1. Introduction
Whole grains are widely recognized to be an important part of a healthy diet by both U.S. [
1] and global [
2] dietary guidelines. The Dietary Guidelines for Americans recommends making at least half of all grains whole, thereby consuming at least 48 grams of whole grain per day [
1]. Dietary guidelines in Latin America tend to be more qualitative than quantitative [
3], and many Latin American countries do not include an explicit whole-grain recommendation [
4]. NHANES data indicate that U.S. whole-grain consumption has been slowly but steadily increasing, reaching 14.4 grams of whole-grain per day (0.9 ounce-equivalents) in 2013–2014 [
5]. Similarly, the average person in Latin America eats only 14.7 grams of whole-grain foods per day [
6].
Whole grains are an important component of a healthy, balanced diet. Whole-grain intake is consistently associated with lower rates of colorectal cancer [
7,
8], type 2 diabetes [
9], cardiovascular disease, and mortality [
10], as well as beneficial changes to the gut microbiome [
11]. On the other hand, suboptimal whole-grain intake is associated with serious health risks. The Global Burden of Disease study found that poor diet played a role in about 20% of all deaths globally and that low whole-grain intake was the second greatest dietary risk factor for mortality after high sodium consumption [
12]. Therefore, it is clear there is much to be gained by increasing whole-grain intake globally.
In 2005, the Oldways Whole Grains Council introduced the Whole Grain Stamp packaging symbol [
13], part of a voluntary third-party certification program. The Stamp helps consumers quantify whole-grain intake by communicating how many grams of whole grain are in one serving of a product, thereby enabling consumers to increase intake more easily toward recommended levels [
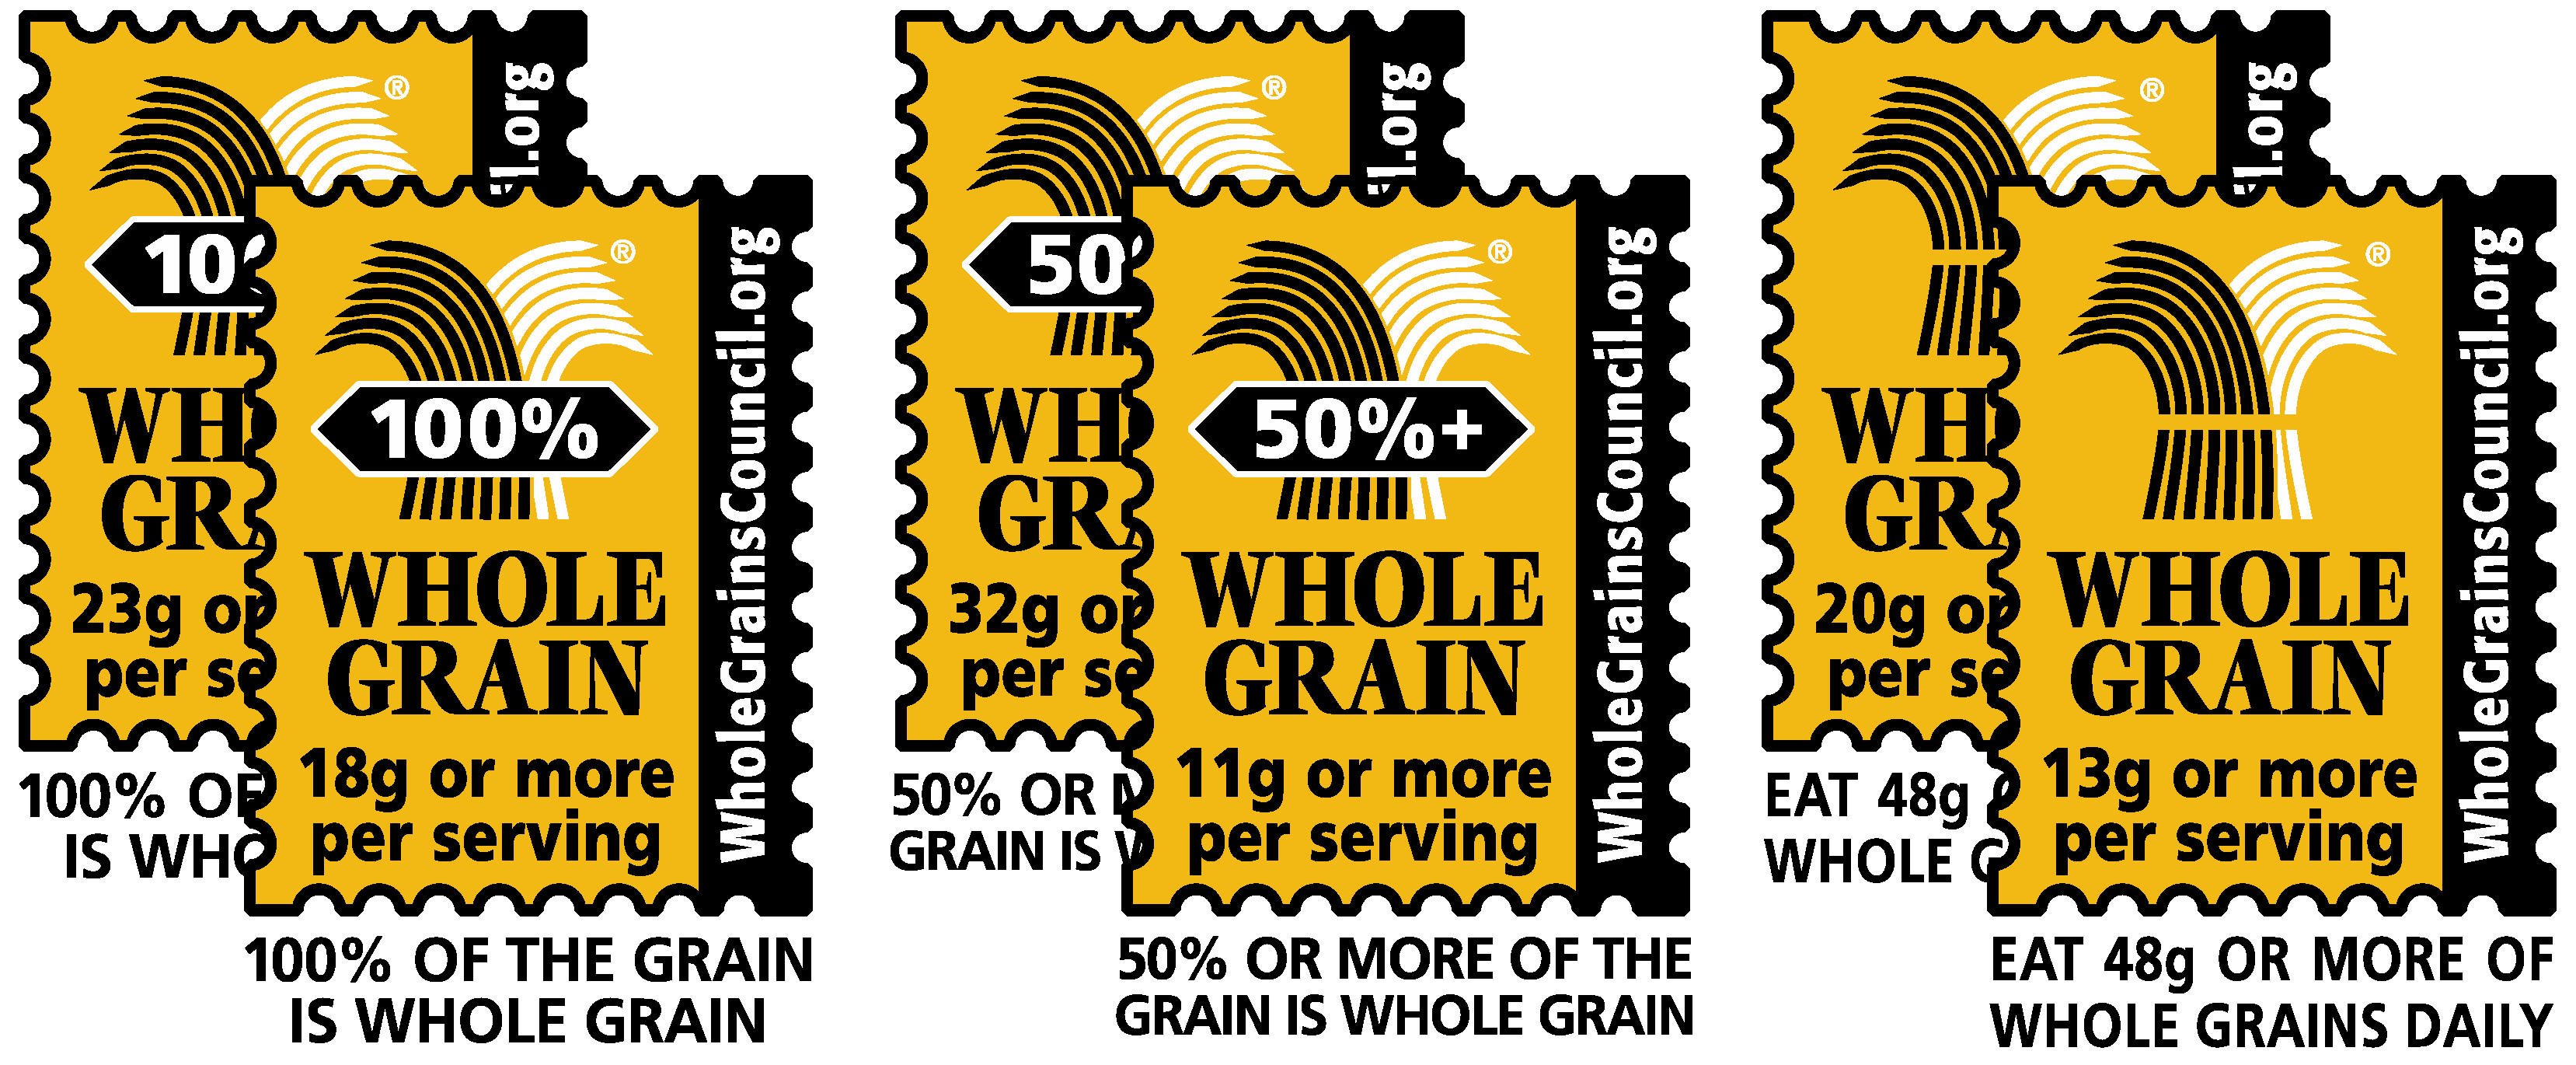
14]. Today, the Whole Grain Stamp program has three different types of Stamps: the 100% Stamp (which indicates that 100% of the grain ingredients are whole grain), the 50%+ Stamp (which indicates that at least 50% of the grain ingredients are whole grain) and the Basic Stamp (which indicates that a product contains at least 8 grams of whole grain per serving but may have more refined grain than whole grain) (
Figure 1).
While other whole-grain packaging symbols exist in Australia [
15], Denmark [
16] and Singapore [
17], the Oldways Whole Grains Council’s WGC Stamped Product Database is the largest database of whole-grain products that includes the gram amount of whole grain in the product as well as the product type (bread, snack, etc.) and types of whole grains (whole wheat, oats, etc.) incorporated into the product.
The lack of published data on whole-grain content of foods within the U.S. and Latin America limits the ability of researchers to explore whether or not availability of whole-grain products may be a factor contributing to low whole-grain consumption. The purpose of this research is to examine the long-term change in (1) measured whole grains in food products, (2) Whole Grain Stamp usage and (3) the prominence of whole-grain ingredients and product categories across the United States and Latin America.
2. Materials and Methods
The Whole Grain Stamp is tightly regulated by the Oldways Whole Grains Council, to serve as a symbol for consumers to recognize and understand whole-grain composition in a food product. When a manufacturer applies for use of the Whole Grain Stamp, they submit information about the ingredients, nutritional profile, and whole-grain content of the product to the Oldways Whole Grains Council for review. Products are resubmitted for review every time there is a change in ingredients, formulation, nutrition facts, serving size, or UPC code. Approved products are included in the WGC Stamped Product Database, allowing for the observation of trends over time. As the WGC Stamped Product Database contains proprietary information from food manufacturers, some data cannot be published. However, product name, Stamp type, and total grams of whole grains are publicly available information. The WGC Stamped Product Database has historically recorded data each year from 2007 (when the WGC Stamped Product Database transitioned from paper records to online records) to 2020.
2.1. Measured Whole Grains in Food Products
The quantity of whole grain was calculated by taking the gram amount of whole grain displayed on each of the products with the approved Whole Grain Stamp and averaging the products’ whole-grain content on an annual basis. The average whole-grain content was calculated for both U.S. products (2008–2020), and Latin American products (2009–2020) separately.
2.2. Whole Grain Stamp Utilization
The growth in Whole Grain Stamp use was measured by the growth in the cumulative number of products with an approved Stamp from 2005 to 2020. The products approved for Stamp use were categorized as follows: (1) those approved for Stamp use in the U.S. only, (2) those approved for Stamp use in the U.S. and at least one international country, (3) those approved for Stamp use in one or more international countries, but not the U.S., and (4) those approved for Stamp use in Latin America (products in this category are not exclusive of those in categories 2 and 3).
2.3. Whole-Grain Ingredients
In order to track changes in the prevalence of specific ‘ancient’ whole-grain ingredients, ingredient lists were searched in each year from 2010 (when a new searchable text box field was first added to capture ingredient lists in the WGC Stamped Product Database) to 2020 for the following terms: ‘amaranth,’ ‘buckwheat,’ ‘farro,’ ‘millet,’ ‘quinoa,’ ‘spelt,’ ‘sorghum,’ and ‘teff.’ While other ‘ancient grain’ varieties exist (e.g., einkorn, Job’s tears, and purple barley) there were insufficient examples of products using these ingredients within the WGC Stamped Product Database. Only ingredients in the English language were captured. Based on the number of products containing each of these ingredients, the percentage of products utilizing each grain was calculated. Products captured in these searches and included in the percentage calculations represent a subset of the overall database (between 29–57% of product registrations utilized the text box ingredients list submission option between 2010 and 2020).
The change in the prominence of sprouted-grain ingredients in the WGC Stamped Product Database (including both U.S. and international products) was calculated by adding up the total number of products marked as containing sprouted grains in each year from 2013 (when a new ‘Contains Sprouted Grains’ field was first added to the WGC Stamped Product Database) to 2020 and by calculating the overall percentage of products utilizing this field in each year. Although there is no regulated definition of what constitutes a sprouted grain, it is generally accepted that a sprouted grain is grain which has been allowed to germinate under controlled conditions, thus transforming the long-term-storage starch of the grain’s endosperm into simpler molecules that are easily digested by the growing plant embryo, making many of the nutrients stored in the grain more bioavailable for human consumption [
18].
2.4. Whole-Grain Food Product Categories
The change in the prominence of particular product categories over time was calculated by adding up the total number of products (across all U.S. and international products) marked as belonging to 17 product categories for each year and then calculating the percentage of all products captured by each of these categories. The 17 product categories were: baking mixes; bars; beverages; breads; cold cereals; entrees; flours; grain side dishes; hot cereals; pasta; pizza and pizza crust; snacks and crackers; soups; tortillas, wraps, and flatbreads; treats; waffles, pancakes, and French toast; and yogurts.
3. Results
3.1. Measured Whole Grains in Food Products
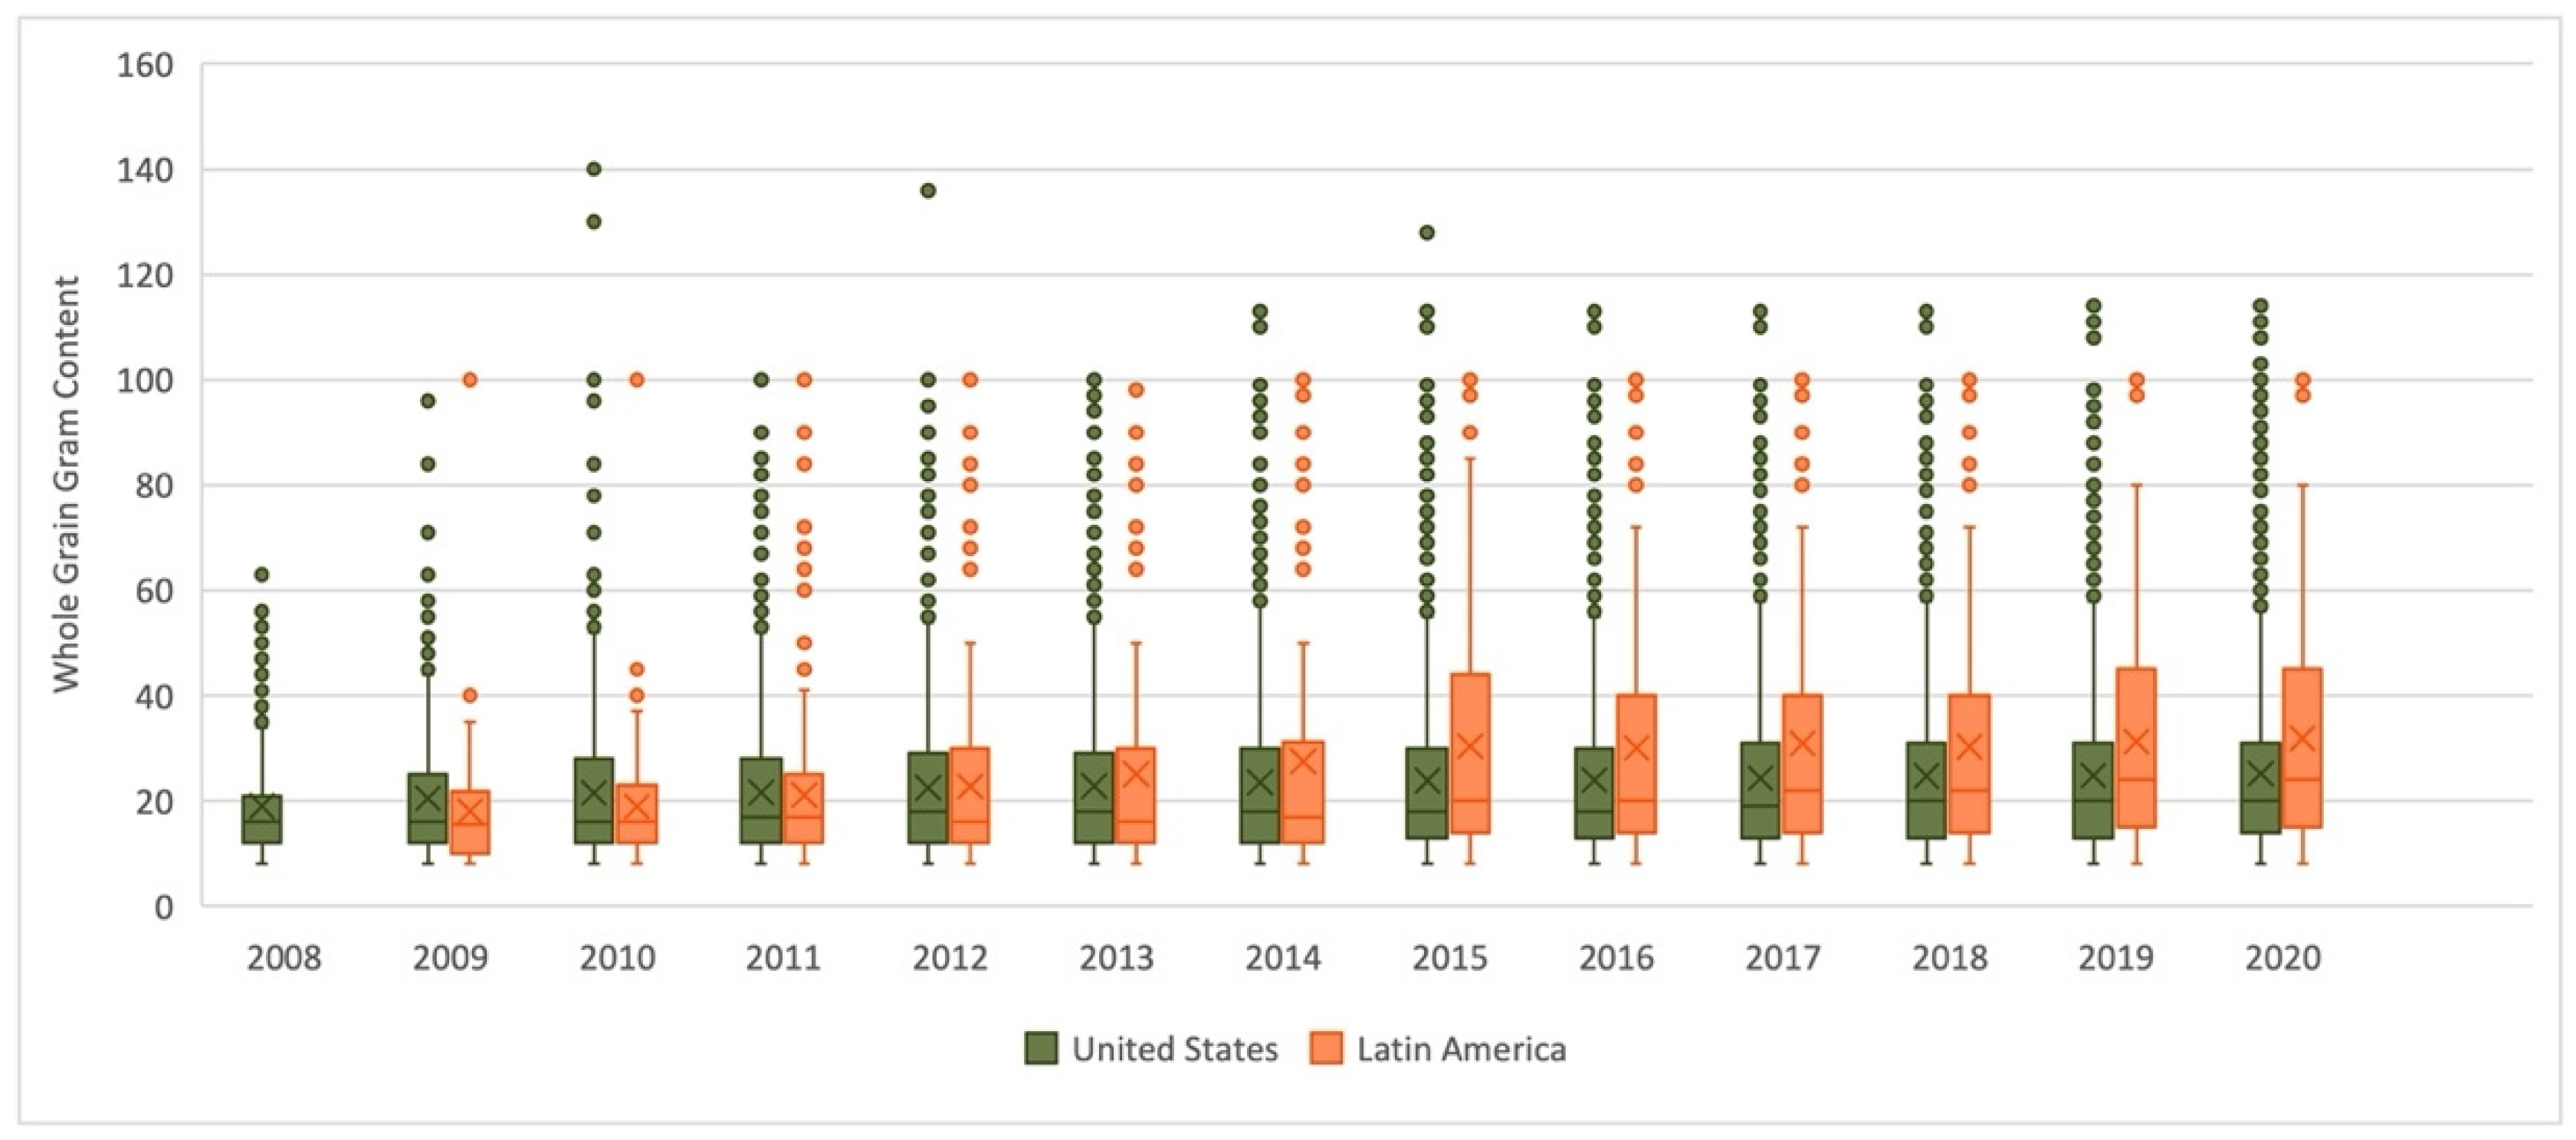
Globally, the average whole-grain gram amount shown on the Whole Grain Stamp increased from 19 grams to 25.8 grams per serving (a 36% increase) from 2008 to 2020. For products registered for Whole Grain Stamp use in the U.S., a similar increase from 19 grams to 25.1 grams was observed from 2008 to 2020 (
Figure 2). In contrast, the growth in Latin America was greater, with an increase from 18.1 grams to 31.9 grams per serving (a 76% increase) from 2009 to 2020.
3.2. Whole Grain Stamp Utilization
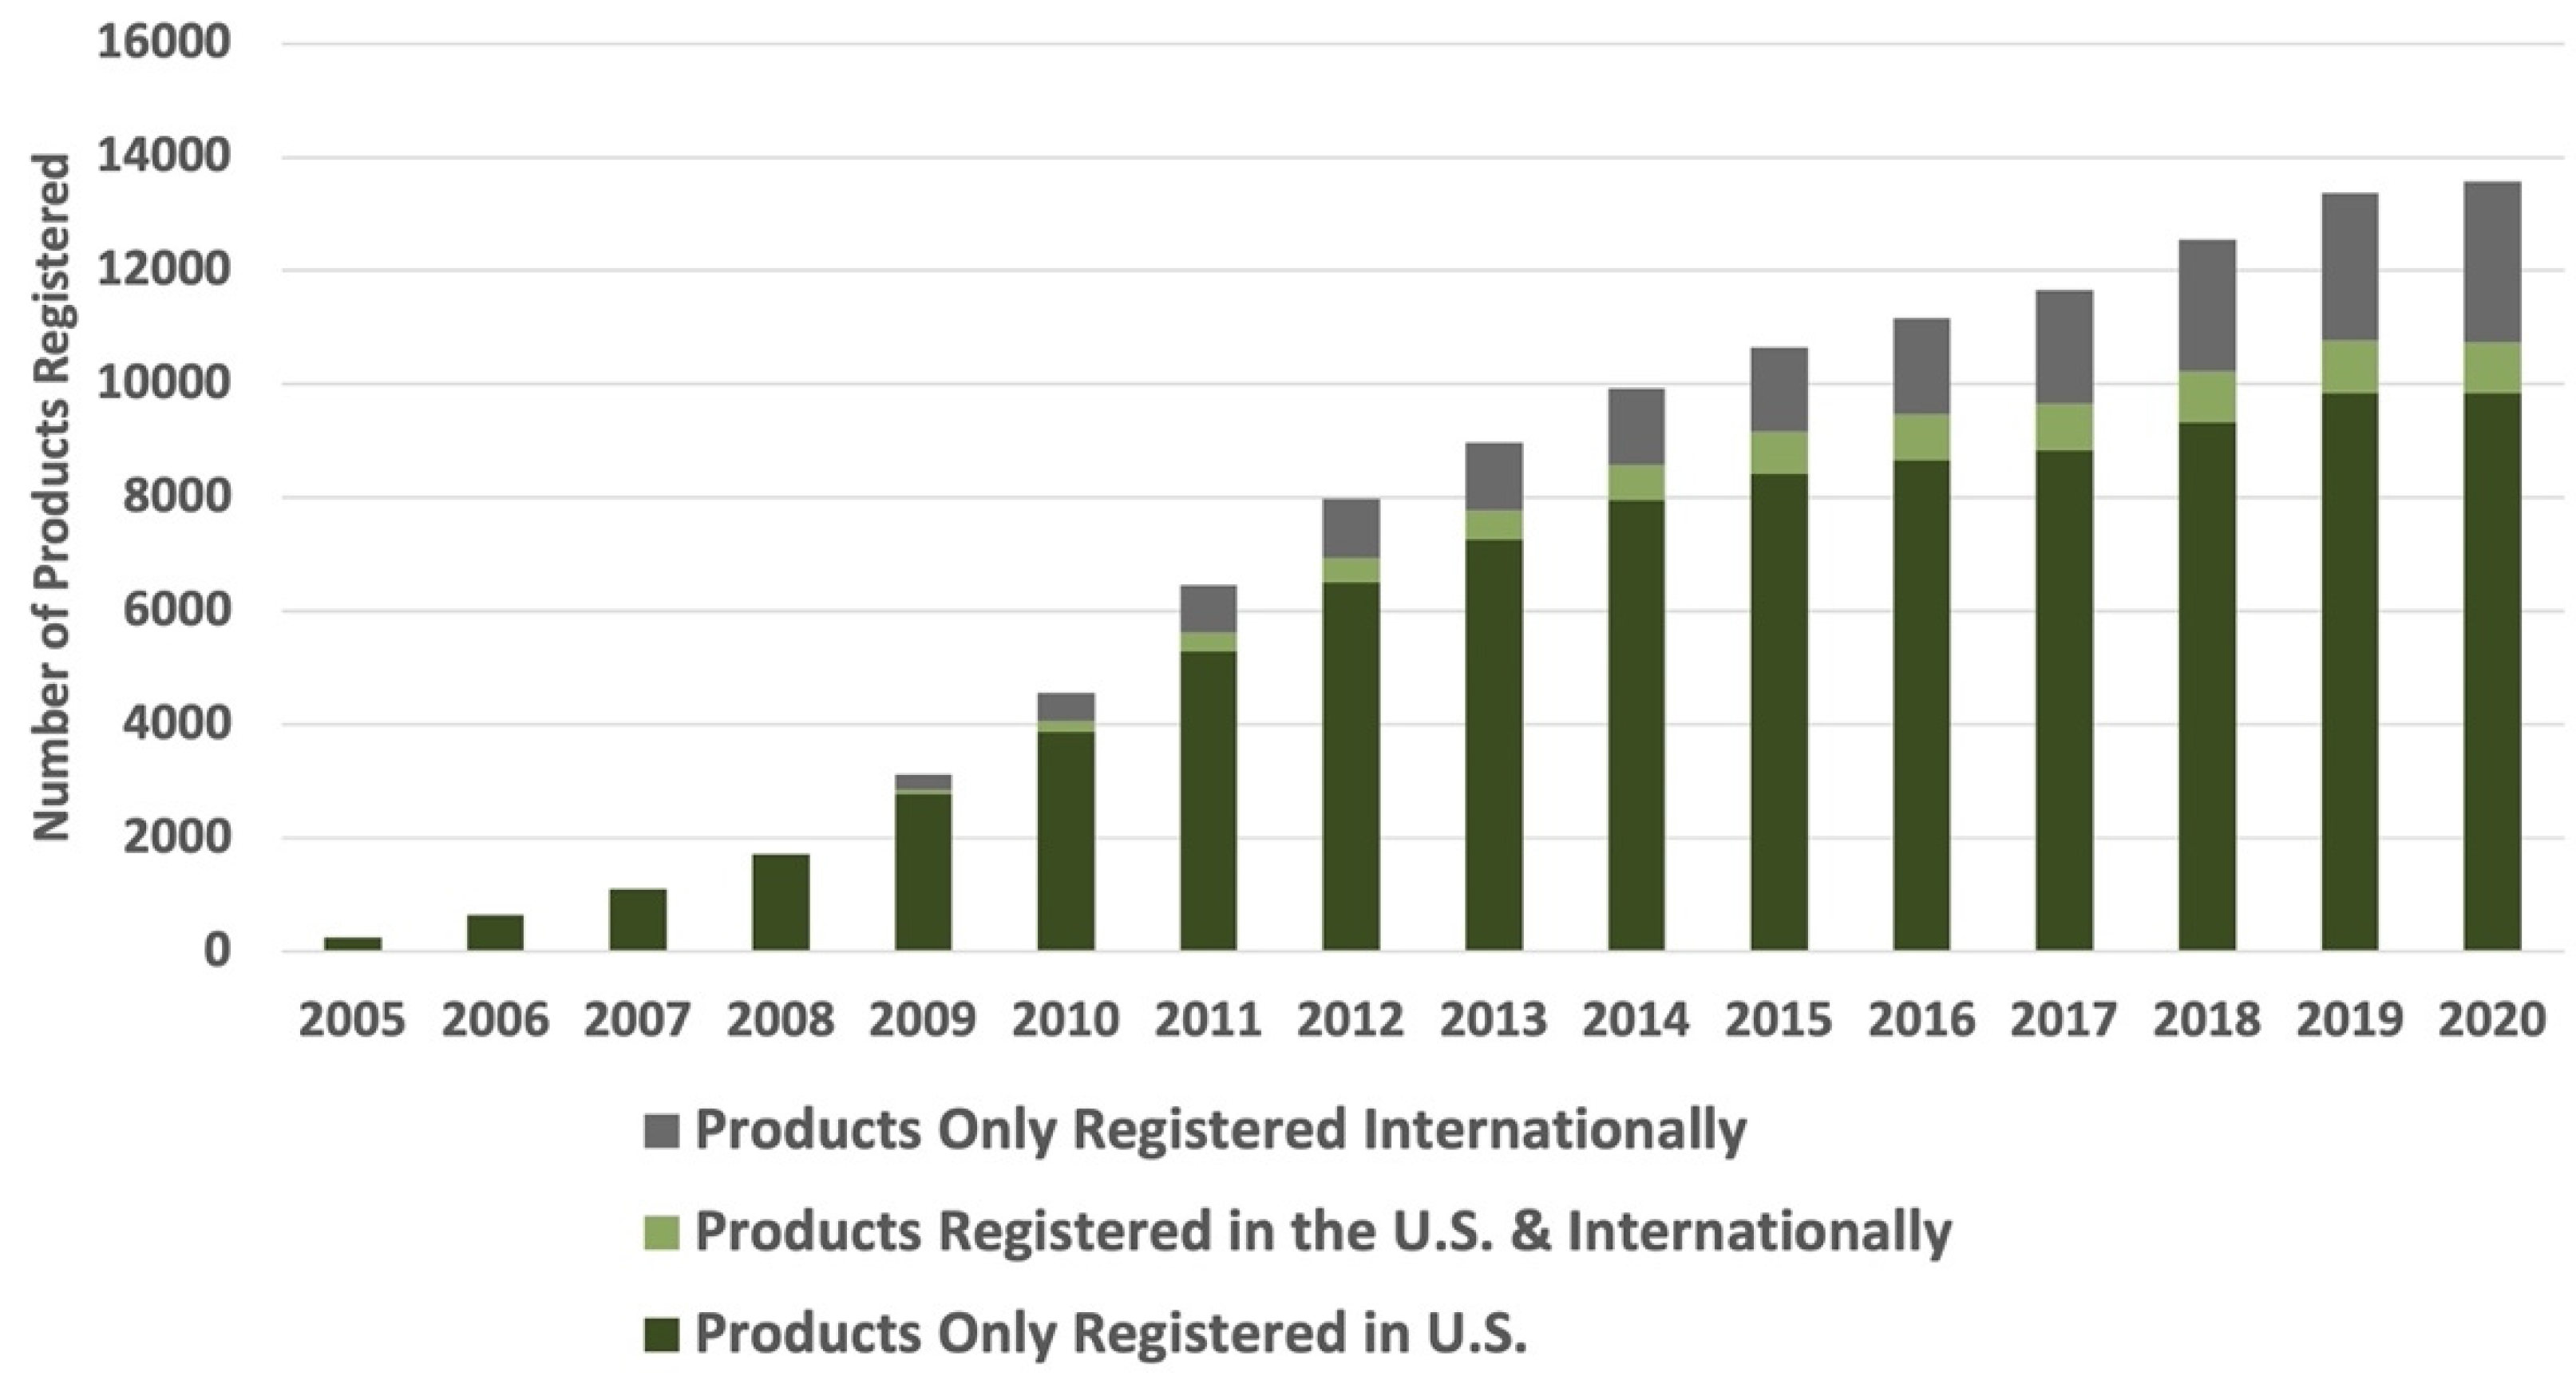
In the U.S., use of the Whole Grain Stamp has increased significantly (from 250 products in 2005 to more than 10,700 products in 2020) (
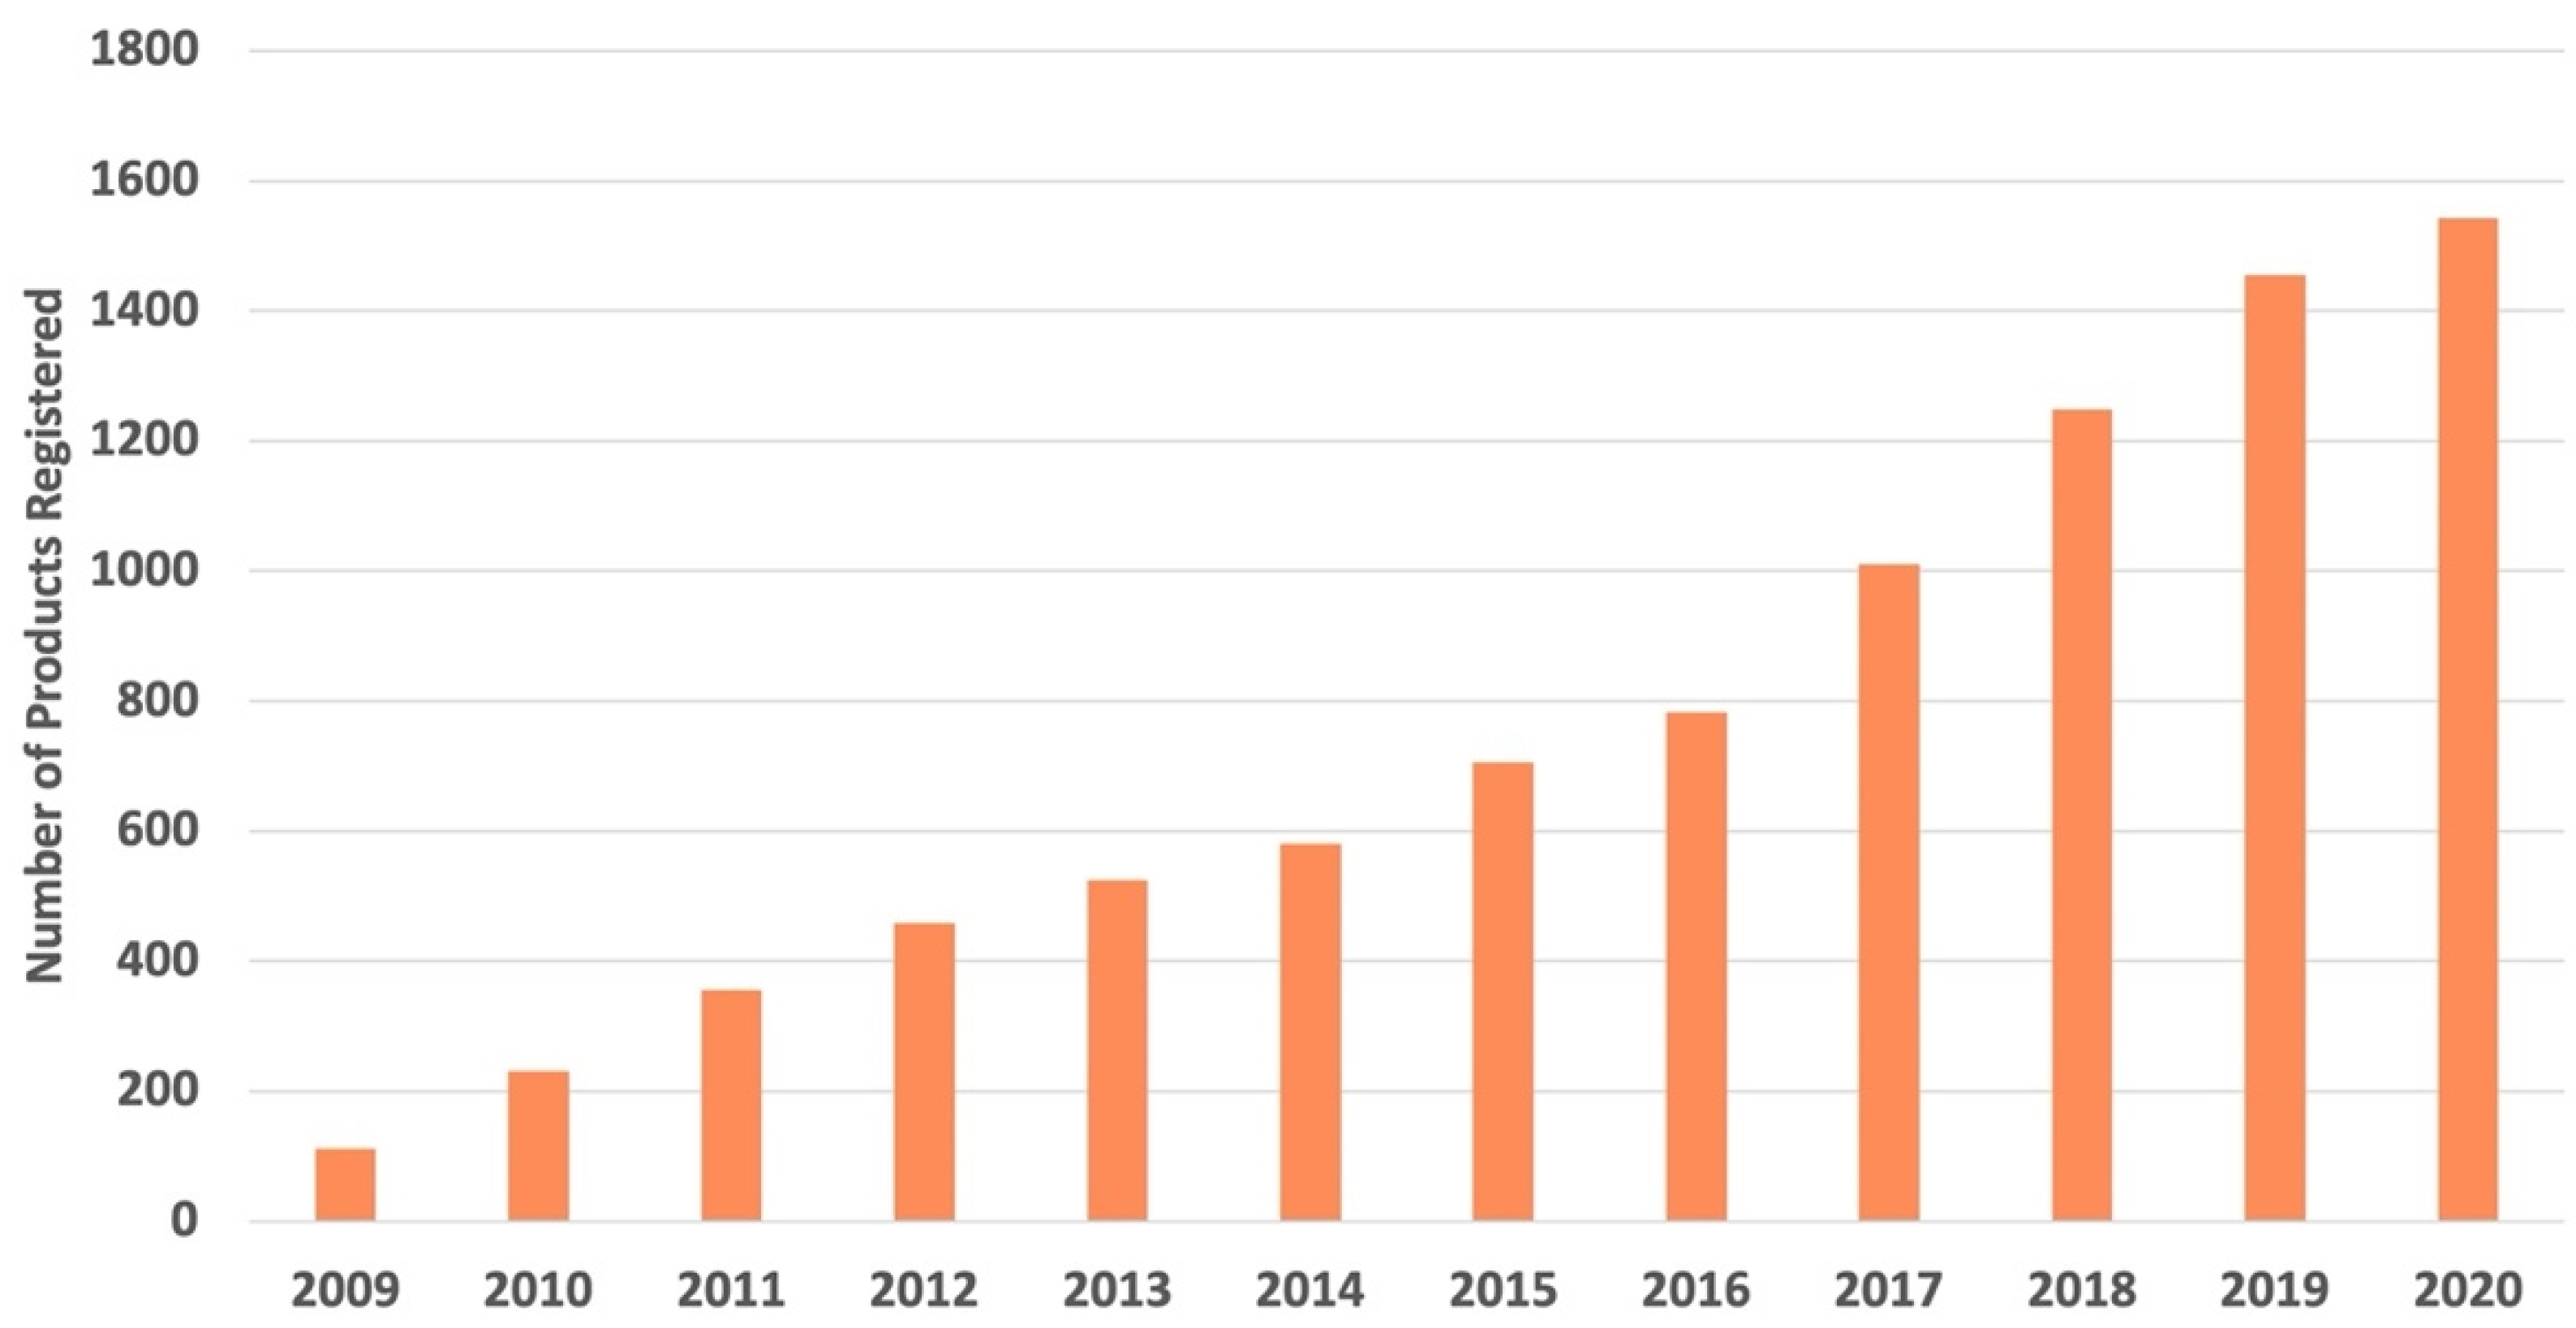
Figure 3). Since 2009, the proportion of products available outside the U.S. has also increased. As of 2020, more than 27% of Stamped products were available outside the U.S. Stamp use on products in Latin America has also grown steadily, with more than 500 new whole-grain products registered for the Whole Grain Stamp between 2017–2020 (
Figure 4). In 2020, over 40% of all products registered for Stamp use outside the U.S. were registered in Latin America.
3.3. Whole-Grain Ingredients
Of the eight ‘ancient grains’ included in the analysis, only five (amaranth, millet, quinoa, sorghum, and teff) showed steady or positive change in relative prevalence between 2010 and 2020. Of these five, millet and quinoa are the most common ingredients in products registered for Stamp use. Millet’s prominence has been relatively steady, with inclusion in 8–9% of products. Quinoa was used in under 3% of Stamped products in 2010, but by 2020, it showed up in 10.5% of products—a 3.5-fold increase. In 2010, sorghum was included in 0.6% of products but had increased to 4.4% of Stamped products by 2019 (a 7.4-fold increase). Over 10 years, amaranth’s use doubled, and teff’s prominence quadrupled.
A steady increase in the number of products containing sprouted grains occurred from 2013, when there were just over 100 sprouted products registered for the Stamp, to 2017, when the number of sprouted products grew to nearly 400. Growth since 2017 has leveled off somewhat, but there were more than 400 sprouted products registered for Stamp use in 2020.
3.4. Whole-Grain Food Product Categories
The six categories that included the most Stamped products were cold cereals (19.3% of products in 2020); breads (16.7% of products in 2020); snacks and crackers (14.9% of products in 2020); hot cereals (8.2% of products in 2020); grain side dishes (8.1% of products in 2020); and flours (5.8% of products in 2020). Product categories with very few Stamped products included baking mixes; pizza and pizza crusts; waffles, pancakes and French toast; soups; beverages; and yogurts. Among the six most prevalent categories, breads and hot cereals saw declines of 39% and 21%, respectively between 2009 and 2020, while the most significant increase was observed with cold cereal products, which rose 60% in prevalence within the database.
4. Discussion
These data indicate that there is has been a stark increase in whole-grain makeup of Stamped products, as well as an increase in products that are registered to use the Whole Grain Stamp. This suggests that manufacturers are prioritizing whole grain in food products, hoping to reduce whole-grain deficits among consumers.
A greater utilization of ‘ancient grains’ such as sorghum and quinoa and increased prominence of sprouted grains supports existing literature on increased consumer interest in ancient and alternative grains [
19]. These ancient grains have shown upward trends in food products such as breads, breakfast cereals, baked goods and even beverages [
20]. The finding that whole grains are particularly underutilized in the pizza and baking mix categories compared with breads, cereals, snacks, and flour supports existing literature on sources of whole grains in the American diet [
21]. These data help to expose product categories where further innovation and development of whole-grain integration may be warranted by food manufacturers.
Incremental change in the nutritional quality of foods, thus boosting whole-grain consumption, can be achieved by simply increasing the whole-grain content of the food [
22]. Given the relatively low consumption of whole grains in the U.S. [
5] and Latin America [
6], a mean 36% increase in whole-grain content in Stamped products can have profound impacts on whole-grain consumption across the regions. Strategic food labeling, such as the Whole Grain Stamp (
Figure 1), which indicates varying levels of whole-grain content, can help meet consumer demand whilst boosting the nutritional profile of commonly consumed foods (e.g., breads, cereals, baked goods).
With any research study, there are always both strengths and limitations that should be addressed. A major strength of this study is that, to the authors’ knowledge, the WGC Stamped Product Database is the largest database of whole-grain products that includes quantity, product type, and types of grains used in the product. Secondly, this is the first study to describe and compare whole-grain utilization in consumer-level food products across two regions. A limitation of this study is that this analysis does not capture every product on the market, due to the Whole Grain Stamp program being voluntary for manufacturers. This limitation is particularly evident outside the Americas, as Whole Grain Stamp use is most prevalent throughout the U.S., Canada, and Latin America. Another limitation is that only a subset of the products analyzed (29–57%, depending on the year) were searchable for specific whole-grain ingredients (such as sorghum), meaning that trends in whole-grain ingredient usage may not be generalizable to the entire dataset, particularly for non-English language products.
Nutrition programs and policies endorsing whole-grain consumption can only be successful if whole-grain products are readily available in the consumer marketplace. This study demonstrates that food manufacturers are continuing to increase whole-grain content and diverse utilization of food products. Therefore, policy makers, nonprofits, and food manufacturers need to collaborate and communicate to better align whole-grain recommendations with product offerings. More research is needed to better understand whole-grain diversity, utilization, and availability among food products within the Americas and worldwide.
Author Contributions
Conceptualization, C.S. and K.L.; methodology, C.S., data curation, C.S.; software, C.S., validation, C.S., formal analysis, C.S.; investigation, C.S.; resources, C.S.; data curation, C.S., writing—original draft preparation, C.S. and K.L.; writing—review and editing, K.H.-R.; visualization, C.S.; supervision, K.H.-R.; project administration, K.L. All authors have read and agreed to the published version of this manuscript.
Funding
This research received no external funding.
Institutional Review Board Statement
Not applicable.
Informed Consent Statement
Not applicable.
Data Availability Statement
Please reach out to the corresponding author for access to the full data set.
Acknowledgments
The authors wish to thank Cynthia Harriman for her mentorship, Nicola McKeown for her insightful comments on the manuscript, Abigail Clement for keeping the Stamped Product Database up to date, and Sara Baer-Sinnott and the entire team at Oldways for their ongoing support and encouragement.
Conflicts of Interest
C.S. and K.L. are employees of Oldways, a 501(c)3 nonprofit organization that founded and runs the Oldways Whole Grains Council. The Oldways Whole Grains Council is supported by approximately 400 member companies (full list available at:
https://wholegrainscouncil.org/about-us/members-list). K.H.-R. declares no conflict of interest.
References
- US Department of Health and Human Services and US Department of Agriculture. Dietary Guidelines for Americans 2020–2025, 9th ed.; 2020. Available online: https://www.dietaryguidelines.gov/sites/default/files/2020-12/Dietary_Guidelines_for_Americans_2020-2025.pdf (accessed on 6 January 2022).
- World Health Organization. Healthy Diet. 2020. Available online: https://www.who.int/news-room/fact-sheets/detail/healthy-diet (accessed on 6 January 2022).
- Miller, K.B. Review of whole grain and dietary fiber recommendations and intake levels in different countries. Nutr. Rev. 2020, 78, 29–36. [Google Scholar] [CrossRef] [PubMed]
- Seal, C.J.; Nugent, A.P.; Tee, E.S.; Thielecke, F. Whole-grain dietary recommendations: The need for a unified global approach. Br. J. Nutr. 2016, 115, 2031–2038. [Google Scholar] [CrossRef] [PubMed] [Green Version]
- Bowman, S.A.; Clemens, J.C.; Friday, J.E.; Lynch, K.L.; LaComb, R.P.; Moshfegh, A.J. Dietary Data Brief No. 17. Food Patterns Equivalents Intakes by Americans: What We Eat in America, NHANES 2003–2004 and 2013–2014; 2017. Available online: https://www.ars.usda.gov/ARSUserFiles/80400530/pdf/DBrief/17_Food_Patterns_EquiEquival_0304_1314.pdf (accessed on 6 January 2022).
- Fisberg, R.M.; Fontanelli, M.M.; Kowalskys, I.; Gómez, G.; Rigotti, A.; Cortés, L.Y.; García, M.Y.; Pareja, R.G.; Herrera-Cuenca, M.; Fisberg, M.; et al. Total and whole grain intake in Latin America: Findings from the multicenter cross-sectional Latin American Study of Health and Nutrition (ELANS). Eur. J. Nutr. 2021, 61, 489–501. [Google Scholar] [CrossRef] [PubMed]
- Aune, D.; Chan, D.S.M.; Lau, R.; Vieira, R.; Greenwood, D.C.; Kampman, E.; Norat, T. Dietary Fibre, Whole Grains, and Risk of Colorectal Cancer: Systematic Review and Dose-Response Meta-Analysis of Prospective Studies. BMJ 2011, 343, d6617. [Google Scholar] [CrossRef] [PubMed] [Green Version]
- Vieira, A.R.; Abar, L.; Chan, D.S.M.; Vingeliene, S.; Polemiti, E.; Stevens, C.; Greenwood, D.; Norat, T. Foods and Beverages and Colorectal Cancer Risk: A Systematic Review and Meta-Analysis of Cohort Studies, and Update of the Evidence of the WCRF-AICR Continuous Update Project. Ann. Oncol. 2017, 28, 1788–1802. [Google Scholar] [CrossRef] [PubMed]
- Kyrø, C.; Tjønneland, A.; Overvad, K.; Olsen, A.; Landberg, R. Higher Whole-Grain Intake Is Associated with Lower Risk of Type 2 Diabetes Among Middle-Aged Men and Women: The Danish Diet, Cancer, and Health Cohort. J. Nutr. 2018, 148, 1434–1444. [Google Scholar] [CrossRef] [PubMed]
- Aune, D.; Keum, N.; Giovannucci, E.; Fadnes, L.T.; Boffetta, P.; Greenwood, D.C.; Tonstad, S.; Vatten, L.J.; Riboli, E.; Norat, T. Whole Grain Consumption and Risk of Cardiovascular Disease, Cancer, and All Cause and Cause Specific Mortality: Systematic Review and Dose-Response Meta-Analysis of Prospective Studies. BMJ 2016, 353, i2716. [Google Scholar] [CrossRef] [PubMed] [Green Version]
- Gong, L.; Cao, W.; Chi, H.; Wang, J.; Zhang, H.; Liu, J.; Sun, B. Whole cereal grains and potential health effects: Involvement of the gut microbiota. Food Res. Int. 2018, 103, 84–102. [Google Scholar] [CrossRef]
- GBD 2017 Risk Factor Collaborators. Global, regional, and national comparative risk assessment of 84 behavioural, environmental and occupational, and metabolic risks or clusters of risks for 195 countries and territories, 1990–2017: A systematic analysis for the Global Burden of Disease Study 2017. The Lancet 2018, 392, 1923–1994. [Google Scholar]
- Oldways. Oldways’ Timeline. Available online: https://oldwayspt.org/about-us/oldways-timeline (accessed on 6 January 2022).
- Oldways Whole Grains Council. Whole Grain Stamp. Available online: https://wholegrainscouncil.org/whole-grain-stamp (accessed on 6 January 2022).
- Grains and Legumes Nutrition Council. GLNC Certification of Foods. Available online: https://www.glnc.org.au/codeofpractice/glnc-certification-of-foods/ (accessed on 6 January 2022).
- Whole Grains Partnership. Whole Grains Logo. Available online: https://fuldkorn.dk/om-partnerskabet/fuldkornslogoet/ (accessed on 6 January 2022).
- Singapore Healthy Foods and Dining Department. Obesity Prevention Management Division, Singapore Health Promotion Board. Healthier Choice Symbol Nutrient Guidelines; 2018. Available online: https://www.hpb.gov.sg/docs/default-source/default-document-library/hcs-guidelines-(january-2018)9ab599f6468366dea7adff00000d8c5a.pdf?sfvrsn=2d36ff72_0 (accessed on 6 January 2022).
- Oldways Whole Grains Council. Sprouted Grains Working Group Phase I Summary Report. 2017. Available online: https://wholegrainscouncil.org/sites/default/files/atoms/files/WGC_SGWG_Phase1report_Nov2017wLinks.pdf (accessed on 6 January 2022).
- Hosafci, P.; Euromonitor International. Passport: 8 Food Trends for 2018. 2018. Available online: https://go.euromonitor.com/rs/805-KOK-719/images/8_Food_Trends_for_2018.pdf (accessed on 6 January 2022).
- Boukid, F.; Folloni, S.; Sforza, S.; Vittadini, E.; Prandi, B. Current trends in ancient grains-based foodstuffs: Insights into nutritional aspects and technological applications. Comp. Rev. Food Sci. Food Saf. 2018, 17, 123–136. [Google Scholar] [CrossRef] [Green Version]
- Albertson, A.M.; Reicks, M.; Joshi, N.; Gugger, C.K. Whole grain consumption trends and associations with body weight measures in the United States: Results from the cross-sectional National Health and Nutrition Examination Survey 2001–2012. Nutr. J. 2016, 15, 8. [Google Scholar] [CrossRef] [Green Version]
- Hicks-Roof, K.K.; Arikawa, A.; Schwam, M.; Osorio, D.; Walker, K. College students approve: Using sorghum to increase whole-grain exposure in university foodservice. J. Foodserv. Bus. Res. 2021, 24, 62–73. [Google Scholar] [CrossRef]
| Publisher’s Note: MDPI stays neutral with regard to jurisdictional claims in published maps and institutional affiliations. |
© 2022 by the authors. Licensee MDPI, Basel, Switzerland. This article is an open access article distributed under the terms and conditions of the Creative Commons Attribution (CC BY) license (https://creativecommons.org/licenses/by/4.0/).


