
The Effect of a 14-Day gymnema sylvestre Intervention to Reduce Sugar Cravings in Adults
 , , , ,
Abstract
:1. Introduction
2. Methods
2.1. Study Design
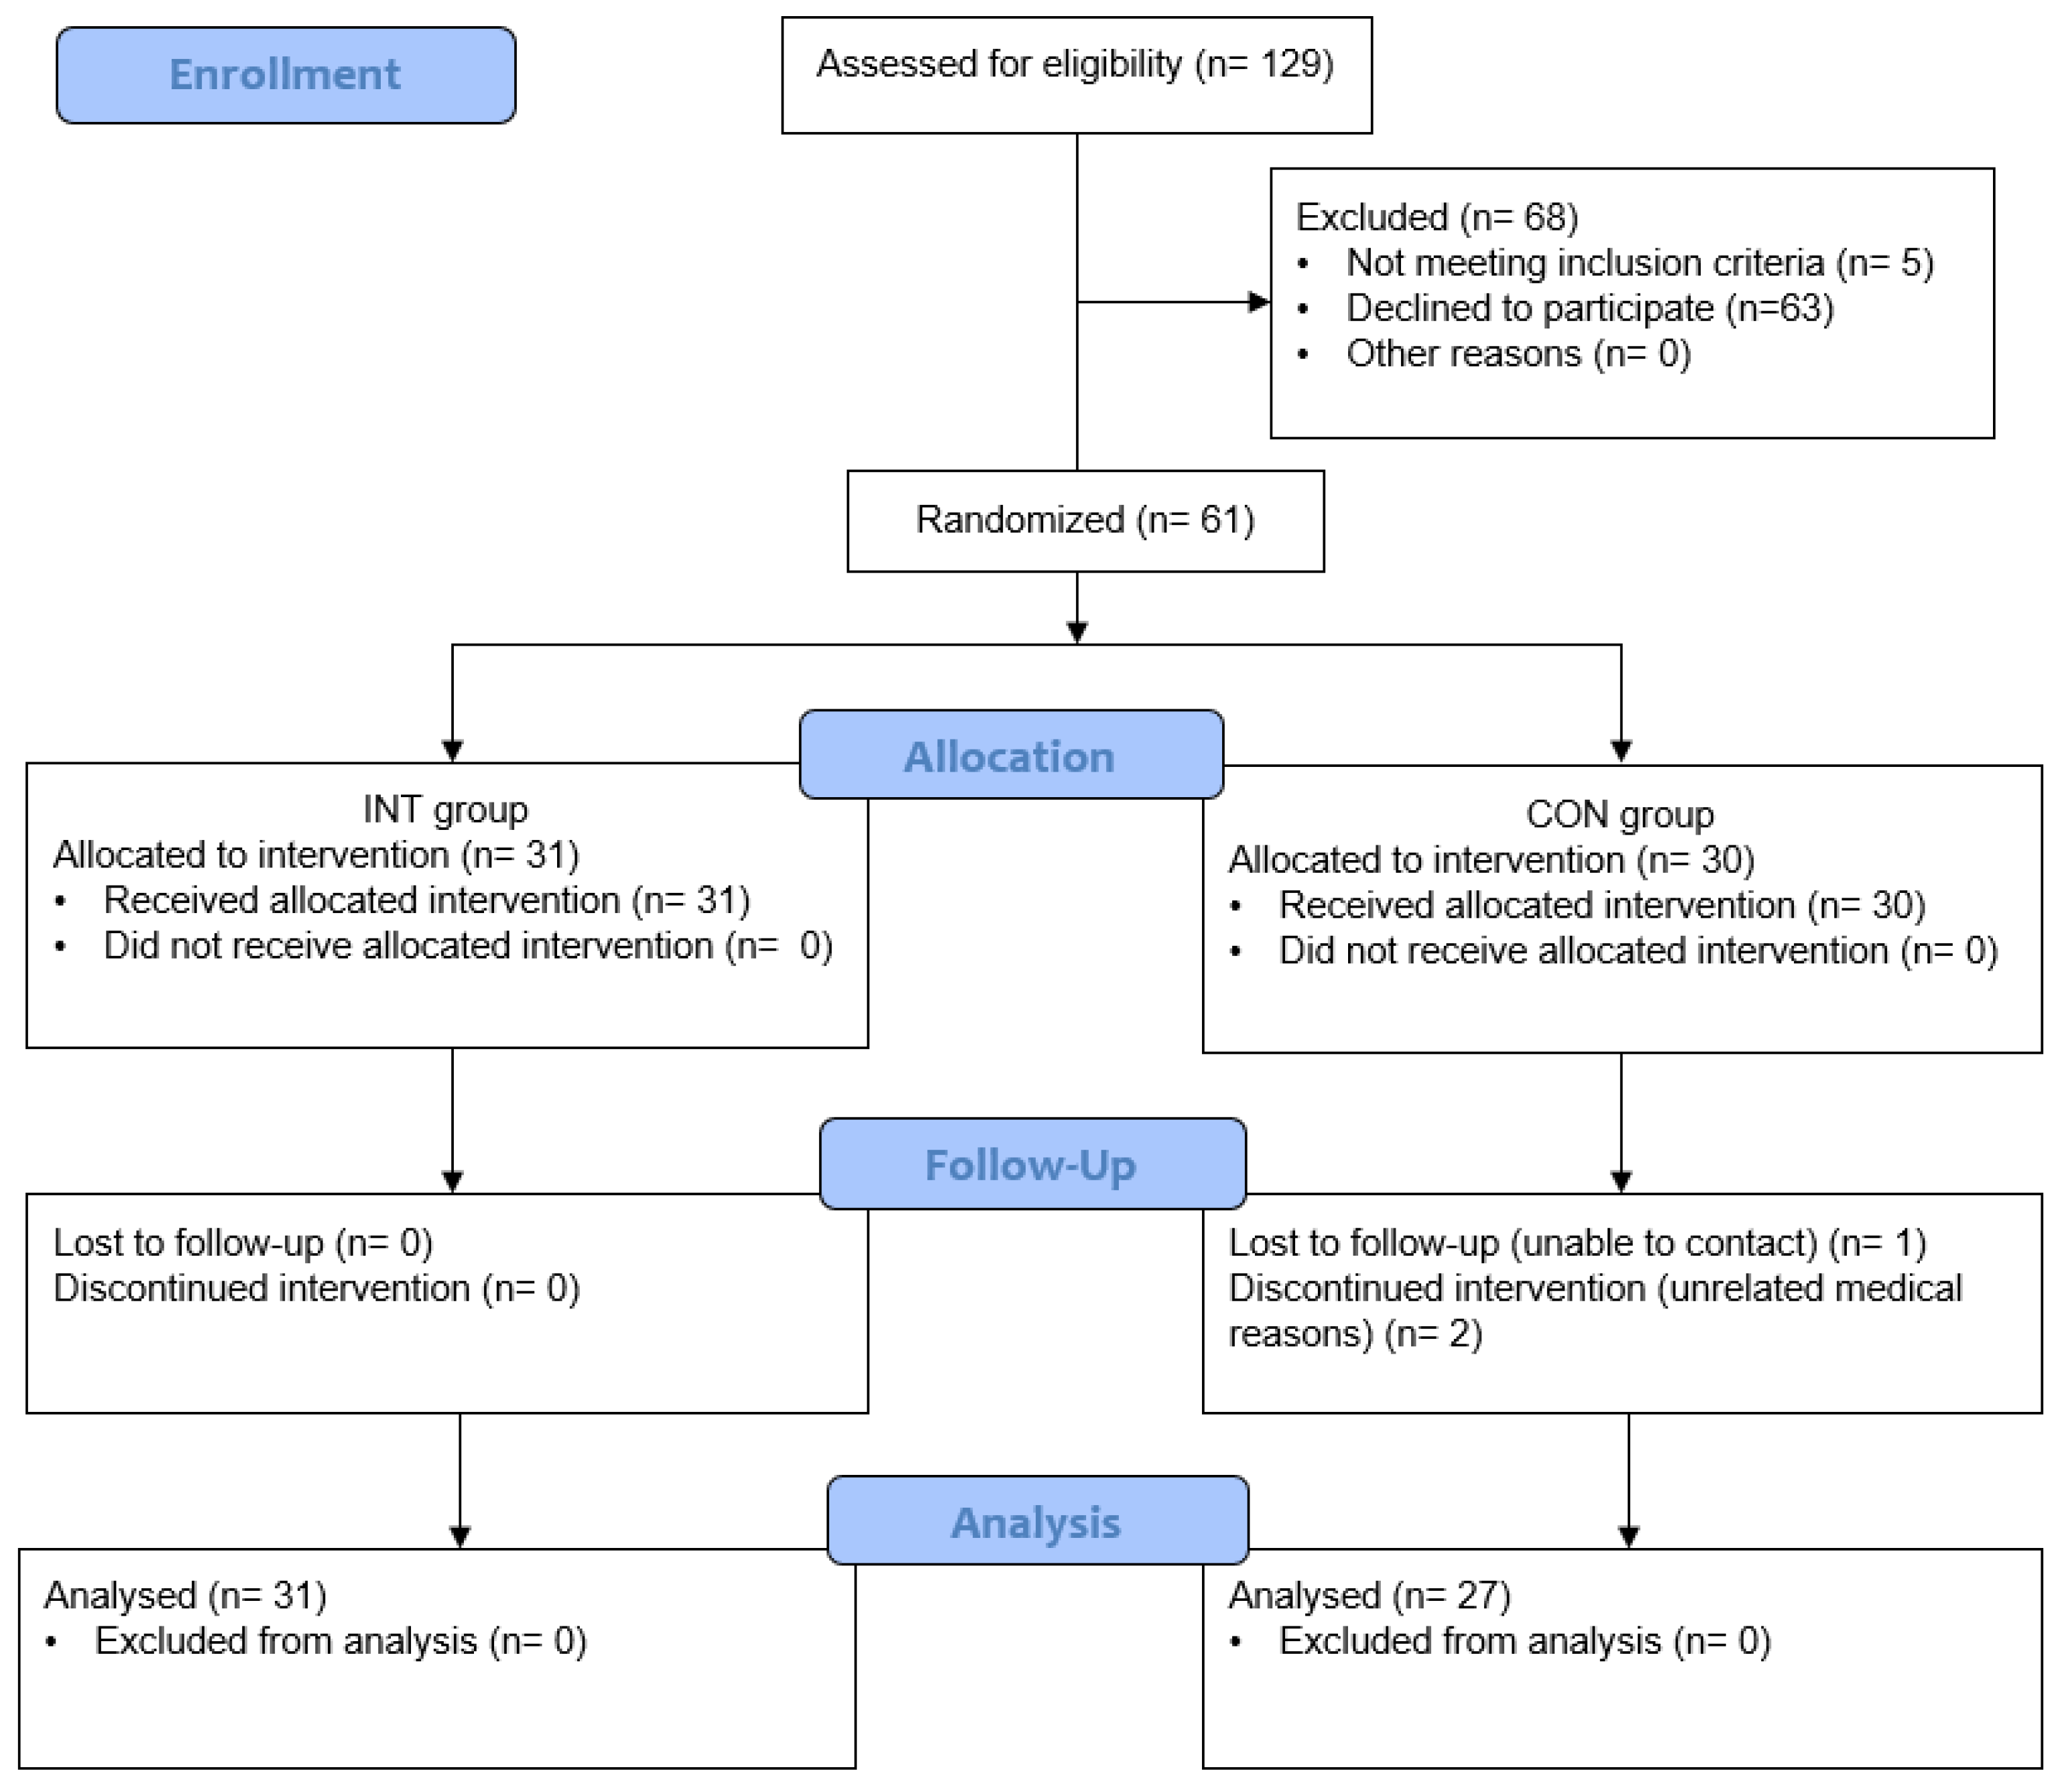
2.2. Participants
2.3. Research Design
2.4. Anthropometric Measures
2.5. Sensory Testing
2.6. Questionnaires
2.7. Data Handling
2.8. Statistical Analysis
3. Results
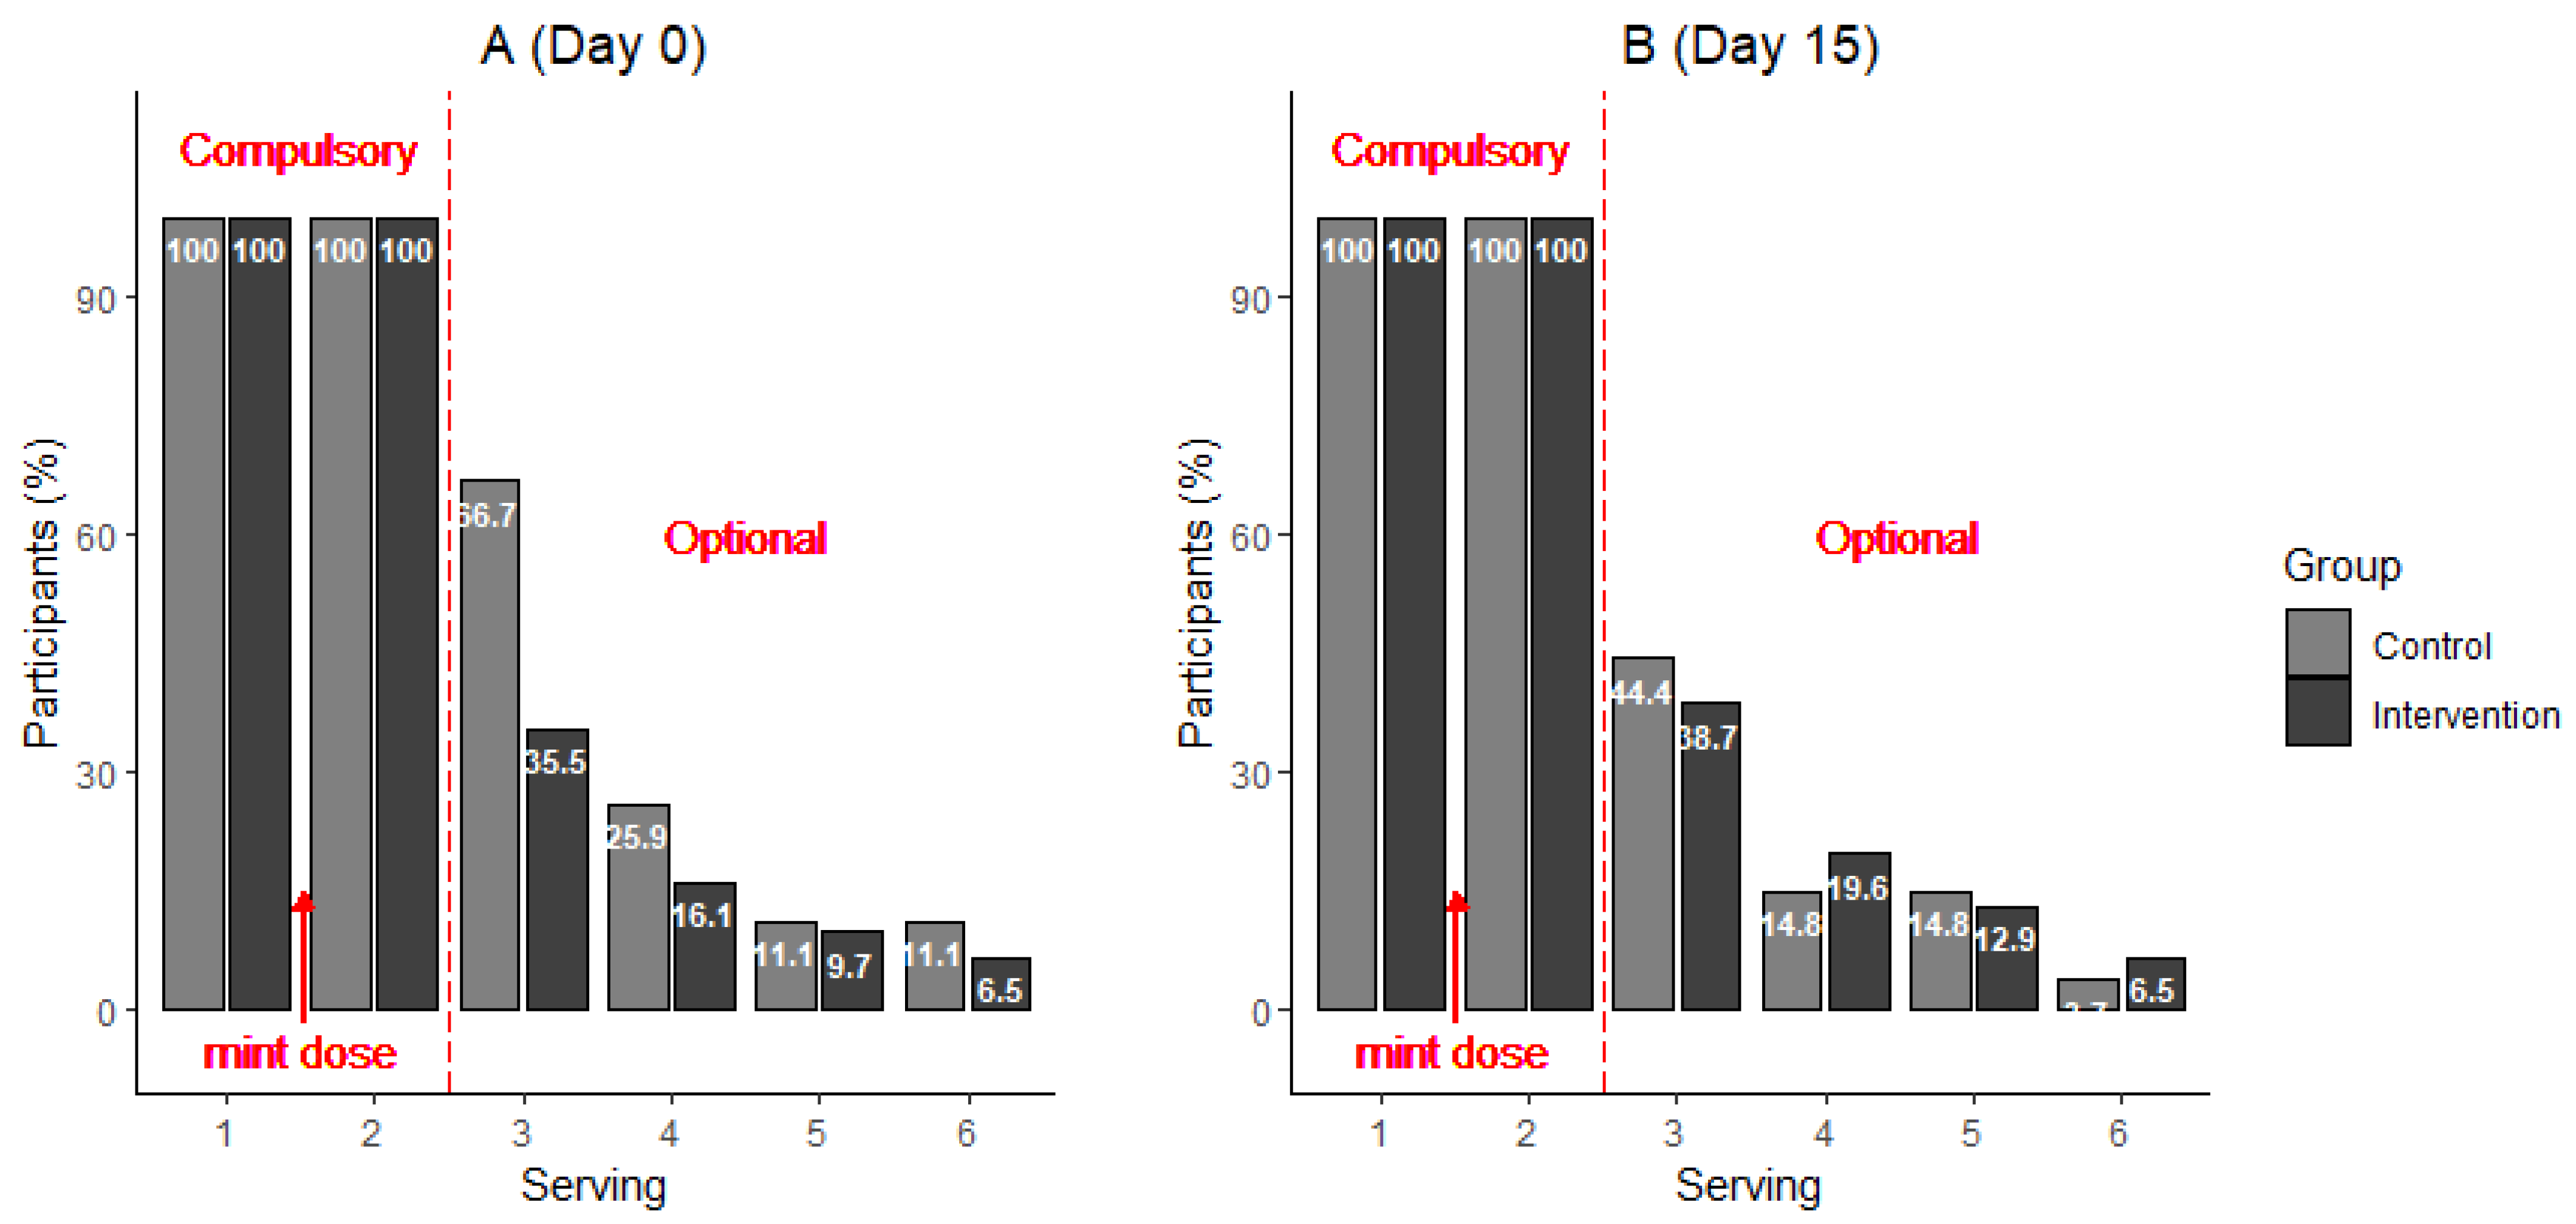
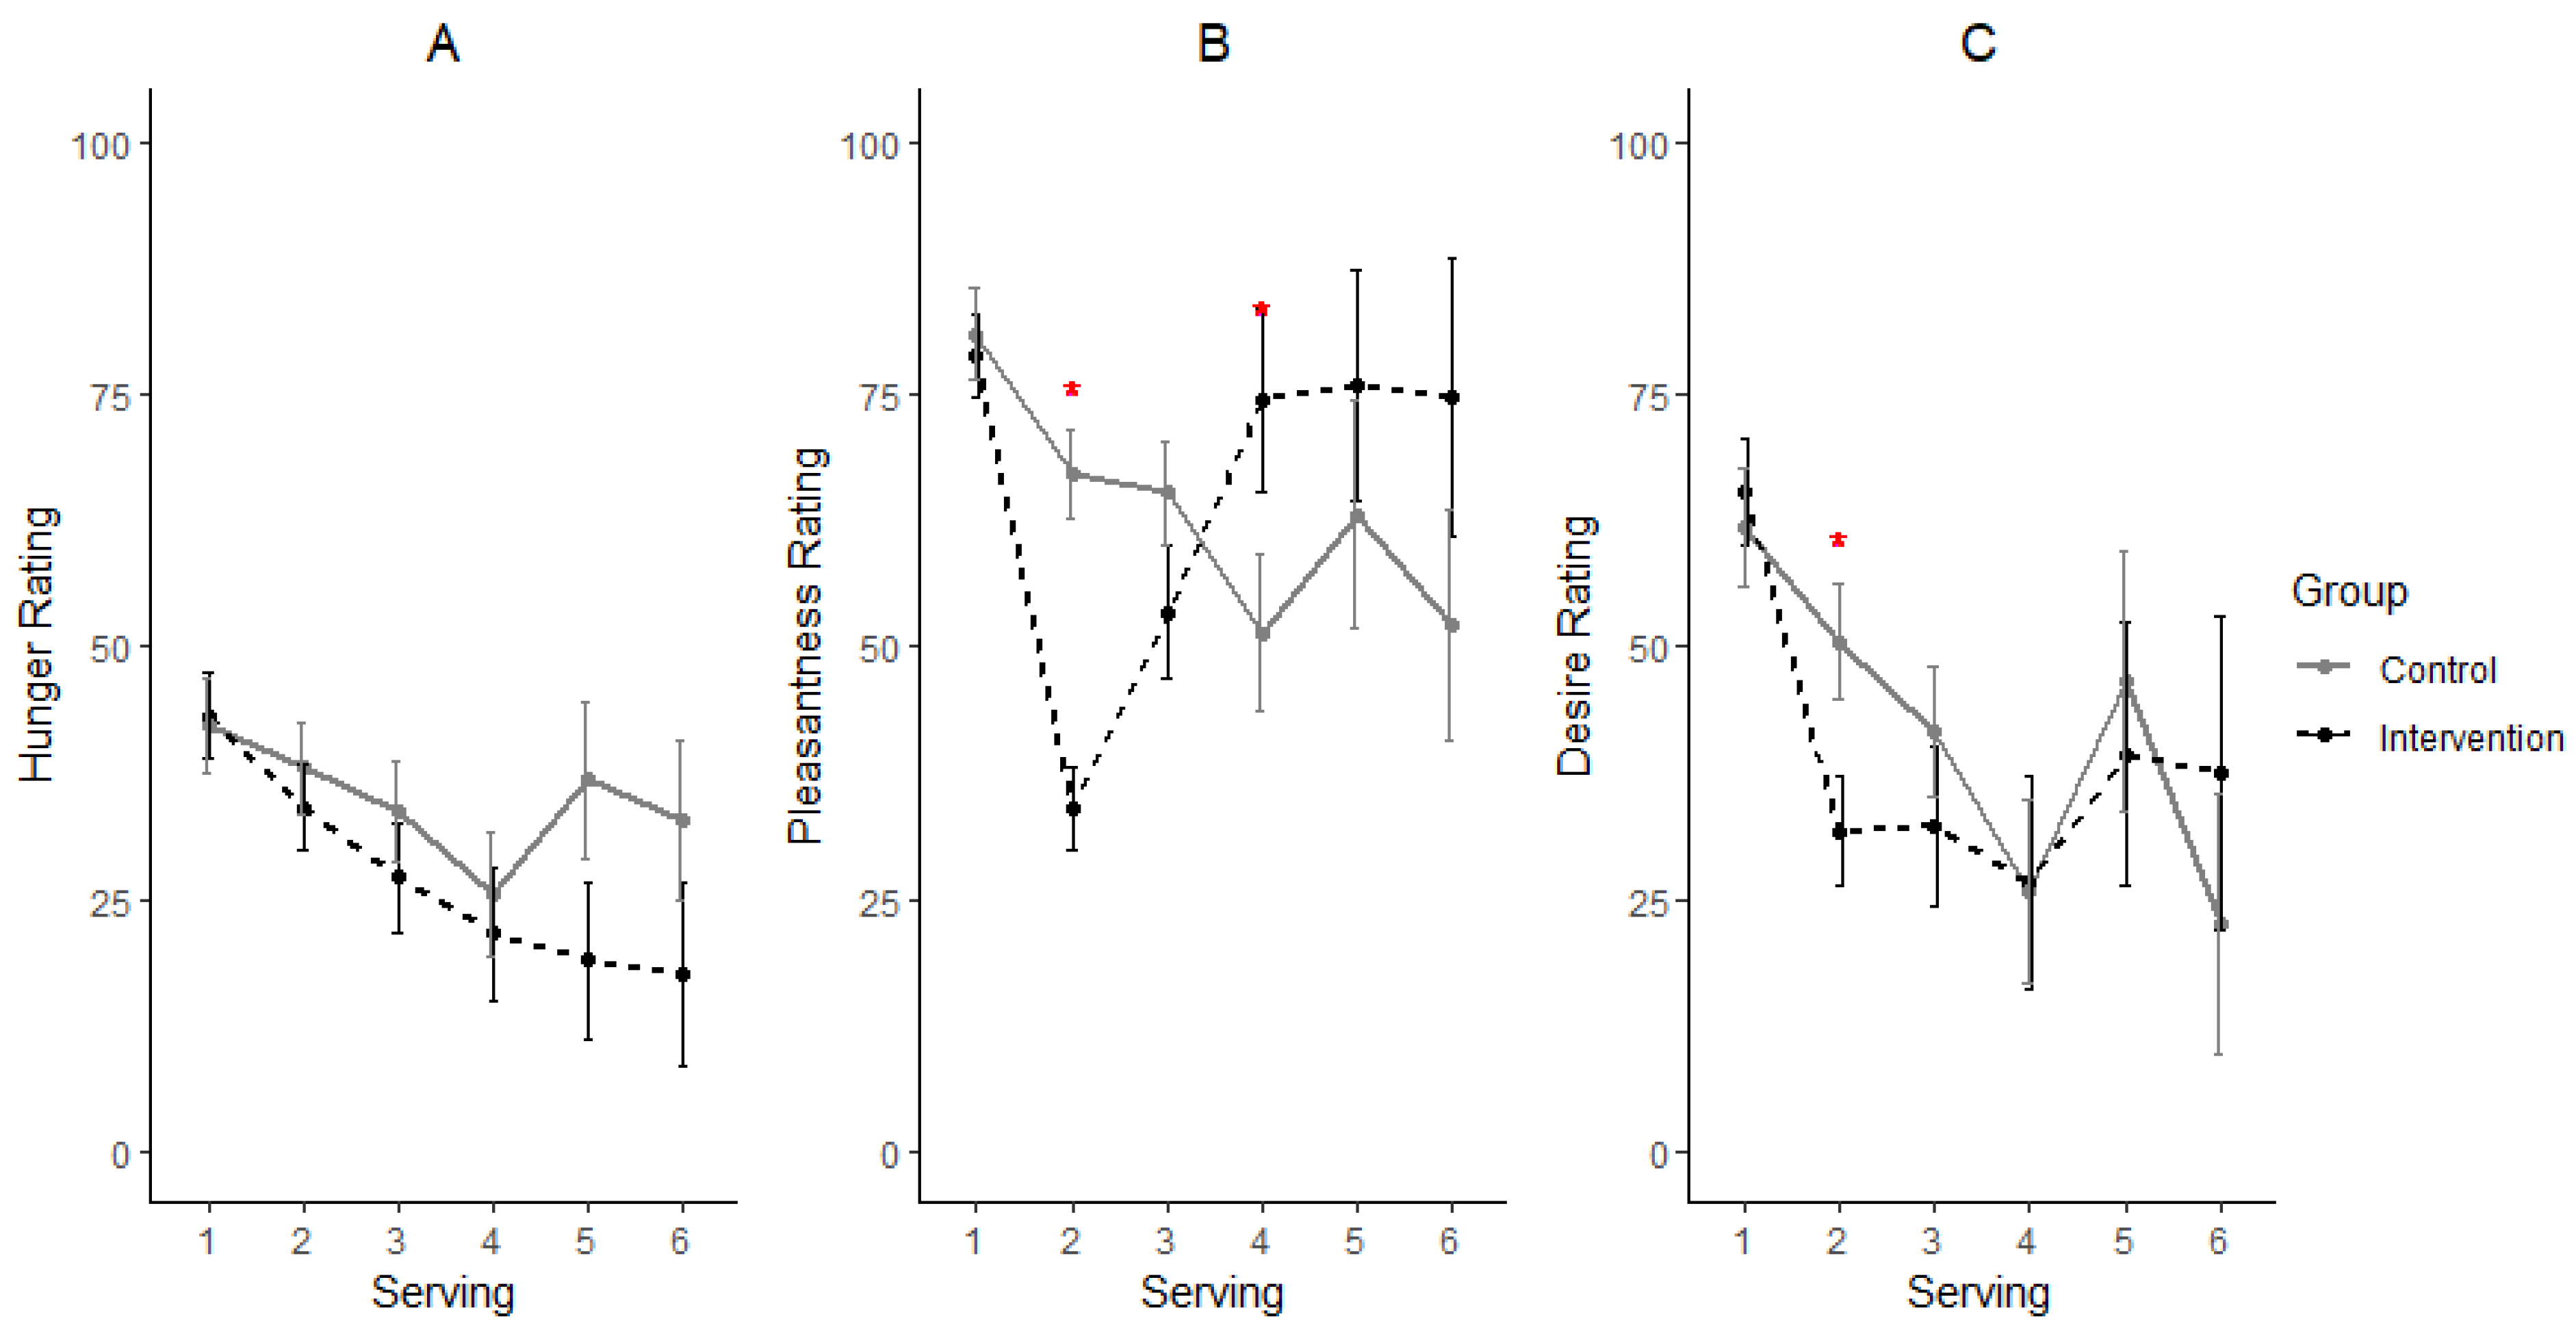
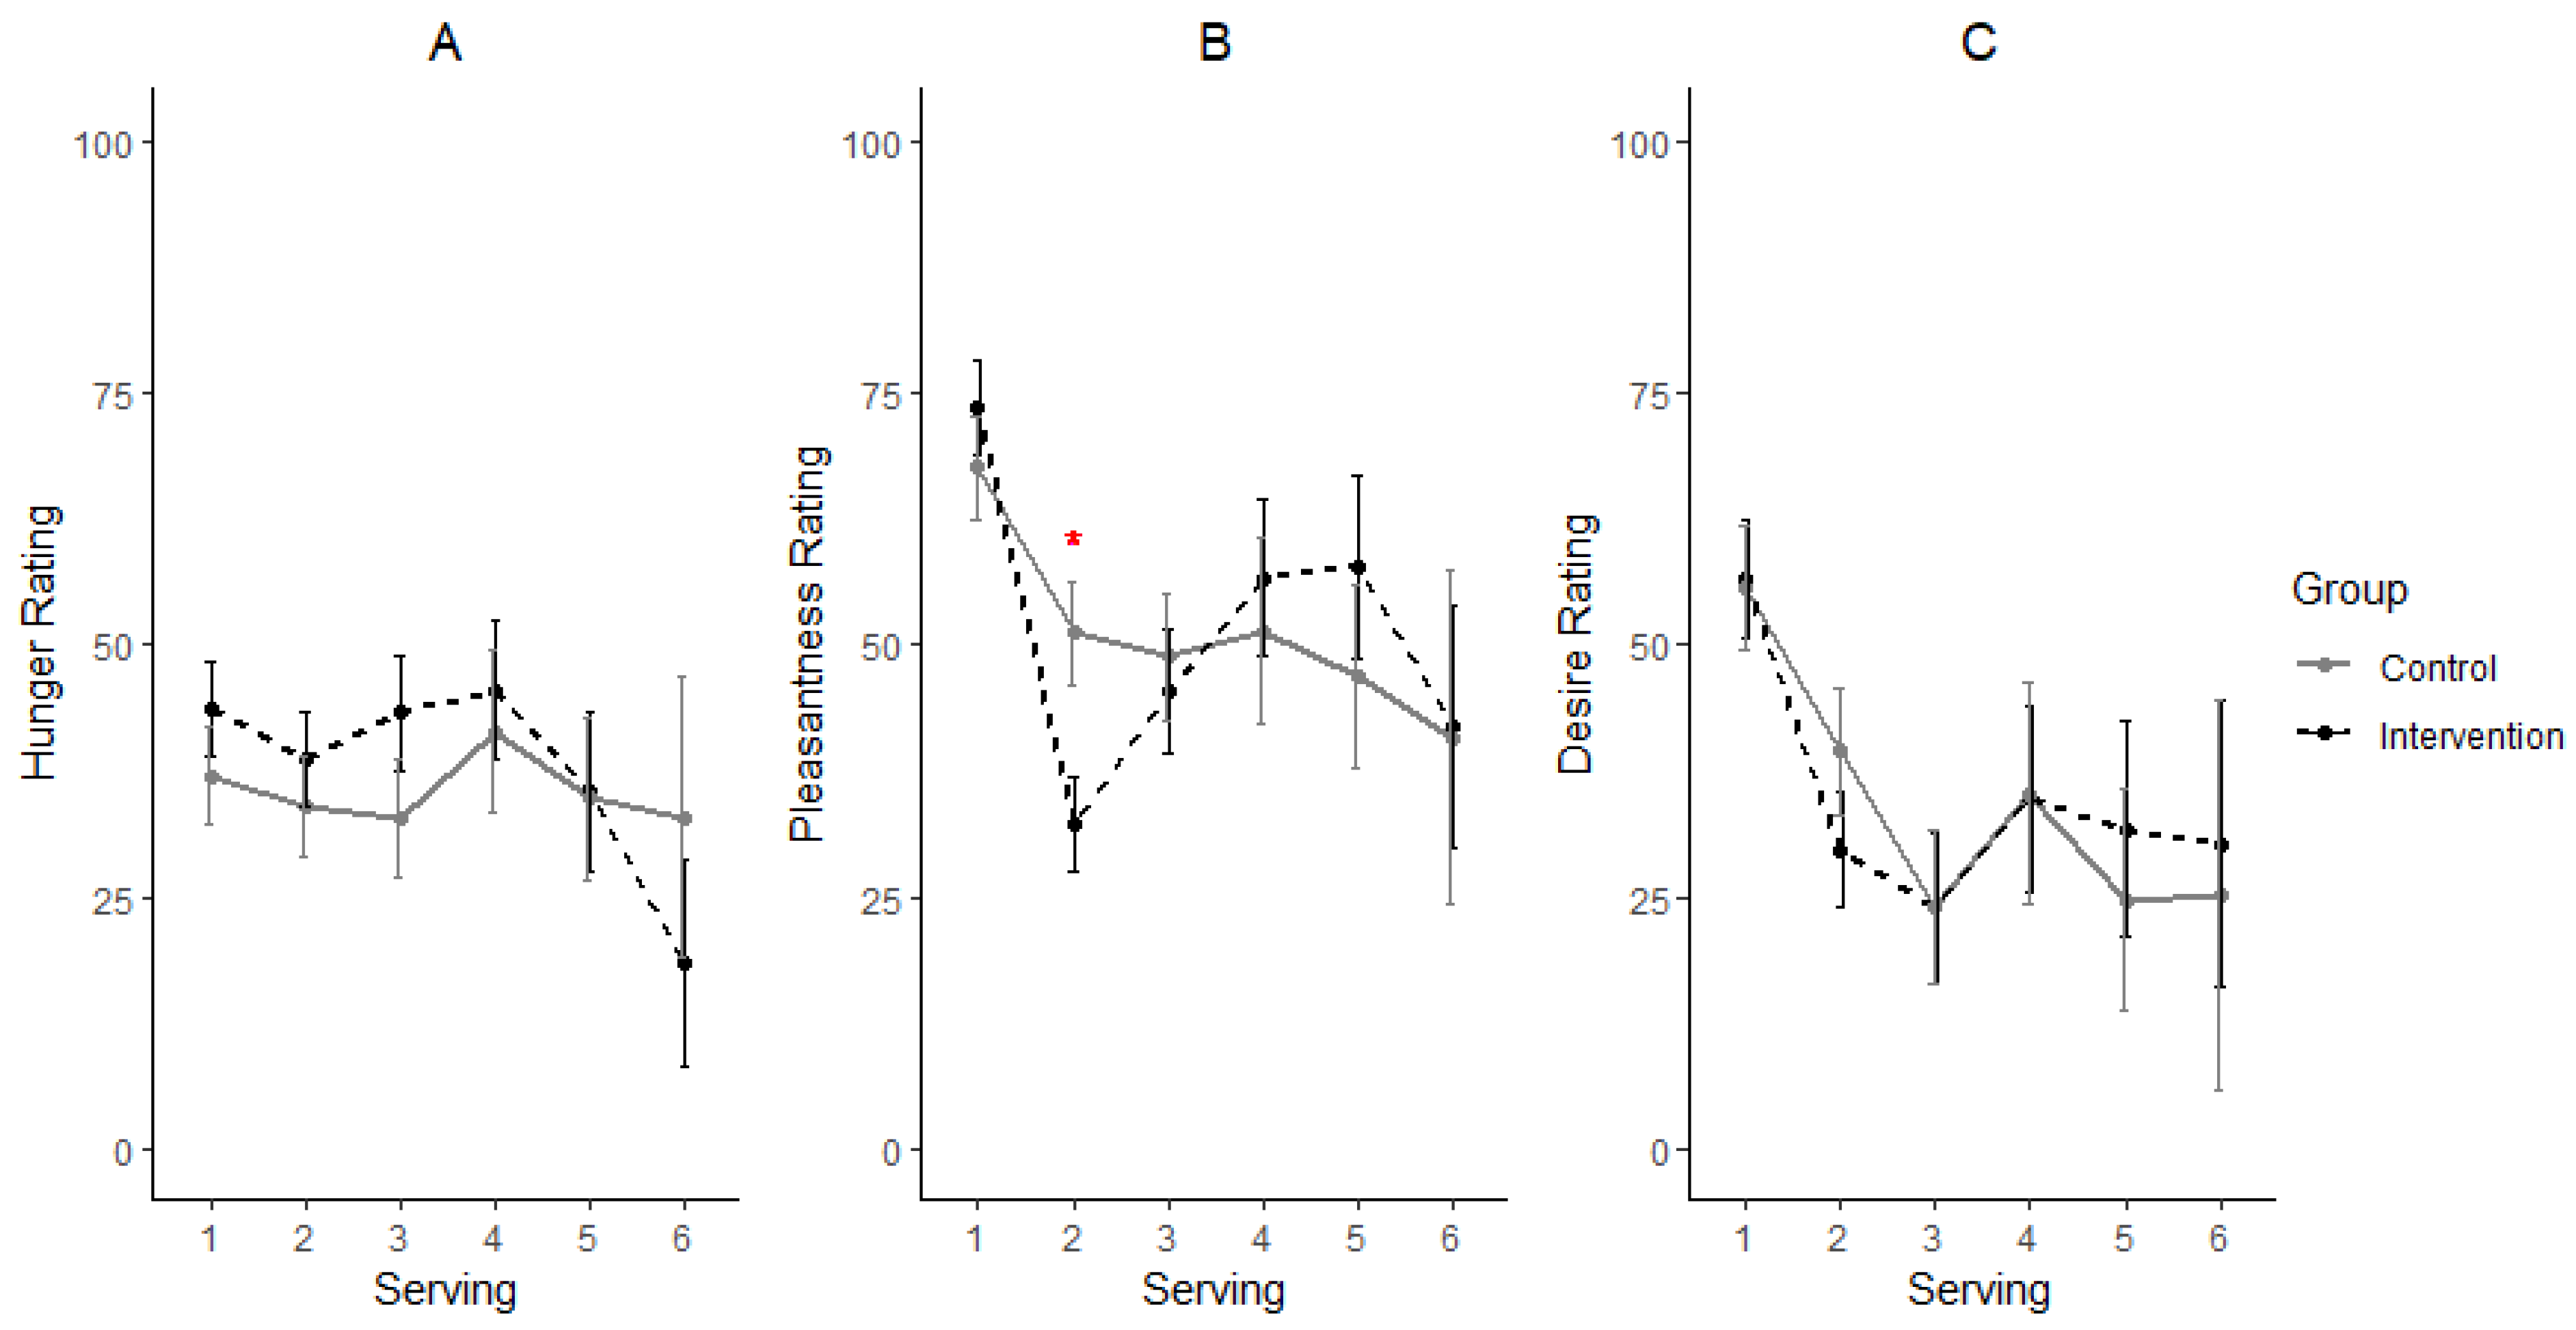
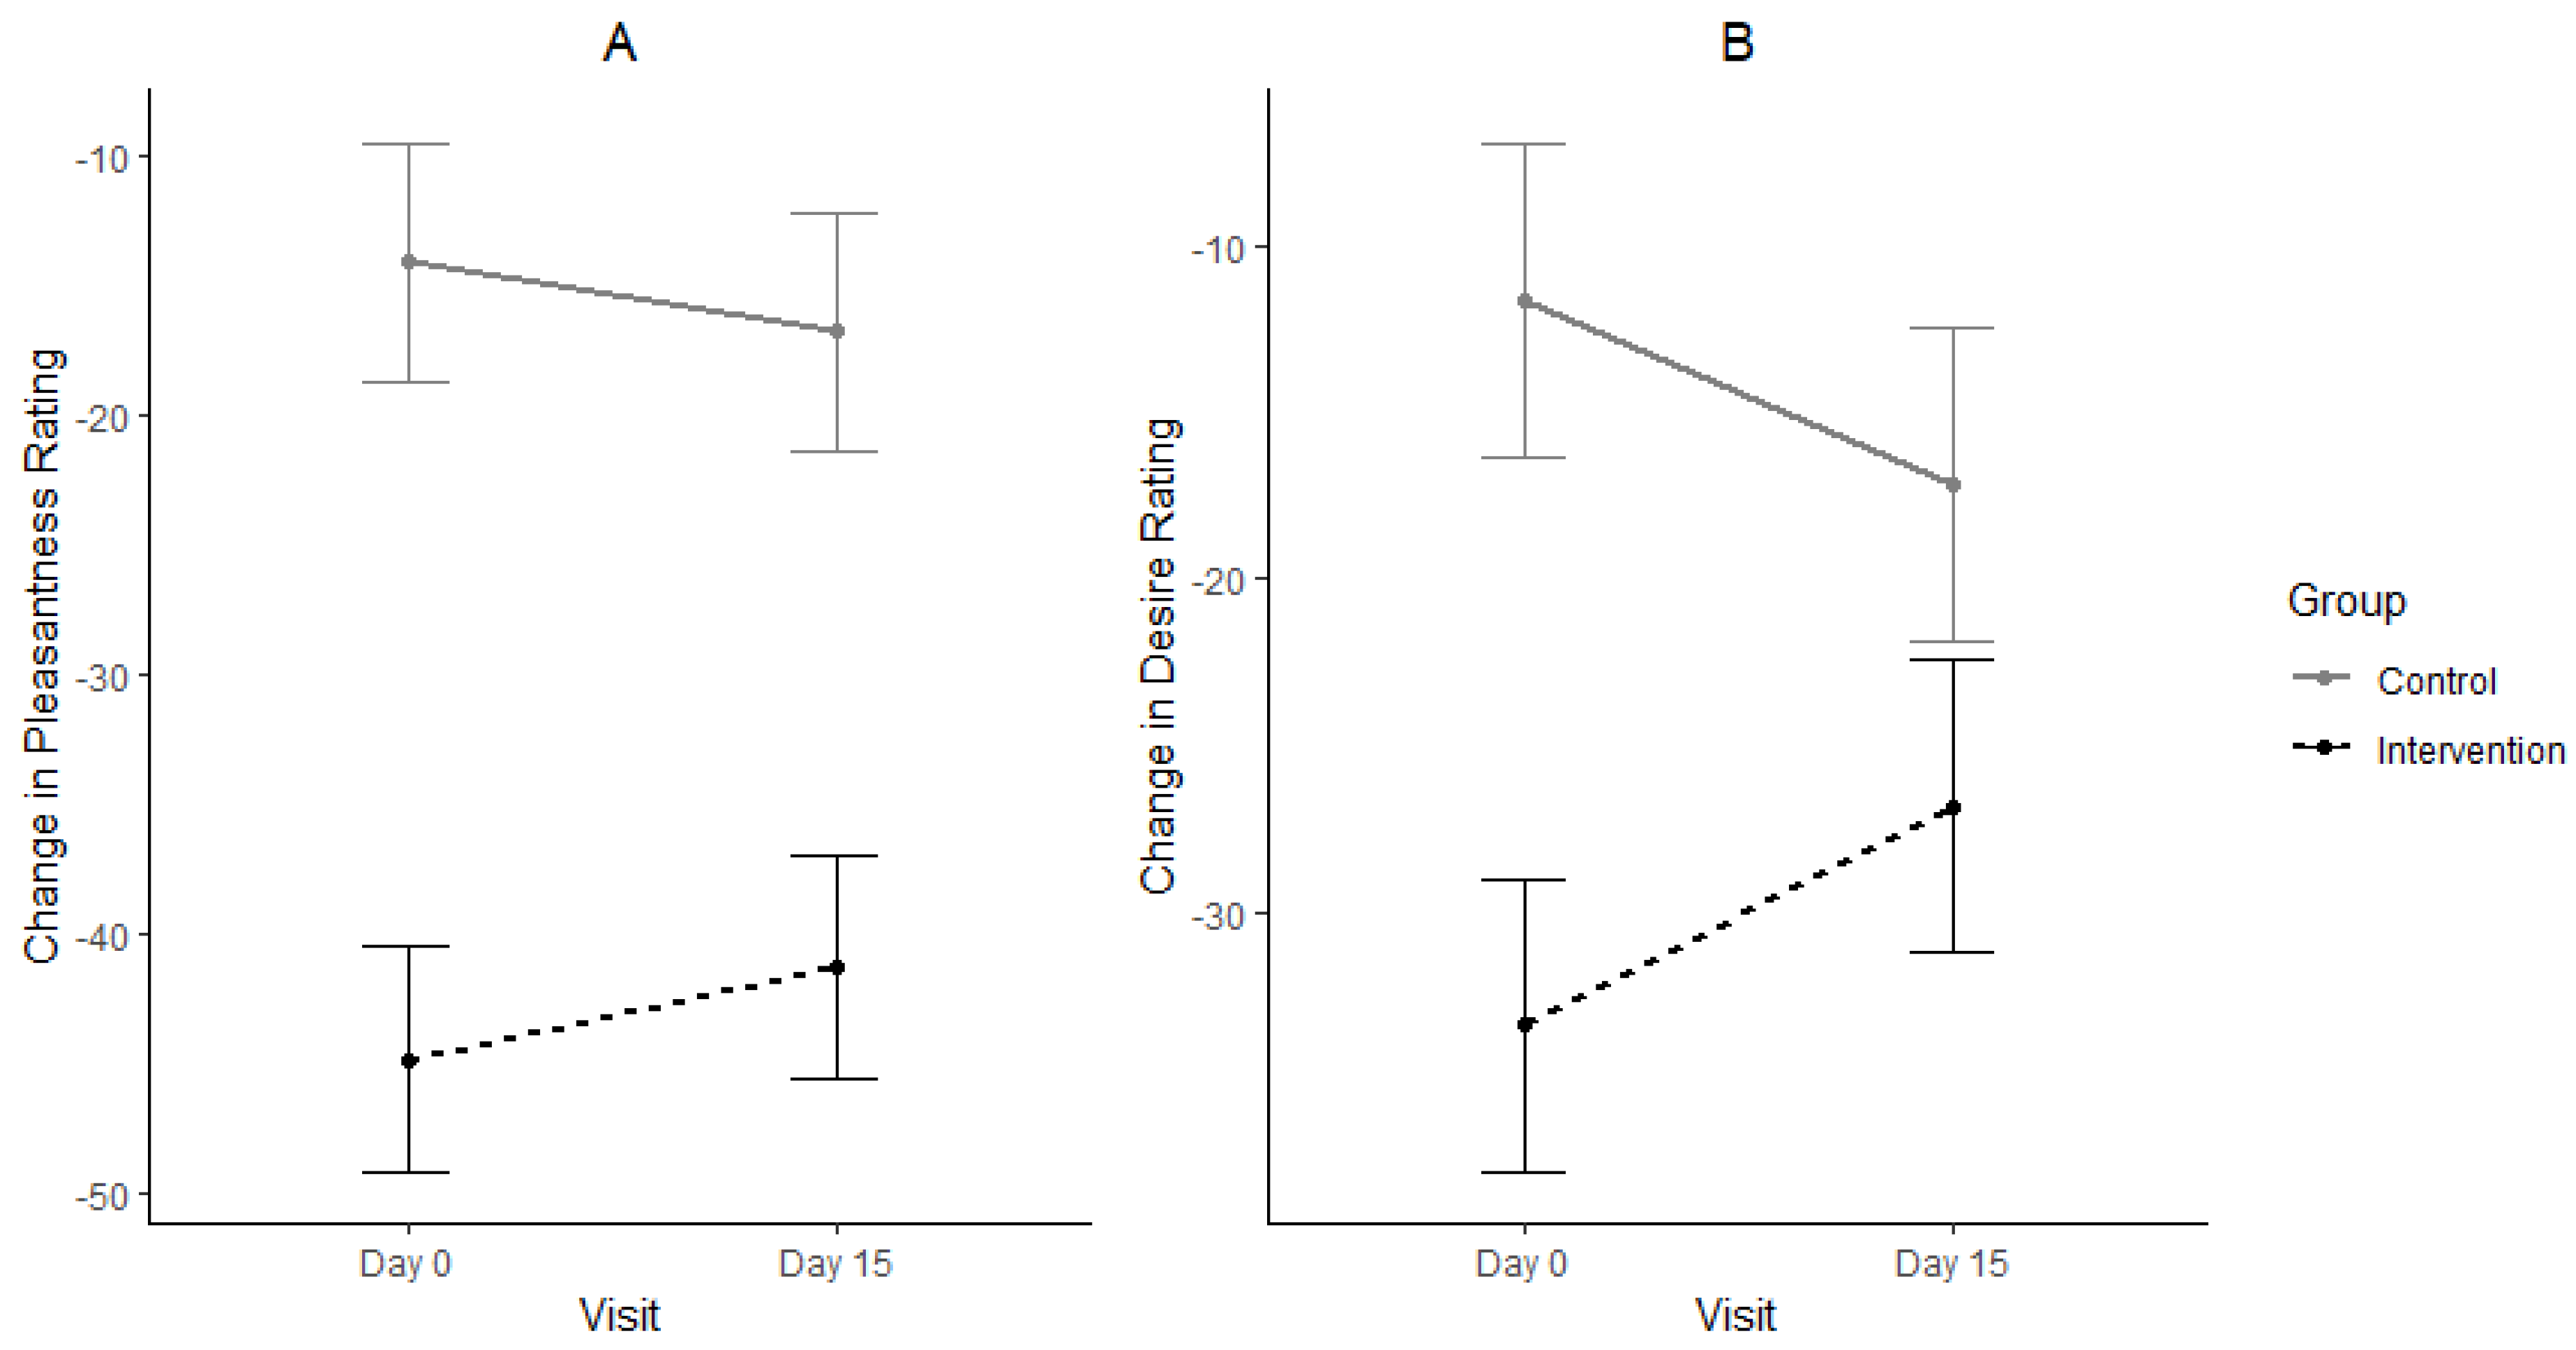
3.1. Consumption, Pleasantness and Desire for Eating Sweet Foods
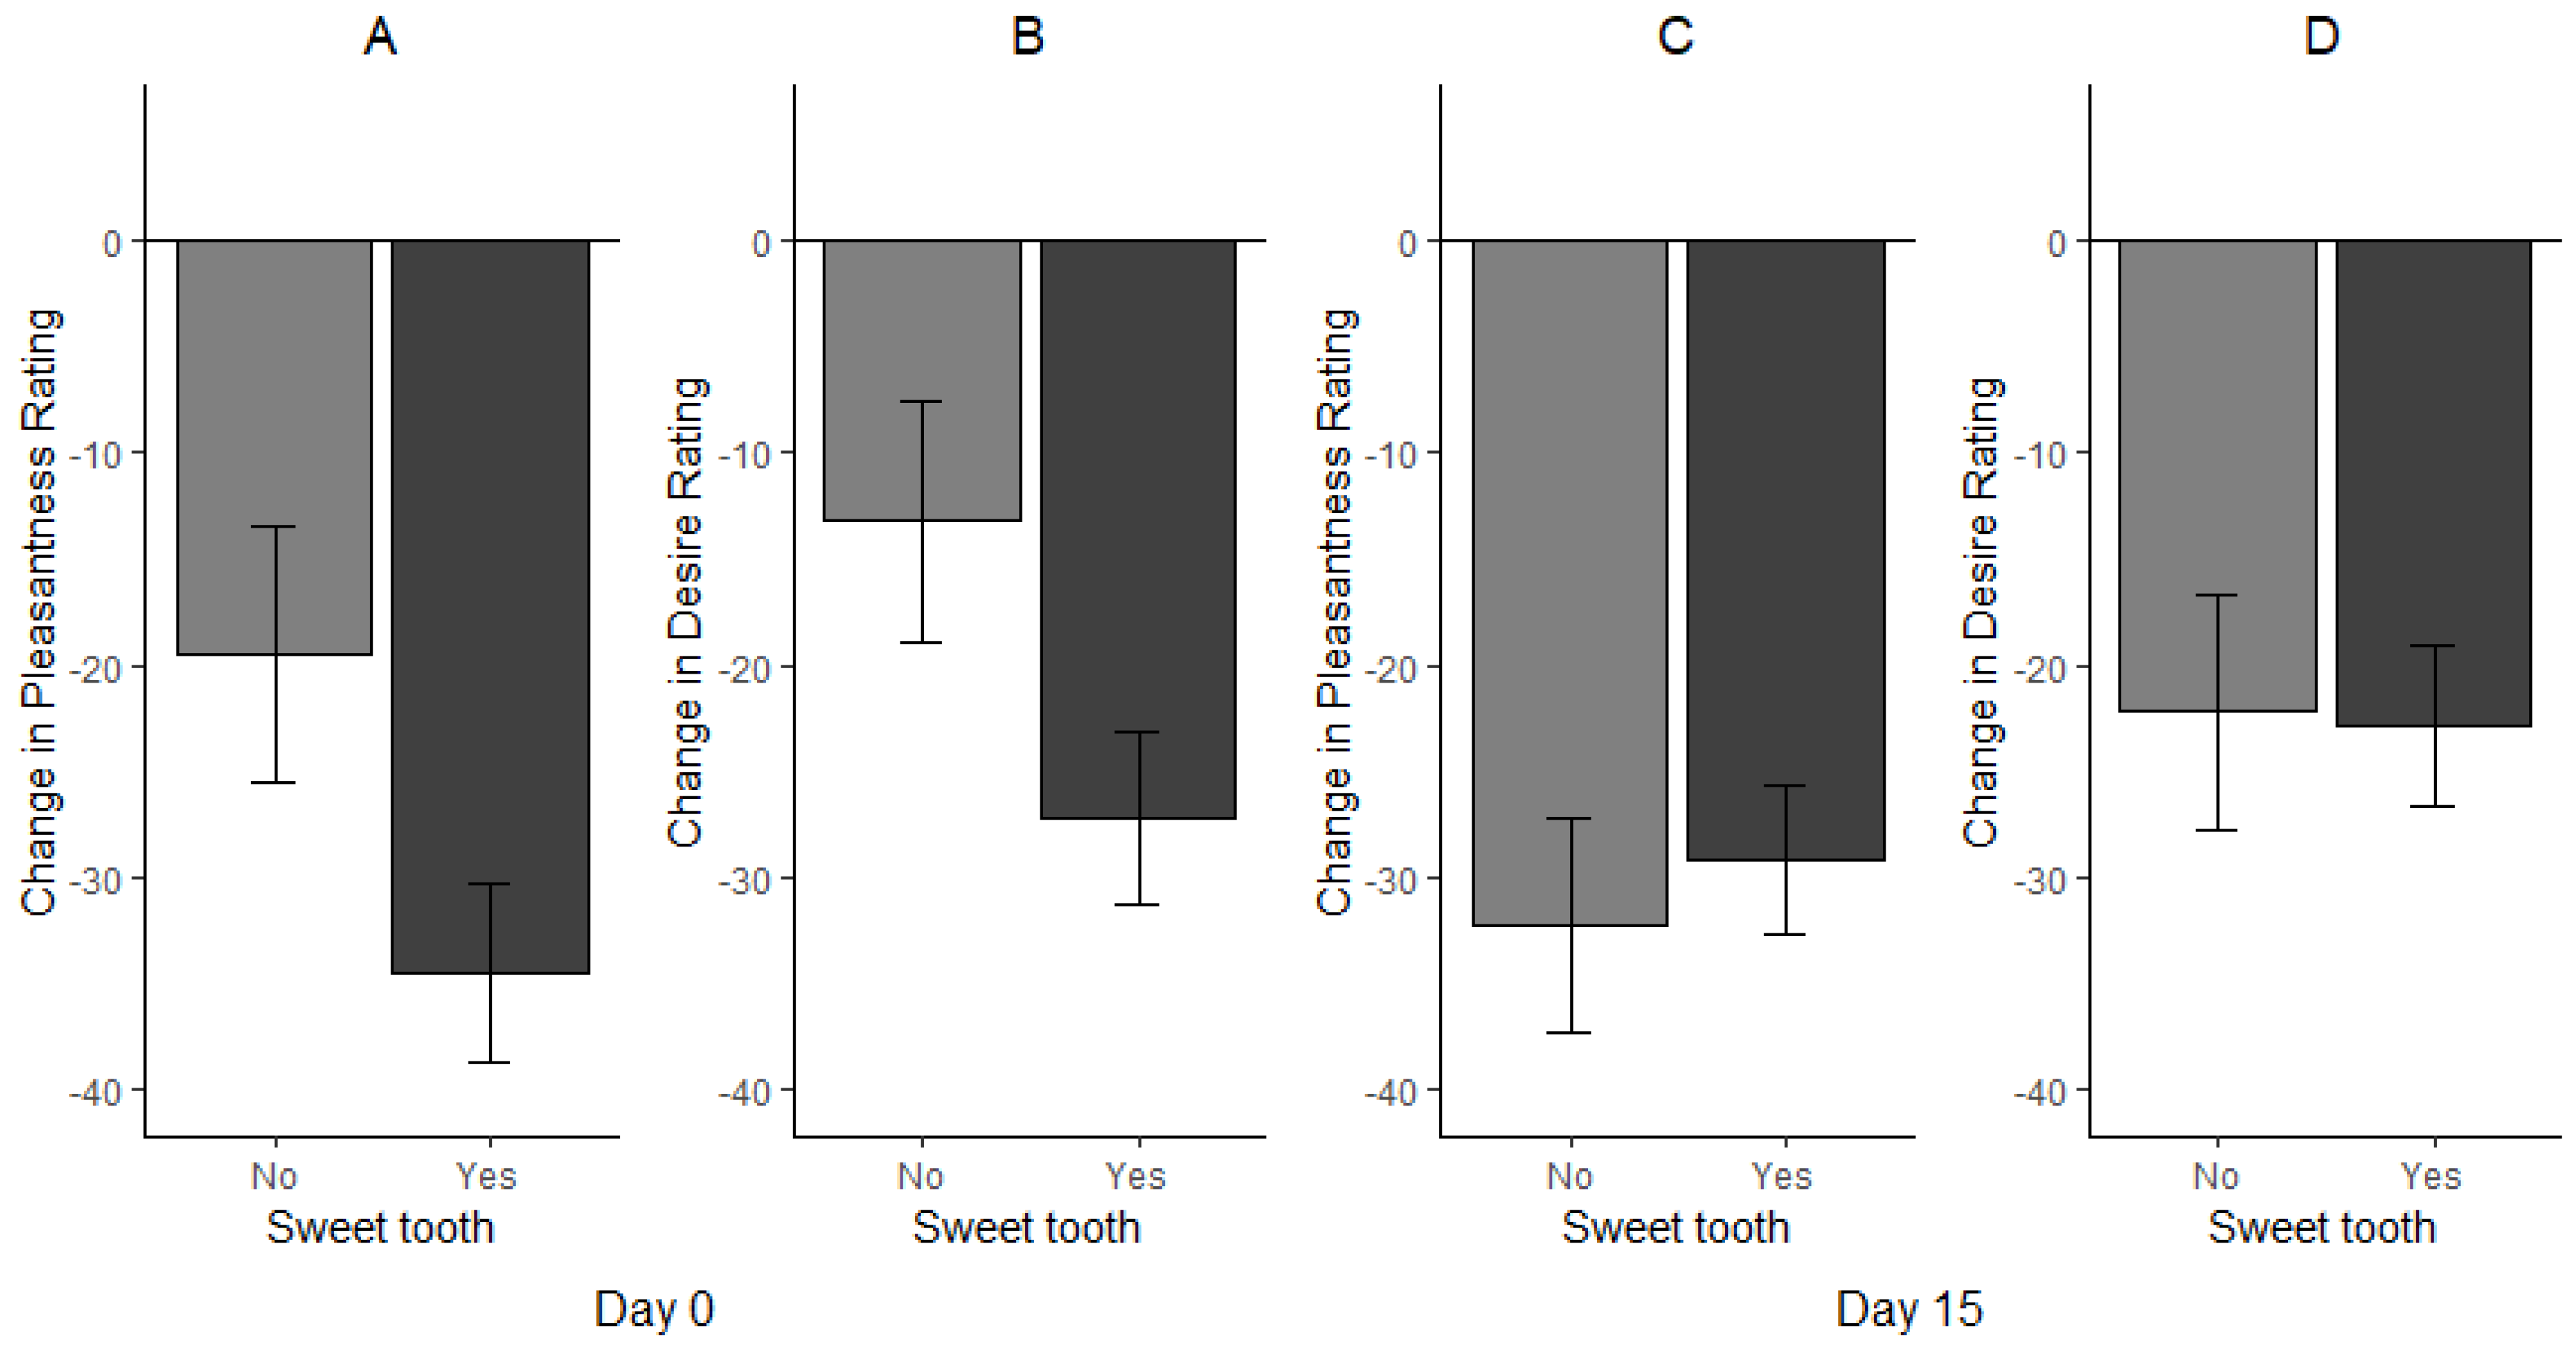
3.2. Effect of Sweet Tooth Status on Consumption, Desire and Pleasantness Ratings
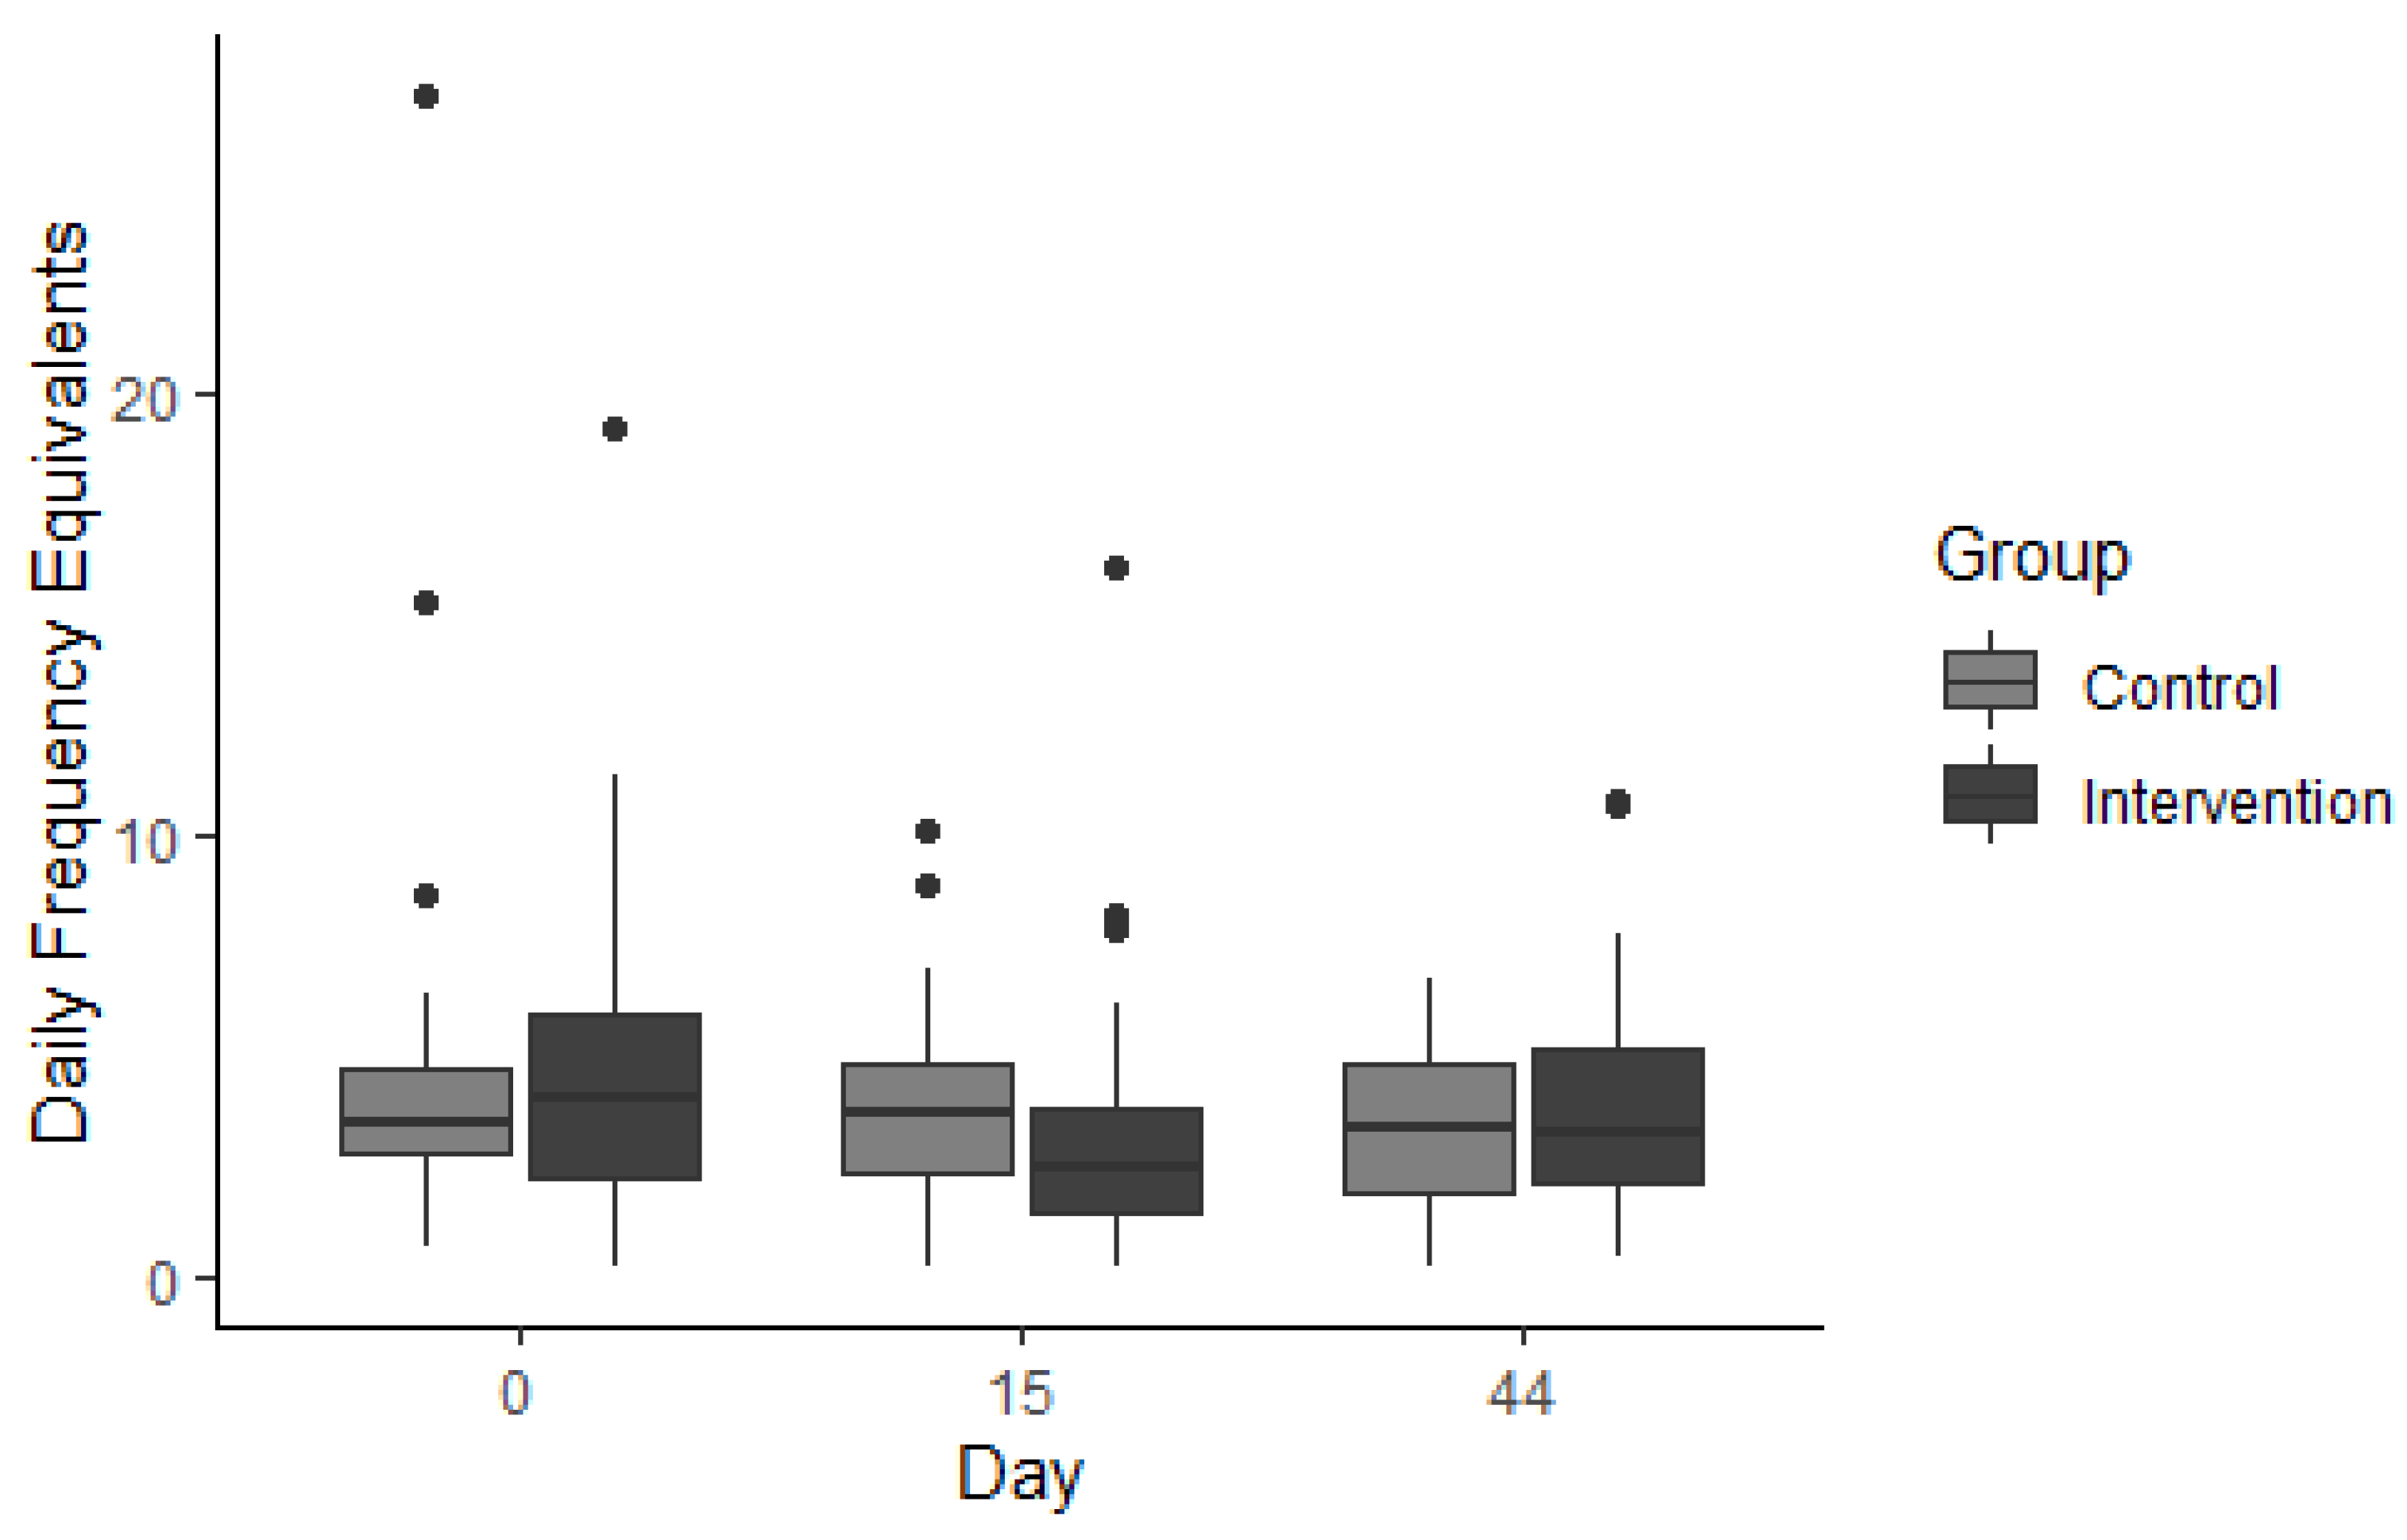
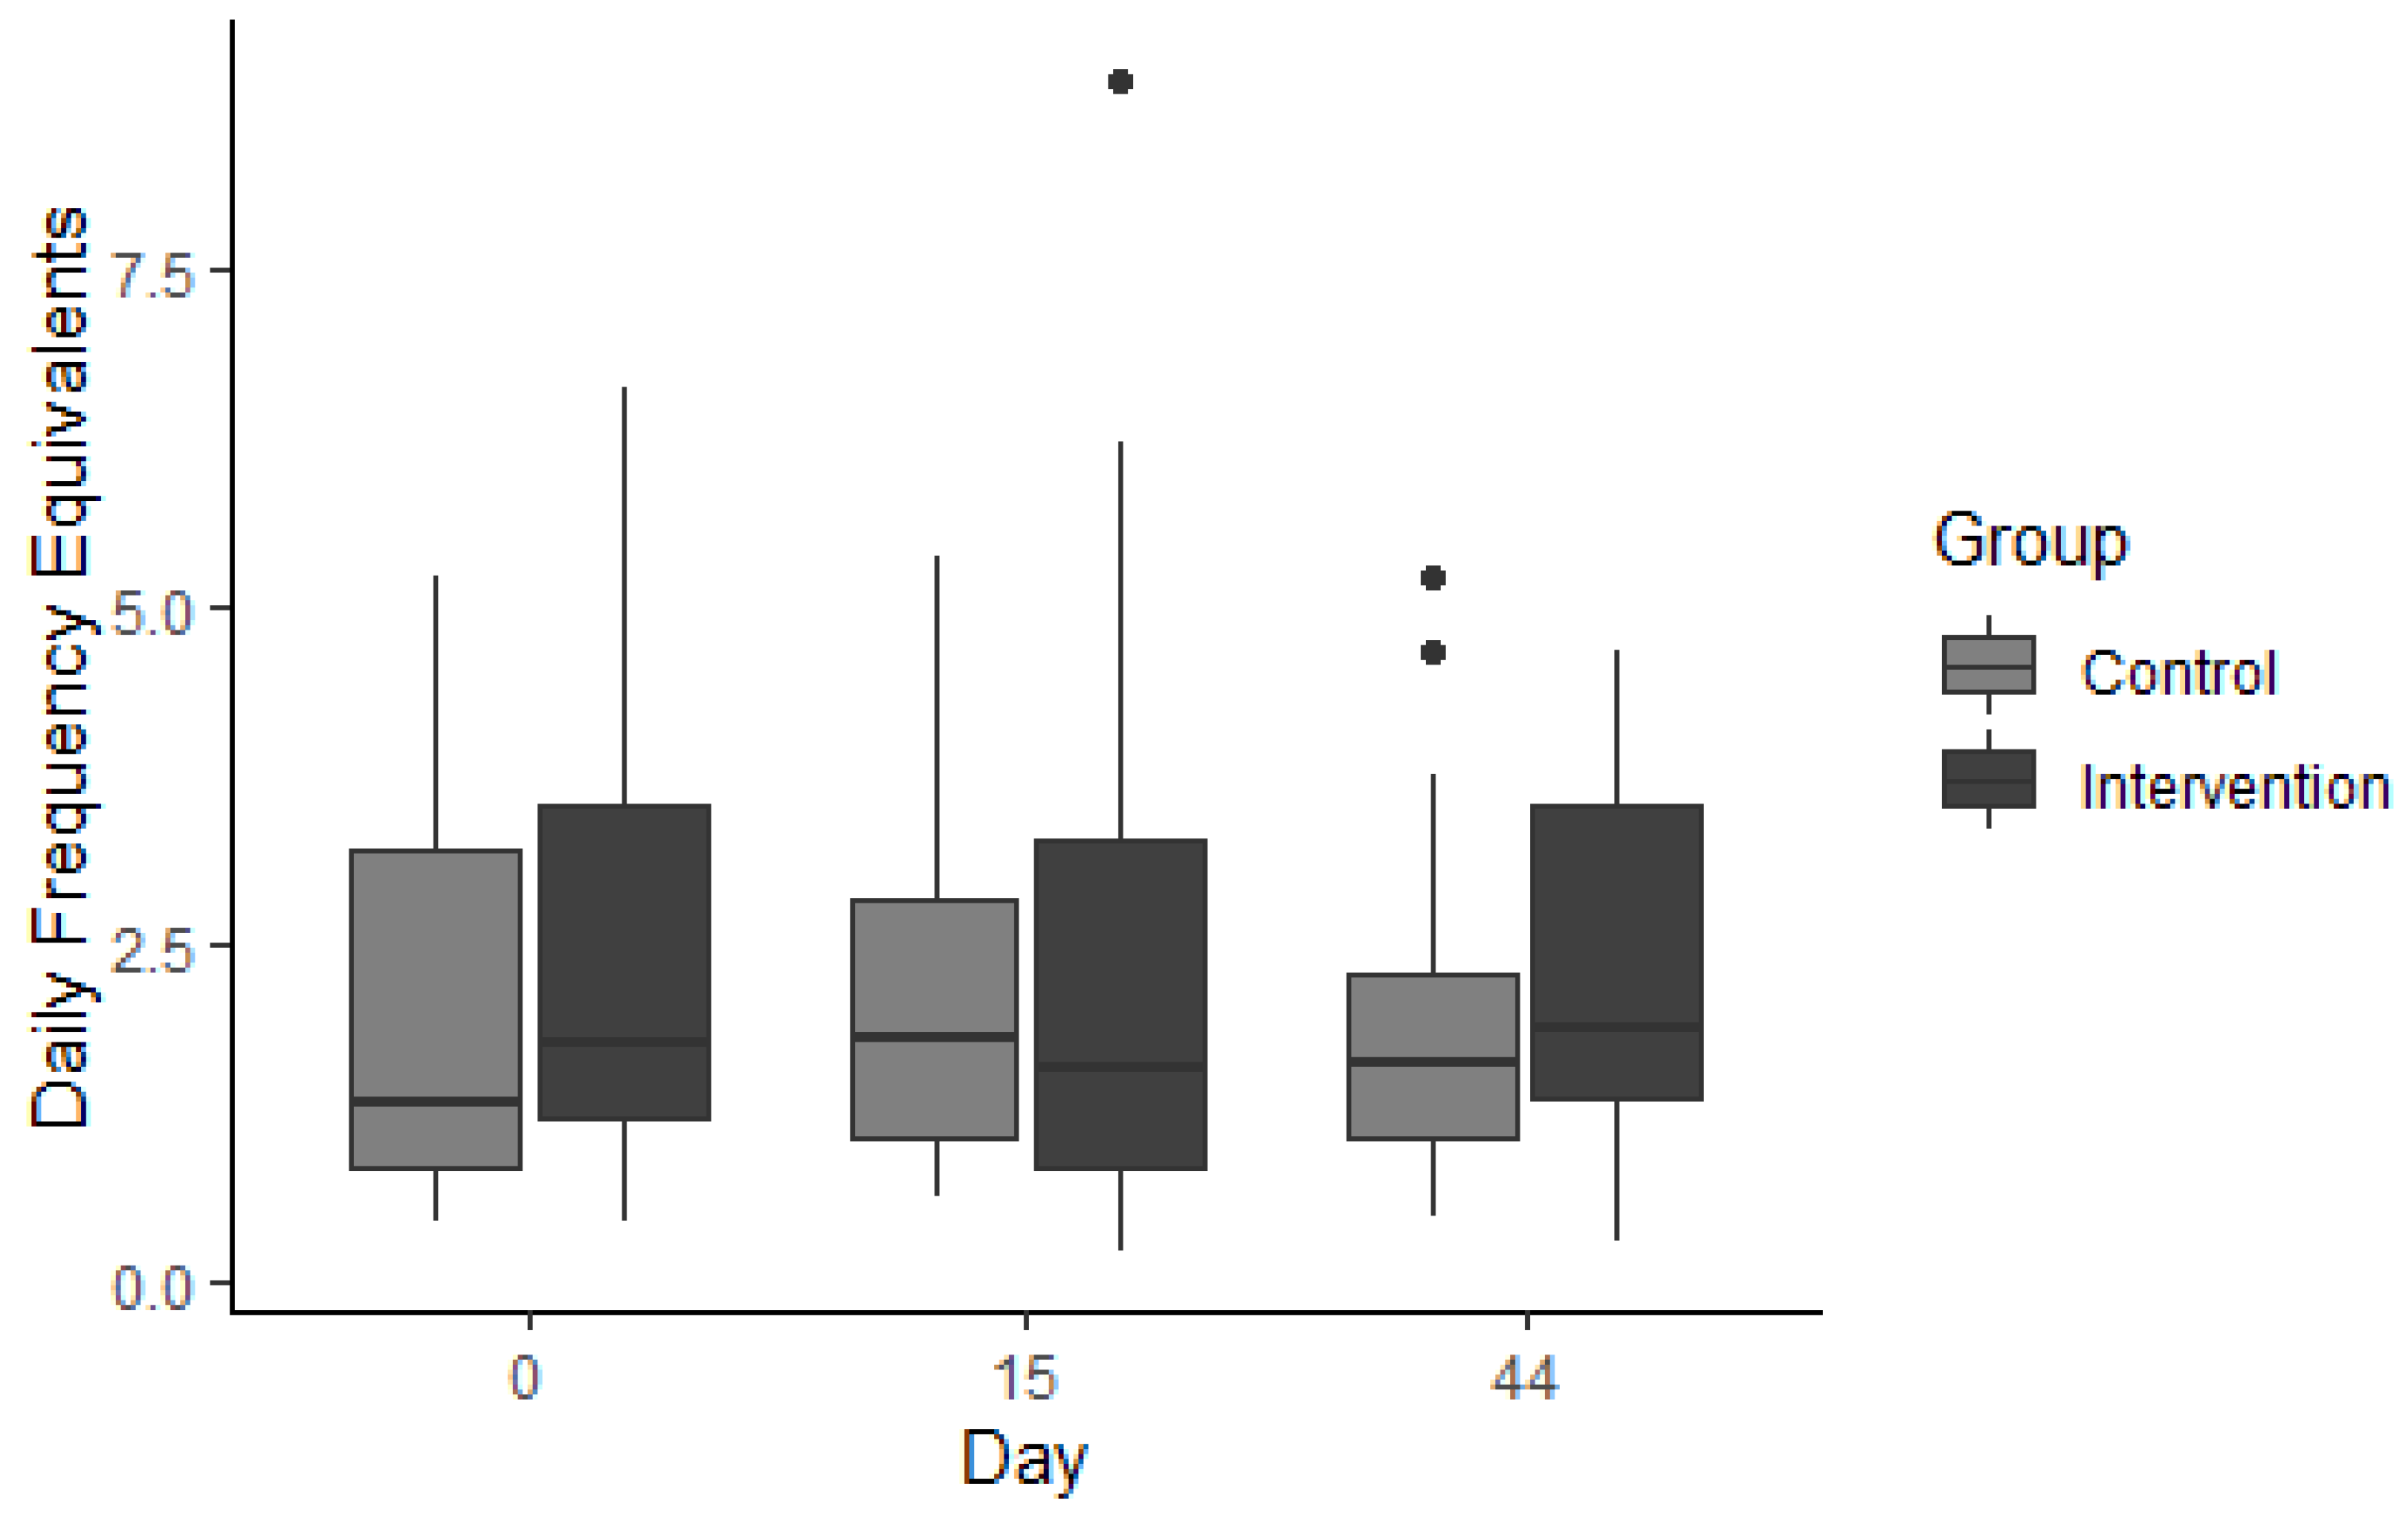
3.3. Effect of Gymnema sylvestre Consumption on Ad Libitum Sweet Food Consumption (SF-FFQ)
3.3.1. Occasional Foods
3.3.2. Everyday Foods
3.3.3. Fruit
4. Discussion
Limitations and Future Directions
5. Conclusions
Author Contributions
Funding
Institutional Review Board Statement
Informed Consent Statement
Data Availability Statement
Acknowledgments
Conflicts of Interest
Abbreviations
| BIA | Bioelectric Impendance Analysis |
| BF% | Body fat percentage |
| DFE | Daily frequency equivalent |
| GS | Gymnema sylvestre |
| GA | Gymnemic acids |
| LMS | labelled magnitude scale |
| SF-FFQ | Sweet Food Food Frequency Questionnaire |
| SSB | Sugar Sweetened Beverages |
| SSP | Sugar Sweetened Products |
| VAS | Visual Analogue Scale |
References
- Machado, P.P.; Steele, E.M.; Louzada, M.L.d.C.; Levy, R.B.; Rangan, A.; Woods, J.; Gill, T.; Scrinis, G.; Monteiro, C.A. Ultra-processed food consumption drives excessive free sugar intake among all age groups in Australia. Eur. J. Nutr. 2020, 59, 2783–2792. [Google Scholar] [CrossRef] [PubMed]
- Moynihan, P.J.; Kelly, S.A. Effect on caries of restricting sugars intake: Systematic review to inform WHO guidelines. J. Dent. Res. 2014, 93, 8–18. [Google Scholar] [CrossRef] [PubMed] [Green Version]
- Rodríguez, L.A.; Madsen, K.A.; Cotterman, C.; Lustig, R.H. Added sugar intake and metabolic syndrome in US adolescents: Cross-sectional analysis of the National Health and Nutrition Examination Survey 2005–2012. Public Health Nutr. 2016, 19, 2424–2434. [Google Scholar] [CrossRef] [PubMed] [Green Version]
- Yang, Q.; Zhang, Z.; Gregg, E.W.; Flanders, W.D.; Merritt, R.; Hu, F.B. Added Sugar Intake and Cardiovascular Diseases Mortality Among US Adults. JAMA Intern. Med. 2014, 174, 516–524. [Google Scholar] [CrossRef] [PubMed] [Green Version]
- Debras, C.; Chazelas, E.; Srour, B.; Kesse-Guyot, E.; Julia, C.; Zelek, L.; Agaësse, C.; Druesne-Pecollo, N.; Galan, P.; Hercberg, S.; et al. Total and added sugar intakes, sugar types, and cancer risk: Results from the prospective NutriNet-Santé cohort. Am. J. Clin. Nutr. 2020, 112, 1267–1279. [Google Scholar] [CrossRef] [PubMed]
- Eyles, H.; Trieu, K.; Jiang, Y.; Mhurchu, C.N. Reducing children’s sugar intake through food reformulation: Methods for estimating sugar reduction program targets, using New Zealand as a case study. Am. J. Clin. Nutr. 2019, 111, 622–634. [Google Scholar] [CrossRef] [Green Version]
- Grummon, A.H.; Brewer, N.T. Health warnings and beverage purchase behaviour: Mediators of impact. Ann. Behav. Med. 2020, 54, 691–702. [Google Scholar] [CrossRef]
- Teng, A.M.; Jones, A.C.; Mizdrak, A.; Signal, L.; Genç, M.; Wilson, N. Impact of sugar-sweetened beverage taxes on purchases and dietary intake: Systematic review and meta-analysis. Obes. Rev. 2019, 20, 1187–1204. [Google Scholar] [CrossRef] [Green Version]
- Yeung, C.H.C.; Gohil, P.; Rangan, A.M.; Flood, V.M.; Arcot, J.; Gill, T.P.; Louie, J.C.Y. Modelling of the impact of universal added sugar reduction through food reformulation. Sci. Rep. 2017, 7, 17392. [Google Scholar] [CrossRef] [Green Version]
- Al-Romaiyan, A.; Liu, B.; Asare-Anane, H.; Maity, C.R.; Chatterjee, S.K.; Koley, N.; Biswas, T.; Chatterji, A.K.; Huang, G.-C.; Amiel, A.S.; et al. A novel Gymnema sylvestre extract stimulates insulin secretion from human islets in vivo and in vitro. Phytother. Res. 2010, 24, 1370–1376. [Google Scholar] [CrossRef]
- Laha, S.; Paul, S. Gymnema sylvestre (Gurmar): A potent herb with anti-diabetic and antioxidant potential. Pharmacog. J. 2019, 11, 201–206. [Google Scholar] [CrossRef] [Green Version]
- Gent, J.F.; Hettinger, T.P.; Frank, M.E.; Marks, L.E. Taste confusions following gymnemic acid rinse. Chem Senses 1999, 24, 393–403. [Google Scholar] [CrossRef] [PubMed] [Green Version]
- Ahmed, S.H.; Guillem, K.; Vandaele, Y. Sugar addiction: Pushing the drug-sugar analogy to the limit. Curr. Opin. Clin. Nutr. Metab. Care 2013, 16, 434–439. [Google Scholar] [CrossRef]
- Lawless, H.T. Evidence for neural inhibition in bittersweet taste mixtures. J. Comp. Physiol. Psychol. 1979, 93, 538–547. [Google Scholar] [CrossRef] [PubMed]
- Sanematsu, K.; Kusakabe, Y.; Shigemura, N.; Hirokawa, T.; Nakamura, S.; Imoto, T.; Ninomiya, Y. Molecular Mechanisms for Sweet-suppressing Effect of Gymnemic Acids. J. Biol. Chem. 2014, 289, 25711–25720. [Google Scholar] [CrossRef] [PubMed] [Green Version]
- Schroeder, J.A.; Flannery-Schroeder, E. Use of the herb Gymnema sylvestre to illustrate the principles of gustatory sensation: An undergraduate neuroscience laboratory exercise. J. Undergrad. Neurosci. Educ. 2005, 3, 59–62. [Google Scholar]
- Nobel, S.; Baker, C.; Loullis, C. Crave Crush lozenge containing gymnemic acids reduce consumption of high sugar foods. Adv. Med. Plant Res. 2017, 5, 63–67. [Google Scholar] [CrossRef] [Green Version]
- Stice, E.; Yokum, S.; Gau, J.M. Gymnemic acids lozenge reduces short-term consumption of high-sugar food: A placebo controlled experiment. J. Psychopharmacol. 2017, 31, 1496–1502. [Google Scholar] [CrossRef] [PubMed]
- Turner, S.; Diako, C.; Kruger, R.; Wong, M.; Wood, W.; Rutherfurd-Markwick, K.; Ali, A. Consuming Gymnema sylvestre Reduces the Desire for High-Sugar Sweet Foods. Nutrients 2020, 12, 1046. [Google Scholar] [CrossRef] [PubMed]
- Alamgir, A.K.M.; Phil, M.; Ferdousi, J. Randomized 30-day trial with granulated gymnema green tea to reduce blood sugar. In Proceedings of the 17th World Congress on Heart Disease, Toronto, ON, Canada, 27–30 July 2012. [Google Scholar]
- Baskaran, K.; Kizar Ahamath, B.; Radha Shanmugasundaram, K.; Shanmugasundaram, E.R. Antidiabetic effect of a leaf extract from Gymnema sylvestre in non-insulin dependent diabetes mellitus. J. Ethnopharmacol. 1990, 30, 295–300. [Google Scholar] [CrossRef]
- Berridge, K.C.; Ho, C.-Y.; Richard, J.M.; DiFeliceantonio, A.G. The tempted brain eats: Pleasure and desire circuits in obesity and eating disorders. Brain Res. 2010, 1350, 43–64. [Google Scholar] [CrossRef] [PubMed]
- Demos, K.E.; Heatherton, T.F.; Kelley, W.M. Individual Differences in Nucleus Accumbens Activity to Food and Sexual Images Predict Weight Gain and Sexual Behavior. J. Neurosci. 2012, 32, 5549–5552. [Google Scholar] [CrossRef] [PubMed] [Green Version]
- Stice, E.; Burger, K.S.; Yokum, S. Reward region responsivity predicts future weight gain and moderating effects of the TaqIA allele. J. Neurosci. 2015, 35, 10316–10324. [Google Scholar] [CrossRef] [Green Version]
- Yokum, S.; Gearhardt, A.N.; Harris, J.L.; Brownell, K.D.; Stice, E. Individual differences in striatum activity to food commercials predict weight gain in adolescents. Obesity 2014, 22, 2544–2551. [Google Scholar] [CrossRef] [Green Version]
- Yokum, S.; Stice, E. Weight gain is associated with changes in neural response to palatable food tastes varying in sugar and fat and palatable food images: A repeated-measures fMRI study. Am. J. Clin. Nutr. 2019, 110, 1275–1286. [Google Scholar] [CrossRef] [PubMed]
- Stice, E.; Yokum, S. Effects of gymnemic acids lozenge on reward region response to receipt and anticipated receipt of high-sugar food. Physiol. Behav. 2018, 194, 568–576. [Google Scholar] [CrossRef]
- Pasternak, H. Sugar Reset Guide . 2019. [Google Scholar]
- Ministry of Health. Healthy Eating, Active Living; Ministry of Health: Wellington, New Zealand, 2018.
- Jayasinghe, S.N.; Kruger, R.; Walsh, D.C.I.; Cao, G.; Rivers, S.; Richter, M.; Breier, B.H. Is Sweet Taste Perception Associated with Sweet Food Liking and Intake? Nutrients 2017, 9, 750. [Google Scholar] [CrossRef] [Green Version]
- Daly, A.M.; Parsons, J.E.; Wood, N.A.; Gill, T.K.; Taylor, A.W. Food consumption habits in two states of Australia, as measured by a Food Frequency Questionnaire. BMC Res. Notes 2011, 4, 507. [Google Scholar] [CrossRef] [Green Version]
- Di Noia, J.; Contento, I.R. Use of a brief food frequency questionnaire for estimating daily number of servings of fruits and vegetables in a minority adolescent population. J. Am. Diet. Assoc. 2009, 109, 1785–1789. [Google Scholar] [CrossRef] [Green Version]
- Ministry of Health. Eating and Activity Guidelines for New Zealand Adults; Ministry of Health: Wellington, New Zealand, 2015.
- Field, A.; Miles, J.; Field, Z. Discovering Statistics Using R; Sage Publications: London, UK, 2012. [Google Scholar]
- Prochaska, J.O.; DiClemente, C.C. Stages and processes of self-change of smoking: Toward an integrative model of change. J. Consult. Clin. Psychol. 1983, 51, 390–395. [Google Scholar] [CrossRef]
- Thiagarajah, K.; Kay, N.S. Readiness to change sugar sweetened beverage intake among college students in USA and Thailand: An exploratory study. J. Acad. Nutr. Diet. 2015, 115, A89. [Google Scholar] [CrossRef]
- University of Otago, Ministry of Health. A Focus on Nutrition: Key Findings of the 2008/09 New Zealand Adult Nutrition Survey; Ministry of Health: Wellington, New Zealand, 2011.
- Ng, S.W.; Mhurchu, C.N.; Jebb, S.A.; Popkin, B.M. Patterns and trends of beverage consumption among children and adults in Great Britain, 1986–2009. Br. J. Nutr. 2011, 108, 536–551. [Google Scholar] [CrossRef] [PubMed] [Green Version]
- Kampov-Polevoy, A.B.; Alterman, A.; Khalitov, E.; Garbutt, J.C. Sweet preference predicts mood altering effect of and impaired control over eating sweet foods. Eat. Behav. 2006, 7, 181–187. [Google Scholar] [CrossRef] [PubMed]
- Kampov-Polevoy, A.B.; Garbutt, J.C.; Janowsky, D. Evidence of preference for a high-concentration sucrose solution in alcoholic men. Am. J. Psychiatr. 1997, 154, 269–270. [Google Scholar] [CrossRef] [PubMed] [Green Version]
- de Menezes, E.V.A.; Sampaio, H.A.d.C.; Carioca, A.A.F.; Parente, N.A.; Brito, F.O.; Moreira, T.M.M.; de Souza, A.C.C.; Arruda, S.P.M. Influence of Paleolithic diet on anthropometric markers in chronic diseases: Systematic review and meta-analysis. Nutr. J. 2019, 18, 41. [Google Scholar] [CrossRef] [Green Version]
- Patterson, R.E.; Laughlin, G.A.; LaCroix, A.Z.; Hartman, S.J.; Natarajan, L.; Senger, C.M.; Martínez, M.E.; Villaseñor, A.; Sears, D.D.; Marinac, C.R.; et al. Intermittent Fasting and Human Metabolic Health. J. Acad. Nutr. Diet. 2015, 115, 1203–1212. [Google Scholar] [CrossRef] [Green Version]
- Kuchkuntla, A.R.; Limketkai, B.; Nanda, S.; Hurt, R.T.; Mundi, M.S. Fad Diets: Hype or Hope? Curr. Nutr. Rep. 2018, 7, 310–323. [Google Scholar] [CrossRef]
- Khawandanah, J.; Tewfik, I. Fad diets: Lifestyle promises and health challenges. J. Food Res. 2016, 5, 80. [Google Scholar] [CrossRef] [Green Version]
- Jain, P.; Danaei, G.; Manson, J.E.; Robins, J.M.; Hernán, M.A. Weight gain after smoking cessation and lifestyle strategies to reduce it. Epidemiology 2020, 31, 7–14. [Google Scholar] [CrossRef]
- World Health Organization. Guideline: Sugars Intake for Adults and Children; World Health Organization: Geneva, Switzerland, 2015. [Google Scholar]
- Ministry of Health. Eating and Activity Guidelines for New Zealand Adults: Updated 2020; Ministry of Health: Wellington, New Zealand, 2020.
- Ministry of Health. Annual Data Explorer 2019/20: New Zealand Health Survey [Data File]; Ministry of Health: Wellington, New Zealand, 2020.
- Capita, R.; Alonso-Calleja, C. Differences in reported winter and summer dietary intakes in young adults in Spain. Int. J. Food Sci. Nutr. 2005, 56, 431–443. [Google Scholar] [CrossRef]
- Jaeger, S.R.; Rasmussen, M.A.; Prescott, J. Relationships between food neophobia and food intake and preferences: Findings from a sample of New Zealand adults. Appetite 2017, 116, 410–422. [Google Scholar] [CrossRef] [PubMed]
- Ziegler, R.G.; Wilcox, H.B., 3rd; Mason, T.J.; Bill, J.S.; Virgo, P.W. Seasonal variation in intake of carotenoids and vegetables and fruits among white men in New Jersey. Am. J. Clin. Nutr. 1987, 45, 107–114. [Google Scholar] [CrossRef] [PubMed]
- Shiyovich, A.; Sztarkier, I.; Nesher, L. Toxic hepatitis induced by Gymnema sylvestre, a natural remedy for type 2 diabetes mellitus. Am. J. Med. Sci. 2010, 340, 514–517. [Google Scholar] [CrossRef] [PubMed]
- Stice, E.; Palmrose, C.A.; Burger, K.S. Elevated BMI and male sex are associated with greater underreporting of caloric intake as assessed by doubly labeled water. J. Nutr. 2015, 145, 2412–2418. [Google Scholar] [CrossRef] [PubMed] [Green Version]
- Khan, F.; Sarker, M.R.; Ming, L.C.; Mohamed, I.N.; Zhao, C.; Sheikh, B.Y.; Tsong, H.F.; Rashid, M.A. Comprehensive Review on Phytochemicals, Pharmacological and Clinical Potentials of Gymnema sylvestre. Front. Pharmacol. 2019, 10, 1223. [Google Scholar] [CrossRef] [PubMed]
- Chambers, E.S.; Bridge, M.W.; Jones, D.A. Carbohydrate sensing in the human mouth: Effects on exercise performance and brain activity. J. Physiol. 2009, 587, 1779–1794. [Google Scholar] [CrossRef] [PubMed]


| Characteristics (Mean ± SD) or n (%) | Total Group | Intervention Group | Control Group |
|---|---|---|---|
| Gender n (%) | 58 (100) | 31 (53.4) | 27 (46.6) |
| Men | 19 (32.8) | 10 (52.6) | 9 (47.4) |
| Women | 39 (67.2) | 21 (53.8) | 18 (46.2) |
| Age (years) | 29.5 ± 7.8 | 30.5 ± 7.4 | 28.0 ± 8.0 |
| Median | 27 | 33 | 26 |
| Range | 18–45 | 19–44 | 18–45 |
| BMI (kg/m2) mean ± SD | 26.1 ± 6.6 | 25.9 ± 7.1 | 26.3 ± 6.2 |
| BMI group n (%) | |||
| Underweight | 2 (3.4) | 2 (6.5) | 0 (0) |
| Normal | 33 (56.9) | 18 (58.1) | 15 (55.6) |
| Overweight | 10 (17.2) | 4 (12.9) | 6 (22.2) |
| Obese | 13 (22.4) | 7 (22.6) | 6 (22.2) |
| Weight (kg) mean ± SD | 73.2 ± 19.0 | 72.5 ± 19.6 | 74.1 ± 18.6 |
| Body fat % mean ± SD | 29.2 ± 11.5 | 28.1 ± 10.6 | 30.4 ± 12.4 |
| Ethnicity * n (%) | |||
| Māori | 2 (3.5) | 1 (3.3) | 1 (3.5) |
| European | 34 (59.6) | 20 (66.7) | 14 (15.9) |
| Pacific Peoples | 2 (3.5) | 2 (6.7) | 0 (0) |
| Asian | 17 (29.8) | 7 (23.3) | 10 (37.0) |
| MELAA # | 6 (10.5) | 3 (10.0) | 3 (11.1) |
| Chocolate | Participant Selection (n) * (%) | Weight (g) | Energy (kJ) | Sugar per Serve (g) | Sugar per 100 g (g) | Cocoa Content (%) | |
|---|---|---|---|---|---|---|---|
| Whittaker’s® Almond Gold | 15 | 26 | 15 | 360 | 5.2 | 34.6 | 33 |
| Nestle KitKat® | 8 | 14 | 17 | 370 | 8.6 | 50.5 | 22 |
| Whittaker’s® Creamy Milk | 6 | 10 | 15 | 352.5 | 6.7 | 44.7 | 33 |
| Snickers | 5 | 9 | 18 | 370 | 9.3 | 50.6 | 25 |
| Whittaker’s® Dark Peppermint | 5 | 9 | 15 | 342 | 7.8 | 52.1 | 50 |
| Cadbury Crunchie | 3 | 5 | 15 | 292 | 10.3 | 68.7 | 26 |
| Cadbury Moro Gold | 3 | 5 | 17.5 | 327 | 7.3 | 48.6 | 26 |
| Cadbury Picnic | 3 | 5 | 15 | 327 | 6.8 | 45.6 | 27 |
| Cadbury Twirl | 3 | 5 | 14 | 316 | 7.7 | 55.2 | 26 |
| Cadbury Flake | 2 | 3 | 14 | 313 | 7.9 | 56.5 | 26 |
| Twix® | 2 | 3 | 14.5 | 308 | 7.0 | 48.0 | 25 |
| Whittaker’s® Peanut Slab | 2 | 3 | 15 | 333 | 7.2 | 48.0 | 33 |
| Mars® | 1 | 2 | 18 | 350 | 10.5 | 57.1 | 25 |
| Food Group | Intervention (DFE) | Control (DFE) | ||||
|---|---|---|---|---|---|---|
| Day 0 | Day 15 | Day 44 | Day 0 | Day 15 | Day 44 | |
| Fruit | 0.59 [0.36, 1.29] # | 1.28 [0.68, 2.42] # | 1.49 [0.74, 2.35] # | 0.46 [0.17, 1.05] # | 1.170 [0.50, 2.26] # | 1.04 [0.54, 2.25] # |
| Vegetable | 0.30 [0.16, 0.66] | 0.27 [0.14, 0.62] | 0.27 [0.17, 0.66] | 0.27 [0.14, 0.44] | 0.28 [0.19, 0.78] | 0.32 [0.17, 0.74] |
| Dairy | 0.53 [0.08, 1.53] | 0.38 [0.11, 1.03] | 0.46 [0.14, 1.42] | 0.50 [0.08, 1.14] | 0.42 [0.08, 0.85] | 0.28 [0.06, 0.85] |
| Cereal | 0.16 [0.03, 0.59] | 0.15 [0.03, 0.56] | 0.16 [0.03, 0.45] | 0.16 [0.03, 0.42] | 0.14 [0.03, 0.66] | 0.14 [0.03, 0.25] |
| Spreads | 0.23 [0.08, 1.20] | 0.17 [0.03, 0.80] | 0.16 [0.03, 0.46] | 0.34 [0.22, 0.70] | 0.33 [0.12, 0.56] | 0.22 [0.06, 0.78] |
| Cakes | 1.31 [0.75, 2.03] # | 0.70 [0.42, 1.52] # | 1.31 [0.75, 1.03] | 1.00 [0.62, 1.59] # | 0.92 [0.35, 1.25] # | 0.95 [0.41, 1.43] |
| Desserts | 0.14 [0.08, 0.33] | 0.12 [0.06, 0.22] | 0.16 [0.06, 0.25] | 0.16 [0.09, 0.30] | 0.16 [0.08, 0.42] | 0.14 [0.08, 0.44] |
| Drinks | 0.71 [0.32, 1.15] | 0.50 [0.17, 1.09] | 0.47 [0.23, 1.49] | 0.61 [0.33, 1.55] | 0.78 [0.25, 1.91] | 0.71 [0.36, 1.69] |
| Occasional foods $ | 4.04 [2.22, 6.05] # | 2.45 [1.44, 3.87] *# | 3.28 [2.01, 5.14] | 3.45 [2.77, 4.76] | 3.71 [2.37, 4.80] | 3.41 [1.80, 4.76] |
| Everyday foods @ | 1.79 [1.23, 3.79] | 1.61 [0.84, 3.30] | 1.90 [1.31, 3.58] | 1.33 [0.81, 3.30] | 1.83 [0.99, 2.86] | 1.63 [1.06, 2.37] |
Publisher’s Note: MDPI stays neutral with regard to jurisdictional claims in published maps and institutional affiliations. |
© 2022 by the authors. Licensee MDPI, Basel, Switzerland. This article is an open access article distributed under the terms and conditions of the Creative Commons Attribution (CC BY) license (https://creativecommons.org/licenses/by/4.0/).
Share and Cite
Turner, S.; Diako, C.; Kruger, R.; Wong, M.; Wood, W.; Rutherfurd-Markwick, K.; Stice, E.; Ali, A. The Effect of a 14-Day gymnema sylvestre Intervention to Reduce Sugar Cravings in Adults. Nutrients 2022, 14, 5287. https://doi.org/10.3390/nu14245287
Turner S, Diako C, Kruger R, Wong M, Wood W, Rutherfurd-Markwick K, Stice E, Ali A. The Effect of a 14-Day gymnema sylvestre Intervention to Reduce Sugar Cravings in Adults. Nutrients. 2022; 14(24):5287. https://doi.org/10.3390/nu14245287
Chicago/Turabian StyleTurner, Sophie, Charles Diako, Rozanne Kruger, Marie Wong, Warrick Wood, Kay Rutherfurd-Markwick, Eric Stice, and Ajmol Ali. 2022. "The Effect of a 14-Day gymnema sylvestre Intervention to Reduce Sugar Cravings in Adults" Nutrients 14, no. 24: 5287. https://doi.org/10.3390/nu14245287