
Multi-Perspective Observation on the Prevalence of Food Allergy in the General Chinese Population: A Meta-Analysis
 , and
, and
Abstract
:
1. Introduction
2. Methods
2.1. Search Strategy
2.2. Inclusion and Exclusion Criteria
2.3. Data Extraction
2.4. Quality Assessment
2.5. Data Analysis
3. Results
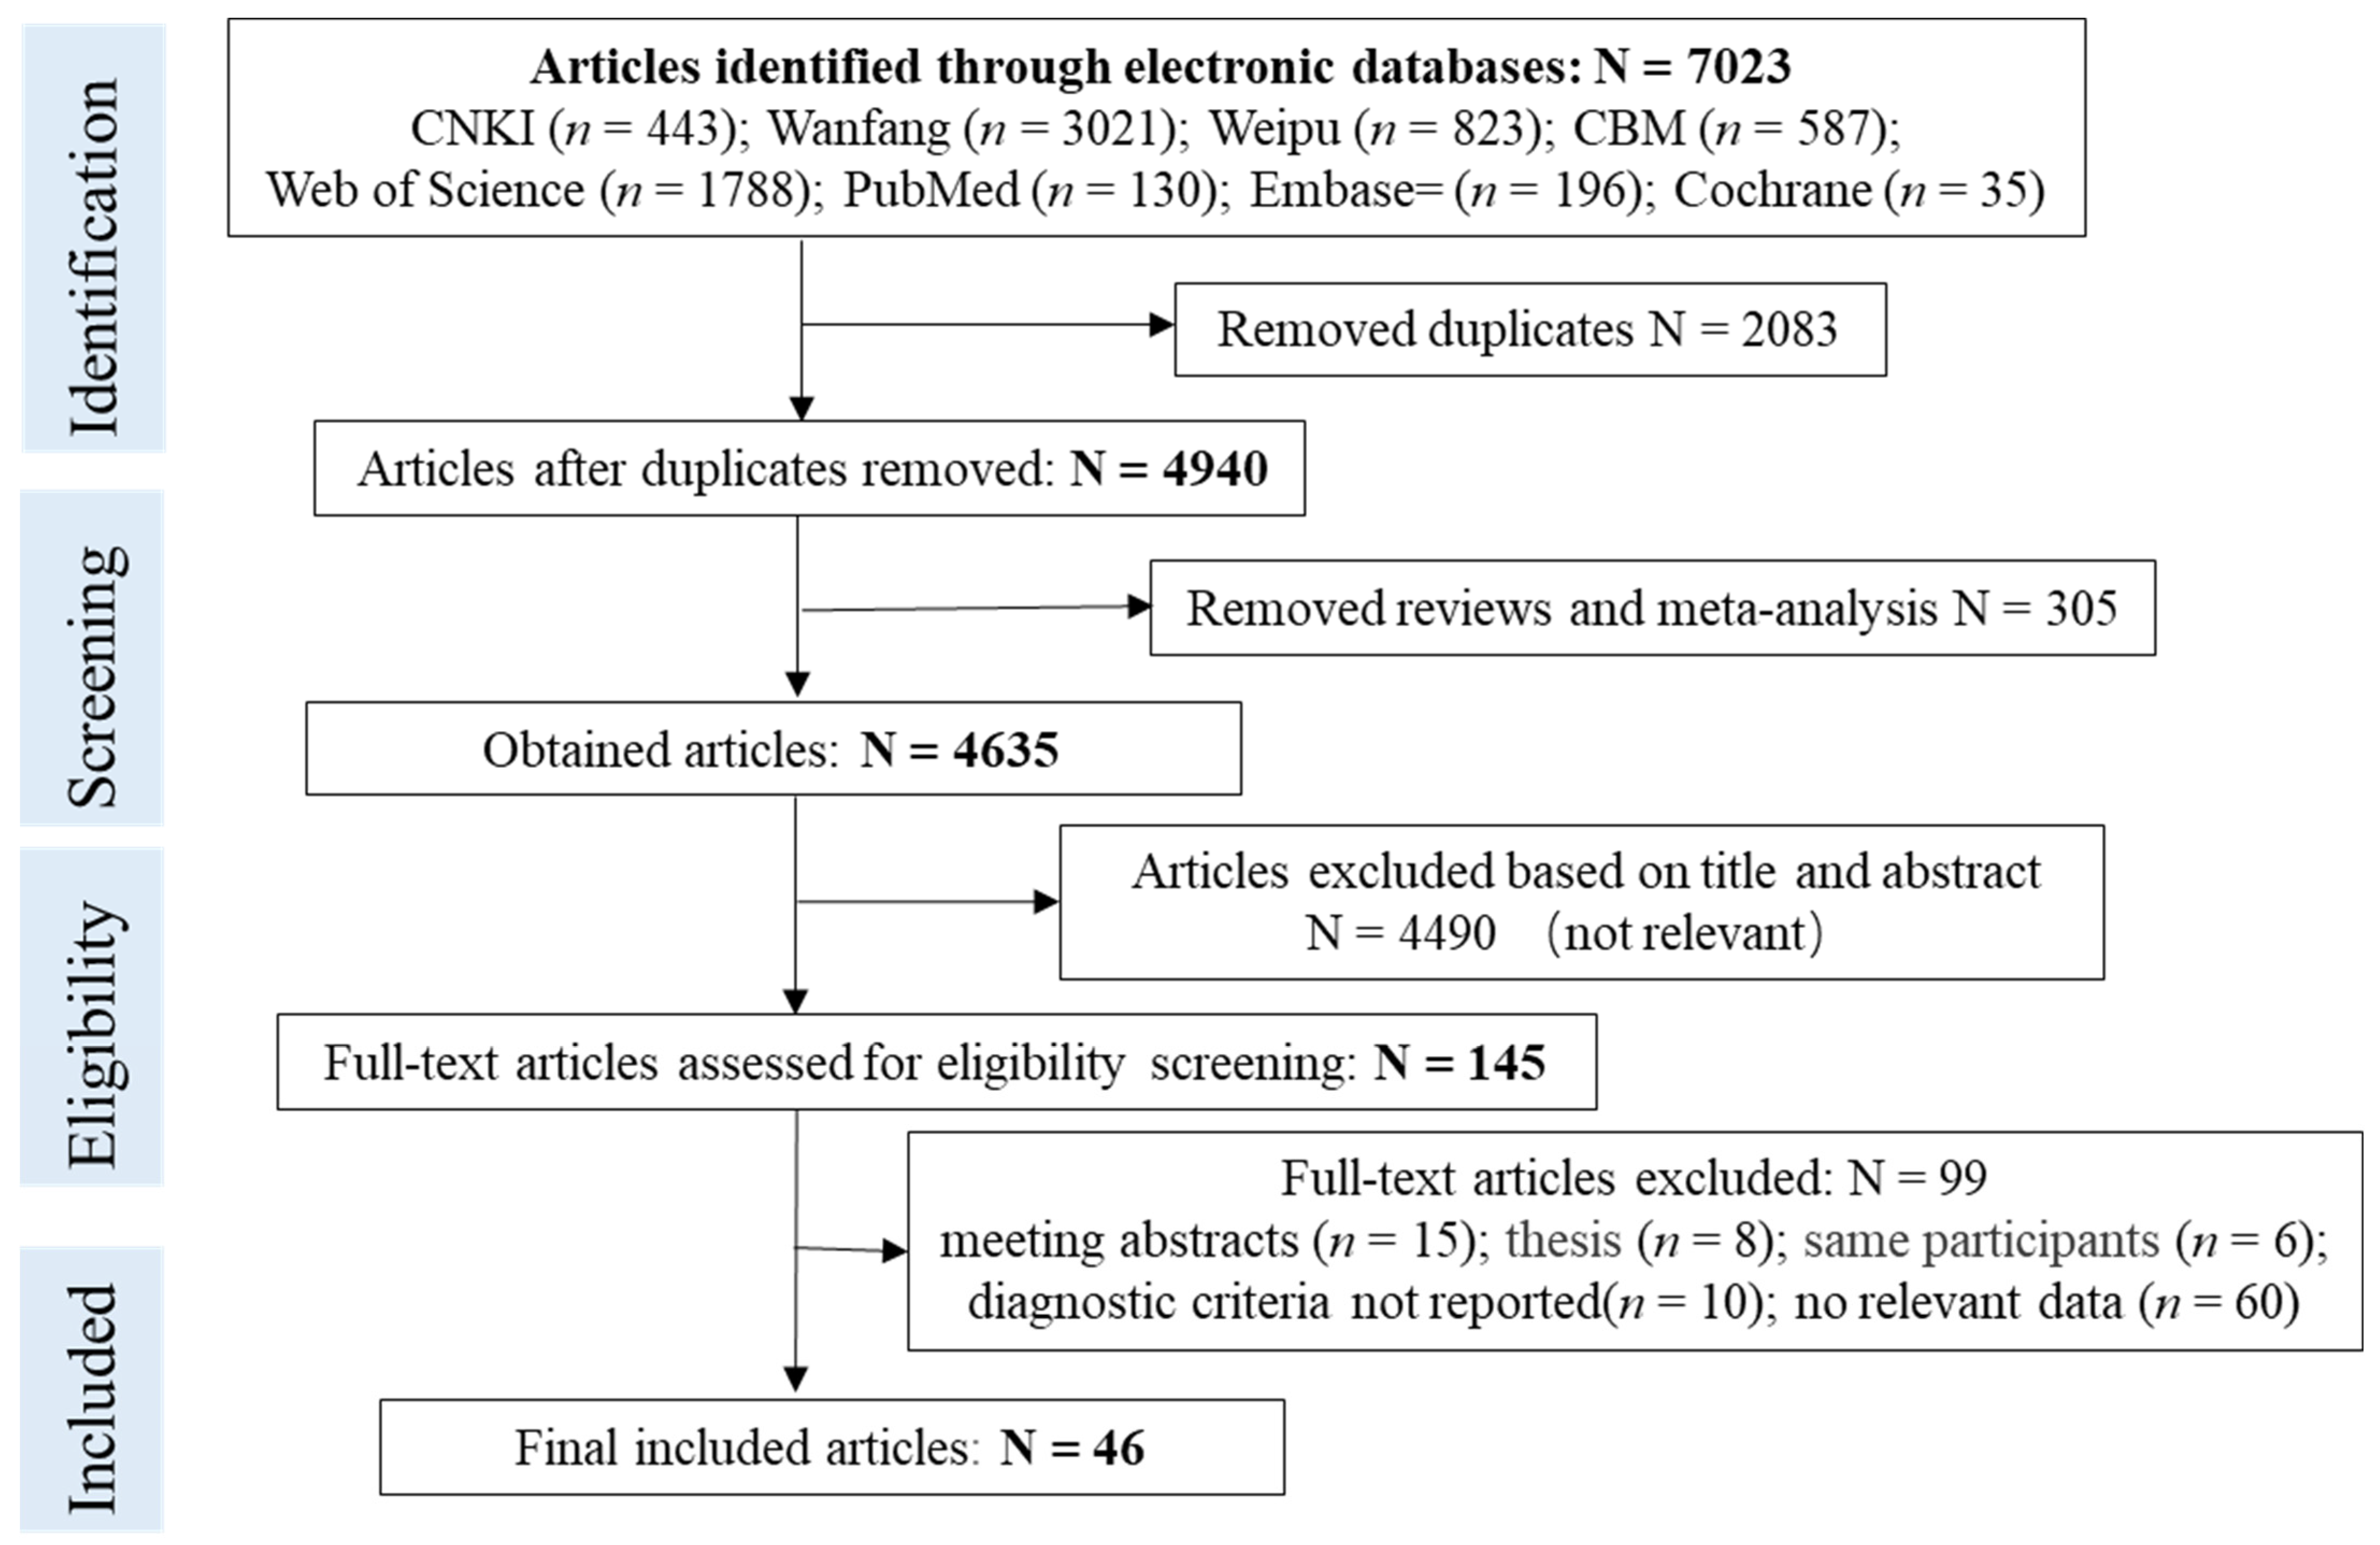
3.1. Inclusion of Studies and Characteristics
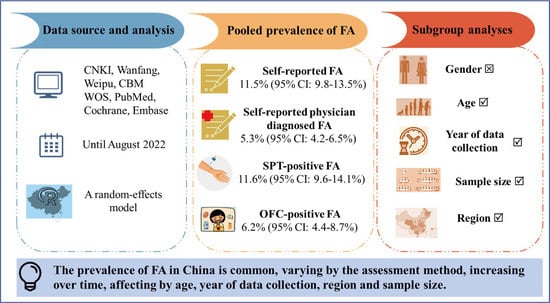
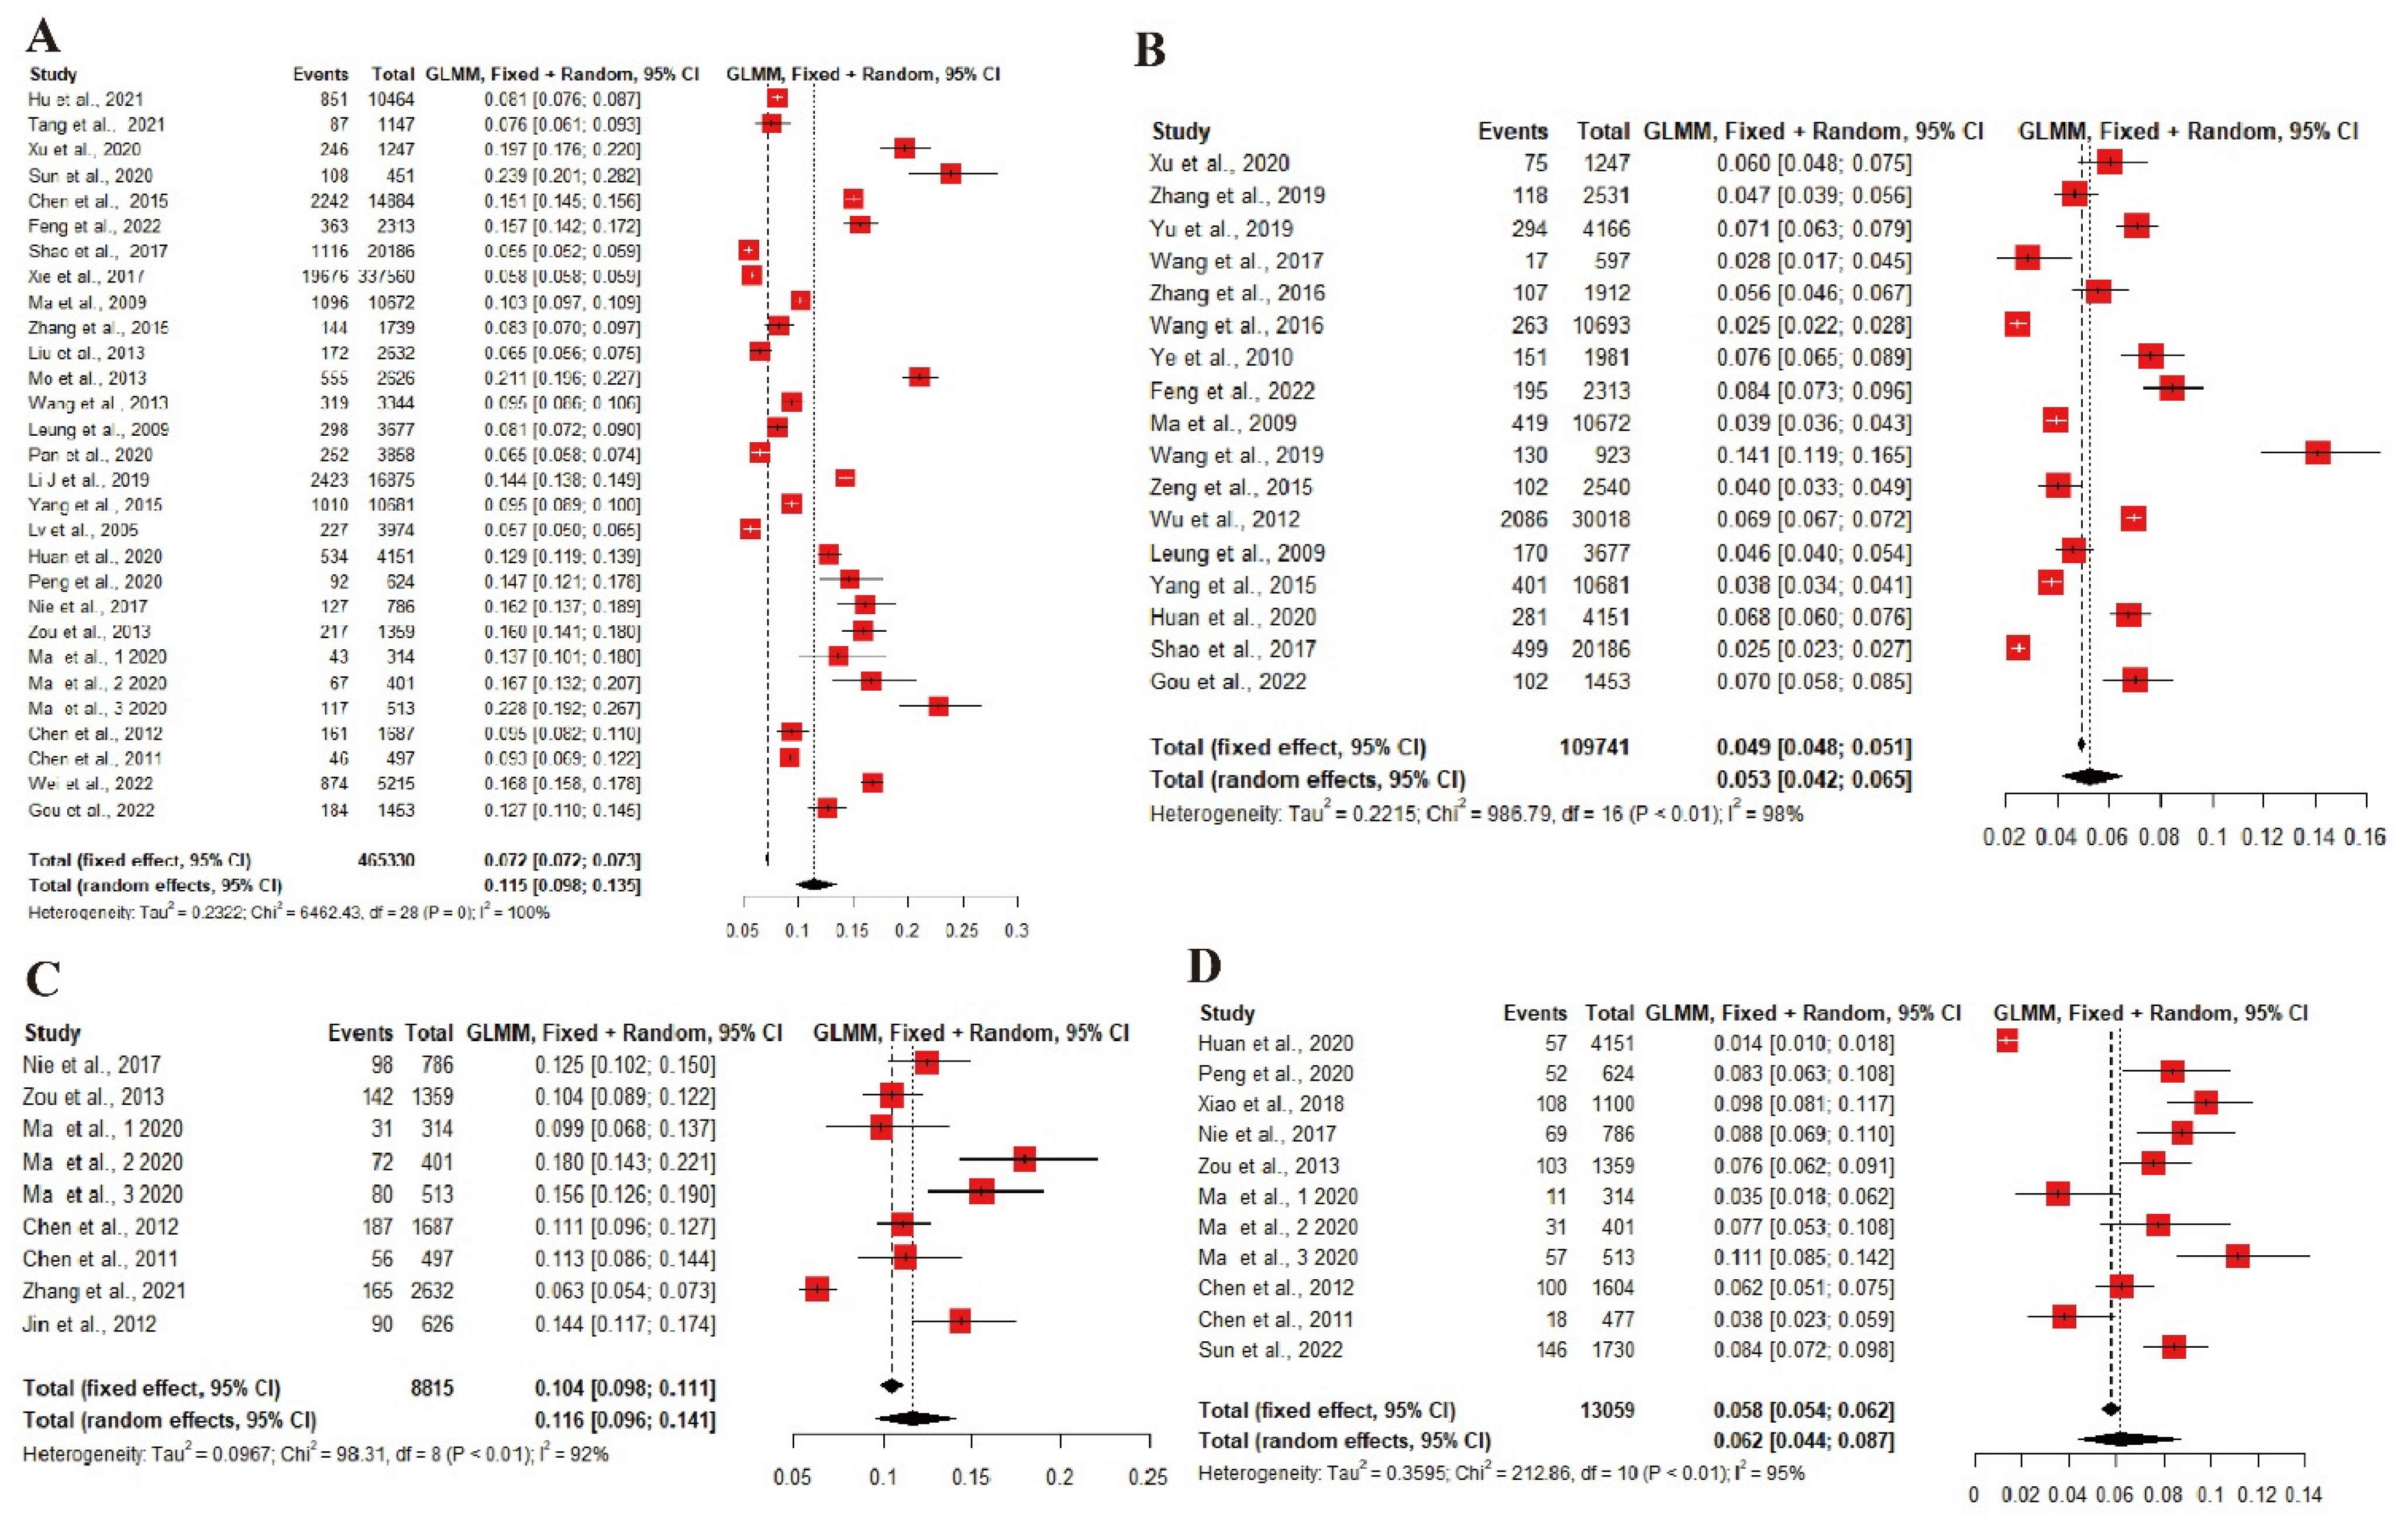
3.2. Pooled Prevalence of FA
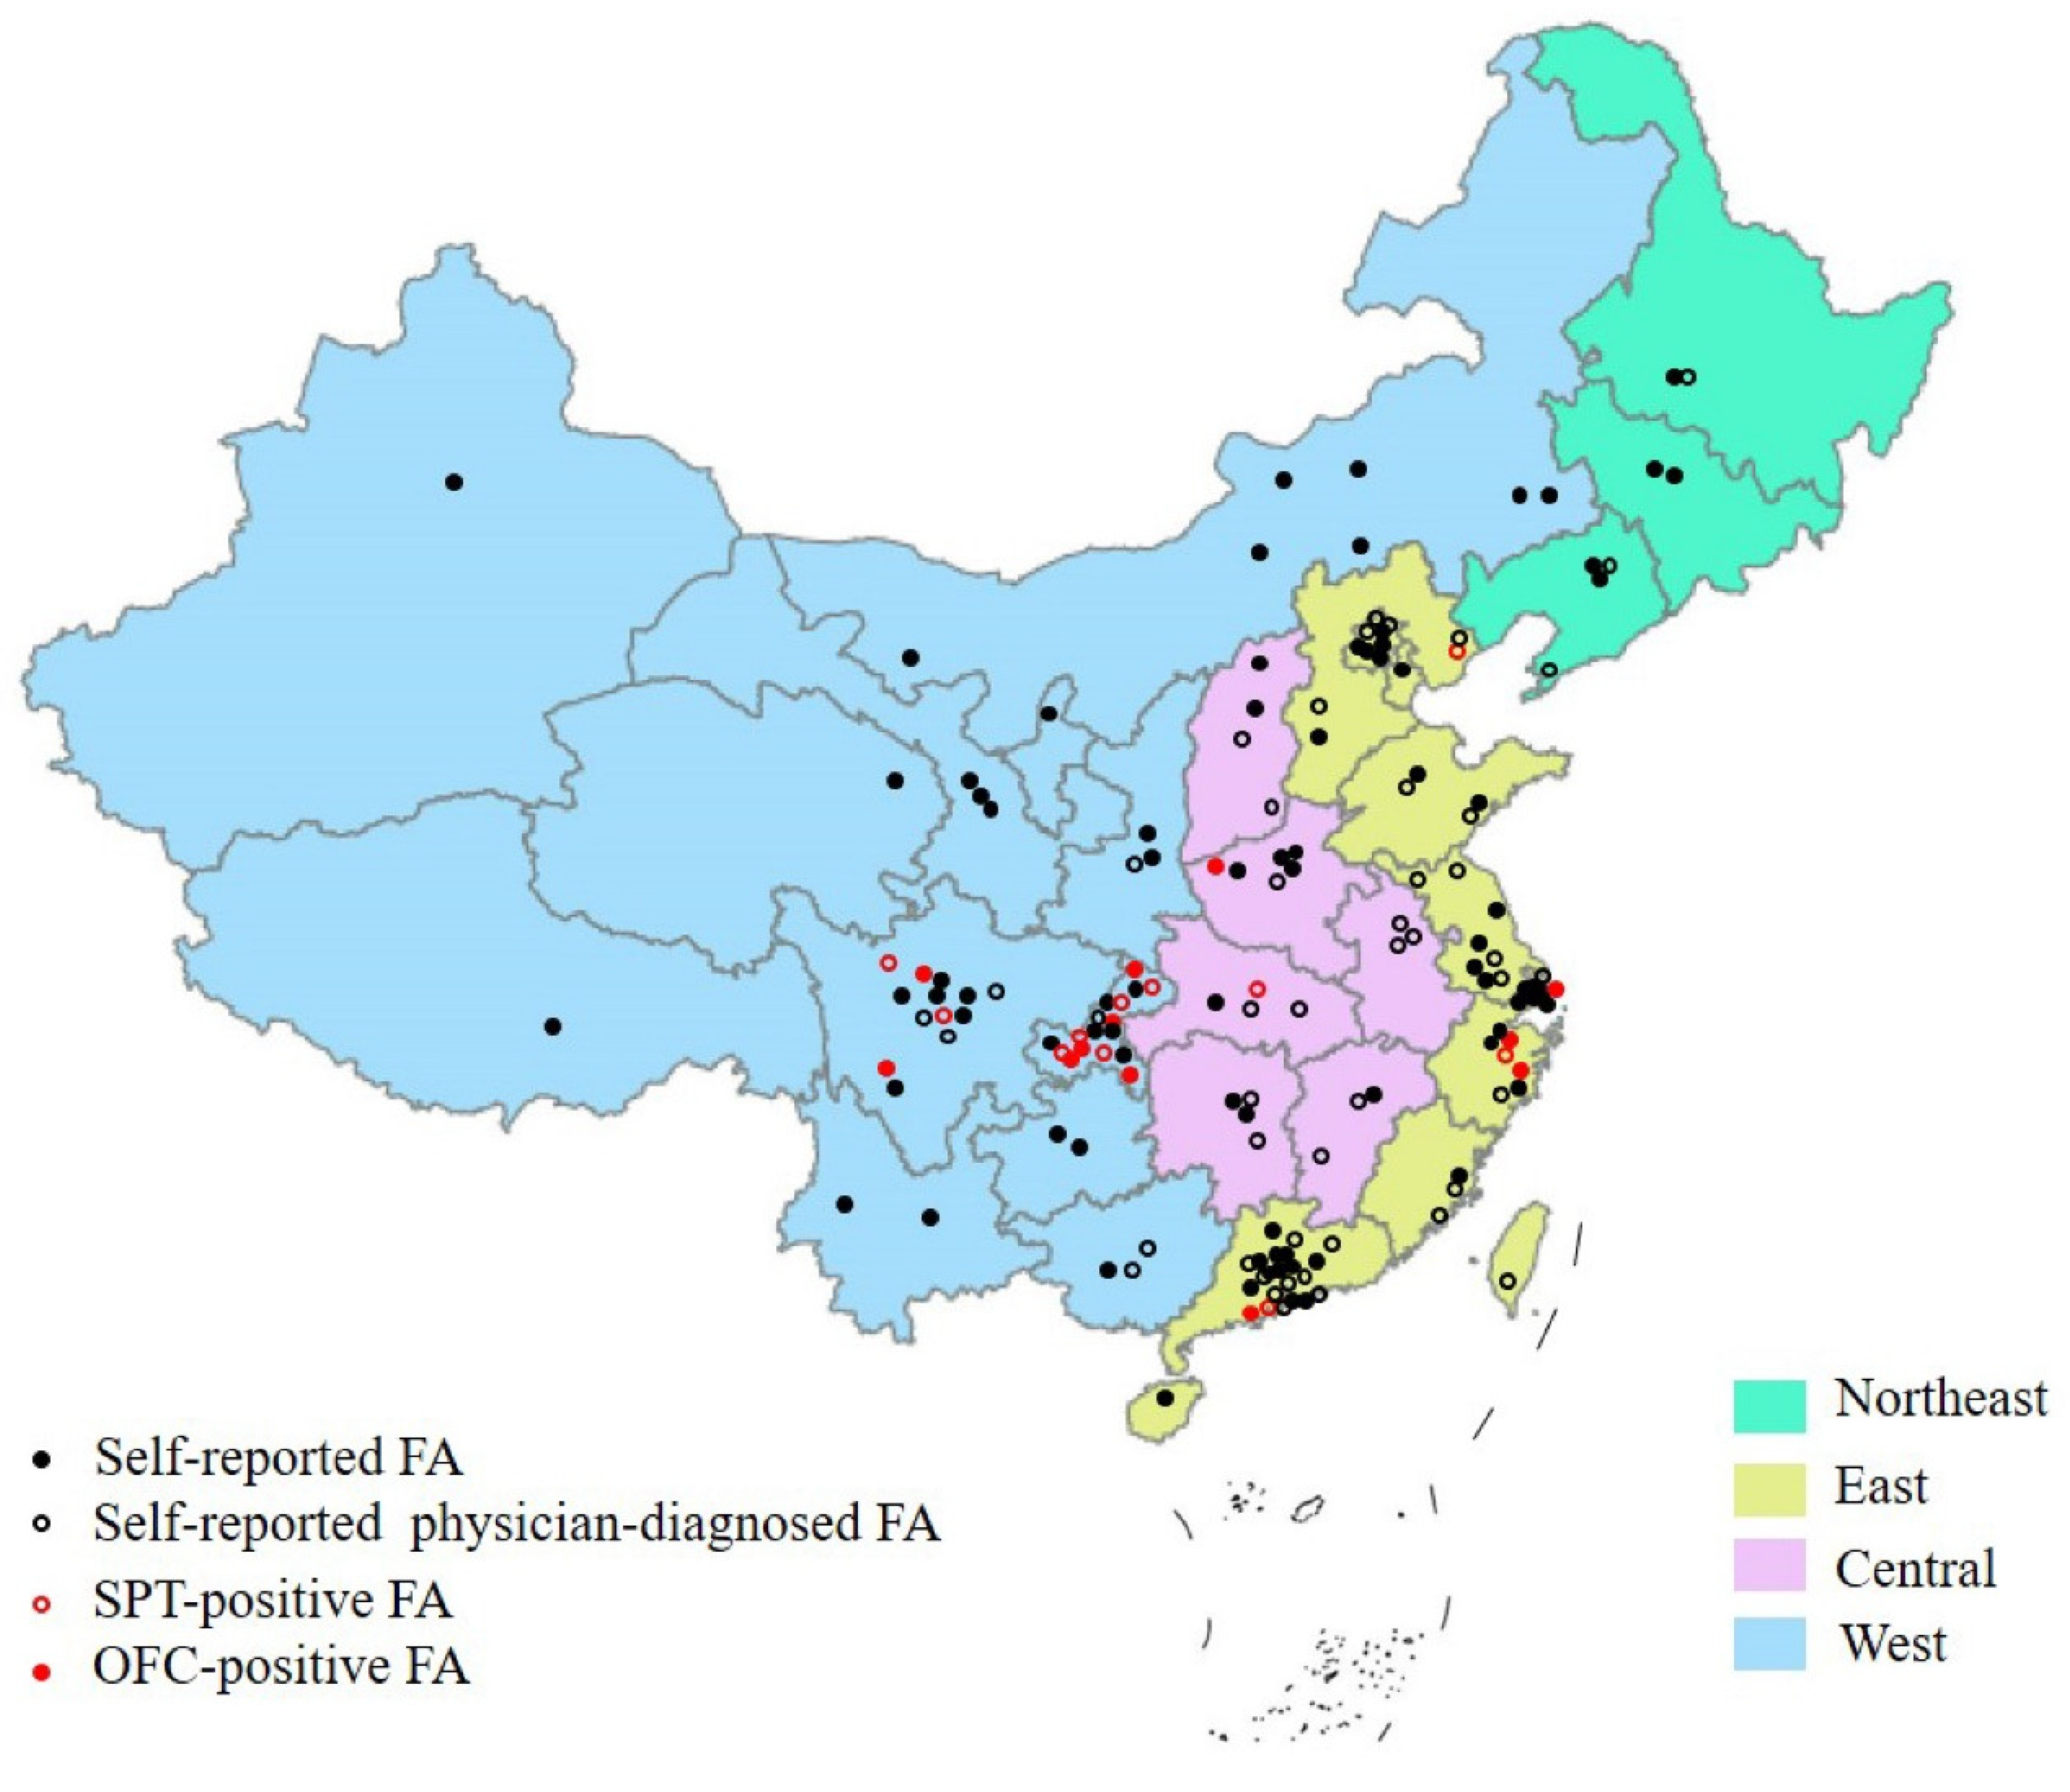
3.3. Subgroup Analyses
3.4. Meta-Regression Analyses
3.5. Sensitivity Analysis and Publication Bias
4. Discussion
5. Conclusions
Supplementary Materials
Author Contributions
Funding
Institutional Review Board Statement
Informed Consent Statement
Data Availability Statement
Acknowledgments
Conflicts of Interest
References
- De Martinis, M.; Sirufo, M.M.; Suppa, M.; Ginaldi, L. New Perspectives in Food Allergy. Int. J. Mol. Sci. 2020, 21, 1474. [Google Scholar] [CrossRef] [PubMed] [Green Version]
- Prescott, S.; Allen, K.J. Food allergy: Riding the second wave of the allergy epidemic. Pediatr. Allergy Immunol. 2011, 22, 155–160. [Google Scholar] [CrossRef] [PubMed]
- Warren, C.M.; Jiang, J.; Gupta, R.S. Epidemiology and Burden of Food Allergy. Curr. Allergy Asthma Rep. 2020, 20, 6. [Google Scholar] [CrossRef]
- Tang, R.; Wang, Z.X.; Ji, C.M.; Leung, P.S.C.; Woo, E.; Chang, C.; Wang, M.; Liu, B.; Wei, J.F.; Sun, J.L. Regional Differences in Food Allergies. Clin. Rev. Allergy Immunol. 2019, 57, 98–110. [Google Scholar] [CrossRef]
- National Academies of Sciences, Engineering and Medicine. Finding a Path to Safety in Food Allergy: Assessment of Global Burden, Causes, Prevention, Management, and Public Policy; National Academies of Sciences, Engineering and Medicine: Washington, DC, USA, 2016. [Google Scholar]
- Nwaru, B.I.; Panesar, S.S.; Hickstein, L.; Rader, T.; Werfel, T.; Muraro, A.; Hoffmann-Sommergruber, K.; Roberts, G.; Sheikh, A. The epidemiology of food allergy in Europe: Protocol for a systematic review. Clin. Transl. Allergy 2013, 3, 13. [Google Scholar] [CrossRef] [PubMed] [Green Version]
- Page, M.J.; Mckenzie, J.E.; Bossuyt, P.M.; Boutron, I.; Moher, D.J.S.R. The PRISMA 2020 statement: An updated guideline for reporting systematic reviews. BMJ 2021, 10, 372. [Google Scholar]
- Feng, R.Y.; Ma, H.M. Retrospective analysis of serum IgE levels in 708 physical examinations. J. Med. Forum 2017, 38, 72–74. [Google Scholar]
- Hu, Y.; Wang, R.; Piao, J.; Tian, Y.; Yang, X. Study on IgE mediated food allergy of 3-12 years urban children in China. J. Hyg. Res. 2015, 44, 60–63. [Google Scholar]
- Hua, W.; Li, F.; Mi, X.L.; Cai, H.; Zhu, X.Y.; Xu, P.; Ru, E. Detection and analysis of serum allergen-specific IgE in general population. China Med. 2008, 3, 682–683. [Google Scholar] [CrossRef]
- Wang, X.Y.; Zhuang, Y.; Ma, T.T.; Zhang, B.; Wang, X.Y. Prevalence of Self-Reported Food Allergy in Six Regions of Inner Mongolia, Northern China: A Population-Based Survey. Med. Sci. Monit. 2018, 24, 1902–1911. [Google Scholar] [CrossRef]
- Ho, M.H.; Lee, S.L.; Wong, W.H.; Ip, P.; Lau, Y.L. Prevalence of self-reported food allergy in Hong Kong children and teens-a population survey. Asian Pac. J. Allergy Immunol. 2012, 30, 275–284. [Google Scholar] [PubMed]
- Hu, Y.; Chen, Y.; Liu, S.; Jiang, F.; Tong, S. Breastfeeding duration modified the effects of neonatal and familial risk factors on childhood asthma and allergy: A population-based study. Respir. Res. 2021, 22, 11. [Google Scholar] [CrossRef] [PubMed]
- Tang, W.B.; Luo, W.T.; Wu, Z.H.; Hu, H.S.; Chen, H.X.; Sun, B.Q. Prevalence and influencing factors of allergic diseases among middle school students in Eastern Shenzhen. Guangxi Med. J. 2021, 43, 829–833. [Google Scholar] [CrossRef]
- Xu, J.; Wang, X.Q.; Li, W.X.; Zhang, P.B.; Cai, Y.; Zhang, S.M.; Zhang, H.; Bao, Y.X. A cross-sectional survey and analysis of childhood allergic diseases in two communities of Yangpu District, Shanghai. Chin. J. Pract. Pediatr. 2020, 722–726. [Google Scholar] [CrossRef]
- Sun, Z.Q.; Guo, G.S.; Sun, C.M.; Li, J.; Fan, Y. Investigation on prevalence of allergic diseases and knowledge of allergicdiseases among middle school students in Datong City. Chin. J. Sch. Dr. 2020, 34, 721–723. [Google Scholar]
- Zhang, J.L.; Yu, W.P.; Chen, Q.; Zuo, X.Y.; Tao, F.B.; Su, T.J. Effects of allergic diseases on sleep status of preschool children in Yangzhou. Matern. Child Health Care China 2019, 34. [Google Scholar] [CrossRef]
- Yu, Q.Q.; Tang, J.; Wang, Y.; Xu, Y.X.; Liu, M.H. Epidemiological analysis of allergic diseases in primary and middle school students of Foshan. J. Clin. Otorhinolaryngol. Head Neck 2019, 33, 970–974. [Google Scholar]
- Wang, S.G.; Zhang, X.S.; Zhao, Y.F.; Sun, L.; Pan, X.T.; Wang, N. Risk factors for allergic diseases in children aged 0-24 months in the Wuhu urban area, Anhui Province, China. Chin. J. Contemp. Pediatr. 2017, 19, 303–307. [Google Scholar] [CrossRef]
- Zhang, A.H.; Wang, Y.L.; Zhao, Y.; Niu, Q.J.; Xu, M.J.; Fang, Q. Current status of anaphylactic diseases among preschool children in urban area, Wuhu. Mod. Prev. Med. 2016, 43, 3896–3898. [Google Scholar]
- Wang, S.; Jiang, J.X.; Wang, Y.; Wang, Z.H.; Wang, T.; Wang, H.S. Survey on prevalence of allergic symptoms among 0 to 24 months old children in Chinese cities. Chin. J. Child Health Care 2016, 24, 119–122. [Google Scholar] [CrossRef]
- Huang, C.; Liu, W.; Hu, Y.; Zou, Z.J.; Zhao, Z.H.; Shen, L.; Weschler, L.B.; Sundell, J. Updated Prevalences of Asthma, Allergy, and Airway Symptoms, and a Systematic Review of Trends over Time for Childhood Asthma in Shanghai, China. PLoS ONE 2015, 10, e0121577. [Google Scholar] [CrossRef]
- Zhao, Y.E.; Qian, Y.; Jiang, S.Z.; Mao, X.Y.; Xie, S.M. Epidemiology of allergic diseases among students at Wenzhou Medical College. Dis. Surveill. 2010, 25, 904–911. [Google Scholar] [CrossRef]
- Feng, H.; Liu, Y.; Xiong, X.; Xu, Q.; Zhang, Z.; Wu, Y.; Lu, Y. Epidemiological survey of self-reported food allergy among university students in China. Medicine 2022, 101, e29606. [Google Scholar] [CrossRef] [PubMed]
- Sha, L.; Shao, M.; Liu, C.; Wu, Y.; Chen, Y. A cross-sectional study of the prevalence of food allergies among children younger than ages 14 years in a Beijing urban region. Allergy Asthma Proc. 2019, 40, e1–e7. [Google Scholar] [CrossRef] [PubMed]
- Shao, M.J.; Sha, L.; Liu, C.H.; Zhu, W.J.; Shuo, L.I.; Luo, Y.Q. Comparison of Prevalence of Childhood Food Allergy between Urban and Rural Area in Beijing. Chin. J. Allergy Clin. Immunol. 2017, 11, 358–364. [Google Scholar]
- Xie, H.L.; Shao, M.J.; Liu, C.H.; Sun, Z.H.; Sha, L.; Chen, Y.Z. Epidemiology of food allergy in children from 31 cities in China. Int. J. Pediatr. 2017, 044, 637–641. [Google Scholar] [CrossRef]
- Ma, Y.; Fang, J.L.; Luo, Y.Q.; Li, Y.D.; Li, Y.T.; Zhao, R.L.; Cao, L.; Chen, Y.Z. Analysis of the prevalence of food allergy in children. Chin. J. Med. 2009, 44, 60–62. [Google Scholar] [CrossRef]
- Wang, M.; He, M.; Shen, X.; Wu, X.; Yu, X.; He, F.; Ming, L. Prevalence and influencing factors of food hypersensitivity in infants reported by parents in Chengdu City. J. Hyg. Res. 2019, 48, 594–600. [Google Scholar]
- Zeng, G.Q.; Luo, J.Y.; Huang, H.M.; Zheng, P.Y.; Luo, W.T.; Wei, N.L.; Sun, B.Q. Food allergy and related risk factors in 2540 preschool children: An epidemiological survey in Guangdong Province, southern China. World J. Pediatr. 2015, 11, 219–225. [Google Scholar] [CrossRef]
- Zhang, Y.; Yun, C.; Zhao, A.; Li, H.; Mu, Z.; Zhang, Y.; Wang, P. Prevalence of self-reported food allergy and food intolerance and their associated factors in 3–12 year-old children in 9 areas in China. J. Hyg. Res. 2015, 44, 226–231. [Google Scholar]
- Liu, F.L.; Ning, Y.B.; Ma, D.F.; Zheng, Y.D.; Yang, X.G.; Li, W.J.; Zhang, Y.M.; Wang, P.Y. Prevalence of self-reported allergy, food hypersensitivity and food intolerance and their influencing factors in 0-36 months old infants in 8 cities in China. Chin. J. Pediatr. 2013, 51, 801–806. [Google Scholar] [CrossRef]
- Mo, F.; Tan, Y.T.; Wang, G.F.; Nie, Z.Y.; Zhou, H.; Hu, S.R.; Shao, J. Status of food allergy among high school students in Shanghai. Chin. J. Sch. Health 2013, 34, 1328–1332. [Google Scholar]
- Wang, Y.; Li, R.; Sun, X.H.; Huang, L.J.; Pang, X.H.; Guo, Z. Prevalence of self-reported food allergy and related factors for infants and young children in southwest of China. Chin. J. Child Health Care 2013, 21, 853–856. [Google Scholar]
- Wu, T.C.; Tsai, T.C.; Huang, C.F.; Chang, F.Y.; Lin, C.C.; Huang, I.F.; Chu, C.-H.; Lau, B.-H.; Wu, L.; Peng, H.-J.; et al. Prevalence of food allergy in Taiwan: A questionnaire-based survey. Intern. Med. J. 2012, 42, 1310–1315. [Google Scholar] [CrossRef] [PubMed]
- Leung, T.F.; Yung, E.; Yun, S.W.; Lam, C.; Wong, G. Parent-reported adverse food reactions in Hong Kong Chinese pre-schoolers: Epidemiology, clinical spectrum and risk factors. Pediatr. Allergy Immunol. 2010, 20, 339–346. [Google Scholar] [CrossRef] [PubMed]
- Zhang, Q. Investigation of food allergy in infants and its influencing factors. J. North Sichuan Med. Coll. 2021, 36, 480–483. [Google Scholar] [CrossRef]
- Pan, J.R.; Li, L. Analysis of children food allergy, Wuxi. Mod. Prev. Med. 2020, 47, 3121–3124. [Google Scholar]
- Li, J.; Ogorodova, L.M.; Mahesh, P.A.; Wang, M.H.; Fedorova, O.S.; Leung, T.F.; Fernandez-Rivas, M.; Mills, E.N.C.; Potts, J.; Kummeling, I.; et al. Comparative Study of Food Allergies in Children from China, India, and Russia: The EuroPrevall-INCO Surveys. J. Allergy Clin. Immunol. Pract. 2020, 8, 1349–1358. [Google Scholar] [CrossRef]
- Yang, Z.; Zheng, W.; Yung, E.; Zhong, N.; Wong, G.W.; Li, J. Frequency of food group consumption and risk of allergic disease and sensitization in schoolchildren in urban and rural China. Clin. Exp. Allergy 2015, 45, 1823–1832. [Google Scholar] [CrossRef]
- Jin, Y.; Xion, Z.G. Investigation and Analysis of Food Allergy in Infants. J. Public Health Prev. 2012, 23, 120–121. [Google Scholar]
- Lv, X.Z.; Liu, X.M.; Yang, X.G. Preliminary survey on status of food allergy in young Chinese students. Chin. J. Food Hyg. 2005, 17, 119–120. [Google Scholar] [CrossRef]
- Dai, H.; Wang, F.M.; Wang, L.K.; Wan, J.Y.; Xiang, Q.W.; Zhang, H.; Zhao, W.; Zhang, W.X. An epidemiological investigation of food allergy among children aged 3 to 6 in an urban area of Wenzhou, China. BMC Pediatr. 2020, 20, 1–8. [Google Scholar] [CrossRef]
- Peng, W.J.; Liu, J.T.; Li, X.L.; Tan, Z.Z.; Chen, Y. Prevalence and Clinical Characteristics of Food Allergy in Children Under 1 Year Old. Henan Med. Res. 2020, 29, 4433–4435. [Google Scholar]
- Xiao, Y.; Pan, J.; Wang, L.; Duan, Y. Food allergy status of infants and young children in community in Shanghai and influencing factors. J. Clin. Med. Pract. 2018, 22, 72–78. [Google Scholar] [CrossRef]
- Nie, J.; Ran, Y.C.; Zhang, Y.G.; Chen, J. Epidemiological survey on food allergy among children aged 0-24 months in Chengdu. Chin. J. Woman Child Health Res. 2017, 28, 364–365. [Google Scholar]
- Zou, Y.; Xu, Y.L.; Shen, X.M.; Cheng, Y.; Huang, A.Y.; Yu, J.; Liao, C.Y. Prevalence of food allergy in children under 3 years of age in Panzhihua city. Chin. J. Public Health 2013, 29, 1813–1815. [Google Scholar] [CrossRef]
- Ma, Z.Y.; Chen, L.; Xian, R.L.; Fang, H.P.; Wang, J.; Hu, Y. Time trends of childhood food allergy in China: Three cross-sectional surveys in 1999, 2009, and 2019. Pediatr. Allergy Immunol. 2021, 32, 1073–1079. [Google Scholar] [CrossRef]
- Chen, J.; Yan, L.; Zhang, H.Z.; Zhao, H.; Li, H.Q. Prevalence of food allergy in children under 2 years of age in three cities in China. Chin. J. Pediatr. 2012, 50, S173–S174. [Google Scholar] [CrossRef]
- Chen, J.; Hu, Y.; Allen, K.J.; Ho, M.H.; Li, H. The prevalence of food allergy in infants in Chongqing, China. Pediatr. Allergy Immunol. 2011, 22, 356–360. [Google Scholar] [CrossRef]
- Wei, L.; Chen, T.; Chen, Z.; Tang, H.; Zhao, Z. Analysis of dietary characteristics and food allergy of preschool children in Shanghai. Chin. J. Food Hyg. 2022. Available online: http://kns.cnki.net/kcms/dtail/11.3156.r.20220831.1158.002.html (accessed on 6 October 2022).
- Gou, J.; Yang, Y.; Xing, Q.; Li, Y.; Hu, B.; Ma, X. Investigation on probable food allergy in undergraduates of an university in Guizhou Province. J. Zunyi Med. Univ. 2021, 044, 787–792. [Google Scholar]
- Sun, J.; Guo, R.; Xia, J. Analysis on Influencing Factors of Food Allergy Among Infant and Children with Different Genetic Backgrounds in Yiyang City. Chin. Community Dr. 2022, 38, 3. [Google Scholar] [CrossRef]
- Rona, R.J.; Keil, T.; Summers, C.; Gislason, D.; Zuidmeer, L.; Sodergren, E.; Sigurdardottir, S.T.; Lindner, T.; Goldhahn, K.; Dahlstrom, J.; et al. The prevalence of food allergy: A meta-analysis. J. Allergy Clin. Immunol. 2007, 120, 638–646. [Google Scholar] [CrossRef]
- Hilvo, M. Maternal Elimination Diet and Symptoms of Cow's Milk Allergy in Breastfed Infants. JAMA Pediatr. 2021, 175, 425–426. [Google Scholar] [CrossRef]
- Obeng, B.B.; Amoah, A.S.; Larbi, I.A.; Yazdanbakhsh, M.; van Ree, R.; Boakye, D.A.; Hartgers, F.C. Food allergy in Ghanaian schoolchildren: Data on sensitization and reported food allergy. Int. Arch. Allergy Immunol. 2011, 155, 63–73. [Google Scholar] [CrossRef]
- Nwaru, B.I.; Hickstein, L.; Panesar, S.S.; Muraro, A.; Werfel, T.; Cardona, V.; Dubois, A.E.J.; Halken, S.; Hoffmann-Sommergruber, K.; Poulsen, L.K.; et al. The epidemiology of food allergy in Europe: A systematic review and meta-analysis. Allergy 2014, 69, 62–75. [Google Scholar] [CrossRef] [Green Version]
- Verrill, L.; Bruns, R.; Luccioli, S. Prevalence of self-reported food allergy in U.S. adults: 2001, 2006, and 2010. Allergy Asthma Proc. 2015, 36, 458–467. [Google Scholar] [CrossRef]
- Venter, C.; Pereira, B.; Grundy, J.; Clayton, C.B.; Roberts, G.; Higgins, B.; Dean, T. Incidence of parentally reported and clinically diagnosed food hypersensitivity in the first year of life. J. Allergy Clin. Immunol. 2006, 117, 1118–1124. [Google Scholar] [CrossRef]
- Eller, E.; Kjaer, H.F.; Host, A.; Andersen, K.E.; Bindslev-Jensen, C. Food allergy and food sensitization in early childhood: Results from the DARC cohort. Allergy 2009, 64, 1023–1029. [Google Scholar] [CrossRef]
- Kvenshagen, B.; Halvorsen, R.; Jacobsen, M. Is there an increased frequency of food allergy in children delivered by caesarean section compared to those delivered vaginally? Acta Paediatr. 2009, 98, 324–327. [Google Scholar] [CrossRef]
- Peters, R.L.; Koplin, J.J.; Gurrin, L.C.; Dharmage, S.C.; Wake, M.; Ponsonby, A.L.; Tang, M.L.K.; Lowe, A.J.; Matheson, M.; Dwyer, T.; et al. The prevalence of food allergy and other allergic diseases in early childhood in a population-based study: HealthNuts age 4-year follow-up. J. Allergy Clin. Immunol. 2017, 140, 145–153. [Google Scholar] [CrossRef] [PubMed] [Green Version]
- De, M.M.; Sirufo, M.M.; Suppa, M.; Di, S.D.; Ginaldi, L. Sex and Gender Aspects for Patient Stratification in Allergy Prevention and Treatment. Int. J. Mol. Sci. 2020, 21, 1535. [Google Scholar] [CrossRef] [Green Version]
- Just, J.; Elegbede, C.F.; Deschildre, A.; Bousquet, J.; Moneret-Vautrin, D.A.; Crepet, A. Three peanut-allergic/sensitized phenotypes with gender difference. Clin. Exp. Allergy 2016, 46, 1596–1604. [Google Scholar] [CrossRef] [Green Version]
- Acker, W.W.; Plasek, J.M.; Blumenthal, K.G.; Lai, K.H.; Topaz, M.; Seger, D.L.; Goss, F.R.; Slight, S.P.; Bates, D.W.; Zhou, L. Prevalence of food allergies and intolerances documented in electronic health records. J. Allergy Clin. Immunol. 2017, 140, 1587–1591. [Google Scholar] [CrossRef] [Green Version]
- Jessica, S.; Christina, B.J. Food Allergy: Epidemiology and Natural History. Immunol. Allergy Clin. N. Am. 2015, 35, 45–59. [Google Scholar] [CrossRef] [Green Version]
- Popov, T.A.; Mustakov, T.B.; Kralimarkova, T.Z. Food allergy in adults in Europe: What can we learn from geographical differences? Curr. Opin. Allergy Clin. Immunol. 2020, 20, 6. [Google Scholar] [CrossRef] [PubMed]
- Keet, C.A.; Savage, J.H.; Seopaul, S.; Peng, R.D.; Wood, R.A.; Matsui, E.C. Temporal trends and racial/ethnic disparity in self-reported pediatric food allergy in the United States. Ann. Allergy Asthma Immunol. 2014, 112, 222–229. [Google Scholar] [CrossRef]
- Turner, P.J.; Gowland, M.H.; Sharma, V.; Ierodiakonou, D.; Harper, N.; Garcez, T.; Pumphrey, R.; Boyle, R.J. Increase in anaphylaxis-related hospitalizations but no increase in fatalities: An analysis of United Kingdom national anaphylaxis data, 1992-2012. J. Allergy Clin. Immun. 2015, 135, 956–963. [Google Scholar] [CrossRef] [Green Version]
- Poulos, L.M.; Waters, A.M.; Correll, P.K.; Loblay, R.H.; Marks, G.B. Trends in hospitalizations for anaphylaxis, angioedema, and urticaria in Australia, 1993–1994 to 2004-2005. J. Allergy Clin. Immunol. 2007, 120, 878–884. [Google Scholar] [CrossRef]
- Patsopoulos, N.A.; Evangelou, E.; Ioannidis, J.P. Sensitivity of between-study heterogeneity in meta-analysis: Proposed metrics and empirical evaluation. Int. J. Epidemiol. 2008, 37, 1148–1157. [Google Scholar] [CrossRef]


| Study | Survey Region | Survey Period | Population Source | Age Range (years) | Sample Size | Diagnostic Method |
|---|---|---|---|---|---|---|
| Hu et al., 2021 [13] | Shanghai | 2019.4–2019.6 | School | 6–11 | 10,464 | Questionnaire |
| Tang et al., 2021 [14] | Shenzhen | 2016.12–2017.3 | School | 10–16 | 1147 | Questionnaire |
| Xu et al., 2020 [15] | Shanghai | 2019.12–2020.1 | School | 0–5 | 1247 | Questionnaire |
| Sun et al., 2020 [16] | Datong, Shanxi | 2016.9–2016.12 | School | around 16 | 451 | Questionnaire |
| Zhang et al., 2019 [17] | Yangzhou, Jiangsu | - | School | 3–6 | 2531 | Questionnaire |
| Yu et al., 2019 [18] | Foshan, Guangdong | - | School | 6–8, 12–14 | 4166 | Questionnaire |
| Wang et al., 2017 [19] | Wuhu, Anhui | 2014.11 | Physical examination hospitals | 0–2 | 597 | Questionnaire |
| Zhang et al., 2016 [20] | Wuhu, Anhui | - | School | 3–6 | 1912 | Questionnaire |
| Wang et al., 2016 [21] | 33 cities in China | 2014.11 | Physical examination hospitals | 0–2 | 10,693 | Questionnaire |
| Chen et al., 2015 [22] | Shanghai | 2011.4–2012.4 | School | 3–7 | 14,884 | Questionnaire |
| Ye et al., 2010 [23] | Wenzhou, Zhejiang | 2009 | School | 16–25 | 1981 | Questionnaire |
| Feng et al., 2022 [24] | Nanchang, Jiangxi | 2019.12 | School | 18–24 | 2313 | Questionnaire |
| Li et al., 2019 [25] | Beijing | 2010 | Community, School | 0–14 | 13,073 | Questionnaire |
| Shao et al., 2017 [26] | Beijing | 2010 | Community, School | 0–15 | 20,186 | Questionnaire |
| Xie et al., 2017 [27] | 31 cities in China | 2010 | Community, School | 0–14 | 337,560 | Questionnaire |
| Ma et al., 2009 [28] | Beijing | 2007.10–2008.1 | School | 6–11 | 10,672 | Questionnaire |
| Wang et al., 2019 [29] | Chengdu, Sichuan | 2014.3–2015.3 | Cohort study | 0–1 | 923 | Questionnaire |
| Wang et al., 2018 [11] | Nei Mongol | 2015.5–2015.8 | Community | - | 4441 | Questionnaire |
| Zeng et al., 2015 [30] | Guangdong | 2013.6–2013.12 | School | 1–7 | 2540 | Questionnaire |
| Zhang et al., 2015 [31] | 7 cities, 2 rural areas in China | 2011.11–2012.4 | School | 3–12 | 1739 | Questionnaire |
| Liu et al., 2013 [32] | 8 cities in China | 2011.10–2012.3 | Physical examination hospital | 0–3 | 2632 | Questionnaire |
| Mo et al., 2013 [33] | Shanghai | - | School | 15–20 | 2626 | Questionnaire |
| Wang et al., 2013 [34] | YunnanGuizhouSichuan | 2011.3–2011.7 | Community | 0.5–2 | 3344 | Questionnaire |
| Wu et al., 2012 [35] | Taiwan | 2004.4.1–2004.10.31 | Physical examination hospital, Community, School | - | 30,018 | Questionnaire |
| Ho et al., 2012 [12] | Hong Kong | 2005.9–2006.8 | Community | 0–14 | 7393 | Questionnaire |
| Leung et al., 2009 [36] | Hong Kong | 2006.11–2007.5 | School | 2–7 | 3677 | Questionnaire |
| Zhang et al., 2021 [37] | Qinhuangdao, Hebei | 2016.1–2017.1 | Physical examination hospital | 0–3 | 2632 | Questionnaire, SPT |
| Pan et al., 2020 [38] | Wuxi, Jiangsu | 2016.1–2017.12 | School | 3–14 | 3858 | Questionnaire, sIgE |
| Li J et al., 2019 [39] | HongKong Guangzhou Shaoguan | 2009.9–2016.6 | School | 7–10 | 16,875 | Questionnaire, SPT, sIgE |
| Yang et al., 2015 [40] | Guangzhou Shaoguang | 2010 | School | 7–12 | 10,681 | Questionnaire, SPT, sIgE |
| Jin et al., 2012 [41] | Wuhan, Hubei | 2011.6–2011.12 | Physical examination hospital | 0.5–0.75 | 626 | Questionnaire, SPT |
| Lv et al., 2005 [42] | China Medical University | - | School | 15–24 | 3974 | Questionnaire, SPT |
| Huan et al., 2020 [43] | Wenzhou, Zhejiang | 2018 | School | 3–6 | 4151 | Questionnaire, SPT, sIgE, OFC |
| Peng et al., 2020 [44] | Sanmenxia, Henan | 2017.1–2018.1 | Physical examination hospital | 0–1 | 624 | Questionnaire, SPT, OFC |
| Xiao et al., 2018 [45] | Shanghai | 2016.1–2017.6 | Physical examination hospital | 0–3 | 1100 | Questionnaire, sIgE, OFC |
| Nie et al., 2017 [46] | Chengdu, Sichuan | 2014.9–2015.3 | Physical examination hospital | 0–2 | 786 | Questionnaire, SPT, OFC |
| Zou et al., 2013 [47] | Panzhihua, Sichuan | 2010.1–2012.12 | Community | 0–3 | 1359 | Questionnaire, SPT, OFC |
| Ma et al., 2020 [48] | Chongqing | 1999/2009/2019 | Physical examination hospital | 0–2 | 314/401/513 | Questionnaire, SPT, OFC |
| Chen et al., 2012 [49] | Chongqing Zhuhai Hangzhou | 2009.1–2009.22010.1–2010.5 | Physical examination hospital | 0–2 | 1687 | Questionnaire, SPT, OFC |
| Chen et al., 2011 [50] | Chongqing | 2009.1.1–2009.2.28 | Physical examination hospital | 0–1 | 479 | Questionnaire, SPT, OFC |
| Feng et al., 2017 [8] | Beijing | 2012.5–2013.5 | Physical examination hospital | 39 ± 7 | 708 | sIgE |
| Hu et al., 2015 [9] | National | 2002 | Serum bank | 3–12 | 5190 | sIgE |
| Hua et al., 2008 [10] | Xinjiang | 2007.8–2007.12 | Physical examination hospital | 36–57 | 3067 | sIgE |
| Wei et al., 2022 [51] | Shanghai | 2019 | School | 3–6 | 5215 | Questionnaire |
| Gou et al., 2022 [52] | Guizhou | 2017–2018 | School | 18–20 | 1453 | Questionnaire |
| Sun et al., 2022 [53] | Yiyang, Hunan | 2018.1–2019.12 | Physical examination hospital | 0–3 | 1730 | Questionnaire, OFC |
| Categories | Subgroups | No. of Studies | Sample Size (n) | Prevalence (% [95% CI]) | Heterogeneity | p Across Subgroup | |
|---|---|---|---|---|---|---|---|
| I2 | p | ||||||
| Prevalence of self-reported FA | Gender | p = 0.81 | |||||
| Male | 11 | 199,963 | 10.7 (8.2–13.8) | 100% | <0.01 | ||
| Female | 11 | 187,689 | 10.2 (7.8–13.3) | 99% | <0.01 | ||
| Age (years) | p < 0.01 | ||||||
| 0–3 | 13 | 63,055 | 10.5 (7.7–14.2) | 99% | <0.01 | ||
| 3–6 | 7 | 98,234 | 9.2 (6.4–13.1) | 100% | <0.01 | ||
| 6–12 | 10 | 278,335 | 9.0 (7.3–11.1) | 100% | <0.01 | ||
| 12–18 | 5 | 7843 | 12.0 (7.4–19.0) | 99% | <0.01 | ||
| >18 | 2 | 3766 | 14.2 (12.2–16.5) | - | - | ||
| Year of data collection | p = 0.02 | ||||||
| 1999–2010 | 9 | 378,968 | 8.7 (6.8–11.0) | 99% | <0.01 | ||
| 2011–2021 | 18 | 82,377 | 12.5 (10.4–15.0) | 98% | <0.01 | ||
| Regions | p < 0.01 | ||||||
| Northeast | 2 | 31,984 | 7.4 (7.1–7.6) | 66% | 0.09 | ||
| East | 16 | 230,191 | 10.2 (8.3–12.5) | 100% | <0.01 | ||
| Central | 4 | 55,203 | 9.9 (4.8–19.2) | 99% | <0.01 | ||
| West | 11 | 139,926 | 12.1 (9.5–15.4) | 99% | <0.01 | ||
| Sample size | p = 0.02 | ||||||
| <1000 | 7 | 3586 | 16.3 (13.0–20.2) | 89% | <0.01 | ||
| 1000–2000 | 6 | 8632 | 11.7 (8.8–15.4) | 96% | <0.01 | ||
| 2001–5000 | 8 | 26575 | 9.9 (7.2–13.4) | 99% | <0.01 | ||
| >5000 | 8 | 426,537 | 10.0 (7.6–13.1) | 100% | 0 | ||
| Prevalence of self-reported physician-diagnosed FA | Gender | p = 0.43 | |||||
| Male | 8 | 24,561 | 4.6 (3.6–5.9) | 95% | <0.01 | ||
| Female | 8 | 22,573 | 4.0 (2.9–5.4) | 96% | <0.01 | ||
| Age (years) | p < 0.01 | ||||||
| 0–3 | 6 | 16,290 | 4.0 (2.1–7.4) | 99% | <0.01 | ||
| 3–6 | 5 | 16,029 | 4.5 (3.3–6.1) | 95% | <0.01 | ||
| 6–12 | 5 | 35,699 | 4.1 (3.0–5.6) | 95% | <0.01 | ||
| 12–18 | 1 | 2971 | 7.0 (6.1–7.9) | - | - | ||
| >18 | 3 | 17,802 | 7.2 (6.2–8.2) | 85% | <0.01 | ||
| Year of data collection | p = 0.60 | ||||||
| 1999–2010 | 5 | 66,534 | 4.7 (3.3–6.8) | 99% | <0.01 | ||
| 2011–2021 | 9 | 34,598 | 5.4 (3.8–7.6) | 98% | <0.01 | ||
| Regions | p = 0.02 | ||||||
| Northeast | - | - | - | - | - | ||
| East | 10 | 89,869 | 4.8 (3.9–5.8) | 99% | <0.01 | ||
| Central | 2 | 2509 | 4.2 (2.6–6.7) | 86% | <0.01 | ||
| West | 2 | 2376 | 10.0 (6.1–16.0) | 97% | <0.01 | ||
| Sample size | p < 0.01 | ||||||
| <1000 | 2 | 1520 | 6.6 (2.1–19.0) | 98% | <0.01 | ||
| 1000–2000 | 4 | 6593 | 6.6 (5.8–7.4) | 60% | 0.06 | ||
| 2001–5000 | 6 | 19,378 | 5.7 (4.6–7.1) | 93% | <0.01 | ||
| >5000 | 5 | 82,250 | 3.6 (2.6–5.1) | 99% | <0.01 | ||
| Prevalence of SPT-positive FA | Gender | - | - | - | - | - | - |
| Age (years) | - | - | - | - | - | - | |
| Year of data collection | p = 0.75 | ||||||
| 1999–2010 | 4 | 2889 | 12.3 (9.8–15.3) | 81% | p < 0.01 | ||
| 2011–2021 | 4 | 4557 | 11.5 (8.0–16.2) | 96% | p < 0.01 | ||
| Regions | p < 0.01 | ||||||
| Northeast | - | - | - | - | - | ||
| East | 2 | 3738 | 7.4 (5.8–9.6) | 89% | p < 0.01 | ||
| Central | 1 | 626 | 14.4 (11.7–17.4) | - | - | ||
| West | 7 | 4451 | 13.0 (11.2–15.1) | 77% | p < 0.01 | ||
| Sample size | p < 0.01 | ||||||
| <1000 | 6 | 3137 | 13.5 (11.6–15.6) | 67% | p < 0.01 | ||
| 1000–2000 | 2 | 3046 | 10.8 (9.7–12.0) | 0 | p = 0.57 | ||
| 2001–5000 | 1 | 2632 | 6.3 (5.4–7.3) | - | - | ||
| >5000 | - | - | - | - | - | ||
| Prevalence of OFC-positive FA | Gender | - | - | - | - | - | - |
| Age (years) | p < 0.01 | ||||||
| 0–3 | 10 | 8908 | 7.4 (6.1–8.9) | 77% | <0.01 | ||
| 3–6 | 1 | 4151 | 1.4 (1.0–1.8) | - | - | ||
| >6 | - | - | - | - | - | ||
| Year of data collection | p = 0.45 | ||||||
| 1999–2010 | 4 | 2796 | 5.3 (3.9–7.2) | 69% | 0.02 | ||
| 2011–2021 | 6 | 8904 | 6.8 (3.8–11.7) | 97% | <0.01 | ||
| Regions | p = 0.18 | ||||||
| Northeast | - | - | - | - | - | ||
| East | 3 | 6305 | 4.3 (1.7–10.7) | 99% | <0.01 | ||
| Central | 2 | 2345 | 8.4 (7.4–9.6) | 0 | 0.93 | ||
| West | 7 | 4400 | 6.9 (5.3–9.0) | 78% | <0.01 | ||
| Sample size | p < 0.01 | ||||||
| <1000 | 6 | 3115 | 6.9 (4.9–9.5) | 81% | <0.01 | ||
| 1000–2000 | 4 | 5793 | 7.9 (6.7–9.3) | 83% | <0.01 | ||
| 2001–5000 | 1 | 4151 | 1.4 (1.0–1.8) | 96% | <0.01 | ||
| >5000 | - | - | - | - | - | ||
Publisher’s Note: MDPI stays neutral with regard to jurisdictional claims in published maps and institutional affiliations. |
© 2022 by the authors. Licensee MDPI, Basel, Switzerland. This article is an open access article distributed under the terms and conditions of the Creative Commons Attribution (CC BY) license (https://creativecommons.org/licenses/by/4.0/).
Share and Cite
Wang, J.; Liu, W.; Zhou, C.; Min, F.; Wu, Y.; Li, X.; Tong, P.; Chen, H. Multi-Perspective Observation on the Prevalence of Food Allergy in the General Chinese Population: A Meta-Analysis. Nutrients 2022, 14, 5181. https://doi.org/10.3390/nu14235181
Wang J, Liu W, Zhou C, Min F, Wu Y, Li X, Tong P, Chen H. Multi-Perspective Observation on the Prevalence of Food Allergy in the General Chinese Population: A Meta-Analysis. Nutrients. 2022; 14(23):5181. https://doi.org/10.3390/nu14235181
Chicago/Turabian StyleWang, Jian, Wenfeng Liu, Chunyan Zhou, Fangfang Min, Yong Wu, Xin Li, Ping Tong, and Hongbing Chen. 2022. "Multi-Perspective Observation on the Prevalence of Food Allergy in the General Chinese Population: A Meta-Analysis" Nutrients 14, no. 23: 5181. https://doi.org/10.3390/nu14235181