Article

The Role of Calcium, 25-Hydroxyvitamin D, and Parathyroid Hormone in Irritable Bowel Syndrome: A Bidirectional Two-Sample Mendelian Randomization Study

1
Second Affiliated Hospital, Xi’an Jiaotong University, Xi’an 710049, China
2
Bioinspired Engineering and Biomechanics Center (BEBC), Xi’an Jiaotong University, Xi’an 710049, China
3
The Key Laboratory of Biomedical Information Engineering of Ministry of Education, School of Life Science and Technology, Xi’an Jiaotong University, Xi’an 710049, China
4
Department of Joint Surgery, HongHui Hospital, Xi’an Jiaotong University, Xi’an 710054, China
5
National Clinical Research Center for Digestive Diseases, State Key Laboratory of Cancer Biology, Xijing Hospital of Digestive Diseases, Air Force Medical University, Xi’an 710032, China
*
Authors to whom correspondence should be addressed.
These authors contributed equally to this work.
Nutrients 2022, 14(23), 5109; https://doi.org/10.3390/nu14235109
Submission received: 24 October 2022 / Revised: 24 November 2022 / Accepted: 27 November 2022 / Published: 1 December 2022

Abstract

:
Several observational studies have indicated the potential associations among calcium, vitamin D (Vit-D), and irritable bowel syndrome (IBS). However, the causal relationship deduced from these studies is subject to residual confounding factors and reverse causation. Therefore, we aimed to explore the bidirectional causal effects among serum calcium, Vit-D, PTH, and IBS at the genetic level by a two-sample Mendelian randomization (MR) analysis of the datasets from IEU OpenGWAS database. Sensitivity analyses were performed to evaluate the robustness. The estimates were presented as odds ratios (ORs) with their 95% confidence intervals (CIs). The results of the inverse variance weighted method did not reveal any causal relationship between the genetically predisposed calcium (OR = 0.92, 95% CI: 0.80–1.06, p = 0.25) and Vit-D (OR = 0.99, 95% CI: 0.83–1.19, p = 0.94) level and the risk of IBS. The bidirectional analysis demonstrated that genetic predisposition to IBS was associated with a decreased level of PTH (beta: −0.19, 95%CI: −0.34 to −0.04, p = 0.01). In conclusion, the present study indicates no causal relationship between the serum calcium and Vit-D concentrations and the risk of IBS. The potential mechanisms via which IBS affects serum PTH need to be further investigated.

1. Introduction

Irritable bowel syndrome (IBS) is one of the most common gastrointestinal diseases, and affects approximately 5–10% of the global population, which exerts an immense impact on the patient’s quality of life, society, and economy [1]. The most complained symptoms include abdominal pain/discomfort and diarrhea/constipation. The pathogenesis of IBS is complex and recent studies bring the consensus that IBS mainly results from the disorder of gut–brain interactions [2]. Furthermore, epidemiological studies suggest that genetics, diet, gut microbiota dysbiosis, gut infection, and psychological factors are all risk factors for IBS, which can exert effects on IBS via disrupting the bidirectional interactions of the gut–brain axis [3,4]. Considering these factors, the common therapeutics for IBS include dietary exclusion, probiotics/fecal microbiota transplant, antibiotics, psychotropic medications, and symptom-relieving drugs (e.g., antispasmodics, antidiarrheal agents, and laxative) [5]. However, all the treatments have limited therapeutic effectiveness. Therefore, there is still an unmet need for improved understanding of the pathophysiological mechanisms of IBS to develop more effective therapeutic approaches.
Recent studies demonstrate that the diet and micronutrients play a vital role in the pathophysiology of IBS, and over 80% of IBS patients report food triggers for their complaints, such as dairy products, gluten, alcohol, and fried foods [6,7]. Noteworthily, dietary fibers are related to the onset of IBS symptoms, as they can exert effects on nutrients bioavailability, gut motility, stool pattern, and the gut microbiota [8]. Specifically, the insoluble fibers, which are poorly absorbed in the gut, can provoke and exacerbate the symptoms of IBS patients, while the soluble fibers can improve stool pattern [9,10]. Furthermore, FODMAPs (fermentable oligosaccharides, disaccharides, monosaccharides, and polyols), which are rich in some vegetables, fruits, dairy products, and legumes, are also associated with the development and severity of symptoms in specific IBS subgroup via their fermentative and osmotic effects on the gut [1,11]. These findings provide some promising dietary therapies including dietary exclusion and dietary supplementation. For example, the increased intake of soluble fibers and reduced intake of insoluble fibers are suggested for IBS subjects [8]. Moreover, a low-FODMAP diet is a recommended therapy for IBS patients by the American College of Gastroenterology. Notably, several epidemiological studies have reported the deficiency of vitamin D (Vit-D) and calcium in IBS patients [7], which indicates that Vit-D and calcium would serve as promising targets for potential dietary therapies.
Calcium homeostasis, which plays a vital role in various cellular and biological processes, is mainly regulated by concerted action of the calciotropic hormones, such as Vit-D and parathyroid hormone (PTH) [12]. Studies indicate that supplementation of Vit-D and calcium might help improve the symptoms of IBS patients [13]. However, randomized controlled trials on the effects of Vit-D and calcium supplementation for IBS patients yielded contradictory results [14,15,16]. Additionally, the causal relationship among Vit-D, calcium, and the risk of IBS needs to be illustrated considering the potential unmeasured confounders or reverse causality in previous observational studies.
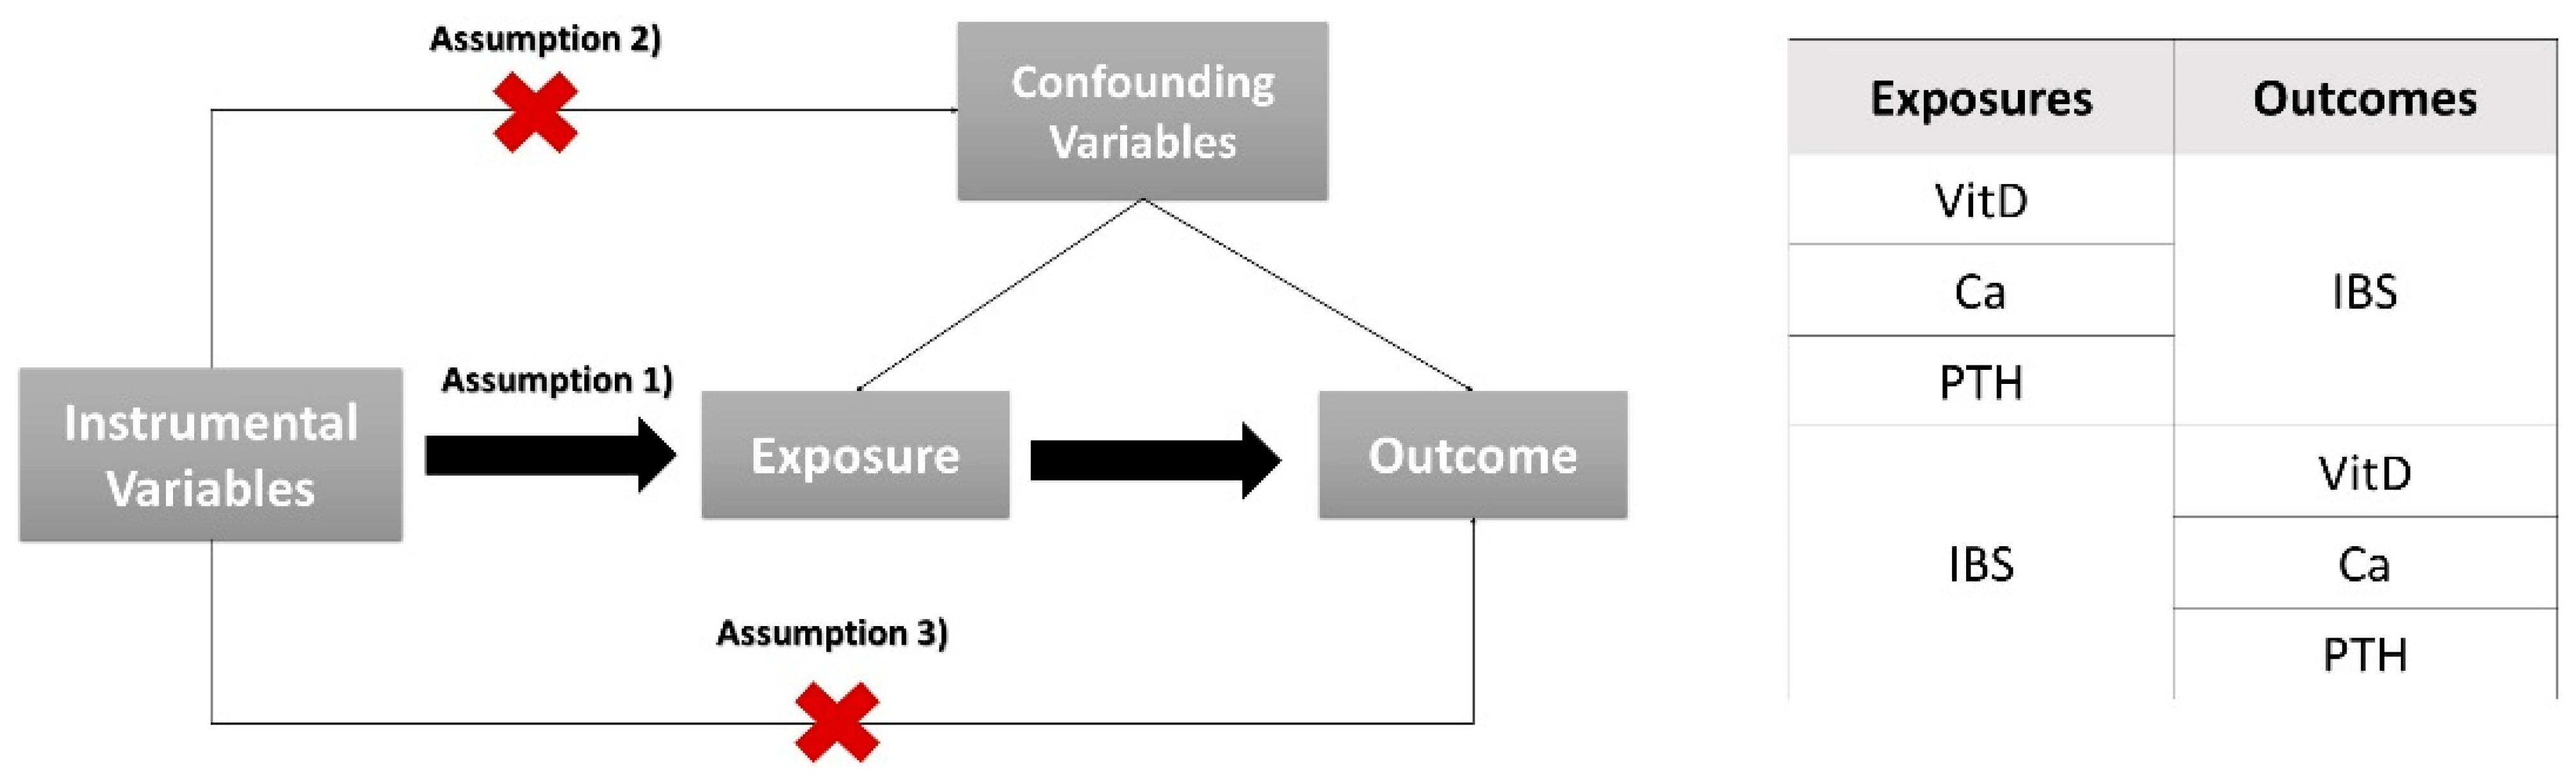
Based on Mendel’s law of inheritance, Mendelian randomization (MR) analysis can use genetic variants, namely single-nucleotide polymorphisms (SNPs), as instrumental variables (IVs) to estimate the causal effects of the predefined exposure on outcome [17]. Since genetic variants are randomly allocated at conception and remain stable after birth, MR is less susceptible to confounding factors and reverse causation, thus simulating the randomized controlled trials in the clinic. With the existing genome-wide association study (GWAS) databank, our study is dedicated to probing the causal association between Vit-D, calcium, PTH, and IBS via a bidirectional two-sample MR study.

2. Materials and Methods

2.1. Study Design

To investigate the causality between exposures and disease, we conducted two-sample MR analysis that used genetic variants as instrumental variables to explore the causal effects of risk factors on outcomes. Compared with observational studies, MR can avoid reverse causation and reduce confounding factors. The graphical flow of the experimental design is shown in Figure 1.
The validity of MR analysis relies on three assumptions: (1) there is strong association between the IVs and the exposure; (2) each IV is not associated with confounding variables; (3) each IV is only associated with the outcome through the exposure; there are no alternative pathways for the association.

2.2. Data Sources and Study Population

The data of our study were obtained from the IEU OpenGWAS database (https://gwas.mrcieu.ac.uk/, accessed on 10 October 2022), a database of 244,879,032,980 genetic associations from 42,334 GWAS summary datasets, for query or download.
The datasets utilized in our study are shown in Table 1. For the dataset of Vit-D, summary statistics of serum 25-hydroxyvitamin D levels were from a GWAS of the EBI database with a sample size of 496,946 (ebi-a-GCST90000618) [18]. For the dataset of calcium, we used summary statistics from a GWAS of UK Biobank from Neale lab with a sample size of 315,153 (ukb-d-30680_irnt). For the dataset of PTH, the complete GWAS summary data on protein levels as described by Sun et al. (2018) was used (prot-a-2431) [19], and the sample size was 3301. For the dataset of IBS, summary statistics from FinnGen biobank analysis including 4605 patients of IBS and 182,423 controls were used (finn-b-K11_IBS) [20]. All cases were defined by the code M13 in the International Classification of Diseases—Tenth Revision (ICD-10).
All the above data samples were of European ethnicity. In all original studies, ethical approval and consent to participate were obtained.

2.3. Selection of Instrumental Variables

Firstly, the summary-level data above for Vit-D and calcium were screened by the genome-wide significance (p < 5 × 10⁻⁸) to select the SNPs genetically associated with the traits. To avoid inaccurate results due to too few SNPs, the significance threshold of PTH data was relaxed to 5 × 10⁻⁶. Secondly, we utilized the linkage disequilibrium clumping to exclude some undesirable SNPs (r2 > 0.001). Thirdly, we harmonized the respective exposure and outcome datasets using effect allele frequencies, while removing palindromic SNPs with intermediate allele frequencies. Lastly, according to the third assumption of MR that genetic variation cannot be associated with any possible confounding factor, we used PhenoScanner V2 [21] (a database of human genotype–phenotype associations) to search the SNPs and exclude those associated (p < 1 × 10⁻⁵) with confounding factors such as drinking [22], smoking [23], depression, and anxiety [24].
The IV exposure strength of genetic instruments was assessed from the F statistic using an approximation. If F > 10, there is sufficient strength to avoid a problem of weak instrument bias in the two-sample model. The F statistics were computed by the admittedly reliable formula F = R2 (N − 2)/(1 − R2). R2 and N refer to the cumulative explained variance of selected SNPs and sample size separately [25]. R2 was calculated using the formula R2 = 2 × MAF × (1 − MAF) × Beta2 [26].

2.4. Statistical Analyses

Multiple approaches were used in our study. We utilized the method of inverse variance weighted (IVW) as the primary analysis for its efficiency to estimate the causal effect. The weighted median was used as auxiliary method when the heterogeneity was significant, and the MR-Egger regression method was used to assess the pleiotropy by intercept test. According to the assumption of MR analysis, the instrumental variable must be only associated with the outcome through the risk factor; thus, if there are other pathways via which the outcome is influenced by genetic variants, bias will occur, and the horizontal pleiotropy may increase the false positive rate. Therefore, the pleiotropy should be evaluated using the method of MR-Egger and MR-PRESSO. The former can evaluate the potential pleiotropy in the IVW model, and the latter is used for testing horizontal pleiotropy via identifying and removing outlying instrumental variables (NbDistribution = 3000, SignifThreshold = 0.05). The leave-one-out sensitivity analysis was performed to evaluate the robustness of the study findings. The estimates were presented as odds ratios (ORs) with their 95% confidence intervals (CIs) per one standard deviation (SD) increase in the exposures. The statistical analyses above were performed in R 4.1.3 with R package of “TwoSampleMR” (version 0.5.6) and “MRPRESSO”.

3. Results

3.1. Instrumental Variables

In the analysis investigating the effect of Vit-D and calcium on IBS risk, 110 and 186 SNPs were screened, respectively, as potential instrumental variables (p < 5 × 10⁻⁸). As for PTH, 15 SNPs were screened for instrumental variables (p < 5 × 10⁻⁶). After linkage disequilibrium clumping and the removal of palindromic SNPs and confounders, 102, 176, and 14 SNPs could be used in the analyses as the instrumental variables of Vit-D, calcium, and PTH, respectively. The F statistics demonstrated that there was no bias due to weak instruments (F > 10, Table A1, Table A2, Table A3 and Table A4).

3.2. Main Analyses and Sensitivity Analyses

As shown in Figure 2, genetically predicted risk of IBS was not associated with the levels of vitamin D (p = 0.938, OR = 0.99, 95% CI: 0.83–1.19), calcium (p = 0.248, OR = 0.92, 95% CI: 0.80–1.06), and parathyroid hormone (p = 0.427, OR = 1.04, 95% CI: 0.94–1.15) using the IVW method. As shown in Table 2, Cochran’s Q statistics demonstrated no heterogeneity based on genetically predicted SNPs of Vit-D, calcium, and PTH (p > 0.05). The MR Egger intercept test showed no evidence of directional pleiotropy (p > 0.05). The results of the leave-one-out method demonstrated that the removal of SNP did not fundamentally affect the results, which indicated that the results were actually robust.
As shown in Figure 3, genetically predicted levels of PTH were associated with the risk of IBS (p = 0.012, Beta = −0.188) while IBS was not the risk factor of Vit-D (p = 0.898, Beta = −0.001) and calcium (p = 0.432, Beta = −0.006) using the IVW method. As shown in Table 2, Cochran’s Q statistics demonstrated no heterogeneity based on genetically predicted SNPs of Vit-D, calcium, and PTH (p > 0.05). The MR Egger intercept test showed no evidence of directional pleiotropy (p > 0.05). The results of the leave-one-out method demonstrated that the removal of SNP did not fundamentally affect the results, which indicated that the results were actually robust.

4. Discussion

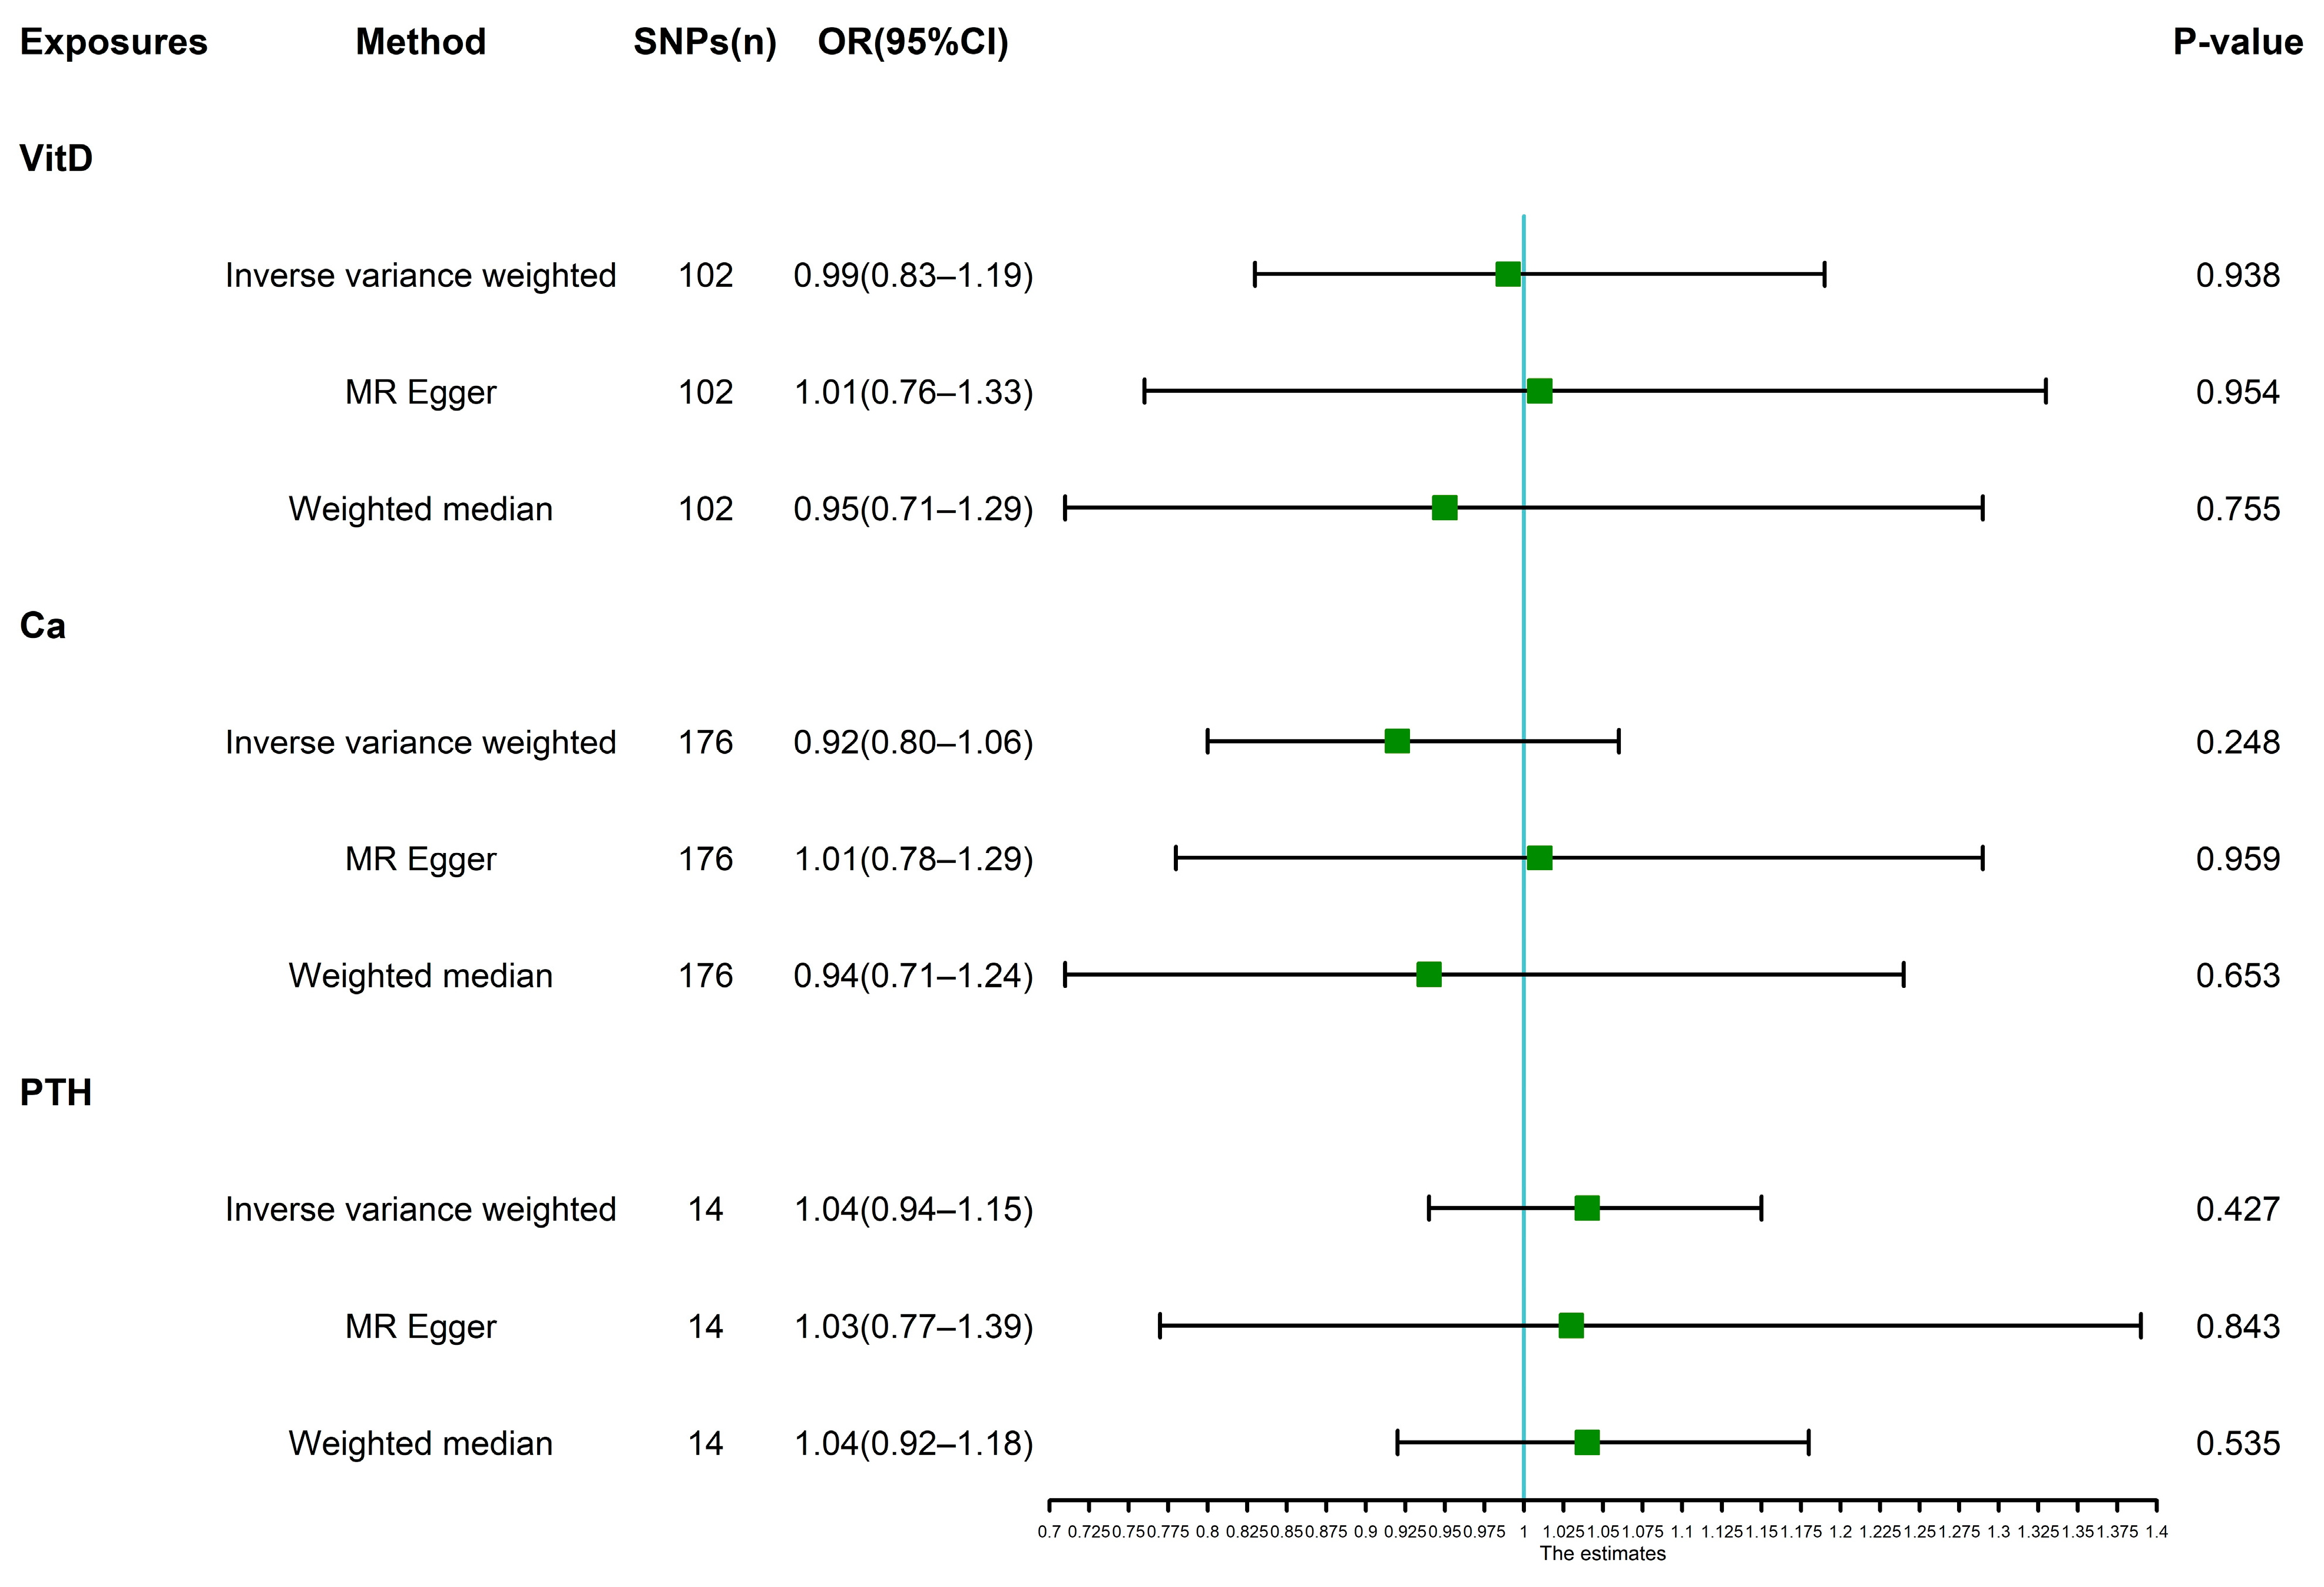
To the best of our knowledge, this is the first two-sample MR study to generally clarify the causal relationship among calcium, Vit-D, PTH, and IBS. Despite employing the latest large sample size and strong instruments, our MR results did not indicate the significantly causal associations of genetically predicted calcium, Vit-D, and PTH with the risk of IBS.
Researchers have been devoted to exploring the role of micronutrients in the pathogenesis and treatment of IBS [27,28]. A systematic review including 12 interventional and 14 observational studies showed that IBS patients generally had lower levels of Vit-D, vitamin B2, calcium, and iron compared with control subjects. Meanwhile, studies also found that exclusion diets were associated with deficiencies of the aforementioned micronutrients [7]. As the major circulating form of Vit-D, 25-hydroxyvitamin D is used as indicator of Vit-D status. 25-Hydroxyvitamin D is critical to regulate calcium metabolism and a series of pathological and physiological processes in intestinal homeostasis [29]. The various effects of Vit-D supplementation on IBS patients were reported in several randomized controlled trials and systematic reviews. Jalili et al. conducted a randomized, double-blind, placebo-controlled clinical trial to assess the impact of Vit-D supplementation on symptoms severity and quality of life (QOL) in IBS patients and found that, compared to the placebo group, Vit-D therapy could markedly improve the symptoms and QOL of IBS patients [14]. Similarly, a systematic review and meta-analysis including four randomized, placebo-controlled trials showed that Vit-D supplementation was remarkably superior to placebo in improving the symptom severity (WMD: −84.21, 95% CI: −111.38 to −57.05, I2 = 73.2%; WMD: −28.29, 95% CI: −49.95 to −6.62, I2 = 46.6%, respectively) and QOL (WMD: 14.98, 95% CI: 12.06 to 17.90, I2 = 0.0%; WMD: 6.55, 95% CI: −2.23 to 15.33, I2 = 82.7%, respectively) of IBS patients [30]. However, the other randomized, double-blind, placebo-controlled study by Williams et al. demonstrated that there were no improvements in the IBS symptom severity and QOL between the trial (Vit-D supplementation) and placebo groups [15]. Moreover, a systematic review and meta-analysis based on six randomized controlled trials including 616 participants indicated that Vit-D supplementation led to no significant improvements in symptom severity and QOL of IBS subjects in contrast to placebo [31]. Considering that Vit-D contributes to the regulation of the gut microbiome, immune system, inflammatory processes, and the intestinal mucosal barrier, the present interventional trials on IBS mainly focused on Vit-D supplementation. Few studies evaluated the effects of calcium supplementation on IBS symptom severity and QOL. In contrast to studies that reported the relationship among Vit-D, calcium, and IBS, our study suggested no causal association among Vit-D, calcium, and IBS. The contradictory findings might be explained by several factors: trial participants with different ages, races, sexes, and vitamin D statuses, sample size, intervention duration, intervention diet, and placebo effects.
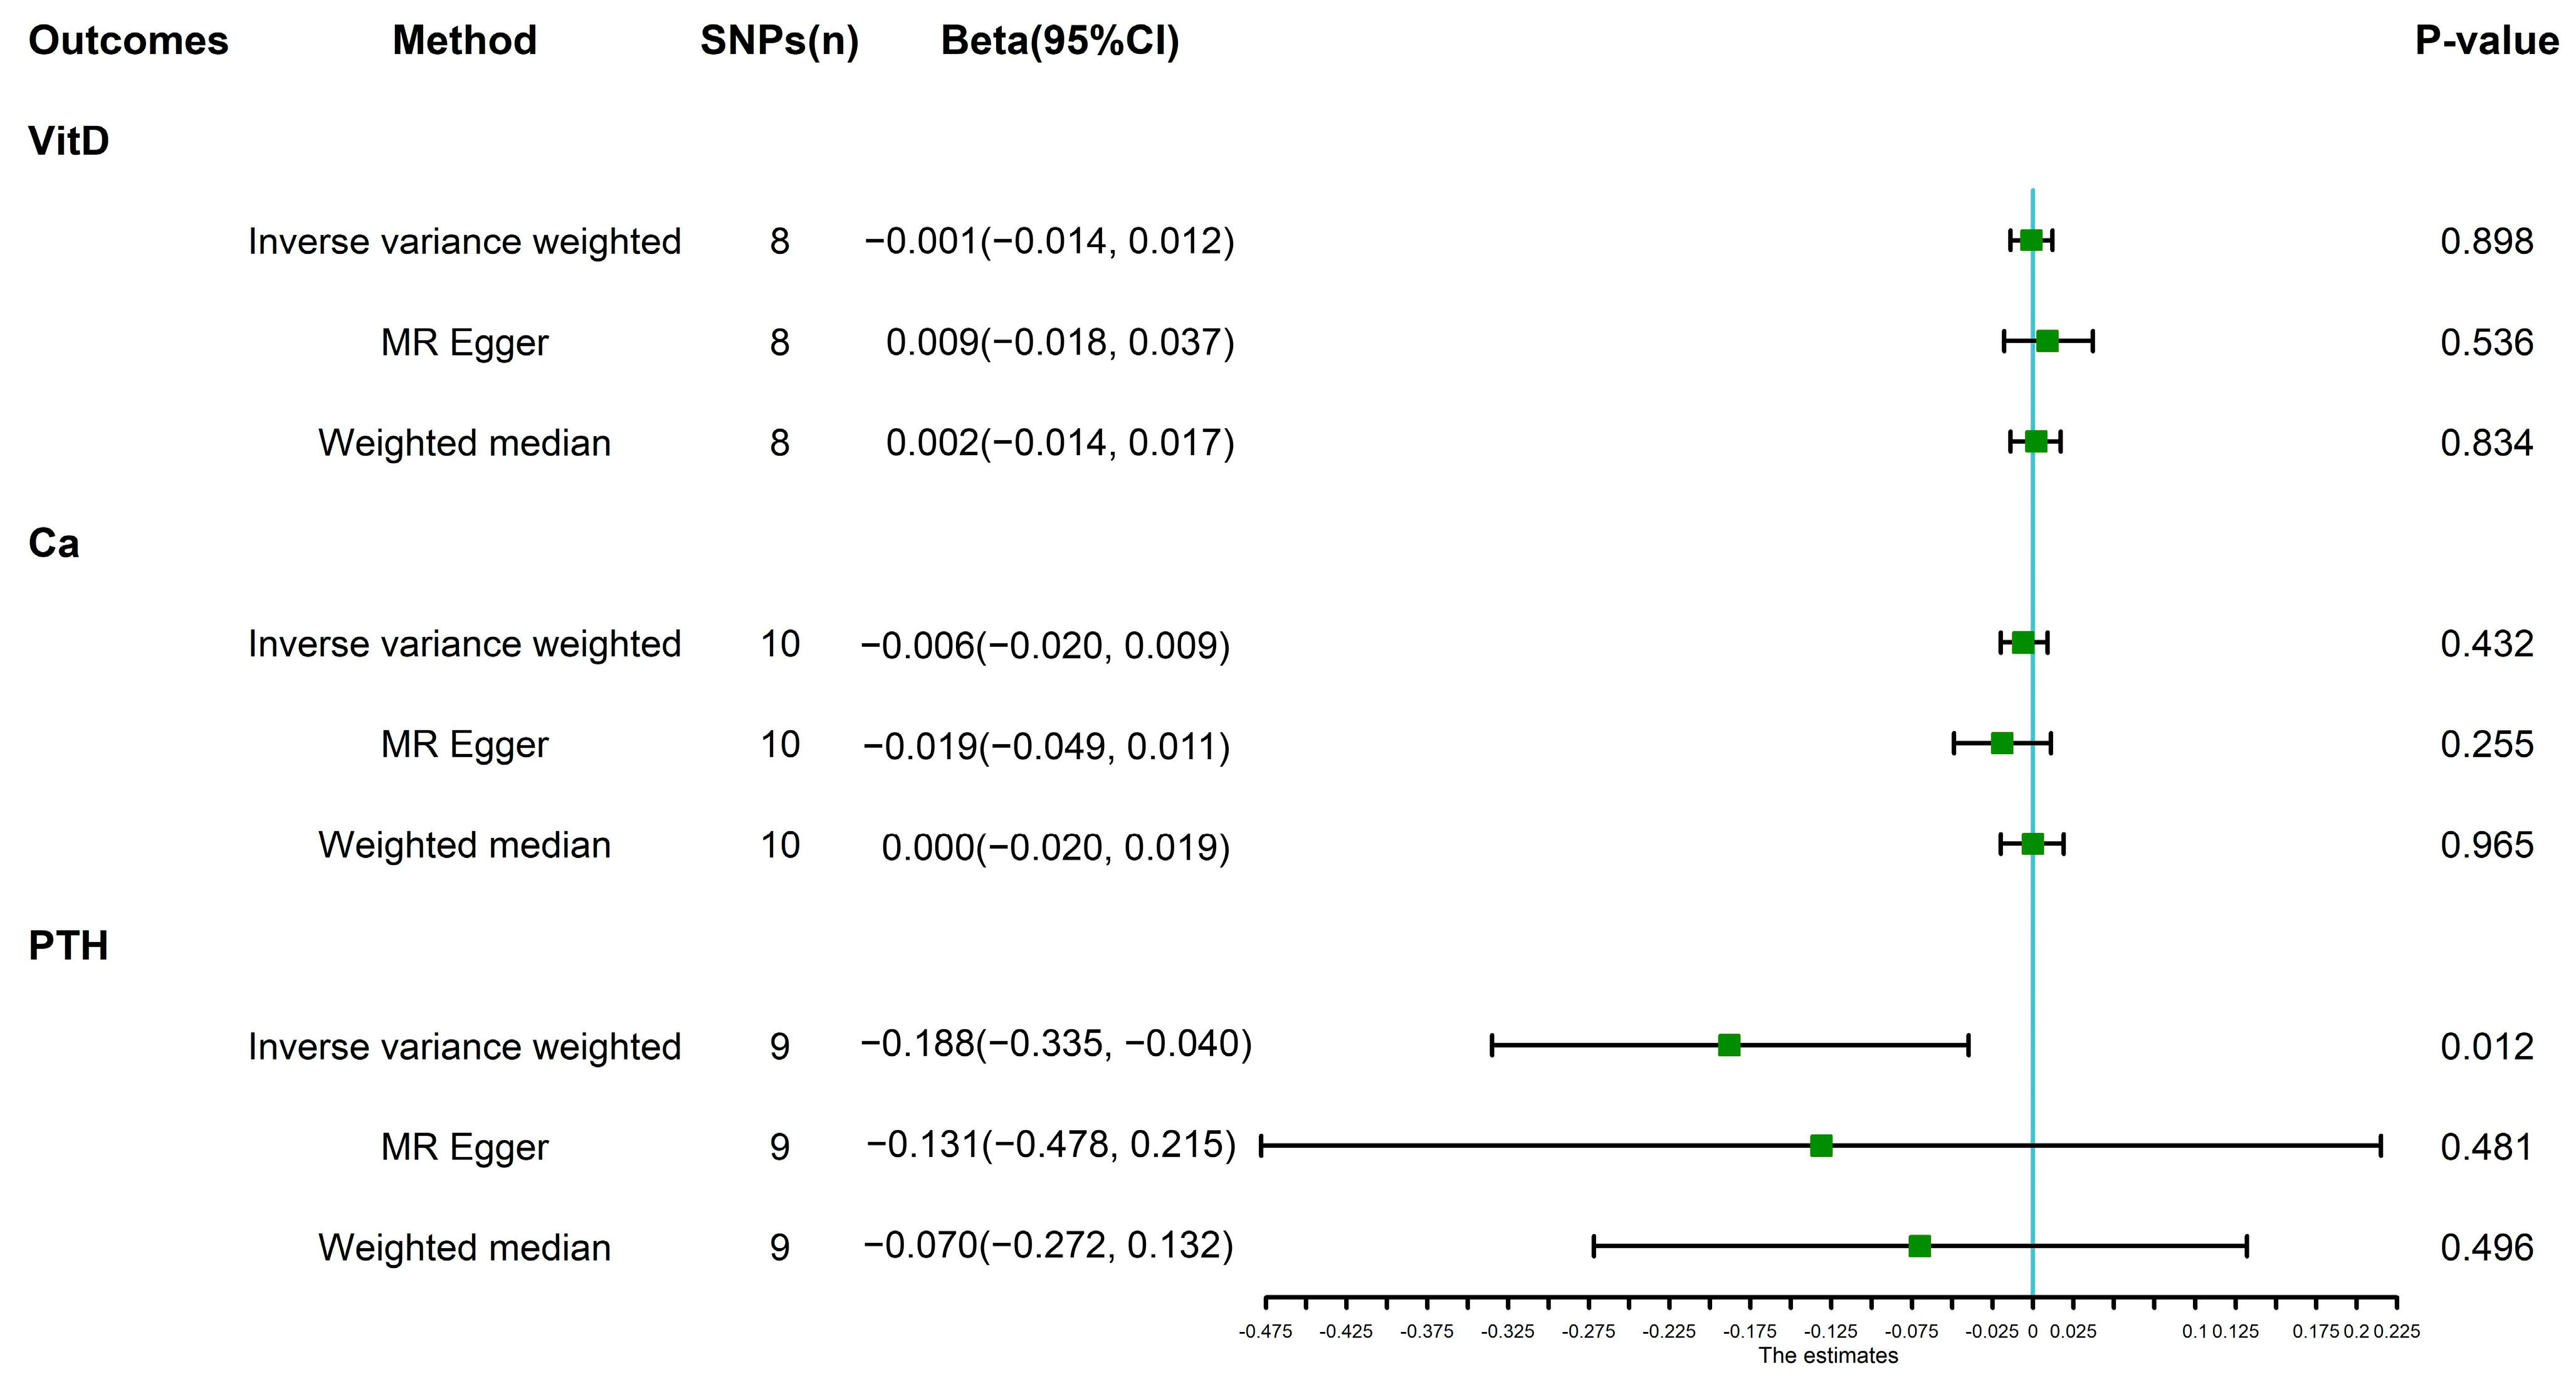
In addition, our bidirectional two-sample MR analysis identified that IBS was associated with a lower level of PTH, although there was no causal effect of PTH on IBS. The main function of PTH is to increase the concentration of serum calcium and decrease the concentration of serum phosphorus by impacting its primary target organs of bone and kidney, so as to regulate the homeostasis of calcium and phosphorus in vivo. It was noteworthy that recent studies suggested an increased risk of osteoporosis and osteoporotic fracture for IBS patients. A systematic review and meta-analysis including four cohorts and one cross-sectional study with 526,633 participants indicated that IBS patients had a remarkably higher risk of osteoporosis than the non-IBS subjects (pooled RR: 1.95, 95%CI: 1.04–3.64, I2 = 100%) [32]. Moreover, even though not statistically significant, IBS subjects had an increased risk of osteoporotic fracture (pooled RR: 1.58, 95%CI: 0.95–2.62, I2 = 99%). The possible mechanisms for the association between IBS and osteoporosis comprise chronic inflammation, abnormal activation of the hypothalamic–pituitary–adrenal (HPA) axis, smoking, and malnutrition. When suffering from osteoporosis, the secretion of PTH was reduced to inhibit the activity of osteoclasts, thus impeding the progression of osteoporosis, which might be the plausible explanation for the relationship between IBS and reduced level of PTH.
To our knowledge, this is the first study to elucidate the causal correlation among calcium, Vit-D, PTH, and IBS from the perspective of genetic variants using a bidirectional two-sample MR approach. This method could greatly circumvent the possible impacts of reverse causation and residual confounding factors, such as incomplete adjustment for confounders, the absence of high-quality evidence, and relatively small sample sizes of trials. Additionally, we performed several sensitivity analyses to strengthen the robustness of our results.
However, there are some limitations associated with this study. Firstly, the study mainly analyzed the European participants enrolled in the GWAS biobank; hence, the results could not precisely reflect the fact of patients from other regions and races. Secondly, we failed to accomplish the sex-specific, IBS subtype-specific, age-specific, and race-specific analyses due to a lack of data. Lastly, MR analysis possesses some inherent shortcomings, making it impossible to eliminate the effects of confounding factors and horizontal pleiotropy.
In conclusion, the present study provides no evidence that calcium, Vit-D, and PTH are causally associated with IBS, and it suggests a lower concentration of PTH in IBS subjects. Our findings may reduce possible expenses and research interests in elucidating the effects of calcium, Vit-D, and PTH on IBS. More importantly, further research is needed to investigate the causal relationship between micronutrients and IBS.

Author Contributions

N.X., N.L., F.X. and J.W. (Jian Wu) conceptualized and designed the study; Z.W. and J.X. analyzed the data; Q.S. interpreted the data; N.X. wrote the original draft; H.S. and J.W. (Jinhai Wang) commented on and improved the manuscript; N.L., F.X. and J.W. (Jian Wu) reviewed the manuscript, obtained the funding, and supervised all research work. All authors have read and agreed to the published version of the manuscript.

Funding

The study was supported by grants from the National Natural Science Foundation of China (No. 81872397) and National Key Technology R&D Program of China (No. 2015BAI13B07).

Institutional Review Board Statement

Not applicable.

Informed Consent Statement

Ethical approval and consent to participate were not needed for this current study because it is a secondary analysis of previously published data. In all original studies related to this study, ethical approval and consent to participate were obtained.

Data Availability Statement

This study is based on the public database, and all related-datasets are available at https://gwas.mrcieu.ac.uk/ (accessed on 10 October 2022).

Conflicts of Interest

The authors declare no conflict of interest. The funders had no role in the design of the study; in the collection, analyses, or interpretation of data; in the writing of the manuscript; or in the decision to publish the results.

Appendix A

Table A1. The F statistics for SNPs strongly associated with vitamin D.
SNPEafBetaR2F
rs102771630.255−0.0140.000139
rs10381650.5790.0120.000132
rs10420340.792−0.0150.000137
rs104389780.820−0.0170.000143
rs10478910.317−0.0130.000139
rs10483280.0800.0310.000172
rs108599950.580−0.0440.0009461
rs110231590.0330.0480.000173
rs110761750.1760.0230.000276
rs1115157410.017−0.0490.000140
rs112079690.3510.0210.000299
rs112643610.2510.0170.000157
rs115424620.134−0.0250.000171
rs116000540.0100.0680.000146
rs117268860.291−0.0540.0012591
rs1173008350.013−0.3350.00291469
rs117912580.1910.0140.000130
rs118672970.3850.0140.000143
rs120567680.584−0.0230.0003130
rs122830490.234−0.0560.0011569
rs123247200.175−0.0150.000132
rs124628260.370−0.0130.000140
rs125015150.590−0.0790.00301504
rs127750910.2130.0160.000140
rs13212470.102−0.0220.000145
rs132947340.4660.0130.000139
rs1383350.659−0.0140.000142
rs13846870.132−0.0170.000132
rs1420044000.034−0.0310.000132
rs1421589110.1120.0260.000168
rs15320850.6170.0250.0003150
rs16270430.033−0.0490.000276
rs16846000.299−0.0130.000133
rs172077840.324−0.0130.000140
rs174732570.017−0.0610.000163
rs18005880.215−0.0310.0003156
rs18588890.5030.0130.000145
rs18713950.153−0.0200.000153
rs19496330.6060.0110.000131
rs20375110.1660.0180.000143
rs20747350.0650.0290.000152
rs22297420.105−0.0250.000158
rs22451330.164−0.0210.000162
rs22979910.7180.0130.000133
rs24944290.823−0.0150.000132
rs25112790.9600.0980.0007365
rs25956440.385−0.0120.000135
rs27106510.526−0.0120.000133
rs28078340.685−0.0150.000149
rs284354700.663−0.0120.000131
rs28475000.123−0.0230.000155
rs3253930.278−0.0140.000137
rs341868900.260−0.0160.000147
rs347268340.2520.0140.000137
rs352704970.1760.0160.000135
rs37322200.085−0.0480.0004177
rs38292510.133−0.1140.00301508
rs41475360.789−0.0150.000136
rs43481600.327−0.0260.0003146
rs43642590.1990.0170.000147
rs44206380.177−0.0190.000154
rs45800370.286−0.0140.000137
rs5120830.4620.0120.000137
rs57707940.314−0.0130.000138
rs61296480.3800.0140.000146
rs616987550.560−0.0110.000132
rs617477280.0390.0300.000134
rs618138750.0250.0820.0003162
rs618874210.030−0.0370.000139
rs620072990.713−0.0120.000131
rs621299660.1610.0610.0010502
rs6356340.187−0.0150.000134
rs64389000.2560.0150.000143
rs66727580.8000.0160.000142
rs68344880.423−0.0140.000151
rs715999740.1480.0260.000283
rs7278570.612−0.0120.000134
rs7334540.0990.0190.000132
rs734135960.0740.0220.000134
rs7424930.1130.0180.000134
rs75284190.2240.0220.000280
rs75697550.2890.0140.000138
rs75807710.176−0.0170.000140
rs77120010.4400.0120.000135
rs775328680.0520.0260.000133
rs779246150.194−0.0150.000136
rs779603470.013−0.0530.000134
rs786499100.106−0.0190.000134
rs80187200.824−0.0340.0003172
rs81079740.0760.0360.000289
rs81219400.198−0.0440.0006299
rs93750370.4430.0120.000134
rs94092660.862−0.0170.000133
rs9641840.8670.0410.0004189
rs98472480.713−0.0120.000131
rs9866490.3220.0130.000136
rs99467710.066−0.0230.000134
Table A2. The F statistics for SNPs strongly associated with calcium.
SNPEafBetaR2F
rs101088870.3880.0140.000131
rs10363320.7390.0220.000259
rs10611340.092−0.0250.000133
rs107544390.4170.0140.000132
rs108191780.6380.0320.0005153
rs108589350.687−0.0190.000251
rs109173860.6900.0200.000254
rs109587000.2470.0200.000248
rs110785970.1860.0510.0008249
rs110850150.800−0.0180.000133
rs1121740500.0250.1020.0005163
rs1149492630.1120.0340.000272
rs115889070.342−0.0160.000136
rs116160300.087−0.0310.000248
rs116217920.4540.0160.000139
rs116298760.331−0.0180.000146
rs116713930.040−0.0450.000248
rs1167699260.0240.0730.000276
rs1170804180.011−0.0990.000264
rs1171790230.012−0.0680.000134
rs1172137540.0150.1040.0003100
rs117304910.1680.0210.000138
rs117434660.3640.0180.000145
rs1178968570.027−0.0550.000251
rs117929280.295−0.0170.000136
rs121324120.3880.0280.0004121
rs121353820.5840.0220.000276
rs121477030.895−0.0280.000147
rs123395410.064−0.0610.0004141
rs123789910.080−0.0380.000267
rs125838510.751−0.0230.000260
rs126138070.4440.0160.000140
rs126754770.2740.0170.000137
rs127937310.5110.0150.000134
rs129189680.439−0.0320.0005157
rs129225490.237−0.0220.000255
rs129338580.4930.0190.000256
rs129822340.040−0.0580.000382
rs129983790.194−0.0240.000258
rs130731060.6410.0380.0007205
rs133892190.394−0.0160.000140
rs13540340.601−0.0180.000249
rs13741610.491−0.0230.000380
rs1387897590.0750.0470.000396
rs1472330900.0240.1030.0005157
rs14766980.369−0.0210.000262
rs14978260.3730.0240.000386
rs1498078920.0160.0660.000143
rs15001870.456−0.0140.000129
rs1647510.410−0.0190.000254
rs1653160.198−0.0180.000131
rs16729910.9340.0750.0007221
rs171321440.093−0.0260.000135
rs171646830.270−0.0210.000255
rs175800.0490.0470.000264
rs17635190.607−0.0320.0005149
rs177746720.158−0.0270.000262
rs178848690.025−0.1110.0006190
rs18012820.120−0.0370.000392
rs18588000.3450.0310.0004134
rs20018840.507−0.0170.000146
rs20043150.6250.0330.0005160
rs22416990.277−0.0260.000384
rs22430100.206−0.0180.000132
rs22498250.269−0.0160.000133
rs22742240.432−0.0170.000147
rs23092330.7310.0210.000256
rs23277740.378−0.0220.000271
rs23355340.179−0.0380.0004136
rs23435920.267−0.0230.000267
rs23702180.766−0.0220.000253
rs24198860.257−0.0200.000147
rs2557550.2700.0150.000129
rs26472420.798−0.0200.000140
rs27629380.5870.0160.000137
rs285203340.1190.0220.000131
rs289294740.0200.1230.0006189
rs29718550.3020.0190.000249
rs30116420.2430.0200.000145
rs30264450.367−0.0180.000145
rs3026500.432−0.0190.000258
rs30918420.0440.0940.0007235
rs31335480.1420.0200.000131
rs340420700.1860.0210.000142
rs340669450.358−0.0260.000397
rs342904110.2860.0180.000141
rs343959350.1520.0590.0009285
rs351187550.1490.0230.000143
rs355904870.241−0.0210.000253
rs357516930.0390.0430.000145
rs358528400.0590.0290.000129
rs360861950.5800.0200.000263
rs361043520.1210.0280.000252
rs37488610.202−0.0170.000131
rs37952430.1260.0220.000132
rs38228580.407−0.0160.000140
rs39318410.681−0.0260.000394
rs40823300.8140.0210.000141
rs412781740.0270.0500.000142
rs413939480.113−0.0220.000129
rs42391420.745−0.0170.000135
rs43201030.0390.0450.000249
rs43240760.530−0.0180.000253
rs46334800.5560.0200.000262
rs47214670.738−0.0210.000254
rs47448540.629−0.0330.0005156
rs47586210.308−0.0260.000394
rs47903100.575−0.0200.000259
rs48411320.9080.0570.0005171
rs49386420.0740.0340.000249
rs49766470.3320.0180.000147
rs4984900.164−0.0310.000382
rs557720240.242−0.0170.000132
rs564063110.3860.0180.000247
rs5677430.7080.0150.000129
rs57513500.3300.0160.000137
rs57604950.3540.0170.000141
rs57863880.5810.0220.000271
rs585798870.4040.0160.000140
rs598216840.0290.0540.000252
rs61270990.278−0.0530.0011358
rs621346790.1480.0220.000139
rs622116220.184−0.0180.000132
rs623098630.586−0.0140.000132
rs624727280.0600.0320.000136
rs6349160.511−0.0140.000131
rs6485140.467−0.0140.000130
rs65809810.458−0.0180.000252
rs669203160.196−0.0210.000145
rs67415610.393−0.0380.0007222
rs67714380.116−0.0270.000248
rs68414290.166−0.0400.0004137
rs69092010.517−0.0420.0009281
rs7102170.4850.0240.000394
rs715653930.1770.0180.000130
rs72211180.215−0.0200.000141
rs7222980.4380.0150.000134
rs726603830.064−0.0280.000130
rs726978160.1630.0200.000133
rs730010650.0710.0360.000253
rs731860300.1280.1930.00832637
rs731860980.015−0.0910.000278
rs735367520.043−0.0330.000129
rs73708770.420−0.0170.000144
rs74029770.267−0.0160.000130
rs742300870.078−0.0550.0004134
rs75333480.352−0.0210.000261
rs75468380.6510.0200.000255
rs75590130.1300.0250.000146
rs757029860.1880.0370.0004134
rs75876360.529−0.0160.000138
rs758954300.0330.0800.0004126
rs75922160.869−0.0200.000130
rs75990.634−0.0190.000255
rs76885740.3690.0150.000132
rs77303440.2930.0170.000140
rs775421620.023−0.0890.0004113
rs7775880.578−0.0290.0004126
rs7783680.585−0.0140.000130
rs77863680.416−0.0240.000390
rs78641560.3900.0190.000255
rs79130720.859−0.0210.000133
rs79247370.349−0.0150.000134
rs79402150.4340.0140.000130
rs795016930.021−0.0500.000132
rs80410570.714−0.0150.000130
rs8356640.456−0.0170.000146
rs8387170.566−0.0460.0010327
rs8839510.2610.0230.000266
rs9287600.303−0.0180.000145
rs93883990.312−0.0240.000381
rs93996970.4640.0140.000132
rs94197410.4790.0150.000136
rs9458900.714−0.0170.000137
rs9493000.3800.0150.000135
rs95300.549−0.0310.0005149
rs95329580.8550.0350.000399
rs96113960.655−0.0140.000129
rs98956610.831−0.0280.000269
Table A3. The F statistics for SNPs strongly associated with parathyroid hormone.
SNPEafBetaR2F
rs108867040.4250.1210.00724
rs109027640.5760.1310.00828
rs1503502290.026−0.3880.00825
rs168955590.0430.2860.00722
rs172677300.0450.2920.00724
rs25854420.249−0.1580.00931
rs344210710.171−0.1550.00723
rs4642020.888−0.1810.00722
rs625331880.106−0.1910.00723
rs6783600.962−0.3460.00929
rs735566120.0350.3280.00724
rs75146370.788−0.1480.00724
rs7534090.2010.1510.00724
rs93166800.384−0.1370.00930
rs9504550.3170.1290.00724
Table A4. The F statistics for SNPs strongly associated with irritable bowel syndrome.
SNPEafBetaR2F
rs102759860.316−0.1130.0051028
rs109855540.3940.1030.005947
rs119520720.1130.1570.005932
rs125706770.112−0.1580.005935
rs129566890.400−0.1020.005930
rs1473671490.010−0.5210.0061042
rs1775030.358−0.1050.005951
rs455062000.0150.4160.005957
rs7358200.0012.0700.0091623
rs7636140.3290.1070.005948

References

  1. Ford, A.C.; Sperber, A.D.; Corsetti, M.; Camilleri, M. Irritable bowel syndrome. Lancet 2020, 396, 1675–1688. [Google Scholar] [CrossRef]
  2. Camilleri, M. Diagnosis and Treatment of Irritable Bowel Syndrome: A Review. JAMA 2021, 325, 865–877. [Google Scholar] [CrossRef]
  3. Black, C.; Ford, A. Global burden of irritable bowel syndrome: Trends, predictions and risk factors. Nat. Rev. Gastroenterol. Hepatol. 2020, 17, 473–486. [Google Scholar] [CrossRef]
  4. Camilleri, M.; Zhernakova, A.; Bozzarelli, I.; D’Amato, M. Genetics of irritable bowel syndrome: Shifting gear via biobank-scale studies. Nat. Rev. Gastroenterol. Hepatol. 2022, 19, 689–702. [Google Scholar] [CrossRef]
  5. Liu, Y.L.; Liu, J.S. Irritable bowel syndrome in China: A review on the epidemiology, diagnosis, and management. Chin. Med. J. 2021, 134, 1396–1401. [Google Scholar] [CrossRef]
  6. Böhn, L.; Störsrud, S.; Törnblom, H.; Bengtsson, U.; Simrén, M. Self-reported food-related gastrointestinal symptoms in IBS are common and associated with more severe symptoms and reduced quality of life. Am. J. Gastroenterol. 2013, 108, 634–641. [Google Scholar] [CrossRef] [Green Version]
  7. Bek, S.; Teo, Y.N.; Tan, X.H.; Fan, K.H.R.; Siah, K.T.H. Association between irritable bowel syndrome and micronutrients: A systematic review. J. Gastroenterol. Hepatol. 2022, 37, 1485–1497. [Google Scholar] [CrossRef] [PubMed]
  8. Gill, S.; Rossi, M.; Bajka, B.; Whelan, K. Dietary fibre in gastrointestinal health and disease. Nat. Rev. Gastroenterol. Hepatol. 2021, 18, 101–116. [Google Scholar] [CrossRef]
  9. Müller, M.; Canfora, E.E.; Blaak, E.E. Gastrointestinal Transit Time, Glucose Homeostasis and Metabolic Health: Modulation by Dietary Fibers. Nutrients 2018, 10, 275. [Google Scholar] [CrossRef] [Green Version]
  10. Bijkerk, C.J.; de Wit, N.J.; Muris, J.W.; Whorwell, P.J.; Knottnerus, J.A.; Hoes, A.W. Soluble or insoluble fibre in irritable bowel syndrome in primary care? Randomised placebo controlled trial. BMJ 2009, 339, b3154. [Google Scholar] [CrossRef]
  11. Black, C.J.; Staudacher, H.M.; Ford, A.C. Efficacy of a low FODMAP diet in irritable bowel syndrome: Systematic review and network meta-analysis. Gut 2022, 71, 1117–1126. [Google Scholar] [CrossRef] [PubMed]
  12. Matikainen, N.; Pekkarinen, T.; Ryhänen, E.M.; Schalin-Jäntti, C. Physiology of Calcium Homeostasis: An Overview. Endocrinol. Metab. Clin. N. Am. 2021, 50, 575–590. [Google Scholar] [CrossRef] [PubMed]
  13. Glabska, D.; Kolota, A.; Lachowicz, K.; Skolmowska, D.; Stachon, M.; Guzek, D. Vitamin D Supplementation and Mental Health in Inflammatory Bowel Diseases and Irritable Bowel Syndrome Patients: A Systematic Review. Nutrients 2021, 13, 3662. [Google Scholar] [CrossRef] [PubMed]
  14. Jalili, M.; Vahedi, H.; Poustchi, H.; Hekmatdoost, A. Effects of Vitamin D Supplementation in Patients with Irritable Bowel Syndrome: A Randomized, Double-Blind, Placebo-Controlled Clinical Trial. Int. J. Prev. Med. 2019, 10, 16. [Google Scholar] [CrossRef]
  15. Williams, C.E.; Williams, E.A.; Corfe, B.M. Vitamin D supplementation in people with IBS has no effect on symptom severity and quality of life: Results of a randomised controlled trial. Eur. J. Nutr. 2022, 61, 299–308. [Google Scholar] [CrossRef]
  16. Abboud, M.; Haidar, S.; Mahboub, N.; Papandreou, D.; Al Anouti, F.; Rizk, R. Association between Serum Vitamin D and Irritable Bowel Syndrome Symptoms in a Sample of Adults. Nutrients 2022, 14, 4157. [Google Scholar] [CrossRef]
  17. Emdin, C.A.; Khera, A.V.; Kathiresan, S. Mendelian Randomization. JAMA 2017, 318, 1925–1926. [Google Scholar] [CrossRef]
  18. Revez, J.A.; Lin, T.; Qiao, Z.; Xue, A.; Holtz, Y.; Zhu, Z.; Zeng, J.; Wang, H.; Sidorenko, J.; Kemper, K.E.; et al. Genome-wide association study identifies 143 loci associated with 25 hydroxyvitamin D concentration. Nat. Commun. 2020, 11, 1647. [Google Scholar] [CrossRef] [Green Version]
  19. Sun, B.B.; Maranville, J.C.; Peters, J.E.; Stacey, D.; Staley, J.R.; Blackshaw, J.; Burgess, S.; Jiang, T.; Paige, E.; Surendran, P.; et al. Genomic atlas of the human plasma proteome. Nature 2018, 558, 73–79. [Google Scholar] [CrossRef]
  20. Kurki, M.I.; Karjalainen, J.; Palta, P.; Sipilä, T.P.; Kristiansson, K.; Donner, K.; Reeve, M.P.; Laivuori, H.; Aavikko, M.; Kaunisto, M.A.; et al. FinnGen: Unique genetic insights from combining isolated population and national health register data. medRxiv 2022. [Google Scholar]
  21. Kamat, M.A.; Blackshaw, J.A.; Young, R.; Surendran, P.; Burgess, S.; Danesh, J.; Butterworth, A.S.; Staley, J.R. PhenoScanner V2: An expanded tool for searching human genotype-phenotype associations. Bioinformatics 2019, 35, 4851–4853. [Google Scholar] [CrossRef] [PubMed]
  22. Reding, K.W.; Cain, K.C.; Jarrett, M.E.; Eugenio, M.D.; Heitkemper, M.M. Relationship between patterns of alcohol consumption and gastrointestinal symptoms among patients with irritable bowel syndrome. Am. J. Gastroenterol. 2013, 108, 270–276. [Google Scholar] [CrossRef] [PubMed] [Green Version]
  23. Talley, N.J.; Powell, N.; Walker, M.M.; Jones, M.P.; Ronkainen, J.; Forsberg, A.; Kjellstrom, L.; Hellstrom, P.M.; Aro, P.; Wallner, B.; et al. Role of smoking in functional dyspepsia and irritable bowel syndrome: Three random population-based studies. Aliment Pharm. Ther. 2021, 54, 32–42. [Google Scholar] [CrossRef] [PubMed]
  24. Creed, F. Review article: The incidence and risk factors for irritable bowel syndrome in population-based studies. Aliment Pharm. Ther. 2019, 50, 507–516. [Google Scholar] [CrossRef] [PubMed]
  25. Palmer, T.M.; Lawlor, D.A.; Harbord, R.M.; Sheehan, N.A.; Tobias, J.H.; Timpson, N.J.; Davey Smith, G.; Sterne, J.A. Using multiple genetic variants as instrumental variables for modifiable risk factors. Stat. Methods Med. Res. 2012, 21, 223–242. [Google Scholar] [CrossRef] [PubMed] [Green Version]
  26. Liu, B.; Ye, D.; Yang, H.; Song, J.; Sun, X.; Mao, Y.; He, Z. Two-Sample Mendelian Randomization Analysis Investigates Causal Associations Between Gut Microbial Genera and Inflammatory Bowel Disease, and Specificity Causal Associations in Ulcerative Colitis or Crohn’s Disease. Front. Immunol. 2022, 13, 921546. [Google Scholar] [CrossRef]
  27. Pham, V.T.; Fehlbaum, S.; Seifert, N.; Richard, N.; Bruins, M.J.; Sybesma, W.; Rehman, A.; Steinert, R.E. Effects of colon-targeted vitamins on the composition and metabolic activity of the human gut microbiome—A pilot study. Gut Microbes 2021, 13, 1–20. [Google Scholar] [CrossRef]
  28. Peacock, M. Calcium metabolism in health and disease. Clin. J. Am. Soc. Nephrol. 2010, 5 (Suppl. S1), S23–S30. [Google Scholar] [CrossRef] [Green Version]
  29. Na, S.Y.; Kim, K.B.; Lim, Y.J.; Song, H.J. Vitamin D and Colorectal Cancer: Current Perspectives and Future Directions. J. Cancer Prev. 2022, 27, 147–156. [Google Scholar] [CrossRef]
  30. Huang, H.; Lu, L.; Chen, Y.; Zeng, Y.; Xu, C. The efficacy of vitamin D supplementation for irritable bowel syndrome: A systematic review with meta-analysis. Nutr. J. 2022, 21, 24. [Google Scholar] [CrossRef]
  31. Abuelazm, M.; Muhammad, S.; Gamal, M.; Labieb, F.; Amin, M.A.; Abdelazeem, B.; Brasic, J.R. The Effect of Vitamin D Supplementation on the Severity of Symptoms and the Quality of Life in Irritable Bowel Syndrome Patients: A Systematic Review and Meta-Analysis of Randomized Controlled Trials. Nutrients 2022, 14, 2618. [Google Scholar] [CrossRef] [PubMed]
  32. Wongtrakul, W.; Charoenngam, N.; Ungprasert, P. The association between irritable bowel syndrome and osteoporosis: A systematic review and meta-analysis. Osteoporos. Int. 2020, 31, 1049–1057. [Google Scholar] [CrossRef] [PubMed]
Figure 1. (Left): a schematic diagram showing three assumptions of MR; (Right): overview of the exposures and outcomes in our MR analysis. VitD, 25-Hydroxyvitamin D; Ca, calcium; PTH, parathyroid hormone; IBS, irritable bowel syndrome.
Nutrients 14 05109 g001
Figure 2. The result of MR analysis investigating the causality between IBS and VitD, Ca, and PTH using multiple approaches. VitD, 25-hydroxyvitamin D; Ca, calcium; PTH, parathyroid hormone; IBS, irritable bowel syndrome; OR, odds ratio; 95% CI, 95% confidence interval.
Nutrients 14 05109 g002
Figure 3. The result of MR analysis investigating the causality between VitD, Ca, and PTH and IBS using multiple approaches. VitD, 25-hydroxyvitamin D; Ca, calcium; PTH, parathyroid hormone; IBS, irritable bowel syndrome; 95% CI, 95% confidence interval.
Nutrients 14 05109 g003
Table 1. The information of datasets used in our study.
TraitsGWAS IDAuthorPMIDAncestorSample Size
VitDebi-a-GCST90000618Revez et al.32242144European496,946
Caukb-d-30680_irntNeale labNAEuropean315,153
PTHprot-a-2431Sun et al.29875488European3301
IBSfinn-b-K11_IBSNANAEuropean187,028
Abbreviations: VitD, 25-hydroxyvitamin D; Ca, calcium; PTH, parathyroid hormone; IBS, irritable bowel syndrome.
Table 2. The result of sensitivity analyses of MR.
Exposure-OutcomeMR-PRESSOIVW EstimatesMR-Egger Pleiotropy Test
Global p-ValueCochran’s Qp-ValueMR-Egger Interceptp-Value
VitD-IBS0.384102.680.435−0.0010.886
Ca-IBS0.670166.660.662−0.0030.417
PTH-IBS0.55512.790.4640.0020.949
IBS-VitD0.6455.3290.620−0.0020.452
IBS-Ca0.6176.5150.6870.0020.361
IBS-PTH0.4808.1000.424−0.0090.732
Abbreviations: VitD, 25-hydroxyvitamin D; Ca, calcium; PTH, parathyroid hormone; IBS, irritable bowel syndrome.
Publisher’s Note: MDPI stays neutral with regard to jurisdictional claims in published maps and institutional affiliations.

