
Assessment of Changes in Physiological Markers in Different Body Fluids at Rest and after Exercise


Abstract
:1. Introduction
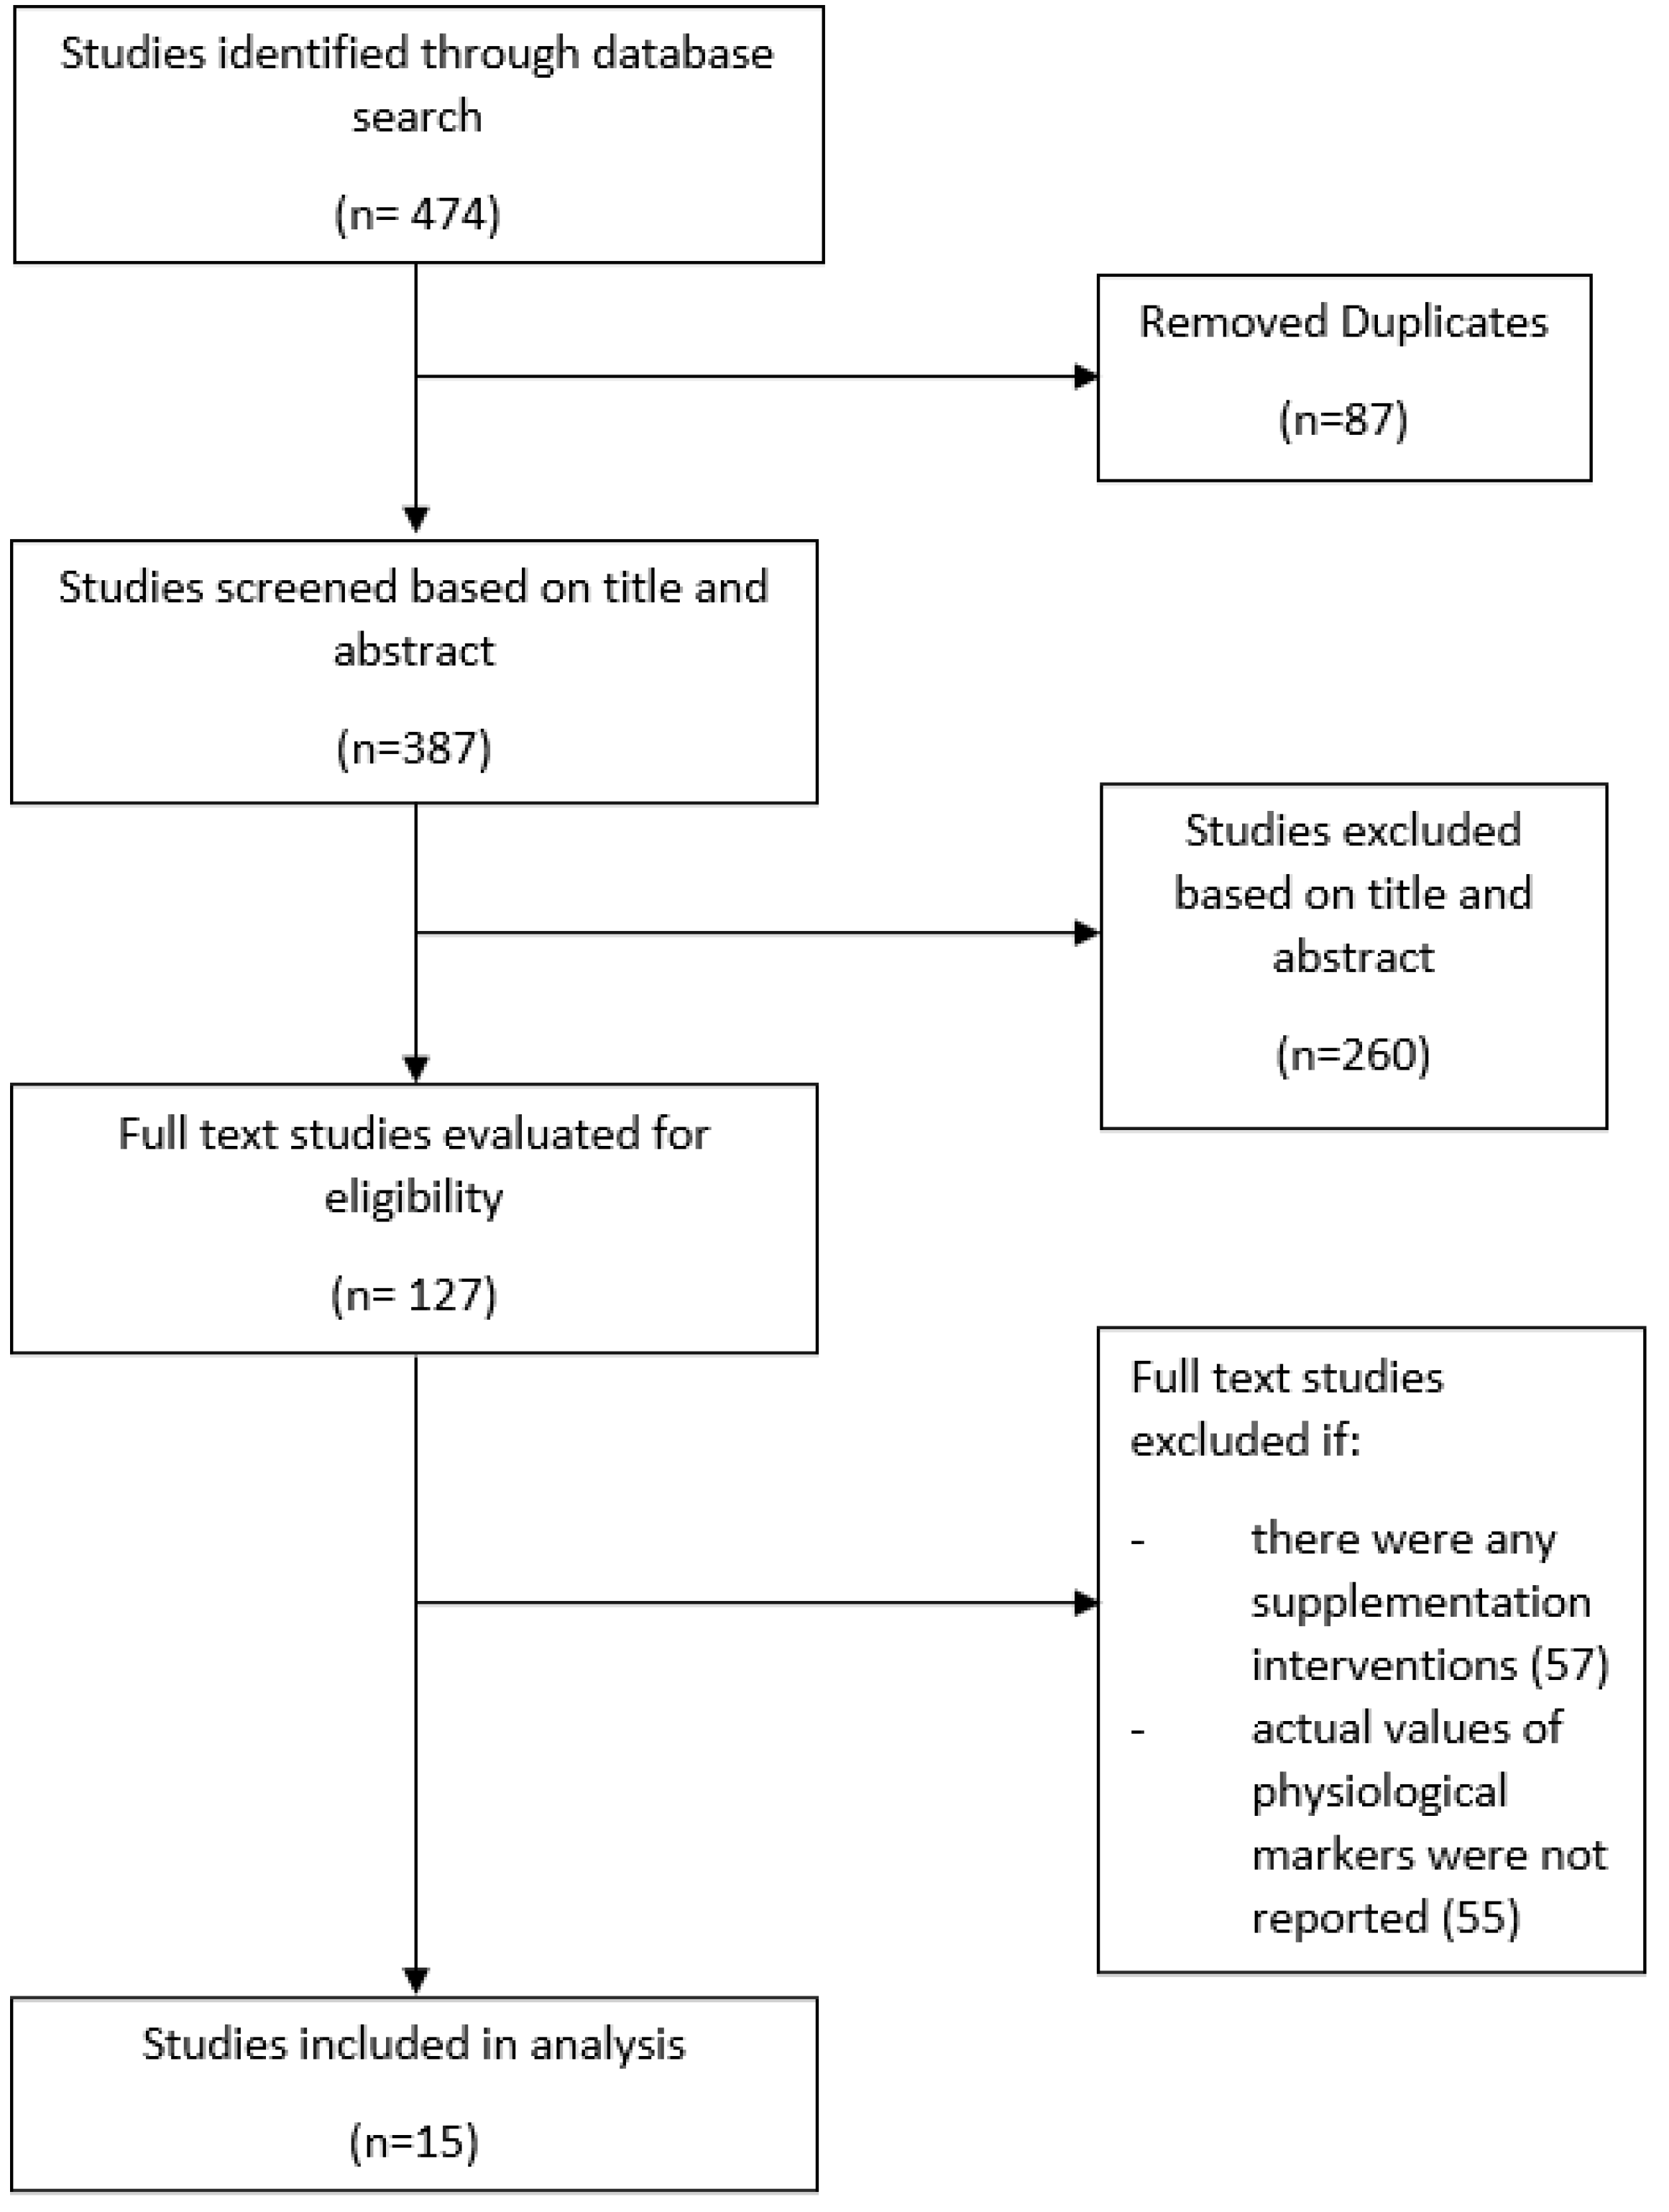
2. Materials and Methods
3. Results and Discussion
3.1. Blood (Serum and Plasma)
3.2. Urine

| Urinary Physiological Marker | Participants | Exercise Protocol [Reference] | At Rest | After Exercise | % Change | Urine Collection Method |
|---|---|---|---|---|---|---|
| Albumin | 35 M | Cycling, 80% HRmax, 30 min TT Cycling, 80% HRmax, 120 min or 3% hypohydration achieved [11] | 3.9 mg/mL | 10.0 mg/mL 32.5 mg/mL | ↑ 156 ↑ 733 | Mid-stream urine before and after race |
| Calcium | 21 M | Cross-country skiing, 70 km, 5.45 h TT [12] | 6.6 mmol/L | 2.3 mmol/L | ↓ 66 | Morning urine sample and spot urine after race |
| Chloride | 21 M | Cross-country skiing, 70 km, 5.45 h TT [12] | 131.4 mmol/L | 115.6 mmol/L | ↓ 12 | Morning urine sample and spot urine after race |
| Creatinine | 35 M | Cycling, 80% HRmax, 30 min TT Cycling, 80% HRmax, 120 min or 3% hypohydration achieved [11] | 5.0 mmol/L | 9.2 mmol/L 26.3 mmol/L | ↑ 84 ↑ 426 | Urine before and after race |
| 16 M | Running, 60 km [53] | 0.2 mmol/L | 0.2 mmol/L | ↑ 59 | Mid-stream urine before and after race | |
| 21 M | Cross-country skiing, 70 km, 5.45 h TT [12] | 19.3 mmol/L | 28.0 mmol/L | ↑ 45 | Morning urine sample and spot urine after race | |
| 24 M, F | Running, 120 km [54] | 0.1 mmol/L | 0.1 mmol/L | ↑ 56 | Mid-stream urine before and after race | |
| Cystatin C | 35 M | Cycling, 80% HRmax, 30 min TT Cycling, 80% HRmax, 120 min or 3% hypohydration achieved [11] | 0.01 mg/L | 0.03 mg/L 0.2 mg/L | ↑ 200 ↑ 1400 | Mid-stream urine before and after race |
| Glucose | 35 M | Cycling, 80% HRmax, 30 min TT Cycling, 80% HRmax, 120 min or 3% hypohydration achieved [11] | 0.1 mmol/L | 0.2 mmol/L 0.5 mmol/L | ↑ 55 ↑ 355 | Mid-stream urine before and after race |
| Magnesium | 21 M | Cross-country skiing, 70 km, 5.45 h TT [12] | 8.1 mmol/L | 2.7 mmol/L | ↓ 67 | Morning urine sample and spot urine after race |
| NGAL | 14 M, F | Running, 0.8 km [55] | The change from baseline | 12.8 ng/mL | --- | Mid-stream urine before and after race |
| 35 M | Cycling, 80% HRmax, 30 min TT Cycling, 80% HRmax, 120 min or 3% hypohydration achieved [11] | 1.0 ng/mL 11.1 ng/mL | --- | Mid-stream urine before and after race | ||
| Osmolality | 35 M | Cycling, 80% HRmax, 30 min TT Cycling, 80% HRmax, 120 min or 3% hypohydration achieved [11] | 585.0 mOsm/kg 837.0 mOsm/kg | ↑ 61 ↑ 130 | Urine before and after race | |
| Potassium | 21 M | Cross-country skiing, 70 km, 5.45 h TT [12] | 47.5 mmol/L | 137.2 mmol/L | ↑ 189 | Morning urine sample and spot urine after race |
| Sodium | 21 M | Cross-country skiing, 70 km, 5.45 h TT [12] | 151.4 mmol/L | 71.2 mmol/L | ↓ 53 | Morning urine sample and spot urine after race |
| Urea | 21 M | Cross-country skiing, 70 km, 5.45 h TT [12] | 496.8 mmol/L | 230.8 mmol/L | ↓ 54 | Morning urine sample and spot urine after race |
| Volume | 21 M | Cross-country skiing, 70 km, 5.45 h TT [12] | 200.0 ml | 135.0 ml | ↓ 33 | Morning urine sample and spot urine after race |
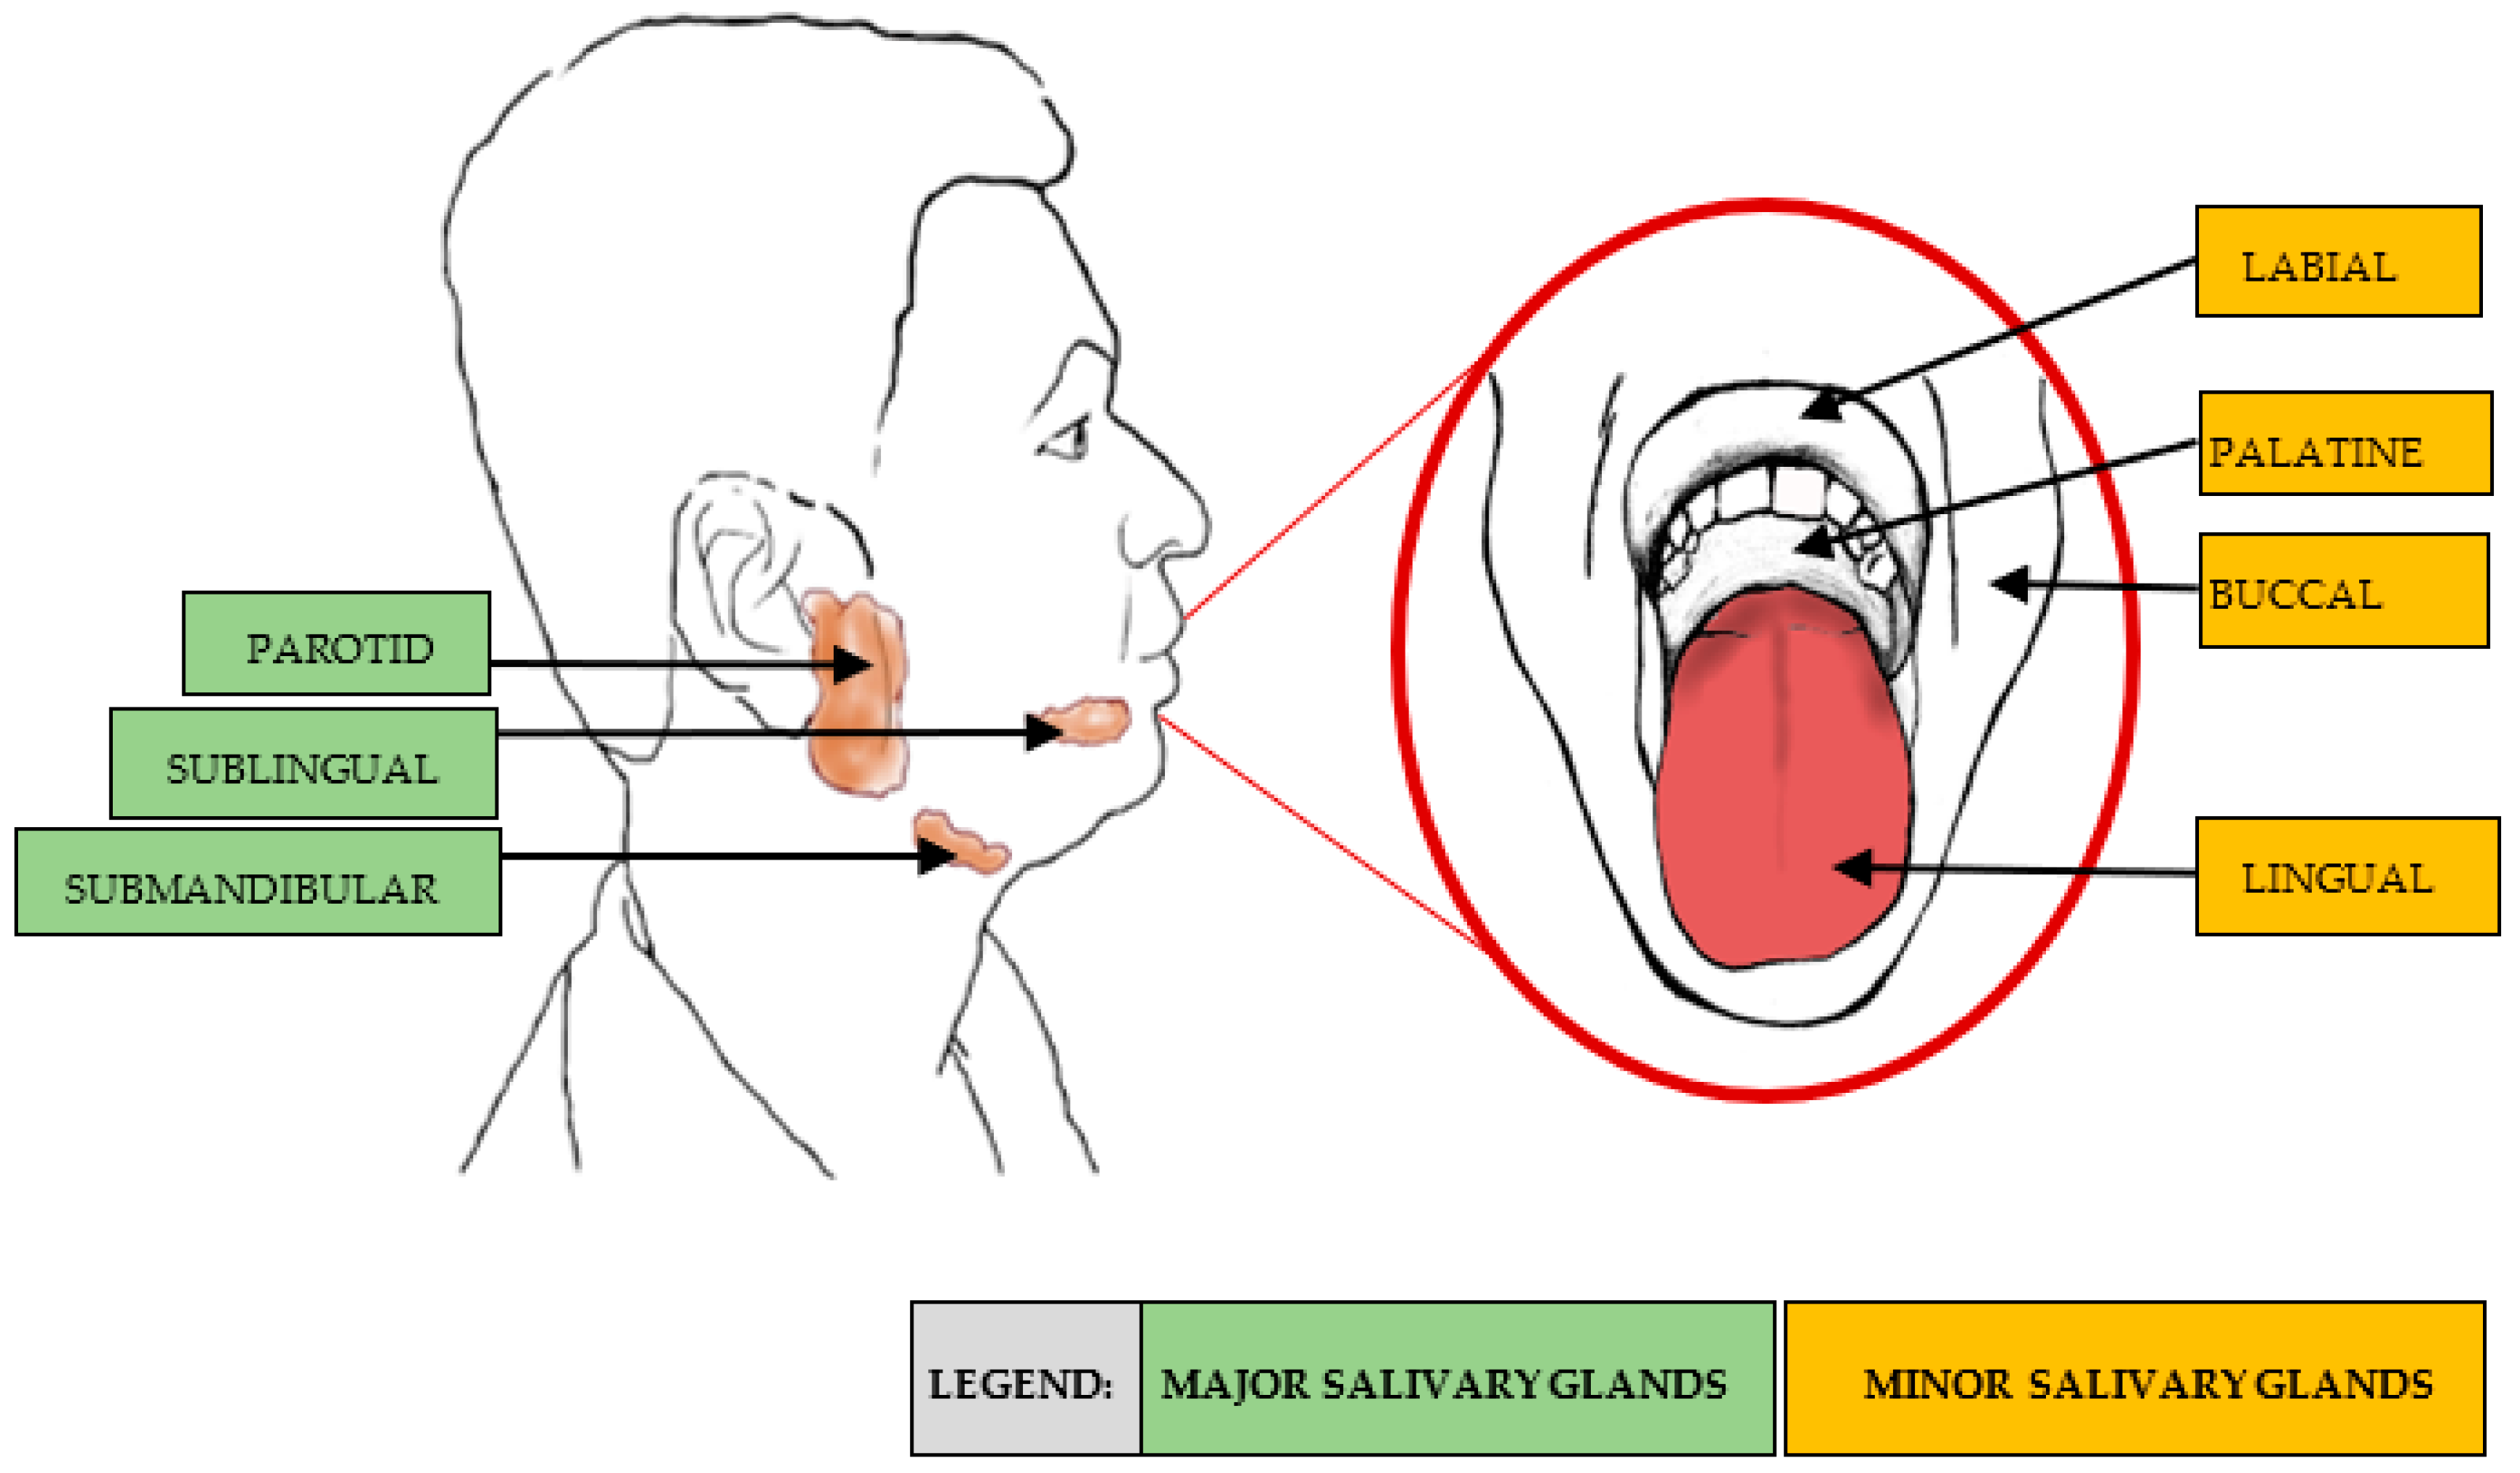
3.3. Saliva
3.4. Assessment of Key Physiological Markers before and after Exercise
3.4.1. Creatinine
3.4.2. Cystatin C
3.4.3. Albumin
3.4.4. Electrolytes
3.4.5. Cortisol
3.4.6. Other Markers
4. Limitations and Future Research
5. Conclusions
Author Contributions
Funding
Institutional Review Board Statement
Informed Consent Statement
Data Availability Statement
Acknowledgments
Conflicts of Interest
References
- Brinkman, J.E.; Dorius, B.; Sharma, S. Physiology, Body Fluids; StatPearls Publishing: Tampa, FL, USA, 2021. [Google Scholar]
- Reddi, A.S. Fluid, Electrolyte and Acid-Base Disorders: Clinical Evaluation and Management, 2nd ed.; Springer: Berlin/Heidelberg, Germany, 2018; p. 506. [Google Scholar]
- Colon, L.A. Analysis of body fluids: Urine, blood, saliva and tears. In Handbook of Capillary Electrophoresis Applications; Springer: Berlin/Heidelberg, Germany, 1997. [Google Scholar]
- Lindsay, A.; Costello, J. Realising the Potential of Urine and Saliva as Diagnostic Tools in Sport and Exercise Medicine. Sports Med. 2017, 47, 11–31. [Google Scholar] [CrossRef] [Green Version]
- Walsh, P.; Montague, J.; Callow, N.; Rowlands, A. Saliva flow rate, total protein concentration and osmolality as potential markers of whole body hydration status during progressive acute dehydration in humans. Arch. Oral Biol. 2004, 49, 149–154. [Google Scholar] [CrossRef] [PubMed]
- Mulic, A.; Tveit, A.B.; Songe, D.; Sivertsen, H.; Skaare, A.B. Dental erosive wear and salivary flow rate in physically active young adults. BMC Oral Health 2012, 12, 8. [Google Scholar] [CrossRef] [PubMed] [Green Version]
- De Bock, M.; De Seny, D.; Meuwis, M.A.; Chapelle, J.P.; Louis, E.; Malaise, M.; Merville, M.-P.; Fillet, M. Challenges for biomarker discovery in body fluids using SELDI-TOF-MS. J. Biomed. Biotechnol. 2010, 2010, 906082. [Google Scholar] [CrossRef] [PubMed]
- Saw, A.E.; Main, L.C.; Gastin, P.B. Monitoring the athlete training response: Subjective self-reported measures trump commonly used objective measures: A systematic review. Br. J. Sports Med. 2016, 50, 281–291. [Google Scholar] [CrossRef]
- VanBruggen, M.D.; Hackney, A.C.; McMurray, R.G.; Ondrak, K.S. The relationship between serum and salivary cortisol levels in response to different intensities of exercise. Int. J. Sports Physiol. Perform. 2011, 6, 396–407. [Google Scholar] [CrossRef] [Green Version]
- Blannin, A.K.; Robson, P.J.; Walsh, N.P.; Clark, A.M.; Glennon, L.; Gleeson, M. The effect of exercising to exhaustion at different intensities on saliva immunoglobulin A, protein and electrolyte secretion. Int. J. Sports Med. 1998, 19, 547–552. [Google Scholar] [CrossRef]
- Bongers, C.C.W.G.; Alsady, M.; Nijenhuis, T.; Tulp, A.D.M.; Eijsvogels, T.M.H.; Deen, P.M.T.; Hopman, M.T.E. Impact of acute versus prolonged exercise and dehydration on kidney function and injury. Physiol. Rep. 2018, 6, 13734. [Google Scholar] [CrossRef]
- Refsum, H.E.; Strömme, S.B. Relationship between urine flow, glomerular filtration, and urine solute concentrations during prolonged heavy exercise. Scand. J. Clin. Lab. Investig. Suppl. 1975, 35, 775–780. [Google Scholar] [CrossRef]
- Ezukwa, E.O.; Mabel, I.E.; Ogban, E.O.; Atim, U. Comparison of urine and blood testing for HIV among pregnant women in Calabar, Nigeria. Recent Adv. Biol. Med. 2018, 4, 33–40. [Google Scholar]
- Nunes, L.A.S.; Mussavira, S.; Bindhu, O.S. Clinical and diagnostic utility of saliva as a non-invasive diagnostic fluid: A systematic review. Biochem. Med. 2015, 25, 177–192. [Google Scholar] [CrossRef] [PubMed]
- Palacios, G.; Pedrero-Chamizo, R.; Palacios, N.; Maroto-Sánchez, B.; Aznar, S.; González-Gross, M. Biomarkers of physical activity and exercise. Nutr. Hosp. 2015, 31, 237–244. [Google Scholar] [CrossRef] [PubMed] [Green Version]
- Grant, S.M.; Green, H.J.; Phillips, S.M.; Enns, D.L.; Sutton, J.R. Fluid and electrolyte hormonal responses to exercise and acute plasma volume expansion. J. Appl. Physiol. 1996, 81, 2386–2392. [Google Scholar] [CrossRef] [PubMed] [Green Version]
- Lindsay, B.; Dawson, S.; Harwell, A.; Hopkins, R.; Kaufmann, J.; LeMaster, M.; Matern, P.; Morrison-Graham, K.; Quick, D.; Runyeon, J. Anatomy & Physiology; OpenStax Oregon State University: Corvallis, OR, USA, 2020. [Google Scholar]
- Mathew, J.; Sankar, P.; Varacallo, M. Physiology, Blood Plasma; StatPearls Publishing: Treasure Island, FL, USA, 2020. [Google Scholar]
- Mannello, F. Serum or plasma samples? The “Cinderella” role of blood collection procedures: Preanalytical methodological issues influence the release and activity of circulating matrix metalloproteinases and their tissue inhibitors, hampering diagnostic trueness and leading to misinterpretation. Arterioscler. Thromb. Vasc. Biol. 2008, 28, 611–614. [Google Scholar] [CrossRef] [PubMed] [Green Version]
- Yu, Z.; Kastenmüller, G.; He, Y.; Belcredi, P.; Möller, G.; Prehn, C.; Mendes, J.; Wahl, S.; Roemisch-Margl, W.; Ceglarek, U.; et al. Differences between human plasma and serum metabolite profiles. PLoS ONE 2011, 6, 21230. [Google Scholar] [CrossRef] [PubMed]
- Lundblad, R. Considerations for the use of blood plasma and serum for proteomic analysis. Int. J. Genom. Proteom. 2003, 1. [Google Scholar]
- Ladenson, J.H.; Tsai, L.M.; Michael, J.M.; Kessler, G.; Joist, J.H. Serum versus heparinized plasma for eighteen common chemistry tests: Is serum the appropriate specimen? Am. J. Clin. Pathol. 1974, 62, 545–552. [Google Scholar] [CrossRef]
- Lum, G.; Gambino, S.R. A comparison of serum versus heparinized plasma for routine chemistry tests. Am. J. Clin. Pathol. 1974, 61, 108–113. [Google Scholar] [CrossRef]
- Allgrove, J.; Gomes, E.; Hough, J.; Gleeson, M. Effects of exercise intensity on saliva antimicrobial proteins and markers of stress in active men. J. Sports Sci. 2008, 26, 653–661. [Google Scholar] [CrossRef]
- Sawka, M.N.; Cheuvront, S.N.; Kenefick, R.W. Hypohydration and human performance: Impact of environment and physiological mechanisms. Sports Med. 2015, 45, 51–60. [Google Scholar] [CrossRef] [Green Version]
- Green, H.J.; Thomson, J.A.; Ball, M.E.; Hughson, R.L.; Houston, M.E.; Sharratt, M.E. Alterations in blood volume following short-term supramaximal exercise. J. Appl. Physiol. 1984, 56, 145–149. [Google Scholar] [CrossRef] [PubMed]
- Fellmann, N. Hormonal and plasma volume alterations following endurance exercise. Sports Med. 1992, 13, 37. [Google Scholar] [CrossRef] [PubMed]
- Waterfield, R.L. The effects of posture on the circulating blood volume. J. Physiol. 1931, 72, 110–120. [Google Scholar] [CrossRef] [PubMed] [Green Version]
- Mingels, A.; Jacobs, L.; Kleijnen, V.; Wodzig, W.; van Dieijen-Visser, M. Cystatin c a marker for renal function after exercise. Int. J. Sports Med. 2009, 30, 668–671. [Google Scholar] [CrossRef] [PubMed]
- Kratz, A.; Lewandrowski, K.; Siegel, A.; Chun, K.; Flood, J.; Cott, E.; Lewandrowski, E. Effect of marathon running on hematologic and biochemical laboratory parameters, including cardiac markers. Am. J. Clin. Pathol. 2002, 118, 856–863. [Google Scholar] [CrossRef]
- Spada, T.C.; Silva, J.M.R.D.; Francisco, L.S.; Marçal, L.J.; Antonangelo, L.; Zanetta, D.M.T.; Yu, L.; Burdmann, E.A. High intensity resistance training causes muscle damage and increases biomarkers of acute kidney injury in healthy individuals. PLoS ONE 2018, 13, e0205791. [Google Scholar] [CrossRef]
- McCullough, P.A.; Chinnaiyan, K.M.; Gallagher, M.J.; Colar, J.M.; Geddes, T.; Gold, J.M.; Trivax, J.E. Changes in renal markers and acute kidney injury after marathon running. Nephrology 2011, 16, 194–199. [Google Scholar] [CrossRef]
- Hewing, B.; Schattke, S.; Spethmann, S.; Sanad, W.; Schroeckh, S.; Schimke, I.; Halleck, F.; Peters, H.; Brechtel, L.; Lock, J.; et al. Cardiac and renal function in a large cohort of amateur marathon runners. Cardiovasc. Ultrasound 2015, 13, 13. [Google Scholar] [CrossRef] [Green Version]
- Rose, C.; Parker, A.; Jefferson, B.; Cartmell, E. The characterization of feces and urine: A review of the literature to inform advanced treatment technology. Crit. Rev. Environ. Sci. Technol. 2015, 45, 1827–1879. [Google Scholar] [CrossRef] [Green Version]
- Ferri, F.F. Ferri’s Practical Guide: Fast Facts for Patient Care; Elsevier Mosby: Philadelphia, PA, USA, 2014. [Google Scholar]
- Stuempfle, K.J.; Drury, D.G. Comparison of 3 methods to assess urine specific gravity in collegiate wrestlers. J. Athl. Train. 2003, 38, 315–319. [Google Scholar]
- Exercise and Fluid Replacement. Med. Sci. Sports Exerc. 2007, 39, 377–390. [CrossRef] [PubMed] [Green Version]
- Nall, R.; Gotter, A. Urine Specific Gravity Test. Available online: https://www.healthline.com/health/urine-specific-gravity (accessed on 21 September 2020).
- Armstrong, L.E. Hydration assessment techniques. Nutr. Rev. 2005, 63, 40–54. [Google Scholar] [CrossRef]
- Sommerfield, L.M.; McAnulty, S.R.; McBride, J.M.; Zwetsloot, J.J.; Austin, M.D.; Mehlhorn, J.D.; Calhoun, M.C.; Young, J.O.; Haines, T.L.; Utter, A.C. Validity of Urine Specific Gravity When Compared With Plasma Osmolality as a Measure of Hydration Status in Male and Female NCAA Collegiate Athletes. J. Strength Cond. Res. 2016, 30, 2219–2225. [Google Scholar] [CrossRef]
- Poortmans, J.R. Exercise and renal function. Sports Med. 1984, 1, 125–153. [Google Scholar] [CrossRef] [PubMed]
- Kachadorian, W.A.; Johnson, R.E. Renal responses to various rates of exercise. J. Appl. Physiol. 1970, 28, 748–752. [Google Scholar] [CrossRef]
- Wade, C.E.; Claybaugh, J.R. Plasma renin activity, vasopressin concentration, and urinary excretory responses to exercise in men. J. Appl. Physiol. 1980, 49, 930–936. [Google Scholar] [CrossRef]
- Tidgren, B.; Hjemdahl, P. Reflex activation of renal nerves in humans: Differential effects on noradrenaline, dopamine and renin overflow to renal venous plasma. Acta Physiol. 1988, 134, 23–34. [Google Scholar] [CrossRef]
- Love, T.D. The Effect of Exercise on Sodium Balance in Humans. Ph.D. Thesis, Loughborough University, Loughborough, UK, 2010. [Google Scholar]
- James, L.J.; Moss, J.; Henry, J.; Papadopoulou, C.; Mears, S.A. Hypohydration impairs endurance performance: A blinded study. Physiol. Rep. 2017, 5, 13315. [Google Scholar] [CrossRef]
- Deshayes, T.A.; Jeker, D.; Goulet, E.D.B. Impact of pre-exercise hypohydration on aerobic exercise performance, peak oxygen consumption and oxygen consumption at lactate threshold: A systematic review with meta-analysis. Sports Med. 2020, 50, 581–596. [Google Scholar] [CrossRef]
- Shirreffs, S.M.; Merson, S.J.; Fraser, S.M.; Archer, D.T. The effects of fluid restriction on hydration status and subjective feelings in man. Br. J. Nutr. 2004, 91, 951–958. [Google Scholar] [CrossRef]
- Hew-Butler, T.D.; Eskin, C.; Bickham, J.; Rusnak, M.; VanderMeulen, M. Dehydration is how you define it: Comparison of 318 blood and urine athlete spot checks. BMJ Open Sport Amp. Exerc. Med. 2018, 4, e000297. [Google Scholar] [CrossRef] [PubMed] [Green Version]
- Rabinovitch, A.; Sarewitz, S.; Woodcock, S.; Allinger, D.; Azar, M.; Dynek, D.; Robinowitz, M.; Slade, B. Urinalysis and Collection, Transportation, and Preservation of Urine Specimens; NCCLS: Wayne, PA, USA, 2001; Volume 21, p. 40. [Google Scholar]
- Bakońska-Pacoń, E.; Borkowski, J. The effect of the physical effort on the activity of brush border enzymes and lysosomal enzymes of nephron excreted in the urine. Biol. Sport 2003, 20, 69–78. [Google Scholar]
- Bakońska-Pacoń, E. Creatinine clearance and 24-hour creatinine excretion profile in the urine of people after physical exercises. Biol. Sport 2006, 23, 157–170. [Google Scholar]
- Lippi, G.; Sanchis-Gomar, F.; Salvagno, G.L.; Aloe, R.; Schena, F.; Guidi, G.C. Variation of serum and urinary neutrophil gelatinase associated lipocalin (NGAL) after strenuous physical exercise. Clin. Chem. Lab. Med. 2012, 50, 1585–1589. [Google Scholar] [CrossRef]
- Poussel, M.; Touzé, C.; Allado, E.; Frimat, L.; Hily, O.; Thilly, N.; Rousseau, H.; Vauthier, J.-C.; Chenuel, B. Ultramarathon and renal function: Does exercise-induced acute kidney injury really exist in common conditions? Front. Sports Act. Living 2020, 1, 71. [Google Scholar] [CrossRef] [PubMed]
- Junglee, N.A.; Lemmey, A.B.; Burton, M.; Searell, C.; Jones, D.; Lawley, J.S.; Jibani, M.M.; Macdonald, J.H. Does proteinuria-inducing physical activity increase biomarkers of acute kidney injury? Kidney Blood Press. Res. 2012, 36, 278–289. [Google Scholar] [CrossRef] [PubMed]
- De Almeida Pdel, V.; Grégio, A.M.; Machado, M.A.; De Lima, A.A.; Azevedo, L.R. Saliva composition and functions: A comprehensive review. J. Contemp. Dent. Pract. 2008, 9, 72–80. [Google Scholar]
- Denny, P.; Hagen, F.K.; Hardt, M.; Liao, L.; Yan, W.; Arellanno, M.; Bassilian, S.; Bedi, G.S.; Boontheung, P.; Cociorva, D.; et al. The proteomes of human parotid and submandibular/sublingual gland salivas collected as the ductal secretions. J. Proteome Res. 2008, 7, 1994–2006. [Google Scholar] [CrossRef] [Green Version]
- Saitou, M.; Gaylord, E.A.; Xu, E.; May, A.J.; Neznanova, L.; Nathan, S.; Grawe, A.; Chang, J.; Ryan, W.; Ruhl, S.; et al. Functional specialization of human salivary glands and origins of proteins intrinsic to human saliva. Cell Rep. 2020, 33, 108402. [Google Scholar] [CrossRef]
- Kumar, B. The composition, function and role of saliva in maintaining oral health: A review. Int. J. Contemp. Dent. Med. Rev. 2017, 220, 140–640. [Google Scholar] [CrossRef]
- Pedersen, A.M.L.; Bardow, A.; Nauntofte, B. Salivary changes and dental caries as potential oral markers of autoimmune salivary gland dysfunction in primary Sjogren’s syndrome. BMC Clin. Pathol 2005, 5, 4. [Google Scholar] [CrossRef] [PubMed] [Green Version]
- Baum, B.J. Principles of saliva secretion. Ann. N. Y. Acad. Sci. 1993, 694, 17–23. [Google Scholar] [CrossRef] [PubMed]
- Jacobsen, N.; Melvaer, K.L.; Hensten-Pettersen, A. Some properties of salivary amylase: A survey of the literature and some observations. J. Dent. Res. 1972, 51, 381–388. [Google Scholar] [CrossRef] [PubMed]
- Scannapieco, F.A.; Torres, G.; Levine, M.J. Salivary alpha-amylase: Role in dental plaque and caries formation. Crit. Rev. Oral Biol. Med. 1993, 4, 301–307. [Google Scholar] [CrossRef] [Green Version]
- Rutherfurd-Markwick, K.; Starck, C.; Dulson, D.; Ali, A. Comparison of three saliva collection methods to assess physiological markers. J. Nutr. Metab. 2020, 47, 777–780. [Google Scholar] [CrossRef]
- Lorgulescu, G. Saliva between normal and pathological. Important factors in determining systemic and oral health. J. Med. Life 2009, 2, 303–307. [Google Scholar]
- Bellagambi, F.; Lomonaco, T.; Salvo, P.; Vivaldi, F.M.; Hangouët, M.; Ghimenti, S.; Biagini, D.; Di Francesco, F.; Fuoco, R.; Errachid, A. Saliva sampling: Methods and devices. An overview. Trends Analyt. Chem. 2019, 124, 115781. [Google Scholar] [CrossRef]
- Dawes, C.; Watanabe, S. The effect of taste adaptation on salivary flow rate and salivary sugar clearance. J. Dent. Res. 1987, 66, 740–744. [Google Scholar] [CrossRef]
- Humphrey, S.P.; Williamson, R.T. A review of saliva: Normal composition, flow, and function. J. Prosthet. Dent. 2001, 85, 162–169. [Google Scholar] [CrossRef]
- Navazesh, M. Methods for collecting saliva. Ann. N. Y. Acad. Sci. 1993, 694, 72–77. [Google Scholar] [CrossRef]
- Harmon, A.; Towe-Goodman, N.; Fortunato, C.; Granger, D. Differences in saliva collection location and disparities in baseline and diurnal rhythms of alpha-amylase: A preliminary note of caution. Horm. Behav. 2008, 54, 592–596. [Google Scholar] [CrossRef] [PubMed]
- Chicharro, J.L.; Lucía, A.; Pérez, M.; Vaquero, A.F.; Ureña, R. Saliva composition and exercise. Sports Med. 1998, 26, 17–27. [Google Scholar] [CrossRef] [PubMed]
- Li, T.; Gleeson, M. The effect of single and repeated bouts of prolonged cycling and circadian variation on saliva flow rate, immunoglobulin A and alpha-amylase responses. J. Sports Sci. 2004, 22, 1015–1024. [Google Scholar] [CrossRef] [PubMed]
- Walsh, N.P.; Laing, S.J.; Oliver, S.J.; Montague, J.C.; Walters, R.; Bilzon, J.L.J. Saliva parameters as potential indices of hydration status during acute dehydration. Med. Sci. Sports Exerc. 2004, 36, 1535–1542. [Google Scholar] [CrossRef] [PubMed]
- Gleeson, M.; McDonald, W.A.; Pyne, D.B.; Clancy, R.L.; Cripps, A.W.; Francis, J.L.; Fricker, P.A. Immune status and respiratory illness for elite swimmers during a 12-week training cycle. Int. J. Sports Med. 2000, 21, 302–307. [Google Scholar] [CrossRef] [Green Version]
- Laing, S.J.; Gwynne, D.; Blackwell, J.; Williams, M.; Walters, R.; Walsh, N.P. Salivary IgA response to prolonged exercise in a hot environment in trained cyclists. Eur. J. Appl. Physiol. 2005, 93, 665–671. [Google Scholar] [CrossRef]
- Nieman, D.C.; Henson, D.A.; Fagoaga, O.R.; Utter, A.C.; Vinci, D.M.; Davis, J.M.; Nehlsen-Cannarella, S.L. Change in salivary IgA following a competitive marathon race/modification des immunoglobulines IgA salivaires apres une competition de marathon. Int. J. Sports Med. 2002, 23, 69–75. [Google Scholar] [CrossRef]
- Rutherfurd-Markwick, K.; Starck, C.; Dulson, D.K.; Ali, A. Salivary diagnostic markers in males and females during rest and exercise. J. Int. Soc. Sports Nutr. 2017, 14, 27. [Google Scholar] [CrossRef] [Green Version]
- Allen, P.J. Creatine metabolism and psychiatric disorders: Does creatine supplementation have therapeutic value? Neurosci. Biobehav. Rev. 2012, 36, 1442–1462. [Google Scholar] [CrossRef] [Green Version]
- Banfi, G. Serum creatinine concentrations in athletes: Are they normal? Braz. J. Biomotricity 2010, 4, 157–164. [Google Scholar]
- Mandal, A. What is creatinine? News-Med. 2019. Available online: https://webstore.ansi.org/preview-pages/CLSI/preview_GP16-A2.pdf (accessed on 21 September 2020).
- Warburton, D.E.R.; Welsh, R.C.; Haykowsky, M.J.; Taylor, D.A.; Humen, D.P. Biochemical changes as a result of prolonged strenuous exercise. Br. J. Sports Med. 2002, 36, 301–303. [Google Scholar] [CrossRef] [Green Version]
- Refsum, H.E.; Strömme, S.B. Urea and creatinine production and excretion in urine during and after prolonged heavy exercise. Scand. J. Clin. Lab. Investig. 1974, 33, 247–254. [Google Scholar] [CrossRef]
- Milić, R.; Banfi, G.; Del Fabbro, M.; Dopsaj, M. Serum creatinine concentrations in male and female elite swimmers. Correlation with body mass index and evaluation of estimated glomerular filtration rate. Clin. Chem. Lab. Med. 2010, 49, 285–289. [Google Scholar] [CrossRef] [PubMed]
- Banfi, G.; Del Fabbro, M.; Lippi, G. Relation between serum creatinine and body mass index in elite athletes of different sport disciplines. Br. J. Sports Med. 2006, 40, 675–678. [Google Scholar] [CrossRef] [PubMed] [Green Version]
- Chew, J.S.C.; Saleem, M.; Florkowski, C.M.; George, P.M. Cystatin C--a paradigm of evidence based laboratory medicine. Clin. Biochem. Rev. 2008, 29, 47–62. [Google Scholar]
- Gounden, V.; Bhatt, H.; Jialal, I. Renal Function Tests. In StatPearls; StatPearls Publishing: Tampa, FL, USA, 2020. [Google Scholar]
- Fagerstrom, P.; Sallsten, G.; Akerstrom, M.; Haraldsson, B.; Barregard, L. Urinary albumin excretion in healthy adults: A cross sectional study of 24-hour versus timed overnight samples and impact of GFR and other personal characteristics. BMC Nephrol. 2015, 16, 8. [Google Scholar] [CrossRef] [Green Version]
- Banfi, G.; Del Fabbro, M.; d‘Eril, G.M.; Melegati, G. Reliability of cystatin C in estimating renal function in rugby players. Ann. Clin. Biochem. 2009, 46, 428. [Google Scholar] [CrossRef] [Green Version]
- Wołyniec, W.; Ratkowski, W.; Renke, J.; Renke, M. Changes in novel AKI biomarkers after exercise. A systematic review. Int. J. Mol. Sci. 2020, 21, 5673. [Google Scholar] [CrossRef]
- Busher, J.T. Serum Albumin and Globulin. In Clinical Methods: The History, Physical, and Laboratory Examinations; Walker, H.K., Hall, W.D., Hurst, J.W., Eds.; Butterworths: Boston, MA, USA, 1990. [Google Scholar]
- Mclaren, D.S.; Kamel, W.W.; Ayyoub, N. Plasma amino acids and the detection of protein-calorie malnutrition. Am. J. Clin. Nutr. 1965, 17, 152–157. [Google Scholar] [CrossRef]
- Krämer, B.K.; Kernz, M.; Ress, K.M.; Pfohl, M.; Müller, G.A.; Schmülling, R.M.; Risler, T. Influence of strenuous exercise on albumin excretion. Clin. Chem. 1988, 34, 2516–2518. [Google Scholar] [CrossRef] [PubMed]
- James, W.P.; Hay, A.M. Albumin metabolism: Effect of the nutritional state and the dietary protein intake. J. Clin. Investig. 1968, 47, 1958–1972. [Google Scholar] [CrossRef] [PubMed] [Green Version]
- Foran, S.E.; Lewandrowski, K.B.; Kratz, A. Effects of exercise on laboratory test results. Lab. Med. 2003, 34, 736–742. [Google Scholar] [CrossRef]
- Poortmans, J.R.; Haggenmacher, C.; Vanderstraeten, J. Postexercise proteinuria in humans and its adrenergic component. J. Sports Med. Phys. Fit. 2001, 41, 95–100. [Google Scholar]
- Clerico, A.; Giammattei, C.; Cecchini, L.; Lucchetti, A.; Cruschelli, L.; Penno, G.; Gregori, G.; Giampietro, O. Exercise-induced proteinuria in well-trained athletes. Clin. Chem. 1990, 36, 562–564. [Google Scholar] [CrossRef]
- Poortmans, J.R. Effect of exercise on the renal clearance of amylase and lysozyme in humans. Clin. Sci. 1972, 43, 115–120. [Google Scholar] [CrossRef]
- Robertshaw, M.; Cheung, C.K.; Fairly, I.; Swaminathan, R. Protein Excretion after Prolonged Exercise. Ann. Clin. Biochem. 1993, 30, 34–37. [Google Scholar] [CrossRef]
- Garrett, W.E.; Kirkendall, D.T.; Squire, D.L. Principles and practice of primary care sports medicine. J. Bone Jt. Surg. 2002, 84-B, 152. [Google Scholar] [CrossRef]
- Lee, E.C.; Fragala, M.S.; Kavouras, S.A.; Queen, R.M.; Pryor, J.L.; Casa, D.J. Biomarkers in sports and exercise: Tracking health, performance, and recovery in athletes. J. Strength Cond. Res. 2017, 31, 2920–2937. [Google Scholar] [CrossRef] [Green Version]
- Saeed, F.; Devaki, P.; Mahendrakar, L.; Holley, J. Exercise-induced proteinuria? Fam. Pract. 2012, 61, 23–26. [Google Scholar]
- Shirreffs, S.; Sawka, M. Fluid and electrolyte needs for training, competition, and recovery. J. Sports Sci. 2011, 29, 39–46. [Google Scholar] [CrossRef] [PubMed]
- Institute of Medicine, IOM. Dietary Reference Intakes for Water, Potassium, Sodium, Chloride, and Sulfate; The National Academies Press: Washington, DC, USA, 2005. [Google Scholar]
- Cohen, I.; Zimmerman, A.L. Changes in serum electrolyte levels during marathon running. S. Afr. Med. J. 1978, 53, 449–453. [Google Scholar]
- Kraemer, R.R.; Brown, B.S. Alterations in plasma-volume-corrected blood components of marathon runners and concomitant relationship to performance. Eur. J. Appl. Physiol. Occup. Physiol. 1986, 55, 579–584. [Google Scholar] [CrossRef] [PubMed]
- Rose, L.I.; Carroll, D.R.; Lowe, S.L.; Peterson, E.W.; Cooper, K.H. Serum electrolyte changes after marathon running. J. Appl. Physiol. 1970, 29, 449–451. [Google Scholar] [CrossRef] [PubMed]
- Nelson, P.B.; Ellis, D.; Fu, F.; Bloom, M.D.; O’Malley, J. Fluid and electrolyte balance during a cool weather marathon. Am. J. Sports Med. 1989, 17, 770–772. [Google Scholar] [CrossRef]
- Lindinger, M.; Sjøgaard, G. Potassium regulation during exercise and recovery. Sports Med. 1991, 11, 382–401. [Google Scholar] [CrossRef]
- Patlar, S.; Unsal, S. RAA System and Exercise Relationship. Turk. J. Sports Med. 2019, 21, 261–269. [Google Scholar] [CrossRef]
- Viru, A.; Viru, M. Cortisol--essential adaptation hormone in exercise. Int. J. Sports Med. 2004, 25, 461–464. [Google Scholar] [CrossRef]
- Hackney, A.C. Stress and the neuroendocrine system: The role of exercise as a stressor and modifier of stress. Expert Rev. Endocrinol. Metab. 2006, 1, 783–792. [Google Scholar] [CrossRef] [Green Version]
- Van Der Spek, R.; Kreier, F.; Fliers, E.; Kalsbeek, A. Progress in Brain Research; Kalsbeek, A., Merrow, M., Roenneberg, T., Foster, R.G., Eds.; Elsevier: Amsterdam, The Netherlands, 2012; Volume 199, pp. 183–201. [Google Scholar]
- El-Farhan, N.; Rees, D.A.; Evans, C. Measuring cortisol in serum, urine and saliva—Are our assays good enough? Ann. Clin. Biochem. 2017, 54, 308–322. [Google Scholar] [CrossRef] [Green Version]
- Gatti, R.; De Palo, E.F. An update: Salivary hormones and physical exercise. Scand. J. Clin. Lab. Invest. Suppl. 2010, 21, 157–169. [Google Scholar] [CrossRef] [PubMed]
- Tremblay, M.S.; Copeland, J.L.; Van Helder, W. Effect of training status and exercise mode on endogenous steroid hormones in men. J. Appl. Physiol. 2004, 96, 531–539. [Google Scholar] [CrossRef] [PubMed] [Green Version]
- Jacks, D.E.; Sowash, J.; Anning, J.; McGloughlin, T.; Andres, F. Effect of exercise at three exercise intensities on salivary cortisol. J. Strength Cond. Res. 2002, 16, 286–289. [Google Scholar] [PubMed]
- Touitou, Y.; Haus, E. Alterations with aging of the endocrine and neuroendocrine system in humans. Chronobiol. Int. 2000, 17, 369–390. [Google Scholar] [CrossRef] [PubMed]
- Papacosta, E.; Nassis, G.P. Saliva as a tool for monitoring steroid, peptide and immune markers in sport and exercise science. J. Sci. Med. Sport 2011, 14, 424–434. [Google Scholar] [CrossRef] [PubMed]
- Urhausen, A.; Gabriel, H.H.; Kindermann, W. Impaired pituitary hormonal response to exhaustive exercise in overtrained endurance athletes. Med. Sci. Sports Exerc. 1998, 30, 407–414. [Google Scholar] [CrossRef]
- Urhausen, A.; Kindermann, W. Diagnosis of Overtraining. Sports Med. 2002, 32, 95–102. [Google Scholar] [CrossRef]
- Ushiki, K.; Tsunekawa, K.; Shoho, Y.; Martha, L.; Ishigaki, H.; Matsumoto, R.; Yanagawa, Y.; Nakazawa, A.; Yoshida, A.; Nakajima, K.; et al. Assessment of exercise-induced stress by automated measurement of salivary cortisol concentrations within the circadian rhythm in Japanese female long-distance runners. Sports Med. 2020, 6, 38. [Google Scholar] [CrossRef]
- Vining, R.F.; McGinley, R.A.; Maksvytis, J.J.; Ho, K.Y. Salivary cortisol: A better measure of adrenal cortical function than serum cortisol. Ann. Clin. Biochem. 1983, 20, 329–335. [Google Scholar] [CrossRef] [Green Version]
- Turpeinen, U.; Hämäläinen, E. Determination of cortisol in serum, saliva and urine. Best Pract. Res. Clin. Endocrinol. Metab. 2013, 27, 795–801. [Google Scholar] [CrossRef]
- Vining, R.F.; McGinley, R.A.; Symons, R.G. Hormones in saliva: Mode of entry and consequent implications for clinical interpretation. Clin. Chem. 1983, 29, 1752–1756. [Google Scholar] [CrossRef] [PubMed]
- Stupnicki, R.; Obminski, Z. Glucocorticoid response to exercise as measured by serum and salivary cortisol. Eur. J. Appl. Physiol. 1992, 65, 546–549. [Google Scholar] [CrossRef] [PubMed]
- Port, K. Serum and saliva cortisol responses and blood lactate accumulation during incremental exercise testing. Int. J. Sports Med. 1991, 12, 490–494. [Google Scholar] [CrossRef] [PubMed]
- Umeda, T.; Hiramatsu, R.; Iwaoka, T.; Shimada, T.; Miura, F.; Sato, T. Use of saliva for monitoring unbound free cortisol levels in serum. Clin. Chim. Acta 1981, 110, 245–253. [Google Scholar] [CrossRef] [PubMed]
- Poll, E.-M.; Kreitschmann-Andermahr, I.; Langejuergen, Y.; Stanzel, S.; Gilsbach, J.M.; Gressner, A.; Yagmur, E. Saliva collection method affects predictability of serum cortisol. Clin. Chim. Acta 2007, 382, 15–19. [Google Scholar] [CrossRef]
- Sokal, P.; Jastrzębski, Z.; Jaskulska, E.; Sokal, K.; Jastrzębska, M.; Radzimiński, Ł.; Dargiewicz, R.; Zieliński, P. Differences in Blood Urea and Creatinine Concentrations in Earthed and Unearthed Subjects during Cycling Exercise and Recovery. Evid. Based Complement. Altern. Med. 2013, 2013, 382643. [Google Scholar] [CrossRef]
- Steerenberg, P.A.; Van, I.A.; Van, A.; Biewenga, A.; Mol, D.; Medema, G.J. Salivary levels of immunoglobulin A in triathletes. Eur. J. Oral Sci. 1997, 105, 305–309. [Google Scholar] [CrossRef]
- Libicz, S.; Mercier, B.; Bigou, N.; Le Gallais, D.; Castex, F. Salivary IgA response of triathletes participating in the French Iron Tour. Int. J. Sports Med. 2006, 27, 389–394. [Google Scholar] [CrossRef]
- Farzanaki, P.; Azarbayjani, M.A.; Rassaee, M.; Ostojic, S.; Stannard, S.; Jourkesh, M. Salivary immunoglobulin A and cortisol response to training in young elite female gymnasts. Braz. J. Biomotricity 2008, 2, 252–258. [Google Scholar]
- Nauta, F.L.; Scheven, L.; Meijer, E.; van Oeveren, W.; de Jong, P.E.; Bakker, S.J.L.; Gansevoort, R.T. Glomerular and tubular damage markers in individuals with progressive albuminuria. Clin. J. Am. Soc. Nephrol. 2013, 8, 1106–1114. [Google Scholar] [CrossRef] [Green Version]
- Brodehl, J.; Oemar, B.S.; Hoyer, P.F. Renal glucosuria. Pediatr. Nephrol. 1987, 1, 502–508. [Google Scholar] [CrossRef] [PubMed]
- Bi, H.; Guo, Z.; Jia, X.; Liu, H.; Ma, L.; Xue, L. The key points in the pre-analytical procedures of blood and urine samples in metabolomics studies. Metabolomics 2020, 16, 68. [Google Scholar] [CrossRef] [PubMed]
- Popowski, L.A.; Oppliger, R.A.; Patrick Lambert, G.; Johnson, R.F.; Kim Johnson, A.; Gisolf, C.V. Blood and urinary measures of hydration status during progressive acute dehydration. Med. Sci. Sports Exerc. 2001, 33, 747–753. [Google Scholar] [CrossRef] [PubMed]
- Kang, J.-H.; Kho, H.-S. Blood contamination in salivary diagnostics: Current methods and their limitations. Clin. Chem. Lab. Med. 2019, 57, 1115–1124. [Google Scholar] [CrossRef]
- Sun, W.; Chen, Y.; Li, F.; Zhang, L.; Yang, R.; Zhang, Z.; Zheng, D.; Gao, Y. Dynamic urinary proteomic analysis reveals stable proteins to be potential biomarkers. Proteom. Clin. Appl. 2009, 3, 370–382. [Google Scholar] [CrossRef]
- Pedlar, C.R.; Newell, J.; Lewis, N.A. Blood Biomarker Profiling and Monitoring for High-Performance Physiology and Nutrition: Current Perspectives, Limitations and Recommendations. Sports Med. 2019, 49, 185–198. [Google Scholar] [CrossRef] [Green Version]
- Villiger, M.; Stoop, R.; Vetsch, T.; Hohenauer, E.; Pini, M.; Clarys, P.; Pereira, F.; Clijsen, R. Evaluation and review of body fluids saliva, sweat and tear compared to biochemical hydration assessment markers within blood and urine. Eur. J. Clin. Nutr. 2018, 72, 69–76. [Google Scholar] [CrossRef]


| Physiological Marker | Participants | Exercise Protocol [Reference] | At Rest | After Exercise | % Change | Blood Matrix |
|---|---|---|---|---|---|---|
| Albumin | 70 M | Running, 222.6 min TT [29] | 44.0 g/l | 48.2 g/l | ↑ 10 | Serum |
| 37 M, F | Running, 240 min TT [30] | 40.0 g/l | 45.0 g/l | ↑ 13 | Serum | |
| Calcium | 21 M | Cross-country skiing, 70 km, 5.45 h TT [12] | 2.4 mmol/L | 2.4 mmol/L | ↓ 0.4 | Serum |
| Chloride | 21 M | Cross-country skiing, 70 km, 5.45 h TT [12] | 106.5 mmol/L | 106.2 mmol/L | ↓ 0.3 | Serum |
| 37 M, F | Running, 240 min [30] | 105.7 mmol/L | 101.0 mmol/L | ↓ 4 | Serum | |
| Cortisol | 12 M | Cycling, 40% of VO2max Cycling, 60% of VO2max Cycling, 80% of VO2max [9] | 394.5 nmol/l 386.2 nmol/l 336.6 nmol/l | 380.7 nmol/l 446.9 nmol/l 565.5 nmol/l | ↓ 4 ↑ 16 ↑ 68 | Serum |
| Creatinine | 70 M | Running, 222.6 min TT [29] | 0.1 mmol/L | 0.1 mmol/L | ↑ 44 | Serum |
| 37 M, F | Running, 240 min [30] | 0.1 mmol/L | 0.1 mmol/L | ↑ 30 | Serum | |
| 21 M | Cross-country skiing, 70 km, 5.45 h TT [12] | 0.1 mmol/L | 0.2 mmol/L | ↑ 65 | Serum | |
| 58 M, F | Squat exercise, 4 min TT [31] | 0.1 mmol/L | 0.08 mmol/L | ↓ 1 | Serum | |
| Cystatin C | 70 M | Running, 222.6 min TT [29] | 0.7 mg/l | 1.0 mg/l | ↑ 34 | Serum |
| 25 M, F | Running, 256.2 min TT [32] | 0.8 mg/l | 1.0 mg/l | ↑ 25 | Serum | |
| 167 M, F | Running, 263.0 min TT [33] | 0.7 mg/l | 0.9 mg/l | ↑ 25 | Serum | |
| Hemoglobin | 35 M | Cycling, 80% HRmax, 30 min TT Cycling, 80% HRmax, 120 min or 3% hypohydration achieved [11] | 9.2 mmol/L | 9.6 mmol/L 9.7 mmol/L | ↑ 4 ↑ 5 | Plasma |
| 37 M, F | Running, 240 min TT [30] | 9.2 mmol/L | 9.4 mmol/L | ↑ 2 | Serum | |
| Magnesium | 21 M | Cross-country skiing, 70 km, 5.45 h TT [12] | 0.9 mmol/L | 0.8 mmol/L | ↓ 9 | Serum |
| 37 M, F | Running, 240 min TT [30] | 1.7 mmol/L | 1.5 mmol/L | ↓ 12 | Serum | |
| Potassium | 37 M, F | Cross-country skiing, 70 km, 5.45 h TT [12] | 4.4 mmol/L | 4.7 mmol/L | ↑ 8 | Serum |
| Sodium | 35 M | Cycling, 80% HRmax, 30 min TT Cycling, 80% HRmax, 120 min or 3% hypohydration achieved [11] | 142.2 mmol/L | 141.9 mmol/L 144.0 mmol/L | ↓ 0.2 ↑ 1 | Serum |
| 21 M | Cross-country skiing, 70 km, 5.45 h TT [12] | 138.7 mmol/L | 140.1 mmol/L | ↑ 1 | Serum | |
| 25 M, F | Running, 240 min TT [30] | 142.4 mmol/L | 141.5 mmol/L (4 h) 139.0 mmol/L (24 h) | ↓ 0.6 ↓ 2 | Serum | |
| Urea | 21 M | Cross-country skiing, 70 km, 5.45 h TT [12] | 5.7 mmol/L | 9.0 mmol/L | ↑ 56 | Serum |
| Salivary Gland | Location | Composition | Contribution during Unstimulated Flow |
|---|---|---|---|
| Parotid | Side of the face, below and in front of each ear | Serous saliva: a watery secretion rich in enzymes, e.g., amylase and proline-rich proteins (PRP) | 20% |
| Submandibular | Near the inner side of the lower jawbone, in front of the sternomastoid muscle | Mixed secretion that is both serous and mucous | 65% |
| Sublingual | Directly under the mucous membrane covering the floor of the mouth beneath the tongue | Mucous saliva: a viscous secretion containing no enzymes and large amounts of mucus | 7–8% |
| Minor salivary glands | Spread throughout the submucosa of the sinonasal cavity, oral cavity, pharynx, larynx, trachea, lungs, and middle ear cavity | Secretion that is dependent on location; includes pure mucous or serous, or mixed secretion | 10% |
| Salivary Physiological Marker | Participants | Exercise Protocol [Reference] | At Rest | After Exercise | % Change | Salivary Collection Method |
|---|---|---|---|---|---|---|
| Cortisol | 98 M, F | Running, 42.2 km, 268.2 min TT [76] | 830.0 nmol/l | 1035.0 nmol/l | ↑ 25 | Unstimulated whole saliva |
| 12 M | Cycling, 40% of VO2max Cycling, 60% of VO2max Cycling, 80% of VO2max [9] | 7.4 nmol/l 5.2 nmol/l 4.7 nmol/l | 5.9 nmol/l 8.1 nmol/l 9.6 nmol/l | ↓ 20 ↑ 55 ↑ 105 | Mix method (passive drooling and if saliva secretion needed to be stimulated, subjects chewed on paraffin film) | |
| 10 M | Cycling, 50% of VO2max Cycling, 75% of VO2max [24] | 13.7 nmol/l 13.7 nmol/l | 13.1 nmol/l 14.6 nmol/l | ↓ 4 ↑ 7 | Unstimulated whole saliva | |
| Glucose | 98 M, F | Running, 42.2 km, 268.2 min TT [76] | 5.5 nmol/l | 5.0 nmol/l | ↓ 9 | Unstimulated whole saliva |
| IgA concentration | 98 M, F | Running, 42.2 km, 268.2 min TT [76] | 399.0 mg/l | 429.0 mg/l | ↑ 8 | Unstimulated whole saliva |
| 18 M | Cycling, 55% VO2max Cycling, 80% VO2max [10] | 91.0 mg/l 85.0 mg/l | 234.0 mg/l 295.0 mg/l | ↑ 157 ↑ 247 | Salivette swab | |
| 22 M, F | Swimming, 12 weeks of 600–1500 min pool training + 300 min dry land training per week [56] | 55.3 mg/l | 37.1 mg/l | ↓ 33 | Unstimulated whole saliva | |
| Salivary secretion rate | 98 M, F | Running, 42.2 km, 268.2 min TT [76] | 0.9 ml/min | 0.6 ml/min | ↓ 38 | Unstimulated whole saliva |
| Salivary amylase secretion rate | 10 M | Cycling, 50% of VO2max Cycling, 75% of VO2max [24] | 226.0 U/min 150.0 U/min | 200.0 U/min 264.0 U/min | ↓ 12 ↑ 76 | Unstimulated whole saliva |
| Pros | Cons | |
|---|---|---|
| Blood |
|
|
| Urine |
|
|
| Saliva |
|
|
Publisher’s Note: MDPI stays neutral with regard to jurisdictional claims in published maps and institutional affiliations. |
© 2022 by the authors. Licensee MDPI, Basel, Switzerland. This article is an open access article distributed under the terms and conditions of the Creative Commons Attribution (CC BY) license (https://creativecommons.org/licenses/by/4.0/).
Share and Cite
Jesuthasan, A.; Ali, A.; Lee, J.K.W.; Rutherfurd-Markwick, K. Assessment of Changes in Physiological Markers in Different Body Fluids at Rest and after Exercise. Nutrients 2022, 14, 4685. https://doi.org/10.3390/nu14214685
Jesuthasan A, Ali A, Lee JKW, Rutherfurd-Markwick K. Assessment of Changes in Physiological Markers in Different Body Fluids at Rest and after Exercise. Nutrients. 2022; 14(21):4685. https://doi.org/10.3390/nu14214685
Chicago/Turabian StyleJesuthasan, Amalini, Ajmol Ali, Jason Kai Wei Lee, and Kay Rutherfurd-Markwick. 2022. "Assessment of Changes in Physiological Markers in Different Body Fluids at Rest and after Exercise" Nutrients 14, no. 21: 4685. https://doi.org/10.3390/nu14214685