
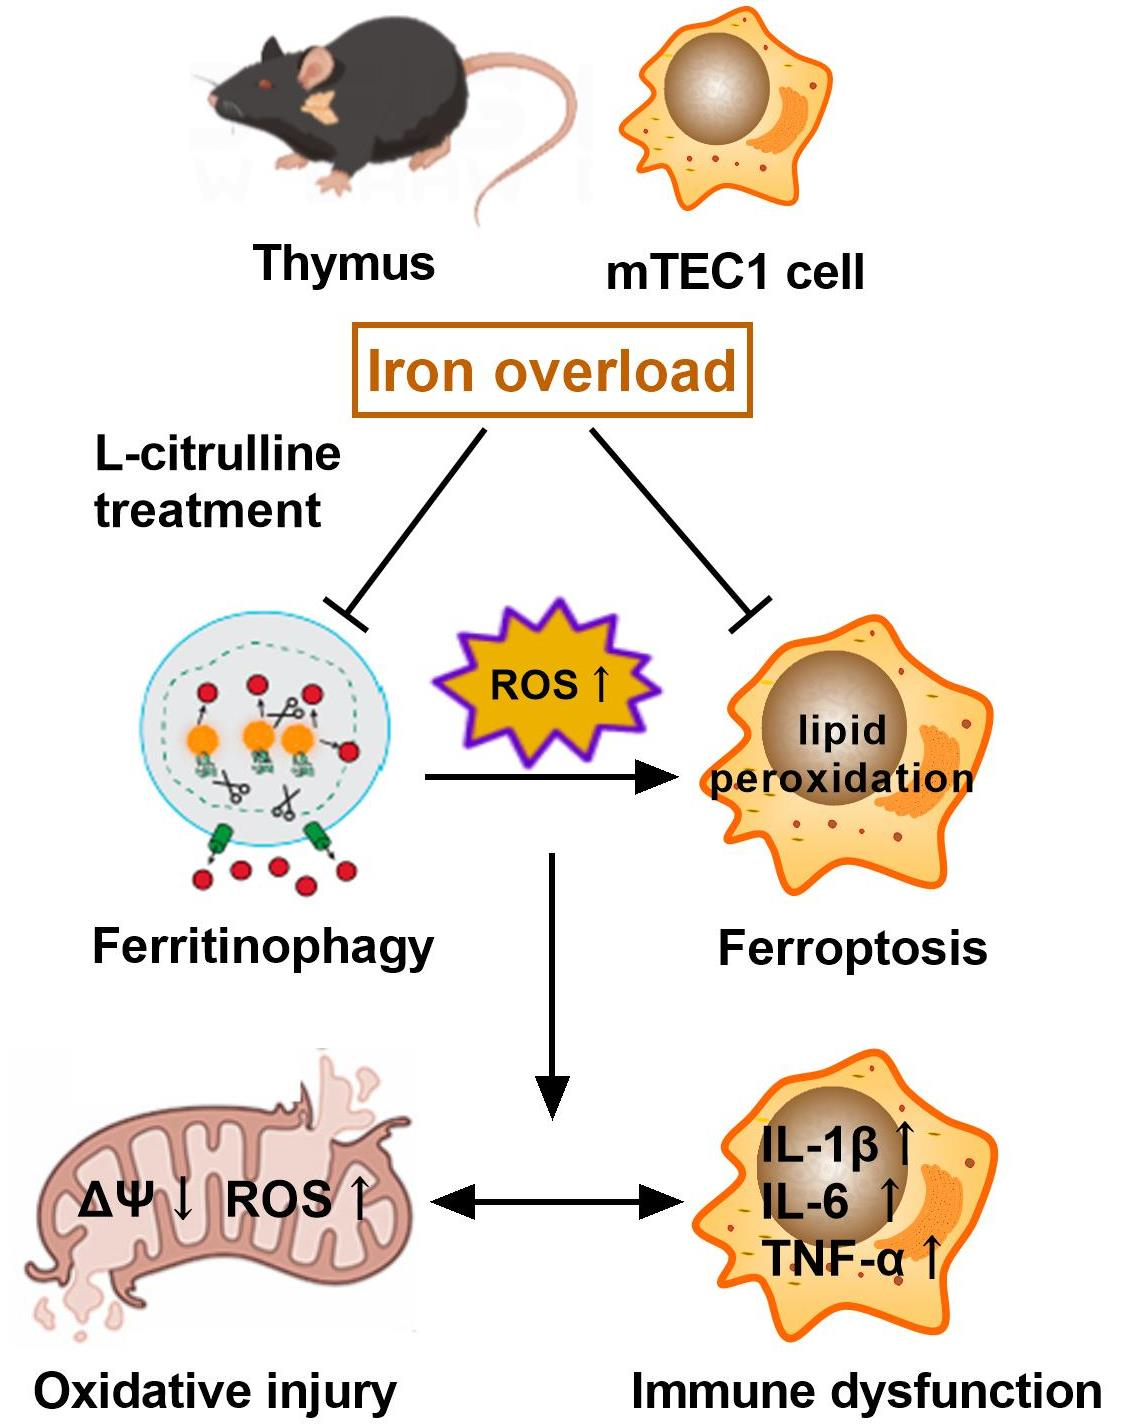
L-Citrulline Supplementation Restrains Ferritinophagy-Mediated Ferroptosis to Alleviate Iron Overload-Induced Thymus Oxidative Damage and Immune Dysfunction

Abstract
:
1. Introduction
2. Materials and Methods
2.1. Animal Treatment
2.2. Hematoxylin and Eosin Staining (H&E Staining)
2.3. Prussian Blue Staining
2.4. Cell Viability Assay
2.5. siRNA Transfection
2.6. Determination of Iron Concentration
2.7. Determination of MDA Content, SOD, GSH-Px, and LDH Activity
2.8. Real-Time Fluorescence Quantitative PCR
2.9. Western Blot Assay
2.10. Mitochondrial Membrane Potential (MMP) Measurement
2.11. Cytoplasmic ROS and Lipid ROS Measurement
2.12. Immunofluorescence Staining
2.13. Statistical Analysis of Data
3. Results
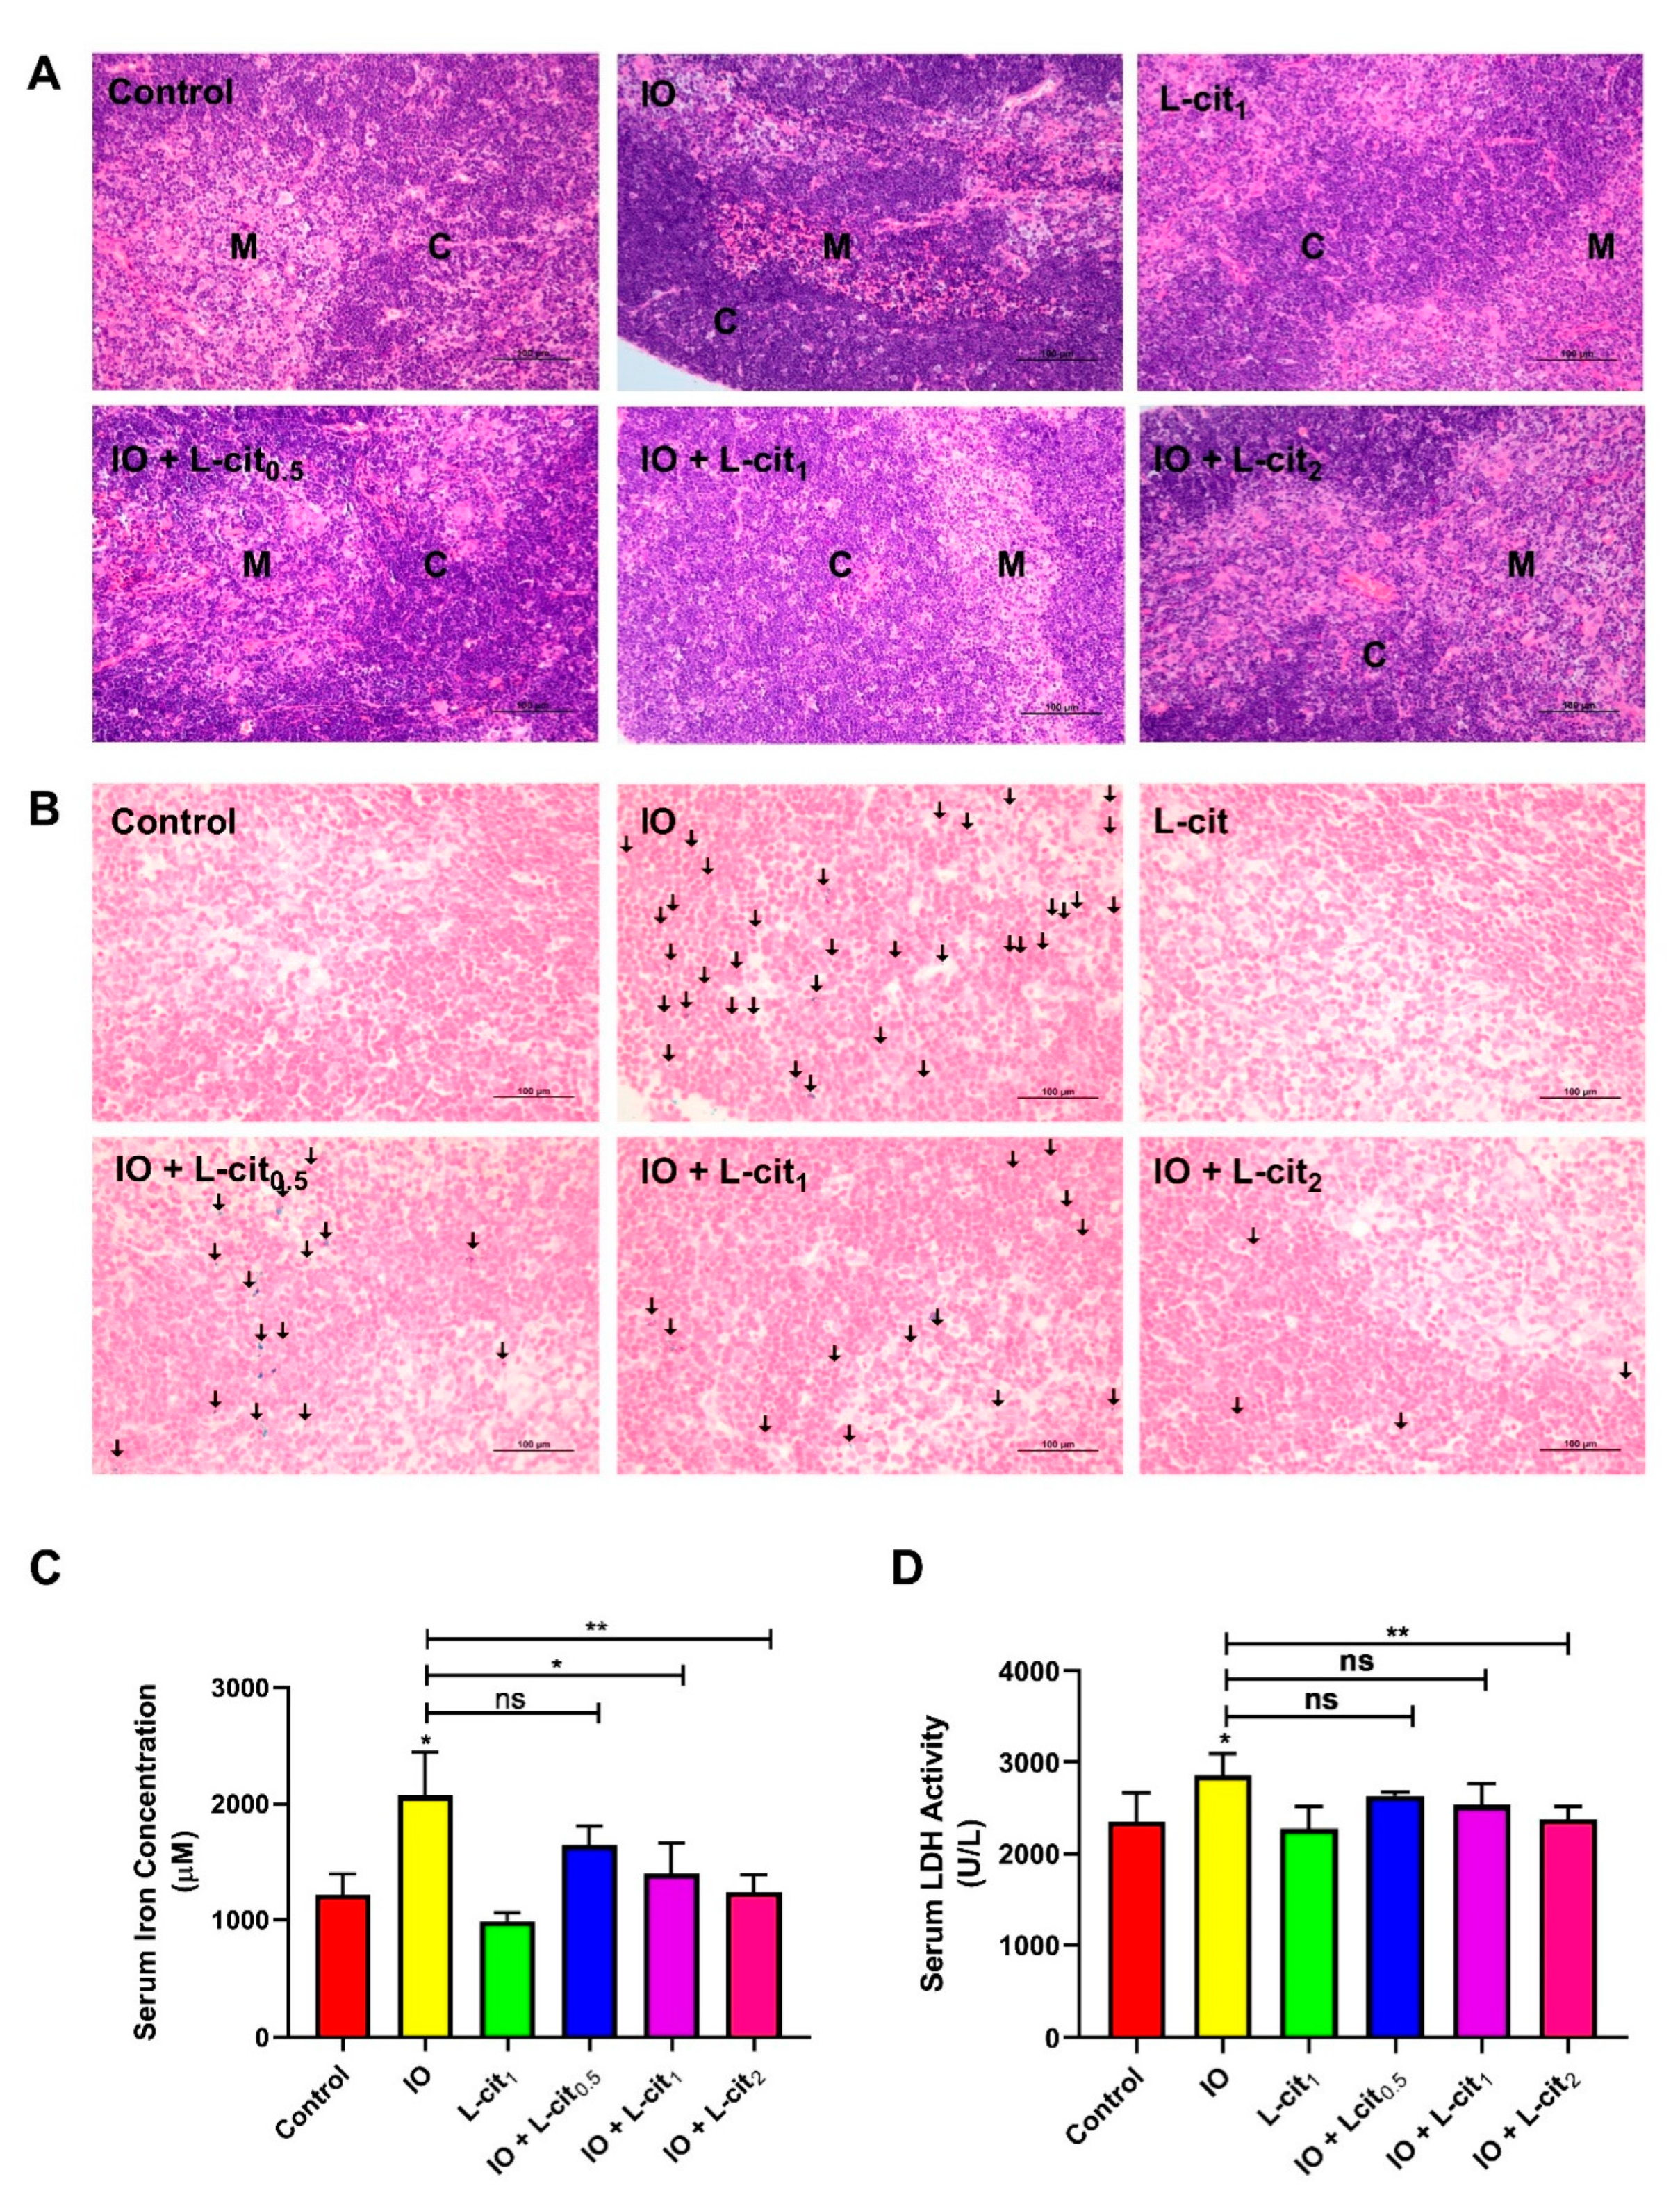
3.1. L-Cit Alleviates Mouse Thymus Damage and Inhibits Iron Deposition
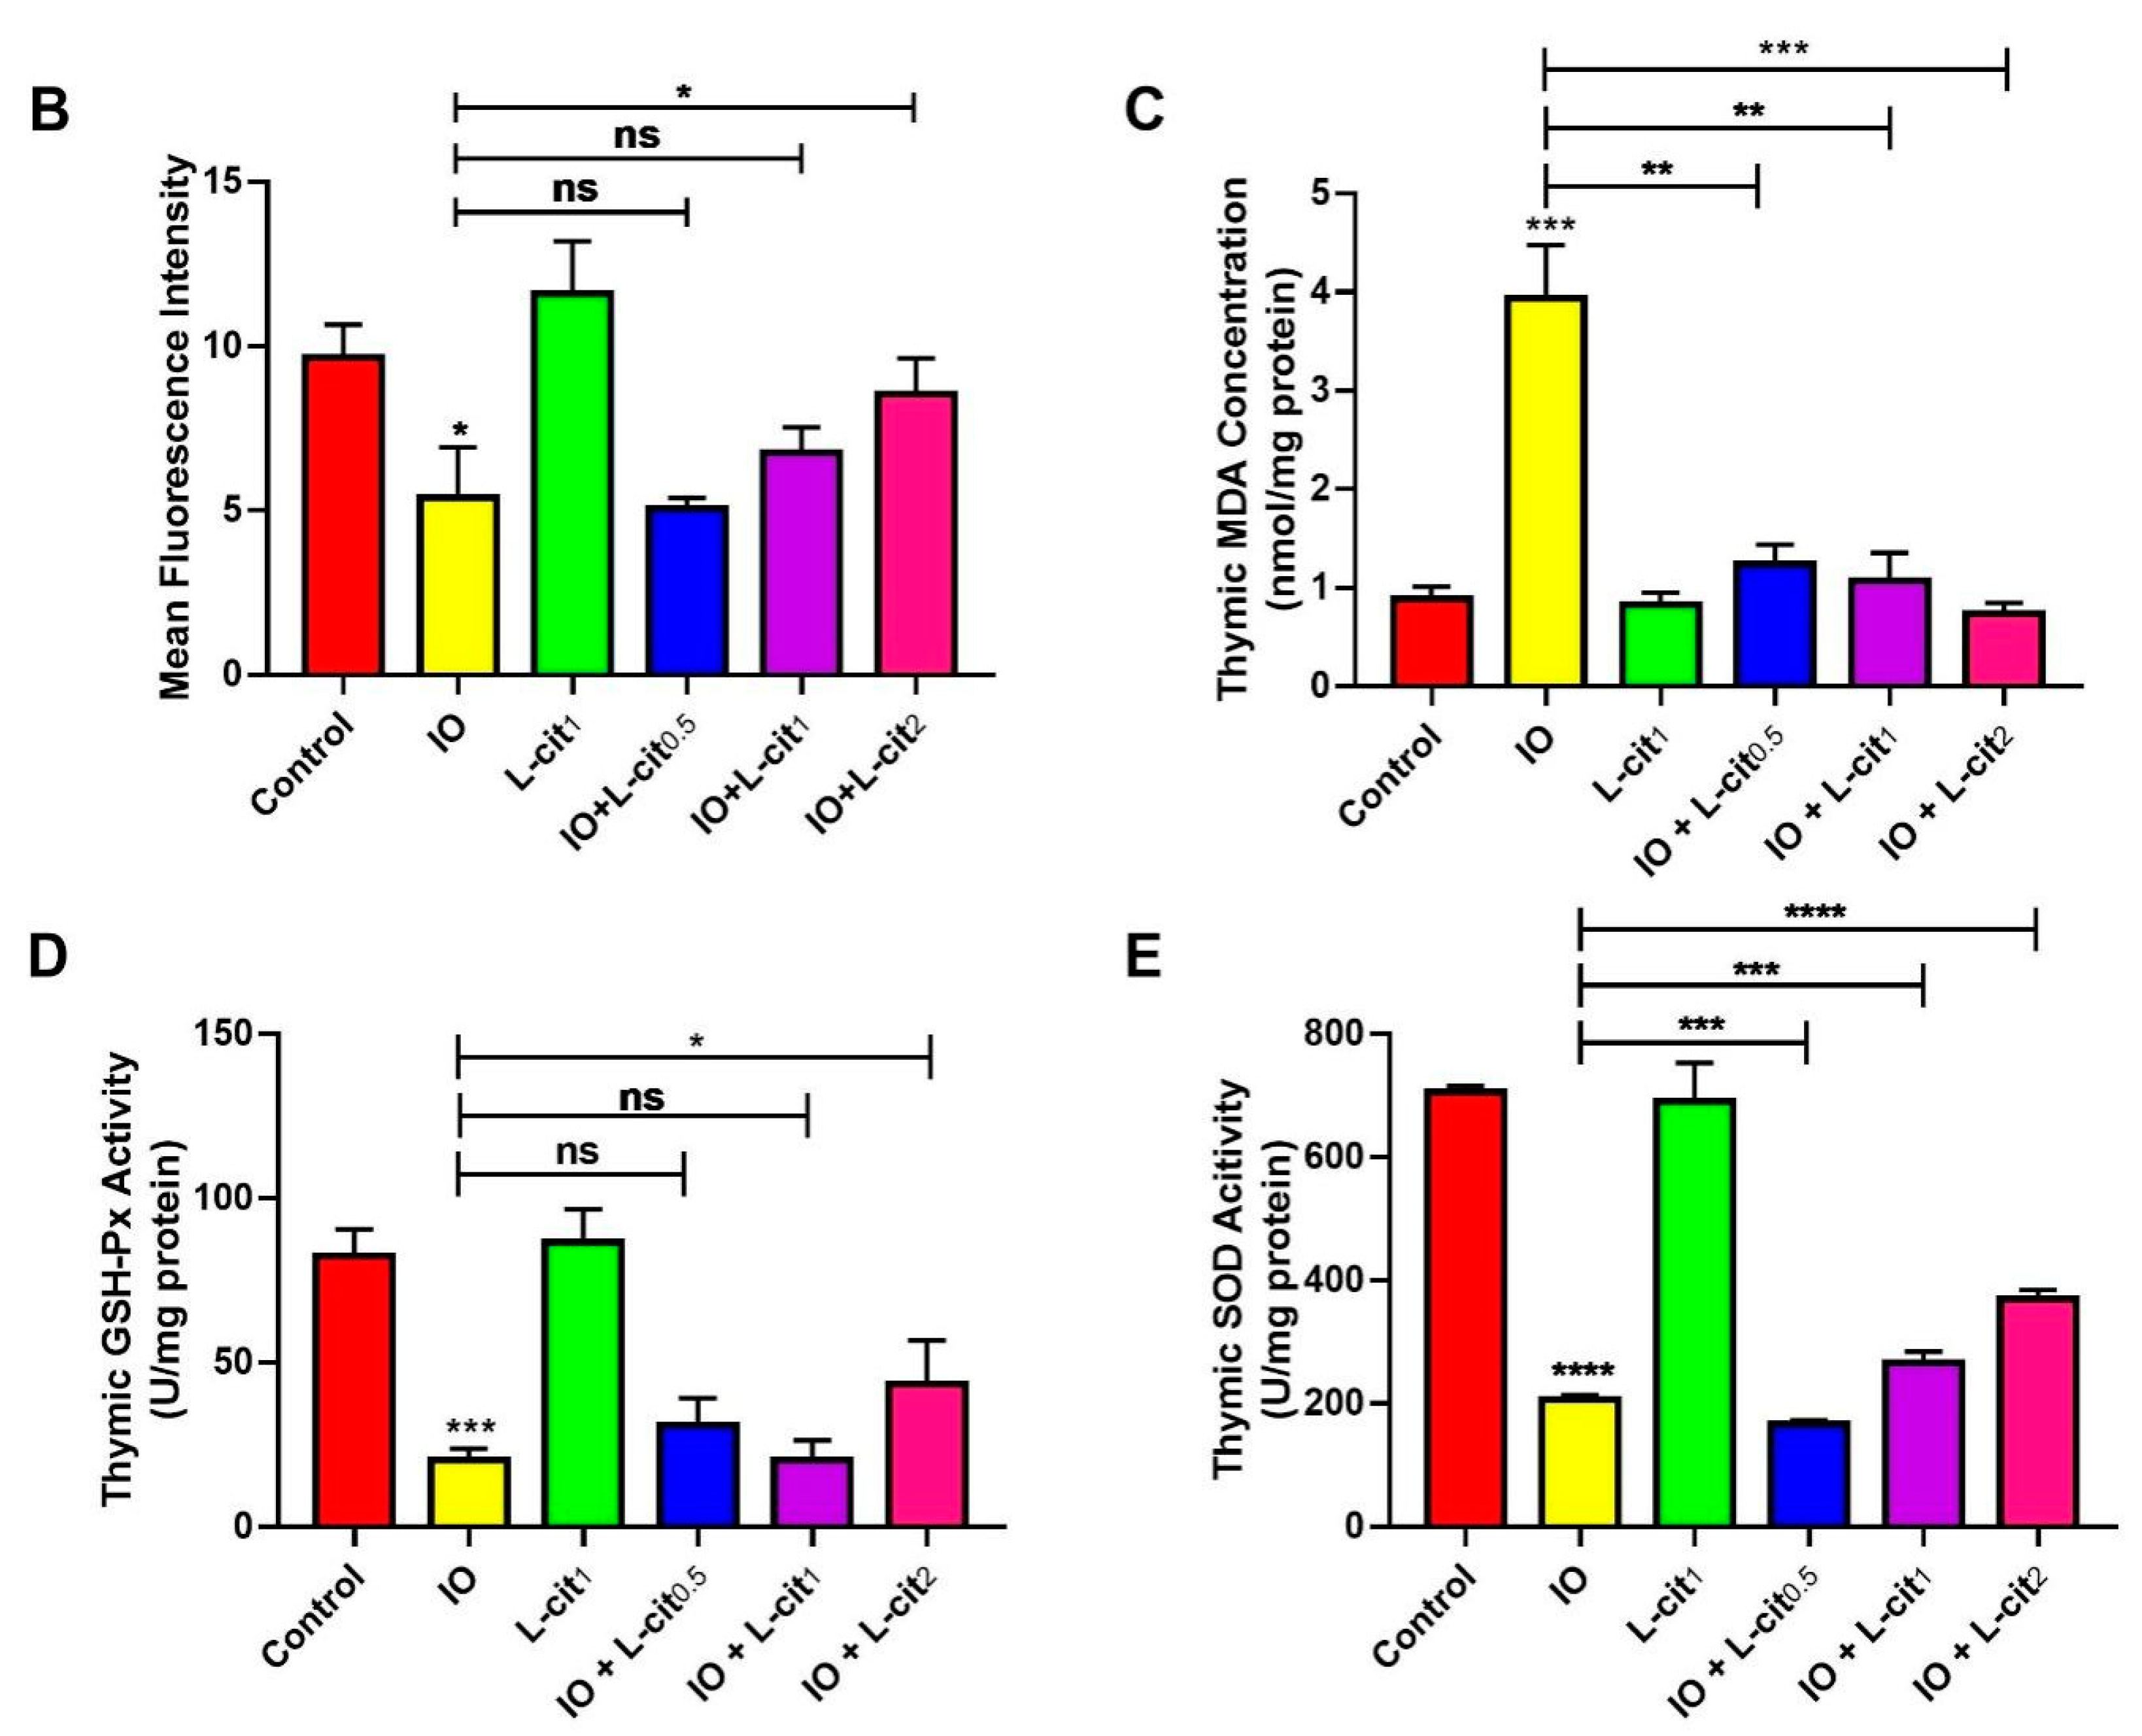
3.2. L-Cit Attenuates Oxidative Stress Induced by Iron Overload in Mouse Thymus
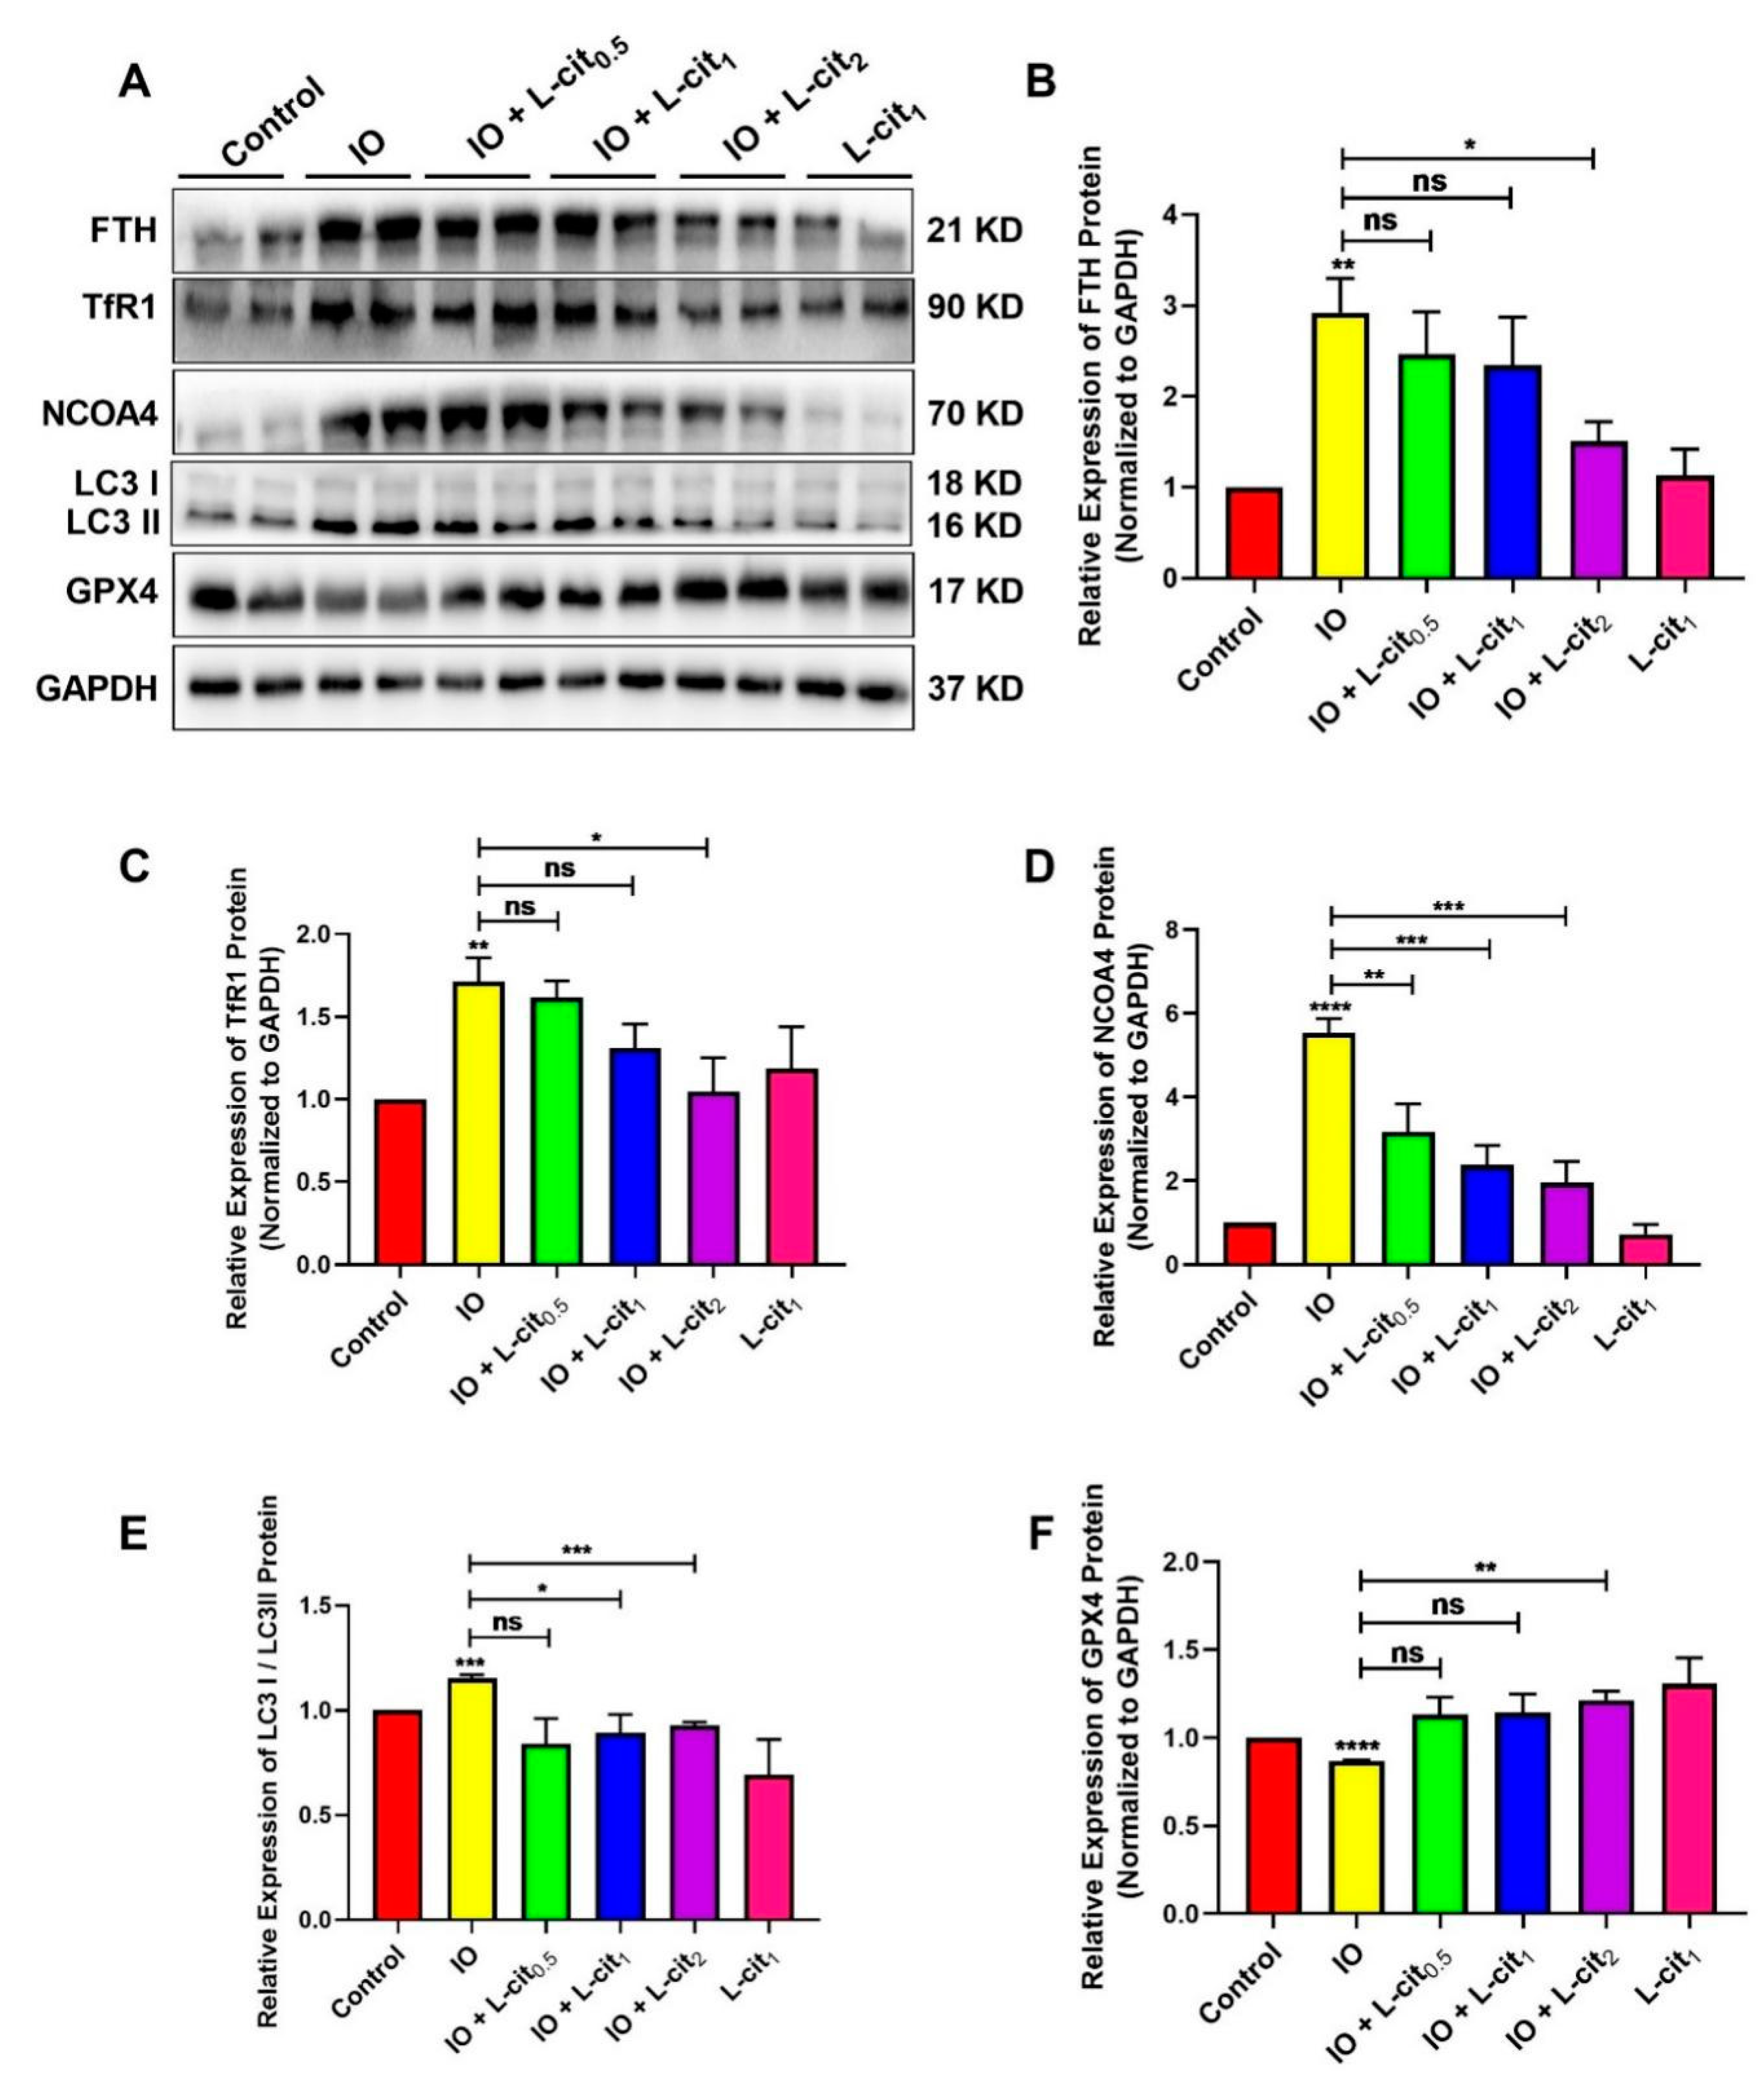
3.3. L-Cit Restrains Ferritinophagy Induced by Iron Overload in Mouse Thymus
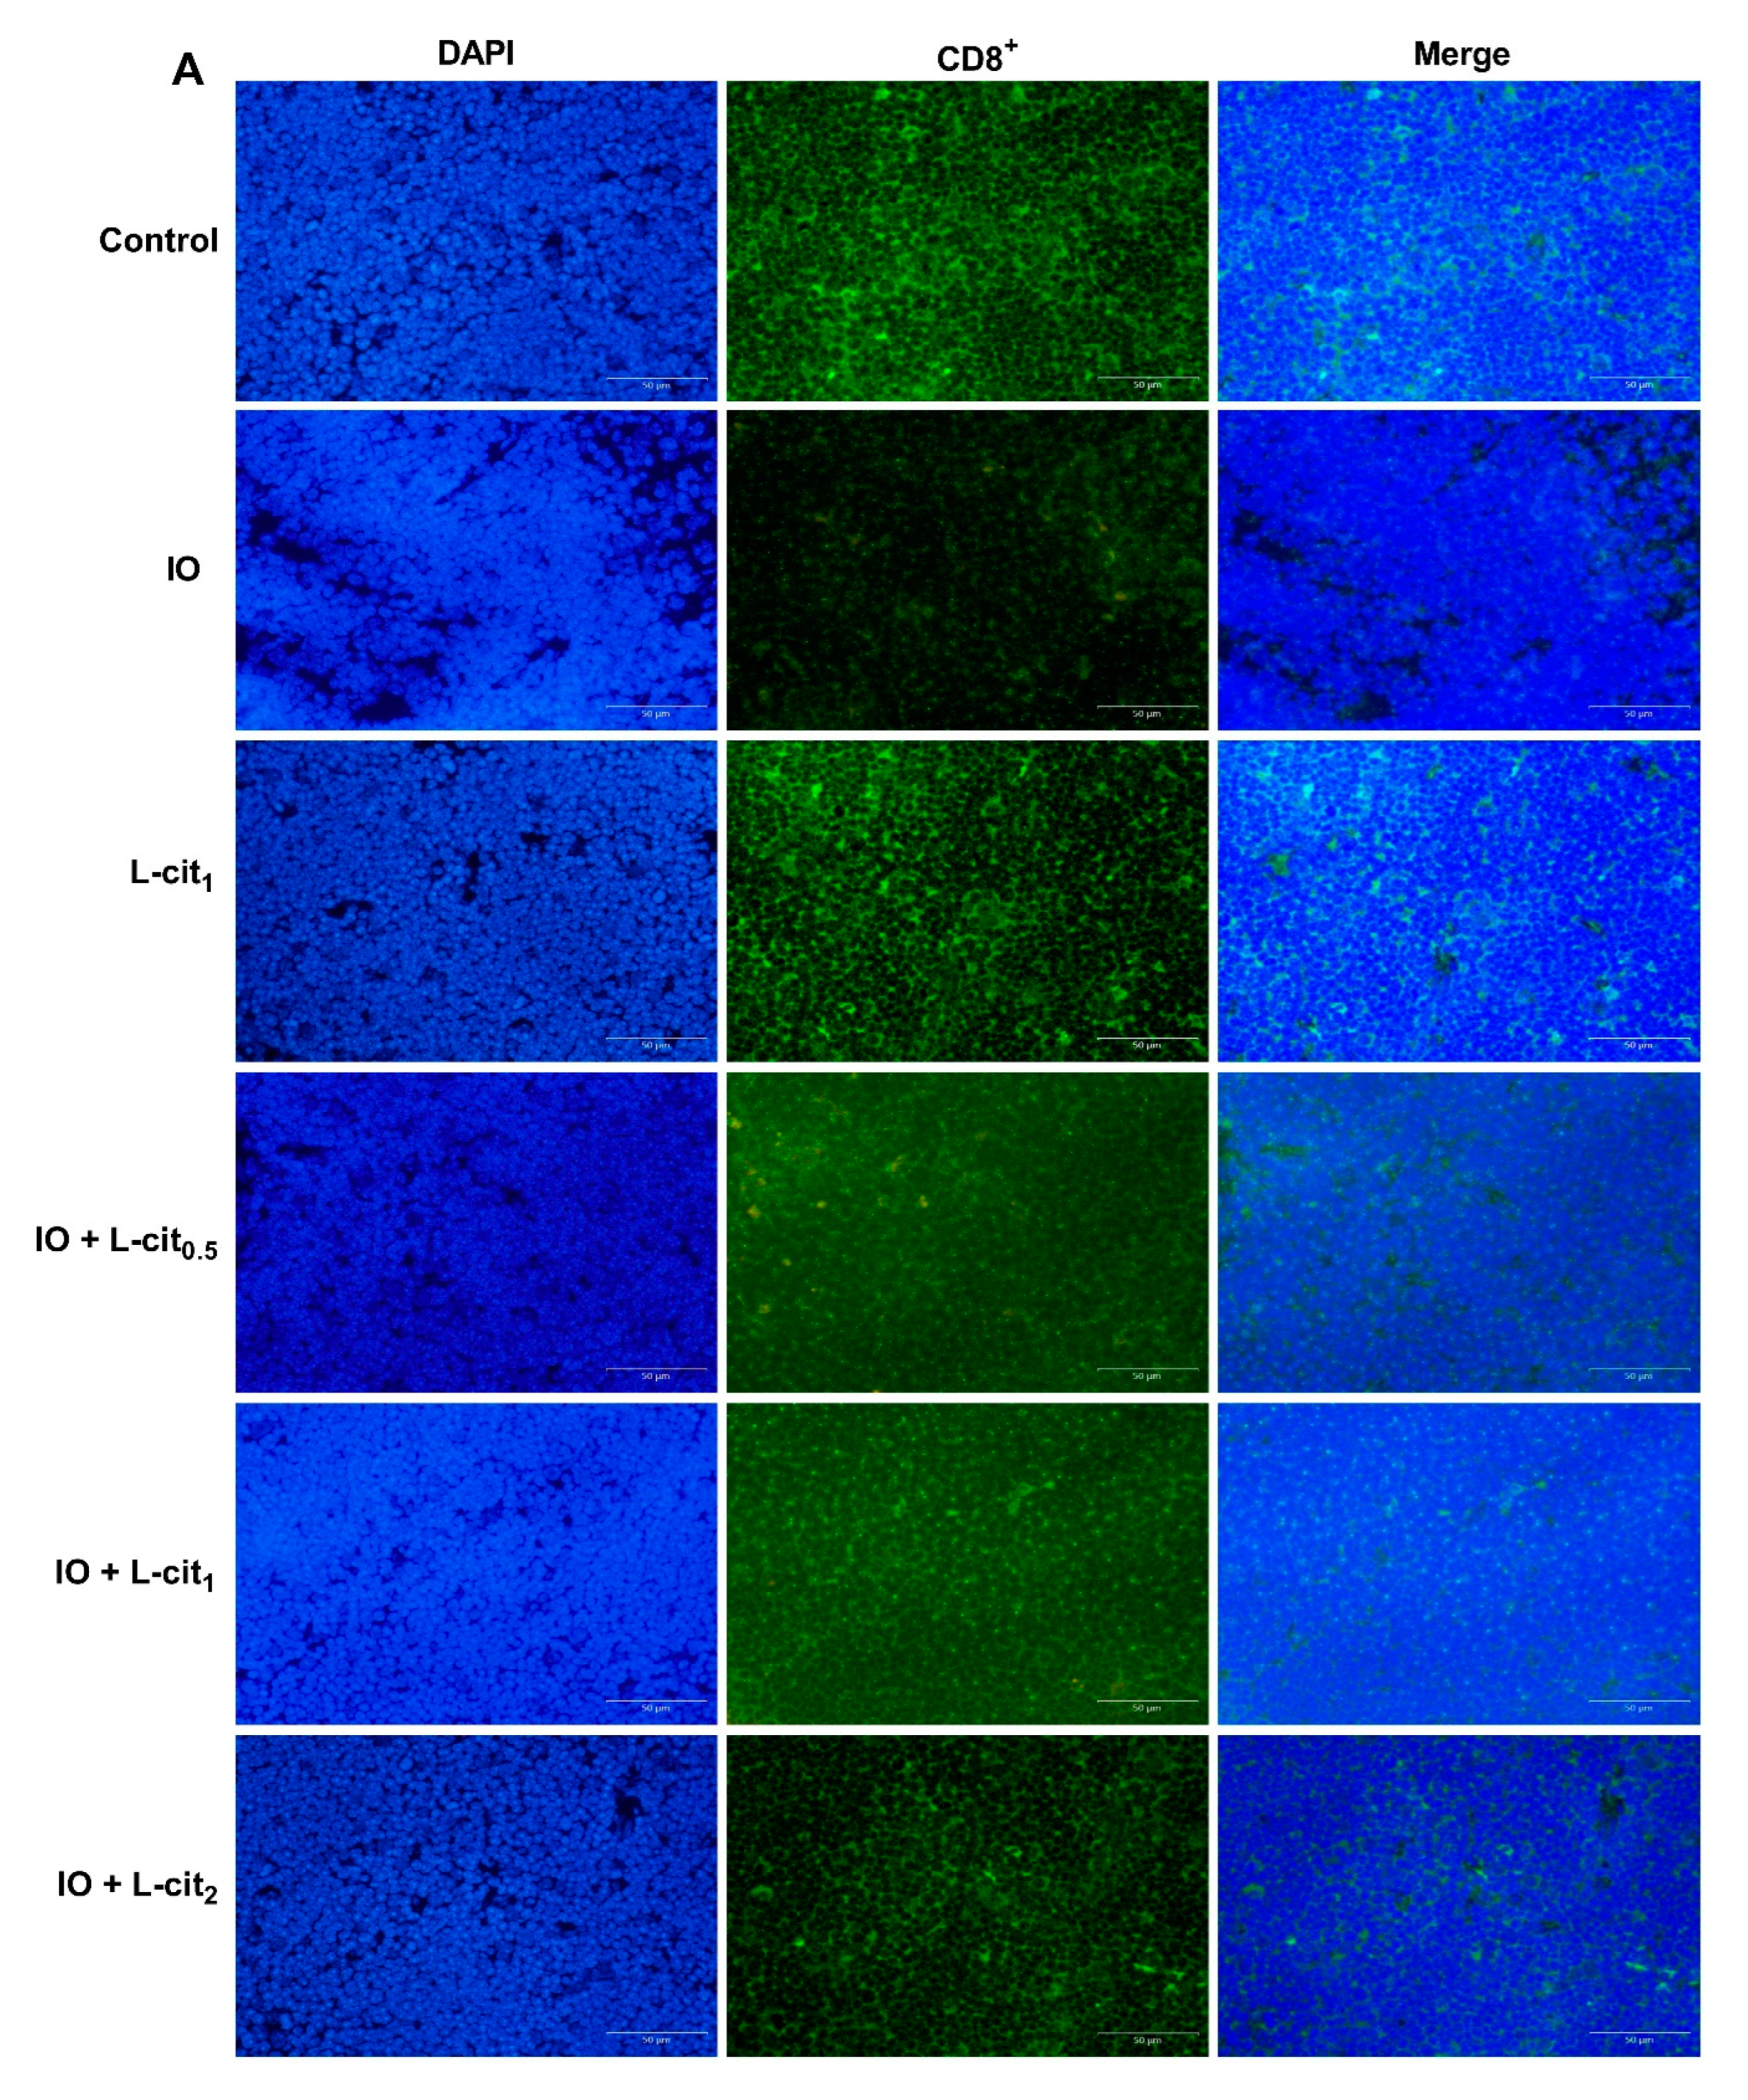
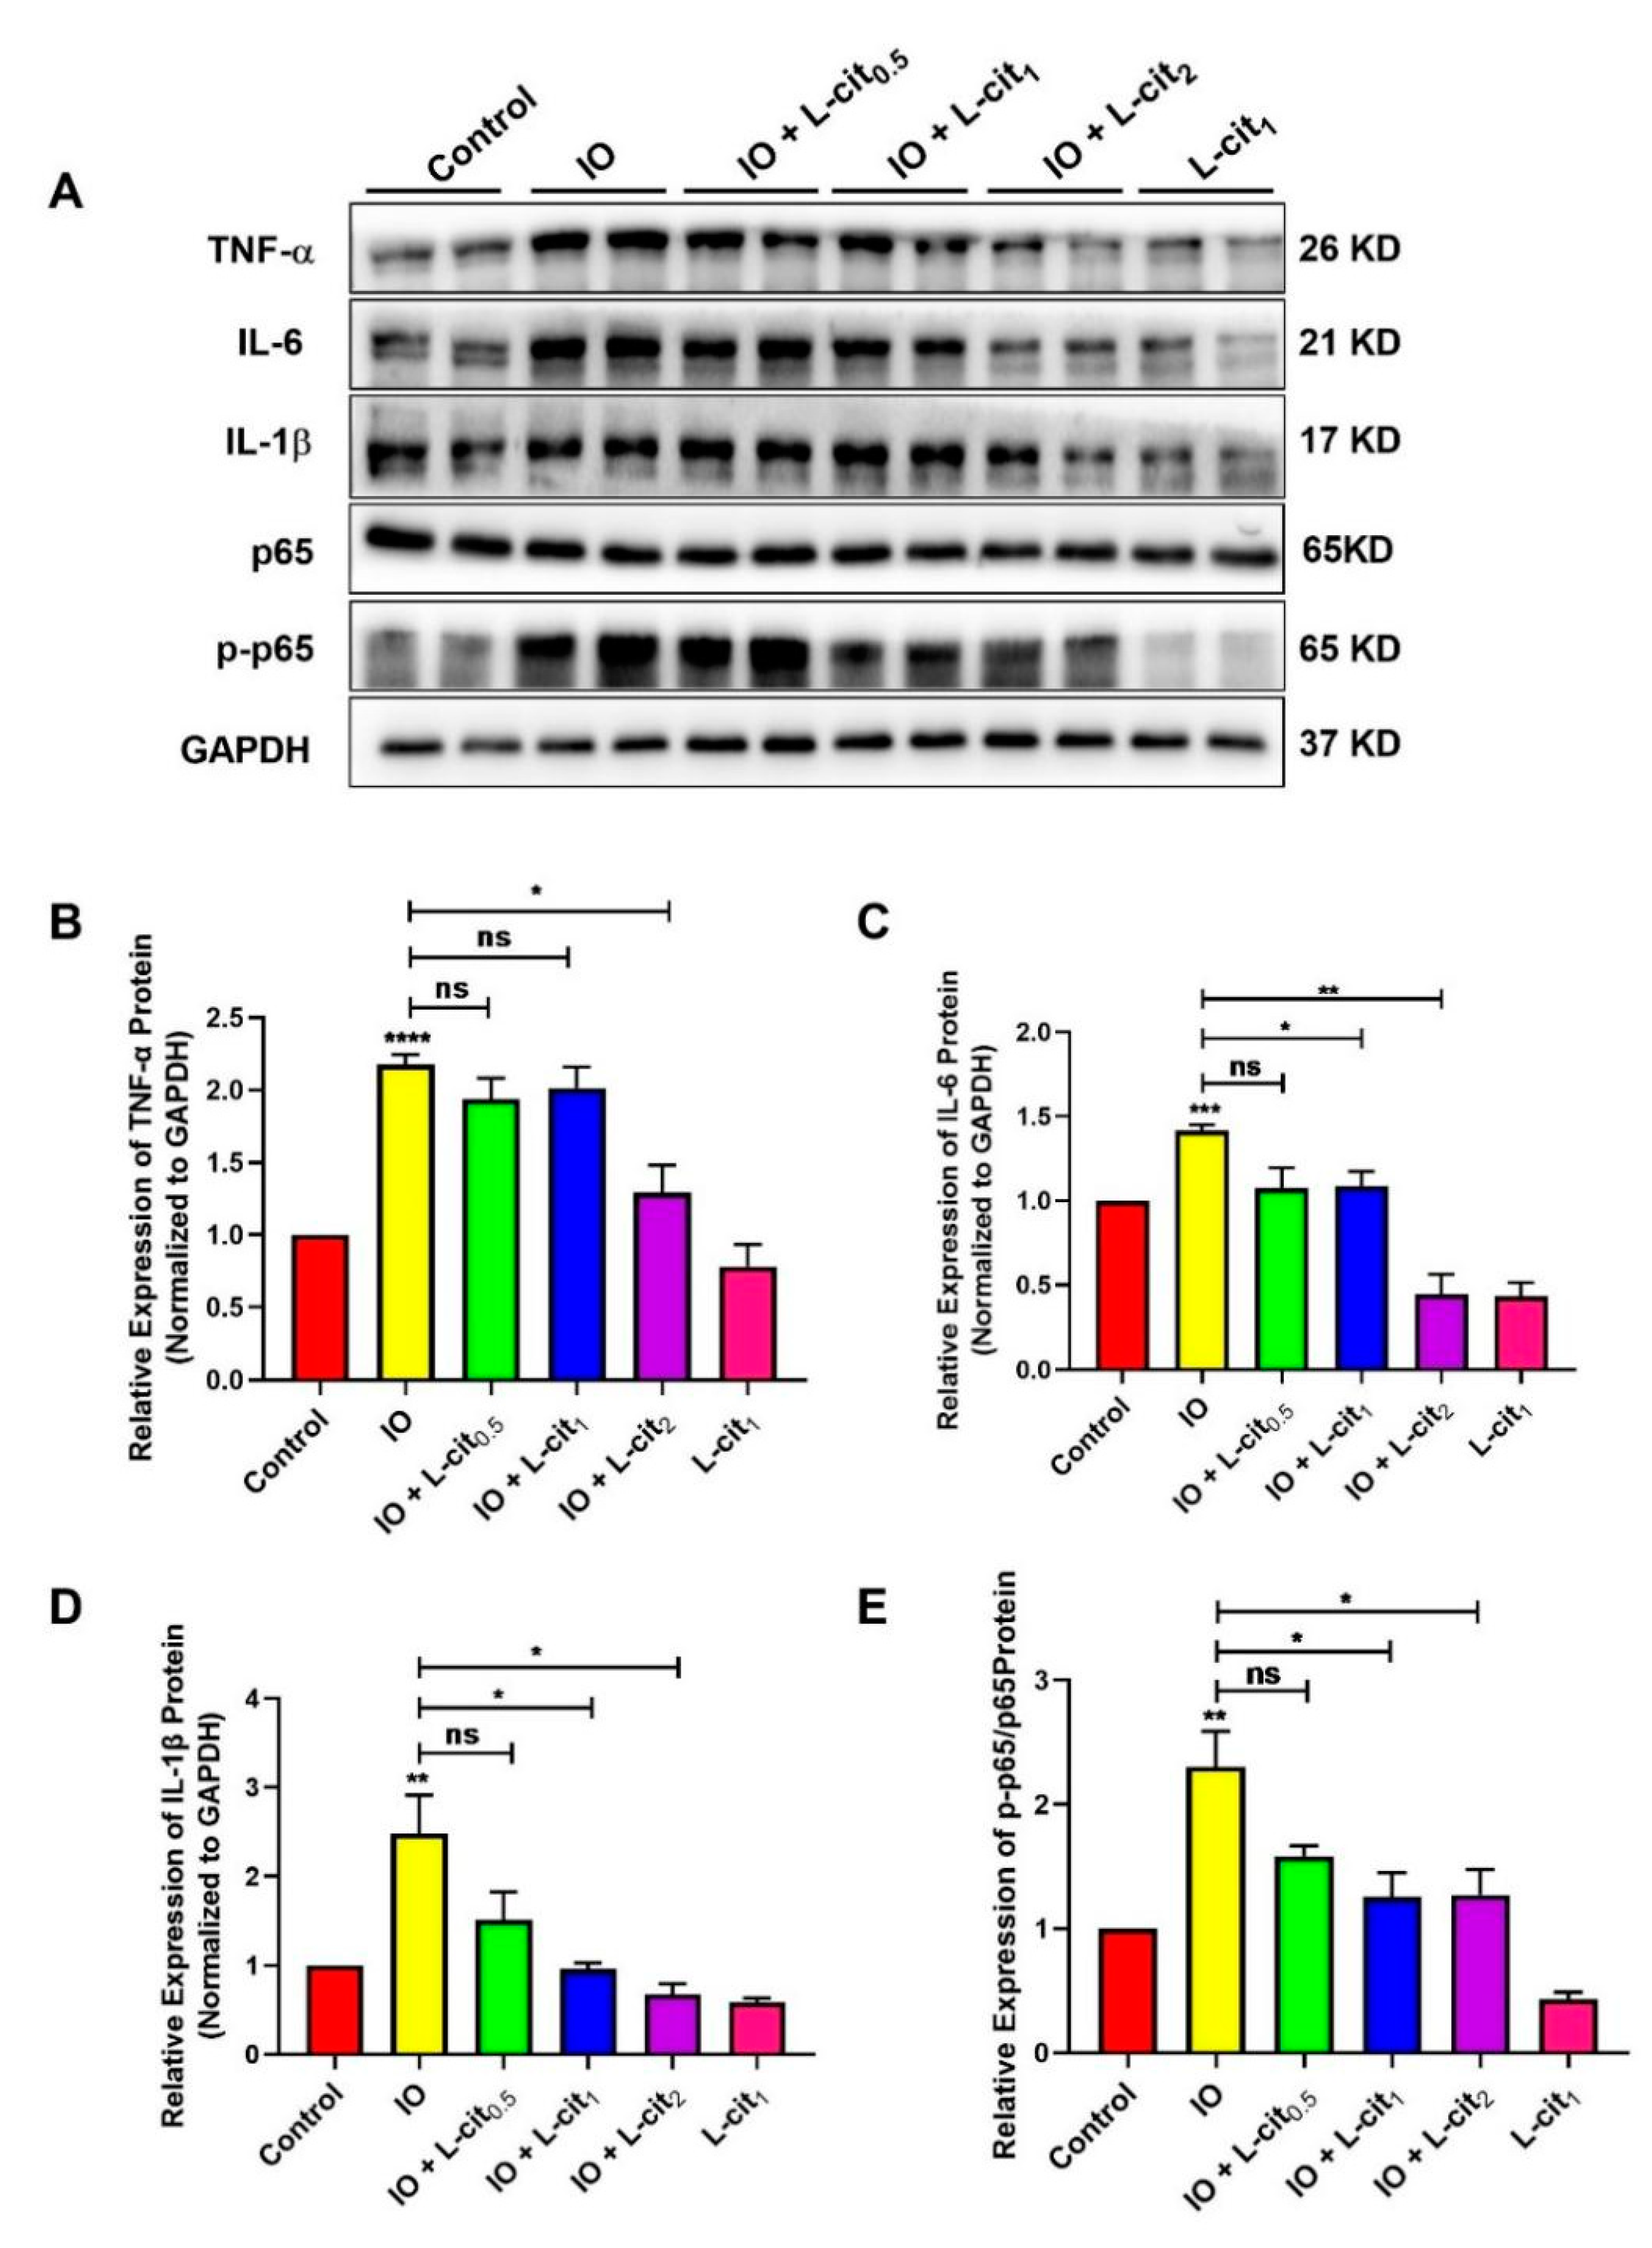
3.4. L-Cit Suppresses NF-κB Signaling Pathway Induced by Iron Overload in Mouse Thymus
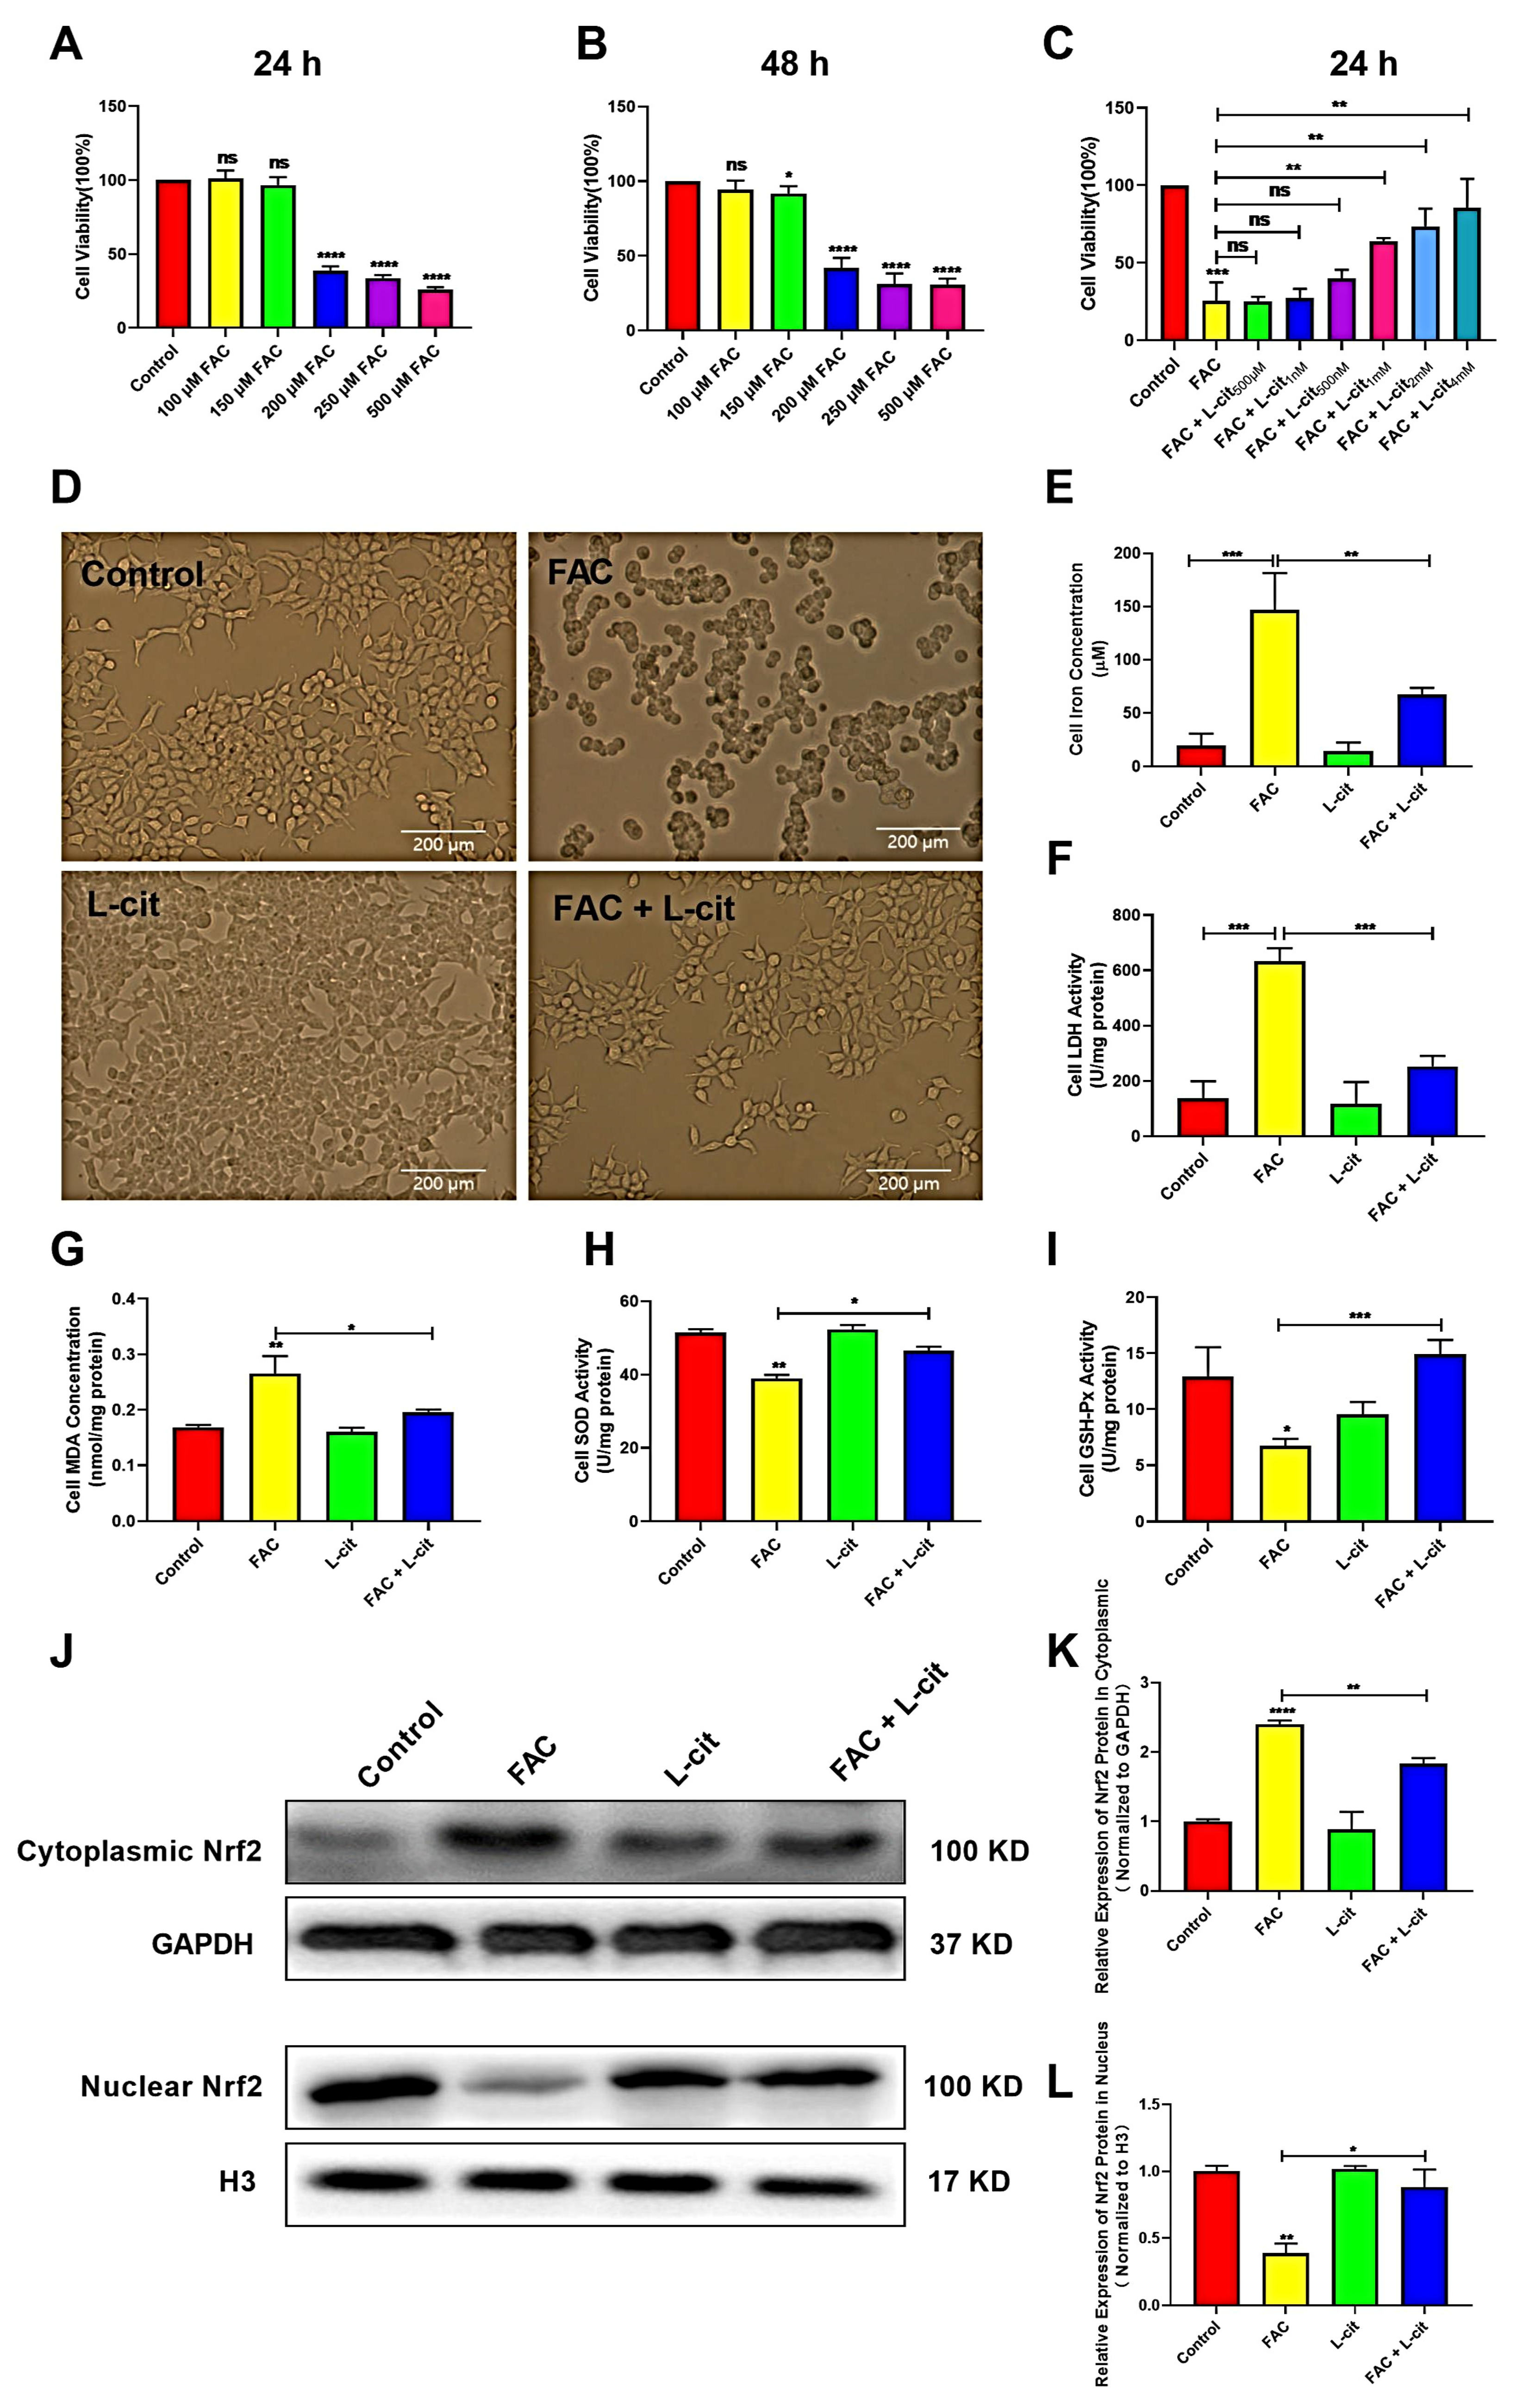
3.5. L-Cit Improves Cells’ Viability and Activates Nrf2 Expression in mTEC1 Cells
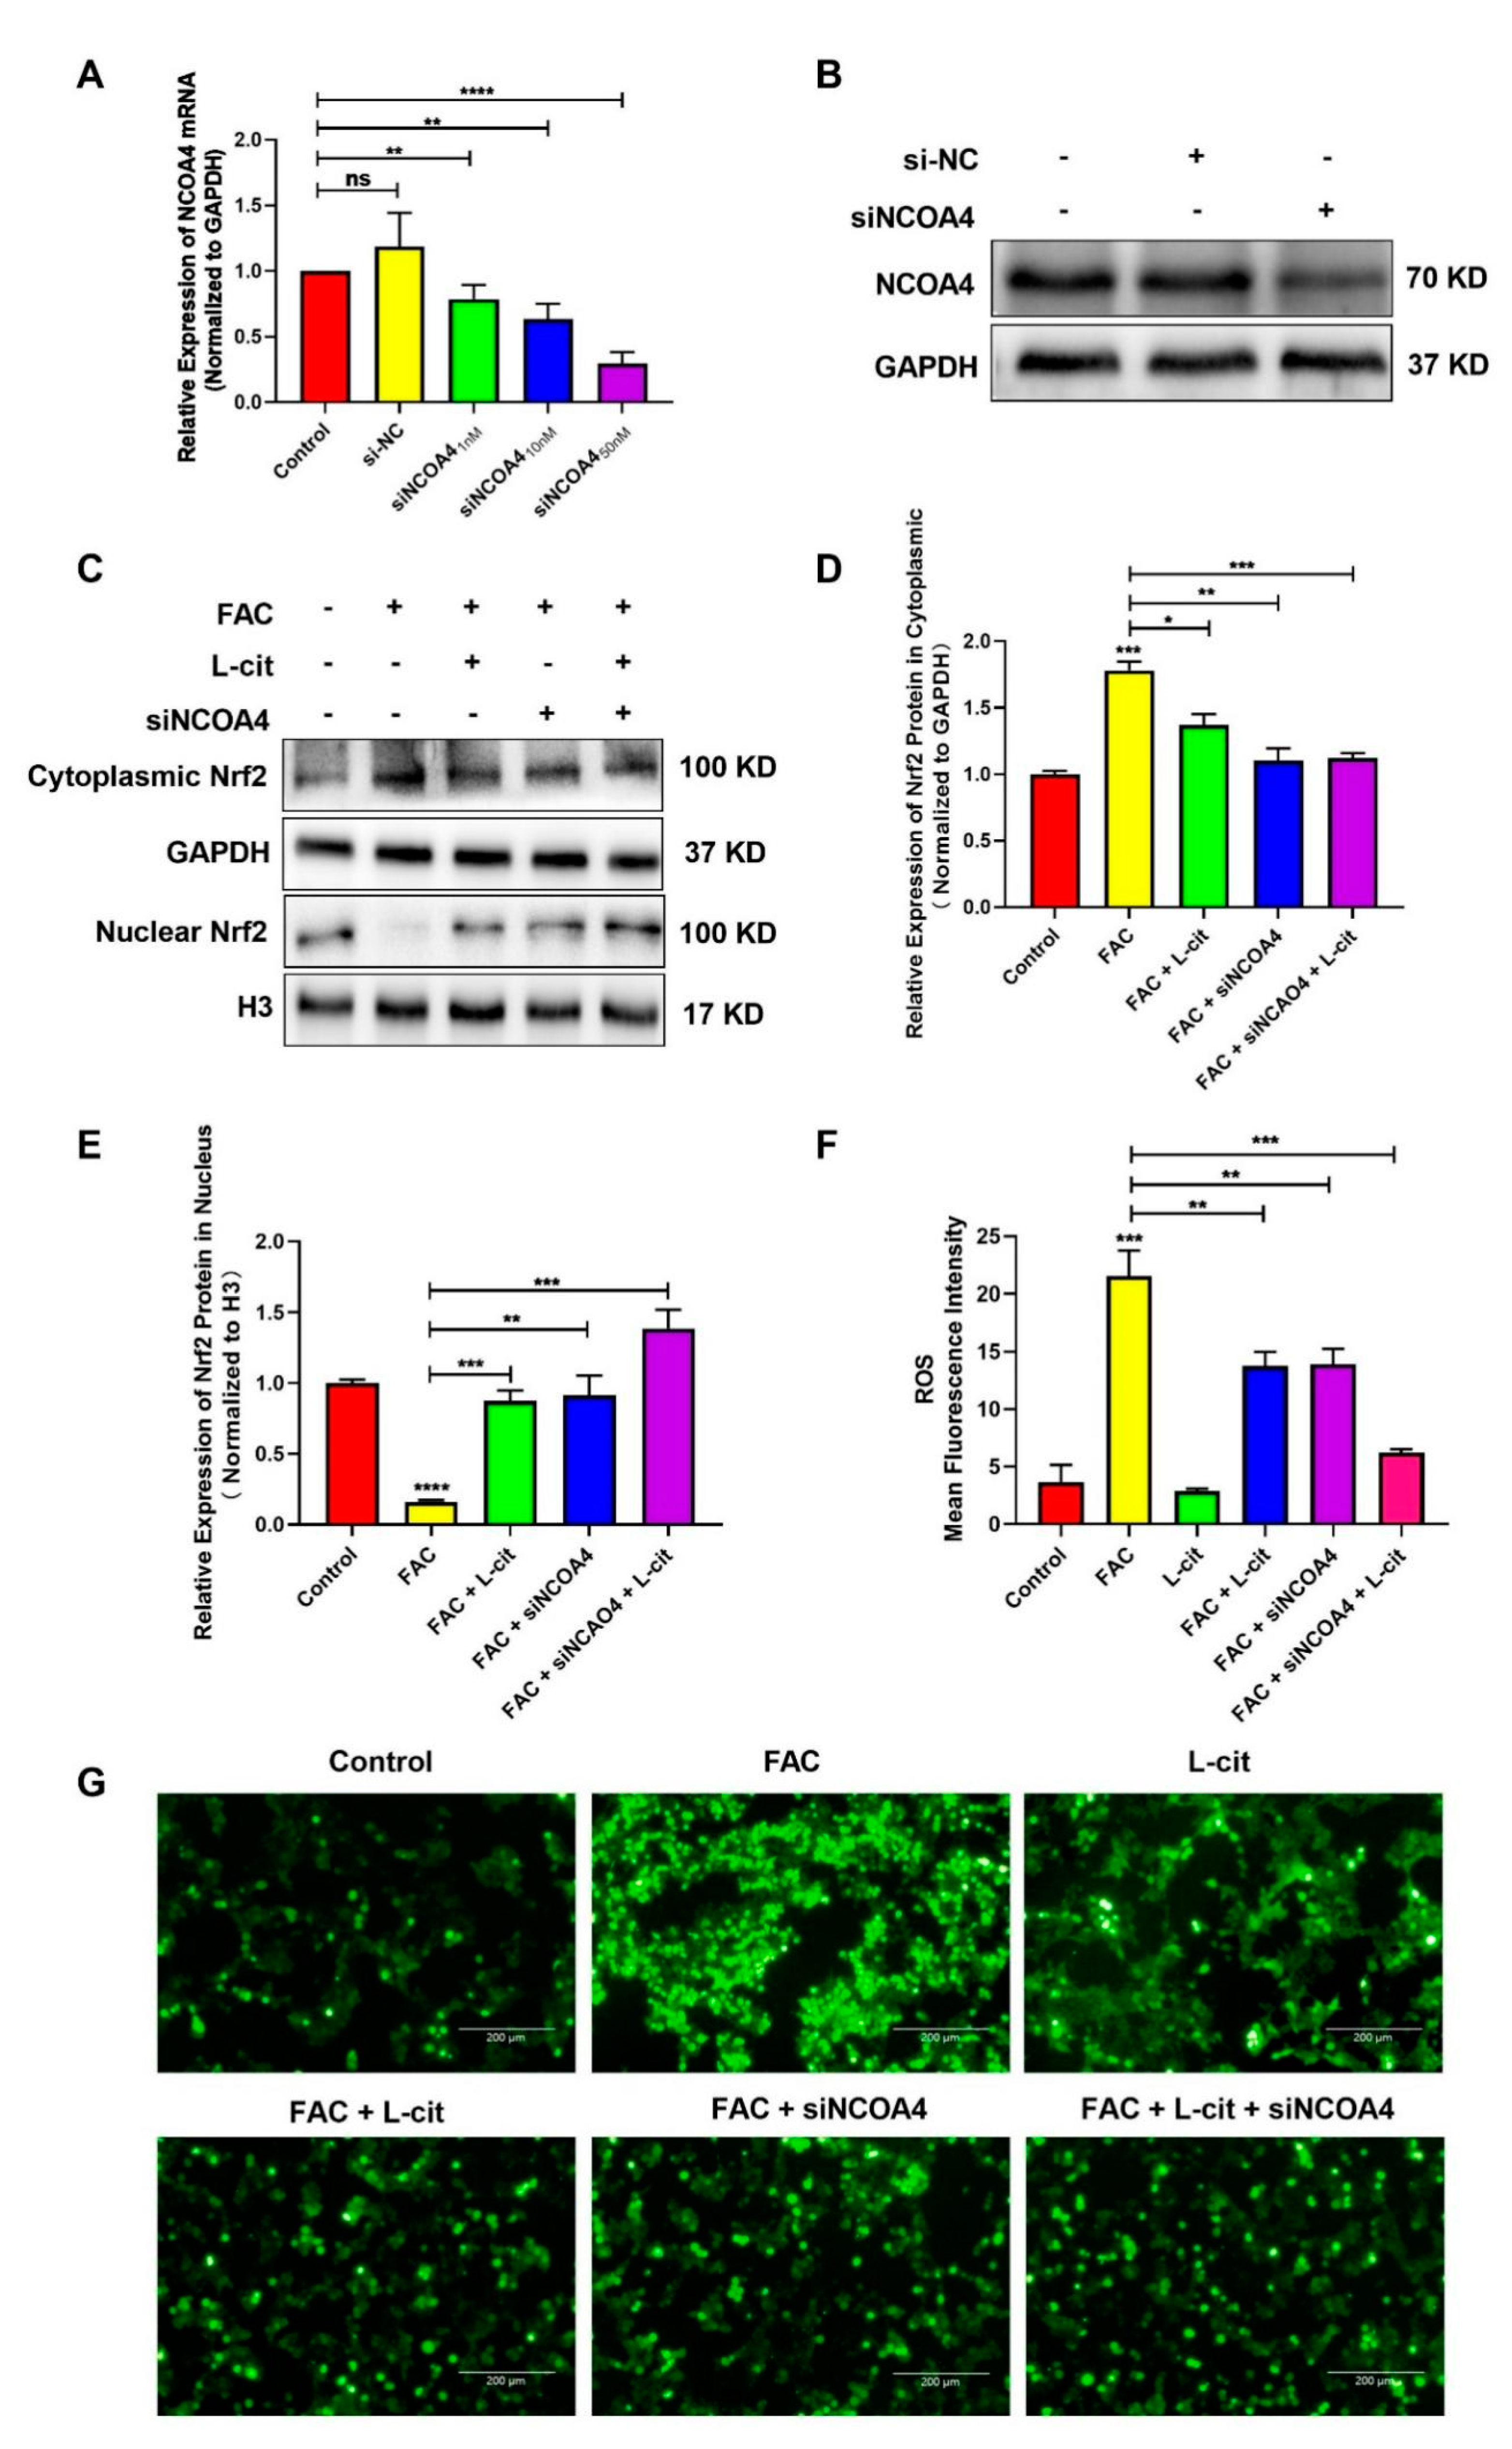
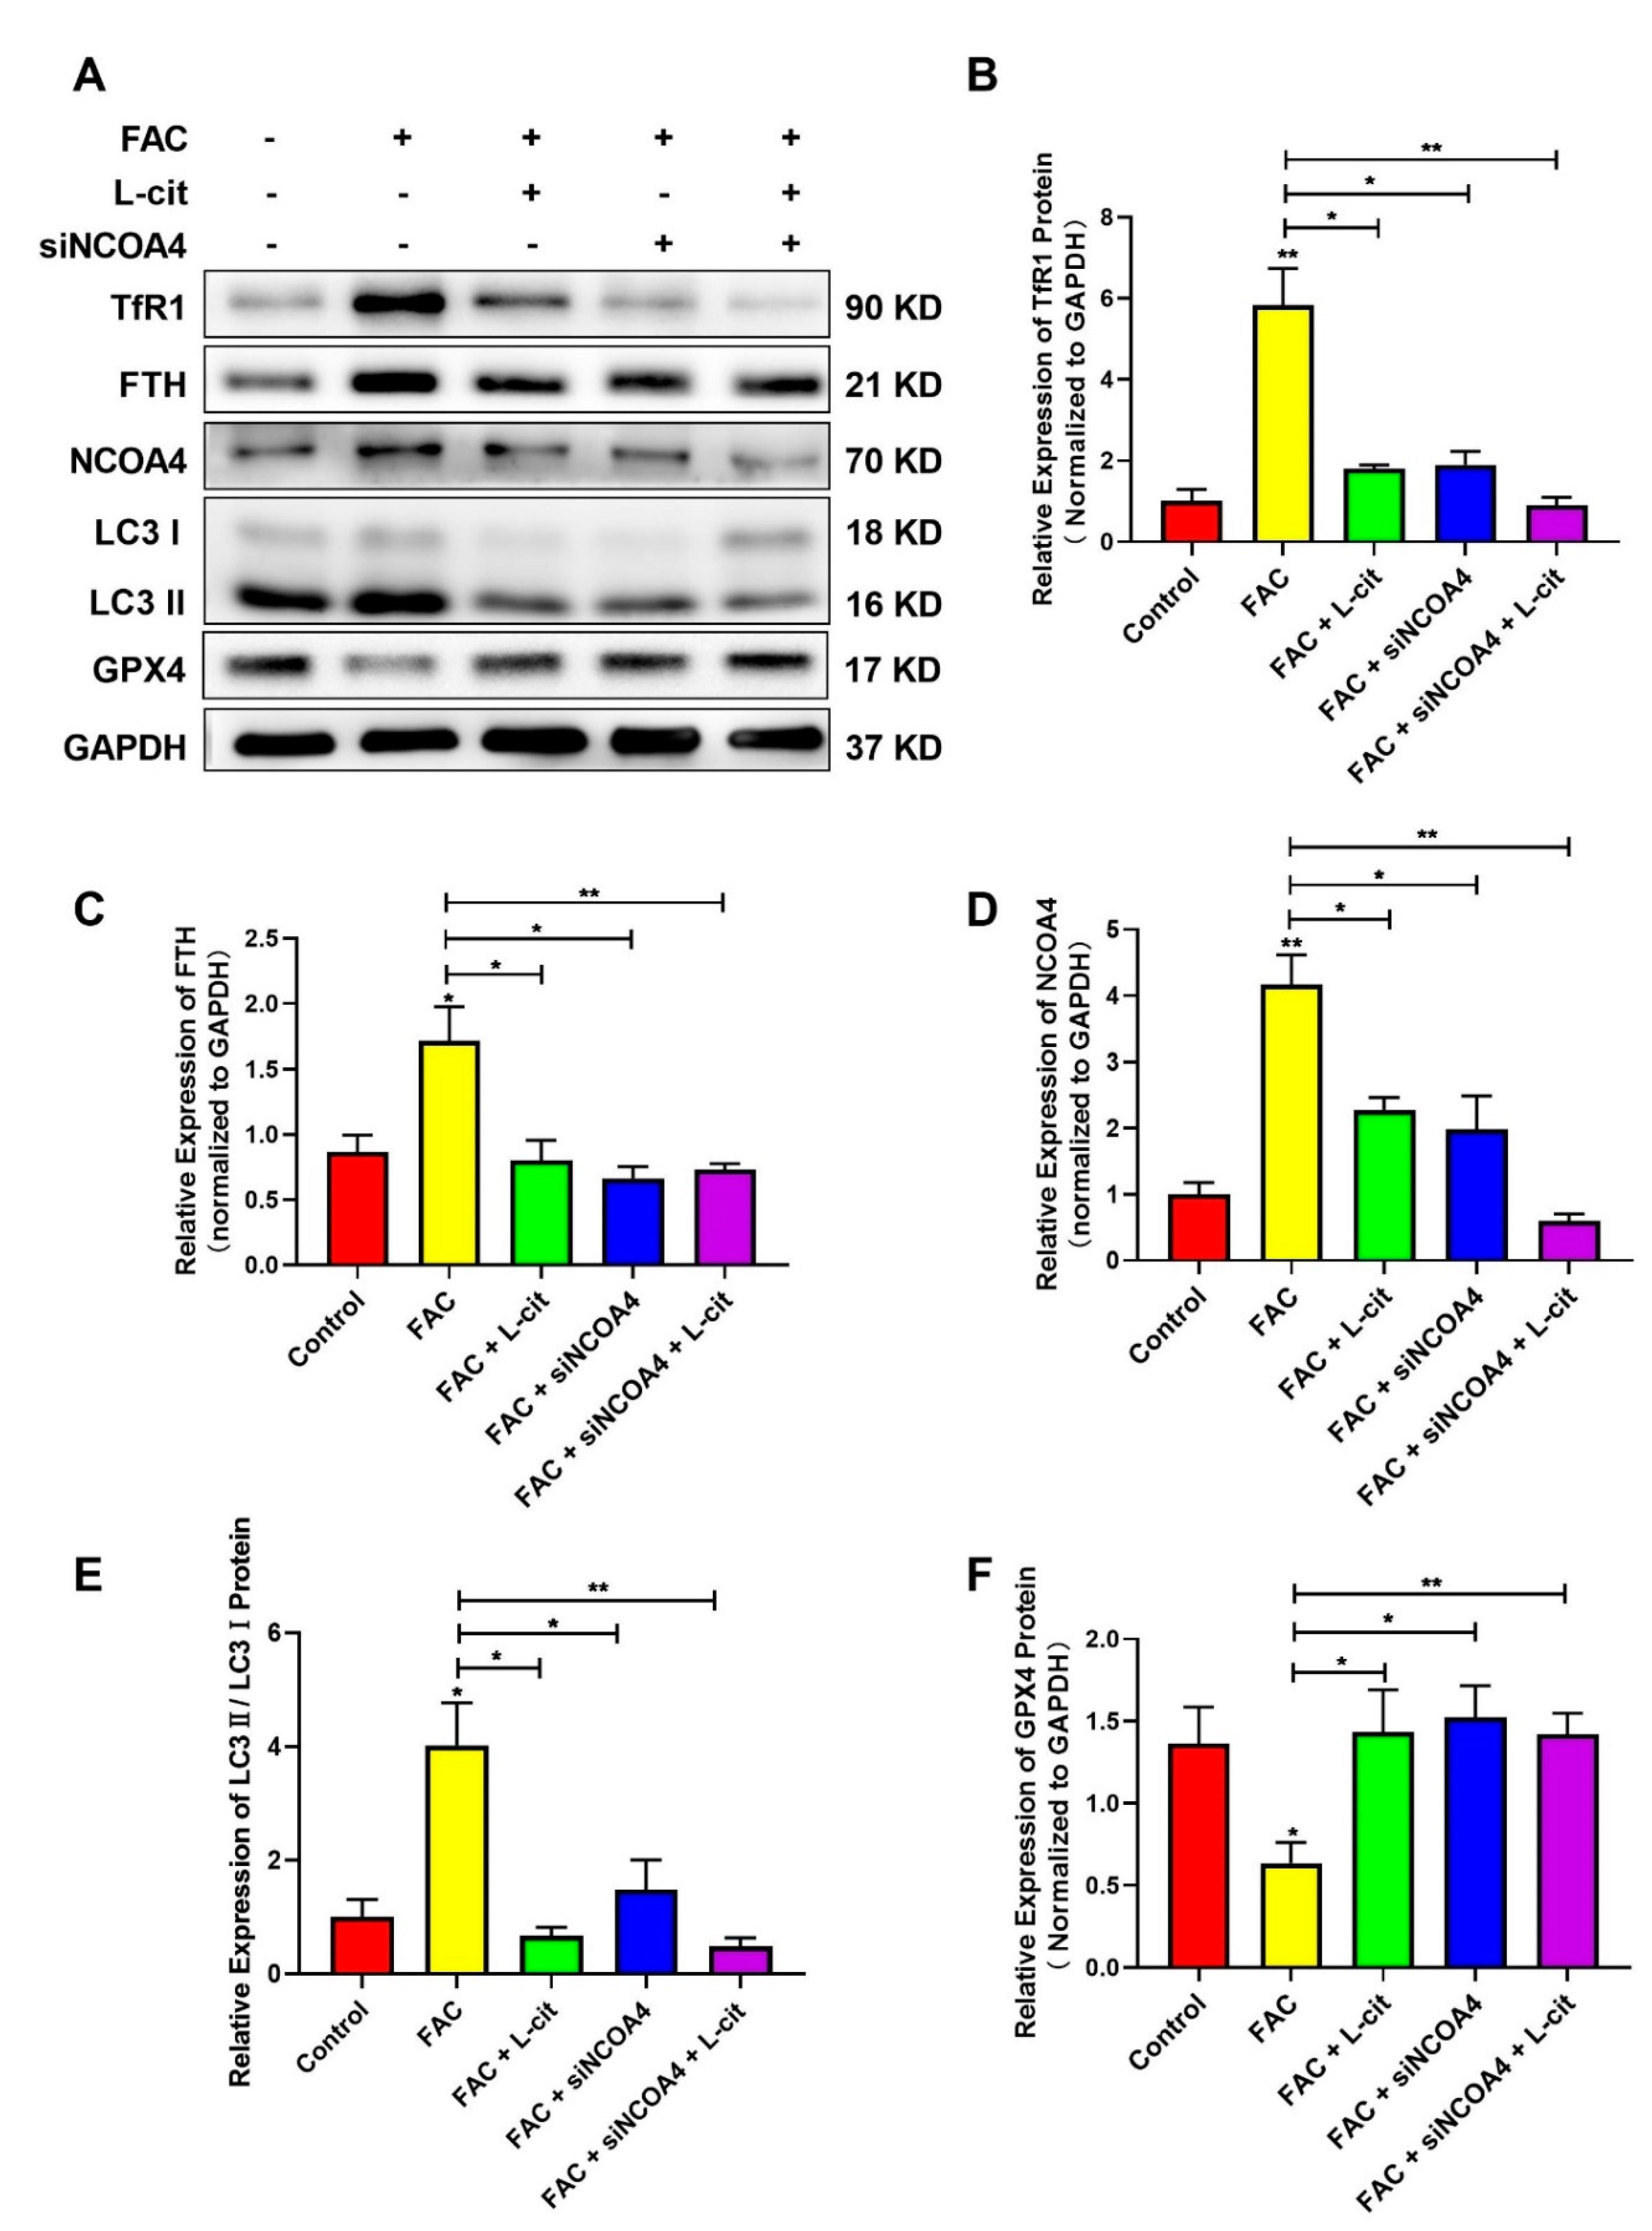
3.6. L-Cit Suppresses Ferritinophagy to Ameliorate FAC-Induced ROS Accumulation in mTEC1 Cells
3.7. L-Cit Restrains Ferritinophagy to Prevente Breakdown of Mitochondrial Membrane Potential (MMP) in mTEC1 Cells
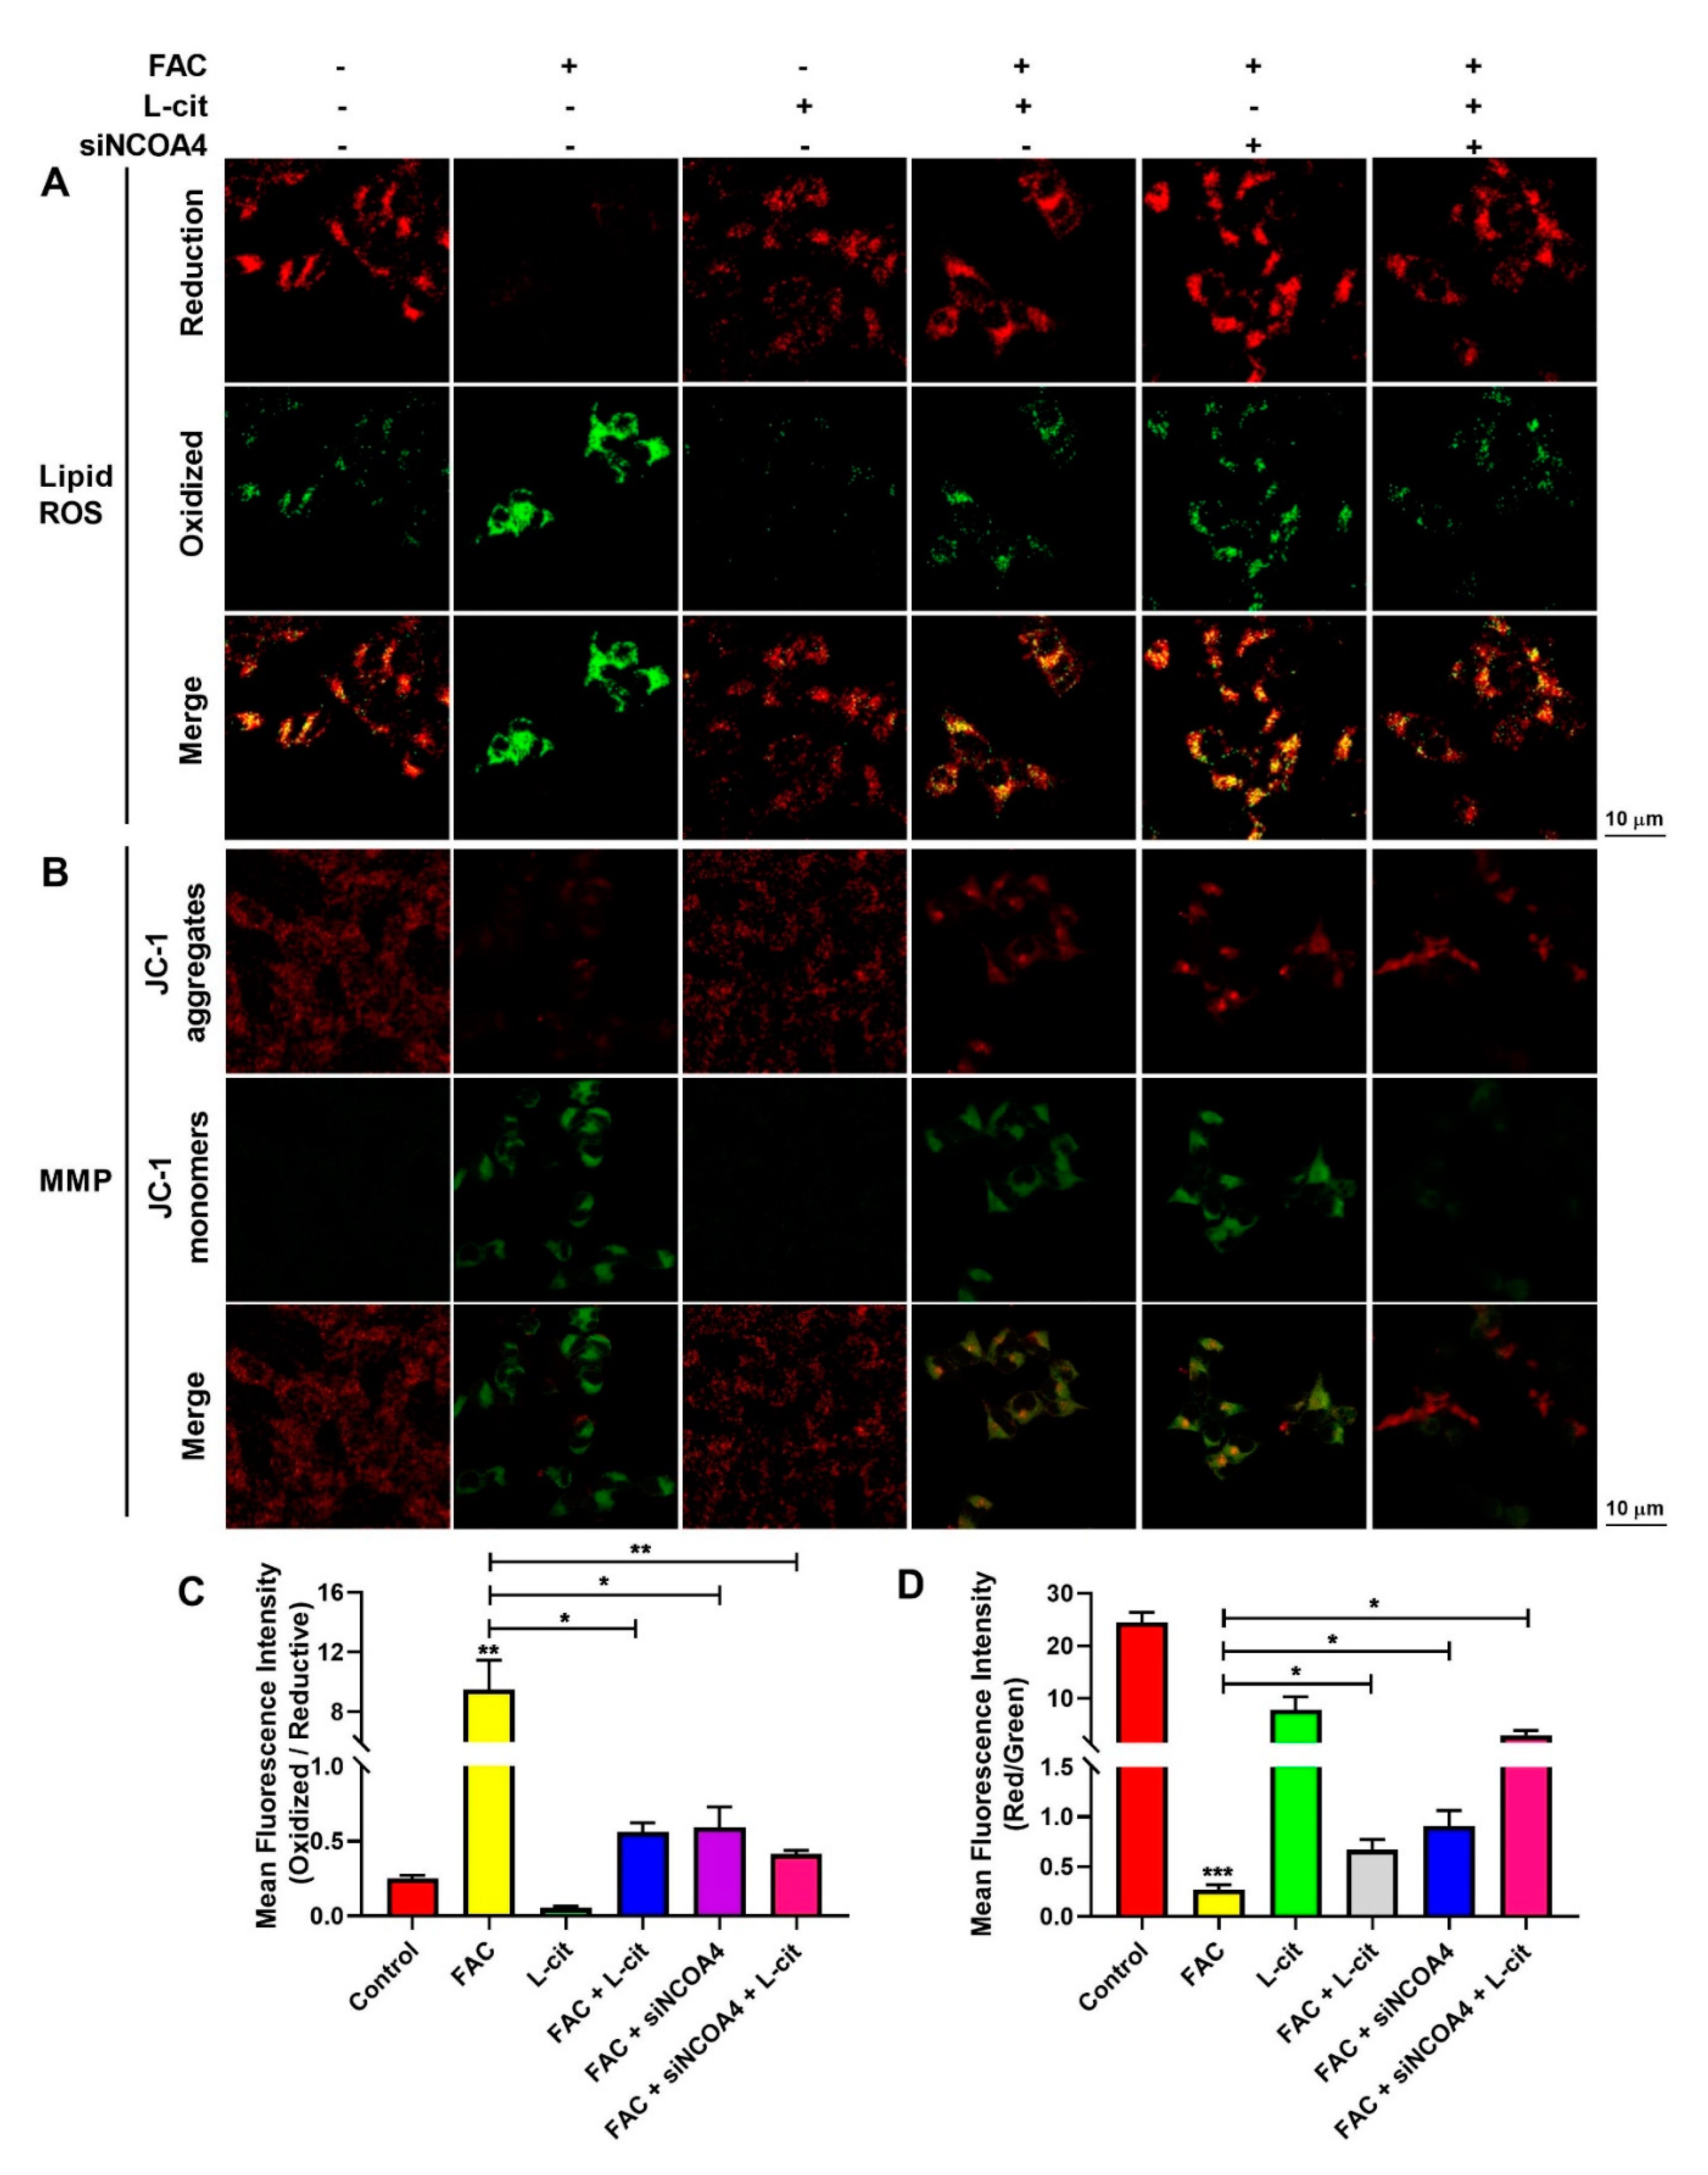
3.8. L-Cit Restrains Ferritinophagy to Suppress Ferroptosis Induced by FAC in mTEC1 Cells
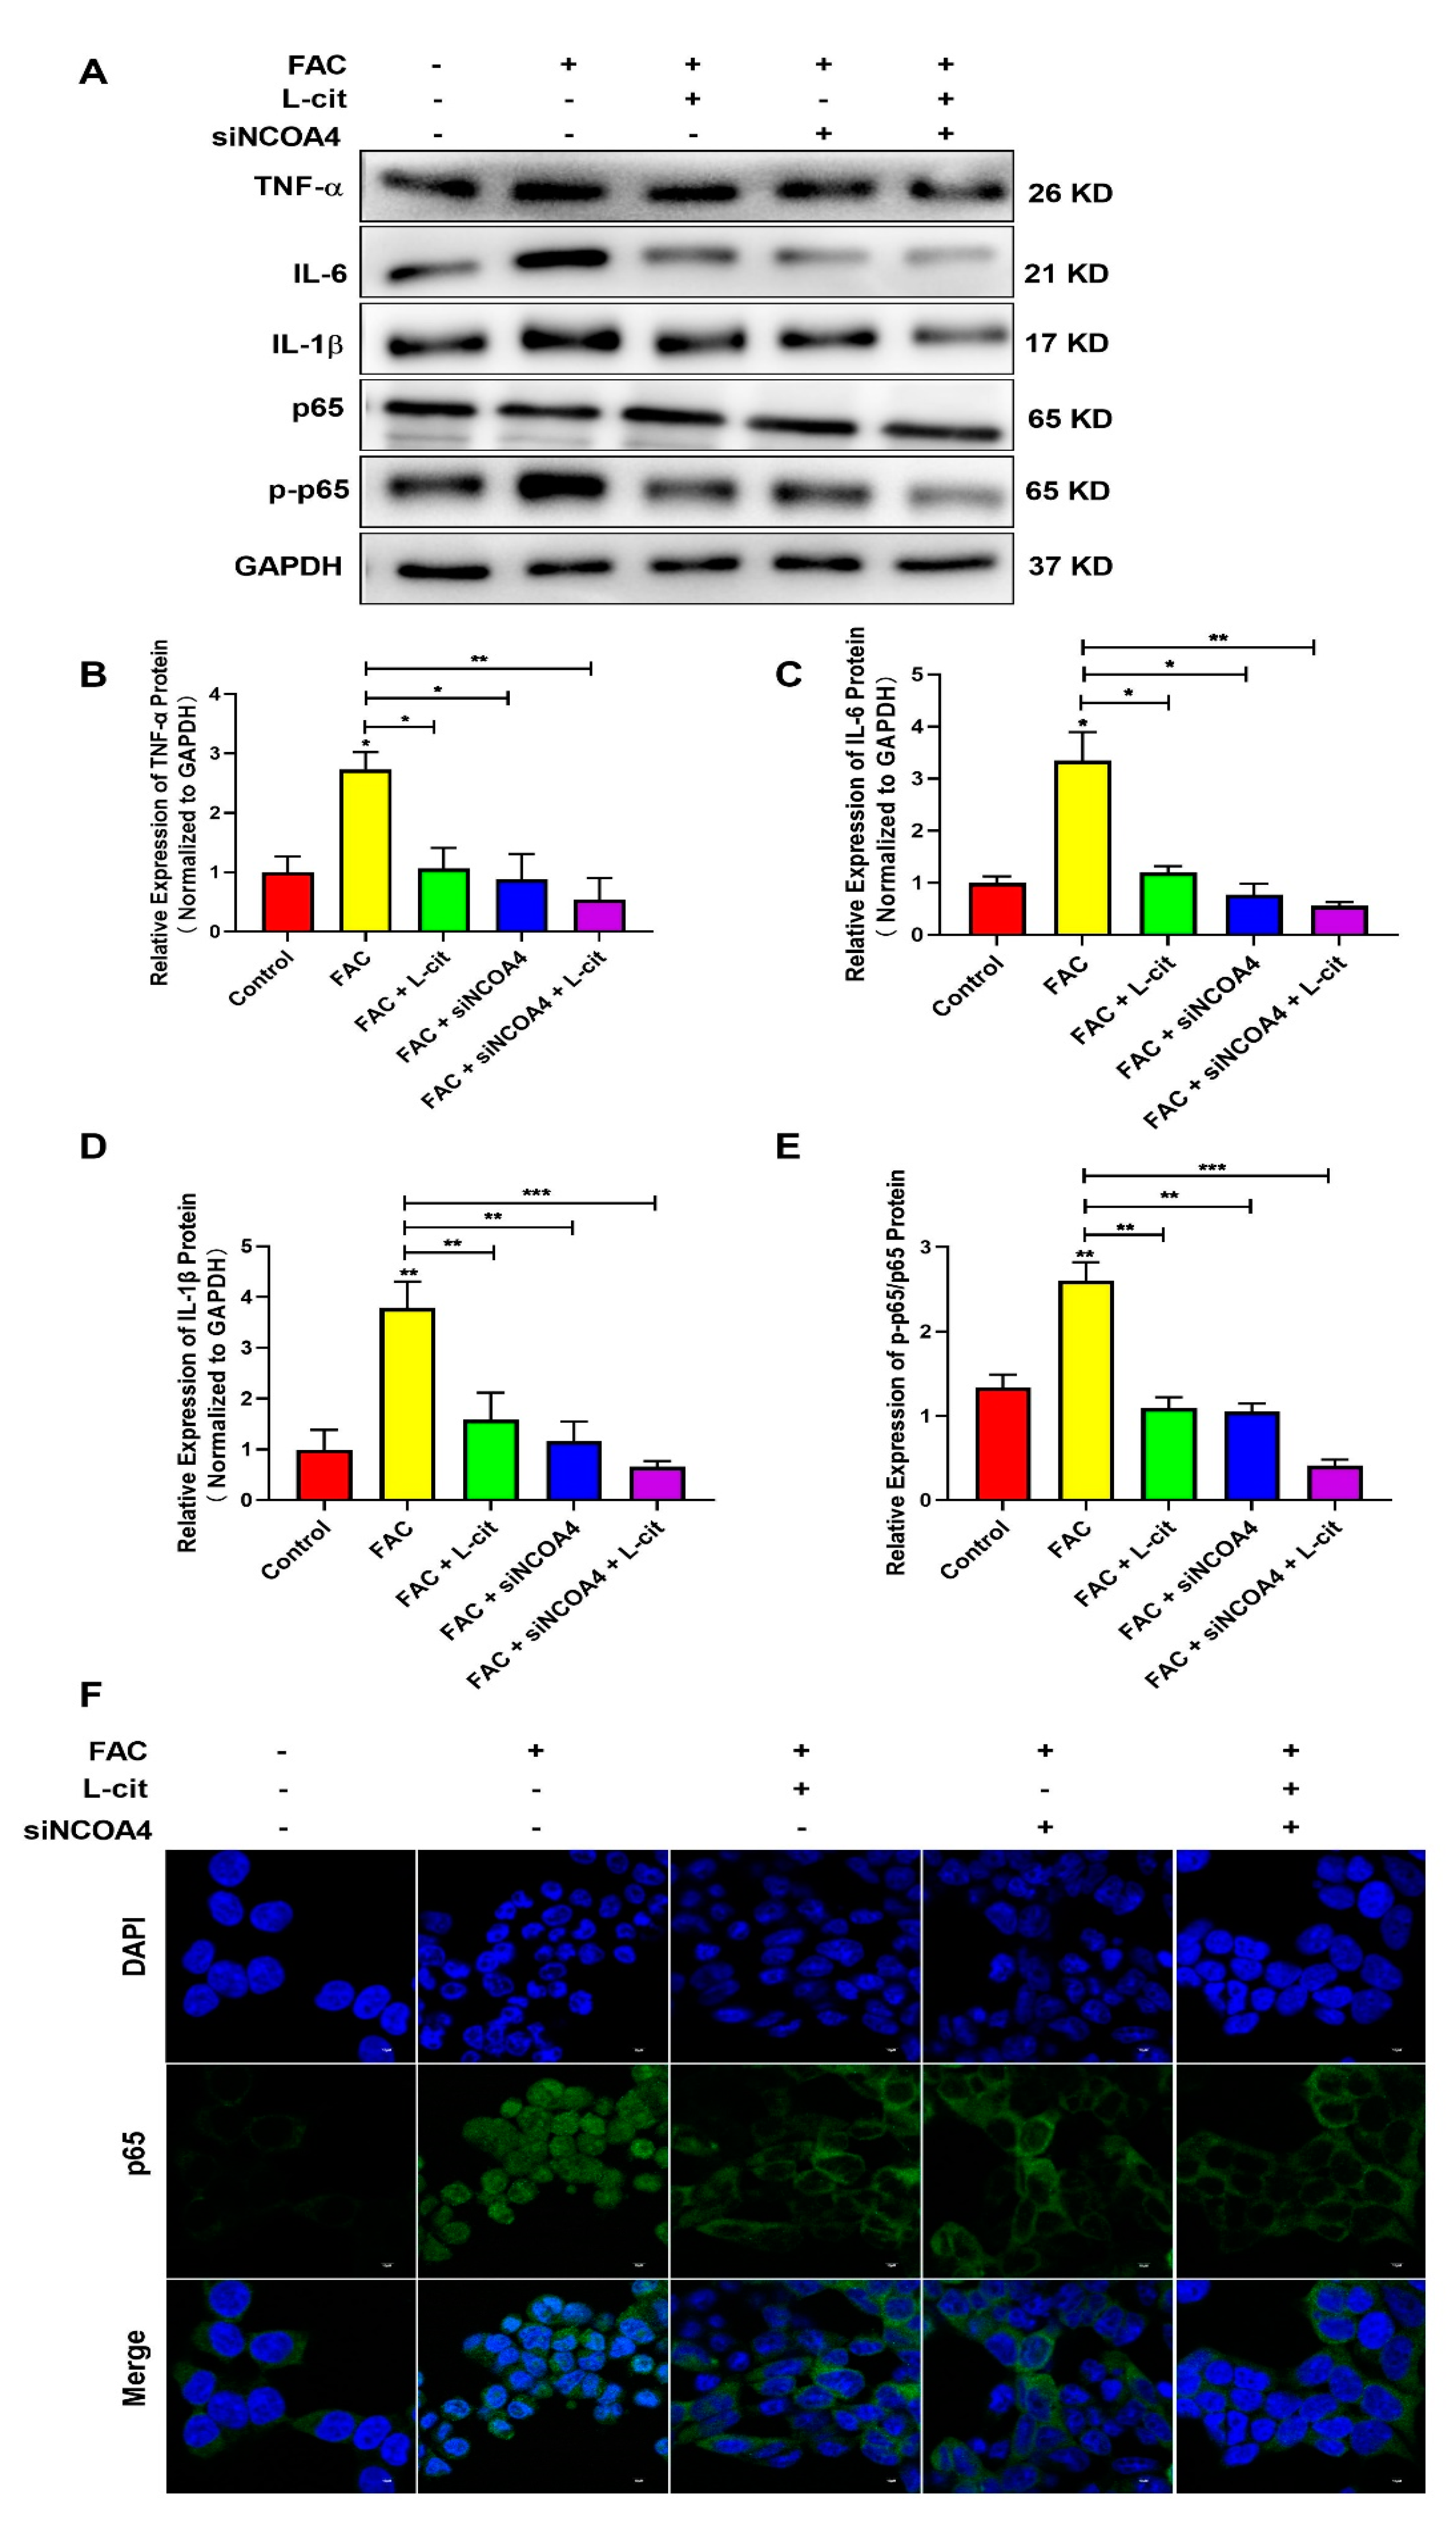
3.9. L-Cit Restrains Ferritinophagy-Mediated Ferroptosis to Alleviate Iron Overload-Induced Inflammation in mTEC1 Cells
4. Discussions
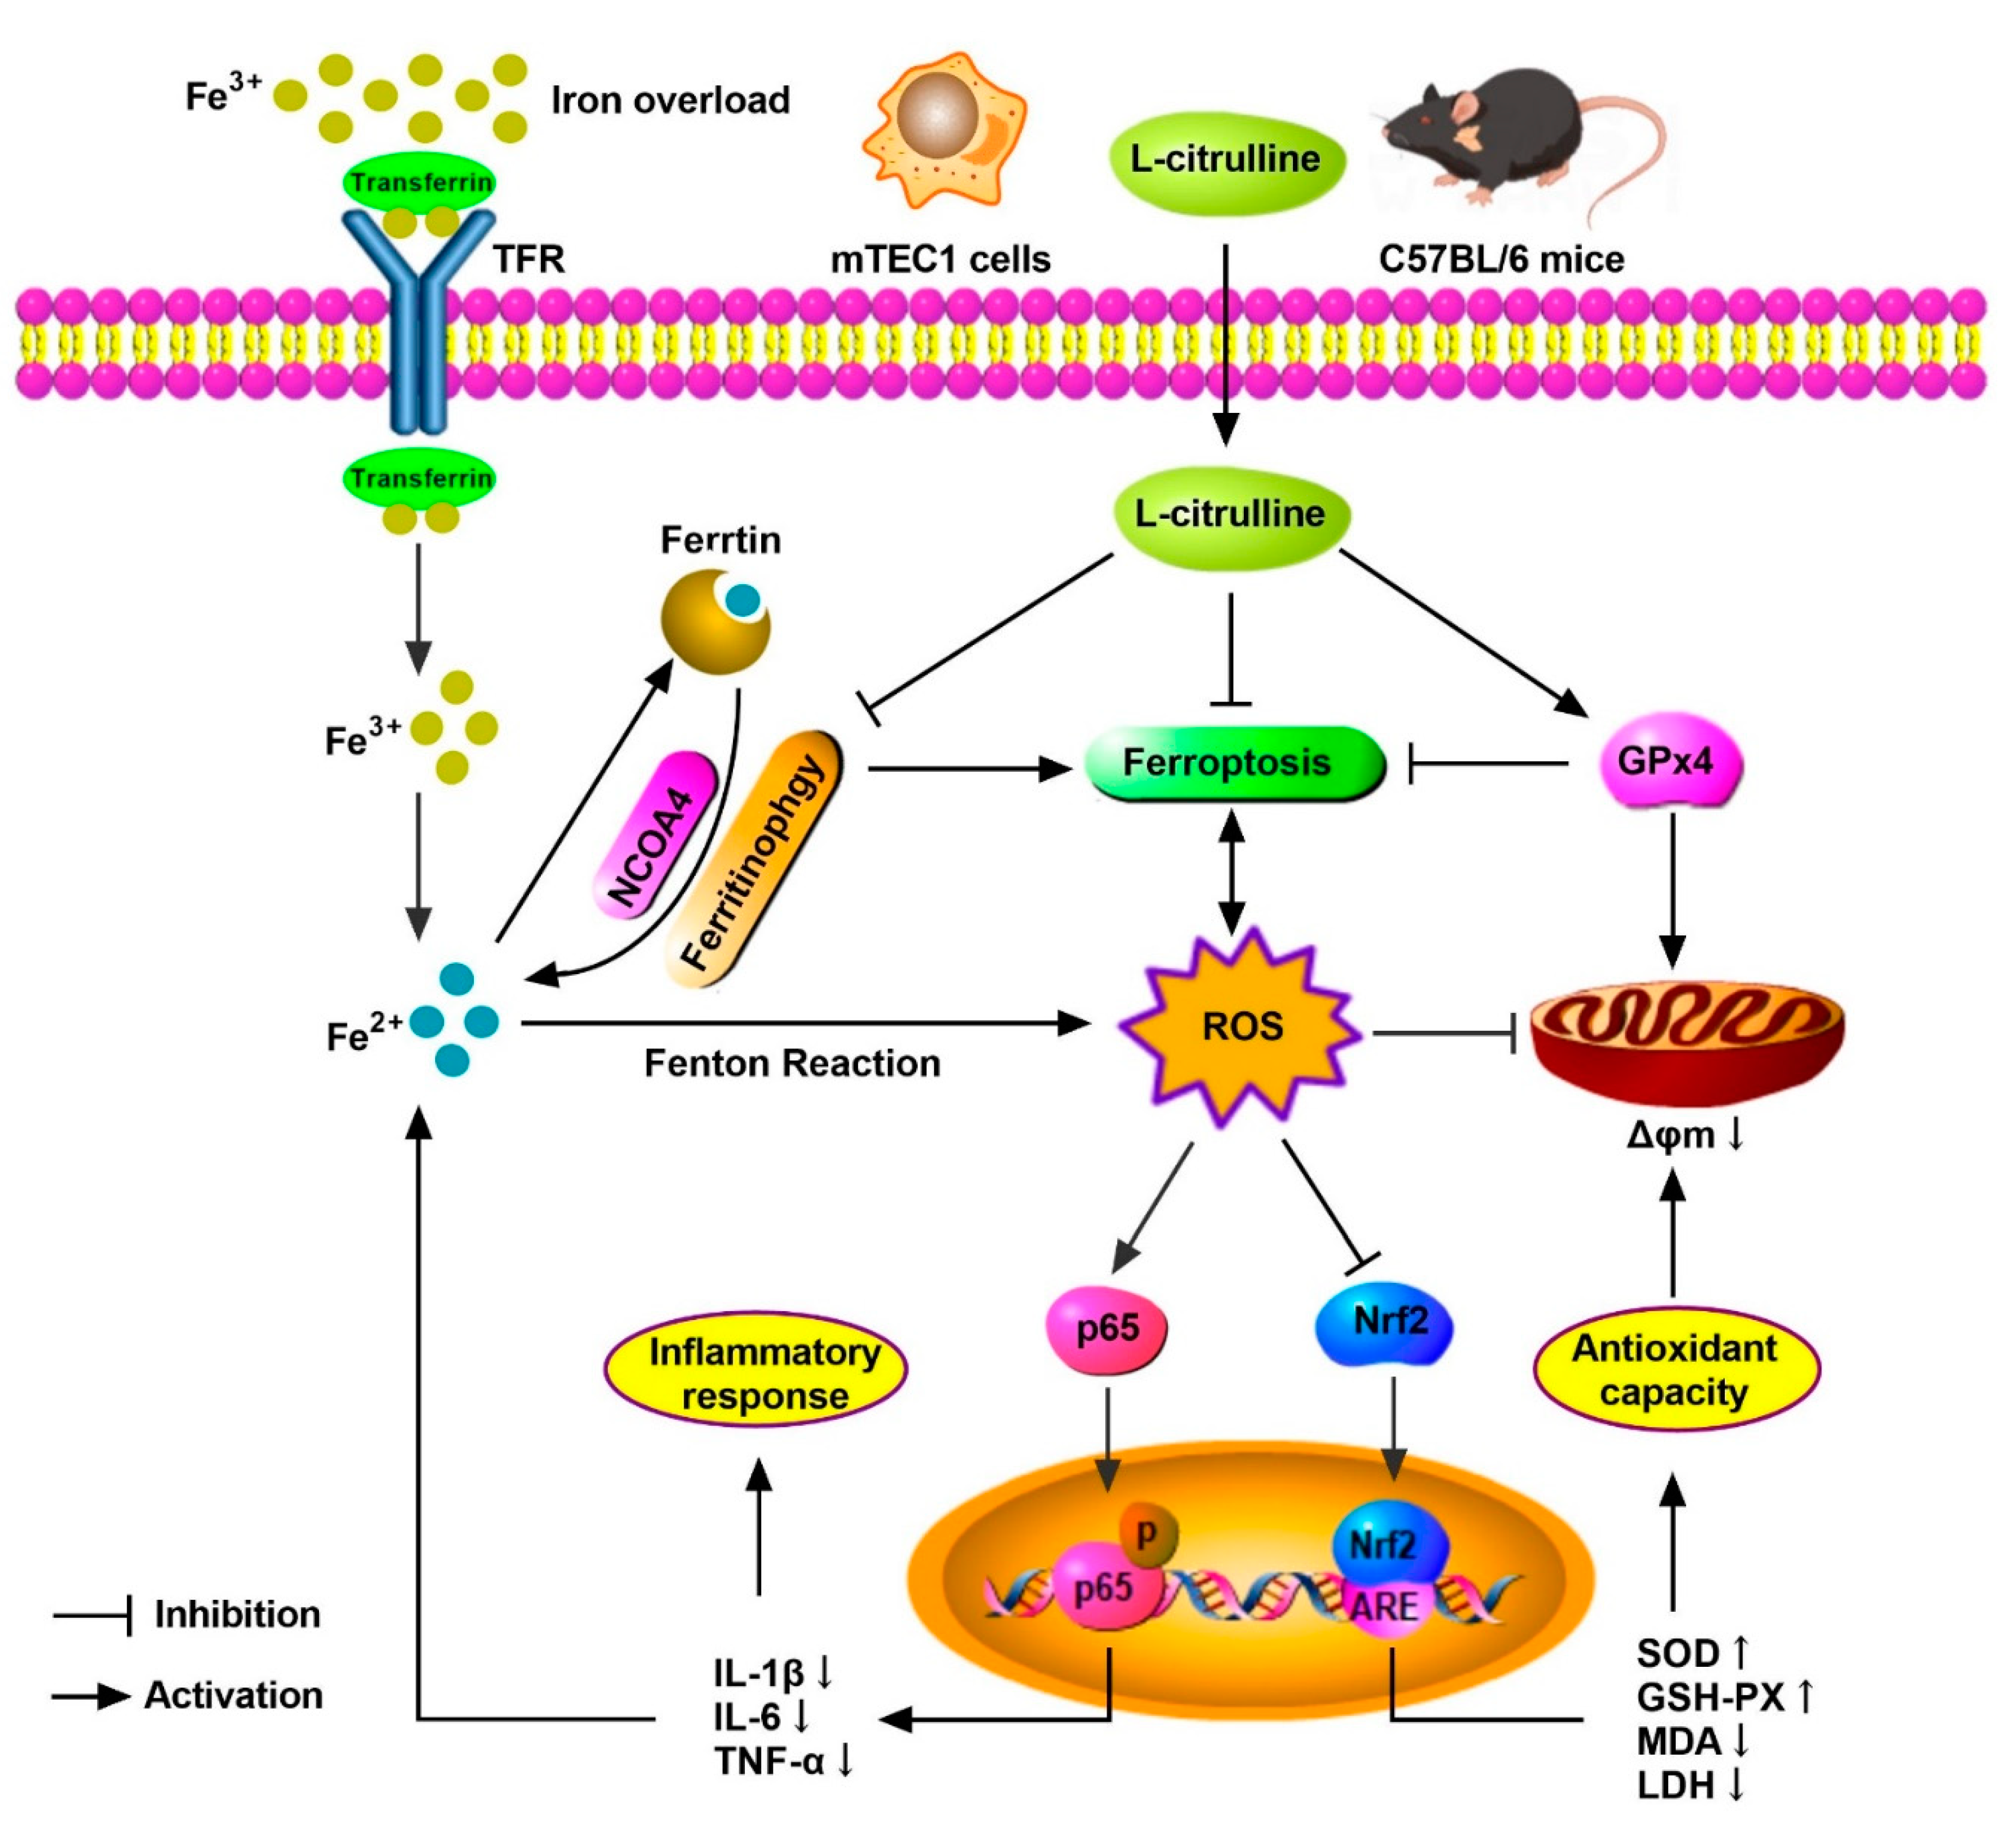
5. Conclusions
Author Contributions
Funding
Institutional Review Board Statement
Informed Consent Statement
Data Availability Statement
Conflicts of Interest
References
- Weber, S.; Parmon, A.; Kurrle, N.; Schnütgen, F.; Serve, H. The Clinical Significance of Iron Overload and Iron Metabolism in Myelodysplastic Syndrome and Acute Myeloid Leukemia. Front. Immunol. 2021, 11, 627662. [Google Scholar] [CrossRef] [PubMed]
- Malesza, I.J.; Bartkowiak-Wieczorek, J.; Winkler-Galicki, J.; Nowicka, A.; Dzięciołowska, D.; Błaszczyk, M.; Gajniak, P.; Słowińska, K.; Niepolski, L.; Walkowiak, J.; et al. The Dark Side of Iron: The Relationship between Iron, Inflammation and Gut Microbiota in Selected Diseases Associated with Iron Deficiency Anaemia—A Narrative Review. Nutrients 2022, 14, 3478. [Google Scholar] [CrossRef] [PubMed]
- Wang, H.; An, P.; Xie, E.; Wu, Q.; Fang, X.; Gao, H.; Zhang, Z.; Li, Y.; Wang, X.; Zhang, J.; et al. Characterization of ferroptosis in murine models of hemochromatosis. Hepatology 2017, 66, 449–465. [Google Scholar] [CrossRef] [Green Version]
- Yang, L.; Wang, H.; Yang, X.; Wu, Q.; An, P.; Jin, X.; Liu, W.; Huang, X.; Li, Y.; Yan, S.; et al. Auranofin mitigates systemic iron overload and induces ferroptosis via distinct mechanisms. Signal Transduct. Target. Ther. 2020, 5, 138. [Google Scholar] [CrossRef]
- Shander, A.; Berth, U.; Betta, J.; Javidroozi, M. Iron overload and toxicity: Implications for anesthesiologists. J. Clin. Anesth. 2012, 24, 419–425. [Google Scholar] [CrossRef]
- Isom, H.C.; McDevitt, E.I.; Moon, M.S. Elevated hepatic iron: A confounding factor in chronic hepatitis C. Biochim. Biophys. Acta 2009, 1790, 650–662. [Google Scholar] [CrossRef]
- Zou, D.-M.; Sun, W.-L. Relationship between Hepatitis C Virus Infection and Iron Overload. Chin. Med. J. 2017, 130, 866–871. [Google Scholar] [CrossRef]
- Kim, M.; Kim, Y.-H.; Min, S.; Lee, S.-M. High Iron Exposure from the Fetal Stage to Adulthood in Mice Alters Lipid Metabolism. Nutrients 2022, 14, 2451. [Google Scholar] [CrossRef]
- Ganz, T. Systemic iron homeostasis. Physiol. Rev. 2013, 93, 1721–1741. [Google Scholar] [CrossRef] [Green Version]
- Meynard, D.; Babitt, J.L.; Lin, H.Y. The liver: Conductor of systemic iron balance. Blood 2014, 123, 168–176. [Google Scholar] [CrossRef]
- Fu, Y.Z.; Su, S.; Gao, Y.Q.; Wang, P.P.; Huang, Z.F.; Hu, M.M.; Luo, W.W.; Li, S.; Luo, M.H.; Wang, Y.Y.; et al. Human Cytomegalovirus Tegument Protein UL82 Inhibits STING-Mediated Signaling to Evade Antiviral Immunity. Cell Host Microbe 2017, 21, 231–243. [Google Scholar] [CrossRef] [PubMed] [Green Version]
- Ni, S.; Yuan, Y.; Kuang, Y.; Li, X. Iron Metabolism and Immune Regulation. Front. Immunol. 2022, 13, 816282. [Google Scholar] [CrossRef] [PubMed]
- Nakamura, T.; Naguro, I.; Ichijo, H. Iron homeostasis and iron-regulated ROS in cell death, senescence and human diseases. Biochim. Biophys. Acta Gen. Subj. 2019, 1863, 1398–1409. [Google Scholar] [CrossRef]
- Zheng, Y.-Y.; Wang, Y.; Chen, X.; Wei, L.-S.; Wang, H.; Tao, T.; Zhou, Y.-W.; Jiang, Z.-H.; Qiu, T.-T.; Sun, Z.-Y.; et al. The thymus regulates skeletal muscle regeneration by directly promoting satellite cell expansion. J. Biol. Chem. 2022, 298, 101516. [Google Scholar] [CrossRef] [PubMed]
- Kaya Dagistanli, F.; Susleyici Duman, B.; Ozturk, M. Protective effects of a calcium channel blocker on apoptosis in thymus of neonatal STZ-diabetic rats. Acta Histochem. 2005, 107, 207–214. [Google Scholar] [CrossRef] [PubMed]
- Zivkovic, I.; Rakin, A.; Petrovic-Djergovic, D.; Miljkovic, B.; Micic, M. The effects of chronic stress on thymus innervation in the adult rat. Acta Histochem. 2005, 106, 449–458. [Google Scholar] [CrossRef]
- Pavlovic, V.; Pavlovic, D.; Kocic, G.; Sokolovic, D.; Jevtovic-Stoimenov, T.; Cekic, S.; Velickovic, D. Effect of monosodium glutamate on oxidative stress and apoptosis in rat thymus. Mol. Cell. Biochem. 2007, 303, 161–166. [Google Scholar] [CrossRef]
- Zhu, L.; Yi, X.; Ma, C.; Luo, C.; Kong, L.; Lin, X.; Gao, X.; Yuan, Z.; Wen, L.; Li, R.; et al. Betulinic Acid Attenuates Oxidative Stress in the Thymus Induced by Acute Exposure to T-2 Toxin via Regulation of the MAPK/Nrf2 Signaling Pathway. Toxins 2020, 12, 540. [Google Scholar] [CrossRef]
- Fathy, S.M.; Abdelkader, I.Y. Effect of resveratrol on the inflammatory status and oxidative stress in thymus gland and spleen of sulfoxaflor-treated rats. Environ. Toxicol. 2021, 36, 1326–1337. [Google Scholar] [CrossRef]
- Li, J.; Qiao, Z.; Hu, W.; Zhang, W.; Shah, S.W.A.; Ishfaq, M. Baicalin mitigated Mycoplasma gallisepticum-induced structural damage and attenuated oxidative stress and apoptosis in chicken thymus through the Nrf2/HO-1 defence pathway. Vet. Res. 2019, 50, 83. [Google Scholar] [CrossRef]
- De Sousa, M. Lymphoid cell positioning: A new proposal for the mechanism of control of lymphoid cell migration. Symp. Soc. Exp. Biol. 1978, 32, 393–410. [Google Scholar] [PubMed]
- Walker, E.M.; Walker, S.M. Effects of iron overload on the immune system. Ann. Clin. Lab. Sci. 2000, 30, 354–365. [Google Scholar] [PubMed]
- Bowlus, C.L. The role of iron in T cell development and autoimmunity. Autoimmun. Rev. 2003, 2, 73–78. [Google Scholar] [CrossRef]
- Lesnikov, V.A.; Lesnikova, M.P.; Deeg, H.J. Neuroimmunomodulation and aging: A role for transferrin and the hypothalamus/thymus axis. Curr. Aging Sci. 2013, 6, 21–28. [Google Scholar] [CrossRef]
- Macedo, M.F.; de Sousa, M.; Ned, R.M.; Mascarenhas, C.; Andrews, N.C.; Correia-Neves, M. Transferrin is required for early T-cell differentiation. Immunology 2004, 112, 543–549. [Google Scholar] [CrossRef]
- Kuvibidila, S.; Dardenne, M.; Savino, W.; Lepault, F. Influence of iron-deficiency anemia on selected thymus functions in mice: Thymulin biological activity, T-cell subsets, and thymocyte proliferation. Am. J. Clin. Nutr. 1990, 51, 228–232. [Google Scholar] [CrossRef]
- Ajoolabady, A.; Aslkhodapasandhokmabad, H.; Libby, P.; Tuomilehto, J.; Lip, G.Y.H.; Penninger, J.M.; Richardson, D.R.; Tang, D.; Zhou, H.; Wang, S.; et al. Ferritinophagy and ferroptosis in the management of metabolic diseases. Trends Endocrinol. Metab. TEM 2021, 32, 444–462. [Google Scholar] [CrossRef]
- Mancias, J.D.; Wang, X.; Gygi, S.P.; Harper, J.W.; Kimmelman, A.C. Quantitative proteomics identifies NCOA4 as the cargo receptor mediating ferritinophagy. Nature 2014, 509, 105–109. [Google Scholar] [CrossRef] [Green Version]
- Santana-Codina, N.; Mancias, J.D. The Role of NCOA4-Mediated Ferritinophagy in Health and Disease. Pharmaceuticals 2018, 11, 114. [Google Scholar] [CrossRef] [Green Version]
- Mou, Y.; Wu, J.; Zhang, Y.; Abdihamid, O.; Duan, C.; Li, B. Low expression of ferritinophagy-related NCOA4 gene in relation to unfavorable outcome and defective immune cells infiltration in clear cell renal carcinoma. BMC Cancer 2021, 21, 18. [Google Scholar] [CrossRef]
- Bellelli, R.; Federico, G.; Matte, A.; Colecchia, D.; Iolascon, A.; Chiariello, M.; Santoro, M.; De Franceschi, L.; Carlomagno, F. NCOA4 Deficiency Impairs Systemic Iron Homeostasis. Cell Rep. 2016, 14, 411–421. [Google Scholar] [CrossRef] [PubMed] [Green Version]
- Qiu, Y.; Cao, Y.; Cao, W.; Jia, Y.; Lu, N. The Application of Ferroptosis in Diseases. Pharmacol. Res. 2020, 159, 104919. [Google Scholar] [CrossRef] [PubMed]
- Wei, S.; Qiu, T.; Yao, X.; Wang, N.; Jiang, L.; Jia, X.; Tao, Y.; Wang, Z.; Pei, P.; Zhang, J.; et al. Arsenic induces pancreatic dysfunction and ferroptosis via mitochondrial ROS-autophagy-lysosomal pathway. J. Hazard. Mater. 2020, 384, 121390. [Google Scholar] [CrossRef] [PubMed]
- Wu, A.; Feng, B.; Yu, J.; Yan, L.; Che, L.; Zhuo, Y.; Luo, Y.; Yu, B.; Wu, D.; Chen, D. Fibroblast growth factor 21 attenuates iron overload-induced liver injury and fibrosis by inhibiting ferroptosis. Redox Biol. 2021, 46, 102131. [Google Scholar] [CrossRef]
- Sun, Y.; Chen, P.; Zhai, B.; Zhang, M.; Xiang, Y.; Fang, J.; Xu, S.; Gao, Y.; Chen, X.; Sui, X.; et al. The emerging role of ferroptosis in inflammation. Biomed. Pharmacother. 2020, 127, 110108. [Google Scholar] [CrossRef]
- Peng, J.J.; Song, W.T.; Yao, F.; Zhang, X.; Peng, J.; Luo, X.J.; Xia, X.B. Involvement of regulated necrosis in blinding diseases: Focus on necroptosis and ferroptosis. Exp. Eye Res. 2020, 191, 107922. [Google Scholar] [CrossRef]
- Martin-Sanchez, D.; Ruiz-Andres, O.; Poveda, J.; Carrasco, S.; Cannata-Ortiz, P.; Sanchez-Niño, M.D.; Ruiz Ortega, M.; Egido, J.; Linkermann, A.; Ortiz, A.; et al. Ferroptosis, but Not Necroptosis, Is Important in Nephrotoxic Folic Acid-Induced AKI. J. Am. Soc. Nephrol. JASN 2017, 28, 218–229. [Google Scholar] [CrossRef] [Green Version]
- Kim, E.H.; Wong, S.W.; Martinez, J. Programmed Necrosis and Disease:We interrupt your regular programming to bring you necroinflammation. Cell Death Differ. 2019, 26, 25–40. [Google Scholar] [CrossRef] [Green Version]
- Li, N.; Wang, W.; Zhou, H.; Wu, Q.; Duan, M.; Liu, C.; Wu, H.; Deng, W.; Shen, D.; Tang, Q. Ferritinophagy-mediated ferroptosis is involved in sepsis-induced cardiac injury. Free Radic. Biol. Med. 2020, 160, 303–318. [Google Scholar] [CrossRef]
- Li, C.; Sun, G.; Chen, B.; Xu, L.; Ye, Y.; He, J.; Bao, Z.; Zhao, P.; Miao, Z.; Zhao, L.; et al. Nuclear receptor coactivator 4-mediated ferritinophagy contributes to cerebral ischemia-induced ferroptosis in ischemic stroke. Pharmacol. Res. 2021, 174, 105933. [Google Scholar] [CrossRef]
- Chen, X.; Kang, R.; Kroemer, G.; Tang, D. Broadening horizons: The role of ferroptosis in cancer. Nat. Rev. Clin. Oncol. 2021, 18, 280–296. [Google Scholar] [CrossRef]
- Kong, Z.; Liu, R.; Cheng, Y. Artesunate alleviates liver fibrosis by regulating ferroptosis signaling pathway. Biomed. Pharmacother. Biomed. Pharmacother. 2019, 109, 2043–2053. [Google Scholar] [CrossRef]
- Sui, M.; Xu, D.; Zhao, W.; Lu, H.; Chen, R.; Duan, Y.; Li, Y.; Zhu, Y.; Zhang, L.; Zeng, L. CIRBP promotes ferroptosis by interacting with ELAVL1 and activating ferritinophagy during renal ischaemia-reperfusion injury. J. Cell. Mol. Med. 2021, 25, 6203–6216. [Google Scholar] [CrossRef]
- Lee, J.; You, J.H.; Roh, J.L. Poly(rC)-binding protein 1 represses ferritinophagy-mediated ferroptosis in head and neck cancer. Redox Biol. 2022, 51, 102276. [Google Scholar] [CrossRef]
- Guan, D.; Zhou, W.; Wei, H.; Wang, T.; Zheng, K.; Yang, C.; Feng, R.; Xu, R.; Fu, Y.; Li, C.; et al. Ferritinophagy-Mediated Ferroptosis and Activation of Keap1/Nrf2/HO-1 Pathway Were Conducive to EMT Inhibition of Gastric Cancer Cells in Action of 2,2′-Di-pyridineketone Hydrazone Dithiocarbamate Butyric Acid Ester. Oxidative Med. Cell. Longev. 2022, 2022, 3920664. [Google Scholar] [CrossRef]
- Khalaf, D.; Krüger, M.; Wehland, M.; Infanger, M.; Grimm, D. The Effects of Oral l-Arginine and l-Citrulline Supplementation on Blood Pressure. Nutrients 2019, 11, 1679. [Google Scholar] [CrossRef] [Green Version]
- Mao, Y.; Shi, D.; Li, G.; Jiang, P. Citrulline depletion by ASS1 is required for proinflammatory macrophage activation and immune responses. Mol. Cell 2022, 82, 527–541. [Google Scholar] [CrossRef]
- Sureda, A.; Cordova, A.; Ferrer, M.D.; Tauler, P.; Perez, G.; Tur, J.A.; Pons, A. Effects of L-citrulline oral supplementation on polymorphonuclear neutrophils oxidative burst and nitric oxide production after exercise. Free Radic. Res. 2009, 43, 828–835. [Google Scholar] [CrossRef]
- Ginguay, A.; De Bandt, J.P. Citrulline production and protein homeostasis. Curr. Opin. Clin. Nutr. Metab. Care 2019, 22, 371–376. [Google Scholar] [CrossRef]
- Lee, Y.-C.; Su, Y.-T.; Liu, T.-Y.; Tsai, C.-M.; Chang, C.-H.; Yu, H.-R. L-Arginine and L-Citrulline Supplementation Have Different Programming Effect on Regulatory T-Cells Function of Infantile Rats. Front. Immunol. 2018, 9, 2911. [Google Scholar] [CrossRef]
- El-Sheikh, A.A.; Ameen, S.H.; AbdEl-Fatah, S.S. Ameliorating Iron Overload in Intestinal Tissue of Adult Male Rats: Quercetin vs Deferoxamine. J. Toxicol. 2018, 2018, 8023840. [Google Scholar] [CrossRef]
- Nematbakhsh, M.; Pezeshki, Z.; Moaeidi, B.A.; Eshraghi-Jazi, F.; Talebi, A.; Nasri, H.; Baradaran, S.; Gharagozloo, M.; Safari, T.; Haghighi, M. Protective Role of Silymarin and Deferoxamine against Iron Dextran-induced Renal Iron Deposition in Male Rats. Int. J. Prev. Med. 2013, 4, 286–292. [Google Scholar]
- Farhana, A.; Lappin, S.L. Biochemistry, Lactate Dehydrogenase. In StatPearls; StatPearls Publishing LLC: Treasure Island, FL, USA, 2022. [Google Scholar]
- Forcina, G.C.; Dixon, S.J. GPX4 at the Crossroads of Lipid Homeostasis and Ferroptosis. Proteomics 2019, 19, e1800311. [Google Scholar] [CrossRef]
- Datz, C.; Müller, E.; Aigner, E. Iron overload and non-alcoholic fatty liver disease. Minerva Endocrinol. 2017, 42, 173–183. [Google Scholar] [CrossRef]
- Kang, T.C. Nuclear Factor-Erythroid 2-Related Factor 2 (Nrf2) and Mitochondrial Dynamics/Mitophagy in Neurological Diseases. Antioxidants 2020, 9, 617. [Google Scholar] [CrossRef]
- Kerins, M.J.; Ooi, A. The Roles of NRF2 in Modulating Cellular Iron Homeostasis. Antioxid. Redox Signal. 2018, 29, 1756–1773. [Google Scholar] [CrossRef] [Green Version]
- Drummen, G.P.; van Liebergen, L.C.; Op den Kamp, J.A.; Post, J.A. C11-BODIPY(581/591), an oxidation-sensitive fluorescent lipid peroxidation probe: (micro)spectroscopic characterization and validation of methodology. Free Radic. Biol. Med. 2002, 33, 473–490. [Google Scholar] [CrossRef]
- Mei, H.; Zhao, L.; Li, W.; Zheng, Z.; Tang, D.; Lu, X.; He, Y. Inhibition of ferroptosis protects House Ear Institute-Organ of Corti 1 cells and cochlear hair cells from cisplatin-induced ototoxicity. J. Cell Mol. Med. 2020, 24, 12065–12081. [Google Scholar] [CrossRef]
- Tang, M.; Chen, Z.; Wu, D.; Chen, L. Ferritinophagy/ferroptosis: Iron-related newcomers in human diseases. J. Cell Physiol. 2018, 233, 9179–9190. [Google Scholar] [CrossRef]
- Zhang, P.; Chen, L.; Zhao, Q.; Du, X.; Bi, M.; Li, Y.; Jiao, Q.; Jiang, H. Ferroptosis was more initial in cell death caused by iron overload and its underlying mechanism in Parkinson’s disease. Free Radic. Biol. Med. 2020, 152, 227–234. [Google Scholar]
- Hu, X.; Cai, X.; Ma, R.; Fu, W.; Zhang, C.; Du, X. Iron-load exacerbates the severity of atherosclerosis via inducing inflammation and enhancing the glycolysis in macrophages. J. Cell Physiol. 2019, 234, 18792–18800. [Google Scholar] [CrossRef]
- Hansen, J.B.; Moen, I.W.; Mandrup-Poulsen, T. Iron: The hard player in diabetes pathophysiology. Acta Physiol. 2014, 210, 717–732. [Google Scholar] [CrossRef]
- Nunes-Cabaço, H.; Ramalho-Dos-Santos, A.; Pires, A.R.; Martins, L.R.; Barata, J.T.; Sousa, A.E. Human CD4 T Cells from Thymus and Cord Blood Are Convertible into CD8 T Cells by IL-4. Front. Immunol. 2022, 13, 834033. [Google Scholar] [CrossRef]
- Kinsella, S.; Dudakov, J.A. When the Damage Is Done: Injury and Repair in Thymus Function. Front. Immunol. 2020, 11, 1745. [Google Scholar] [CrossRef]
- Shen, L.; Zhou, Y.; He, H.; Chen, W.; Lenahan, C.; Li, X.; Deng, Y.; Shao, A.; Huang, J. Crosstalk between Macrophages, T Cells, and Iron Metabolism in Tumor Microenvironment. Oxidative Med. Cell. Longev. 2021, 2021, 8865791. [Google Scholar] [CrossRef]
- Porto, G.; De Sousa, M. Iron overload and immunity. World J. Gastroenterol. 2007, 13, 4707–4715. [Google Scholar] [CrossRef]
- Zaccone, V.; Gasbarrini, G. From iron accumulation to organ damage. Minerva Med. 2012, 103, 123–140. [Google Scholar]
- Hayashi, S.; Nakamura, T.; Motooka, Y.; Ito, F.; Jiang, L.; Akatsuka, S.; Iwase, A.; Kajiyama, H.; Kikkawa, F.; Toyokuni, S. Novel ovarian endometriosis model causes infertility via iron-mediated oxidative stress in mice. Redox Biol. 2020, 37, 101726. [Google Scholar] [CrossRef]
- Zhu, C.; Boucheron, N.; Müller, A.C.; Májek, P.; Claudel, T.; Halilbasic, E.; Baazim, H.; Lercher, A.; Viczenczova, C.; Hainberger, D.; et al. 24-Norursodeoxycholic acid reshapes immunometabolism in CD8(+) T cells and alleviates hepatic inflammation. J. Hepatol. 2021, 75, 1164–1176. [Google Scholar] [CrossRef]
- Figueroa, A.; Wong, A.; Jaime, S.J.; Gonzales, J.U. Influence of L-citrulline and watermelon supplementation on vascular function and exercise performance. Curr. Opin. Clin. Nutr. Metab. Care 2017, 20, 92–98. [Google Scholar] [CrossRef]
- Fike, C.D.; Summar, M.; Aschner, J.L. L-citrulline provides a novel strategy for treating chronic pulmonary hypertension in newborn infants. Acta Paediatr. 2014, 103, 1019–1026. [Google Scholar] [CrossRef] [Green Version]
- Theodorou, A.A.; Zinelis, P.T.; Malliou, V.J.; Chatzinikolaou, P.N.; Margaritelis, N.V.; Mandalidis, D.; Geladas, N.D.; Paschalis, V. Acute L-Citrulline Supplementation Increases Nitric Oxide Bioavailability but Not Inspiratory Muscle Oxygenation and Respiratory Performance. Nutrients 2021, 13, 3311. [Google Scholar] [CrossRef]
- Gou, L.; Zhang, L.; Yin, C.; Jia, G.; Yin, X.; Zhuang, X.; Xu, X.; Liu, Y. Protective effect of L-citrulline against acute gastric mucosal lesions induced by ischemia-reperfusion in rats. Can. J. Physiol. Pharmacol. 2011, 89, 317–327. [Google Scholar] [CrossRef]
- Breuillard, C.; Bonhomme, S.; Couderc, R.; Cynober, L.; De Bandt, J.P. In vitro anti-inflammatory effects of citrulline on peritoneal macrophages in Zucker diabetic fatty rats. Br. J. Nutr. 2015, 113, 120–124. [Google Scholar] [CrossRef] [Green Version]
- Cai, B.; Li, C.; Zhou, M.; Zhou, A.; Chu, Z.; Huang, H.; Huang, X. Effects of citrulline on intestinal inflammation and peripheral blood mononuclear cells in rats with ulcerative colitis. Chin. J. Gastroenterol. Hepatol. 2020, 29, 908–910. (In Chinese) [Google Scholar] [CrossRef]
- Li, S.; Zhang, H.; Wang, Y.; Jiang, L.; Sheng, S. Investigation of the protective effects of citrulline pretreatment in lipopolysaccharide-induced lung injury in mice. Int. J. Anesthesiol. Resusc. 2020, 41, 545–549. (In Chinese) [Google Scholar]
- Kao, J.K.; Wang, S.C.; Ho, L.W.; Huang, S.W.; Chang, S.H.; Yang, R.C.; Ke, Y.Y.; Wu, C.Y.; Wang, J.Y.; Shieh, J.J. Chronic Iron Overload Results in Impaired Bacterial Killing of THP-1 Derived Macrophage through the Inhibition of Lysosomal Acidification. PLoS ONE 2016, 11, e0156713. [Google Scholar] [CrossRef] [Green Version]
- Nairz, M.; Schroll, A.; Haschka, D.; Dichtl, S.; Tymoszuk, P.; Demetz, E.; Moser, P.; Haas, H.; Fang, F.C.; Theurl, I.; et al. Genetic and Dietary Iron Overload Differentially Affect the Course of Salmonella Typhimurium Infection. Front. Cell Infect. Microbiol. 2017, 7, 110. [Google Scholar] [CrossRef] [Green Version]
- Habib, H.M.; Ibrahim, S.; Zaim, A.; Ibrahim, W.H. The role of iron in the pathogenesis of COVID-19 and possible treatment with lactoferrin and other iron chelators. Biomed. Pharmacother. Biomed. Pharmacother. 2021, 136, 111228. [Google Scholar] [CrossRef]
- Santana-Codina, N.; Gikandi, A.; Mancias, J.D. The Role of NCOA4-Mediated Ferritinophagy in Ferroptosis. Adv. Exp. Med. Biol. 2021, 1301, 41–57. [Google Scholar] [CrossRef]
- Liu, J.; Kuang, F.; Kroemer, G.; Klionsky, D.J.; Kang, R.; Tang, D. Autophagy-Dependent Ferroptosis: Machinery and Regulation. Cell Chem. Biol. 2020, 27, 420–435. [Google Scholar] [CrossRef]
- Dai, E.; Han, L.; Liu, J.; Xie, Y.; Kroemer, G.; Klionsky, D.J.; Zeh, H.J.; Kang, R.; Wang, J.; Tang, D. Autophagy-dependent ferroptosis drives tumor-associated macrophage polarization via release and uptake of oncogenic KRAS protein. Autophagy 2020, 16, 2069–2083. [Google Scholar] [CrossRef]
- Wang, W.; Green, M.; Choi, J.E.; Gijón, M.; Kennedy, P.D.; Johnson, J.K.; Liao, P.; Lang, X.; Kryczek, I.; Sell, A.; et al. CD8(+) T cells regulate tumour ferroptosis during cancer immunotherapy. Nature 2019, 569, 270–274. [Google Scholar] [CrossRef]


Publisher’s Note: MDPI stays neutral with regard to jurisdictional claims in published maps and institutional affiliations. |
© 2022 by the authors. Licensee MDPI, Basel, Switzerland. This article is an open access article distributed under the terms and conditions of the Creative Commons Attribution (CC BY) license (https://creativecommons.org/licenses/by/4.0/).
Share and Cite
Ba, T.; Zhao, D.; Chen, Y.; Zeng, C.; Zhang, C.; Niu, S.; Dai, H. L-Citrulline Supplementation Restrains Ferritinophagy-Mediated Ferroptosis to Alleviate Iron Overload-Induced Thymus Oxidative Damage and Immune Dysfunction. Nutrients 2022, 14, 4549. https://doi.org/10.3390/nu14214549
Ba T, Zhao D, Chen Y, Zeng C, Zhang C, Niu S, Dai H. L-Citrulline Supplementation Restrains Ferritinophagy-Mediated Ferroptosis to Alleviate Iron Overload-Induced Thymus Oxidative Damage and Immune Dysfunction. Nutrients. 2022; 14(21):4549. https://doi.org/10.3390/nu14214549
Chicago/Turabian StyleBa, Tongtong, Dai Zhao, Yiqin Chen, Cuiping Zeng, Cheng Zhang, Sai Niu, and Hanchuan Dai. 2022. "L-Citrulline Supplementation Restrains Ferritinophagy-Mediated Ferroptosis to Alleviate Iron Overload-Induced Thymus Oxidative Damage and Immune Dysfunction" Nutrients 14, no. 21: 4549. https://doi.org/10.3390/nu14214549