
Artificially Sweetened Beverage Consumption and Cancer Risk: A Comprehensive Dose–Response Meta-Analysis of Prospective Studies
Abstract
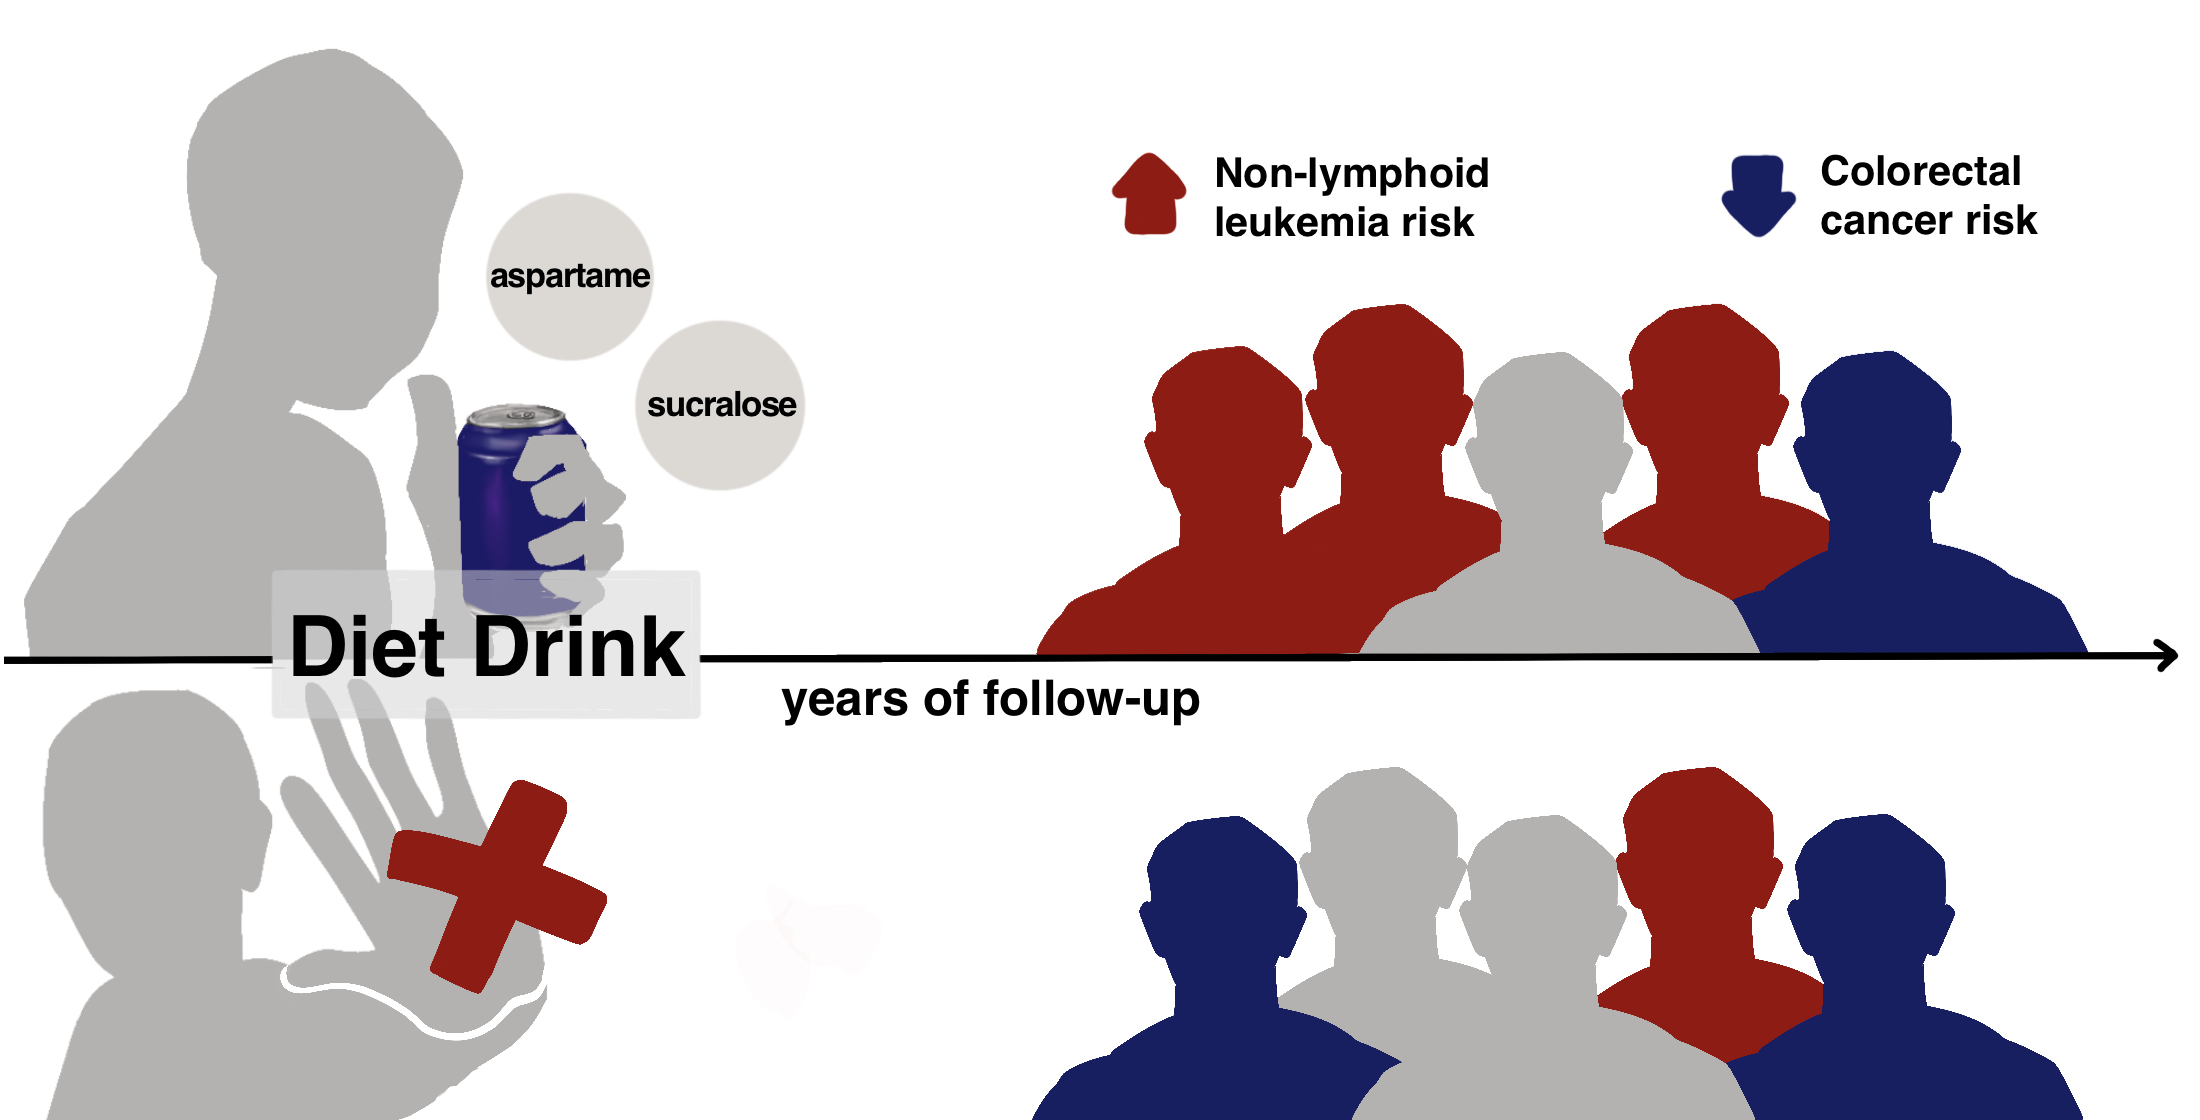
:
1. Introduction
2. Materials and Methods
2.1. Search Strategy
2.2. Study Selection
2.3. Data Extraction
2.4. Risk of Bias Assessment and Quality of Evidence
2.5. Data Analysis
3. Results
3.1. Literature Search
3.2. Study Characteristics and Quality Assessment
3.3. ASB Consumption and Risk of Overall Cancer
3.4. ASB Consumption and Risk of Hematopoietic Cancers
3.5. ASB Consumption and Risk of Digestive System Cancers
3.6. ASB Consumption and Risk of Hormone-Related Cancers
3.7. ASB Consumption and Risk of Other Cancers (Kidney Cancer, Thyroid Cancer, and Gliomas)
3.8. ASB Consumption and Risk of Cancer Related to Obesity
3.9. Subgroup Analyses, Sensitivity Analyses, and Publication Bias
3.10. Certainty of Evidence
4. Discussion
5. Conclusions
Supplementary Materials
Author Contributions
Funding
Institutional Review Board Statement
Informed Consent Statement
Data Availability Statement
Conflicts of Interest
References
- Zhou, M.; Wang, H.; Zeng, X.; Yin, P.; Zhu, J.; Chen, W.; Li, X.; Wang, L.; Liu, Y.; Liu, J.; et al. Mortality, morbidity, and risk factors in China and its provinces, 1990–2017: A systematic analysis for the Global Burden of Disease Study 2017. Lancet 2019, 394, 1145–1158. [Google Scholar] [CrossRef] [Green Version]
- Malik, V.S.; Hu, F.B. The role of sugar-sweetened beverages in the global epidemics of obesity and chronic diseases. Nat. Rev. Endocrinol. 2022, 18, 205–218. [Google Scholar] [CrossRef] [PubMed]
- Atkinson, F.S.; Brand-Miller, J.C.; Foster-Powell, K.; Buyken, A.E.; Goletzke, J. International tables of glycemic index and glycemic load values 2021: A systematic review. Am. J. Clin. Nutr. 2021, 114, 1625–1632. [Google Scholar] [CrossRef] [PubMed]
- Jenkins, D.J.; Wolever, T.M.; Taylor, R.H.; Barker, H.; Fielden, H.; Baldwin, J.M.; Bowling, A.C.; Newman, H.C.; Jenkins, A.L.; Goff, D.V. Glycemic index of foods: A physiological basis for carbohydrate exchange. Am. J. Clin. Nutr. 1981, 34, 362–366. [Google Scholar] [CrossRef] [PubMed] [Green Version]
- Augustin, L.S.A.; Kendall, C.W.C.; Jenkins, D.J.A.; Willett, W.C.; Astrup, A.; Barclay, A.W.; Björck, I.; Brand-Miller, J.C.; Brighenti, F.; Buyken, A.E.; et al. Glycemic index, glycemic load and glycemic response: An International Scientific Consensus Summit from the International Carbohydrate Quality Consortium (ICQC). Nutr. Metab. Cardiovasc. Dis. 2015, 25, 795–815. [Google Scholar] [CrossRef] [PubMed] [Green Version]
- Bell, S.J.; Sears, B. Low-glycemic-load diets: Impact on obesity and chronic diseases. Crit. Rev. Food Sci. Nutr. 2003, 43, 357–377. [Google Scholar] [CrossRef] [PubMed]
- Brand-Miller, J.C. Glycemic load and chronic disease. Nutr. Rev. 2003, 61, S49–S55. [Google Scholar] [CrossRef]
- Long, T.; Liu, K.; Long, J.; Li, J.; Cheng, L. Dietary glycemic index, glycemic load and cancer risk: A meta-analysis of prospective cohort studies. Eur. J. Nutr. 2022, 61, 2115–2127. [Google Scholar] [CrossRef]
- Schwingshackl, L.; Schwedhelm, C.; Hoffmann, G.; Knüppel, S.; Iqbal, K.; Andriolo, V.; Bechthold, A.; Schlesinger, S.; Boeing, H. Food Groups and Risk of Hypertension: A Systematic Review and Dose-Response Meta-Analysis of Prospective Studies. Adv. Nutr. 2017, 8, 793–803. [Google Scholar] [CrossRef] [Green Version]
- Malik, V.S.; Pan, A.; Willett, W.C.; Hu, F.B. Sugar-sweetened beverages and weight gain in children and adults: A systematic review and meta-analysis. Am. J. Clin. Nutr. 2013, 98, 1084–1102. [Google Scholar] [CrossRef]
- Imamura, F.; O’Connor, L.; Ye, Z.; Mursu, J.; Hayashino, Y.; Bhupathiraju, S.N.; Forouhi, N.G. Consumption of sugar sweetened beverages, artificially sweetened beverages, and fruit juice and incidence of type 2 diabetes: Systematic review, meta-analysis, and estimation of population attributable fraction. BMJ-Br. Med. J. 2015, 351, h3576. [Google Scholar] [CrossRef] [Green Version]
- Li, Y.; Guo, L.; He, K.; Huang, C.; Tang, S. Consumption of sugar-sweetened beverages and fruit juice and human cancer: A systematic review and dose-response meta-analysis of observational studies. J. Cancer 2021, 12, 3077–3088. [Google Scholar] [CrossRef]
- Micha, R.; Penalvo, J.L.; Cudhea, F.; Imamura, F.; Rehm, C.D.; Mozaffarian, D. Association Between Dietary Factors and Mortality from Heart Disease, Stroke, and Type 2 Diabetes in the United States. Jama-J. Am. Med. Assoc. 2017, 317, 912–924. [Google Scholar] [CrossRef] [Green Version]
- Sylvetsky, A.C.; Rother, K.I. Trends in the consumption of low-calorie sweeteners. Physiol. Behav. 2016, 164, 446–450. [Google Scholar] [CrossRef] [PubMed] [Green Version]
- Rother, K.I.; Conway, E.M.; Sylvetsky, A.C. How Non-nutritive Sweeteners Influence Hormones and Health. Trends Endocrinol. Metab. 2018, 29, 455–467. [Google Scholar] [CrossRef]
- Nakagawa, Y.; Nagasawa, M.; Yamada, S.; Hara, A.; Mogami, H.; Nikolaev, V.O.; Lohse, M.J.; Shigemura, N.; Ninomiya, Y.; Kojima, I. Sweet taste receptor expressed in pancreatic beta-cells activates the calcium and cyclic AMP signaling systems and stimulates insulin secretion. PLoS ONE 2009, 4, e5106. [Google Scholar] [CrossRef] [PubMed] [Green Version]
- Duffy, V.B.; Anderson, G.H. Position of the American Dietetic Association: Use of nutritive and nonnutritive sweeteners. J. Am. Diet. Assoc. 1998, 98, 580–587. [Google Scholar] [PubMed]
- Fakhouri, T.H.; Kit, B.K.; Ogden, C.L. Consumption of diet drinks in the United States, 2009–2010. NCHS Data Brief 2012, 109, 1–8. [Google Scholar]
- Suez, J.; Korem, T.; Zeevi, D.; Zilberman-Schapira, G.; Thaiss, C.A.; Maza, O.; Israeli, D.; Zmora, N.; Gilad, S.; Weinberger, A.; et al. Artificial sweeteners induce glucose intolerance by altering the gut microbiota. Nature 2014, 514, 181–186. [Google Scholar] [CrossRef] [PubMed]
- Qin, P.; Li, Q.; Zhao, Y.; Chen, Q.; Sun, X.; Liu, Y.; Li, H.; Wang, T.; Chen, X.; Zhou, Q.; et al. Sugar and artificially sweetened beverages and risk of obesity, type 2 diabetes mellitus, hypertension, and all-cause mortality: A dose-response meta-analysis of prospective cohort studies. Eur. J. Epidemiol. 2020, 35, 655–671. [Google Scholar] [CrossRef]
- Maghiari, A.L.; Coricovac, D.; Pinzaru, I.A.; Macașoi, I.G.; Marcovici, I.; Simu, S.; Navolan, D.; Dehelean, C. High Concentrations of Aspartame Induce Pro-Angiogenic Effects in Ovo and Cytotoxic Effects in HT-29 Human Colorectal Carcinoma Cells. Nutrients 2020, 12, 3600. [Google Scholar] [CrossRef] [PubMed]
- Bandyopadhyay, A.; Ghoshal, S.; Mukherjee, A. Genotoxicity testing of low-calorie sweeteners: Aspartame, acesulfame-K., and saccharin. Drug Chem. Toxicol. 2008, 31, 447–457. [Google Scholar] [CrossRef] [PubMed]
- Alleva, R.; Borghi, B.; Santarelli, L.; Strafella, E.; Carbonari, D.; Bracci, M.; Tomasetti, M. In vitro effect of aspartame in angiogenesis induction. Toxicol. Vitr. 2011, 25, 286–293. [Google Scholar] [CrossRef] [PubMed]
- Soffritti, M.; Belpoggi, F.; Degli Esposti, D.; Lambertini, L.; Tibaldi, E.; Rigano, A. First experimental demonstration of the multipotential carcinogenic effects of aspartame administered in the feed to Sprague-Dawley rats. Environ. Health Perspect. 2006, 114, 379–385. [Google Scholar] [CrossRef] [PubMed] [Green Version]
- Soffritti, M.; Padovani, M.; Tibaldi, E.; Falcioni, L.; Manservisi, F.; Lauriola, M.; Bua, L.; Manservigi, M.; Belpoggi, F. Sucralose administered in feed, beginning prenatally through lifespan, induces hematopoietic neoplasias in male swiss mice. Int. J. Occup. Environ. Health 2016, 22, 7–17. [Google Scholar]
- Ishii, H. Incidence of brain tumors in rats fed aspartame. Toxicol. Lett. 1981, 7, 433–437. [Google Scholar] [PubMed]
- Jeffrey, A.M.; Williams, G.M. Lack of DNA-damaging activity of five non-nutritive sweeteners in the rat hepatocyte/DNA repair assay. Food Chem. Toxicol. 2000, 38, 335–338. [Google Scholar] [CrossRef]
- Bucher Bristol, J.R.; French, D.W.; Hailey, J.E.; Haseman, J.R.; Herbert, J.K.; Malarkey, R.A.; Maronpot, D.E.; Peckham, R.R.; Roycroft, J.C. NTP report on the toxicology studies of aspartame (CAS No. 22839-47-0) in genetically modified (FVB Tg.AC hemizygous) and B6.129-Cdkn2atm1Rdp (N2) deficient mice and carcinogenicity studies of aspartame in genetically modified. Natl. Toxicol. Program Genet. Modif. Model. Rep. 2005, 1, 1–222. [Google Scholar]
- Sullivan, J.W. Epidemiologic survey of bladder cancer in greater New Orleans. J. Urol. 1982, 128, 281–283. [Google Scholar] [CrossRef]
- Sturgeon, S.R.; Hartge, P.; Silverman, D.T.; Kantor, A.F.; Linehan, W.M.; Lynch, C.; Hoover, R.N. Associations between bladder cancer risk factors and tumor stage and grade at diagnosis. Epidemiology 1994, 5, 218–225. [Google Scholar] [CrossRef]
- Wang, J.; Wu, X.; Kamat, A.; Barton Grossman, H.; Dinney, C.P.; Lin, J. Fluid intake, genetic variants of UDP-glucuronosyltransferases, and bladder cancer risk. Br. J. Cancer 2013, 108, 2372–2380. [Google Scholar] [CrossRef] [PubMed] [Green Version]
- Chan, J.M.; Wang, F.; Holly, E.A. Sweets, sweetened beverages, and risk of pancreatic cancer in a large population-based case-control study. Cancer Causes Control. 2009, 20, 835–846. [Google Scholar] [CrossRef] [Green Version]
- Murtaugh, M.A.; Ma, K.N.; Caan, B.J.; Slattery, M.L. Association of fluids from beverages with risk of rectal cancer. Nutr. Cancer 2004, 49, 25–31. [Google Scholar] [CrossRef]
- Ibiebele, T.I.; Hughes, M.C.; O’Rourke, P.; Webb, P.M.; Whiteman, D.C. Cancers of the esophagus and carbonated beverage consumption: A population-based case-control study. Cancer Causes Control. 2008, 19, 577–584. [Google Scholar] [CrossRef]
- Lim, U.; Subar, A.F.; Mouw, T.; Hartge, P.; Morton, L.M.; Stolzenberg-Solomon, R.; Campbell, D.; Hollenbeck, A.R.; Schatzkin, A. Consumption of aspartame-containing beverages and incidence of hematopoietic and brain malignancies. Cancer Epidemiol. Biomark. Prev. 2006, 15, 1654–1659. [Google Scholar] [CrossRef] [PubMed] [Green Version]
- Schernhammer, E.S.; Bertrand, K.A.; Birmann, B.M.; Sampson, L.; Willett, W.C.; Feskanich, D. Consumption of artificial sweetener- and sugar-containing soda and risk of lymphoma and leukemia in men and women. Am. J. Clin. Nutr. 2012, 96, 1419–1428. [Google Scholar] [CrossRef] [PubMed] [Green Version]
- McCullough, M.L.; Teras, L.R.; Shah, R.; Diver, W.R.; Gaudet, M.M.; Gapstur, S.M. Artificially and sugar-sweetened carbonated beverage consumption is not associated with risk of lymphoid neoplasms in older men and women. J. Nutr. 2014, 144, 2041–2049. [Google Scholar] [CrossRef] [PubMed] [Green Version]
- Debras, C.; Chazelas, E.; Srour, B.; Druesne-Pecollo, N.; Esseddik, Y.; Szabo de Edelenyi, F.; Agaësse, C.; de Sa, A.; Lutchia, R.; Gigandet, S.; et al. Artificial sweeteners and cancer risk: Results from the NutriNet-Santé population-based cohort study. PLoS Med. 2022, 19, e1003950. [Google Scholar] [CrossRef]
- Hodge, A.M.; Bassett, J.K.; Milne, R.L.; English, D.R.; Giles, G.G. Consumption of sugar-sweetened and artificially sweetened soft drinks and risk of obesity-related cancers. Public Health Nutr. 2018, 21, 1618–1626. [Google Scholar] [CrossRef] [Green Version]
- Llaha, F.; Gil-Lespinard, M.; Unal, P.; de Villasante, I.; Castañeda, J.; Zamora-Ros, R. Consumption of Sweet Beverages and Cancer Risk. A Systematic Review and Meta-Analysis of Observational Studies. Nutrients 2021, 13, 516. [Google Scholar] [CrossRef]
- Heath, A.K.; Clasen, J.L.; Jayanth, N.P.; Jenab, M.; Tjonneland, A.; Petersen, K.E.N.; Overvad, K.; Srour, B.; Katzke, V.; Bergmann, M.M.; et al. Soft Drink and Juice Consumption and Renal Cell Carcinoma Incidence and Mortality in the European Prospective Investigation into Cancer and Nutrition. Cancer Epidemiol. Biomark. Prev. 2021, 30, 1270–1274. [Google Scholar] [CrossRef] [PubMed]
- Hur, J.; Otegbeye, E.; Joh, H.K.; Nimptsch, K.; Ng, K.; Ogino, S.; Meyerhardt, J.A.; Chan, A.T.; Willett, W.C.; Wu, K.; et al. Sugar-sweetened beverage intake in adulthood and adolescence and risk of early-onset colorectal cancer among women. Gut 2021, 70, 2330–2336. [Google Scholar] [CrossRef] [PubMed]
- Romanos-Nanclares, A.; Collins, L.C.; Hu, F.B.; Willett, W.C.; A Rosner, B.; Toledo, E.; Eliassen, A.H. Sugar-Sweetened Beverages, Artificially Sweetened Beverages, and Breast Cancer Risk: Results From 2 Prospective US Cohorts. J. Nutr. 2021, 151, 2768–2779. [Google Scholar] [CrossRef]
- Zamora-Ros, R.; Cayssials, V.; Clèries, R.; Torrents, M.; Byrnes, G.; Weiderpass, E.; Sandström, M.; Almquist, M.; Boutron-Ruault, M.-C.; Tjønneland, A.; et al. Sweetened beverages are associated with a higher risk of differentiated thyroid cancer in the EPIC cohort: A dietary pattern approach. Eur. J. Nutr. 2022. [Google Scholar] [CrossRef] [PubMed]
- Page, M.J.; McKenzie, J.E.; Bossuyt, P.M.; Boutron, I.; Hoffmann, T.C.; Mulrow, C.D.; Shamseer, L.; Tetzlaff, J.M.; Akl, E.A.; Brennan, S.E.; et al. The PRISMA 2020 statement: An updated guideline for reporting systematic reviews. BMJ 2021, 372, n71. [Google Scholar] [CrossRef] [PubMed]
- Aune, D.; Greenwood, D.C.; Chan, D.S.M.; Vieira, R.; Vieira, A.R.; Navarro Rosenblatt, D.A.; Cade, J.; Burley, V.; Norat, T. Body mass index, abdominal fatness and pancreatic cancer risk: A systematic review and non-linear dose-response meta-analysis of prospective studies. Ann. Oncol. 2012, 23, 843–852. [Google Scholar] [CrossRef]
- Rong, Y.; Chen, L.; Zhu, T.; Song, Y.; Yu, M.; Shan, Z.; Sands, A.; Hu, F.B.; Liu, L. Egg consumption and risk of coronary heart disease and stroke: Dose-response meta-analysis of prospective cohort studies. BMJ 2013, 346, e8539. [Google Scholar] [CrossRef] [Green Version]
- Navarrete-Muñoz, E.M.; Wark, P.A.; Romaguera, D.; Bhoo-Pathy, N.; Michaud, D.; Molina-Montes, E.; Tjønneland, A.; Olsen, A.; Overvad, K. Sweet-beverage consumption and risk of pancreatic cancer in the European Prospective Investigation into Cancer and Nutrition (EPIC). Am. J. Clin. Nutr. 2016, 104, 760–768. [Google Scholar] [CrossRef] [Green Version]
- Stepien, M.; Duarte-Salles, T.; Fedirko, V.; Trichopoulou, A.; Lagiou, P.; Bamia, C.; Overvad, K.; Tjønneland, A.; Hansen, L.; Boutron-Ruault, M.-C.; et al. Consumption of soft drinks and juices and risk of liver and biliary tract cancers in a European cohort. Eur. J. Nutr. 2016, 55, 7–20. [Google Scholar] [CrossRef] [Green Version]
- Sylvetsky, A.; Rother, K.I.; Brown, R. Artificial sweetener use among children: Epidemiology, recommendations, metabolic outcomes, and future directions. Pediatr. Clin. North Am. 2011, 58, 1467–1480. [Google Scholar] [CrossRef] [Green Version]
- Lauby-Secretan, B.; Scoccianti, C.; Loomis, D.; Grosse, Y.; Bianchini, F.; Straif, K. Body Fatness and Cancer—Viewpoint of the IARC Working Group. N. Engl. J. Med. 2016, 375, 794–798. [Google Scholar] [CrossRef] [PubMed] [Green Version]
- Morgan, R.L.; Thayer, K.A.; Santesso, N.; Holloway, A.C.; Blain, R.; Eftim, S.E.; Goldstone, A.E.; Ross, P.; Ansari, M.; Akl, E.A.; et al. A risk of bias instrument for non-randomized studies of exposures: A users’ guide to its application in the context of GRADE. Environ. Int. 2019, 122, 168–184. [Google Scholar] [CrossRef] [PubMed]
- Guyatt, G.H.; Oxman, A.D.; Vist, G.E.; Kunz, R.; Falck-Ytter, Y.; Alonso-Coello, P.; Schünemann, H.J. GRADE: An emerging consensus on rating quality of evidence and strength of recommendations. BMJ 2008, 336, 924–926. [Google Scholar] [CrossRef] [PubMed]
- Higgins, J.P.; Thompson, S.G.; Deeks, J.J.; Altman, D.G. Measuring inconsistency in meta-analyses. BMJ 2003, 327, 557–560. [Google Scholar] [CrossRef] [PubMed] [Green Version]
- Orsini, N.; Li, R.; Wolk, A.; Khudyakov, P.; Spiegelman, D. Meta-analysis for linear and nonlinear dose-response relations: Examples, an evaluation of approximations, and software. Am. J. Epidemiol. 2012, 175, 66–73. [Google Scholar] [CrossRef] [PubMed] [Green Version]
- Harrell, F.E., Jr.; Lee, K.L.; Pollock, B.G. Regression models in clinical studies: Determining relationships between predictors and response. J. Natl. Cancer Inst. 1988, 80, 1198–1202. [Google Scholar] [CrossRef]
- Egger, M.; Davey Smith, G.; Schneider, M.; Minder, C. Bias in meta-analysis detected by a simple, graphical test. BMJ 1997, 315, 629–634. [Google Scholar] [CrossRef] [Green Version]
- Begg, C.B.; Mazumdar, M. Operating characteristics of a rank correlation test for publication bias. Biometrics 1994, 50, 1088–1101. [Google Scholar] [CrossRef]
- Chazelas, E.; Srour, B.; Desmetz, E.; Kesse-Guyot, E.; Julia, C.; Deschamps, V.; Druesne-Pecollo, N.; Galan, P.; Hercberg, S.; Latino-Martel, P.; et al. Sugary drink consumption and risk of cancer: Results from NutriNet-Santé prospective cohort. Bmj 2019, 366, l2408. [Google Scholar] [CrossRef] [Green Version]
- Bassett, J.K.; Milne, R.L.; English, D.R.; Giles, G.G.; Hodge, A.M. Consumption of sugar-sweetened and artificially sweetened soft drinks and risk of cancers not related to obesity. Int. J. Cancer 2020, 146, 3329–3334. [Google Scholar] [CrossRef]
- Inoue-Choi, M.; Robien, K.; Mariani, A.; Cerhan, J.R.; Anderson, K.E. Sugar-sweetened beverage intake and the risk of type I and type II endometrial cancer among postmenopausal women. Cancer Epidemiol. Biomark. Prev. 2013, 22, 2384–2394. [Google Scholar] [CrossRef] [PubMed] [Green Version]
- Bao, Y.; Stolzenberg-Solomon, R.; Jiao, L.; Silverman, D.T.; Subar, A.F.; Park, Y.; Leitzmann, M.F.; Hollenbeck, A.; Schatzkin, A.; Michaud, D.S. Added sugar and sugar-sweetened foods and beverages and the risk of pancreatic cancer in the National Institutes of Health-AARP Diet and Health Study. Am. J. Clin. Nutr. 2008, 88, 431–440. [Google Scholar] [CrossRef] [PubMed] [Green Version]
- Schernhammer, E.S.; Hu, F.B.; Giovannucci, E.; Michaud, D.S.; Colditz, G.A.; Stampfer, M.J.; Fuchs, C.S. Sugar-sweetened soft drink consumption and risk of pancreatic cancer in two prospective cohorts. Cancer Epidemiol. Biomark. Prev. 2005, 14, 2098–2105. [Google Scholar] [CrossRef] [PubMed]
- Soffritti, M.; Belpoggi, F.; Tibaldi, E.; Esposti, D.D.; Lauriola, M. Life-span exposure to low doses of aspartame beginning during prenatal life increases cancer effects in rats. Environ. Health Perspect. 2007, 115, 1293–1297. [Google Scholar] [CrossRef]
- Soffritti, M.; Belpoggi, F.; Manservigi, M.; Tibaldi, E.; Lauriola, M.; Falcioni, L.; Bua, L. Aspartame administered in feed, beginning prenatally through life span, induces cancers of the liver and lung in male Swiss mice. Am. J. Ind. Med. 2010, 53, 1197–1206. [Google Scholar] [CrossRef]
- Landrigan, P.J.; Straif, K. Aspartame and cancer—New evidence for causation. Environ. Health 2021, 20, 42. [Google Scholar] [CrossRef]
- Tsang, W.S.; Clarke, M.A.; Parrish, F.W. Determination of aspartame and its breakdown products in soft drinks by reverse-phase chromatography with UV detection. J. Agric. Food Chem. 1985, 33, 734–738. [Google Scholar] [CrossRef]
- World Health Organization. Formaldehyde, 2-Butoxyethanoland 1-Tert-Butoxypropan-2-ol: Summary of Data Reported and Evaluation; International Agency for Research on Cancer: Lyon, France, 2006.
- Report, F.; Backgrou, C.; Carcinog, R.; Doc, B.; Pubmed, P.M. Final Report on Carcinogens Background Document for Formaldehyde. Rep. Carcinog. Backgr. Doc. 2010, i-512. [Google Scholar]
- Zhang, L.; Tang, X.; Rothman, N.; Vermeulen, R.; Ji, Z.; Shen, M.; Qiu, C.; Guo, W.; Liu, S.; Reiss, B.; et al. Occupational exposure to formaldehyde, hematotoxicity, and leukemia-specific chromosome changes in cultured myeloid progenitor cells. Cancer Epidemiol. Biomark. Prev. 2010, 19, 80–88. [Google Scholar] [CrossRef] [Green Version]
- Smith, T.J.S.; Wolfson, J.A.; Jiao, D.; Crupain, M.J.; Rangan, U.; Sapkota, A.; Bleich, S.N.; Nachman, K.E. Caramel color in soft drinks and exposure to 4-methylimidazole: A quantitative risk assessment. PLoS ONE 2015, 10, e0118138. [Google Scholar] [CrossRef] [Green Version]
- Palmnäs, M.S.A.; Cowan, T.E.; Bomhof, M.R.; Su, J.; Reimer, R.A.; Vogel, H.J.; Hittel, D.S.; Shearer, J. Low-dose aspartame consumption differentially affects gut microbiota-host metabolic interactions in the diet-induced obese rat. PLoS ONE 2014, 9, e109841. [Google Scholar] [CrossRef] [PubMed]
- Lobach, A.R.; Roberts, A.; Rowland, I.R. Assessing the in vivo data on low/no-calorie sweeteners and the gut microbiota. Food Chem. Toxicol. 2019, 124, 385–399. [Google Scholar] [CrossRef] [PubMed]
- Ruiz-Ojeda, F.J.; Plaza-Díaz, J.; Sáez-Lara, M.J.; Gil, A. Effects of Sweeteners on the Gut Microbiota: A Review of Experimental Studies and Clinical Trials. Adv. Nutr. 2019, 10, S31–S48. [Google Scholar] [CrossRef] [PubMed] [Green Version]
- Finney, M.; Smullen, J.; Foster, H.A.; Brokx, S.; Storey, D.M. Effects of low doses of lactitol on faecal microflora, pH, short chain fatty acids and gastrointestinal symptomology. Eur. J. Nutr. 2007, 46, 307–314. [Google Scholar] [CrossRef]
- Beards, E.; Tuohy, K.; Gibson, G. A human volunteer study to assess the impact of confectionery sweeteners on the gut microbiota composition. Br. J. Nutr. 2010, 104, 701–708. [Google Scholar] [CrossRef] [PubMed] [Green Version]
- Goodwin, A.C.; Destefano Shields, C.E.; Wu, S.; Huso, D.L.; Wu, X.; Murray-Stewart, T.R.; Hacker-Prietz, A.; Rabizadeh, S.; Woster, P.M.; Sears, C.L.; et al. Polyamine catabolism contributes to enterotoxigenic Bacteroides fragilis-induced colon tumorigenesis. Proc. Natl. Acad. Sci. USA 2011, 108, 15354–15359. [Google Scholar] [CrossRef] [Green Version]
- Wu, N.; Yang, X.; Zhang, R.; Li, J.; Xiao, X.; Hu, Y.; Chen, Y.; Yang, F.; Lu, N.; Wang, Z.; et al. Dysbiosis signature of fecal microbiota in colorectal cancer patients. Microb. Ecol. 2013, 66, 462–470. [Google Scholar] [CrossRef]
- Saus, E.; Iraola-Guzmán, S.; Willis, J.R.; Brunet-Vega, A.; Gabaldón, T. Microbiome and colorectal cancer: Roles in carcinogenesis and clinical potential. Mol. Aspects Med. 2019, 69, 93–106. [Google Scholar] [CrossRef]
- Yuan, C.; Joh, H.-K.; Wang, Q.-L.; Zhang, Y.; A Smith-Warner, S.; Wang, M.; Song, M.; Cao, Y.; Zhang, X.; Zoltick, E.S.; et al. Sugar-sweetened beverage and sugar consumption and colorectal cancer incidence and mortality according to anatomic subsite. Am. J. Clin. Nutr. 2022, 115, 1481–1489. [Google Scholar] [CrossRef]
- Ma, J.; McKeown, N.M.; Hwang, S.J.; Hoffmann, U.; Jacques, P.F.; Fox, C.S. Sugar-Sweetened Beverage Consumption Is Associated with Change of Visceral Adipose Tissue Over 6 Years of Follow-Up. Circulation 2016, 133, 370–377. [Google Scholar] [CrossRef] [Green Version]
- Doyle, S.L.; Donohoe, C.L.; Lysaght, J.; Reynolds, J.V. Visceral obesity, metabolic syndrome, insulin resistance and cancer. Proc. Nutr. Soc. 2012, 71, 181–189. [Google Scholar] [CrossRef] [PubMed] [Green Version]
- Swithers, S.E. Artificial sweeteners produce the counterintuitive effect of inducing metabolic derangements. Trends Endocrinol. Metab. 2013, 24, 431–441. [Google Scholar] [CrossRef] [PubMed] [Green Version]
- Swithers, S.E.; Laboy, A.F.; Clark, K.; Cooper, S.; Davidson, T.L. Experience with the high-intensity sweetener saccharin impairs glucose homeostasis and GLP-1 release in rats. Behav. Brain Res. 2012, 233, 1–14. [Google Scholar] [CrossRef] [PubMed] [Green Version]
- Rogers, P.J.; Hogenkamp, P.S.; de Graaf, C.; Higgs, S.; Lluch, A.; Ness, A.R.; Penfold, C.; Perry, R.; Putz, P.; Yeomans, M.R.; et al. Does low-energy sweetener consumption affect energy intake and body weight? A systematic review, including meta-analyses, of the evidence from human and animal studies. Int. J. Obes. 2016, 40, 381–394. [Google Scholar] [CrossRef] [PubMed]
- Grech, A.; Kam, C.O.; Gemming, L.; Rangan, A. Diet-Quality and Socio-Demographic Factors Associated with Non-Nutritive Sweetener Use in the Australian Population. Nutrients 2018, 10, 833. [Google Scholar] [CrossRef] [PubMed] [Green Version]
- Mueller, N.T.; Jacobs, D.R., Jr.; MacLehose, R.F.; Demerath, E.W.; Kelly, S.P.; Dreyfus, J.G.; Pereira, M.A. Consumption of caffeinated and artificially sweetened soft drinks is associated with risk of early menarche. Am. J. Clin. Nutr. 2015, 102, 648–654. [Google Scholar] [CrossRef] [Green Version]
- Janghorbani, M.; Mansourian, M.; Hosseini, E. Systematic review and meta-analysis of age at menarche and risk of type 2 diabetes. Acta Diabetol. 2014, 51, 519–528. [Google Scholar] [CrossRef]
- Charalampopoulos, D.; McLoughlin, A.; Elks, C.E.; Ong, K.K. Age at menarche and risks of all-cause and cardiovascular death: A systematic review and meta-analysis. Am. J. Epidemiol. 2014, 180, 29–40. [Google Scholar] [CrossRef]


| No. | Study, Year, Age (at Enrollment), (Sex), PMID * | Study Cohort | Area | Follow-Up (Years) | Case/Participant | Cancer Type | Comparison Level (mL/d) (Lowest vs. Highest) | Adjustment for Confounders | Reference |
|---|---|---|---|---|---|---|---|---|---|
| 1 | Chazelas, 2019, 18–73, (Male and Female), PMID:31292122 | The French NutriNet-Santé cohort | Europe | 5.1 | 2193/101,257 | Cancers including breast, colorectal, and prostate cancer | 4.3 vs. 9.9, Quartile 1 vs. Quartile 4 | Age; sex; energy intake without alcohol; sugar intake from other dietary sources; alcohol, sodium, lipid, and fruit and vegetable intakes; body mass index; height; physical activity; smoking status; number of 24-h dietary records; family history of cancer; educational level; the following prevalent conditions at baseline: type 2 diabetes, hypertension, major cardiovascular event, and dyslipidaemia; and additional adjustments for the number of biological children, menopausal status at baseline, hormonal treatment for menopause at baseline and during follow-up, and oral contraception use at baseline and during follow-up for breast cancer analyses. | [59] |
| 2 | Romanos-Nanclares, 2021, 30–55 (Female), PMID:34114021 | The Nurses’ Health Study AND The Nurses’ Health Study II | US | 26.48 | 7495/82,713 for NHS 3884/93,085 for NHSII | Breast cancer | <11.83 vs. ≥355, Quartile 1 vs. Quartile 4 | Age; SSB intake; race; age at menarche; age at menopause; postmenopausal hormone use; oral contraceptive use history; parity and age at first birth; breastfeeding history; family history of breast cancer; history of benign breast disease; height; cumulatively updated alcohol intake; cumulatively updated total caloric intake; physical activity; BMI at age 18 years; modified Alternate Healthy Eating Index score (with SSBs and alcohol removed); socioeconomic status; and the change in weight since age 18. | [43] |
| 3 | Hur, 2021,25–42, (Female), PMID:33958435 | The Nurses’ Health Study II | US | 24 | 109/95,464 | Colorectal cancer | <33.79 vs. ≥59.14, Quartile 1 vs. Quartile 4 | Age; energy intake; race; height; body mass index; menopausal status and menopausal hormone use; family history of colorectal cancer; smoking status; physical activity; regular use of aspirin; regular use of non-steroidal anti-inflammatory drugs; current use of multivitamins; intake of alcohol, red and processed meat, and dietary fiber; total folate and total calcium; Alternative Healthy Eating Index-2010 score without sugar-sweetened beverages and alcohol; and lower endoscopy due to screening or for other indications within the past 10 years. | [42] |
| 4 | Debras, 2022, 28–57, (Male and Female), PMID: 35324894 | The French NutriNet-Santé cohort | Europe | 7.7 | 3358/102,865 | All cancers, breast cancer, prostate cancer, and obesity-related cancers | 0 vs. 207.77, Tertile 1 vs. Tertile 3 | Age; sex; BMI; height; percentage weight gain during follow-up; physical activity; smoking status; number of smoked cigarettes in pack-years; educational level; number of 24-h dietary records; family history of cancer; prevalent diabetes; energy intake without alcohol; and daily intakes of alcohol, sodium, saturated fatty acids, fiber, sugar, fruits, vegetables, whole-grain foods, and dairy products. Breast cancer models were also adjusted for age at menarche, age at first child, number of biological children, baseline menopausal status, oral contraceptive use at baseline and during follow-up, and hormonal treatment for menopause at baseline and during follow-up. | [38] |
| 5 | Bassett, 2020, 27–76, (Male and Female), PMID:31693185 | The Melbourne Collaborative Cohort Study | Australia | 19 | 4789/35,109 | Cancer not related to obesity including prostate, diffuse large B-cell lymphoma, noncardia gastric, lung, melanoma, premenopausal breast, bladder, brain, and lymphoid leukemia | <12.5 vs. >375, Quintile 1 vs. Quintile 5 | Alcohol intake; country of birth; Mediterranean diet score; physical activity; socioeconomic position; sex and smoking status; and frequency of sugar-sweetened soft drink consumption. | [60] |
| 6 | Hodge, 2018, 27–76, (Male and Female), PMID:29463332 | The Melbourne Collaborative Cohort Study | Australia | 11.6 | 3283/35,593 | Obesity-related cancers including aggressive prostate, ovary, kidney, colorectum, breast, endometrium, and gastric cardia cancer | <12.5 vs. >375, Quintile 1 vs. Quintile 5 | Socio-Economic Indexes for Areas; country of birth; alcohol intake; smoking status; physical activity; sex; Mediterranean diet score; sugar-sweetened soft drink consumption; and waist circumference. | [39] |
| 7 | Navarrete-Muñoz, 2016, 25–42, (Male and Female), PMID:27510540 | European Prospective Investigation into Cancer and Nutrition | Europe | 11.6 | 865/477,199 | Pancreatic cancer | 0 vs. >92.2, Sextile 2 vs. Sextile 6 | Center; sex; age at recruitment; educational level; physical activity; smoking status; alcohol consumption; juice, nectar, and soft drink consumption; energy intake; diabetes; and BMI. | [48] |
| 8 | McCullough, 2014, 47–95, (Male and Female), PMID:25342696 | The Cancer Prevention Study-II Nutrition Cohort | US | 10 | 1196/100,442 | Non-Hodgkin lymphoma | 0 vs. >355, Quintile 1 vs. Quintile 5 | Age at baseline; gender; history of diabetes; BMI; smoking status; energy intake; and sugar-sweetened beverage intake. | [37] |
| 9 | Inoue-Choi, 2013, 52–71, (Female), PMID:24273064 | The Iowa Women’s Health Study | US | 18.79 | 595/23,039 | Post-endometrial cancer: type I, type II | 0 vs. 288, Quintile 1 vs. Quintile 5 | Age; smoking status; physical activity; alcohol use; estrogen use; age at menarche; age at menopause; number of live births; coffee intake; and BMI. | [61] |
| 10 | Schernhammer, 2012, 30–55/40–75, (Male and Female), PMID:23097267 | The Nurses’ Health Study AND The Health Professionals Follow-Up Study | US | 17.88 | 888/47,810 for HPFUS 1060/77,218 for NHS | Hematopoietic cancers including non-Hodgkin lymphoma, multiple myeloma, and leukemia | 0 vs. >355, Quintile 1 vs. Quintile 5 | Age; questionnaire cycle; sugar-sweetened soda consumption; fruit and vegetable consumption; multivitamin use; intakes of alcohol, saturated fat, and animal protein; total energy; race; BMI; height; discretionary physical activity; smoking history; menopausal status and use of hormone replacement therapy (women only). | [36] |
| 11 | Bao, 2008, 50–71, (Male and Female), PMID:18689380 | The NIH-AARP Diet and Health Study cohort | US | 7.2 | 1258/487,922 | Pancreatic cancer | 0 vs. 816.9, Sextile 1 vs. Sextile 6 | Age; sex; race; education; BMI; alcohol consumption; smoking status; physical activity; energy-adjusted red meat consumption; energy-adjusted folate consumption; total energy; and regular soft drink consumption. | [62] |
| 12 | Lim, 2006, 62.0, (Male and Female), PMID:16985027 | The NIH-AARP Diet and Health Study cohort | US | 5.2 | 2203/473,984 | Hematopoietic cancers including Hodgkin lymphoma, multiple myeloma and lymphoid malignancies, gliomas | 0 vs. 1296, Sextile 1 vs. Sextile 6 | Age at entry; sex; ethnicity; BMI; and history of diabetes. | [35] |
| 13 | Schernhammer, 2005, 25–42, (Male and Female), PMID:16172216 | The Nurses’ Health Study AND The Health Professionals Follow-up Study | US | 15.37 | 174/49,364 for HPFUS 205/88,794 for NHS | Pancreatic cancer | <12 vs. >154, Tertile 1 vs. Tertile 3 | Age; gender; follow-up cycle; history of diabetes; smoking status; quintiles of caloric intake; non-vigorous physical activity; and other soft drink consumption. | [63] |
| 14 | Zamora-Ros, 2022, 41.3–60.9, (Male and Female), PMID: 35907037 | European Prospective Investigation into Cancer and Nutrition | Europe | 14 | 495/450,064 | Differentiated thyroid cancer | 0 vs. 3411, Quartile 1 vs. Quartile 4 | Sex; center; age at recruitment; BMI; smoking status; physical activity; educational level; alcohol and energy intake; and for women: menopausal status, oral contraceptive use, and infertility problems. | [44] |
| Subgroup | Number of Studies | RR (95% CI) | p | I2 (%) | p-Heterogeneity | tau2 |
|---|---|---|---|---|---|---|
| Characteristics of study subjects | ||||||
| Area | ||||||
| North America | 11 | 1.00 (0.91–1.09) | 0.936 | 55.9% | 0.012 | 0.011 |
| Australia | 2 | 1.12 (0.92–1.38) | 0.254 | 44.7% | 0.179 | 0.010 |
| Europe | 4 | 1.10 (1.01–1.19) | 0.025 | 0.0% | 0.446 | 0.000 |
| Age at recruitment | ||||||
| ≥60 | 4 | 0.95 (0.81–1.12) | 0.551 | 42.0% | 0.160 | 0.012 |
| <60 | 13 | 1.05 (0.97–1.14) | 0.210 | 56.1% | 0.007 | 0.009 |
| Sex | ||||||
| Female | 7 | 0.95 (0.90–1.01) | 0.085 | 0.0% | 0.442 | 0.000 |
| Male | 3 | 1.15 (0.86–1.53) | 0.344 | 64.9% | 0.058 | 0.041 |
| Sample size | ||||||
| More than 50,000 participants | 12 | 1.01 (0.95–1.07) | 0.871 | 30.7% | 0.146 | 0.003 |
| Less than 50,000 participants | 5 | 1.07 (0.87–1.32) | 0.502 | 72.2% | 0.006 | 0.039 |
| Mean/median BMI (kg/m2) at recruitment | ||||||
| ≥25 and <30 | 10 | 1.05 (0.93–1.19) | 0.430 | 57.7% | 0.011 | 0.022 |
| ≥18 and <25 | 5 | 1.00 (0.92–1.10) | 0.940 | 60.5% | 0.038 | 0.005 |
| Duration of follow-up | ||||||
| Less than 10 years | 4 | 1.07 (0.96–1.19) | 0.245 | 36.8% | 0.191 | 0.005 |
| More than 10 years | 13 | 1.02 (0.93–1.11) | 0.701 | 53.2% | 0.012 | 0.011 |
| Measurements of exposure | ||||||
| ASB measurement approach | ||||||
| Validated FFQ | 13 | 1.02 (0.93–1.11) | 0.708 | 57.2% | 0.005 | 0.012 |
| Lifestyle questionnaires | 4 | 1.10 (1.01–1.19) | 0.025 | 0.0% | 0.636 | 0.000 |
| ASB measurement frequency | ||||||
| Once, only at baseline | 8 | 1.02 (0.91–1.15) | 0.708 | 36.0% | 0.141 | 0.010 |
| Repeated measurements | 9 | 1.04 (0.94–1.14) | 0.466 | 65.3% | 0.003 | 0.010 |
| Outcome assessment | ||||||
| Ascertainment of cancers | ||||||
| Access to disease registry | 8 | 1.06 (0.93–1.20) | 0.404 | 30.7% | 0.183 | 0.010 |
| Self-report but with subsequent external validation | 9 | 1.02 (0.93–1.11) | 0.680 | 65.0% | 0.004 | 0.009 |
| Data analysis | ||||||
| Levels of ASB consumption in controls | ||||||
| High vs. non-consume | 12 | 1.03 (0.94–1.12) | 0.541 | 61.4% | 0.003 | 0.011 |
| High vs. low | 5 | 1.05 (0.93–1.19) | 0.441 | 19.0% | 0.294 | 0.004 |
| Classifications of ASB consumption | ||||||
| Three-category | 3 | 1.12 (1.02–1.22) | 0.018 | 0.0% | 0.521 | 0.000 |
| Four-category | 5 | 0.96 (0.91–1.02) | 0.180 | 0.7% | 0.402 | 0.000 |
| Five-category | 6 | 1.06 (0.90–1.25) | 0.478 | 69.0% | 0.006 | 0.028 |
| Six-category | 3 | 1.04 (0.84–1.28) | 0.744 | 31.4% | 0.233 | 0.011 |
| Adjusted for SSB intake | ||||||
| Yes | 10 | 1.07 (0.95–1.20) | 0.271 | 50.6% | 0.033 | 0.018 |
| No | 7 | 0.99 (0.92–1.08) | 0.893 | 52.4% | 0.050 | 0.005 |
| Adjusted for adiposity measures | ||||||
| Yes | 14 | 1.02 (0.94–1.10) | 0.667 | 55.4% | 0.006 | 0.009 |
| No | 3 | 1.15 (0.98–1.35) | 0.093 | 5.5% | 0.347 | 0.001 |
| No. of Studies | Study Design | Certainty Assessment | RR (95% CI) | Certainty * | ||||
|---|---|---|---|---|---|---|---|---|
| Risk of Bias | Inconsistency | Indirectness | Imprecision | Other Considerations | ||||
| Breast cancer | ||||||||
| 4 | observational studies | moderate a | serious b | serious c | not serious | none | 0.99 (0.90–1.08) | ⨁◯◯◯ VERY LOW |
| Colorectal cancer | ||||||||
| 3 | observational studies | moderate a | not serious | serious c | not serious | none | 0.78 (0.62–0.99) | ⨁⨁◯◯ LOW |
| Endometrial cancer | ||||||||
| 2 | observational studies | moderate a | not serious | serious c | serious d | none | 0.81 (0.64–1.03) | ⨁◯◯◯ VERY LOW |
| Gastric cancer | ||||||||
| 1 | observational study | moderate a | not serious | serious c | serious d | none | 1.03 (0.53–1.99) | ⨁◯◯◯ VERY LOW |
| Gliomas | ||||||||
| 1 | observational study | moderate a | not serious | serious c | serious d | dose–response gradient | 0.73 (0.46–1.15) | ⨁⨁◯◯ LOW |
| Hodgkin lymphoma | ||||||||
| 1 | observational study | moderate a | not serious | serious c | serious d | none | 0.77 (0.45–1.33) | ⨁◯◯◯ VERY LOW |
| Kidney cancer | ||||||||
| 1 | observational study | moderate a | not serious | serious c | serious d | none | 0.92 (0.46–1.84) | ⨁◯◯◯ VERY LOW |
| Leukemia | ||||||||
| 3 | observational studies | moderate a | not serious | serious c | not serious | dose–response gradient | 1.35 (1.03–1.77) | ⨁⨁⨁◯ MODERATE |
| Multiple myeloma | ||||||||
| 3 | observational studies | moderate a | serious e | serious c | serious d | dose–response gradient | 1.18 (0.69–2.02) | ⨁◯◯◯ VERY LOW |
| Non-Hodgkin lymphoma | ||||||||
| 4 | observational studies | moderate a | not serious | serious c | not serious | none | 1.05 (0.91–1.21) | ⨁⨁◯◯ LOW |
| Ovarian cancer | ||||||||
| 1 | observational study | moderate a | not serious | serious c | serious d | none | 1.37 (0.72–2.61) | ⨁◯◯◯ VERY LOW |
| Pancreatic cancer | ||||||||
| 4 | observational studies | moderate a | not serious | serious c | serious d | none | 1.10 (0.92–1.31) | ⨁◯◯◯ VERY LOW |
| Prostate cancer | ||||||||
| 2 | observational studies | moderate a | serious f | serious c | serious d | none | 1.06 (0.70–1.62) | ⨁◯◯◯ VERY LOW |
| Thyroid cancer | ||||||||
| 1 | observational study | moderate a | not serious | serious c | serious d | none | 1.16 (0.80–1.69) | ⨁◯◯◯ VERY LOW |
| All cancer | ||||||||
| 17 | observational studies | moderate a | serious g | serious c | not serious | none | 1.03 (0.96–1.11) | ⨁◯◯◯ VERY LOW |
- Downgraded by one level. There were one or more studies at moderate risk of bias.
- Downgraded by one level. I2 = 55.90%, p = 0.079, and the results showed different point estimates and minimal overlapping CIs.
- Downgraded by one level. The intake of ASB was mostly assessed by questionnaires, which could not directly reflect the actual intake.
- Downgraded by one level. Serious imprecision was evaluated since although the OIS was met (more than 800 (400 per group)) and the 95% CI overlapped no effect (CI includes RR of 1.0), the CI failed to exclude important benefit or important harm (an RR reduction or RR increase of 25% or more)
- Downgraded by one level. I2 = 68.90%, p = 0.040, and the results showed different point estimates and minimal overlapping CIs.
- Downgraded by one level. I2 = 55.50%, p = 0.054, and the results showed different point estimates and minimal overlapping CIs.
- Downgraded by one level. I2 = 53.0%, p = 0.005, and the results showed different point estimates and minimal overlapping CIs.
Publisher’s Note: MDPI stays neutral with regard to jurisdictional claims in published maps and institutional affiliations. |
© 2022 by the authors. Licensee MDPI, Basel, Switzerland. This article is an open access article distributed under the terms and conditions of the Creative Commons Attribution (CC BY) license (https://creativecommons.org/licenses/by/4.0/).
Share and Cite
Yin, T.; Li, J.; Wang, Y.; Liu, K.; Long, T.; Cheng, L. Artificially Sweetened Beverage Consumption and Cancer Risk: A Comprehensive Dose–Response Meta-Analysis of Prospective Studies. Nutrients 2022, 14, 4445. https://doi.org/10.3390/nu14214445
Yin T, Li J, Wang Y, Liu K, Long T, Cheng L. Artificially Sweetened Beverage Consumption and Cancer Risk: A Comprehensive Dose–Response Meta-Analysis of Prospective Studies. Nutrients. 2022; 14(21):4445. https://doi.org/10.3390/nu14214445
Chicago/Turabian StyleYin, Tongxin, Jiaoyuan Li, Yi Wang, Ke Liu, Tingting Long, and Liming Cheng. 2022. "Artificially Sweetened Beverage Consumption and Cancer Risk: A Comprehensive Dose–Response Meta-Analysis of Prospective Studies" Nutrients 14, no. 21: 4445. https://doi.org/10.3390/nu14214445