
Water-Soluble Vitamins and Trace Elements Losses during On-Line Hemodiafiltration

 ,
,  and
and
Abstract
:1. Introduction
2. Materials and Methods
2.1. Patients and Study Design
2.2. Blood Sampling
2.3. Dialysate Sampling
2.4. Biochemical Measurements
2.5. Dialysis Parameters
2.6. Statistical Analysis
3. Results
3.1. Baseline Characteristics
3.2. Blood Concentrations of Vitamins and Trace Elements
3.3. Dialysate Concentration of Vitamins and Trace Elements
4. Discussion
5. Conclusions
Author Contributions
Funding
Institutional Review Board Statement
Informed Consent Statement
Conflicts of Interest
References
- Stein, G.; Sperscfineider, H.; Koppe, S. Vitamin levels in chronic renal failure and need for supplementation. Blood Purif. 1985, 3, 52–62. [Google Scholar] [CrossRef] [PubMed]
- Descombes, E.; Hanck, A.B.; Fellay, G. Water soluble vitamins in chronic hemodialysis patients and need for supplementation. Kidney Int. 1993, 43, 131928. [Google Scholar] [CrossRef] [PubMed] [Green Version]
- Clase, C.M.; Ki, V.; Holden, R.M. Water-soluble vitamins in people with low glomerular filtration rate or on dialysis: A review. Semin. Dial. 2013, 26, 546–567. [Google Scholar] [CrossRef] [Green Version]
- Fouque, D.; Vennegoor, M.; Ter Wee, P. EBPG Guideline on Nutrition. Nephrol. Dial. Transplant. 2007, 22, ii45–ii87. [Google Scholar] [CrossRef] [PubMed] [Green Version]
- Ikizler, T.A.; Burrowes, J.D.; Byham-Gray, L.D.; Campbell, K.L.; Carrero, J.-J.; Chan, W.; Fouque, D.; Friedman, A.N.; Ghaddar, S.; Goldstein-Fuchs, D.J.; et al. KDOQI Nutrition in CKD Guideline Work Group. KDOQI clinical practice guideline for nutrition in CKD: 2020 update. Am. J. Kidney Dis. 2020, 76 (Suppl. S1), S1–S107. [Google Scholar] [CrossRef]
- Fissell, R.B.; Bragg-Gresham, J.L.; Gillespie, B.W.; Goodkin, D.A.; Bommer, J.; Saito, A.; Akiba, T.; Port, F.K.; Young, E.W. International Variation in Vitamin Prescription and Association with Mortality in the Dialysis Outcomes and Practice Patterns Study (DOPPS). Am. J. Kidney Dis. 2004, 44, 293–299. [Google Scholar] [CrossRef]
- Canaud, B.; Köhler, K.; Sichart, J.M.; Möller, S. Global prevalent use, trends, and practices in haemodiafiltration. Nephrol. Dial. Transplant. 2019, 35, 398–407. [Google Scholar] [CrossRef]
- Grooteman, M.P.; Dorpel, M.A.V.D.; Bots, M.L.; Penne, E.L.; van der Weerd, N.C.; Mazairac, A.H.; Hoedt, C.H.D.; van der Tweel, I.; Lévesque, R.; Nubé, M.J.; et al. Effect of Online Hemodiafiltration on All–Cause Mortality and Cardiovascular Outcomes. J. Am. Soc. Nephrol. 2012, 23, 1087–1096. [Google Scholar] [CrossRef] [Green Version]
- Maduell, F.; Moreso, F.; Pons, M.; Ramos, R.; Mora-Macià, J.; Carreras, J.; Soler, J.; Torres, F.; Campistol, J.M.; Martinez-Castelao, A.; et al. High–Efficiency Postdilution Online Hemodiafiltration Reduces All–Cause Mortality in Haemodialysis Patients. J. Am. Soc. Nephrol. 2013, 24, 487–497. [Google Scholar] [CrossRef] [Green Version]
- Cuerq, C.; Peretti, N.; Chikh, K.; Mialon, A.; Guillaumont, M.; Drai, J.; Blond, E. Overview of the in vitro stability of commonly measured vitamins and carotenoids in whole blood. Ann. Clin. Biochem. 2015, 52, 259–269. [Google Scholar] [CrossRef] [Green Version]
- Booth, J.; Pinney, J.; Davenport, A. Do Changes in Relative Blood Volume Monitoring Correlate to Haemodialysis– Associated Hypotension? Nephron Clin. Pract. 2011, 117, c179–c183. [Google Scholar] [CrossRef] [PubMed]
- Ashby, D.; Borman, N.; Burton, J.; Corbett, R.; Davenport, A.; Farrington, K.; Flowers, K.; Fotheringham, J.; Fox, R.N.A.; Franklin, G.; et al. Renal Association Clinical Practice Guideline on Haemodialysis. BMC Nephrol. 2019, 20, 379. [Google Scholar] [CrossRef] [PubMed]
- National Kidney Foundation. KDOQI clinical practice guideline for hemodialysis adequacy: 2015 update. Am. J. Kidney Dis. 2015, 66, 884–930. [Google Scholar] [CrossRef] [Green Version]
- Morena, M.; Cristol, J.-P.; Bosc, J.-Y.; Tetta, C.; Forret, G.; Leger, C.-L.; Delcourt, C.; Papoz, L.; Descomps, B.; Canaud, B. Convective and diffusive losses of vitamin C during haemodiafiltration session: A contributive factor to oxidative stress in haemodialysis patients. Nephrol. Dial. Transplant. 2002, 17, 422–427. [Google Scholar] [CrossRef] [PubMed] [Green Version]
- Chazot, C.; Jean, G.; Kopple, J.D. Can Outcomes be Improved in Dialysis Patients by Optimizing Trace Mineral, Micronutrient, and Antioxidant Status? The Impact of Vitamins and their Supplementation. Semin. Dial. 2016, 29, 39–48. [Google Scholar] [CrossRef] [PubMed]
- Allman, M.A.; Truswell, A.S.; Tiller, D.J.; Stewart, P.M.; Yau, D.F.; Horvath, J.S.; Duggin, G.G. Vitamin supplementation of patients receiving haemodialysis. Med. J. Aust. 1989, 150, 130–133. [Google Scholar] [CrossRef]
- Schwotzer, N.; Kanemitsu, M.; Kissling, S.; Darioli, R.; Benghezal, M.; Rezzi, S.; Burnier, M.; Pruijm, M. Water–soluble vitamin levels and supplementation in chronic online hemodiafiltration Patients. Kidney Int. Rep. 2020, 5, 2160–2167. [Google Scholar] [CrossRef]
- Heinz, J.; Domrose, U.; Westphal, S.; Luley, C.; Neumann, K.H.; Dierkes, J. Washout of water–soluble vitamins and of homocysteine during haemodialysis: Effect of high–flux and low–flux dialyser membranes. Nephrology 2008, 13, 384–389. [Google Scholar] [CrossRef]
- Ubukata, M.; Amemiya, N.; Nitta, K.; Takei, T. Serum thiamine values in end–stage renal disease patients under maintenance hemodialysis. Int. J. Vitam. Nutr. Res. 2015, 85, 348–355. [Google Scholar] [CrossRef]
- Coveney, N.; Polkinghorne, K.R.; Linehan, L.; Corradini, A.; Kerr, P.G. Water–soluble vitamin levels in extended hours hemodialysis. Hemodial Int. 2011, 15, 308. [Google Scholar] [CrossRef]
- Jankowska, M.; Rudnicki-Velasquez, P.; Storoniak, H.; Rutkowski, P.; Rutkowski, B.; Krzymiński, K.; Dębska-Ślizień, A. Thiamine diphosphate status and dialysis–related losses in end–stage kidney disease patients treated with hemodialysis. Blood Purif. 2017, 44, 294–300. [Google Scholar] [CrossRef] [PubMed] [Green Version]
- Zhang, F.; Masania, J.; Anwar, A.; Xue, M.; Zehnder, D.; Kanji, H.; Rabbani, N.; Thornalley, P.J. The uremic toxin oxythiamine causes functional thiamine deficiency in end–stage renal disease by inhibiting transketolase activity. Kidney Int. 2016, 90, 396–403. [Google Scholar] [CrossRef] [PubMed]
- Jankowska, M.; Szupryczyńska, N.; Dębska-Ślizień, A.; Borek, P.; Kaczkan, M.; Rutkowski, B.; Małgorzewicz, S. Dietary intake of vitamins in different options of treatment in chronic kidney disease: Is there a deficiency? Transplant. Proc. 2016, 48, 1427–1430. [Google Scholar] [CrossRef] [PubMed]
- Lacour, B.; Parry, C.; Drüeke, T.; Touam, M.; Kreis, H.; Bailly, M.; Durand, D. Pyridoxal 50–phosphate deficiency in uremic undialyzed, hemodialyzed, and non–uremic kidney transplant patients. Clin. Chim. Acta 1983, 127, 205–215. [Google Scholar] [CrossRef]
- Corken, M.; Porter, J. Is vitamin B6 deficiency an underrecognized risk in patients receiving haemodialysis? A systematic review. Nephrology 2011, 16, 619–625. [Google Scholar]
- Chazot, C.; Steiber, A.L.; Kopple, J.D. Vitamin metabolism and requirements in renal disease and renal failure. In Nutritional Management of Renal Disease, 4th ed.; Kopple, J.D., Massry, S.G., Kalantar–Zadeh, K., Fouque, D., Eds.; Elsevier Science: Amsterdam, The Netherlands, 2022; pp. 413–465. [Google Scholar]
- Stenvinkel, P.; Carrero, J.J.; Axelsson, J.; Lindholm, B.; Heimburger, O.; Massy, Z.A. Emerging biomarkers for evaluating cardiovascular risk in the chronic kidney disease patient: How do new pieces fit into the uremic puzzle? Clin. J. Am. Soc. Nephrol. 2008, 3, 505–521. [Google Scholar] [CrossRef] [Green Version]
- Leblanc, M.; Pichette, V.; Geadah, D.; Ouimet, D. Folic acid and pyridoxal–50 –phosphate losses during high–efficiency hemodialysis in patients without hydrosoluble vitamin supplementation. J. Ren. Nutr. 2000, 10, 196–201. [Google Scholar] [CrossRef]
- Cross, J.; Davenport, A. Does online hemodiafiltration lead to reduction in trace elements and vitamins? Hemodial. Int. 2011, 15, 509–514. [Google Scholar] [CrossRef]
- Fehrman-Ekholm, I.; Lotsander, A.; Logan, K.; Dunge, D.; Odar-Cederlof, I.; Kallner, A. Concentrations of vitamin C, vitamin B12 and folic acid in patients treated with hemodialysis and on–line hemodiafiltration or hemofiltration. Scand J. Urol. Nephrol. 2008, 42, 74–80. [Google Scholar] [CrossRef]
- Chandna, S.M.; Tattersall, J.E.; Nevett, G.; Tew, C.J.; O’Sullivan, J.; Greenwood, R.N.; Farrington, K. Low serum vitamin B12 levels in chronic high–flux hemodialysis patients. Nephron 1997, 75, 259–263. [Google Scholar] [CrossRef]
- Kiziltas, H.; Ekin, S.; Erkoc, R. Trace element status of chronic renal patients undergoing hemodialysis. Biol. Trace Elem. Res. 2008, 124, 103–109. [Google Scholar] [CrossRef] [PubMed]
- Paun, S.; Tudosie, M.; Petris, R.; Macovei, R. The effects of Zinc on human body, including on renal failure and renal transplantation. J. Med. Life 2012, 5, 137–140. [Google Scholar] [PubMed]
- Zhong, W.; Zhanxiang, Z. Chapter 8—Sealing the leaky gut represents a beneficial mechanism of zinc intervention for alcoholic liver disease. In Dietary Interventions in Gastrointestinal Diseases; Elsevier: Amsterdam, The Netherlands, 2019; pp. 91–106. [Google Scholar]
- Bozalioglu, S.; Ozkan, Y.; Turan, M.; Simsek, B. Prevalence of zinc deficiency and immune response in short–term hemodialysis. J. Trace Elem Med. Biol. 2005, 18, 243–249. [Google Scholar] [CrossRef]
- Salonen, J.T.; Alfthan, G.; Huttunen, J.K.; Puska, P. Association between serum selenium and the risk of cancer. Am. J. Epidemiol. 1984, 120, 342–349. [Google Scholar] [CrossRef] [PubMed]
- Virtamo, J.; Valkeila, E.; Alfthan, G.; Punsar, S.; Huttunen, J.K.; Karvonen, M.J. Serum selenium and risk of cancer. Cancer 1987, 60, 145–148. [Google Scholar] [CrossRef]
- Jackson, M.L. Selenium: Geochemical distribution and associations with human heart and cancer death rates and longevity in China and the United States. Biol. Trace Elem. Res. 1988, 15, 13–21. [Google Scholar] [CrossRef]
- Dworkin, B.; Weseley, S.; Rosenthal, W.S.; Schwartz, E.M.; Weiss, L. Diminished blood selenium levels in renal failure patients on dialysis: Correlation with nutritional status. Am. J. Med. Sci. 1987, 293, 6–12. [Google Scholar] [CrossRef]
- Atakan, A.; Macunluoglu, B.; Kaya, Y.; Ari, E.; Demir, H.; Asicioglu, E.; Kaspar, C. Decreased serum selenium levels are correlated with diminished coronary flow reserve among hemodialysis patients. Biol. Trace Elem. Res. 2013, 155, 333–338. [Google Scholar] [CrossRef]
- Bogye, G.; Tompos, G.; Alfthan, G. Selenium Depletion in Hemodialysis Patients Treated with Polysulfone Membranes. Nephron 2000, 84, 119–123. [Google Scholar] [CrossRef]


| Mean ± SD or n | |
|---|---|
| Gender, female | 10 |
| Age, year | 67.0 ± 14.8 |
| Weight, kg | 76.6 ± 14.1 |
| Height, m | 1.67 ± 0.08 |
| BMI, kg/m2 | 27.6 ± 5.7 |
| Diabetes (Yes/No) | 15/24 |
| Vascular access (AVF/Catheter) | 35/4 |
| Dialysis vintage (months) | 44 ± 33 |
| Dialysis session duration (min) | 234 ± 4 |
| Blood flow (mL/min) | 372 ± 25 |
| Kt/V(ocm) ǂ | 1.56 ± 0.23 |
| Convective volume per session (L) | 25.5 ± 2.5 |
| Effluent collected per session (L) | 1.6 ± 0.3 |
| Total Effluent volume per session (L) | 166.2 ± 29.6 |
| Relative Blood Volume at the end (%) | 88.3 ± 4.6 |
| Serum Albumin (g/L) | 38.2 ± 3.8 |
| Serum Pre–Albumin (g/L) | 0.33 ± 0.08 |
| Hemoglobin (g/dL) | 11.0 ± 0.9 |
| Normal Range | Pre Session Concentration | Post Session Concentration | % Change ¶ | |
|---|---|---|---|---|
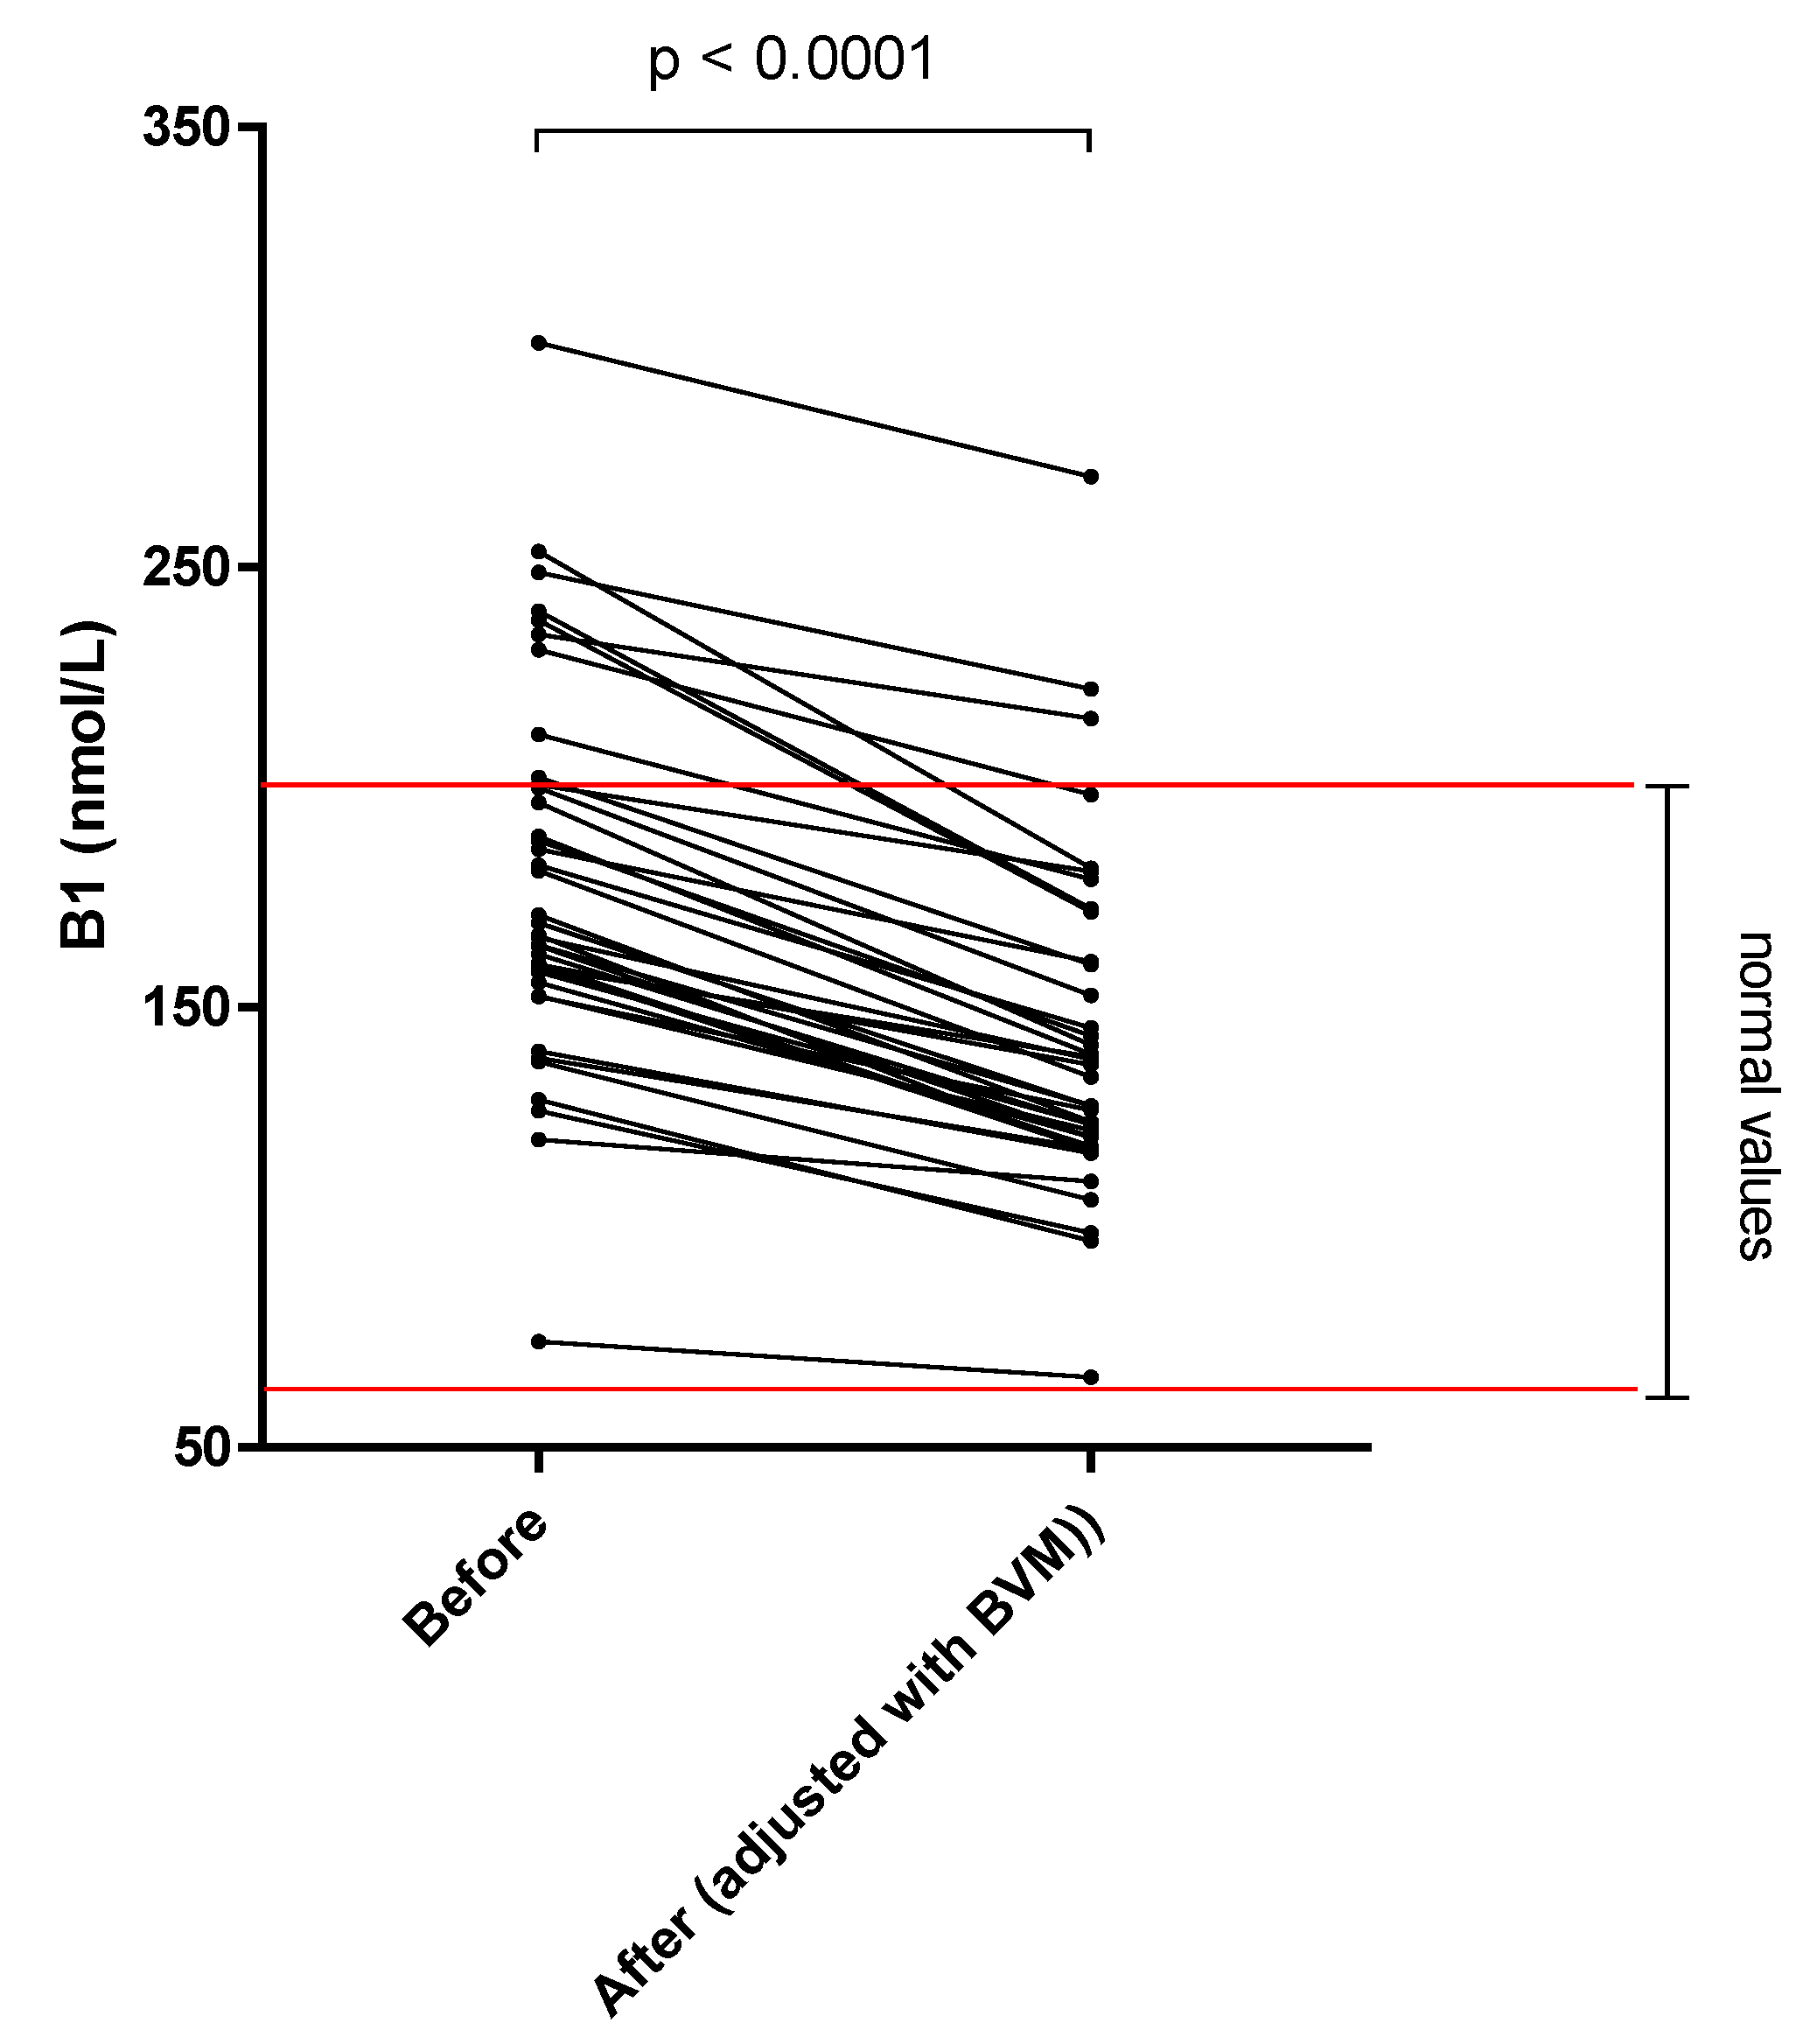
| Thiamine pyrophosphate Δ (nmol/L) | 66–200 | 178.7 ± 43.3 | 142.7 ± 38.6 | –20.2 * |
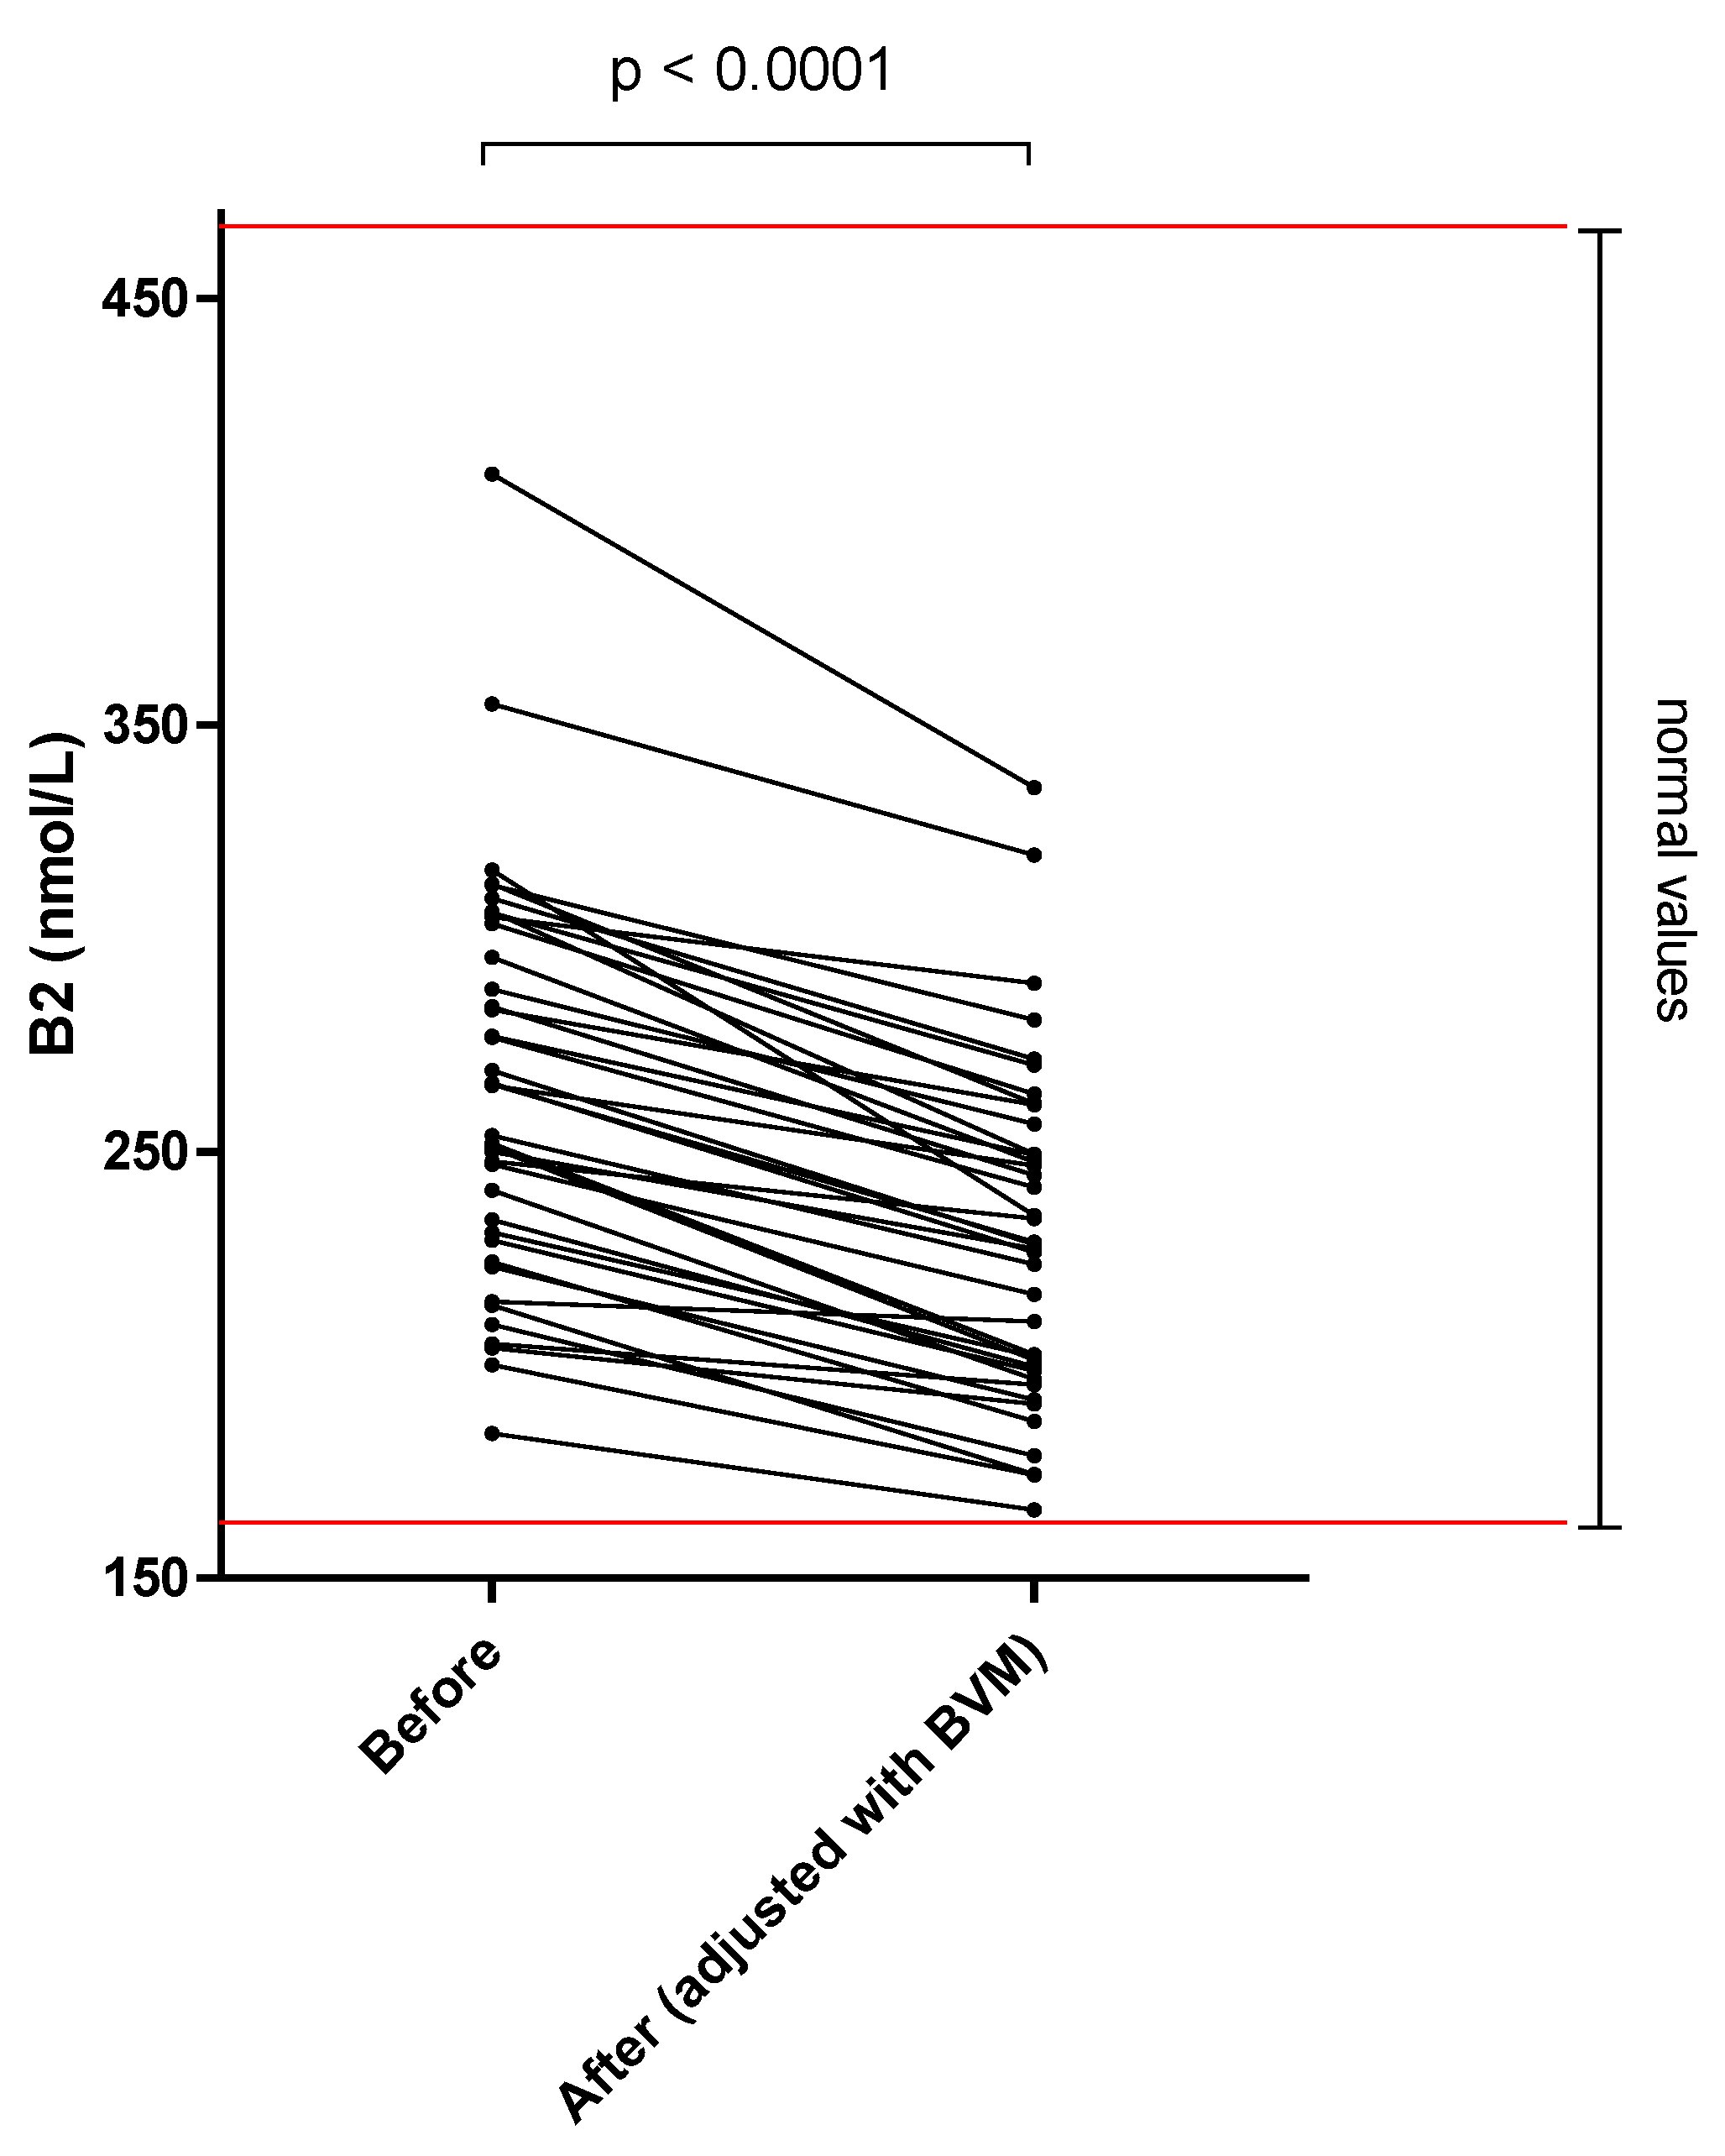
| FAD Ε (nmol/L) | 174–471 | 264.6 ± 46.4 | 230.2 ± 39.4 | –13.0 * |
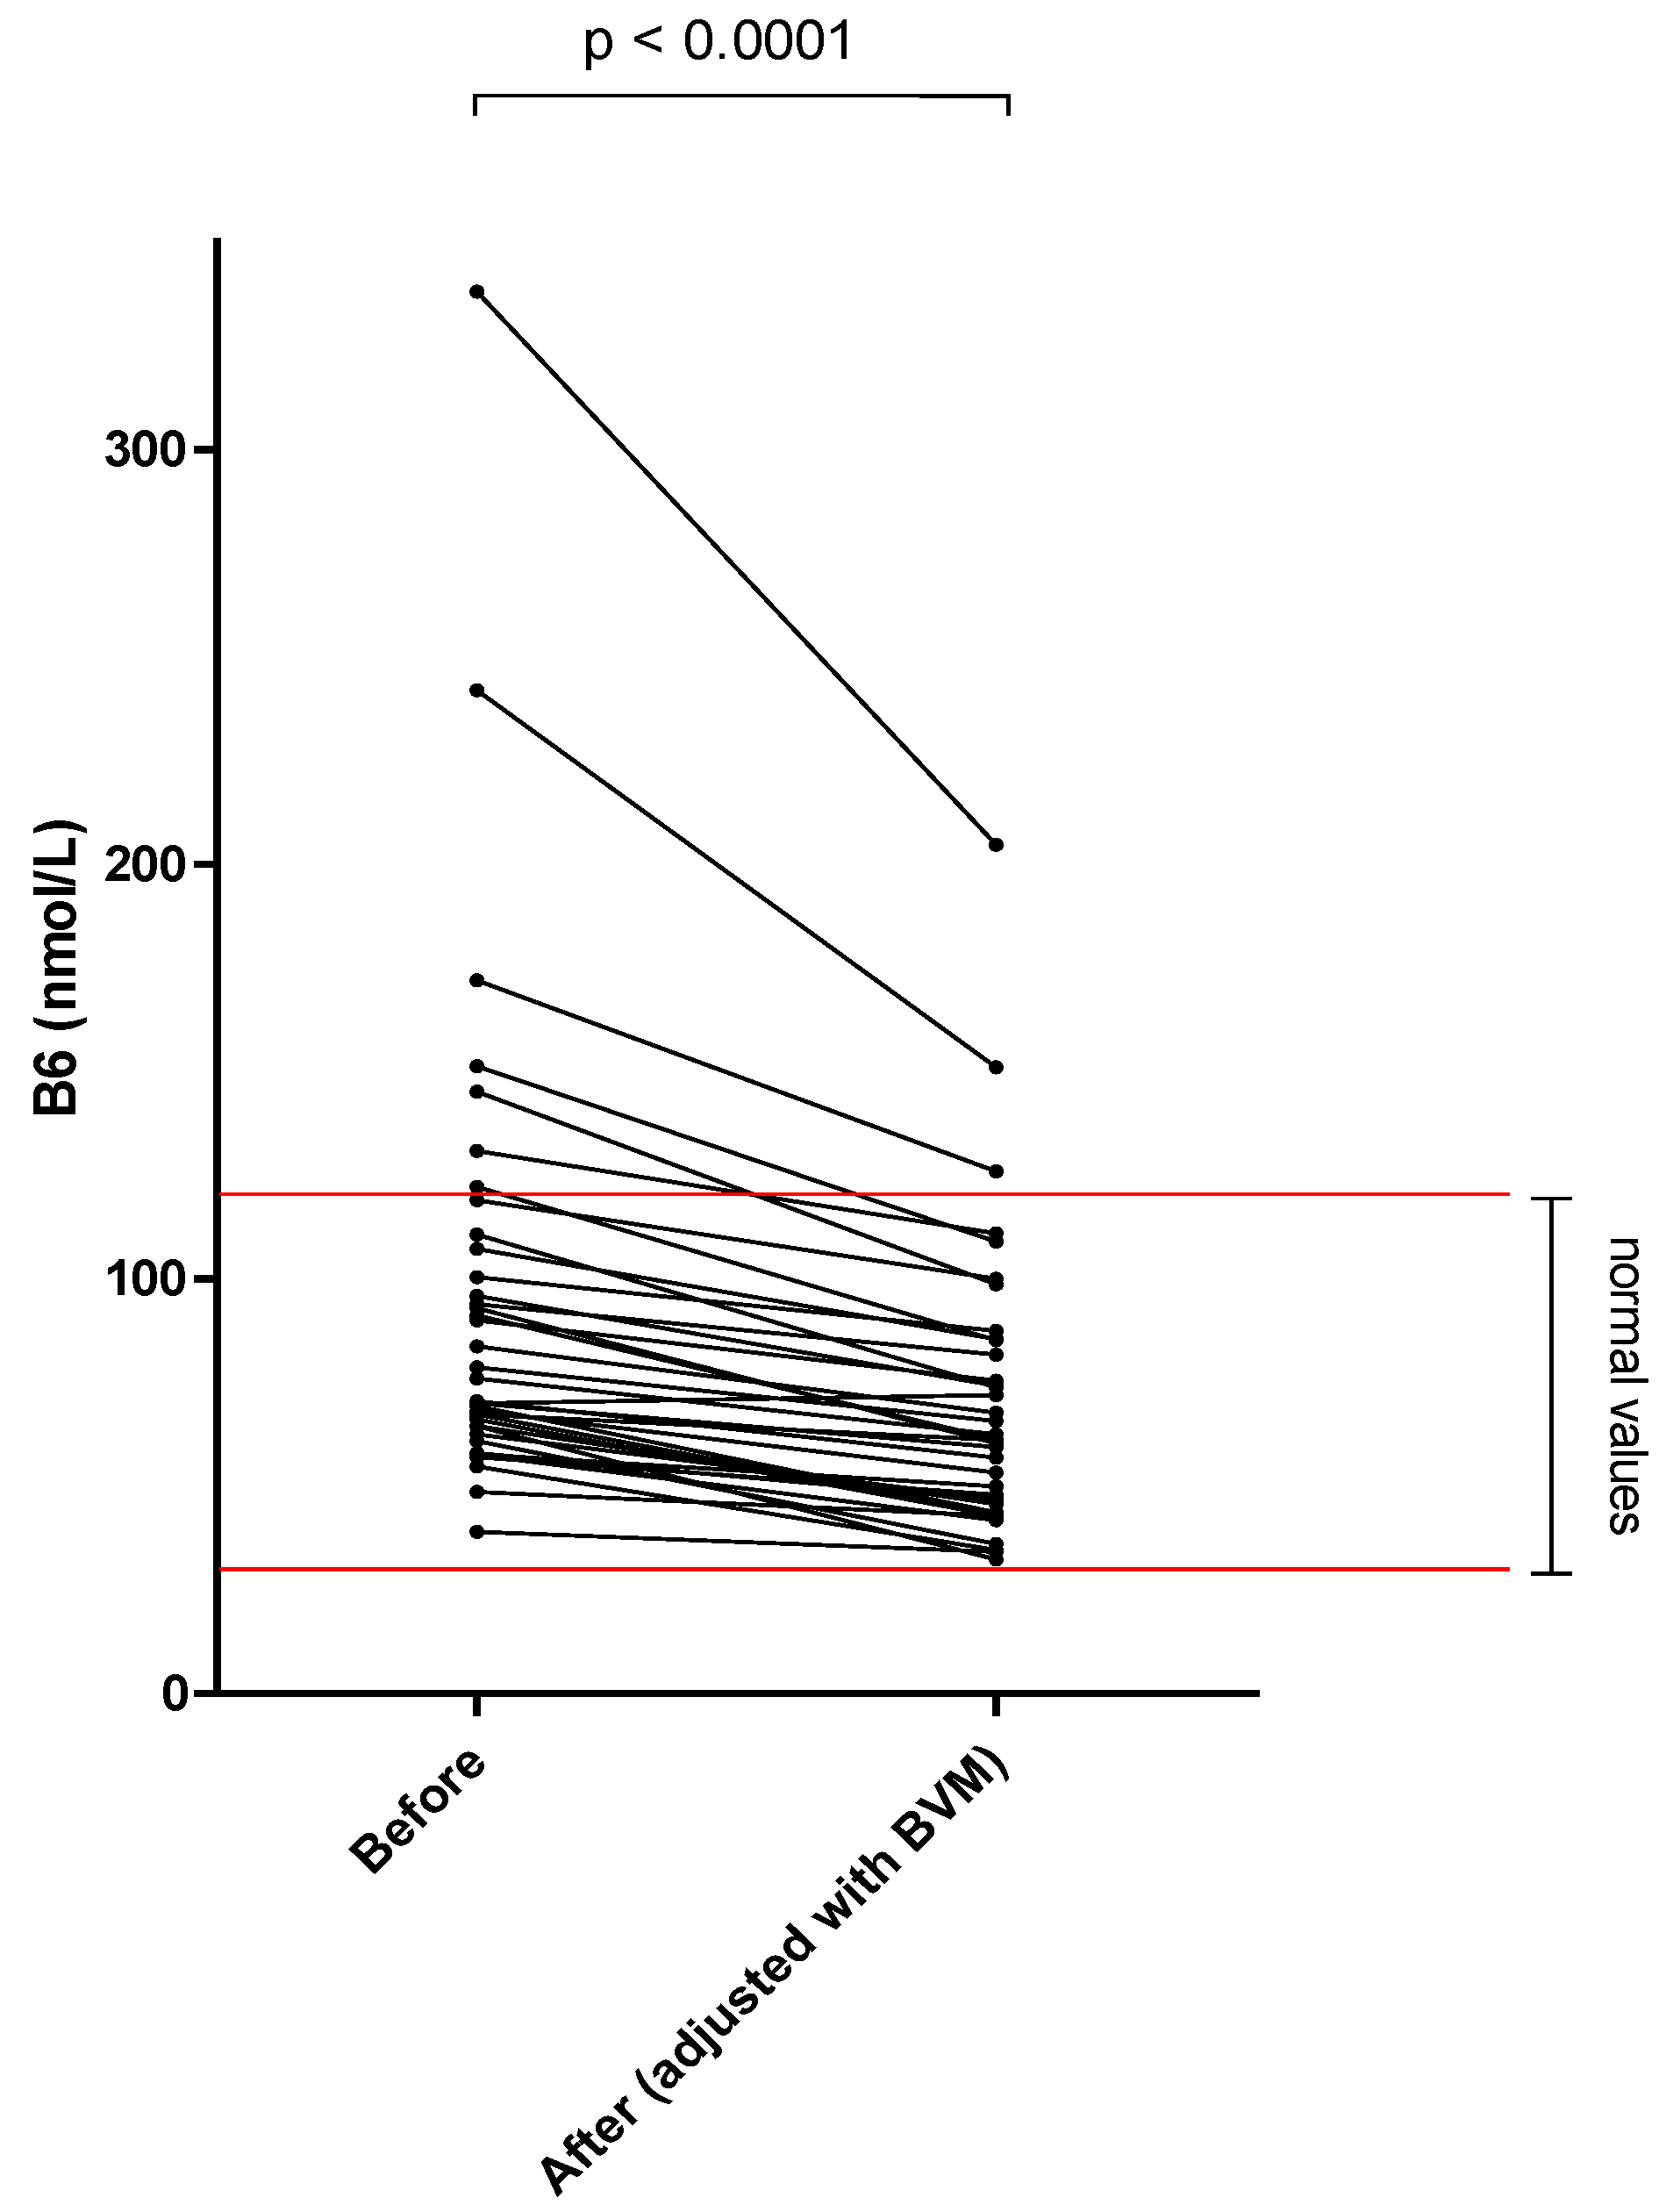
| PLP Φ (nmol/L) | 35–110 | 94.4 ± 56.0 | 70.4 ± 35.2 | –25.4 * |
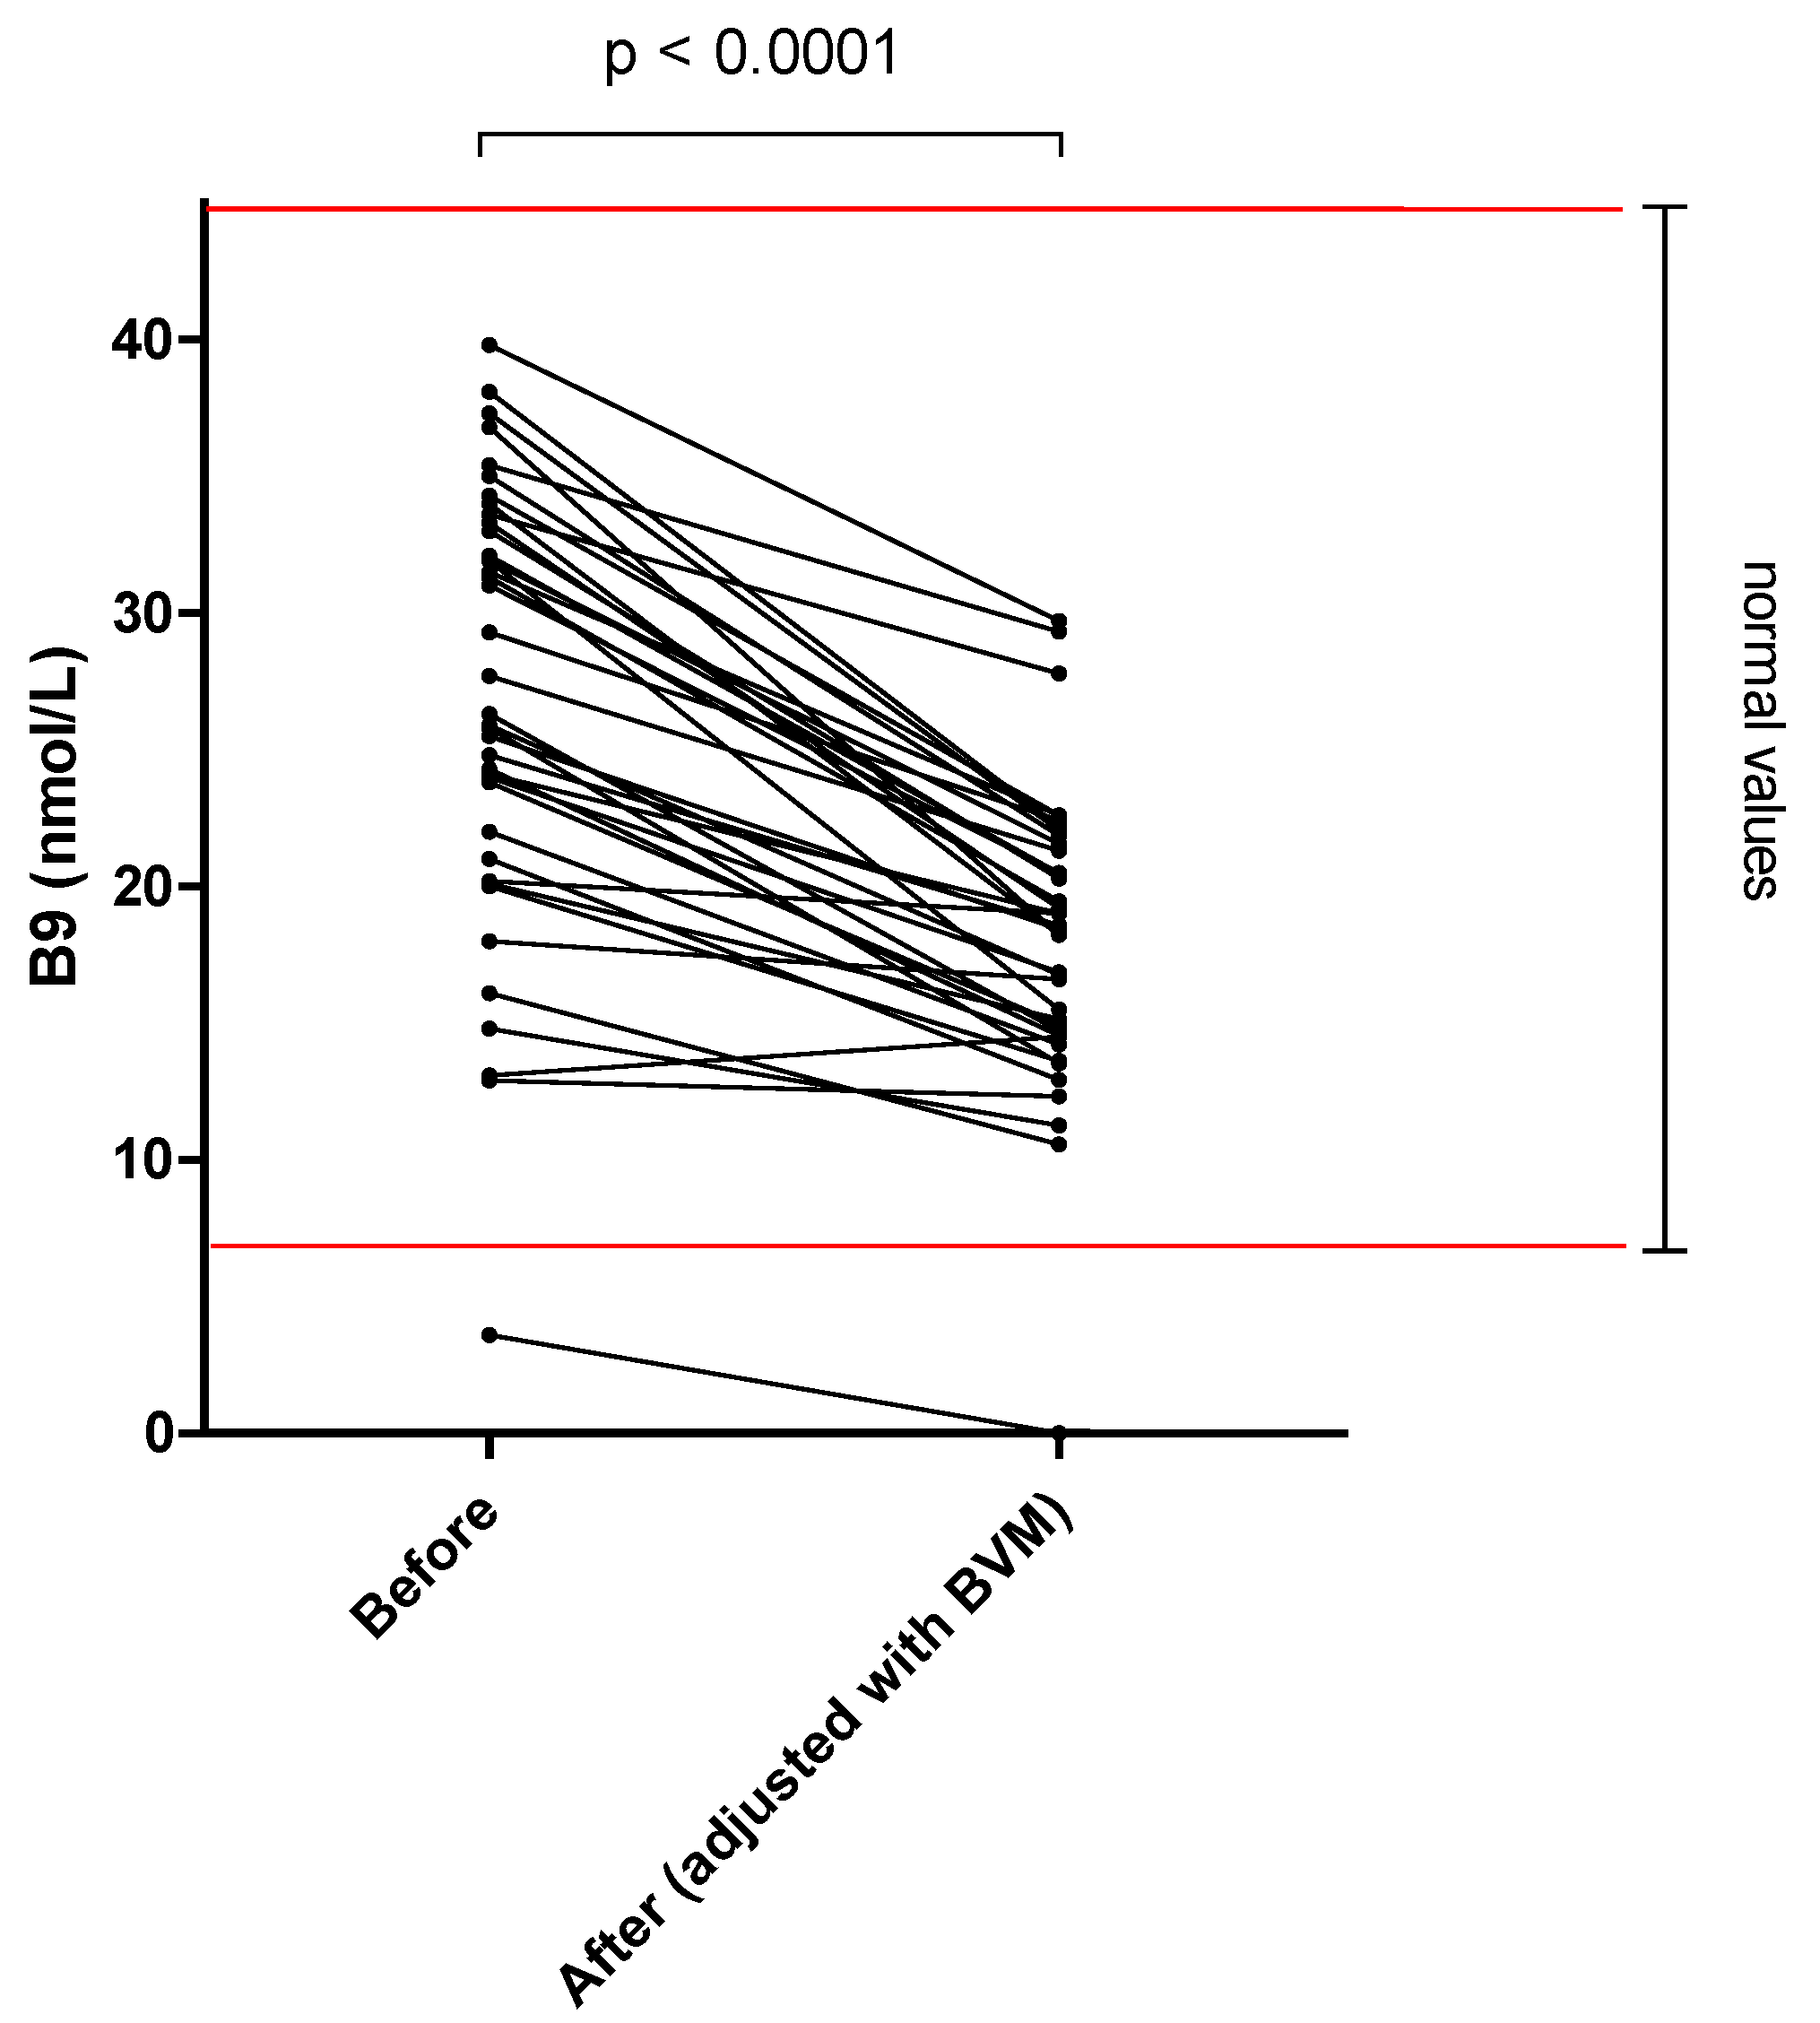
| Folates Γ (nmol/L) | 7–46 | 26.7 ± 8.1 | 18.0 ± 5.4 | –32.6 * |
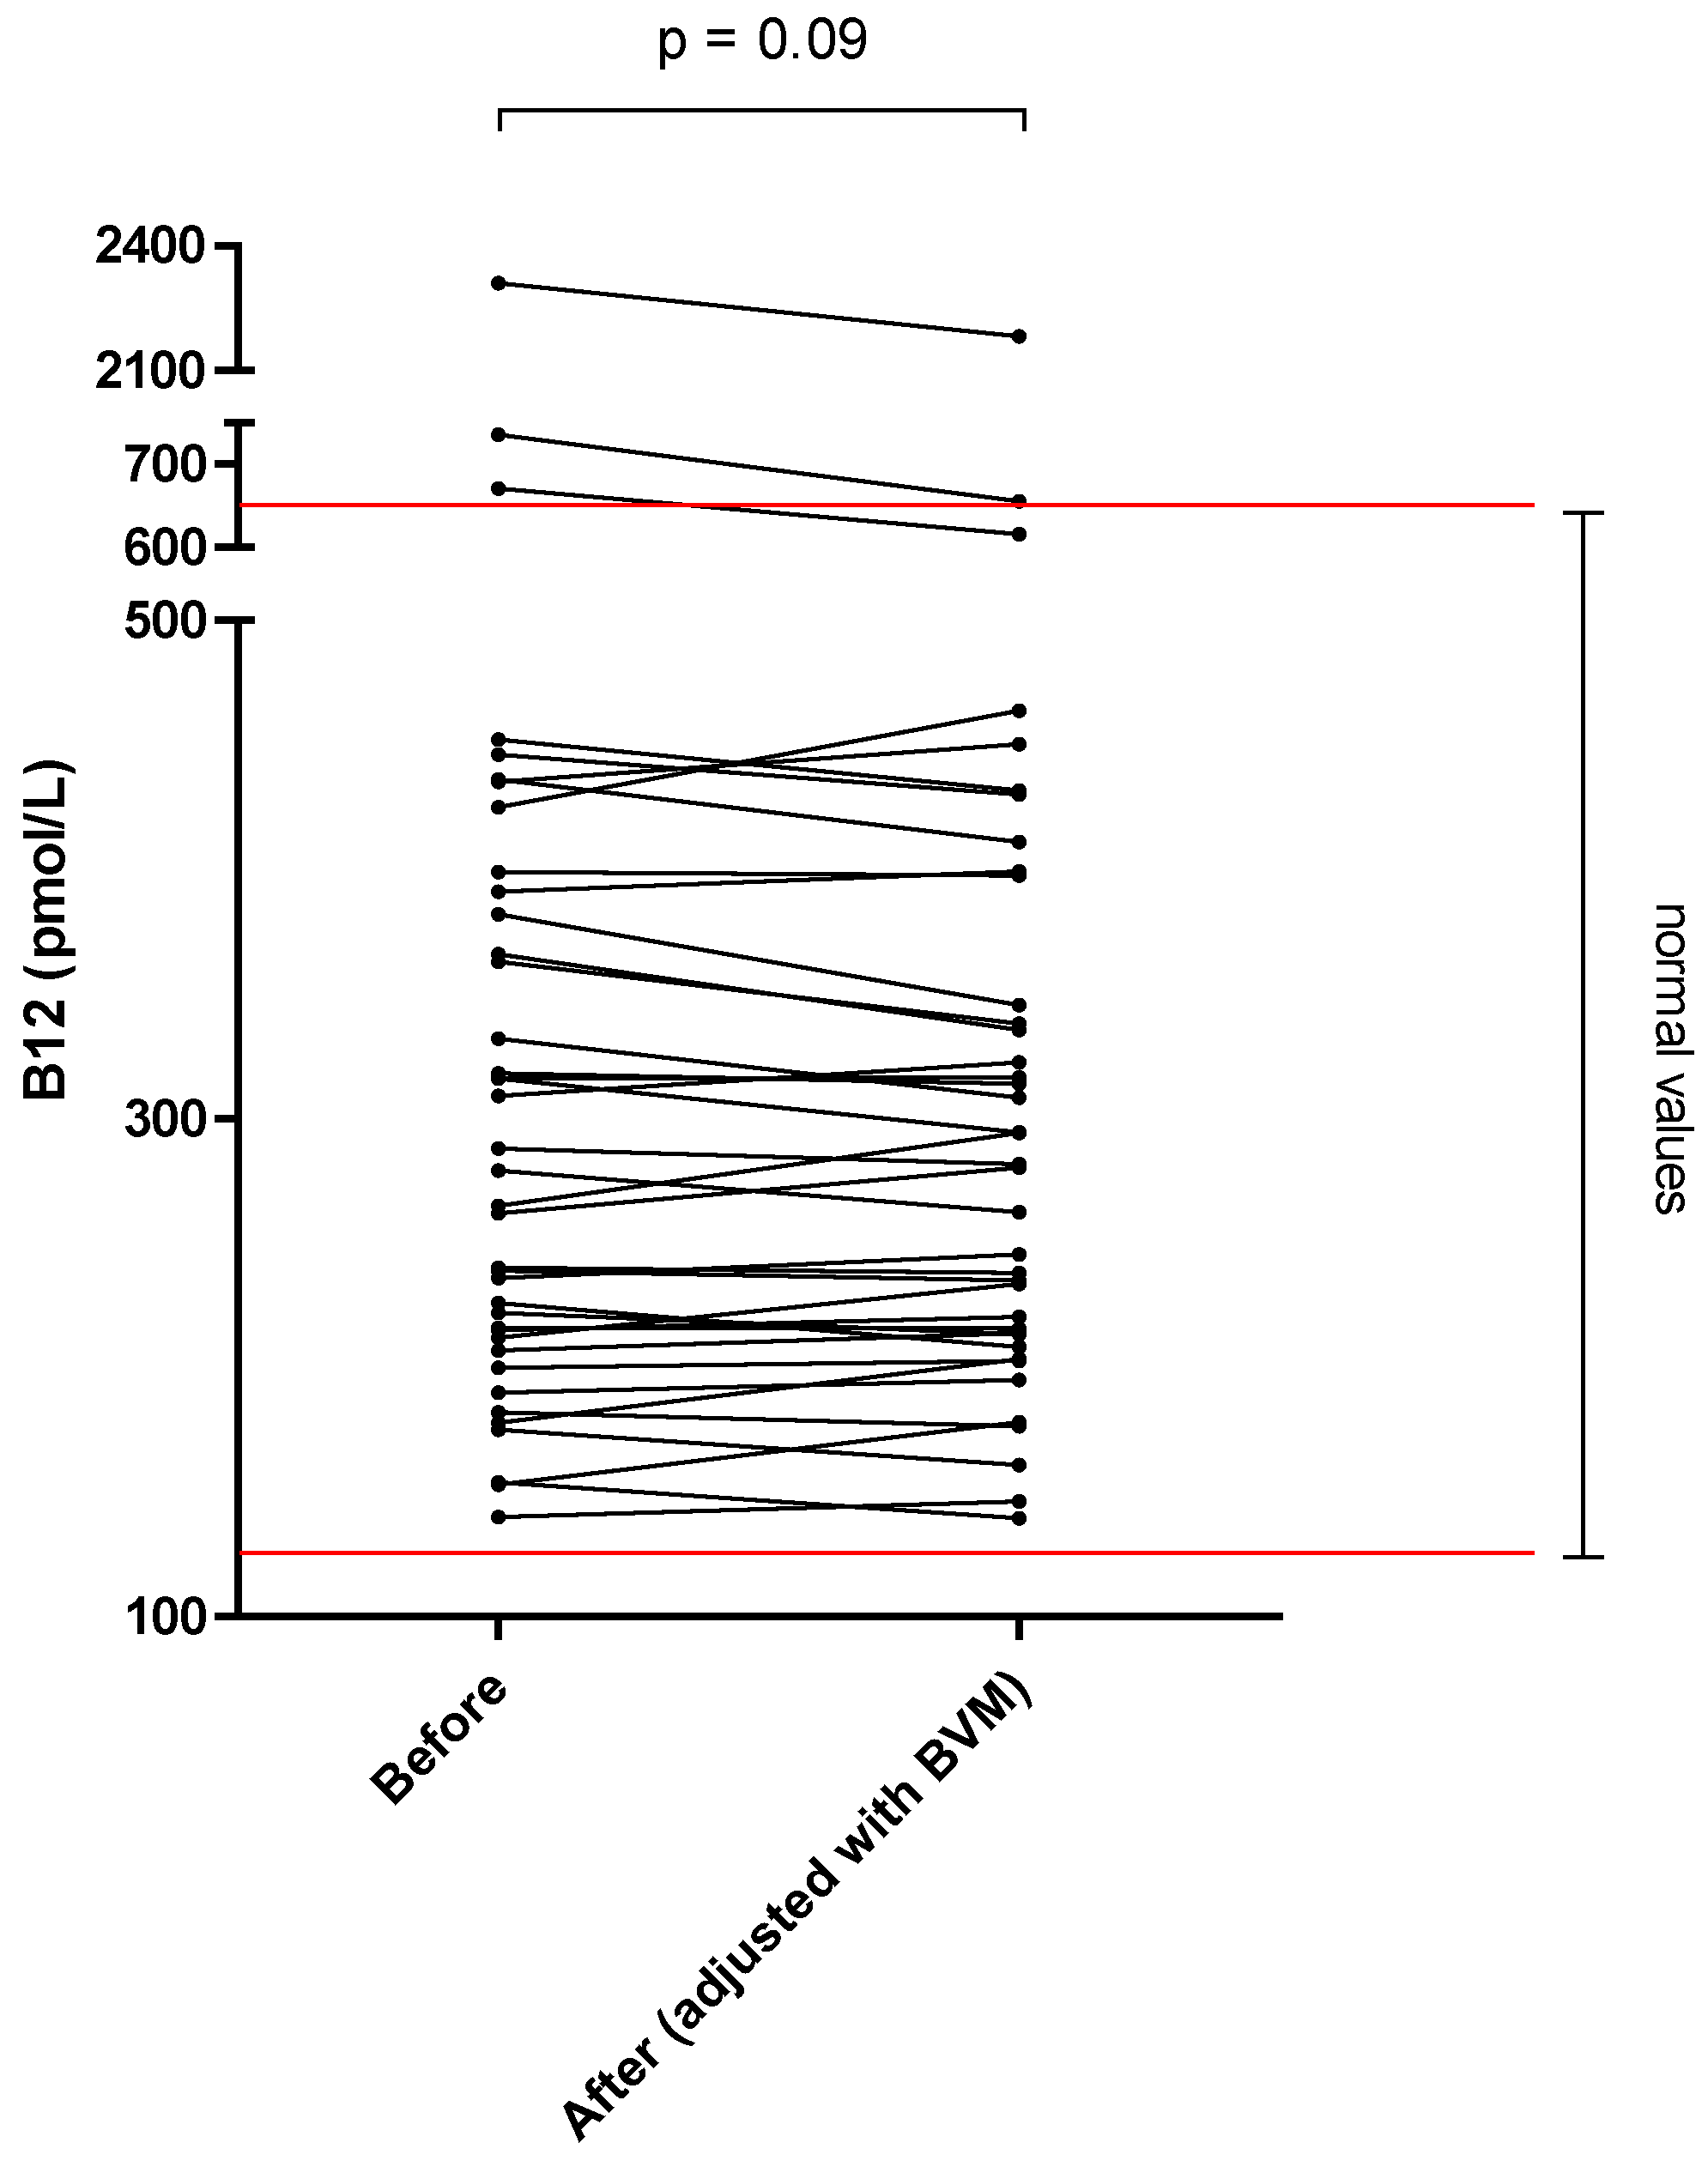
| Cobalamin H (pmol/L) | 138–652 | 355.9 ± 346.8 | 347.6 ± 323.9 | –2.3 |
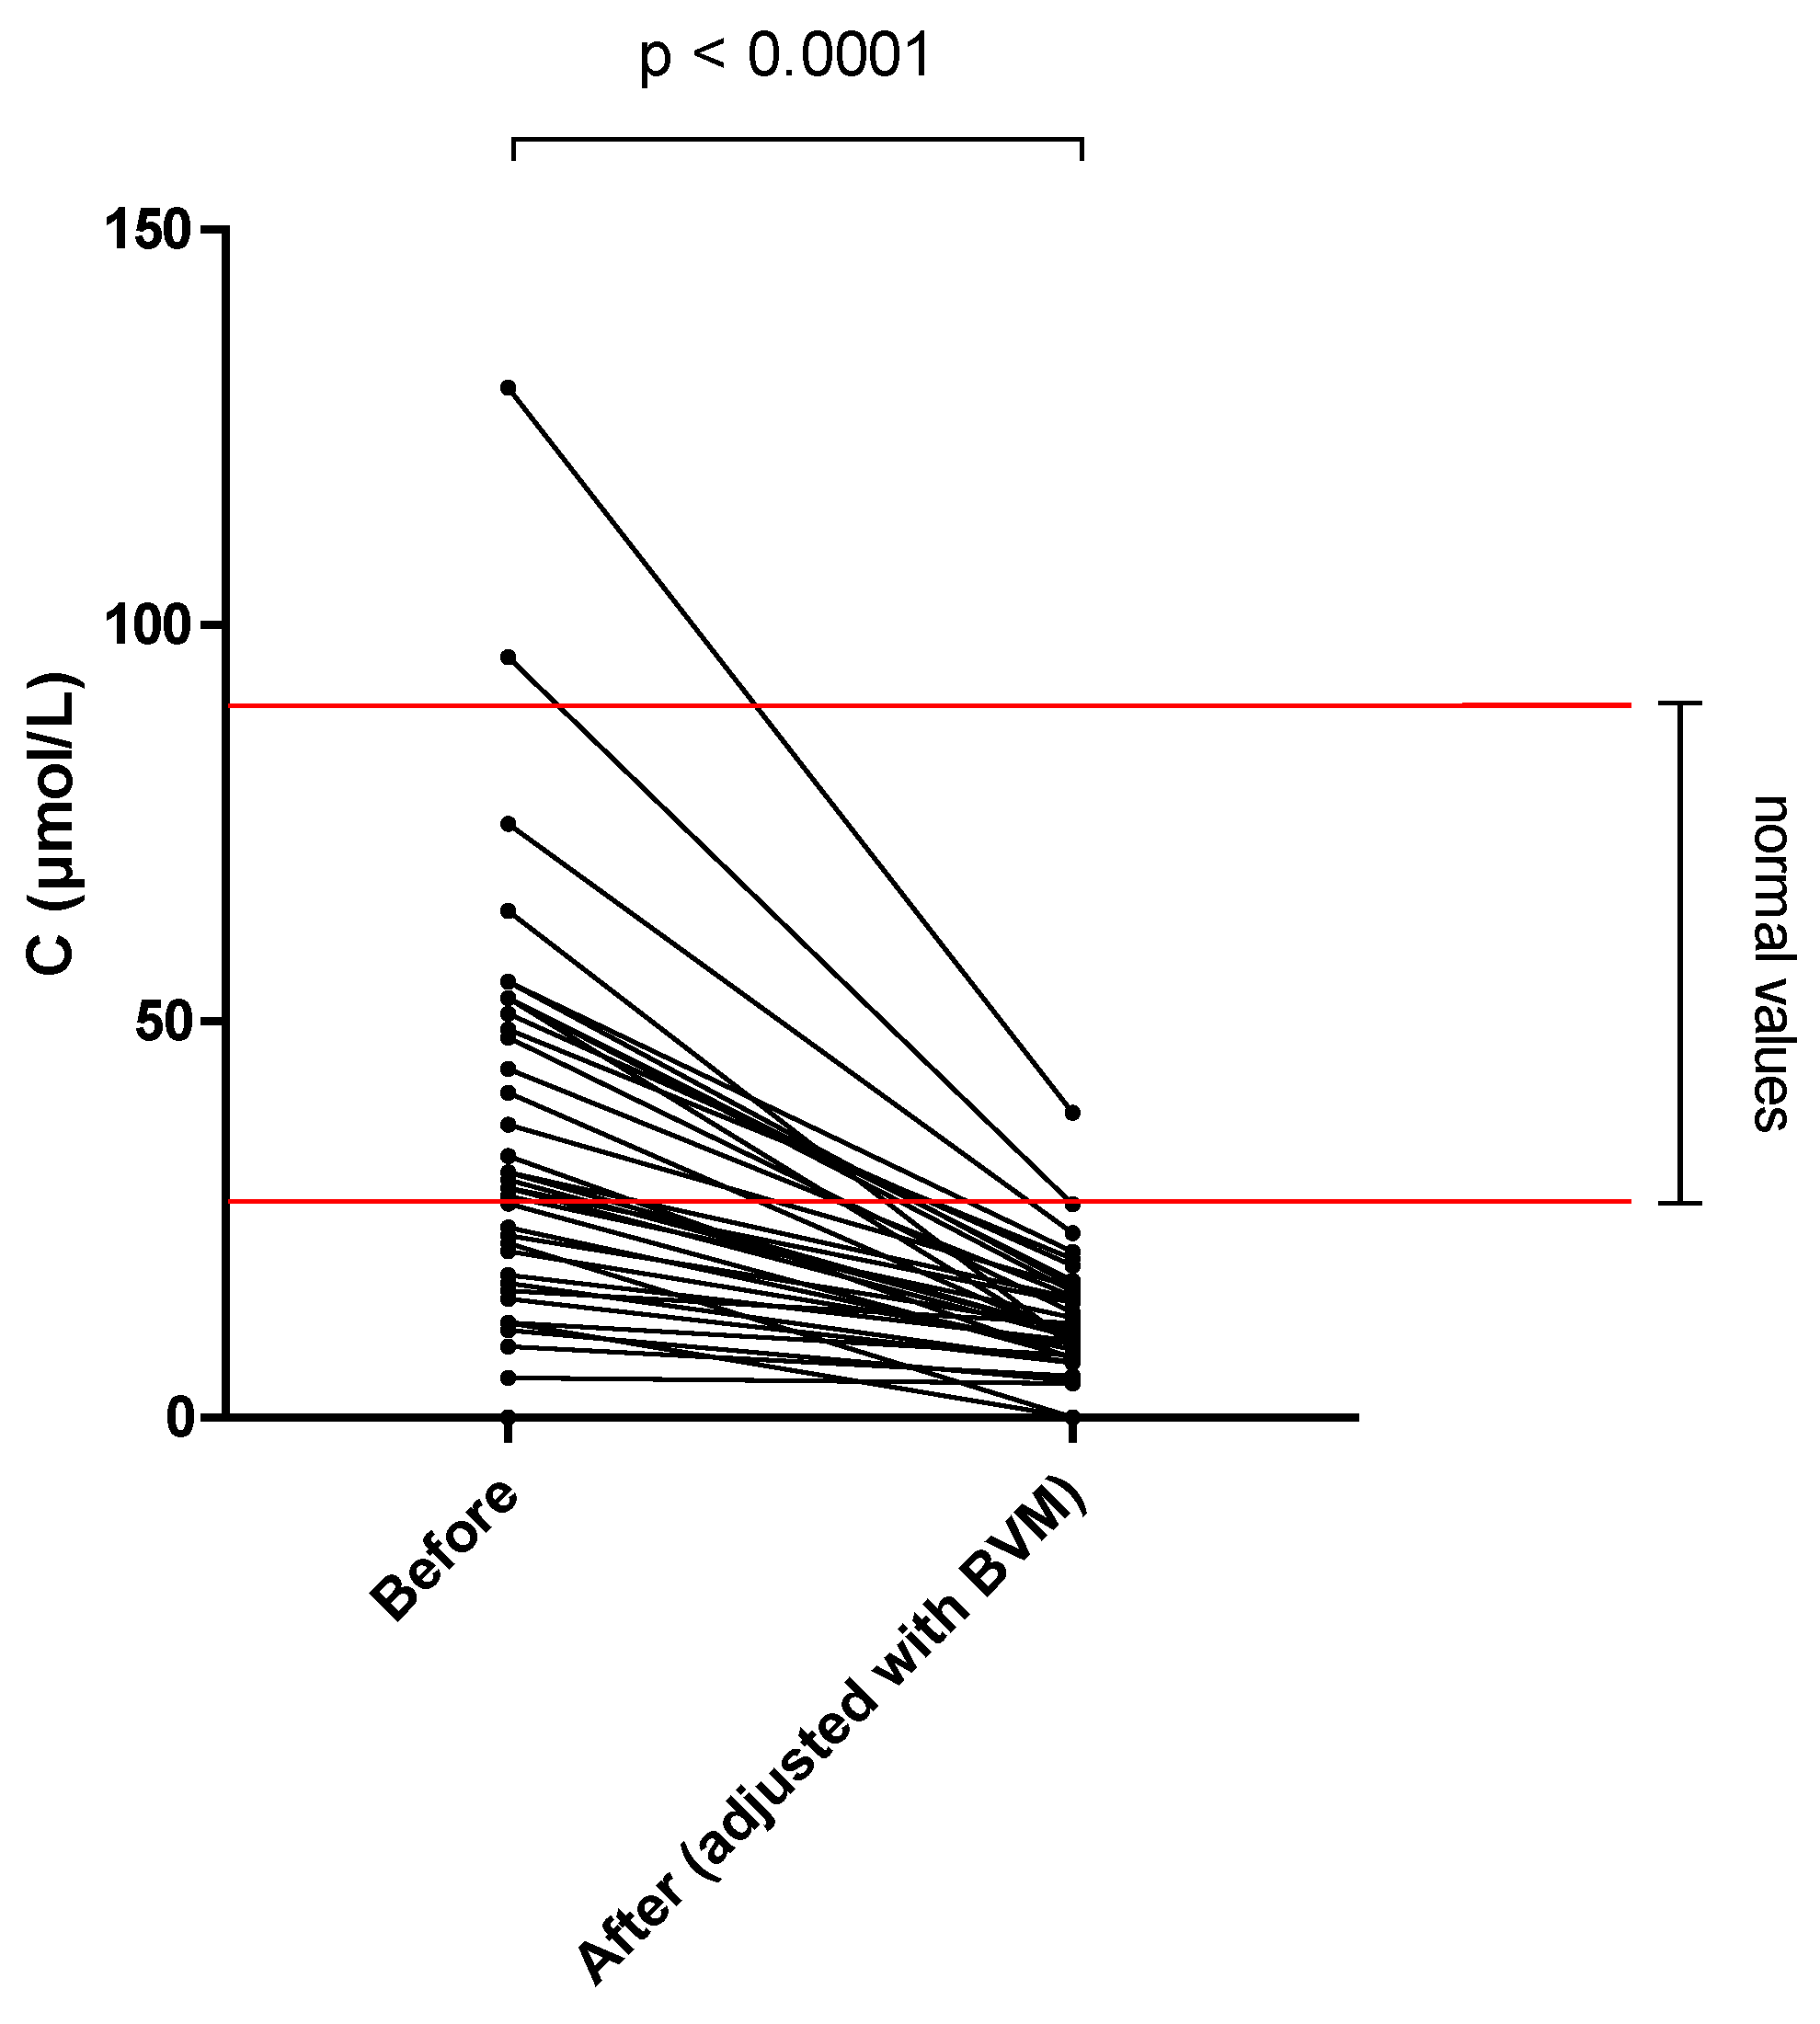
| Ascorbic acid Ι (μmol/L) | 25–85 | 34.5 ± 26.6 | 11.5 ± 7.9 | –66.6 * |
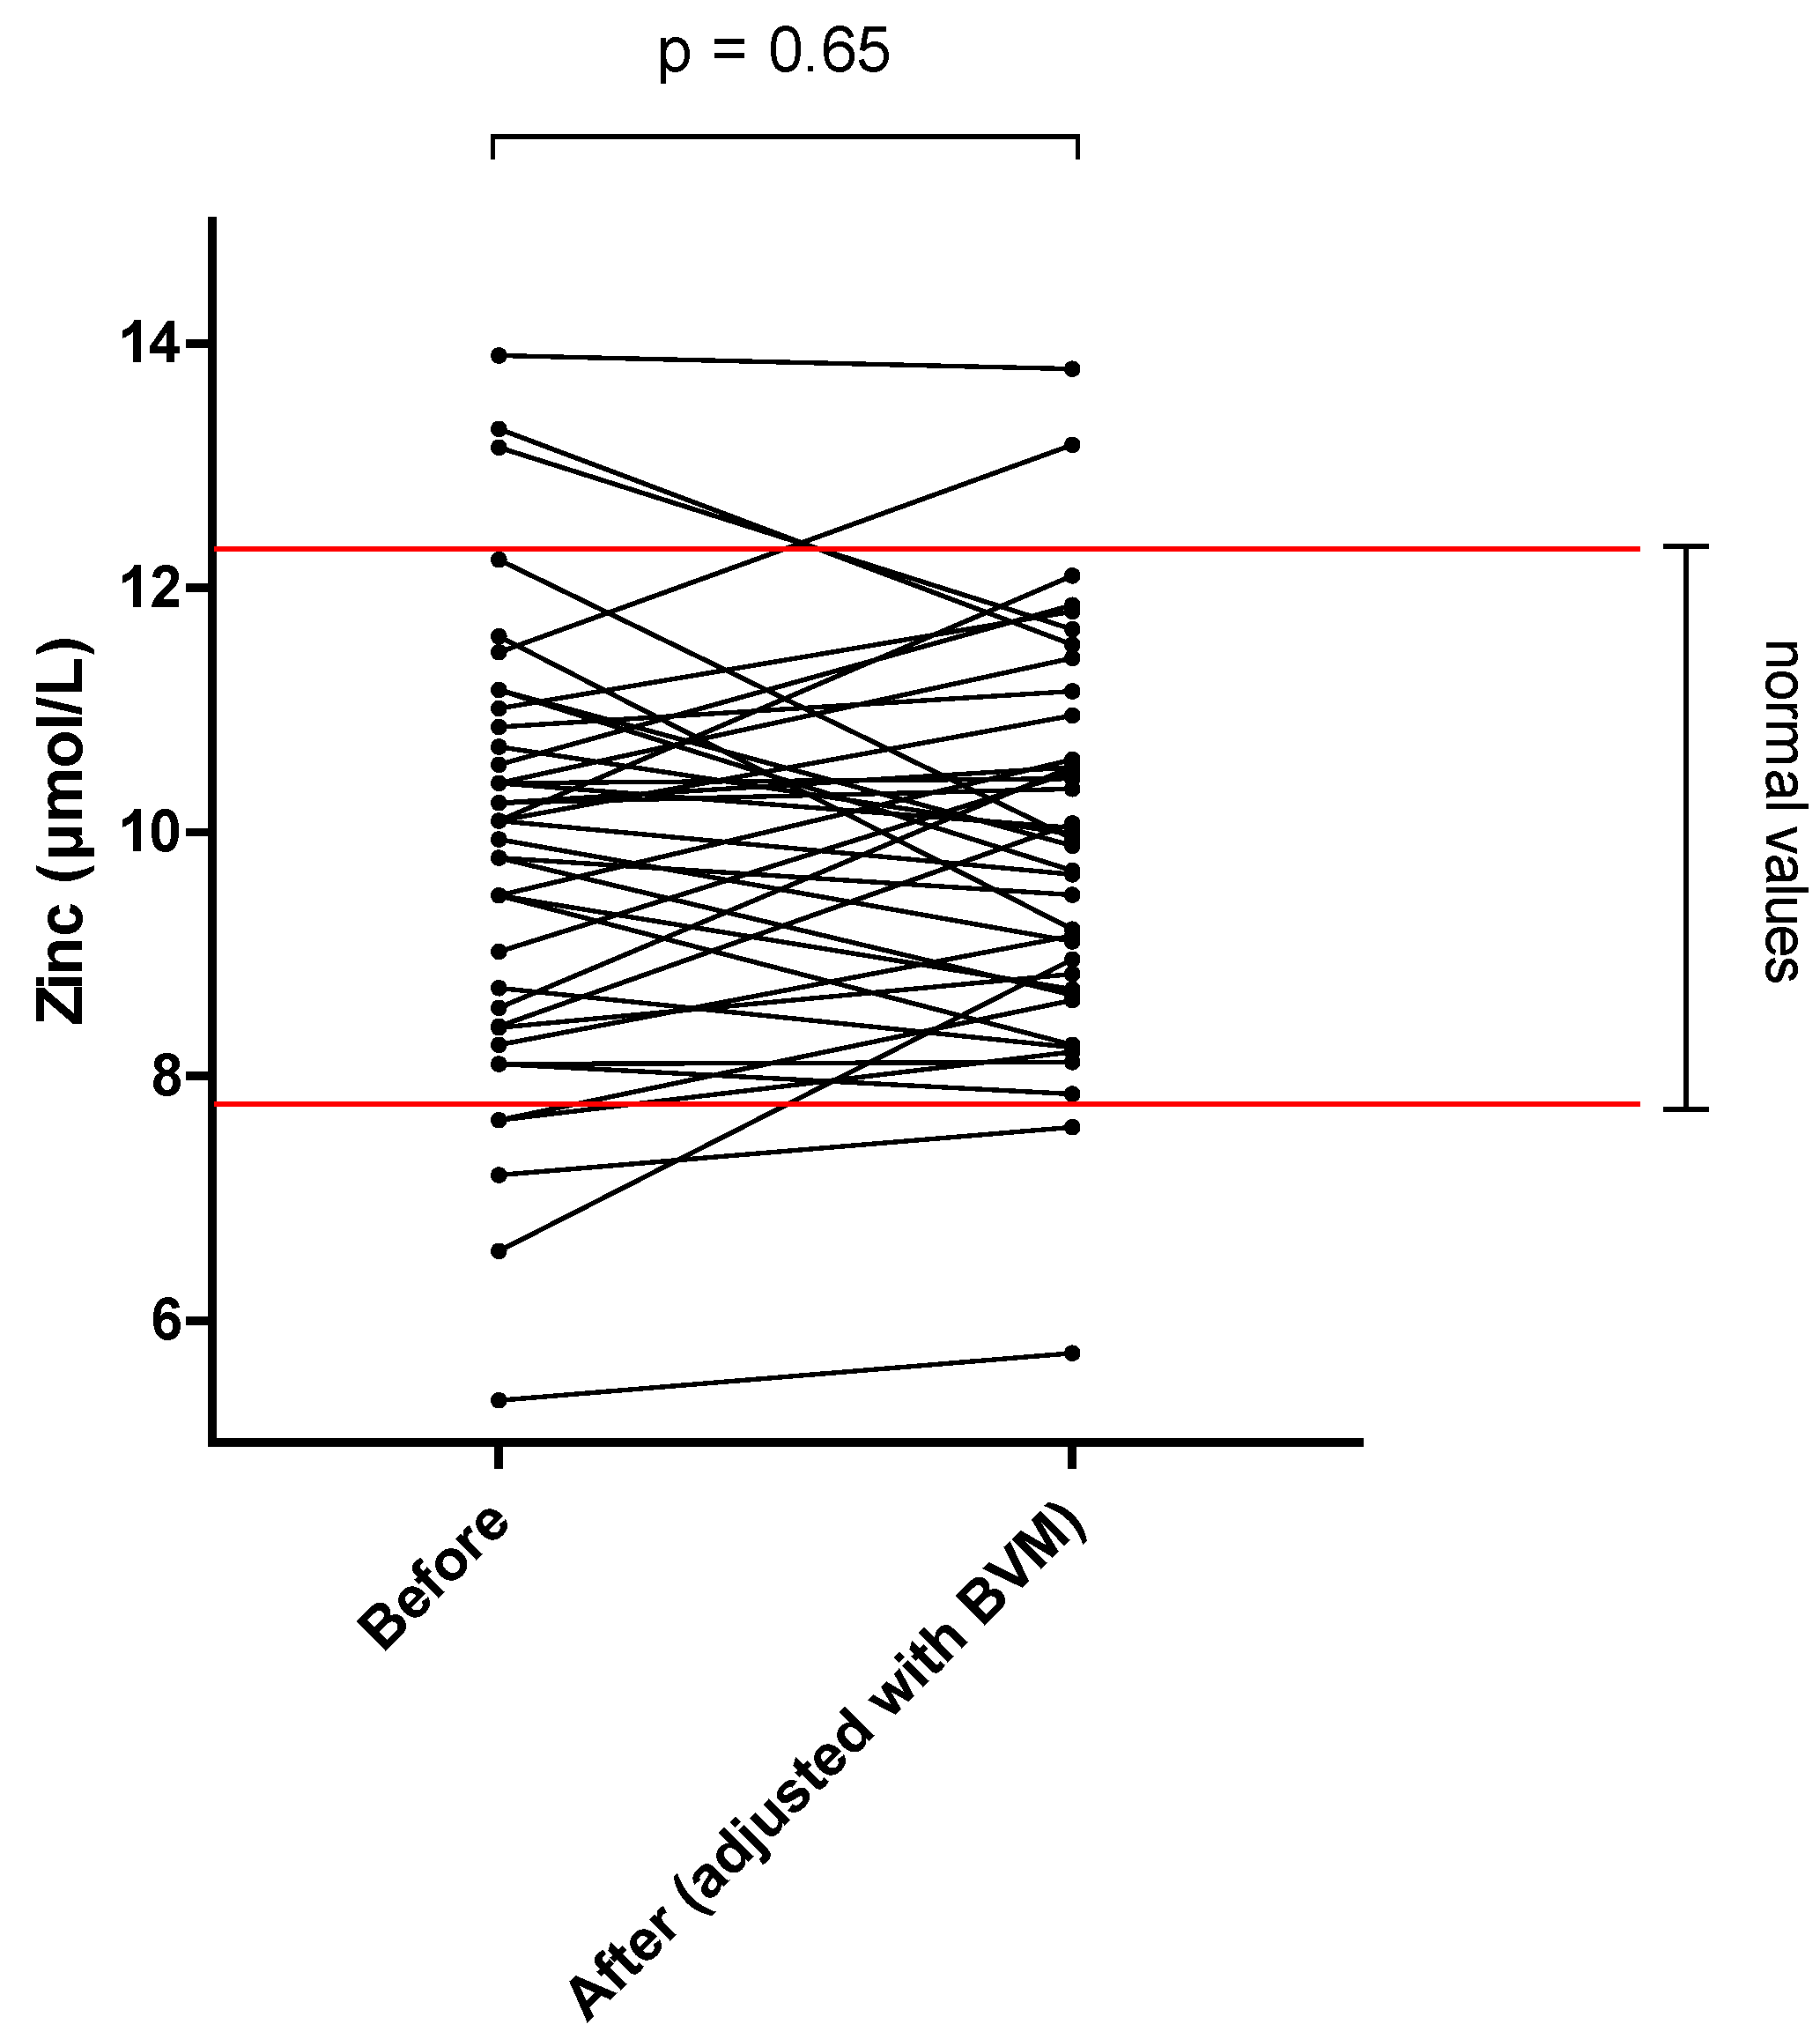
| Zinc (μmol/L) | 7.8–12.4 | 9.8 ± 1.8 | 9.9 ± 1.6 | +1.0 |
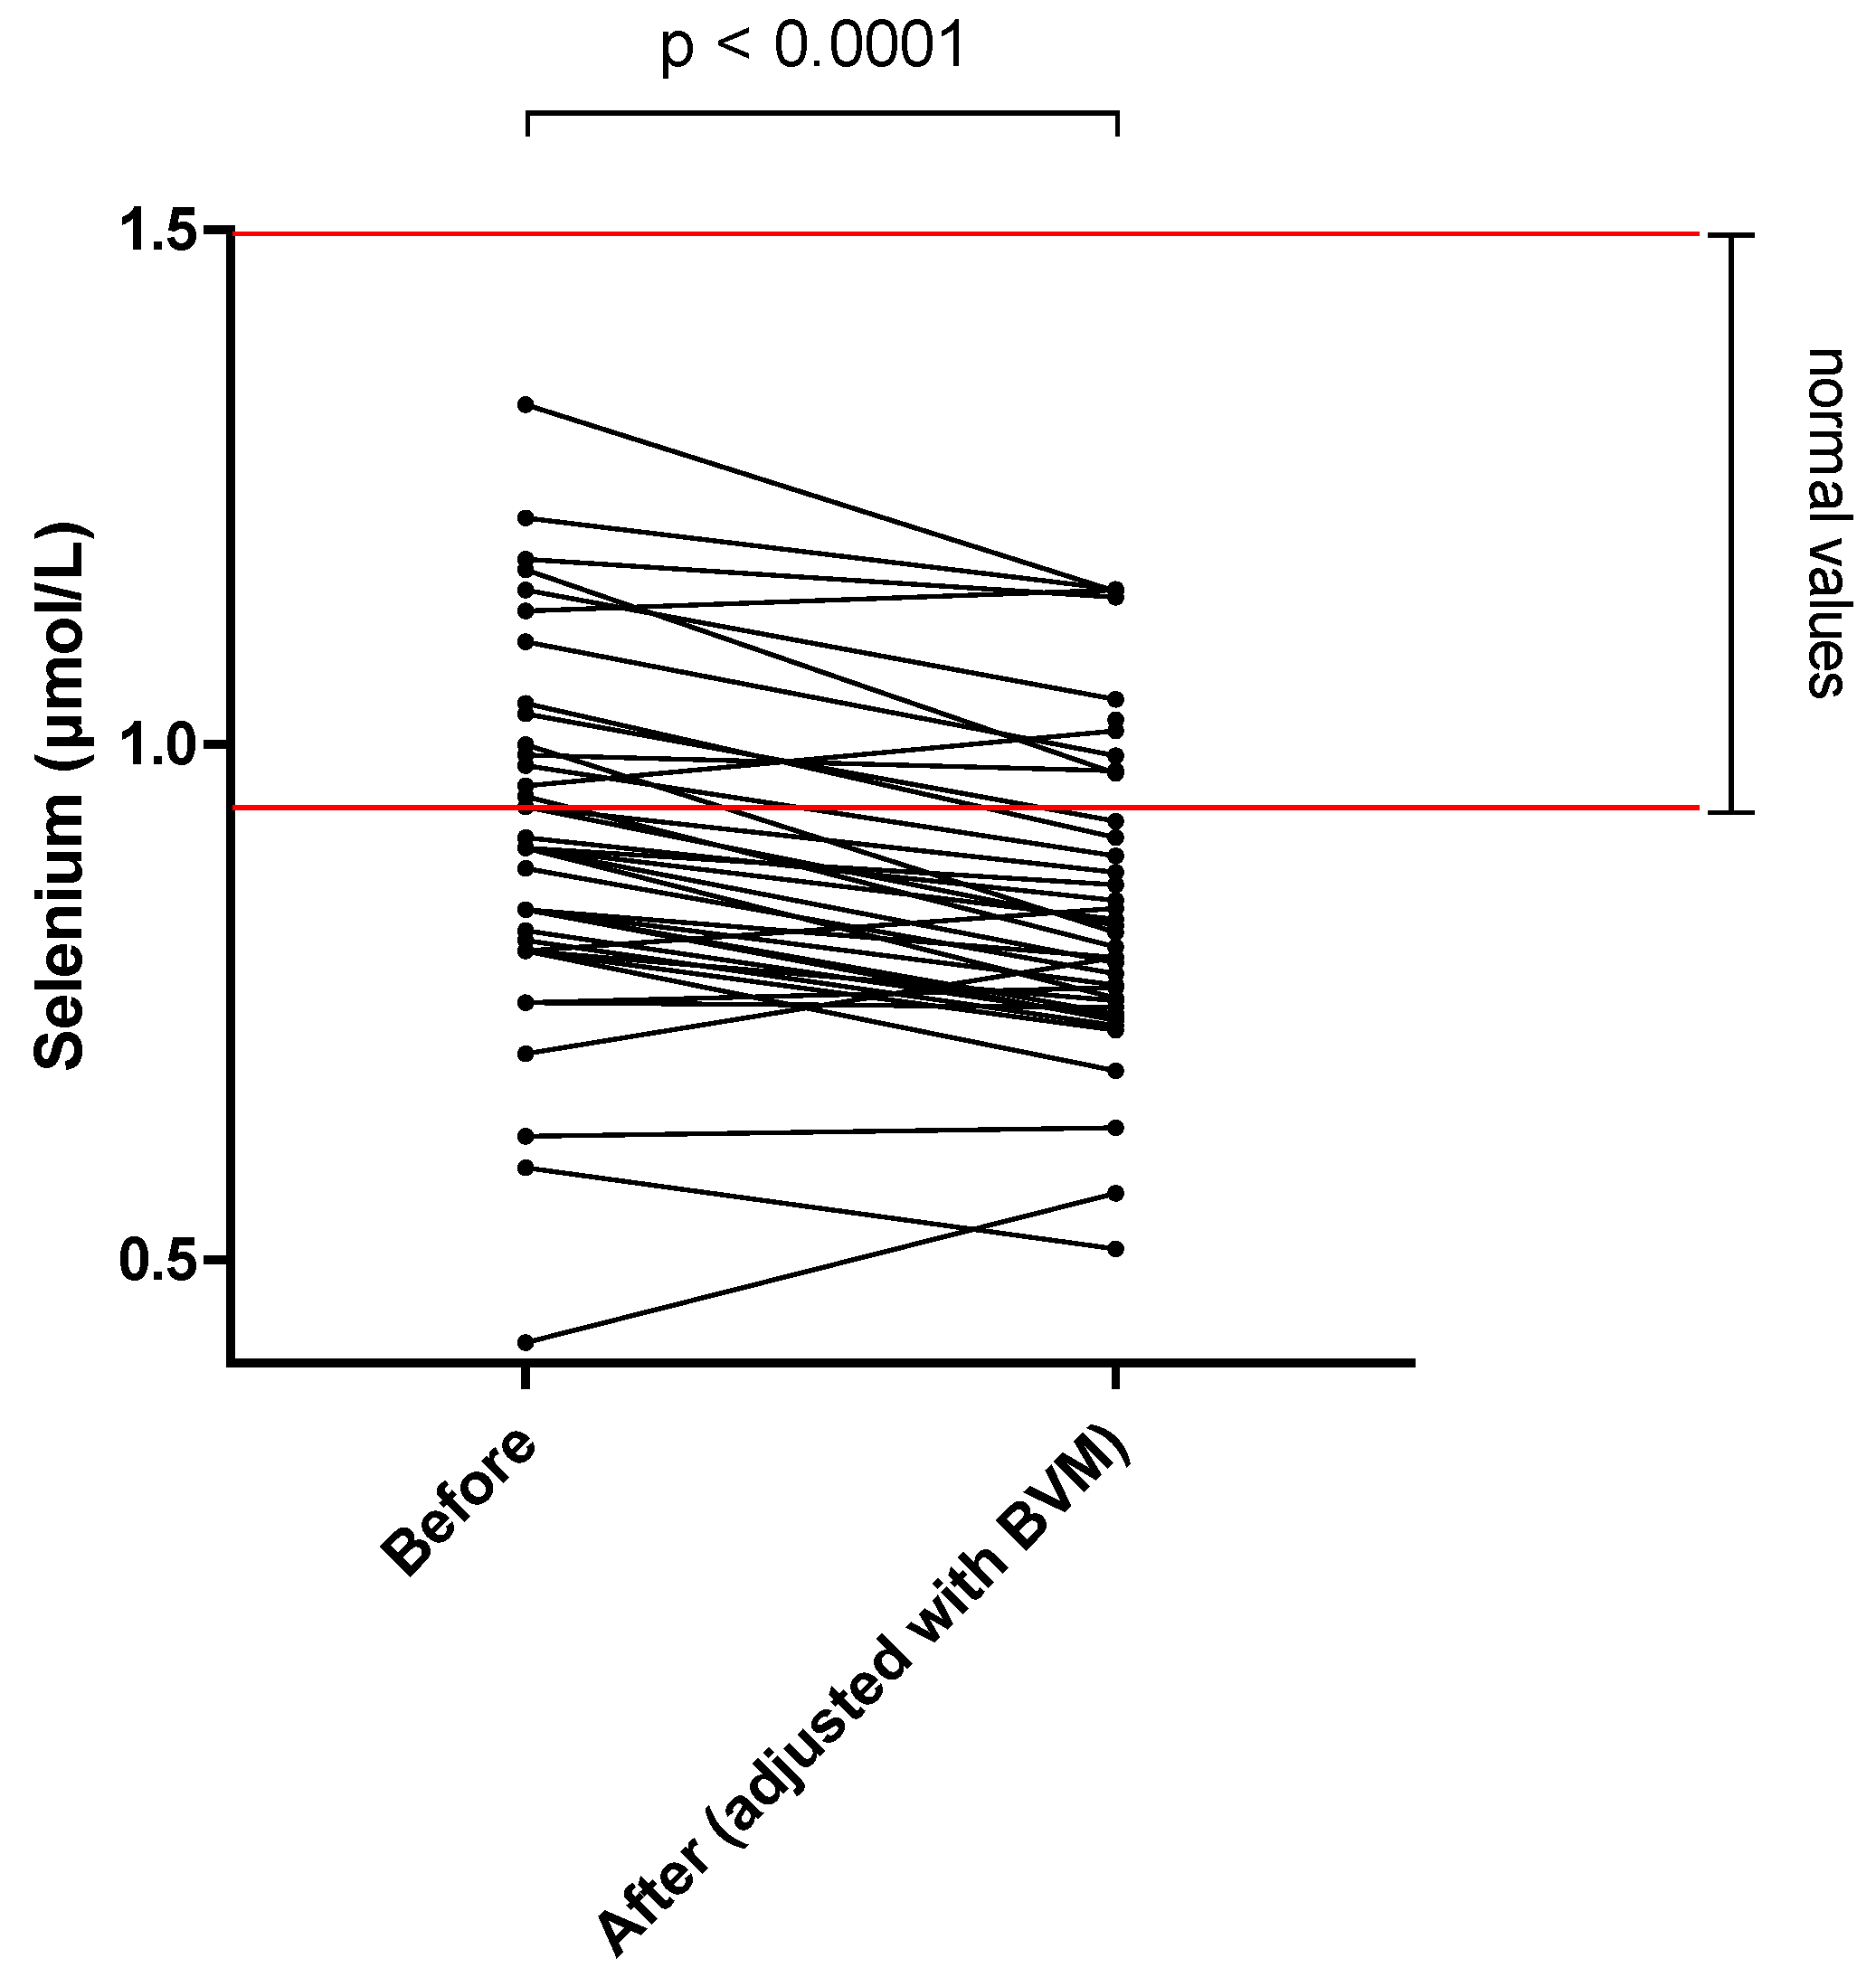
| Selenium (μmol/L) | 0.9–1.5 | 0.9 ± 0.2 | 0.85 ± 0.15 | –6.7 * |
| Dialysate Concentration | Dialysate Mass Loss | RDA Equivalent | |
|---|---|---|---|
| Thiamine | 20.71 (±17.92) nmol/L | 3321.0 ± 2613.0 nmol 1.12 ± 0.88 mg | 97% |
| Riboflavin | 4.61 (±4.97) nmol/L | 751.7 ± 804.1 nmol 0.28 ± 0.30 mg | 23% |
| Pyridoxal | 8.07 (±2.44) nmol/L | 1326.0 ± 385.2 nmol 0.33 ± 0.09 mg | 22% |
| Folates | 4.29 (±2.40) nmol/L | 715.1 ± 404.6 nmol 0.31 ± 0.18 mg | 77% |
| Cobalamin | ND | ND | |
| Ascorbic acid | 5.13 (±5.00) μmol/L | 836.9 ± 825.9 μmol 147.50 ± 145.50 mg | 179% |
| Zinc | 2.37 (±0.44) μmol/L | 394.4 ± 105.8 μmol 25.75 ± 6.91 mg | 234% |
| Selenium | ND | ND |
Publisher’s Note: MDPI stays neutral with regard to jurisdictional claims in published maps and institutional affiliations. |
© 2022 by the authors. Licensee MDPI, Basel, Switzerland. This article is an open access article distributed under the terms and conditions of the Creative Commons Attribution (CC BY) license (https://creativecommons.org/licenses/by/4.0/).
Share and Cite
Bévier, A.; Novel-Catin, E.; Blond, E.; Pelletier, S.; Parant, F.; Koppe, L.; Fouque, D. Water-Soluble Vitamins and Trace Elements Losses during On-Line Hemodiafiltration. Nutrients 2022, 14, 3454. https://doi.org/10.3390/nu14173454
Bévier A, Novel-Catin E, Blond E, Pelletier S, Parant F, Koppe L, Fouque D. Water-Soluble Vitamins and Trace Elements Losses during On-Line Hemodiafiltration. Nutrients. 2022; 14(17):3454. https://doi.org/10.3390/nu14173454
Chicago/Turabian StyleBévier, Alban, Etienne Novel-Catin, Emilie Blond, Solenne Pelletier, Francois Parant, Laetitia Koppe, and Denis Fouque. 2022. "Water-Soluble Vitamins and Trace Elements Losses during On-Line Hemodiafiltration" Nutrients 14, no. 17: 3454. https://doi.org/10.3390/nu14173454