
Body Fat Moderates the Association of Olfactory Dysfunction with Dietary Intake in U.S. Middle-Aged and Older Adults: A Cross-Sectional Analysis of NHANES 2013–2014


Abstract
:1. Introduction
2. Materials and Methods
2.1. Study Design and Sample
2.2. Measures
2.2.1. Olfactory Function Assessment
2.2.2. Dietary Intake and Healthy Eating Index (HEI Calculation)
2.2.3. Anthropometric and Body Composition Measurement
2.2.4. Covariates
2.2.5. Data Analysis
3. Results
3.1. Sample Characteristics
3.2. Dietary Intake and Quality by Objective Olfactory Function
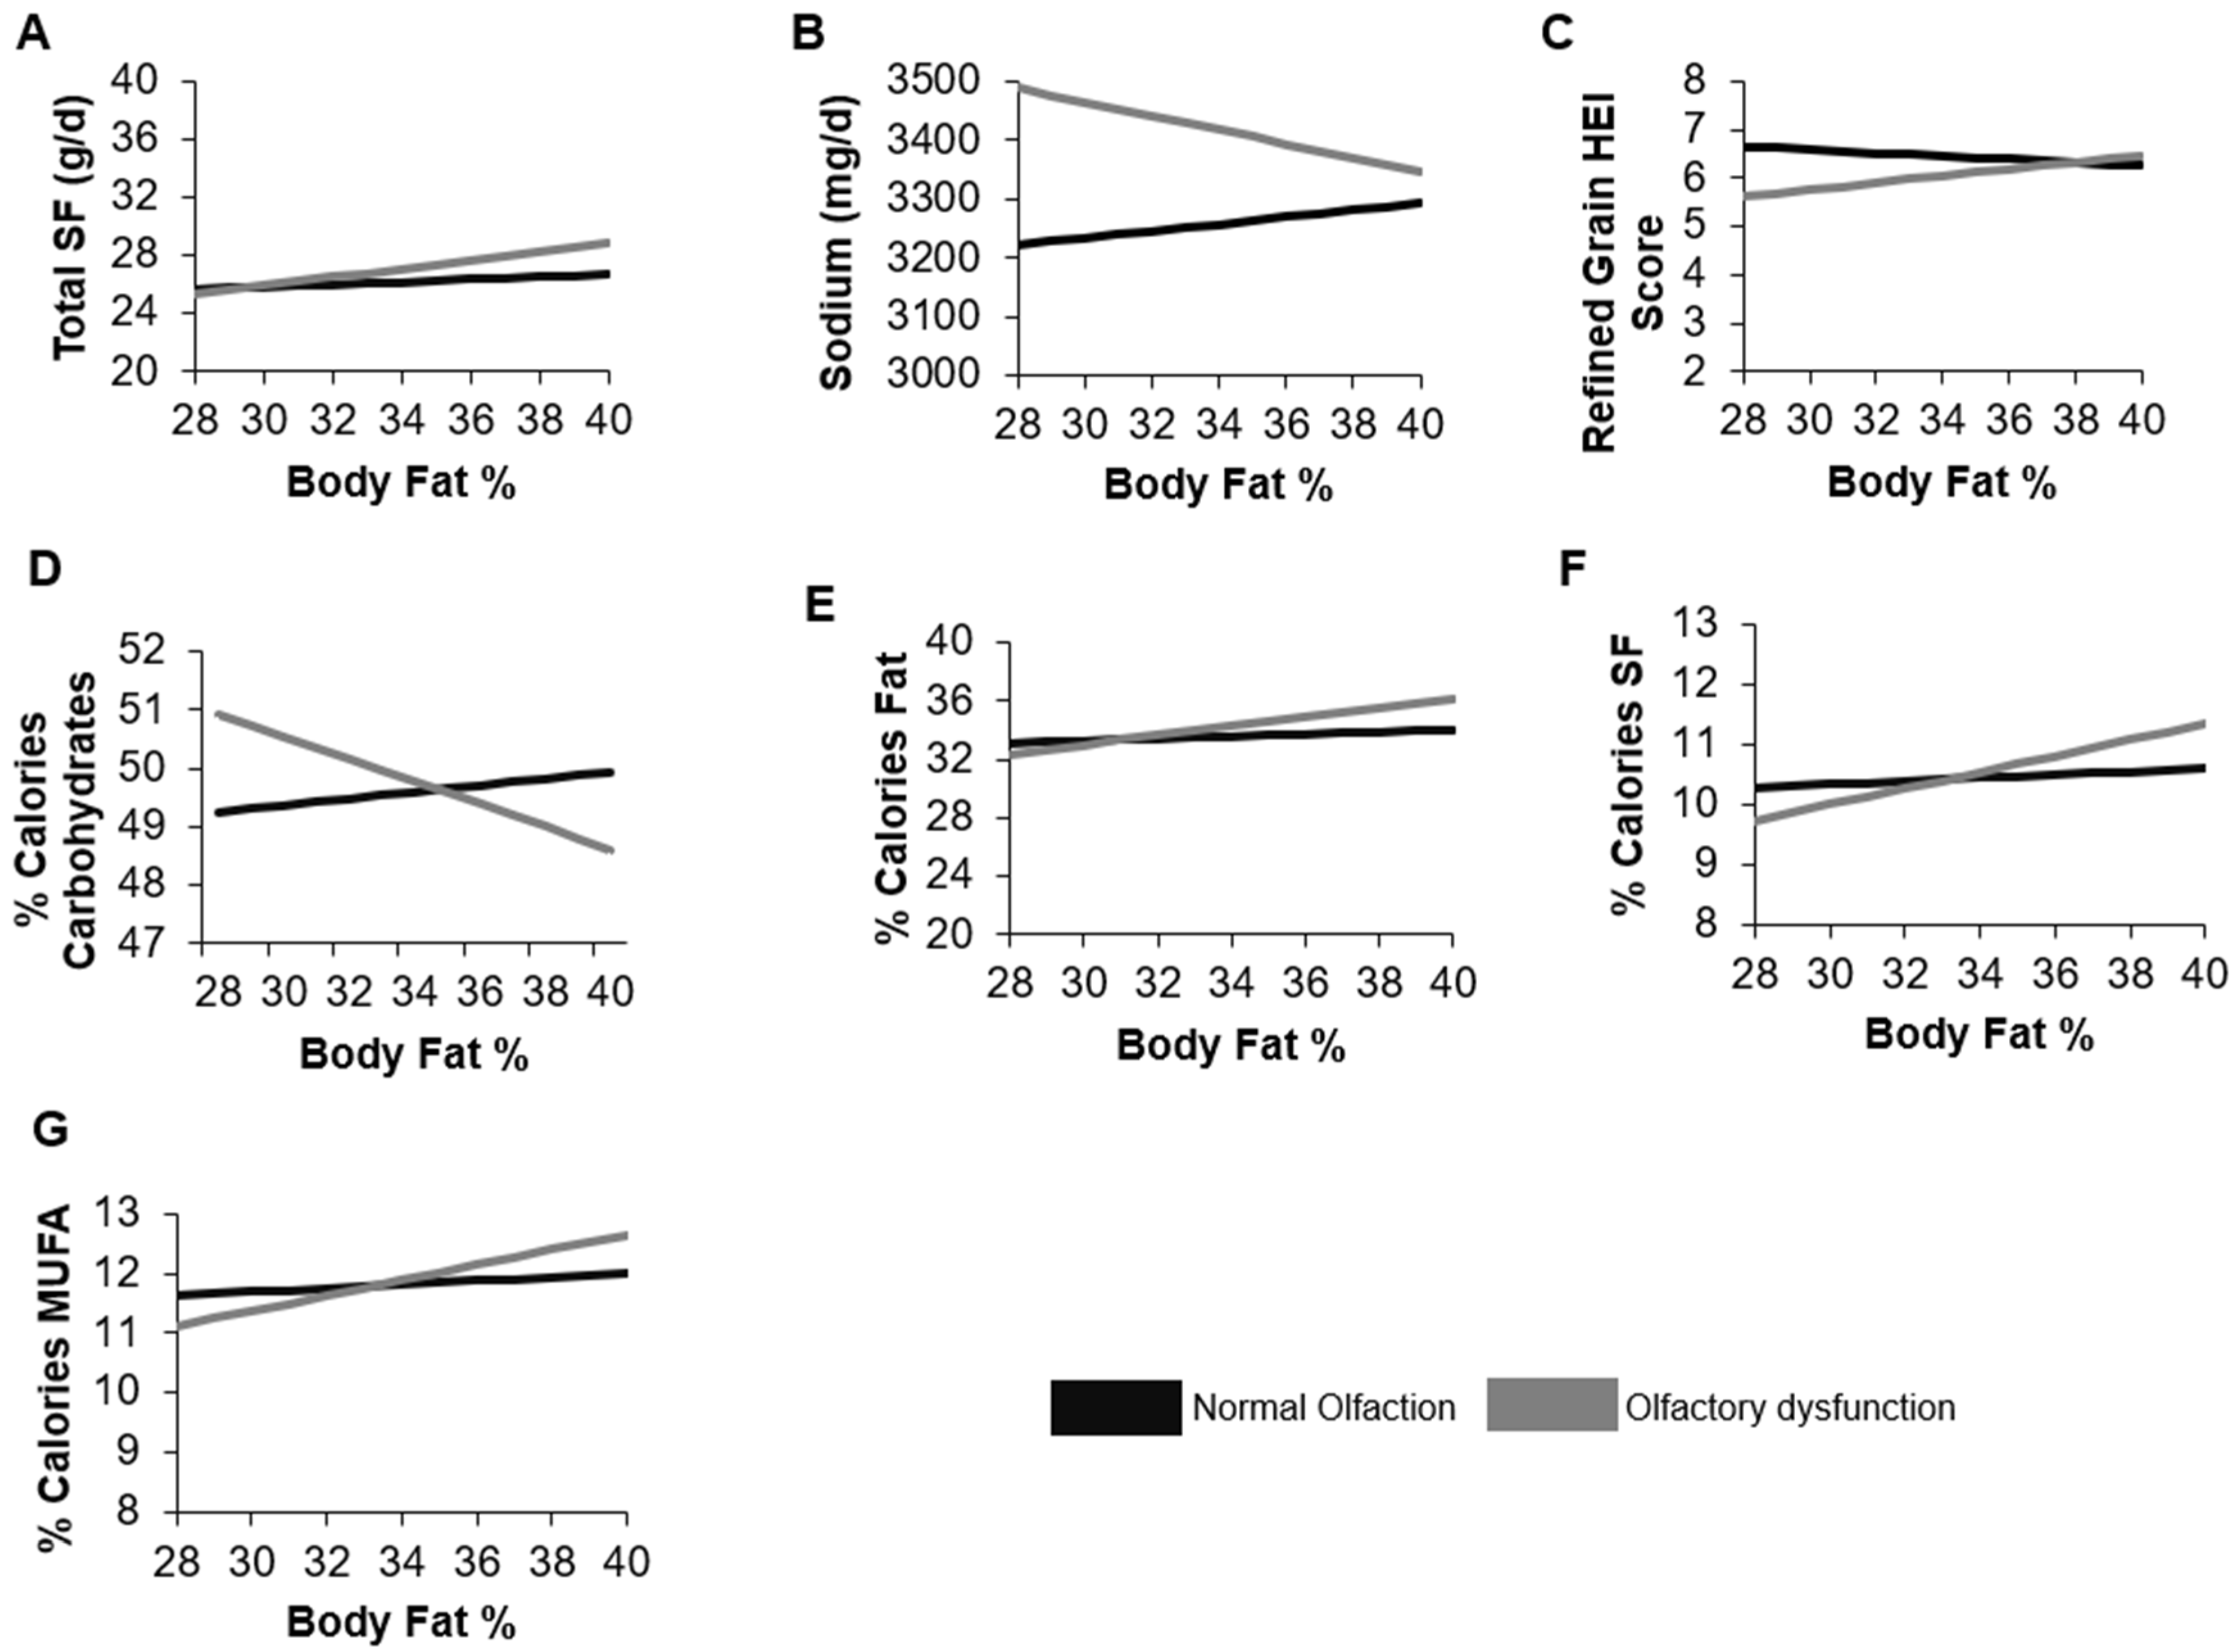
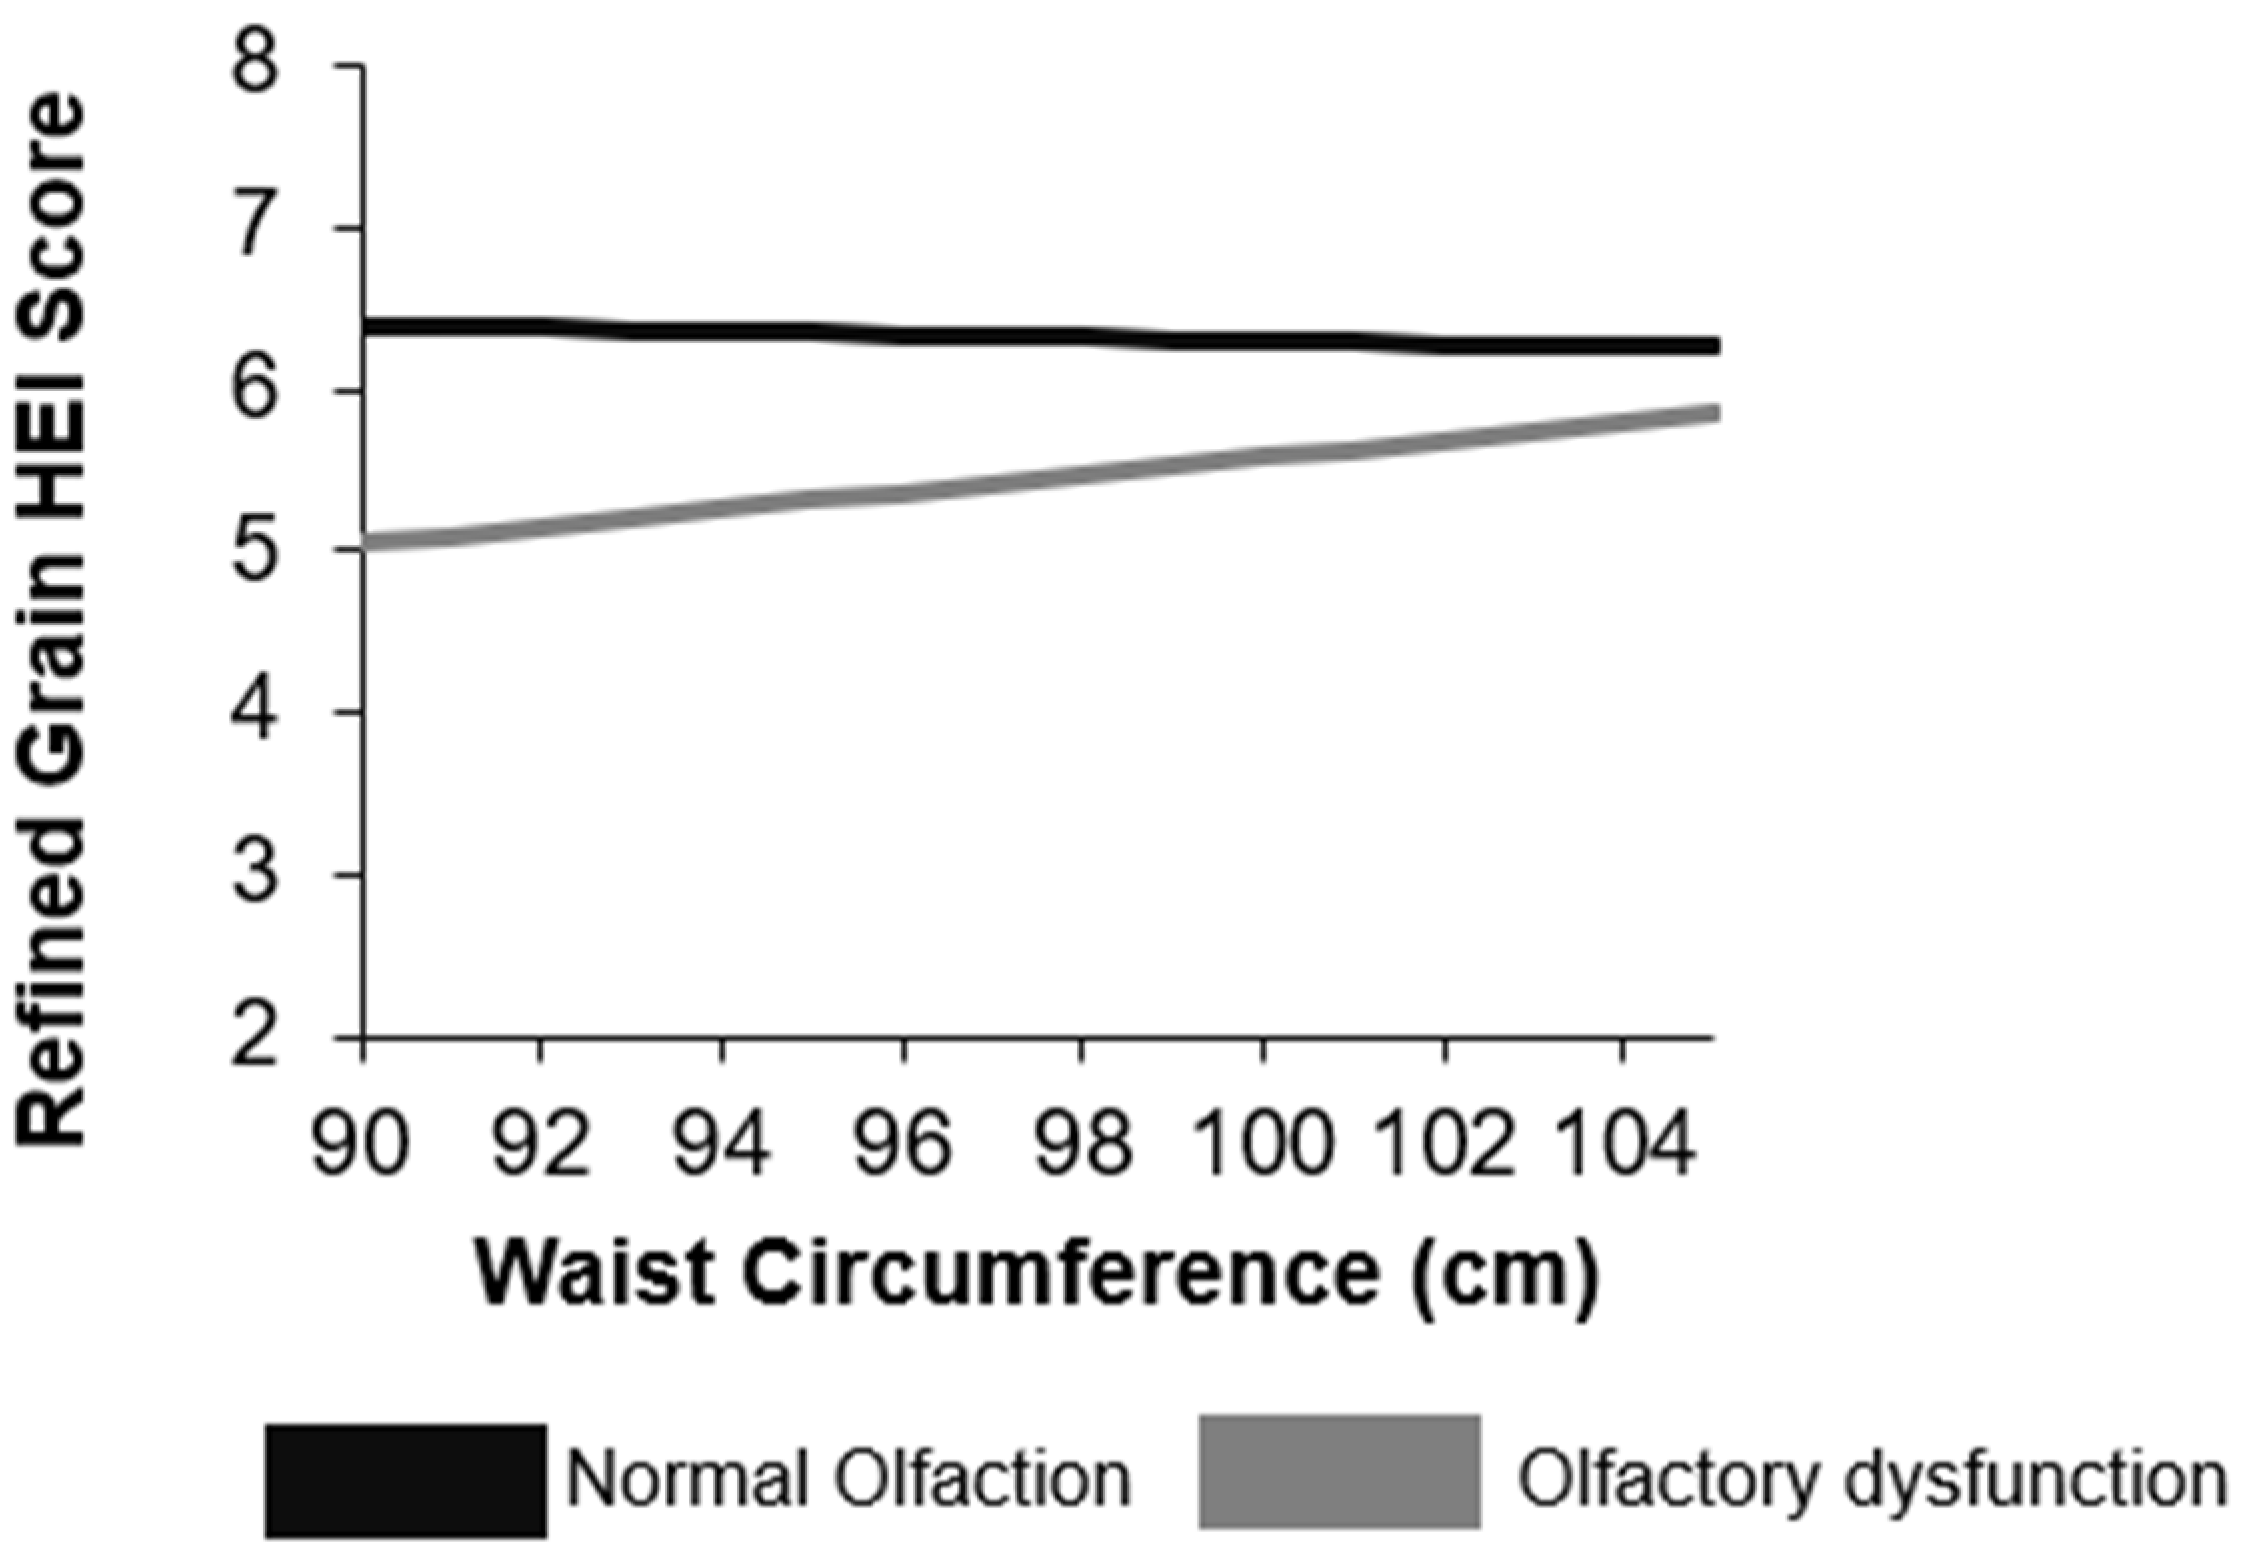
3.3. Moderating Effect of Body Fat or Waist Circumference on the Relationship between Olfactory Function and Dietary Intake
4. Discussion
Supplementary Materials
Author Contributions
Funding
Institutional Review Board Statement
Informed Consent Statement
Data Availability Statement
Conflicts of Interest
Abbreviations
| HEI | Healthy Eating Index |
| NHANES | National Health and Nutrition Examination Survey |
| NCHS | National Center for Health Statistics |
| IPR | Family income-to-poverty ratio |
| DXA | Dual-Energy X-ray absorptiometry |
| UPSIT | University of Pennsylvania Smell Identification Test |
| PST™ | Pocket Smell Test |
References
- WHO. Obesity and Overweight; World Health Organization: Geneva, Switzerland, 2021. [Google Scholar]
- Hammond, R.A.; Levine, R. The economic impact of obesity in the United States. Diabetes Metab. Syndr. Obes. 2010, 3, 285–295. [Google Scholar] [CrossRef] [PubMed] [Green Version]
- Hruby, A.; Manson, J.E.; Qi, L.; Malik, V.S.; Rimm, E.B.; Sun, Q.; Willett, W.C.; Hu, F.B. Determinants and Consequences of Obesity. Am. J. Public Health 2016, 106, 1656–1662. [Google Scholar] [CrossRef]
- Kant, A.K. Dietary patterns and health outcomes. J. Am. Diet. Assoc. 2004, 104, 615–635. [Google Scholar] [CrossRef]
- Small, D.M.; Prescott, J. Odor/taste integration and the perception of flavor. Exp. Brain Res. 2005, 166, 345–357. [Google Scholar] [CrossRef]
- Aime, P.; Duchamp-Viret, P.; Chaput, M.A.; Savigner, A.; Mahfouz, M.; Julliard, A.K. Fasting increases and satiation decreases olfactory detection for a neutral odor in rats. Behav. Brain Res. 2007, 179, 258–264. [Google Scholar] [CrossRef]
- Manesse, C.; Ferdenzi, C.; Sabri, M.; Bessy, M.; Rouby, C.; Faure, F.; Bellil, D.; Jomain, S.; Landis, B.N.; Hugentobler, M.; et al. Dysosmia-Associated Changes in Eating Behavior. Chemosens. Percept. 2017, 10, 104–113. [Google Scholar] [CrossRef]
- Merkonidis, C.; Grosse, F.; Ninh, T.; Hummel, C.; Haehner, A.; Hummel, T. Characteristics of chemosensory disorders--results from a survey. Eur. Arch. Oto-Rhino-Laryngol. 2015, 272, 1403–1416. [Google Scholar] [CrossRef] [PubMed]
- Ferris, A.M.; Duffy, V.B. Effect of olfactory deficits on nutritional status. Does age predict persons at risk? Ann. N. Y. Acad. Sci. 1989, 561, 113–123. [Google Scholar] [CrossRef]
- Miwa, T.; Furukawa, M.; Tsukatani, T.; Costanzo, R.M.; DiNardo, L.J.; Reiter, E.R. Impact of olfactory impairment on quality of life and disability. Arch. Otolaryngol. Head Neck Surg. 2001, 127, 497–503. [Google Scholar] [CrossRef] [Green Version]
- Aschenbrenner, K.; Hummel, C.; Teszmer, K.; Krone, F.; Ishimaru, T.; Seo, H.S.; Hummel, T. The influence of olfactory loss on dietary behaviors. Laryngoscope 2008, 118, 135–144. [Google Scholar] [CrossRef]
- Schubert, C.R.; Cruickshanks, K.J.; Fischer, M.E.; Huang, G.H.; Klein, B.E.; Klein, R.; Pankow, J.S.; Nondahl, D.M. Olfactory impairment in an adult population: The Beaver Dam Offspring Study. Chem. Senses 2012, 37, 325–334. [Google Scholar] [CrossRef] [PubMed] [Green Version]
- Zang, Y.; Han, P.; Burghardt, S.; Knaapila, A.; Schriever, V.; Hummel, T. Influence of olfactory dysfunction on the perception of food. Eur. Arch. Oto-Rhino-Laryngol. 2019, 276, 2811–2817. [Google Scholar] [CrossRef]
- Kong, I.G.; Kim, S.Y.; Kim, M.S.; Park, B.; Kim, J.H.; Choi, H.G. Olfactory Dysfunction Is Associated with the Intake of Macronutrients in Korean Adults. PLoS ONE 2016, 11, e0164495. [Google Scholar] [CrossRef] [PubMed] [Green Version]
- Duffy, V.B.; Backstrand, J.R.; Ferris, A.M. Olfactory dysfunction and related nutritional risk in free-living, elderly women. J. Am. Diet. Assoc. 1995, 95, 879–884. [Google Scholar] [CrossRef]
- Stevenson, R.J.; Mahmut, M.K.; Horstmann, A.; Hummel, T. The Aetiology of Olfactory Dysfunction and Its Relationship to Diet Quality. Brain Sci. 2020, 10, 769. [Google Scholar] [CrossRef]
- Rawal, S.; Duffy, V.B.; Berube, L.; Hayes, J.E.; Kant, A.K.; Li, C.M.; Graubard, B.I.; Hoffman, H.J. Self-Reported Olfactory Dysfunction and Diet Quality: Findings from the 2011–2014 National Health and Nutrition Examination Survey (NHANES). Nutrients 2021, 13, 4561. [Google Scholar] [CrossRef] [PubMed]
- Roxbury, C.R.; Bernstein, I.A.; Lin, S.Y.; Rowan, N.R. Association Between Chemosensory Dysfunction and Diet Quality in United States Adults. Am. J. Rhinol. Allergy 2021, 36, 47–56. [Google Scholar] [CrossRef] [PubMed]
- Proserpio, C.; Invitti, C.; Boesveldt, S.; Pasqualinotto, L.; Laureati, M.; Cattaneo, C.; Pagliarini, E. Ambient Odor Exposure Affects Food Intake and Sensory Specific Appetite in Obese Women. Front. Psychol. 2019, 10, 7. [Google Scholar] [CrossRef] [Green Version]
- Han, P.; Roitzsch, C.; Horstmann, A.; Possel, M.; Hummel, T. Increased Brain Reward Responsivity to Food-Related Odors in Obesity. Obesity 2021, 29, 1138–1145. [Google Scholar] [CrossRef]
- Griep, M.I.; Mets, T.F.; Massart, D.L. Effects of flavour amplification of Quorn and yoghurt on food preference and consumption in relation to age, BMI and odour perception. Br. J. Nutr. 2000, 83, 105–113. [Google Scholar] [CrossRef] [Green Version]
- Poessel, M.; Freiherr, J.; Wiencke, K.; Villringer, A.; Horstmann, A. Insulin Resistance Is Associated with Reduced Food Odor Sensitivity across a Wide Range of Body Weights. Nutrients 2020, 12, 2201. [Google Scholar] [CrossRef] [PubMed]
- Doty, R.L.; Shaman, P.; Dann, M. Development of the University of Pennsylvania Smell Identification Test: A standardized microencapsulated test of olfactory function. Physiol. Behav. 1984, 32, 489–502. [Google Scholar] [CrossRef]
- Gallo, S.; Byham-Gray, L.; Duffy, V.B.; Hoffman, H.J.; Hayes, J.E.; Rawal, S. Associations of olfactory dysfunction with anthropometric and cardiometabolic measures: Findings from the 2013–2014 national health and nutrition examination survey (NHANES). Physiol. Behav. 2020, 215, 112702. [Google Scholar] [CrossRef] [PubMed]
- Hoffman, H.J.; Rawal, S.; Li, C.M.; Duffy, V.B. New chemosensory component in the U.S. National Health and Nutrition Examination Survey (NHANES): First-year results for measured olfactory dysfunction. Rev. Endocr. Metab. Disord. 2016, 17, 221–240. [Google Scholar] [CrossRef] [Green Version]
- Guenther, P.M.; Casavale, K.O.; Reedy, J.; Kirkpatrick, S.I.; Hiza, H.A.; Kuczynski, K.J.; Kahle, L.L.; Krebs-Smith, S.M. Update of the Healthy Eating Index: HEI-2010. J. Acad. Nutr. Diet. 2013, 113, 569–580. [Google Scholar] [CrossRef] [Green Version]
- Schoeller, D.A.; Tylavsky, F.A.; Baer, D.J.; Chumlea, W.C.; Earthman, C.P.; Fuerst, T.; Harris, T.B.; Heymsfield, S.B.; Horlick, M.; Lohman, T.G.; et al. QDR 4500A dual-energy X-ray absorptiometer underestimates fat mass in comparison with criterion methods in adults. Am. J. Clin. Nutr. 2005, 81, 1018–1025. [Google Scholar] [CrossRef] [Green Version]
- Selvin, S. Statistical Analysis of Epidemiologic Data, 3rd ed.; Oxford University Press: Oxford, UK, 2004. [Google Scholar]
- McClelland, G.H.; Judd, C.M. Statistical difficulties of detecting interactions and moderator effects. Psychol. Bull. 1993, 114, 376–390. [Google Scholar] [CrossRef]
- Shepherd, G.M. Smell images and the flavour system in the human brain. Nature 2006, 444, 316–321. [Google Scholar] [CrossRef]
- Poessel, M.; Breuer, N.; Joshi, A.; Pampel, A.; Villringer, A.; Hummel, T.; Horstmann, A. Reduced Olfactory Bulb Volume in Obesity and Its Relation to Metabolic Health Status. Front. Hum. Neurosci. 2020, 14, 586998. [Google Scholar] [CrossRef]
- Negoias, S.; Croy, I.; Gerber, J.; Puschmann, S.; Petrowski, K.; Joraschky, P.; Hummel, T. Reduced olfactory bulb volume and olfactory sensitivity in patients with acute major depression. Neuroscience 2010, 169, 415–421. [Google Scholar] [CrossRef]
- Thomann, P.A.; Dos Santos, V.; Toro, P.; Schonknecht, P.; Essig, M.; Schroder, J. Reduced olfactory bulb and tract volume in early Alzheimer’s disease—A MRI study. Neurobiol. Aging 2009, 30, 838–841. [Google Scholar] [CrossRef]
- de Heredia, F.P.; Gomez-Martinez, S.; Marcos, A. Obesity, inflammation and the immune system. Proc. Nutr. Soc. 2012, 71, 332–338. [Google Scholar] [CrossRef] [PubMed] [Green Version]
- Henkin, R.I.; Schmidt, L.; Velicu, I. Interleukin 6 in hyposmia. JAMA Otolaryngol. Head Neck Surg. 2013, 139, 728–734. [Google Scholar] [CrossRef] [Green Version]
- Riera, C.E.; Tsaousidou, E.; Halloran, J.; Follett, P.; Hahn, O.; Pereira, M.M.A.; Ruud, L.E.; Alber, J.; Tharp, K.; Anderson, C.M.; et al. The Sense of Smell Impacts Metabolic Health and Obesity. Cell Metab. 2017, 26, 198–211.e195. [Google Scholar] [CrossRef] [PubMed] [Green Version]
- Scourboutakos, M.J.; Semnani-Azad, Z.; L’Abbe, M.R. Restaurant meals: Almost a full day’s worth of calories, fats, and sodium. JAMA Intern. Med. 2013, 173, 1373–1374. [Google Scholar] [CrossRef] [PubMed] [Green Version]
- Henkin, R.I. Effects of smell loss (hyposmia) on salt usage. Nutrition 2014, 30, 690–695. [Google Scholar] [CrossRef] [PubMed]
- Umabiki, M.; Tsuzaki, K.; Kotani, K.; Nagai, N.; Sano, Y.; Matsuoka, Y.; Kitaoka, K.; Okami, Y.; Sakane, N.; Higashi, A. The improvement of sweet taste sensitivity with decrease in serum leptin levels during weight loss in obese females. Tohoku J. Exp. Med. 2010, 220, 267–271. [Google Scholar] [CrossRef] [PubMed] [Green Version]
- Mansoor, N.; Vinknes, K.J.; Veierod, M.B.; Retterstol, K. Effects of low-carbohydrate diets v. low-fat diets on body weight and cardiovascular risk factors: A meta-analysis of randomised controlled trials. Br. J. Nutr. 2016, 115, 466–479. [Google Scholar] [CrossRef]
- Fluitman, K.S.; Hesp, A.C.; Kaihatu, R.F.; Nieuwdorp, M.; Keijser, B.J.F.; Ijzerman, R.G.; Visser, M. Poor Taste and Smell Are Associated with Poor Appetite, Macronutrient Intake, and Dietary Quality but Not with Undernutrition in Older Adults. J. Nutr. 2021, 151, 605–614. [Google Scholar] [CrossRef]
- Gopinath, B.; Sue, C.M.; Flood, V.M.; Burlutsky, G.; Mitchell, P. Dietary intakes of fats, fish and nuts and olfactory impairment in older adults. Br. J. Nutr. 2015, 114, 240–247. [Google Scholar] [CrossRef] [Green Version]
- Gopinath, B.; Russell, J.; Sue, C.M.; Flood, V.M.; Burlutsky, G.; Mitchell, P. Olfactory impairment in older adults is associated with poorer diet quality over 5 years. Eur. J. Nutr. 2016, 55, 1081–1087. [Google Scholar] [CrossRef]
- Desiato, V.M.; Levy, D.A.; Byun, Y.J.; Nguyen, S.A.; Soler, Z.M.; Schlosser, R.J. The Prevalence of Olfactory Dysfunction in the General Population: A Systematic Review and Meta-analysis. Am. J. Rhinol. Allergy 2021, 35, 195–205. [Google Scholar] [CrossRef] [PubMed]
- Boesveldt, S.; Lindau, S.T.; McClintock, M.K.; Hummel, T.; Lundstrom, J.N. Gustatory and olfactory dysfunction in older adults: A national probability study. Rhinology 2011, 49, 324–330. [Google Scholar] [CrossRef]
- Ferdenzi, C.; Roberts, S.C.; Schirmer, A.; Delplanque, S.; Cekic, S.; Porcherot, C.; Cayeux, I.; Sander, D.; Grandjean, D. Variability of affective responses to odors: Culture, gender, and olfactory knowledge. Chem. Senses 2013, 38, 175–186. [Google Scholar] [CrossRef] [PubMed]
- Keller, A.; Hempstead, M.; Gomez, I.A.; Gilbert, A.N.; Vosshall, L.B. An olfactory demography of a diverse metropolitan population. BMC Neurosci. 2012, 13, 122. [Google Scholar] [CrossRef] [Green Version]
- Horner, N.K.; Patterson, R.E.; Neuhouser, M.L.; Lampe, J.W.; Beresford, S.A.; Prentice, R.L. Participant characteristics associated with errors in self-reported energy intake from the Women’s Health Initiative food-frequency questionnaire. Am. J. Clin. Nutr. 2002, 76, 766–773. [Google Scholar] [CrossRef] [Green Version]
- Ravelli, M.N.; Schoeller, D.A. Traditional Self-Reported Dietary Instruments Are Prone to Inaccuracies and New Approaches Are Needed. Front. Nutr. 2020, 7, 90. [Google Scholar] [CrossRef] [PubMed]
- Fernandez-Garcia, J.C.; Alcaide, J.; Santiago-Fernandez, C.; Roca-Rodriguez, M.M.; Aguera, Z.; Banos, R.; Botella, C.; de la Torre, R.; Fernandez-Real, J.M.; Fruhbeck, G.; et al. An increase in visceral fat is associated with a decrease in the taste and olfactory capacity. PLoS ONE 2017, 12, e0171204. [Google Scholar] [CrossRef] [Green Version]
- Shanahan, L.K.; Bhutani, S.; Kahnt, T. Olfactory perceptual decision-making is biased by motivational state. PLoS Biol. 2021, 19, e3001374. [Google Scholar] [CrossRef] [PubMed]


| Objective Olfactory Function 1 | Normal Olfaction (6–8 Odors Correct) | Olfactory Dysfunction (<6 Odors Correct) | p-Value |
|---|---|---|---|
| Characteristic | n = 1280 | n = 135 | |
| Age, years | 49.3 (48.8, 49.9) | 50.9 (49.6, 52.2) | 0.01 |
| Female | 50.7 (46.8, 54.6) | 37.3 (30.5, 44.2) | <0.0001 |
| Educational attainment | <0.0001 | ||
| Less than high school | 13.5 (8.8, 18.3) | 31.2 (21.2, 41.3) | |
| High school diploma | 22.4 (17.4, 27.4) | 16.6 (9.0, 24.3) | |
| Some college | 30.4 (24.9, 36.0) | 21.9 (16.2, 27.6) | |
| College graduate or more | 33.6 (27.6, 39.6) | 30.2 (18.5, 41.8) | |
| Marital status | 0.04 | ||
| Married/Partner | 70.5 (66.2, 74.8) | 74.0 (61.5, 86.5) | |
| Divorced/Widowed/Separated | 23.4 (18.1, 25.1) | 11.0 (3.9, 18.1) | |
| Never married | 7.9 (5.6, 10.1) | 15.0 (6.4, 23.7) | |
| Income-to-poverty ratio (IPR) 2 | 0.06 | ||
| IPR ≤ 1.1 | 13.8 (7.3, 20.3) | 21.6 (11.2, 31.9) | |
| 1.1 < IPR ≥ 2.2 | 17.1 (13.7, 20.5) | 18.8 (8.7, 29.0) | |
| 2.2 < IPR ≥ 4.3 | 23.8 (18.9, 28.8) | 28.5 (17.9, 39.1) | |
| IPR > 4.3 | 39.4 (31.2, 47.5) | 20.3 (4.5, 36.2) | |
| Missing | 5.9 (3.1, 8.7) | 10.8 (1.6, 20.0) | |
| Employment status | 0.51 | ||
| Employed | 75.4 (67.2, 83.5) | 68.6 (53.3, 83.9) | |
| Retired | 1.7 (0.7, 2.7) | 2.0 (0, 4.8) | |
| Disabled/unable to work | 10.8 (5.4, 16.2) | 16.7 (8.7, 24.7) | |
| Other | 12.1 (9.3, 14.9) | 12.8 (2.9, 22.6) | |
| Race/Ethnicity | 0.03 | ||
| Mexican American | 8.2 (4.4, 12.0) | 10.1 (1.7, 18.5) | |
| Non-Hispanic White | 66.8 (58.4, 75.1) | 53.0 (39.7, 66.3) | |
| Non-Hispanic Black | 10.8 (7.5, 14.0) | 17.4 (9.5, 25.3) | |
| Non-Hispanic Asian | 5.5 (3.3, 7.7) | 10.4 (3.3, 17.5) | |
| Other | 8.8 (5.2, 12.4) | 9.1 (2.5, 15.7) | |
| Smoking | 0.61 | ||
| Never | 56.7 (50.4, 63.1) | 54.6 (47.1, 62.2) | |
| Current | 21.8 (16.6, 27.0) | 26.6 (16.0, 37.2) | |
| Past | 21.4 (18.9, 24.0) | 18.8 (7.8, 29.7) | |
| Alcohol intake | 0.02 | ||
| Never | 80.3 (76.8, 83.7) | 69.0 (58.2, 79.8) | |
| Current | 8.0 (5.8, 10.2) | 9.8 (3.9, 15.6) | |
| Past | 8.2 (5.0, 11.6) | 13.2 (636, 20.2) | |
| Missing | 3.4 (2.2, 4.7) | 8.0 (1.9, 14.1) | |
| Had problems with smell in past 12 months | 6.6 (4.2, 9.0) | 18.2 (7.5, 28.9) | 0.002 |
| Had change in ability to smell since age 25 years | 7.6 (4.9, 10.4) | 5.6 (2.0, 9.1) | 0.41 |
| Have phantom odors | 8.1 (5.5, 10.7) | 8.7 (0, 17.6) | 0.87 |
| Frequent nasal congestion in past 12 months | 30.1 (26.3, 34.0) | 33.2 (22.8, 43.6) | 0.53 |
| Ever had tonsils removed | 24.9 (20.6, 29.3) | 20.1 (6.1, 34.0) | 0.46 |
| Had persistent dry mouth in past 12 months | 10.1 (7.7, 12.5) | 11.9 (4.6, 19.2) | 0.61 |
| Injury to nose, face, head, or skull, or loss of consciousness | 25.8 (18.9, 32.6) | 23.1 (13.7, 32.6) | 0.57 |
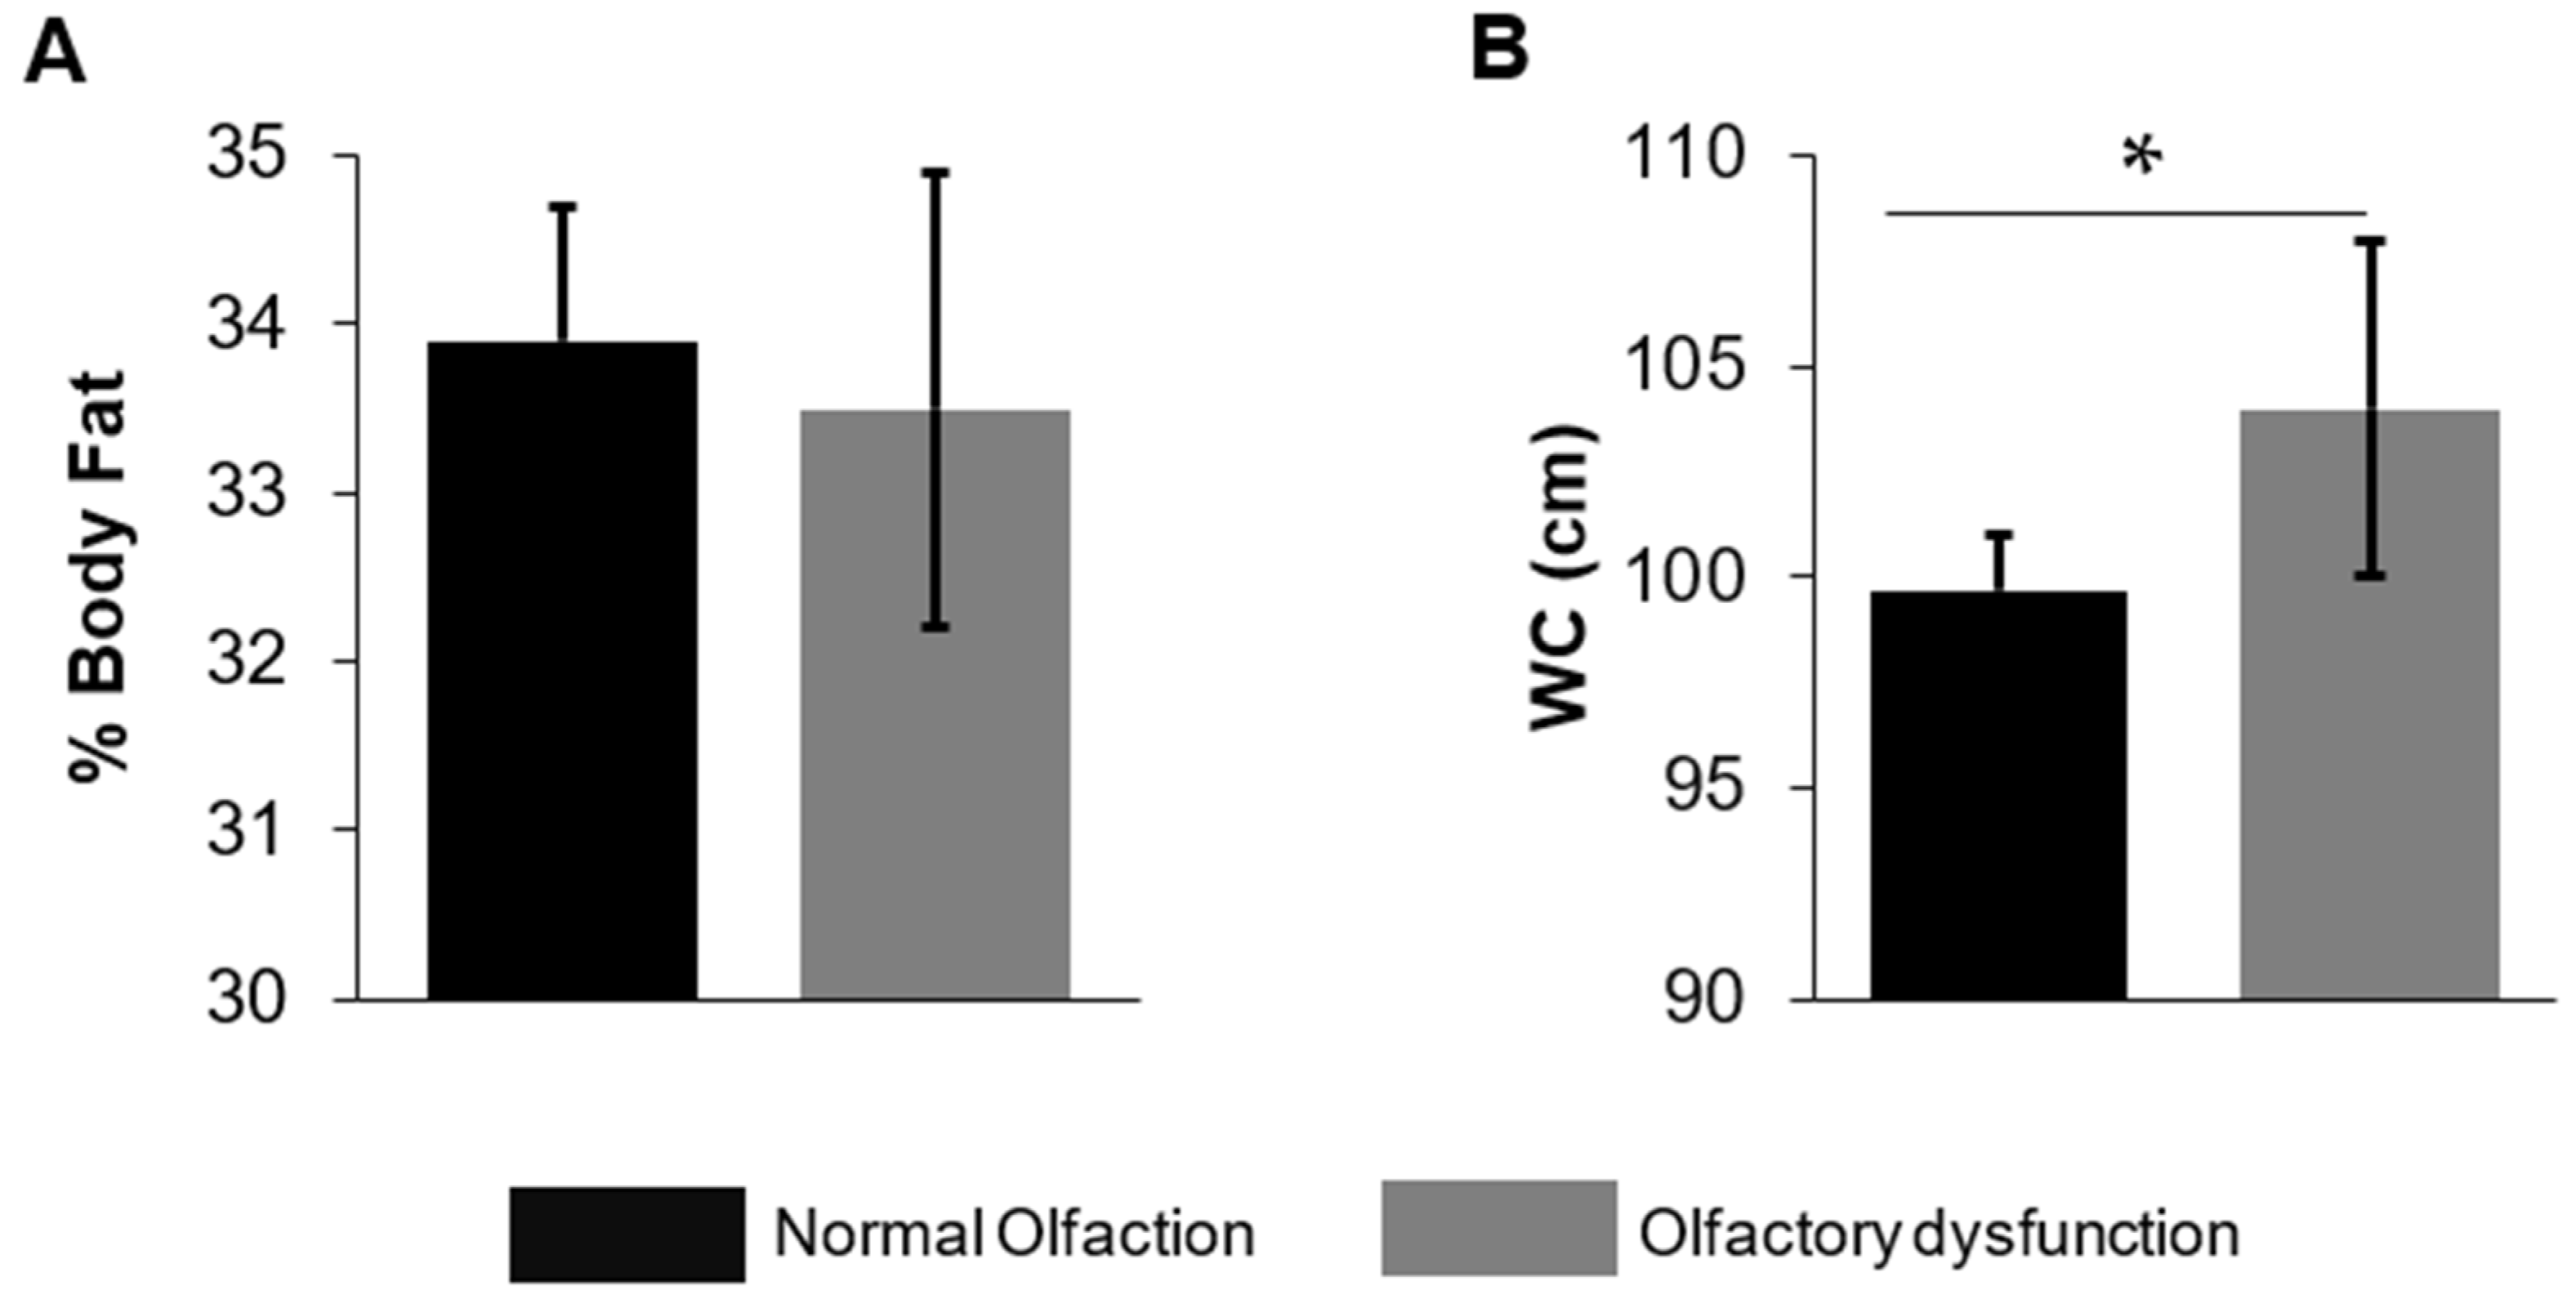
| Waist circumference, cm | 99.7 (98.3, 101) | 104 (100, 108) | 0.03 |
| Body fat percent, % | 33.9 (33.1, 34.7) | 33.5 (32.1, 34.8) | 0.53 |
| Objective Olfactory Function 1 | Normal Olfaction (6–8 Odors Correct) | Olfactory Dysfunction (<6 Odors Correct) | p-Value |
|---|---|---|---|
| Nutrient or Dietary Quality | n = 1280 | n = 135 | |
| Total energy intake, kcal | 2167 (2099, 2235) | 2184 (1908, 2462) | 0.89 |
| Total fat (g/d) | 83.6 (80.7, 86.5) | 87.1 (67.4, 107) | 0.70 |
| Saturated fat | 27.0 (26.0, 28.0) | 27.4 (22.5, 32.4) | 0.84 |
| Monounsaturated fat | 29.3 (28.3, 30.3) | 30.0 (22.6, 37.4) | 0.83 |
| Polyunsaturated fat | 19.3 (18.3, 20.4) | 21.8 (14.9, 28.6) | 0.46 |
| Percent of total calories from fat | 34.2 (33.6, 34.8) | 34.4 (31.5, 37.4) | 0.85 |
| Percent of total calories from saturated fat | 10.9 (10.7, 11.2) | 10.9 (10.2, 11.6) | 0.95 |
| Percent of total calories from monounsaturated fat | 12.0 (11.7, 12.2) | 11.9 (10.5, 13.2) | 0.91 |
| Percent of total calories from polyunsaturated fat | 8.0 (7.7, 8.3) | 8.3 (7.0, 9.6) | 0.71 |
| Protein (g/d) | 85.2 (82.7, 87.7) | 84.3 (74.4, 94.2) | 0.86 |
| Percent of total calories from protein | 16.1 (15.4, 16.7) | 16.7 (14.9, 18.4) | 0.47 |
| Total carbohydrates (g/d) | 254 (245, 264) | 262 (231, 293) | 0.63 |
| Percent of total calories from carbohydrates | 47.5 (46.5, 48.4) | 48.4 (46.2, 50.6) | 0.43 |
| Dietary fiber (g/d) | 17.3 (16.5, 18.1) | 18.0 (14.3, 21.7) | 0.68 |
| Sodium (mg/d) | 3585 (3484, 3687) | 3763 (3349, 4177) | 0.40 |
| Total HEI score 1 | 51.5 (49.5, 53.5) | 49.0 (43.0, 55.1) | 0.39 |
| Total fruit score | 1.9 (1.7, 2.2) | 1.8 (1.4, 2.2) | 0.55 |
| Whole fruit score | 2.1 (1.8, 2.4) | 1.8 (1.1, 2.4) | 0.36 |
| Total vegetable score | 3.1 (2.9, 3.3) | 2.9 (2.5, 3.2) | 0.11 |
| Greens and beans score | 1.3 (1.1, 1.6) | 1.4 (0.9, 1.8) | 0.94 |
| Whole grain score | 2.8 (2.5, 3.0) | 2.0 (0.8, 3.2) | 0.26 |
| Dairy score | 4.8 (4.6, 5.1) | 5.3 (4.2, 6.3) | 0.41 |
| Total protein score | 4.3 (4.2, 4.3) | 4.2 (3.9, 4.6) | 0.93 |
| Seafood and plant protein score | 2.2 (1.9, 2.5) | 1.8 (1.3, 2.3) | 0.18 |
| Fatty acid score | 5.2 (5.0, 5.5) | 5.1 (4.1, 6.0) | 0.71 |
| Refined grain score | 6.2 (6.0, 6.5) | 5.6 (4.5, 6.6) | 0.16 |
| Sodium score | 4.4 (4.1, 4.7) | 3.8 (2.9, 4.7) | 0.20 |
| Empty calorie score 2 | 13.2 (12.5, 14.0) | 13.5 (12.2, 14.7) | 0.73 |
Publisher’s Note: MDPI stays neutral with regard to jurisdictional claims in published maps and institutional affiliations. |
© 2022 by the authors. Licensee MDPI, Basel, Switzerland. This article is an open access article distributed under the terms and conditions of the Creative Commons Attribution (CC BY) license (https://creativecommons.org/licenses/by/4.0/).
Share and Cite
Bhutani, S.; McClain, A.C. Body Fat Moderates the Association of Olfactory Dysfunction with Dietary Intake in U.S. Middle-Aged and Older Adults: A Cross-Sectional Analysis of NHANES 2013–2014. Nutrients 2022, 14, 3178. https://doi.org/10.3390/nu14153178
Bhutani S, McClain AC. Body Fat Moderates the Association of Olfactory Dysfunction with Dietary Intake in U.S. Middle-Aged and Older Adults: A Cross-Sectional Analysis of NHANES 2013–2014. Nutrients. 2022; 14(15):3178. https://doi.org/10.3390/nu14153178
Chicago/Turabian StyleBhutani, Surabhi, and Amanda C. McClain. 2022. "Body Fat Moderates the Association of Olfactory Dysfunction with Dietary Intake in U.S. Middle-Aged and Older Adults: A Cross-Sectional Analysis of NHANES 2013–2014" Nutrients 14, no. 15: 3178. https://doi.org/10.3390/nu14153178