Article

Association of Dietary Fiber Intake with All-Cause Mortality and Cardiovascular Disease Mortality: A 10-Year Prospective Cohort Study

1
Department of Family Medicine, Yongin Severance Hospital, Yonsei University College of Medicine, Seoul 16995, Korea
2
Biostatistics Collaboration Unit, Department of Research Affairs, Yonsei University College of Medicine, Seoul 03277, Korea
3
Biomedical Statistics Center, Research Institute for Future Medicine, Samsung Medical Center, Seoul 06351, Korea
4
Department of Food and Nutrition, Dongduck Women’s University, Seoul 02748, Korea
5
Department of Family Medicine, Severance Hospital, Yonsei University College of Medicine, Seoul 03722, Korea
*
Author to whom correspondence should be addressed.
These authors contributed equally to this work.
Nutrients 2022, 14(15), 3089; https://doi.org/10.3390/nu14153089
Submission received: 2 July 2022 / Revised: 23 July 2022 / Accepted: 25 July 2022 / Published: 27 July 2022
(This article belongs to the Special Issue Nutrition in Chronic Conditions)

Abstract

:
Although previous studies have established that dietary fiber (DF) intake reduces the total cardiovascular disease (CVD) mortality in general populations, limited studies have been conducted in individuals with pre-existing chronic conditions, especially in Asian countries. We aimed to investigate the association of DF intake with all-cause and CVD mortality in the general population and in the subpopulation with hypertension, diabetes, and dyslipidemia. We examined the relationship between DF intake and all-cause and CVD mortality using the Korean genome and epidemiology study. Diet was assessed using a food-frequency questionnaire at baseline. Cox proportional hazard models were used to estimate the hazard ratio (HR) and 95% confidence intervals (CIs) after adjusting for confounders. During the mean 10.1 years of follow-up, higher DF intake was significantly associated with a lower risk of all-cause mortality after adjusting for confounders (HR and 95% CIs for Q5 vs. Q1: 0.84 (0.76–0.93); p < 0.001). DF intake was inversely associated with a lower risk of CVD mortality after adjusting for the same confounders (HR and 95% CIs for Q5 vs. Q1: 0.61 (0.47–0.78); p < 0.001). Total DF intake was inversely associated with all-cause and CVD mortality in middle-aged and older adults.

1. Introduction

At the global level, non-communicable diseases (NCDs) contribute to 73.4% of total deaths, whereas cardiovascular disease (CVD) is the leading cause of death and disability [1]. In Korea, CVD mortality and hospitalization have steadily increased over the last decade [2]. In addition, a considerable proportion of adults in Korea have multiple CVD risk factors, such as hypertension, dyslipidemia, and type 2 diabetes. In 2018, approximately 12.1 million adults had hypertension, 4.3 million had diabetes, and 8.7 million had hypercholesterolemia [2].
Since a significant portion of CVD is preventable, the importance of adequate prevention strategies has long been emphasized [3]. Dietary intervention is the first-line approach for preventing CVD, and dietary fiber (DF) has been established as a nutritionally important and health-promoting food component [4]. DF is composed of plant substances that include non-digestible carbohydrates and lignin, which resist digestion by human endogenous enzymes [5]. DF is primarily derived from plant-based foods, such as whole grain, seeds, vegetables, and fruits [6]. Various beneficial effects of fibers on serum low-density lipoprotein (LDL) cholesterol, blood pressure, insulin sensitivity, controlling body weight, and chronic inflammation may exert a protective effect on the cardiovascular system [7,8,9,10]. Indeed, previous studies have established that DF intake reduced the total mortality and CVD mortality in healthy populations [8,11] Accumulating observational studies indicates that DF is inversely associated with risk of hypertension, diabetes, dyslipidemia, peripheral vascular disease, and coronary heart disease [12,13,14].
However, most studies have been conducted in Western countries, and only a limited number of prospective cohort studies on the Asian population have been published [11,15]. Dietary habits and cultures differ by ethnicity, regions, and countries; hence, the main sources of DF could also be different for various countries and subpopulations [11,15,16]. Moreover, few studies have analyzed the effect of DF intake on total and CVD mortality in individuals with pre-existing chronic conditions, which included hypertension, type 2 diabetes, and dyslipidemia [12]. Therefore, we aimed to investigate the association of DF intake with all-cause and CVD mortality in middle-aged and older Korean adults. Further, we analyzed the effect of DF intake on all-cause and CVD mortality in the subpopulation with hypertension, diabetes, and dyslipidemia.

2. Materials and Methods

2.1. Study Population

We analyzed baseline survey data from the Korean genome and epidemiology study (KoGES),_Ansan–Ansung study (2001–2002), KoGES_health examinee study (2004–2013), and the KoGES_cardiovascular disease association study (2005–2011), which were large-scale, longitudinal, and prospective cohort studies that investigated the risk factors for NCDs [17]. This study included 211,571 adults aged 40 years and older, who had lived in urban and rural areas for ≥6 months. The survey began in the year 2001 and is presently ongoing.
Figure 1 shows the participant selection process. From the 211,571 participants included in the baseline survey, participants were excluded for further study based on the following criteria: (1) lack of data on age and other lifestyle factors (n = 2231); (2) missing data on laboratory tests (n = 5853); (3) missing dietary information and total calorie intake, <500 kcal/day or >6000 kcal/day (n = 14,007); (3) missing data regarding death information (n = 54,530); and (4) death during the enrolled year (n = 63). Finally, we included a total of 143,050 participants. All participants provided written informed consent. The study protocol conformed to the ethical guidelines of the 1975 Declaration of Helsinki. This study was approved by the IRB of Yongin Severance Hospital.

2.2. Dietary Assessment

A food frequency questionnaire (FFQ) was used to assess the dietary intake. The FFQ of the KoGES-Ansan-Ansung baseline study contains 103 food items, while those of the KoGES-HEXA and KoGES_CAVAS contain 106 food items.
The FFQ evaluated how often the participants consumed each food item (never or seldom, once a month, two to three times per month, one to two times per week, three to four times per week, five to six times per week, once a day, twice per day, or thrice per day) and the amount of a particular food that they consumed in each meal (a half serving, one serving, or two or more servings) during the past 1 year. DF intake and other nutrients were calculated using the FFQ. We recorded the DF intake as g/day and divided it into quintiles (Q1 to Q5). The FFQ used in this study was available on the following website: http://www.cdc.go.kr/contents.es?mid=a40504100100 (accessed on 27 December 2021).

2.3. Covariates

Trained medical staff performed all health examination procedures according to the standardized protocols published by KoGES. Measurements for height were obtained to the nearest 0.1 cm, and body mass index (BMI) was calculated using the height and weight. Blood pressure was measured after 5minutes resting in a sitting position. Blood tests were conducted after 8 h fasting. Serum total cholesterol, high-density lipoprotein (HDL), triglyceride, and glucose levels were enzymatically analyzed using a Chemistry Analyzer (Hitachi 7600, Tokyo, Japan from August 2002 and ADVIA 1650, Siemens, Tarrytown, NY from September 2002). A self-questionnaire was used to assess the status of smoking, alcohol drinking and exercise. Smokers were classified as current smokers, former smokers, and non-smokers. People consuming alcohol were classified as current drinkers, former drinkers, and non-drinkers. A person who regularly exercised enough to sweat was defined as a regular exerciser. A person with a systolic blood pressure ≥140 mmHg, diastolic blood pressure ≥90 mmHg, or diagnosis by physician was corresponded to hypertension. A person with fasting plasma glucose level ≥126 mg/dL, glycosylated hemoglobin ≥6.5%, or diagnosis by physician was corresponded to diabetes. A person with total cholesterol level ≥200 mg/dL, triglyceride ≥150 mg/dL, or diagnosis by physician was corresponded to dyslipidemia.

2.4. Study Outcomes

The primary outcome was all-cause mortality. Mortality outcomes were ascertained by the death records provided by Korea National Statistical Office. Participant deaths were tracked from the initial assessment up to 2019. All-cause mortality included all the specified and unknown causes of death. CVD mortality included deaths from International Classification of Diseases-10 codes I00-I99.

2.5. Statistical Analyses
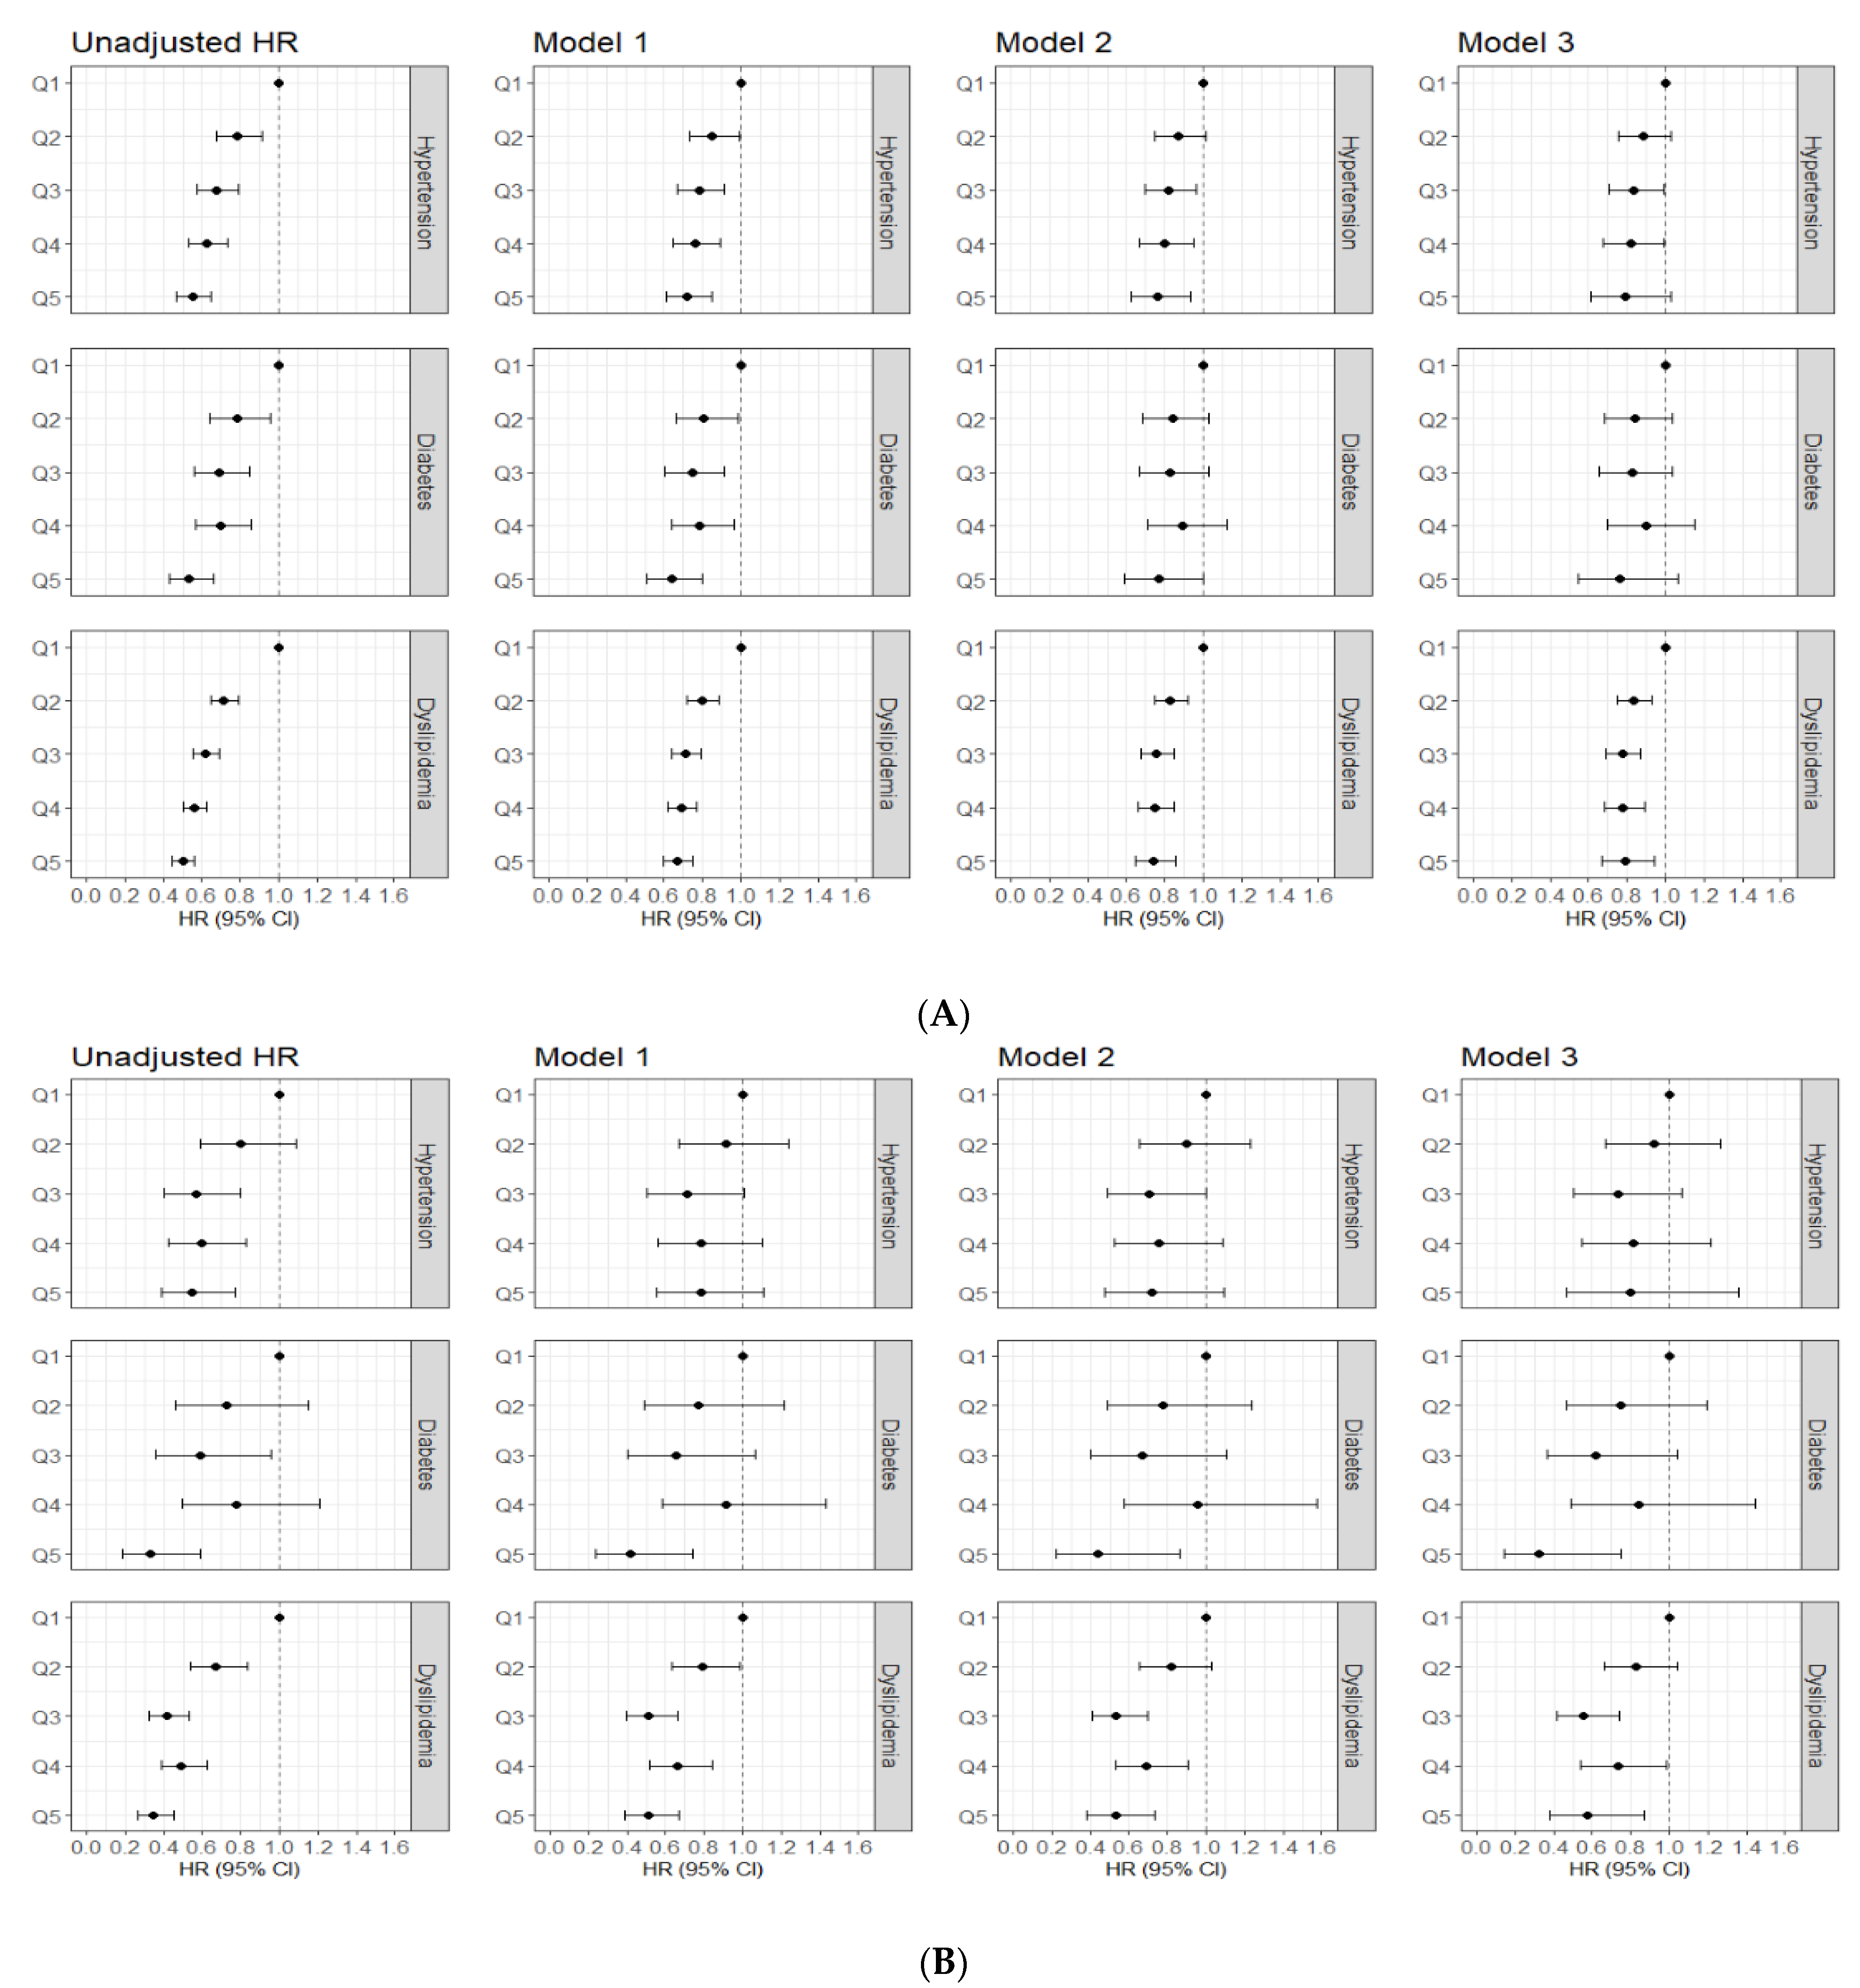
Continuous data are presented as mean ± standard deviation (SD) and categorical data are presented as number (%). Among-group comparisons of continuous and categorical variables were performed using analysis of variance and the chi-square test, respectively. Cox proportional hazard regression model was used to calculate the hazard ratio (HR) and determine the association between DF intake and all-cause mortality and CVD mortality. Kaplan–Meier curves with the log-rank test were used to calculated the cumulative all-cause mortality and CVD mortality, according to the DF intake quintiles. The warranty period was defined as the time taken to reach the cumulative mortality rate of >0.5% for each group. If the 0.5% threshold was not met, the value was expressed as the time of the last follow-up. Incidence per 1000 person-years was calculated for each group. We calculated the HR and 95% confidence interval (CI) for all-cause mortality and CVD mortality, based on the DF intake quintile groups. In model 1, we adjusted for age, sex, body mass index, smoking, alcohol intake, exercise, and total calorie. In model 2, we further adjusted for hypertension, diabetes, and dyslipidemia. We conducted subgroup analysis according to the presence of hypertension, diabetes, and dyslipidemia. SAS statistical software (version 9.4; SAS Institute Inc., Cary, NC, USA) and R (Version 4.0.3; R Foundation for Statistical Computing, Vienna, Austria) were used for statistical analyses. Statistical significance was set at p ≤ 0.05.

3. Results

During the median (min, max) 10.1 years (0.2, 15.9) follow-up period, 5436 cases of all-cause mortality and 985 cases of CVD mortality were noted. Among the total 143,050 participants, the mean age ± SD was 53.9 ± 8.7 years, and the proportion of men was 35.6%.
Table 1 shows the baseline characteristics of study population, according to the DF intake quintiles. Men (p < 0.001), older adults (p < 0.001), and current smokers (p < 0.001) were less likely to have a higher DF intake. Participants with the highest DF intake had lower serum glucose level (p < 0.001) and triglyceride level (p = 0.022). Moreover, participants with the highest DF intake had higher BMI (p < 0.001), waist circumference (p < 0.001), and serum HDL-C level (p = 0.001) and were more likely to regularly exercise (p < 0.001) and live in urban areas (p < 0.001). Regarding nutritional intake, participants with the highest DF intake consumed higher total energy and other nutrients, while they consumed less carbohydrate proportion.
Figure 2 presents the cumulative all-cause mortality and CVD mortality of DF intake quintiles as Kaplan–Meier curves. The lowest DF intake group showed significantly the highest cumulative all-cause mortality, followed by Q2, Q3, Q4, and Q5 (log-rank test, p < 0.001). There was a similar trend in the cumulative CVD mortality event curves among the DF intake quintile groups (log-rank test, p < 0.001).
Table 2 shows the warranty period of all-cause mortality and CVD mortality for all the DF intake quintiles. All-cause mortality was associated with the longest 0.5% warranty period of 3.50 years for participants in the highest DF intake group. CVD mortality was associated with the longest 0.5% warranty period of 11.17 years for those in the highest DF intake group. The observed durations of the warranty period for both all-cause mortality and CVD mortality was the shortest in Q1 of DF intake. The incidence rate for all-cause mortality was lowest for participants with the highest DF intake (2.87 per 1000 person-years; 95% CI, 2.25–3.49). The incidence rate for CVD mortality was also the lowest for participants with the highest DF intake (0.42 per 1000 person-years; 95% CI, 0.18–0.66). The absolute numbers of all-cause mortality were 1511 in Q1, 1126 in Q2, 990 in Q3, 951 in Q4, and 858 in Q5. The number of CVD mortality was the lowest in Q5 (n = 127).
Table 3 shows the multiple Cox proportional hazard regression analysis for all-cause mortality and CVD mortality. The HR (95% CI) for all-cause mortality in Q5 with reference to Q1 was 0.84 (0.76–0.93, p < 0.001) after adjusting for age, sex, BMI, smoking, alcohol intake, exercise, total calories, hypertension, diabetes, and dyslipidemia. The HR (95% CI) for CVD mortality in Q5 with reference to Q1 was 0.61 (0.47–0.78, p < 0.001), after adjusting for the same confounders.
Figure 3 depicts the HR and 95% CI for all-cause mortality and CVD mortality, according to DF intake by participants with hypertension, diabetes, and dyslipidemia. In the baseline survey, there were 24,407 hypertension cases, 10,364 diabetes cases, and 81,219 dyslipidemia cases. During the median follow-up period of 10.3 years, 9.4 years, and 10.2 years, there were 1411 deaths in patients with hypertension, 838 deaths in patients with diabetes, and 3008 deaths in patients with dyslipidemia, respectively. Further, the numbers of CVD deaths were 324 in patients with hypertension, 153 in patients with diabetes, and 591 in patients with dyslipidemia, respectively. The HR (95% CI) for all-cause mortality in Q5 compared with Q1 was 0.55 (0.47–0.65) in patients with hypertension. Similar trends remained after adjusting for confounders. The HR (95% CI) for CVD mortality in Q5 compared with Q1 was 0.55 (0.39–0.77) in patients with hypertension. However, the significant association was attenuated after adjusting for confounders. In patients with diabetes, the HRs (95% CI) for all-cause mortality and CVD mortality in Q5 compared with Q1 were 0.53 (0.43, 0.66) and 0.33 (0.19, 0.59), respectively. However, this significant association between DF intake and total mortality disappeared after adjusting for confounders. Regarding CVD mortality, a significant inverse association between DF intake and CVD mortality was observed after adjusting for confounders. The HRs (95% CIs) for all-cause mortality and CVD mortality were 0.50 (0.49, 0.56) and 0.35 (0.27, 0.45), respectively, in patients with dyslipidemia, and significant association remained after adjusting for confounders. The detailed figures were described in Supplementary Table S1.

4. Discussion

In this study, we found that DF intake was significantly inversely associated with all-cause mortality and with CVD mortality in middle-aged and older Korean adults.
Poor dietary habits are associated with many chronic diseases and can be a major contributor to mortality [18]. In contrast, a healthy diet is one of the most promising factors in primary and secondary prevention of NCD [19]. DF, “the seventh nutrient” of the body, is a component of fruits, vegetables, and whole grains, and is non-replaceable to maintain health [20]. DF has anti-inflammatory [10] and antioxidative properties [21] and has been shown to lower blood pressure [7], reduce serum cholesterol [22] and glucose levels [9], improve endothelial function [23], reduce body weight loss, aid favorable changes of gut microbial composition, and reduce the contact time between carcinogens and intestinal mucosal cells by increasing fecal bulking and viscosity [24]. All of these biochemical effects may be potentially related to a lower risk of chronic diseases and mortality.
Prospective studies have shown an inverse association between DF intake and all-cause and CVD mortality [11,15,25,26,27,28,29,30]. The NIH-AARP Diet and Health Study that had an average 9 years follow-up (567,169 participants aged 50–71 years from six states of the U.S.) found that 10 g/day increment of DF consumption reduced total mortality by 12% and 15% in men and women, respectively [25]. The Zutphen Study reported that 10 g/day of fiber increment reduced all-cause mortality by 9% and CVD mortality by 17% [29]. A meta-analysis from the prospective cohort studies reported that DF intake was inversely associated with the risk of CVD and coronary heart diseases [14]. Recently, the Japan Public Health Center-based prospective study with 92,924 participants found that total mortality was reduced by 23% in men and 18% in women for the highest quintile of total fiber intake [11]. Our data were consistent with the results of the previous studies.
Current recommendations for DF intake for adults in most European countries and in the U.S. are 30–35 g/day for men and 25–32 g/day for women [31]. Similarly, the Korean Nutrition Society suggested that sufficient amount of daily fiber intake for Korean adults is 25 g/day for men and 20 g/day for women regardless of age [32]. However, the global consumption of fiber falls below the recommended levels, regardless of the country [31]. In our study, the amounts of DF intake were far below the recommended daily intake in Korea. Nonetheless, we found that for the highest quintile of total fiber intake, all-cause mortality was reduced by 16% and CVD mortality by 39%. Our data suggested that a relatively small increase in fiber intake may offer a public health benefit in reducing all-cause and CVD mortality.
DF reportedly exerts its influence on CVD mortality by decreasing the risk of hypertension, diabetes, and dyslipidemia in different patterns [7,9]. Epidemiologic studies consistently show that increased fiber intake is significantly associated with reduced hypertension risk. Meta-analyses of intervention trials showed that increased fiber intake is more effective in lowering blood pressure in hypertensive individuals than in normotensive individuals [33]. Therefore, increased fiber intake may adjunctively further lower blood pressure in hypertensive individuals. Further, systematic reviews conducted in 2010–2018 reported that diet high in soluble fiber caused at least moderate (i.e., 0.20–0.40 mmol/L) reductions in LDL cholesterol [34]. The bulking effect, viscosity, fermentation, and increased production of short-chain fatty acids are believed to be responsible for the antihyperlipidemic benefits of DFs [24]. Although the blood glucose-lowering effects of DF are inconsistent, three meta-analyses presented a 15–19% reduction in the incidence of developing type 2 diabetes, when participants with the highest intake of total DF to those with the lowest intake were compared [35,36,37]. A few studies have examined the effect of DF intake on mortality in patients who had hypertension, diabetes, or dyslipidemia and have reported inconsistent results [25,30,38]. Patients with hypertension, diabetes, and dyslipidemia have a 2–3 times higher risk of CVD and premature mortality than the general population [39,40]. We analyzed the effect of DF intake on total and CVD mortality in these patients and found that DF intake lowered the risk of all-cause mortality in patients with hypertension and dyslipidemia, and the risk of CVD mortality in patients with diabetes and dyslipidemia. Our findings suggest that low DF may be considered an important modifiable risk factor for decreasing mortality in patients with hypertension, diabetes, and dyslipidemia. However, the significant association between DF intake in patients with hypertension and CVD mortality, and that between DF intake in patients with diabetes and all-cause mortality were attenuated after adjusting for confounders. Although the exact mechanism is not known, different effects of DF subtypes and sources may explain the results to some extent. Vegetables, cereals, and fruits were three major sources of DF for Koreans who obtained approximately 75% of DF from those sources. Kimchi, a traditional fermented food made by salting and fermenting vegetables, was the first major source of DF for Koreans aged over 12 years [41,42]. A negative impression of kimchi is that as it is high in sodium and could be the cause of high blood pressure and metabolic syndrome [43]. Moreover, the sugar content in fruits is generally higher than in vegetables, leading to concerns about its potentially harmful impacts on patients with diabetes [44]. There are inconsistent results about the effects of fruit consumption on risks of death and major complications among people with established diabetes [45,46,47]. Further studies are needed to identify the association between DF and mortality considering the specific dietary type and sources.
Our study had several limitations. First, the FFQ method used in this study has the potential for recall bias, and DF could be underestimated. However, KoGES data are reliable and widely used. Moreover, it is the only available large dataset that contains both information about nutrition assessed by FFQ and mortality status in Korea. Second, we could not measure the overall diet quality due to restricted data, and there could be potential and unmeasured confounders that were not fully considered. However, the sample size used in this study was sufficiently large to detect significant HRs over 90% power (Q1 vs. Q5). Therefore, our study population was large enough to detect meaningful associations. Third, our study could not differentiate subtypes and sources of DF. Since we obtained an integrated dataset using the three KoGES data and not the original FFQ dataset, we could only use the total DF amount calculated by FFQ. Fourth, since our analysis only included middle-aged and older Korean adults, the current findings cannot be generalized to other countries and ethnic groups. Fifth, we could not consider the information about anti-hypertensive, anti-diabetic, and anti-dyslipidemia medications. Finally, we assessed the baseline DF intake, which was not updated during the follow-up period. Thus, baseline exposures might not reflect changes in DF intake over time.
To the best of our knowledge, this is the first study that investigated the association between DF intake and mortality in Korea using the largest population-based dataset over a long duration of follow-up. Furthermore, we comprehensively analyzed the effect of DF intake on total and CVD mortality in individuals with pre-existing hypertension, type 2 diabetes, and dyslipidemia.

5. Conclusions

In the current study, the total fiber intake was inversely associated with all-cause and CVD mortality. DF intake lowered the risk of all-cause mortality in patients with hypertension and dyslipidemia and the risk of CVD mortality in patients with diabetes and dyslipidemia. In the view of public health policies, adequate fiber consumption with healthy diet habits should be emphasized for reducing mortality and premature NCDs mortality.

Supplementary Materials

The following are available online at https://www.mdpi.com/article/10.3390/nu14153089/s1. Table S1: Multiple Cox proportional hazard regression analysis for all-cause mortality and cardiovascular disease (CVD) mortality of fiber intake quintiles according to the presence of hypertension, diabetes, and dyslipidemia.

Author Contributions

J.-W.L. had full access to all the data in the study and takes responsibility for the integrity of the data and the accuracy of the data analysis; Concept and design: Y.-J.K., H.-S.L. and J.-W.L.; Acquisition, analysis, or interpretation of data: Y.-J.K., H.-S.L., G.P., H.-M.K. and J.-W.L.; Drafting of the manuscript: Y.-J.K., H.-S.L. and J.-W.L.; Critical revision of the manuscript for important intellectual content: Y.-J.K., H.-S.L. and J.-W.L.; Statistical analysis: H.-S.L. and G.P.; Obtained funding: Y.-J.K. and J.-W.L.; Supervision: J.-W.L. All authors have read and agreed to the published version of the manuscript.

Funding

This work was supported by the Korea Institute of Planning and Evaluation for Technology in Food, Agriculture and Forestry (IPET) through the High Value-added Food Technology Development Program funded by the Ministry of Agriculture, Food and Rural Affairs (MAFRA) (321030051HD030) to J.-W.L. and Y.-J.K.

Institutional Review Board Statement

The study protocol conformed to the ethical guidelines of the 1975 Declaration of Helsinki. This study was approved by the IRB of Yongin Severance Hospital (IRB number: 3-2020-0043).

Informed Consent Statement

All participants provided written informed consent.

Data Availability Statement

The data used in this study were available on the following website: http://www.cdc.go.kr/contents.es?mid=a40504100100 (accessed on 27 December 2021).

Acknowledgments

Data used in this study were from the Korean Genome and Epidemiology Study (KoGES; 4851-302), National Research Institute of Health, Centers for Disease Control and Prevention, Ministry for Health and Welfare, Republic of Korea.

Conflicts of Interest

The authors declare no conflict of interest.

References

  1. GBD 2017 Causes of Death Collaborators. Global, regional, and national age-sex-specific mortality for 282 causes of death in 195 countries and territories, 1980–2017: A systematic analysis for the global burden of disease study 2017. Lancet 2018, 392, 1736–1788. [Google Scholar] [CrossRef] [Green Version]
  2. Lee, H.H.; Cho, S.M.J.; Lee, H.; Baek, J.; Bae, J.H.; Chung, W.J.; Kim, H.C. Korea heart disease fact sheet 2020: Analysis of nationwide data. Korean Circ. J. 2021, 51, 495–503. [Google Scholar] [CrossRef] [PubMed]
  3. Mensah, G.A.; Wei, G.S.; Sorlie, P.D.; Fine, L.J.; Rosenberg, Y.; Kaufmann, P.G.; Mussolino, M.E.; Hsu, L.L.; Addou, E.; Engelgau, M.M.; et al. Decline in cardiovascular mortality: Possible causes and implications. Circ. Res. 2017, 120, 366–380. [Google Scholar] [CrossRef] [PubMed]
  4. Cronin, P.; Joyce, S.A.; O’Toole, P.W.; O’Connor, E.M. Dietary fibre modulates the gut microbiota. Nutrients 2021, 13, 1655. [Google Scholar] [CrossRef]
  5. Joye, I.J. Dietary fibre from whole grains and their benefits on metabolic health. Nutrients 2020, 12, 3045. [Google Scholar]
  6. Dahl, W.J.; Stewart, M.L. Position of the academy of nutrition and dietetics: Health implications of dietary fiber. J. Acad. Nutr. Diet. 2015, 115, 1861–1870. [Google Scholar] [CrossRef]
  7. Gibbs, J.; Gaskin, E.; Ji, C.; Miller, M.A.; Cappuccio, F.P. The effect of plant-based dietary patterns on blood pressure: A systematic review and meta-analysis of controlled intervention trials. J. Hypertens 2021, 39, 23–37. [Google Scholar] [CrossRef]
  8. Zeng, X.; Li, X.; Zhang, Z.; Li, H.; Wang, Y.; Zhu, Y.; Hu, A.; Zhao, Q.; Tang, M.; Zhang, X.; et al. A prospective study of carbohydrate intake and risk of all-cause and specific-cause mortality. Eur. J. Nutr. 2022. [Google Scholar] [CrossRef]
  9. Xie, Y.; Gou, L.; Peng, M.; Zheng, J.; Chen, L. Effects of soluble fiber supplementation on glycemic control in adults with type 2 diabetes mellitus: A systematic review and meta-analysis of randomized controlled trials. Clin. Nutr. 2021, 40, 1800–1810. [Google Scholar] [CrossRef]
  10. Milesi, G.; Rangan, A.; Grafenauer, S. Whole grain consumption and inflammatory markers: A systematic literature review of randomized control trials. Nutrients 2022, 14, 374. [Google Scholar] [CrossRef]
  11. Katagiri, R.; Goto, A.; Sawada, N.; Yamaji, T.; Iwasaki, M.; Noda, M.; Iso, H.; Tsugane, S. Dietary fiber intake and total and cause-specific mortality: The japan public health center-based prospective study. Am. J. Clin. Nutr. 2020, 111, 1027–1035. [Google Scholar] [CrossRef]
  12. Reynolds, A.N.; Akerman, A.P.; Mann, J. Dietary fibre and whole grains in diabetes management: Systematic review and meta-analyses. PLoS Med. 2020, 17, e1003053. [Google Scholar] [CrossRef]
  13. Kulezic, A.; Bergwall, S.; Fatemi, S.; Sonestedt, E.; Zarrouk, M.; Gottsäter, A.; Acosta, S. Healthy diet and fiber intake are associated with decreased risk of incident symptomatic peripheral artery disease—A prospective cohort study. Vasc. Med. 2019, 24, 511–518. [Google Scholar] [CrossRef] [PubMed]
  14. Threapleton, D.E.; Greenwood, D.C.; Evans, C.E.; Cleghorn, C.L.; Nykjaer, C.; Woodhead, C.; Cade, J.E.; Gale, C.P.; Burley, V.J. Dietary fibre intake and risk of cardiovascular disease: Systematic review and meta-analysis. BMJ 2013, 347, f6879. [Google Scholar] [CrossRef] [PubMed] [Green Version]
  15. Rebello, S.A.; Koh, H.; Chen, C.; Naidoo, N.; Odegaard, A.O.; Koh, W.P.; Butler, L.M.; Yuan, J.M.; van Dam, R.M. Amount, type, and sources of carbohydrates in relation to ischemic heart disease mortality in a chinese population: A prospective cohort study. Am. J. Clin. Nutr. 2014, 100, 53–64. [Google Scholar] [CrossRef] [Green Version]
  16. McGill, C.R.; Fulgoni, V.L., 3rd; Devareddy, L. Ten-year trends in fiber and whole grain intakes and food sources for the united states population: National health and nutrition examination survey 2001–2010. Nutrients 2015, 7, 1119–1130. [Google Scholar] [CrossRef] [PubMed]
  17. Kim, Y.; Han, B.-G.; the KoGES Group. Cohort profile: The korean genome and epidemiology study (koges) consortium. Int. J. Epidemiol. 2017, 46, e20. [Google Scholar] [CrossRef]
  18. GBD 2017 Diet Collaborators. Health effects of dietary risks in 195 countries, 1990–2017: A systematic analysis for the global burden of disease study 2017. Lancet 2019, 393, 1958–1972. [Google Scholar] [CrossRef] [Green Version]
  19. Hu, E.A.; Steffen, L.M.; Coresh, J.; Appel, L.J.; Rebholz, C.M. Adherence to the healthy eating index-2015 and other dietary patterns may reduce risk of cardiovascular disease, cardiovascular mortality, and all-cause mortality. J. Nutr. 2020, 150, 312–321. [Google Scholar] [CrossRef]
  20. Nie, Y.; Luo, F. Dietary fiber: An opportunity for a global control of hyperlipidemia. Oxid. Med. Cell. Longev. 2021, 2021, 5542342. [Google Scholar] [CrossRef]
  21. Barber, T.M.; Kabisch, S.; Pfeiffer, A.F.H.; Weickert, M.O. The health benefits of dietary fibre. Nutrients 2020, 12, 3209. [Google Scholar] [CrossRef]
  22. Tani, S.; Matsuo, R.; Imatake, K.; Suzuki, Y.; Takahashi, A.; Matsumoto, N. Association of daily fish intake with serum non-high-density lipoprotein cholesterol levels and healthy lifestyle behaviours in apparently healthy males over the age of 50 years in japanese: Implication for the anti-atherosclerotic effect of fish consumption. Nutr. Metab. Cardiovasc. Dis. 2020, 30, 190–200. [Google Scholar]
  23. Yubero-Serrano, E.M.; Fernandez-Gandara, C.; Garcia-Rios, A.; Rangel-Zuñiga, O.A.; Gutierrez-Mariscal, F.M.; Torres-Peña, J.D.; Marin, C.; Lopez-Moreno, J.; Castaño, J.P.; Delgado-Lista, J.; et al. Mediterranean diet and endothelial function in patients with coronary heart disease: An analysis of the cordioprev randomized controlled trial. PLoS Med. 2020, 17, e1003282. [Google Scholar] [CrossRef] [PubMed]
  24. Gill, S.K.; Rossi, M.; Bajka, B.; Whelan, K. Dietary fibre in gastrointestinal health and disease. Nat. Rev. Gastroenterol. Hepatol. 2021, 18, 101–116. [Google Scholar] [CrossRef] [PubMed]
  25. Park, Y.; Subar, A.F.; Hollenbeck, A.; Schatzkin, A. Dietary fiber intake and mortality in the nih-aarp diet and health study. Arch. Intern. Med. 2011, 171, 1061–1068. [Google Scholar] [CrossRef] [Green Version]
  26. Huang, T.; Xu, M.; Lee, A.; Cho, S.; Qi, L. Consumption of whole grains and cereal fiber and total and cause-specific mortality: Prospective analysis of 367,442 individuals. BMC Med. 2015, 13, 59. [Google Scholar]
  27. Kim, Y.; Je, Y. Dietary fiber intake and total mortality: A meta-analysis of prospective cohort studies. Am. J. Epidemiol. 2014, 180, 565–573. [Google Scholar] [CrossRef] [Green Version]
  28. Buil-Cosiales, P.; Zazpe, I.; Toledo, E.; Corella, D.; Salas-Salvadó, J.; Diez-Espino, J.; Ros, E.; Fernandez-Creuet Navajas, J.; Santos-Lozano, J.M.; Arós, F.; et al. Fiber intake and all-cause mortality in the prevención con dieta mediterránea (predimed) study. Am. J. Clin. Nutr. 2014, 100, 1498–1507. [Google Scholar] [CrossRef]
  29. Streppel, M.T.; Ocké, M.C.; Boshuizen, H.C.; Kok, F.J.; Kromhout, D. Dietary fiber intake in relation to coronary heart disease and all-cause mortality over 40 y: The zutphen study. Am. J. Clin. Nutr. 2008, 88, 1119–1125. [Google Scholar] [CrossRef] [Green Version]
  30. Chuang, S.C.; Norat, T.; Murphy, N.; Olsen, A.; Tjønneland, A.; Overvad, K.; Boutron-Ruault, M.C.; Perquier, F.; Dartois, L.; Kaaks, R.; et al. Fiber intake and total and cause-specific mortality in the european prospective investigation into cancer and nutrition cohort. Am. J. Clin. Nutr. 2012, 96, 164–174. [Google Scholar] [CrossRef]
  31. Stephen, A.M.; Champ, M.M.; Cloran, S.J.; Fleith, M.; van Lieshout, L.; Mejborn, H.; Burley, V.J. Dietary fibre in europe: Current state of knowledge on definitions, sources, recommendations, intakes and relationships to health. Nutr Res. Rev. 2017, 30, 149–190. [Google Scholar] [CrossRef] [PubMed]
  32. The Korean Nutrition Society. 2020 Dietary Reference Intakes for Koreans; Ministry of Health and Welfare: Sejong-si, Korea, 2020.
  33. Dreher, M.L. Fiber and hypertension. In Dietary Fiber in Health and Disease; Springer: Berlin/Heidelberg, Germany, 2018; pp. 291–303. [Google Scholar]
  34. Schoeneck, M.; Iggman, D. The effects of foods on ldl cholesterol levels: A systematic review of the accumulated evidence from systematic reviews and meta-analyses of randomized controlled trials. Nutr. Metab. Cardiovasc. Dis. 2021, 31, 1325–1338. [Google Scholar] [CrossRef] [PubMed]
  35. Yao, B.; Fang, H.; Xu, W.; Yan, Y.; Xu, H.; Liu, Y.; Mo, M.; Zhang, H.; Zhao, Y. Dietary fiber intake and risk of type 2 diabetes: A dose-response analysis of prospective studies. Eur. J. Epidemiol. 2014, 29, 79–88. [Google Scholar] [CrossRef]
  36. Ye, E.Q.; Chacko, S.A.; Chou, E.L.; Kugizaki, M.; Liu, S. Greater whole-grain intake is associated with lower risk of type 2 diabetes, cardiovascular disease, and weight gain. J. Nutr. 2012, 142, 1304–1313. [Google Scholar] [CrossRef]
  37. Dietary fibre and incidence of type 2 diabetes in eight european countries: The epic-interact study and a meta-analysis of prospective studies. Diabetologia 2015, 58, 1394–1408. [CrossRef] [PubMed] [Green Version]
  38. Bazzano, L.A.; He, J.; Ogden, L.G.; Loria, C.M.; Whelton, P.K. Dietary fiber intake and reduced risk of coronary heart disease in us men and women: The national health and nutrition examination survey i epidemiologic follow-up study. Arch. Intern. Med. 2003, 163, 1897–1904. [Google Scholar] [CrossRef] [PubMed] [Green Version]
  39. Fuchs, F.D.; Whelton, P.K. High blood pressure and cardiovascular disease. Hypertension 2020, 75, 285–292. [Google Scholar] [CrossRef]
  40. Welty, F.K. Cardiovascular disease and dyslipidemia in women. Arch. Intern. Med. 2001, 161, 514–522. [Google Scholar] [CrossRef]
  41. Park, S.; Na, W.; Kim, M.; Kim, E.; Sohn, C. Correlation between intake of dietary fiber and adherence to the korean national dietary guidelines in adolescents from jeonju. Prev. Nutr. Food Sci. 2012, 17, 254–260. [Google Scholar] [CrossRef] [Green Version]
  42. Lee, H.-J.; Kim, Y.-A.; Lee, H.-S. The estimated dietary fiber intake of korean by age and sex. J. Korean Soc. Food Sci. Nutr. 2006, 35, 1207–1214. [Google Scholar]
  43. Ma, Y.; He, F.J.; MacGregor, G.A. High salt intake: Independent risk factor for obesity? Hypertension 2015, 66, 843–849. [Google Scholar] [CrossRef]
  44. Christensen, A.S.; Viggers, L.; Hasselström, K.; Gregersen, S. Effect of fruit restriction on glycemic control in patients with type 2 diabetes—A randomized trial. Nutr. J. 2013, 12, 29. [Google Scholar] [CrossRef] [PubMed] [Green Version]
  45. Tanaka, S.; Yoshimura, Y.; Kawasaki, R.; Kamada, C.; Tanaka, S.; Horikawa, C.; Ohashi, Y.; Araki, A.; Ito, H.; Akanuma, Y.; et al. Fruit intake and incident diabetic retinopathy with type 2 diabetes. Epidemiology 2013, 24, 204–211. [Google Scholar] [CrossRef] [PubMed]
  46. Nöthlings, U.; Schulze, M.B.; Weikert, C.; Boeing, H.; van der Schouw, Y.T.; Bamia, C.; Benetou, V.; Lagiou, P.; Krogh, V.; Beulens, J.W.; et al. Intake of vegetables, legumes, and fruit, and risk for all-cause, cardiovascular, and cancer mortality in a european diabetic population. J. Nutr. 2008, 138, 775–781. [Google Scholar] [CrossRef] [PubMed] [Green Version]
  47. Sluik, D.; Boeing, H.; Li, K.; Kaaks, R.; Johnsen, N.F.; Tjønneland, A.; Arriola, L.; Barricarte, A.; Masala, G.; Grioni, S.; et al. Lifestyle factors and mortality risk in individuals with diabetes mellitus: Are the associations different from those in individuals without diabetes? Diabetologia 2014, 57, 63–72. [Google Scholar] [CrossRef] [PubMed] [Green Version]
Figure 1. Selection process of study population.
Nutrients 14 03089 g001
Figure 2. Kaplan–Meier curves displaying the estimated survival probability for fiber intake quintile groups. (A) All-cause mortality across the dietary fiber quintiles. (B) Cardiovascular disease mortality across the dietary fiber quintiles.
Nutrients 14 03089 g002
Figure 3. Association between dietary fiber intake and all-cause mortality and cardiovascular disease mortality according to hypertension, diabetes, and dyslipidemia. (A) All-cause mortality, (B) Cardiovascular disease mortality. HR: hazard ratio; CI: confidence interval.
Nutrients 14 03089 g003
Table 1. Baseline characteristics of the cohort according to fiber intake (g/day).
VariablesQ1
(0.37, 3.51)
Q2
(3.51, 4.64)
Q3
(4.64, 5.79)
Q4
(5.79, 7.44)
Q5
(7.44, 52.65)
p-Value
N28,61028,61028,61028,61028,610
Sex, men, n (%)10,033 (35.1)10,308 (36.0)10,438 (36.5)10,315 (36.1)9850 (34.4)<0.001
Age, years54.7 ± 9.453.9 ± 8.853.8 ± 8.653.6 ± 8.453.2 ± 8.2<0.001
BMI, kg/m223.8 ± 3.023.9 ± 2.924.0 ± 2.924.0 ± 2.924.1 ± 2.9<0.001
WC, cm81.0 ± 8.981.3 ± 8.781.4 ± 8.881.5 ± 8.781.4 ± 8.8<0.001
SBP, mmHg122.5 ± 15.7122.7 ± 15.5122.8 ± 15.3122.7 ± 15.3122.5 ± 15.2<0.001
DBP, mmHg76.1 ± 10.276.1 ± 10.176.2 ± 10.076.2 ± 10.076.4 ± 10.0<0.001
Glucose, mg/dL96.0 ± 21.995.9 ± 21.995.7 ± 20.695.4 ± 21.095.2 ± 21.3<0.001
HbA1c, %5.72 ± 0.775.71 ± 0.755.72 ± 0.735.72 ± 0.755.72 ± 0.740.901
TC, mg/dL197.5 ± 36.1197.2 ± 35.6197.3 ± 35.7197.7 ± 35.6197.2 ± 35.50.392
HDL-C, mg/dL52.4 ± 13.352.6 ± 13.152.6 ± 13.052.7 ± 13.052.9 ± 12.90.001
LDL-C (mg/dL)119.3 ± 32.9118.9 ± 32.7119.0 ± 32.8119.2 ± 32.6119.0 ± 32.40.469
TG, mg/dL129.9 ± 90.3130.0 ± 92.4129.3 ± 91.3130.1 ± 91.1127.9 ± 89.40.022
Smoking status, n (%) <0.001
Never smoker20,428 (71.4)20,424 (71.4)20,406 (71.3)20,525 (71.7)21,004 (73.4)
Former smoker4177 (14.6)4421 (15.5)4602 (16.1)4467 (15.6)4218 (14.7)
Current smoker4005 (14.0)3765 (13.2)3602 (12.6)3618 (12.7)3388 (11.8)
Alcohol intake, n (%) <0.001
Never drinker14,618 (51.1)14,355 (50.2)14,348 (50.2)14,418 (50.4)14,633 (51.2)
Former drinker1271 (4.4)1155 (4.0)1100 (3.8)1049 (3.7)1210 (4.2)
Current drinker12,721 (44.5)13,100 (45.8)13,162 (46.0)13,143 (45.9)12,767 (44.6)
Regular exercise (No)12,359 (43.2)13,410 (46.9)14,468 (50.6)15,139 (52.9)16,353 (57.2)<0.001
HTN, n (%)4997 (17.5)4861 (17.0)4842 (16.9)4809 (16.8)4898 (17.1)0.272
DM2165 (7.6)2157 (7.5)2064 (7.2)2019 (7.1)1959 (6.9)0.003
Dyslipidemia16,216 (56.7)16,348 (57.1)16,228 (56.7)16,344 (57.1)16,083 (56.2)0.147
Residential area, n (%) <0.001
Urban23,776 (83.1)24,648 (86.2)24,993 (87.4)25,467 (89.0)25,472 (89.0)
Rural4834 (16.9)3962 (13.9)3617 (12.6)3143 (11.0)3138 (11.0)
Total energy, kcal/day1310.3 ± 344.01541.9 ± 356.21695.2 ± 377.31874.8 ± 415.32256.4 ± 630.7<0.001
Carbohydrate intake, g/day242.8 ± 64.9279.7 ± 64.8304.1 ± 66.3332.3 ± 71.3389.4 ± 100.7<0.001
Carbohydrate (%) 74.2 ± 7.172.8 ± 6.772.1 ± 6.571.2 ± 6.569.70± 7.4<0.001
Fat, g/day17.4 ± 10.522.6 ± 12.026.1 ± 13.130.3 ± 15.040.2 ± 22.9<0.001
Fat (%)11.8 ± 5.713.01 ± 5.313.6 ± 5.114.2 ± 5.015.4 ± 5.4<0.001
Protein, g/day38.9 ± 12.749.0 ± 14.155.9 ± 15.664.4 ± 17.984.2 ± 31.3<0.001
Protein (%)11.9 ± 2.312.8 ± 2.213.2 ± 2.213.8 ± 2.314.9 ± 2.8<0.001
Sodium, mg/day1135.9 ± 492.01837.7 ± 562.32355.9 ± 665.62919.9 ± 783.24306.2 ± 1666.1<0.001
Potassium, mg/day1183.5 ± 392.11684.8 ± 377.22059.3 ± 410.62512.0 ± 474.23642.7 ± 1151.1<0.001
Ca, mg229.8 ± 125.2328.7 ± 135.5402.5 ± 150.7491.9 ± 168.0736.1 ± 321.0<0.001
P, mg571.8 ± 168.2731.7 ± 177.5843.6 ± 197.1975.3 ± 222.51286.9 ± 415.7<0.001
Fe, mg5.4 ± 1.67.5 ± 1.79.1 ± 1.911.0 ± 2.316.3 ± 6.0<0.001
Vit. A, R.E201.4 ± 98.0316.4 ± 117.5405.8 ± 139.1524.9 ± 173.3920.7 ± 474.9<0.001
Vit. B1, mg0.64 ± 0.230.82 ± 0.250.94 ± 0.261.10 ± 0.301.47 ± 0.51<0.001
Vit. B2, mg0.53 ± 0.220.71 ± 0.250.84 ± 0.270.99 ± 0.301.38 ± 0.54<0.001
Niacin, mg9.38 ± 3.0911.92 ± 3.3613.66 ± 3.6815.77 ± 4.2220.80 ± 7.42<0.001
Vit. C, mg42.45 ± 20.0170.18 ± 22.8692.71 ± 27.07121.30 ± 33.19196.14 ± 82.27<0.001
Zinc, μg5.38 ± 1.766.65 ± 2.057.52 ± 2.308.59 ± 2.7011.15 ± 4.90<0.001
Vit. B6, mg0.93 ± 0.251.24 ± 0.251.46 ± 0.281.74 ± 0.332.47 ± 0.80<0.001
Folate, μg98.94 ± 30.53152.45 ± 28.69193.63 ± 33.93243.46 ± 44.54385.96 ± 146.10<0.001
Retinol, μg41.20 ± 38.4954.77 ± 46.3463.83 ± 48.5774.72 ± 54.54102.65 ± 87.49<0.001
Carotene, μg925.6 ± 469.81520.1 ± 585.11991.6 ± 720.72621.8 ± 924.64779.4 ± 2648.2<0.001
Vit. E, mg4.49 ± 1.756.09 ± 2.047.31 ± 2.378.86 ± 2.7713.24 ± 5.48<0.001
Fiber, g2.7 ± 0.64.1 ± 0.35.2 ± 0.36.5 ± 0.510.1 ± 3.0<0.001
BMI, body mass index; DBP, diastolic blood pressure; DM, diabetes mellitus; HTN, hypertension; HbA1c, hemoglobin A1c; HDL-C, high density lipoprotein cholesterol; LDL-C, low density lipoprotein cholesterol; R.E, retinol equivalents; SBP, systolic blood pressure; TC, total cholesterol; TG, triglycerides; WC, waist circumference.
Table 2. Warranty periods for mortality according to fiber intake (g/day).
All-Cause Mortality
VariablesWarranty Period (0.5%)nPerson-Time (Years)Events, nIncidence per 1000 Person-Years (95% CI)
Fiber (g)
Q1 (0.37, 3.51)2.4228,610289,394.915115.22 (4.39–6.06)
Q2 (3.51, 4.64)3.0928,610288,648.611263.90 (3.18–4.62)
Q3 (4.64, 5.79)3.3428,610291,149.09903.40 (2.73–4.08)
Q4 (5.79, 7.44)3.0928,610293,349.09513.24 (2.58–3.90)
Q5 (7.44, 52.65)3.5028,610299,095.98582.87 (2.25–3.49)
CVD Mortality
VariablesWarranty Period (0.5%)nPerson-Time (Years)Events, n (%)Incidence per 1000 Person-Years (95% CI)
Fiber (g)
Q1 (0.37, 3.51)6.8428,610294,427.03111.06 (0.68–1.43)
Q2 (3.51, 4.64)8.5028,610292,325.62310.79 (0.47–1.12)
Q3 (4.64, 5.79)10.8328,610294,656.71450.49 (0.24–0.75)
Q4 (5.79, 7.44)9.3328,610296,603.71710.58 (0.30–0.86)
Q5 (7.44, 52.65)11.1728,610302,202.91270.42 (0.18–0.66)
CVD, cardiovascular disease; CI, confidence interval.
Table 3. Multiple Cox proportional hazard regression analysis for all-cause mortality and cardiovascular disease (CVD) mortality of fiber intake quintiles.
Q1Q2Q3Q4Q5
(0.37, 3.51)(3.51, 4.64)(4.64, 5.79)(5.79, 7.44)(7.44, 52.65)
Hazard ratios
(95% Confidence intervals)
All-cause mortality
Unadjusted1.00 (ref)0.750.650.620.54
(0.70, 0.81)(0.60, 0.71)(0.57, 0.67)(0.50, 0.59)
Model 11.00 (ref)0.890.830.850.84
(0.82, 0.96)(0.76, 0.90)(0.78, 0.93)(0.76, 0.94)
Model 21.00 (ref)0.880.820.850.84
(0.82, 0.96)(0.76, 0.90)(0.78, 0.93)(0.76, 0.93)
CVD mortality
Unadjusted1.00 (ref)0.750.470.550.39
(0.64–0.89)(0.38–0.57)(0.45–0.66)(0.32–0.48)
Model 11.00 (ref)0.940.620.790.62
(0.79–1.12)(0.51–0.77)(0.64–0.97)(0.48–0.79)
Model 21.00 (ref)0.930.620.780.61
(0.78–1.10)(0.50–0.76)(0.64–0.96)(0.47–0.78)
Model 1: adjusted for age, sex, body mass index, smoking, alcohol intake, exercise, and total calories. Model 2: adjusted for age, sex, body mass index, smoking, alcohol intake, exercise, total calories, hypertension, diabetes, and dyslipidemia
Publisher’s Note: MDPI stays neutral with regard to jurisdictional claims in published maps and institutional affiliations.

