Article

Differing Nutrient Intake and Dietary Patterns According to the Presence of Hyper-Low-Density Lipoprotein Cholesterolemia or Hypertriglyceridemia

1
Department of Family Medicine, Yongin Severance Hospital, Yonsei University College of Medicine, Yongin 16995, Korea
2
Department of Research Affairs, Biostatistics Collaboration Unit, Yonsei University College of Medicine, Seoul 06273, Korea
3
Department of Family Medicine, Gangnam Severance Hospital, Yonsei University College of Medicine, Seoul 06273, Korea
*
Authors to whom correspondence should be addressed.
Nutrients 2021, 13(9), 3008; https://doi.org/10.3390/nu13093008
Submission received: 7 August 2021 / Revised: 24 August 2021 / Accepted: 25 August 2021 / Published: 28 August 2021
(This article belongs to the Section Lipids)

Abstract

:
Dietary choices may have differing effects on low-density lipoprotein cholesterol or triglyceride levels. The aim of this study was to investigate daily nutrient intake and dietary patterns of individuals with hyper-low-density lipoprotein cholesterolemia (hLDL) and hypertriglyceridemia (hTG) in a large Korean population-based study using propensity score (PS) matching. This study used data from the Korea National Health and Nutrition Examination Survey. Propensity score values for the predicted probability of patients with hLDL or hTG were estimated using logistic regression analysis, with age, sex, body mass index, alcohol consumption, smoking status, physical activity status, hypertension, and diabetes. After PS matching, intake of carbohydrates (%) was significantly lower (p = 0.021), and intake of fats (%) and saturated fatty acids (%) was significantly higher in the hLDL group than in the non-hLDL group (p = 0.025 and p = 0.013, respectively). The percentage of individuals with a high score for the Korean Healthy Eating Index (KHEI) “whole grains” or “saturated fatty acids” components was higher in the non-hLDL group than in the hLDL group (p < 0.05 for both). Dietary sodium/potassium ratio was significantly higher in the hTG than in the non-hTG (p = 0.049). Our results suggest that individualized dietary information and counseling require consideration of a person’s specific lipid levels.

1. Introduction

Cardiovascular disease (CVD) is a major cause of morbidity and mortality globally and in Korea [1,2]. Dyslipidemia, characterized by elevated total cholesterol (TC), low-density lipoprotein cholesterol (LDL-C), and triglycerides (TG) levels and decreased high-density lipoprotein cholesterol (HDL-C), has been closely linked to the development of CVD and is a modifiable risk factor using lifestyle management [3]. In recent years, dyslipidemia has become a substantial disease burden in Korea. According to the Korean Society of Lipid and Atherosclerosis (KSoLA), the number of people diagnosed with dyslipidemia has abruptly increased nearly 8-fold, from 1.5 million in 2002 to 11.6 million in 2018. Approximately 40.5% of Korean adults >30 years had dyslipidemia in 2018 [4], which is comparable to the prevalence in other high-income countries, such as the United States and Japan [5,6]. This trend may reflect a shift in Koreans’ dietary habits toward more Western-type diets [7]. Promoting a healthy diet forms the cornerstone for treating dyslipidemia [8]. Typically, high consumption of fruits, vegetables, whole grains, fish rich in omega-3 polyunsaturated fatty acids (N-3 PUFA), and legumes is recommended, whereas saturated fatty acids (SFA), trans fatty acids, added sugars, and sodium (Na) are restricted [9,10]. In addition, certain dietary patterns, such as the Mediterranean diet and the Dietary Approaches to Stop Hypertension (DASH) diet, are recommended for their beneficial effects on dyslipidemia [11,12]. However, dietary choices influencing LDL-C or TG levels differ [8]. For example, consuming a low-fat, high-carbohydrate diet lowers LDL-C but raises TG, thereby failing to improve the overall blood lipid profile [13,14]. Developing specific tools for reducing hyper-LDL-cholesterolemia (hLDL) and hypertriglyceridemia (hTG) would therefore require separate clarification and strategies. Nevertheless, very few studies have examined how specific nutrients or dietary patterns differentially affect hLDL and hTG, especially in Asian populations.
Therefore, the aims of this study were to investigate daily nutrient intake and dietary habits of people with hLDL or hTG in a large Korean population-based study using propensity score (PS) matching and to compare the consumption of daily nutrients between these two dyslipidemia phenotypes.

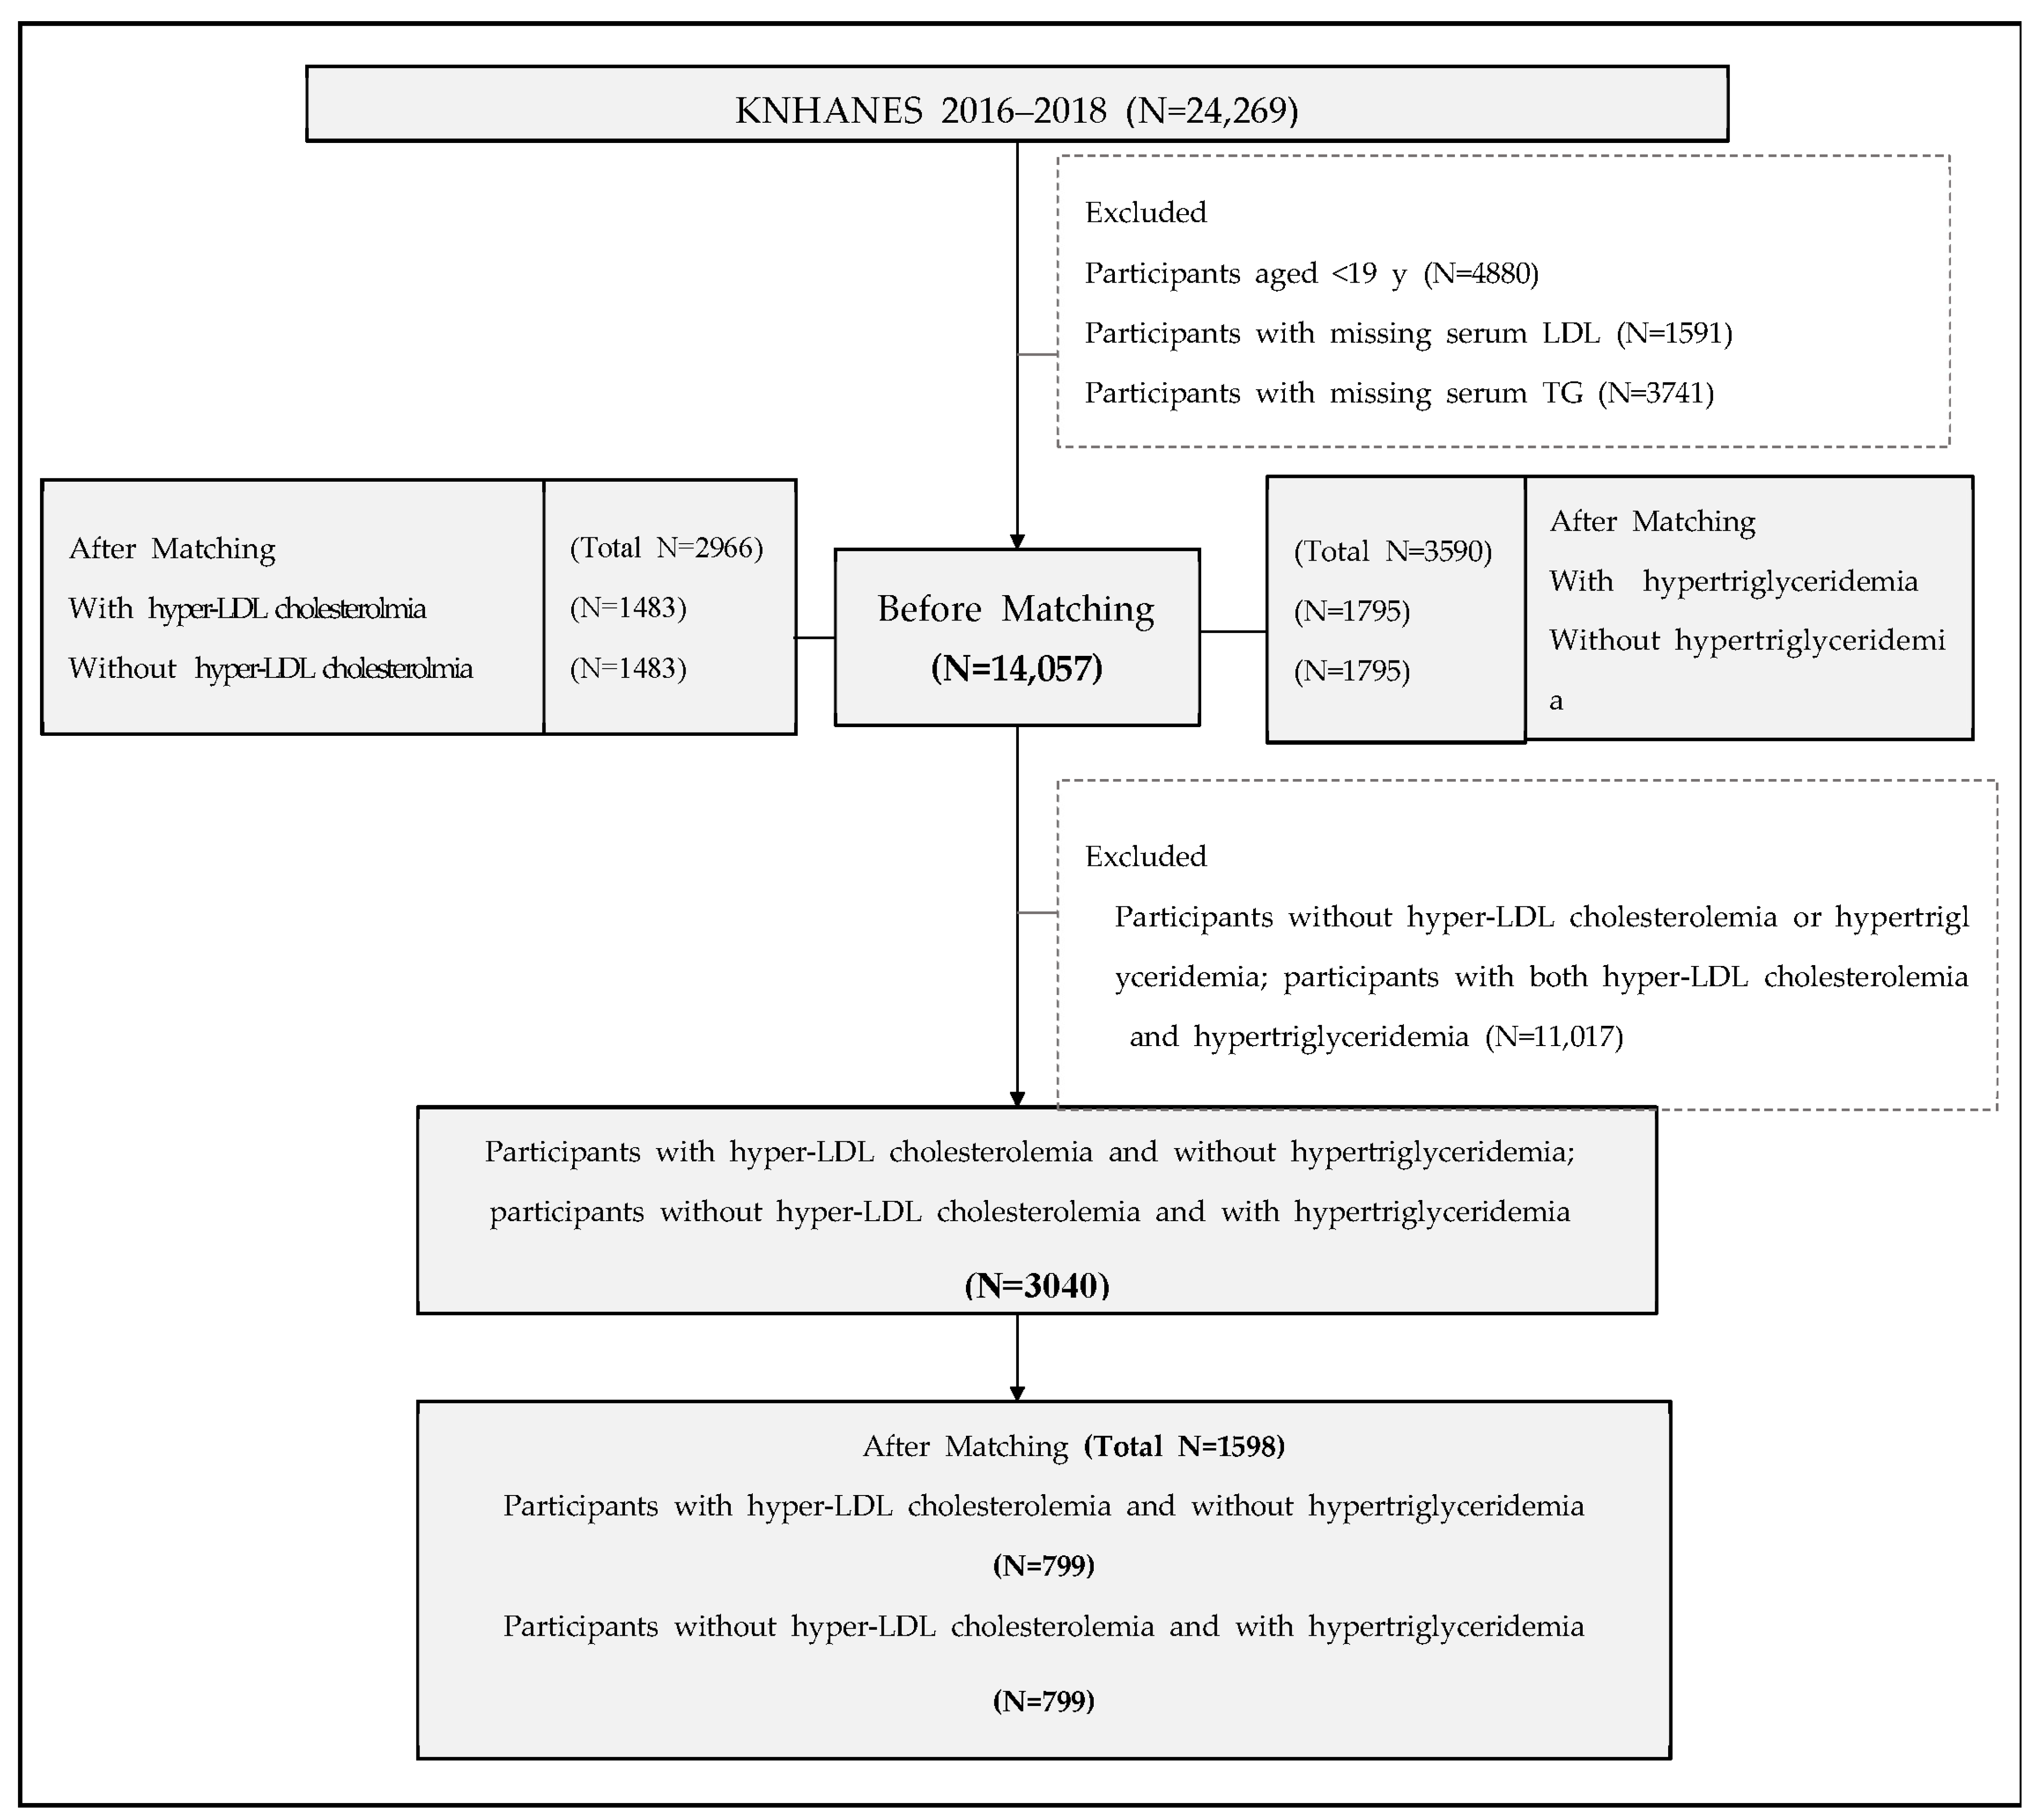
2. Materials and Methods

2.1. Study Population

This study used secondary data obtained from the Korea National Health and Nutrition Examination Survey (KNHANES), a survey conducted by the Korea Centers for Disease Control and Prevention to assess the health and nutrition status of Koreans. The data are publicly available through the KNHANES website.
We used data from the 2016–2018 KNHANES (VII) survey. A total of 24,269 participants were included in KNHANES-VII. Exclusion criteria for this study were as follows: (1) age < 19 years (n = 4880), (2) missing serum LDL-C data (n = 1591), or (3) missing serum TG data (n = 3741). In total, 14,057 participants were included in this study. The study flow chart is shown in Figure 1. The Institutional Review Board of Yongin Severance Hospital approved the study protocol. This study was approved by the Institutional Review Board of Korea Centers for Disease Control and Prevention (IRB No: 2018–01-03-P-A). Informed consent was obtained from all subjects before KNHANES, in accordance with the Declaration of Helsinki.

2.2. Anthropometrics and Biochemical Variables

The health interview and health examination were conducted by trained staff members, including physicians, medical technicians, and health interviewers, at a mobile examination center. Body mass index (BMI) was calculated as weight (kg) divided by height (m) squared. Waist circumference (WC) was measured in the horizontal plane midway between the lowest rib and iliac crest. Blood pressure was measured two times with the patient in the sitting position. The mean of the two measurements was recorded. TC and TG levels were measured by an enzymatic method using the Hitachi Automatic Analyzer 7600–210 (Hitachi, Tokyo, Japan). LDL-C and HDL-C were measured by homogeneous enzymatic colorimetric methods using the same analyzer. In KNHANES-VII, LDL-C was measured directly when TG levels were ≥400 mg/dL [15]. When TG levels were <400 mg/dL, LDL-C was calculated using the Friedwald equation (LDL-C = TC-HDL-C-(TG/5)), which has been demonstrated to correlate with direct LDL-C measurements [16]. Lifestyle data, such as smoking, physical activity, and alcohol consumption, were reported using a self-administered questionnaire. Current smoker was defined as smoking cigarettes at present plus smoking ≥100 cigarettes during the person’s lifetime. Current alcohol drinker was defined as consumption of >1 cup of alcohol per week during the past 1 year. Physically active was defined as participating in ≥150 min of weekly moderate-intensity aerobic physical activity, ≥75 min of weekly vigorous-intensity aerobic physical activity, or an equivalent combination of moderate- and vigorous-intensity activity. The presence of hypertension was defined as systolic blood pressure (SBP) ≥ 160 mm Hg, diastolic blood pressure (DBP) ≥ 140 mm Hg, or anti-hypertensive medication use. The presence of diabetes was defined as a fasting glucose ≥126 mg/dL or anti-diabetes medication use.

2.3. Definition of Dyslipidemia

According to the National Cholesterol Education Program Adult Treatment Panel III criteria and KSoLA [17], hLDL was defined as a serum LDL-C ≥ 160 mg/dL or use of a cholesterol-lowering drug. hTG was defined as a serum TG level ≥ 200 mg/dL.

2.4. Assessment of Nutrition Intake and Dietary Patterns

The nutritional survey was a face-to-face interview conducted by skilled dietitians in the subjects’ homes. Food intake during the past 1 year was examined using the semi-quantitative food frequency questionnaire (FFQ), which has been validated for 112 food items [18]. Total energy and nutrient intake values were derived from this FFQ. Details regarding food items are summarized on the KNHANES website [15]. The survey staff completed an initial intensive, standardized course, and retraining courses are provided 5–6 times per year to reinforce the proper protocols and techniques [19]. Percentages of energy intake from carbohydrates or protein intake were calculated as follows: carbohydrate intake (g/day) × 4 kcal/total energy intake (kcal/day) × 100% and protein intake (g/day) × 4 kcal/total energy intake (kcal/day) × 100%. The percentages of energy intake from fats (total fats, SFA, monounsaturated fatty acids (MUFA), total polyunsaturated fatty acids (PUFA), N-3 PUFA, and omega-6 PUFA (N-6 PUFA)) were calculated as follows: fat intake (g/day) × 9 kcal/total energy intake (kcal/day) × 100%. Cholesterol intake was recorded in mg/day. Intake of Na and potassium (K) was recorded in g/day.
The Korean Healthy Eating Index (KHEI) was developed to assess adherence to national dietary guidelines and to provide a comprehensive evaluation of diet quality in healthy Korean adults [20]. KHEI contains 14 components: 8 items recommended for adequate food consumption (i.e., having breakfast; whole grains; fruits, excluding fruit juice; fruits, including fruit juice; total vegetables, including Kimchi and pickles; total vegetables, excluding Kimchi and pickles; meat, fish, eggs, legumes; and milk and dairy products); 6 items recommended for moderate food consumption (i.e., SFA, Na, empty-calorie foods (sweets, beverages), carbohydrates, total fats, and total energy). Adequacy components represent the food groups and dietary elements that are encouraged. For these components, higher scores reflect higher intakes as higher intakes are desirable. Moderation components represent the food groups and dietary elements for which there are recommended limits to consumption. For moderation components, higher scores reflect lower intakes as lower intakes are more desirable. Overall, a higher total KHEI score indicates a diet that aligns better with dietary recommendations. The maximum total score of all 14 components is 100 points, and each component has a maximum score of 5 or 10 points. Detailed information regarding KHEI is summarized in the previous study in Supplementary Table S1 [21]. A higher KHEI score reflects a higher-quality, healthier diet. We categorized each component into three groups: low score, 0 ≤ score < 4, middle score: 4 ≤ score < 7, and high score: ≥7 points. For components with a maximum of 5 points, we doubled the points and categorized the component using the same three groups.

2.5. Statistical Analysis

Data were expressed as mean ± standard deviation (SD) for continuous variables or number (percentage) for categorical variables. To compare general characteristics between groups, an independent two-sample t-test was used for continuous variables, whereas a chi-squared test was used for categorical variables. PS values for the predicted probability of patients with hLDL or hTG were estimated using logistic regression analysis, with age, sex, BMI, alcohol consumption, smoking status, physical activity status, hypertension, and diabetes as confounding variables. Participants with hLDL were matched to non-hLDL participants in a 1:1 manner (Figure 1) using a nearest-neighbor matching method with a greedy algorithm. Participants with hTG were similarly 1:1 matched to non-hTG individuals. Participants with hLDL but not hTG (LDL-only group) were matched to those with hTG but not hLDL (hTG-only group) in the same manner.
Statistical analyses were conducted using SAS version 9.4 (SAS Institute, Cary, NC, USA) and R Statistical Package (Institute for Statistics and Mathematics, Vienna, Austria, ver 4.1.0, www.R-project.org). p < 0.05 was used as the significance level.

3. Results

3.1. Clinical and Dietary Characteristics According to LDL-C Level

The mean age and BMI of the 14,057 study participants were 52.0 ± 16.6 y and 23.9 ± 3.5 kg/m2. Table 1 shows the clinical characteristics of the study population according to LDL-C level. A total of 1312 participants (9.3%) had hLDL (hLDL group) and 12,745 (90.7%) did not have hLDL (non-hLDL group). In unmatched data, age, BMI, and WC were significantly higher, and the percentage of men was significantly lower in the hLDL group than in the non-hLDL group. Individuals with hLDL were less likely to be current smokers, current alcohol drinkers, and physically active. They also had significantly higher SBP, DBP, TC, LDL-C, HDL-C, C-reactive protein (CRP), and uric acid than people in the non-hLDL group.
After 1:1 PS matching according to age, sex, BMI, alcohol consumption, smoking, physical activity, hypertension, and diabetes, a total of 2966 individuals were matched based on LDL cholesterol levels. The 1483 matched sets were analyzed for differences in various metabolic variables (Table 1). The hLDL group had significantly higher SBP, DBP, glucose, TC, TG, LDL-C, HDL-C, and uric acid levels compared to the non-hLDL group.
Table 2 shows daily nutrient intake according to LDL-C levels. In unmatched data, there were no differences in total caloric intake or intake of carbohydrates (% and g), proteins (% and g), fats (% and g), SFA, MUFA, total PUFA, N-6 PUFA, fiber, or potassium between hLDL and non-hLDL groups. N-3 PUFA intake was significantly higher in the hLDL group than in the non-hLDL group (p = 0.022). Dietary Na and dietary Na/K ratio were lower in the hLDL group (p = 0.048 and p = 0.002, respectively). After 1:1 PS matching, total caloric intake was not different between hLDL and non-hLDL groups. Carbohydrate (%) intake was significantly lower (p = 0.021) and fat (%) and SFA intakes were significantly higher (p = 0.025 and p = 0.013, respectively) in the hLDL group than in the non-hLDL group.
The mean total KHEI score in the study population was 63.8 ± 13.5. The total KHEI score was not significantly different between hLDL and non-hLDL groups before and after PS matching (data not shown). When comparing the percentage of individuals in each KHEI category between hLDL and non-hLDL groups, the percentage of people with a high score for “whole grains” or “SFA” was significantly higher in the non-hLDL group than in the hLDL group after PS matching (p < 0.05 for both comparisons) (Figure 2A). There were no other differences between hLDL and non-hLDL groups.

3.2. Clinical and Dietary Characteristics According to TG Level

Table 3 shows the clinical characteristics of the study population according to TG level. Among the total study population, 2042 individuals (14.5%) had hTG (hTG group) and 12,015 (83.4%) did not have hTG (non-hTG group). In unmatched data, age, BMI, WC, and percentage of men were significantly higher in the hTG group than in the non-hTG group. Individuals in the hTG group were also more likely to be current smokers and current alcohol drinkers and less likely to be physically active. The hTG group also had significantly higher SBP, DBP, glucose, TC, TG, white blood cell (WBC) count, CRP, and uric acid than the non-hTG group. However, LDL-C and HDL-C levels were significantly lower in the hTG group than in the non-hTG group.
After 1:1 PS matching according to age, sex, BMI, alcohol consumption, smoking status, physical activity status, hypertension, and diabetes, a total of 3590 individuals were matched based on TG levels. The 1795 matched sets were analyzed for differences in various metabolic variables (Table 3). The hTG group had significantly higher SBP, DBP, WC, TC, TG, WBC count, and uric acid than the non-hTG group. LDL-C and HDL-C remained significantly lower in the hTG group than in the non-hTG group.
Table 4 shows daily nutrient intake according to TG levels. In unmatched data, there were significant differences in intake of all nutrients except protein (%), fat (g), N-3 PUFA, and cholesterol. Compared to the non-hTG group, the hTG group had significantly higher total caloric intake; intake of carbohydrates (% and g), fiber, Na, and K; and dietary Na/K ratio. Conversely, intake of fats (%), SFA, MUFA, total PUFA, and N-6 PUFA were significantly lower in the hTG group than in the non-hTG group. After 1:1 PS matching, there were no significant differences between hTG and non-hTG groups for all nutrient intake parameters except the dietary Na/K ratio. The Na/K ratio was significantly higher in the hTG group than in the non-hTG group (p = 0.049).
Total KHEI scores differed between hTG and non-hTG groups (62.3 ± 13.3 versus 64.3 ± 12.4 versus, respectively; p < 0.001). After PS matching, the total KHEI score remained significantly higher in the non-hTG group (64.4 ± 13.4 versus 62.9 ± 13.1; p = 0.045). As shown in Figure 2B, the percentage of individuals with a high score for “having breakfast” or “milk and dairy products” was significantly higher in the non-hTG group than in the hTG group after PS matching (p < 0.05 for both comparisons). There were no other significant differences between hTG and non-hTG groups.

3.3. Comparison of Nutrition Intake between hLDL-Only and hTG-Only Groups

Table 5 presents comparisons of nutrition intake between individuals in the hLDL-only and hTG-only groups. In unmatched data, the hLDL-only group had higher fat (%) and SFA intake (%) than the hTG-only group. The hTG-only group had a higher total caloric intake, PUFA/SFA ratio, (PUFA+MUFA)/SFA ratio, Na intake, and dietary Na/K ratio than the hLDL-only group. After 1:1 PS matching, the hLDL-only group had a higher intake of protein (%), fat (%), SFA, MUFA, total PUFA, N-3 PUFA, and N-6 PUFA. By contrast, the hTG-only group had a higher carbohydrate (% and g) intake and dietary Na/K ratio than the hLDL-only group.

4. Discussion

Using PS matching analysis, we found that individuals with hLDL had higher fat and SFA intake, lower carbohydrate intake, and a lower dietary Na/K ratio than individuals without hLDL. In addition, individuals with hTG had a higher dietary Na/K ratio than individuals without hLDL. When comparing individuals with only hLDL versus those with only hTG, the hLDL-only group had a higher intake of protein and fat, including various fatty acids, whereas the hTG-only group had a higher carbohydrate intake and a higher dietary Na/K ratio.
As dyslipidemia is strongly linked to mortality and morbidity from CVD [3], understanding dietary habits that may promote or prevent dyslipidemia is important for dyslipidemia management and CVD prevention [22]. Reducing LDL-C is a main focus of CVD management, and hTG is also an important consideration [23,24]. Further, hTG may be an especially important risk factor for CVD in Asian populations, whose carbohydrate consumption is higher but fat intake is much lower than that of Western populations [25,26]. A number of dietary habits have divergent effects on LDL-C and TG [8,27]. For example, dietary carbohydrate intake has unfavorable effects on hTG and HDL-C, but it is beneficial with regard to LDL-C [27]. Conversely, omega-3 intake from fish oil has no beneficial effects on LDL-C but lowers TG [28]. In a meta-analysis including 21trials, fish oil supplementation was associated with an increase in LDL-C levels [29]. Therefore, hLDL and hTG may require different dietary strategies for optimal dyslipidemia management. Interestingly, a clinical study has shown that a decrease in the amount of polyunsaturated fatty acids (PUFAs), and especially n-3 fatty acids, in membrane phospholipids may contribute to life span extension with calorie restriction [30]. Therefore, we should consider dietary fat composition with appropriate calorie restriction in regards to human health.
In this study, PS-matched comparisons of individuals with or without hLDL revealed that those with hLDL had higher consumption of SFA and lower intake of carbohydrates. These results are consistent with previous findings of a strong association between SFA intake and LDL-C [31,32]. High SFA intake has been associated with an increased risk of CVD, primarily mediated through increased levels of LDL-C [33]. However, several recent studies reported that some foods relatively rich in SFA, such as whole-fat dairy, dark chocolate, and unprocessed meat, are not associated with an increased risk of CVD, suggesting that different SFA have different biologic effects, which are modified by the food matrix and carbohydrate content of the diet [34]. Although the design of our study prevented evaluation of various dietary sources of SFA, we compared KHEI scores (which reflect the intake of culturally neutral basic food groups) to assess the quality of food intake, independent of food quantity [35]. Among the 14 KHEI components, the percentage of individuals with a high score for the “SFA” or “whole grains” components was significantly higher in the non-hLDL group than in the hLDL group. Consumption of plant-based foods has emerged as a promising approach to reduce LDL-C levels [36]. Whole grains, such as rice, corn, barley, and rye, are rich sources of fiber, which help lower LDL-C [37]. According to meta-analyses, whole-grain intake lowers serum TC and LDL levels [38], and ≥2 servings of whole grains per day are associated with a 10–20% reduced risk of developing CVD [39]. Therefore, current dietary guidelines recommend that total fat intake not exceed 30% of total caloric intake [40], and foods rich in healthy fats (e.g., fish, nuts, avocados, and seeds) be encouraged [41]. Replacing SFA with unsaturated fatty acids, proteins, or carbohydrates is also known to reduce LDL-C [31,32].
When comparing hTG and non-hTG groups, we found that the hTG group had a higher dietary Na/K ratio. Interestingly, this result was also observed when comparing the hLDL-only group with the hTG-only group. The hTG-only group had higher carbohydrate intake, as well as a higher dietary Na/K ratio than the hLDL-only group. Na and K are necessary for normal cellular function and have an inverse relationship. As dietary K can attenuate salt sensitivity and hypertensive effects of salt, the biological effects of Na and K intake should be considered jointly [42]. Some studies have suggested that the dietary Na/K ratio is more strongly associated with blood pressure and subsequent CVD than Na or K intake [42]. However, the role of a high Na/K ratio in lipid metabolism and its relationship to CVD are not well established.
For optimal health, the World Health Organization recommends restricting Na intake to 2 g per day, increasing K intake to 3.5 g per day, and maintaining a dietary Na/K ratio of approximately 1 [43]. The traditional South Korean diet is generally high in Na, with about half the population consuming >4000 mg/day of Na. This is far greater than the World Health Organization (WHO) recommendation [44]. The major dietary sources of K are fruits, legumes, whole grains, and vegetables. High salt intake and food processing decrease K use and eventually reduce K intake [45]. For this reason, we speculate that consumption of diets high in ultra-processed foods and “fast foods” with high-salt seasonings would increase the dietary Na/K ratio and have undesirable effects on TG levels. Conversely, intake of fresh fruits, fresh vegetables, and whole grains would reduce the dietary Na/K ratio and improve serum TG levels. The results of Mirmiran et al. support this speculation: fast food intake was positively associated with serum TG, and a higher dietary Na/K ratio increased the risk of hTG by 63% [46]. Our findings detecting an association between dietary Na/K ratio and hTG further highlight the importance of reducing Na and increasing K intake and provide a guide for potential interventional targets to decrease the risk of hTG.
High KHEI scores for “having breakfast” and “milk and dairy products” were more frequent in patients without hTG than in those with hTG. Skipping breakfast is considered an unhealthy habit, and several studies have shown its possible detrimental effects on lipid profiles [47]. A recent large population study in the United States demonstrated an increased risk of dyslipidemia among adults who skipped breakfast [48]. The association between skipping breakfast and dyslipidemia may be attributed to an increased appetite and subsequent high caloric intake after prolonged overnight fasting. Regarding milk or other dairy products, the effects of dairy products on CVD remain controversial because they are not only rich in SFA but also have high quantities of conjugated linoleic acid, whey protein, vitamins, and minerals, all of which have health benefits [49]. East Asians, and especially Koreans, tend to consume lower quantities of dairy products than Westerners [50]. A recent Korean study evaluating the risk of metabolic syndrome components according to milk intake detected protective effects of high milk consumption on TG and HDL-C levels. Frequent consumption of dairy products was also associated with a lower prevalence of hTG [50]. Therefore, reducing breakfast skipping and increasing dietary milk and other dairy products can be regarded as beneficial strategies for improving TG profiles in Koreans.
Our study has some limitations. Firstly, FFQ is less accurate than recording absolute nutrient intake values. Secondly, this is a cross-sectional study, which prevented us from assessing causality. Lastly, our results may not be generalizable to other races and ethnicities. Despite these weaknesses, this is the first study to investigate daily nutrient intake and dietary patterns in individuals with hLDL or hTG in a large Korean population-based study.

5. Conclusions

In conclusion, we found that hLDL was associated with high SFA intake, and hTG was associated with a high dietary Na/K ratio in the Korean population. The dietary Na/K ratio was a nutritional parameter that differentiated dietary habits between patients with only hLDL and those with only hTG. Furthermore, we found that reduced intake of whole grains was associated with hLDL, and skipping breakfast and low intake of milk and dairy products were associated with hTG. Our results may be used as a tool for monitoring patients with hLDL and hTG and for providing individualized dietary information and nutritional counseling. They may also aid in the future development of guidelines for dyslipidemia and CVD prevention, especially in the Korean population.

Supplementary Materials

The following are available online at https://www.mdpi.com/article/10.3390/nu13093008/s1, Table S1: Korean Healthy Eating Index components and standards for scoring.

Author Contributions

Y.-J.K., H.S.L., and J.-W.L.: Conceptualization; Investigation; Methodology; Project administration; Resources; Software; Supervision; Validation; Visualization; Roles/Writing-original draft; Writing—review and editing. S.L.: Data curation; Formal analysis; Methodology. All authors have read and agreed to the published version of the manuscript.

Funding

This work was supported by the Technology Innovation Program (20002781, A Platform for Prediction and Management of Health Risk Based on Personal Big Data and Lifelogging) funded by the Ministry of Trade, Industry & Energy (MOTIE, Korea) and by the Korea Institute of Planning and Evaluation for Technology in Food, Agriculture and Forestry (IPET) through High Value-added Food Technology Development Program funded by Ministry of Agriculture, Food and Rural Affairs (MAFRA) (321030051HD030).

Institutional Review Board Statement

The study was conducted according to the guidelines of the Declaration of Helsinki and approved by the Institutional Review Board of Korea Centers for Disease Control and Prevention (IRB No: 2018-01-03-P-A).

Informed Consent Statement

Informed consent was obtained from all subjects involved in the study.

Data Availability Statement

Data available in a publicly accessible repository; https://knhanes.kdca.go.kr/knhanes/main.do (accessed on 8 October 2020).

Acknowledgments

Thanks to Woojin Park for illustrating figures.

Conflicts of Interest

The authors declare no conflict of interest.

References

  1. World Health Organization. The Global Burden of Disease: 2004 Update; World Health Organization: Geneva, Switzerland, 2008. [Google Scholar]
  2. Rhee, E.J. Prevalence and current management of cardiovascular risk factors in korean adults based on fact sheets. Endocrinol. Metab. 2020, 35, 85–94. [Google Scholar] [CrossRef]
  3. Libby, P.; Buring, J.E.; Badimon, L.; Hansson, G.K.; Deanfield, J.; Bittencourt, M.S.; Tokgözoğlu, L.; Lewis, E.F. Atherosclerosis. Nat. Rev. Dis. Primers 2019, 5, 56. [Google Scholar] [CrossRef]
  4. Cho, S.M.J.; Lee, H.; Lee, H.H.; Baek, J.; Heo, J.E.; Joo, H.J.; Hong, S.J.; Kim, H.C. Dyslipidemia fact sheets in korea 2020: An analysis of nationwide population-based data. J. Lipid Atheroscler. 2021, 10, 202–209. [Google Scholar] [CrossRef]
  5. National Center for Health Statistics. National Center for Health Statistics; 2021. Available online: https://www.cdc.gov/nchs (accessed on 9 June 2021).
  6. Ministry of Health, Labour and Welfare. National Health and Nutrition Survey in Japan. Available online: http://www.mhlw.go.jp/toukei/itiran/gaiyo/k-eisei.html (accessed on 9 June 2021).
  7. Ko, M.; Kim, M.T.; Nam, J.J. Assessing risk factors of coronary heart disease and its risk prediction among Korean adults: The 2001 Korea national health and nutrition examination survey. Int. J. Cardiol. 2006, 110, 184–190. [Google Scholar] [CrossRef]
  8. Mach, F.; Baigent, C.; Catapano, A.L.; Koskinas, K.C.; Casula, M.; Badimon, L.; Chapman, M.J.; De Backer, G.G.; Delgado, V.; Ference, B.A.; et al. 2019 esc/eas guidelines for the management of dyslipidaemias: Lipid modification to reduce cardiovascular risk. Eur. Heart J. 2020, 41, 111–188. [Google Scholar] [CrossRef]
  9. Arnett, D.K.; Blumenthal, R.S.; Albert, M.A.; Buroker, A.B.; Goldberger, Z.D.; Hahn, E.J.; Himmelfarb, C.D.; Khera, A.; Lloyd-Jones, D.; McEvoy, J.W.; et al. 2019 acc/aha guideline on the primary prevention of cardiovascular disease: A report of the american college of cardiology/american heart association task force on clinical practice guidelines. J. Am. Coll. Cardiol. 2019, 74, e177–e232. [Google Scholar] [CrossRef]
  10. Grundy, S.M. An international atherosclerosis society position paper: Global recommendations for the management of dyslipidemia. J. Clin. Lipidol. 2013, 7, 561–565. [Google Scholar] [CrossRef] [PubMed]
  11. Georgia-Eirini, D.; Athina, S.; Wim, V.B.; Christos, K.; Theodoros, C. Natural products from mediterranean diet: From anti-hyperlipidemic agents to dietary epigenetic modulators. Curr. Pharm. Biotechnol. 2019, 20, 825–844. [Google Scholar] [CrossRef]
  12. Salehi-Abargouei, A.; Maghsoudi, Z.; Shirani, F.; Azadbakht, L. Effects of dietary approaches to stop hypertension (dash)-style diet on fatal or nonfatal cardiovascular diseases—Incidence: A systematic review and meta-analysis on observational prospective studies. Nutrition 2013, 29, 611–618. [Google Scholar] [CrossRef] [PubMed]
  13. Mensink, R.P.; World Health Organization. Effects of Saturated Fatty Acids on Serum Lipids and Lipoproteins: A Systematic Review and Regression Analysis; World Health Organization: Geneva, Switzerland, 2016. [Google Scholar]
  14. The Scientific Advisory Committee on Nutrition (SACN). Report on Saturated Fats and Health 2019. Available online: https://www.gov.uk/government/publications/saturated-fats-and-health-sacn-report (accessed on 10 July 2021).
  15. Korea Centers for Disease Control and Prevention (KCDC). Korea National Health & Nutritional Examination Survey Sixth (2013–2015), Guidbook for Data User (Korean). Available online: https://knhanes.cdc.go.kr/knhanes/eng/index.do (accessed on 20 November 2017).
  16. Expert Panel on Detection, Evaluation, and Treatment of High Blood Cholesterol in Adults. Executive summary of the third report of the national cholesterol education program (ncep) expert panel on detection, evaluation, and treatment of high blood cholesterol in adults (adult treatment panel iii). JAMA 2001, 285, 2486–2497. [Google Scholar] [CrossRef] [PubMed]
  17. National Cholesterol Education Program (NCEP) Expert Panel on Detection, Evaluation, and Treatment of High Blood Cholesterol in Adults (Adult Treatment Panel III). Third report of the national cholesterol education program (ncep) expert panel on detection, evaluation, and treatment of high blood cholesterol in adults (adult treatment panel iii) final report. Circulation 2002, 106, 3143–3421. [Google Scholar] [CrossRef]
  18. Yun, S.H.; Shim, J.-S.; Kweon, S.; Oh, K. Development of a food frequency questionnaire for the korea national health and nutrition examination survey: Data from the fourth korea national health and nutrition examination survey (knhanes iv). Korean J. Nutr. 2013, 46, 186–196. [Google Scholar] [CrossRef] [Green Version]
  19. Kweon, S.; Kim, Y.; Jang, M.J.; Kim, Y.; Kim, K.; Choi, S.; Chun, C.; Khang, Y.H.; Oh, K. Data resource profile: The korea national health and nutrition examination survey (knhanes). Int. J. Epidemiol. 2014, 43, 69–77. [Google Scholar] [CrossRef] [PubMed] [Green Version]
  20. Yook, S.-M.; Park, S.; Moon, H.-K.; Kim, K.; Shim, J.E.; Hwang, J.-Y. Development of korean healthy eating index for adults using the korea national health and nutrition examination survey data. J. Nutr. Health 2015, 48, 419–428. [Google Scholar] [CrossRef] [Green Version]
  21. Park, S.; Kim, K.; Lee, B.K.; Ahn, J. Association of the healthy eating index with estimated cardiovascular age in adults from the knhanes 2013–2017. Nutrients 2020, 12, 2912. [Google Scholar] [CrossRef]
  22. Musunuru, K. Atherogenic dyslipidemia: Cardiovascular risk and dietary intervention. Lipids 2010, 45, 907–914. [Google Scholar] [CrossRef] [Green Version]
  23. Ballantyne, C.M.; Olsson, A.G.; Cook, T.J.; Mercuri, M.F.; Pedersen, T.R.; Kjekshus, J. Influence of low high-density lipoprotein cholesterol and elevated triglyceride on coronary heart disease events and response to simvastatin therapy in 4s. Circulation 2001, 104, 3046–3051. [Google Scholar] [CrossRef] [Green Version]
  24. Toth, P.P. Triglyceride-rich lipoproteins as a causal factor for cardiovascular disease. Vasc. Health Risk Manag. 2016, 12, 171–183. [Google Scholar] [CrossRef] [PubMed] [Green Version]
  25. Chen, A.H.; Tseng, C.H. The role of triglyceride in cardiovascular disease in asian patients with type 2 diabetes—A systematic review. Rev. Diabet. Stud. 2013, 10, 101–109. [Google Scholar] [CrossRef] [Green Version]
  26. Sone, H.; Tanaka, S.; Tanaka, S.; Iimuro, S.; Oida, K.; Yamasaki, Y.; Oikawa, S.; Ishibashi, S.; Katayama, S.; Ohashi, Y.; et al. Serum level of triglycerides is a potent risk factor comparable to ldl cholesterol for coronary heart disease in japanese patients with type 2 diabetes: Subanalysis of the japan diabetes complications study (jdcs). J. Clin. Endocrinol. Metab. 2011, 96, 3448–3456. [Google Scholar] [CrossRef]
  27. Song, S.; Song, W.O.; Song, Y. Dietary carbohydrate and fat intakes are differentially associated with lipid abnormalities in korean adults. J. Clin. Lipidol. 2017, 11, 338–347.e333. [Google Scholar] [CrossRef]
  28. Zock, P.L.; Blom, W.A.; Nettleton, J.A.; Hornstra, G. Progressing insights into the role of dietary fats in the prevention of cardiovascular disease. Curr. Cardiol. Rep. 2016, 18, 111. [Google Scholar] [CrossRef] [Green Version]
  29. Balk, E.M.; Lichtenstein, A.H.; Chung, M.; Kupelnick, B.; Chew, P.; Lau, J. Effects of omega-3 fatty acids on serum markers of cardiovascular disease risk: A systematic review. Atherosclerosis 2006, 189, 19–30. [Google Scholar] [CrossRef]
  30. López-Domínguez, J.A.; Ramsey, J.J.; Tran, D.; Imai, D.M.; Koehne, A.; Laing, S.T.; Griffey, S.M.; Kim, K.; Taylor, S.L.; Hagopian, K.; et al. The influence of dietary fat source on life span in calorie restricted mice. J. Gerontol. A Biol. Sci. Med. Sci. 2015, 70, 1181–1188. [Google Scholar] [CrossRef] [Green Version]
  31. Eckel, R.H.; Jakicic, J.M.; Ard, J.D.; de Jesus, J.M.; Miller, N.H.; Hubbard, V.S.; Lee, I.M.; Lichtenstein, A.H.; Loria, C.M.; Millen, B.E.; et al. 2013 aha/acc guideline on lifestyle management to reduce cardiovascular risk: A report of the american college of cardiology/american heart association task force on practice guidelines. J. Am. Coll. Cardiol. 2014, 63, 2960–2984. [Google Scholar] [CrossRef] [PubMed] [Green Version]
  32. Jacobson, T.A.; Maki, K.C.; Orringer, C.E.; Jones, P.H.; Kris-Etherton, P.; Sikand, G.; La Forge, R.; Daniels, S.R.; Wilson, D.P.; Morris, P.B.; et al. National lipid association recommendations for patient-centered management of dyslipidemia: Part 2. J. Clin. Lipidol. 2015, 9, S1–S122.e1. [Google Scholar] [CrossRef] [Green Version]
  33. Siri-Tarino, P.W.; Sun, Q.; Hu, F.B.; Krauss, R.M. Saturated fat, carbohydrate, and cardiovascular disease. Am. J. Clin. Nutr. 2010, 91, 502–509. [Google Scholar] [CrossRef] [Green Version]
  34. Astrup, A.; Magkos, F.; Bier, D.M.; Brenna, J.T.; de Oliveira Otto, M.C.; Hill, J.O.; King, J.C.; Mente, A.; Ordovas, J.M.; Volek, J.S.; et al. Saturated fats and health: A reassessment and proposal for food-based recommendations: Jacc state-of-the-art review. J. Am. Coll. Cardiol. 2020, 76, 844–857. [Google Scholar] [CrossRef] [PubMed]
  35. Schap, T.; Kuczynski, K.; Hiza, H. Healthy eating index-beyond the score. J. Acad. Nutr. Diet. 2017, 117, 519–521. [Google Scholar] [CrossRef] [PubMed]
  36. Sun, Y.; Neelakantan, N.; Wu, Y.; Lote-Oke, R.; Pan, A.; van Dam, R.M. Palm oil consumption increases ldl cholesterol compared with vegetable oils low in saturated fat in a meta-analysis of clinical trials. J. Nutr. 2015, 145, 1549–1558. [Google Scholar] [CrossRef] [PubMed] [Green Version]
  37. Vaidean, G.D.; Manczuk, M.; Vansal, S.S.; Griffith, J. The cholesterol-lowering effect of statins is potentiated by whole grains intake. The polish norwegian study (pons). Eur. J. Intern. Med. 2018, 50, 47–51. [Google Scholar] [CrossRef]
  38. Surampudi, P.; Enkhmaa, B.; Anuurad, E.; Berglund, L. Lipid lowering with soluble dietary fiber. Curr. Atheroscler. Rep. 2016, 18, 75. [Google Scholar] [CrossRef]
  39. Temple, N.J. Fat, sugar, whole grains and heart disease: 50 years of confusion. Nutrients 2018, 10, 39. [Google Scholar] [CrossRef] [Green Version]
  40. Committee for the Korean Guidelines for the Management of Dyslipidemia. 2015 Korean guidelines for the management of dyslipidemia: Executive summary (english translation). Korean Circ. J. 2016, 46, 275–306. [Google Scholar] [CrossRef] [PubMed] [Green Version]
  41. Mozaffarian, D.; Rosenberg, I.; Uauy, R. History of modern nutrition science-implications for current research, dietary guidelines, and food policy. BMJ 2018, 361, k2392. [Google Scholar] [CrossRef] [PubMed] [Green Version]
  42. Geleijnse, J.M.; Witteman, J.C.; Stijnen, T.; Kloos, M.W.; Hofman, A.; Grobbee, D.E. Sodium and potassium intake and risk of cardiovascular events and all-cause mortality: The rotterdam study. Eur. J. Epidemiol. 2007, 22, 763–770. [Google Scholar] [CrossRef] [PubMed] [Green Version]
  43. World Health Organization. Salt Reduction and Iodine Fortification Strategies in Public Health: Report of a Joint Technical Meeting Convened by the World Health Organization and the George Institute for Global Health in Collaboration with the International Council for the Control of Iodine Deficiency Disorders Global Network, Sydney, Australia, March 2013; World Health Organization: Geneva, Switzerland, 2014. [Google Scholar]
  44. Park, H.K.; Lee, Y.; Kang, B.W.; Kwon, K.I.; Kim, J.W.; Kwon, O.S.; Cobb, L.K.; Campbell, N.R.C.; Blakeman, D.E.; Kim, C.I. Progress on sodium reduction in South Korea. BMJ Glob. Health 2020, 5, e002028. [Google Scholar] [CrossRef]
  45. Sun, H.; Weaver, C.M. Rise in potassium deficiency in the us population linked to agriculture practices and dietary potassium deficits. J. Agric. Food Chem. 2020, 68, 11121–11127. [Google Scholar] [CrossRef]
  46. Mirmiran, P.; Bahadoran, Z.; Mirzaei, S.; Azizi, F. Dietary intake, changes in lipid parameters and the risk of hypertriglyceridemia: A prospective approach in the tehran lipid and glucose study. Int. J. Vitam. Nutr. Res. 2014, 84, 269–276. [Google Scholar] [CrossRef]
  47. Kim, S.H.; Song, Y.H.; Park, S.; Park, M.J. Impact of lifestyle factors on trends in lipid profiles among korean adolescents: The korea national health and nutrition examination surveys study, 1998 and 2010. Korean J. Pediatr. 2016, 59, 65–73. [Google Scholar] [CrossRef] [Green Version]
  48. Deshmukh-Taskar, P.; Nicklas, T.A.; Radcliffe, J.D.; O’Neil, C.E.; Liu, Y. The relationship of breakfast skipping and type of breakfast consumed with overweight/obesity, abdominal obesity, other cardiometabolic risk factors and the metabolic syndrome in young adults. The national health and nutrition examination survey (nhanes): 1999–2006. Public Health Nutr. 2013, 16, 2073–2082. [Google Scholar] [PubMed] [Green Version]
  49. Soedamah-Muthu, S.S.; Ding, E.L.; Al-Delaimy, W.K.; Hu, F.B.; Engberink, M.F.; Willett, W.C.; Geleijnse, J.M. Milk and dairy consumption and incidence of cardiovascular diseases and all-cause mortality: Dose-response meta-analysis of prospective cohort studies. Am. J. Clin. Nutr. 2011, 93, 158–171. [Google Scholar] [CrossRef] [PubMed] [Green Version]
  50. Park, S.-J.; Park, J.; Song, H.J.; Lee, C.-H.; Lee, H.-J. Association between dairy product intake and hypertriglyceridemia in korean adults. Nutr. Res. Pract. 2020, 14, 152–159. [Google Scholar] [CrossRef] [PubMed]
Figure 1. Study flow chart. KNHANES, Korea National Health and Nutrition Examination Survey; LDL, low-density lipoprotein.
Nutrients 13 03008 g001
Figure 2. Percentages of participants in different categories for various Korean Healthy Eating Index components. Each Korean Healthy Eating Index component was categorized into three groups: low score: 0 ≤ score < 4, middle score: 4 ≤ score < 7, and high score: ≥7 points. p-values were calculated using the chi-squared test. (A) Percentages for each category of “whole grains” and “saturated fatty acids” scores in participants with or without hyper-LDL cholesterolemia. (B) Percentages for each category of “having breakfast” and “milk and dairy products” scores in participants with or without hypertriglyceridemia.
Nutrients 13 03008 g002
Table 1. Clinical characteristics of study population according to the presence of hyper-low-density lipoprotein cholesterolemia.
Before Propensity Score—MatchingAfter Propensity Score—Matching
Total
(N = 14,057)
Non-hLDL
(N = 12,745)
hLDL
(N = 1312)
p-ValueTotal
(N = 2966)
Non-hLDL
(N = 1483)
hLDL
(N = 1483)
p-Value
Sex (male)5955 (42.4)5486 (43.0)469 (35.8)<0.0011126 (37.96)561 (37.83)565 (38.10)0.880
Age (y)52.0 ± 16.651.7 ± 17.154.6 ± 14.3<0.00154.1 ± 15.254.1 ± 16.354.0 ± 14.00.816
BMI (kg/m2)23.9 ± 3.523.9 ± 3.524.6 ± 3.4<0.00124.6 ± 3.524.6 ± 3.524.6 ± 3.50.720
Waist circumstance (cm)82.4 ± 10.282.2 ± 10.384.0 ± 9.4<0.00183.9 ± 9.783.7 ± 9.984.1 ± 9.50.258
SBP (mm Hg)119.0 ± 16.9118.7 ± 16.8122.1 ± 17.5<0.001120.5 ± 16.9119.3 ± 16.3121.8 ± 17.4<0.001
DBP (mm Hg)75.3 ± 10.175.0 ± 10.177.7 ± 10.2<0.00176.5 ± 10.075.1 ± 9.677.9 ± 10.3<0.001
Glucose (mg/dL)100.8 ± 23.0100.7 ± 22.9101.4 ± 24.50.367100.6 ± 22.299.4 ± 19.1101.8 ± 24.80.004
TC (mg/dL)192.6 ± 37.7185.8 ± 32.0257.9 ± 24.4<0.001223.5 ± 45.0188.6 ± 31.5258.4 ± 24.9<0.001
HDL-C (mg/dL)51.2 ± 12.651.1 ± 12.752.4 ± 11.90.00251.3 ± 12.050.3 ± 12.152.3 ± 11.7<0.001
TG (mg/dL)131.4 ± 92.7131.1 ± 94.9134.4 ± 68.10.115133.5 ± 81.6130.2 ± 90.2136.8 ± 72.00.026
LDL-C (mg/dL)115.1 ± 34.0108.5 ± 28.0178.7 ± 17.9<0.001145.5 ± 40.4112.2 ± 26.9178.7 ± 18.1<0.001
WBC count (×103/µL)6.2 ± 1.86.2 ± 1.86.2 ± 1.80.3796.2 ± 1.86.2 ± 1.76.3 ± 1.80.142
CRP1.22 ± 2.001.20 ± 2.001.39 ± 2.040.0011.33 ± 2.031.29 ± 2.031.37 ± 2.030.284
Uric acid5.05 ± 1.375.03 ± 1.375.17 ± 1.390.0015.11 ± 1.375.03 ± 1.355.20 ± 1.390.001
Current alcohol drinker7411 (53.1)6822 (53.9)589 (45.1)<0.0011366 (46.1)678 (45.7)688 (46.4)0.713
Current smoker5089 (36.5)4669 (36.9)420 (32.2)0.001996 (33.6)499 (33.7)497 (33.5)0.938
Physically active5868 (43.3)5363 (43.7)505 (40.1)0.0141187 (40.0)591 (39.9)596 (40.2)0.851
Comorbidity
HTN4608 (32.9)4226 (33.2)382 (29.2)0.003884 (29.8)453 (30.6)431 (29.1)0.377
DM1793 (12.8)1693 (13.3)100 (7.6)<0.001231 (7.8)109 (7.4)122 (8.2)0.373
Data are mean ± standard deviation or number (percentage). LDL-C, low-density lipoprotein cholesterol; hLDL, hyper-LDL cholesterolemia; BMI, body mass index; SBP, systolic blood pressure; DBP, diastolic blood pressure; TC, total cholesterol; HDL-C, high-density lipoprotein cholesterol; TG, triglycerides; WBC, white blood cell; CRP, C-reactive protein; HTN, hypertension; DM, diabetes. p-values were calculated using the independent t-test or chi-squared test.
Table 2. Daily nutrient intake of study population according to the presence of hyper-low-density lipoprotein cholesterolemia.
Before Propensity Score—MatchingAfter Propensity Score—Matching
Total
(N = 14,057)
Non-hLDL
(N = 12,745)
hLDL
(N = 1312)
p-ValueTotal
(N = 2966)
Non-hLDL
(N = 1483)
hLDL
(N = 1483)
p-Value
Total calories (kcal)1809.5 ± 777.91813.6 ± 778.91770.0 ± 768.10.0701869.9 ± 832.91883.4 ± 843.71856.0 ± 821.70.401
Carbohydrates (%)66.0 ± 11.966.0 ± 11.966.1 ± 12.10.93266.4 ± 11.766.9 ± 11.665.9 ± 11.80.021
Carbohydrates (g)293.0 ± 123.6293.6 ± 123.9286.5 ± 120.60.062294.2 ± 125.3298.1 ± 128.2290.1 ± 122.10.102
Proteins (%)14.8 ± 4.514.8 ± 4.514.7 ± 4.50.44914.7 ± 4.414.5 ± 4.314.8 ± 4.50.190
Proteins (g)67.4 ± 37.867.7 ± 37.865.3 ± 37.10.04566.6 ± 37.066.6 ± 36.566.6 ± 37.60.999
Fats (%)19.2 ± 9.719.2 ± 9.719.3 ± 9.80.80718.9 ± 9.518.5 ± 9.319.4 ± 9.60.025
Fats (g)40.9 ± 32.940.9 ± 32.840.3 ± 33.40.53439.9 ± 31.239.1 ± 30.140.7 ± 32.30.211
SFA (%)6.1 ± 3.76.1 ± 3.76.2 ± 3.70.5806.0 ± 3.65.9 ± 3.56.2 ± 3.60.013
MUFA (%)6.0 ± 3.86.0 ± 3.86.0 ± 3.90.8195.9 ± 3.75.8 ± 3.66.0 ± 3.80.163
PUFA (%)5.2 ± 2.95.2 ± 2.95.2 ± 2.90.6965.2 ± 2.85.1 ± 2.85.3 ± 2.90.111
PUFA/SFA1.09 ± 0.711.09 ± 0.711.08 ± 0.720.5631.10 ± 0.731.12 ± 0.741.08 ± 0.720.247
(PUFA + MUFA)/
SFA
2.12 ± 0.962.12 ± 0.962.08 ± 0.960.1692.12 ± 0.972.15 ± 0.992.09 ± 0.960.106
N-3 PUFA (%)0.90 ± 0.890.89 ± 0.880.96 ± 0.960.0220.91 ± 0.860.89 ± 0.810.93 ± 0.900.191
N-6 PUFA (%)4.30 ± 2.474.30 ± 2.474.27 ± 2.440.6704.29 ± 2.454.22 ± 2.394.36 ± 2.500.145
N-6 PUFA
N-3 PUFA
6.79 ± 4.876.81 ± 4.916.56 ± 4.450.0626.75 ± 6.526.64 ± 4.956.86 ± 7.810.381
Cholesterol (mg)218.7 ± 210.8219.2 ± 210.0213.4 ± 219.00.368215.5 ± 212.7214.2 ± 206.6216.1 ± 218.80.751
Fiber (g)25.3 ± 14.425.3 ± 14.025.30 ± 14.30.96625.9 ± 14.926.1 ± 15.225.8 ± 14.50.646
Na (g)3.3 ± 2.13.3 ± 2.13.1 ± 2.10.0483.2 ± 2.13.2 ± 2.03.2 ± 2.10.735
K (g)2.8 ± 1.42.8 ± 1.42.8 ± 1.40.6942.8 ± 1.42.8 ± 1.42.9 ± 1.40.315
Na/K1.25 ± 0.671.25 ± 0.671.19 ± 0.640.0021.22 ± 0.651.2 ± 0.681.19 ± 0.620.050
Data are mean ± standard deviation. hLDL, hyper-LDL cholesterolemia; SFA, saturated fatty acids; MUFA, monounsaturated fatty acids; PUFA, polyunsaturated fatty acids; N-3, omega-3; N-6, omega-6; Na, sodium; K, potassium. p-values were calculated using the independent t-test.
Table 3. Clinical characteristics of study population according to the presence of hypertriglyceridemia.
Before Propensity Score—MatchingAfter Propensity Score—Matching
Total
(N = 14,057)
Non-hTG
(N = 12,015)
hTG
(N = 2042)
p-ValueTotal
(N = 3590)
Non-hTG
(N = 1795)
hTG
(N = 1795)
p-Value
Sex (male)5955 (42.4)4713 (39.2)1242 (60.8)<0.0012168 (60.4)1107 (61.7)1061 (59.1)0.117
Age (y)52.0 ± 16.951.7 ± 17.253.5 ± 14.9<0.00154.1 ± 15.754.4 ± 16.653.7 ± 14.70.138
BMI (kg/m2)23.9 ± 3.523.7 ± 3.525.7 ± 3.4<0.00125.3 ± 3.225.2 ± 3.325.3 ± 3.10.214
Waist circumstance (cm)82.4 ± 10.281.3 ± 10.188.5 ± 8.7<0.00187.1 ± 8.686.5 ± 9.187.7 ± 8.1<0.001
SBP (mm Hg)119.0 ± 16.9118.2 ± 16.8124.1 ± 16.0<0.001122.8 ± 16.4121.8 ± 16.6123.8 ± 16.10.002
DBP (mm Hg)75.3 ± 10.174.6 ± 9.879.4 ± 10.8<0.00177.7 ± 10.476.3 ± 10.179.2 ± 10.5<0.001
Glucose (mg/dL)100.8 ± 23.099.3 ± 21.2109.6 ± 30.4<0.001106.6 ± 27.5105.0 ± 25.5108.2 ± 29.10.004
TC (mg/dL)192.6 ± 37.7189.6 ± 36.4210.3 ± 40.3<0.001199.5 ± 39.8187.9 ± 36.1211.2 ± 40.0<0.001
HDL-C (mg/dL)51.2 ± 12.652.7 ± 12.442.2 ± 9.4<0.00146.1 ± 11.250.0 ± 11.642.3 ± 9.3<0.001
TG (mg/dL)131.4 ± 92.7103.0 ± 41.7298.5 ± 127.6<0.001205.3 ± 132.6112.0 ± 41.6298.5 ± 126.6<0.001
LDL-C (mg/dL)115.1 ± 34.0116.2 ± 32.8108.5 ± 39.8<0.001112.3 ± 36.5115.5 ± 32.8109.2 ± 39.7<0.001
WBC count (×103/µL)6.2 ± 1.86.1 ± 1.76.9 ± 1.8<0.0016.6 ± 1.76.4 ± 1.76.8 ± 1.8<0.001
CRP1.22 ± 2.01.19 ± 2.051.37 ± 1.74<0.0011.33 ± 1.901.34 ± 2.091.33 ± 1.690.891
Uric acid5.05 ± 1.374.92 ± 1.315.77 ± 1.45<0.0015.52 ± 1.425.30 ± 1.355.74 ± 1.45<0.001
Current alcohol drinker7411 (53.1)6189 (51.9)1222 (60.3)<0.0012142 (59.7)1080 (60.2)1062 (59.2)0.540
Current smoker5089 (36.5)3973 (33.3)1116 (55.0)<0.0011921 (53.5)977 (54.4)944 (52.6)0.270
Physically active5868 (43.3)5093 (44.0)775 (39.7)0.0011444 (40.2)726 (40.5)718 (40.0)0.785
Comorbidity
HTN4608 (32.9)3693 (30.8)915(44.9)<0.0011508 (42.0)745 (41.5)763 (42.5)0.543
DM1793 (12.8)1365 (11.4)428 (21.0)<0.001665 (18.5)329 (18.3)336 (18.7)0.764
Data are mean ± standard deviation or number (percentage). hTG, hypertriglyceridemia; BMI, body mass index; SBP, systolic blood pressure; DBP, diastolic blood pressure; TC, total cholesterol; HDL-C, high-density lipoprotein cholesterol; TG, triglycerides; LDL-C, low-density lipoprotein cholesterol; WBC, white blood cell; CRP, C-reactive protein; Na, sodium; K, potassium; HTN, hypertension; DM, diabetes. p-values were calculated using the independent t-test or chi-squared test.
Table 4. Daily nutrient intake of study population according to the presence of hypertriglyceridemia.
Before Propensity Score—MatchingAfter Propensity Score—Matching
Total
(N = 14,075)
Non-hTG
(N = 12,015)
hTG
(N = 2042)
p-ValueTotal
(N = 3590)
Non-hTG
(N = 1795)
hTG
(N = 1795)
p-Value
Total calories (kcal)1809.5 ± 777.91799.0 ± 767.81873.6 ± 834.00.0052025.6 ± 924.62010.2 ± 907.82041.5 ± 941.60.343
Carbohydrates (%)66.0 ± 11.965.9 ± 11.966.7 ± 12.00.00866.5 ± 11.966.4 ± 11.866.6 ± 12.00.640
Carbohydrates (g)293.0 ± 123.6290.9 ± 121.3305.5 ± 136.5<0.001307.0 ± 132.2307.4 ± 128.6306.7 ± 135.90.892
Proteins (%)14.8 ± 4.514.8 ± 4.514.8 ± 4.50.58314.8 ± 4.414.9 ± 4.314.8 ± 4.50.704
Proteins (g)67.4 ± 37.867.0 ± 37.470.4 ± 40.10.00771.0 ± 39.671.0 ± 39.270.9 ± 40.00.905
Fats (%)19.2 ± 9.719.3 ± 9.718.4 ± 9.90.00418.7 ± 9.818.7 ± 9.718.6 ± 9.80.689
Fats (g)40.9 ± 32.940.8 ± 32.641.1 ± 34.20.78041.7 ± 33.941.9 ± 33.941.5 ± 34.00.734
SFA (%)6.15 ± 3.716.20 ± 3.715.85 ± 3.730.0035.92 ± 3.675.95 ± 3.585.89 ± 3.750.663
MUFA (%)6.00 ± 3.806.05 ± 3.785.71 ± 3.910.0065.80 ± 3.865.83 ± 3.815.76 ± 3.900.670
PUFA (%)5.20 ± 2.865.23 ± 2.875.05 ± 2.840.0185.13 ± 2.835.16 ± 2.835.09 ± 2.840.487
PUFA/SFA1.09 ± 0.711.08 ± 0.711.14 ± 0.770.0071.12 ± 0.741.11 ± 0.711.14 ± 0.760.213
(PUFA + MUFA)/SFA2.12 ± 0.962.11 ± 0.952.16 ± 1.020.0522.15 ± 0.982.13 ± 0.962.17 ± 1.010.246
N-3 PUFA (%)0.90 ± 0.890.89 ± 0.880.91 ± 0.900.5320.89 ± 0.820.88 ± 0.760.91 ± 0.870.286
N-6 PUFA (%)4.30 ± 2.474.33 ± 2.484.13 ± 2.400.0024.23 ± 2.434.28 ± 2.444.18 ± 2.410.245
N-6 PUFA
N-3 PUFA
6.79 ± 4.876.82 ± 4.966.62 ± 4.330.0766.63 ± 4.276.64 ± 4.266.62 ± 4.270.883
Cholesterol (mg)218.7 ± 210.8218.7 ± 208.9218.5 ± 222.10.972220.1 ± 220.6220.6 ± 219.3219.5 ± 222.10.889
Fiber (g)25.3 ± 14.425.2 ± 14.426.1 ± 14.40.02126.4 ± 14.426.6 ± 14.626.2 ± 14.30.491
Na (mg)3.3 ± 2.13.2 ± 2.13.6 ± 2.3<0.0013.6 ± 2.33.5 ± 2.43.6 ± 2.30.316
K (mg)2.8 ± 1.42.8 ± 1.42.9 ± 1.50.0022.9 ± 1.53.0 ± 1.52.9 ± 1.40.338
Na/K1.25 ± 0.671.23 ± 0.671.31 ± 0.67<0.0011.28 ± 0.671.26 ± 0.681.30 ± 0.660.049
Data are mean ± standard deviation. hTG, hypertriglyceridemia; SFA, saturated fatty acids; MUFA, monounsaturated fatty acids; PUFA, polyunsaturated fatty acids; N-3, omega-3; N-6, omega-6; Na, sodium; K, potassium. p-values were calculated using the independent t-test.
Table 5. Daily nutrient intake of study population according to the presence of hyper-low-density lipoprotein cholesterolemia alone or hypertriglyceridemia alone.
Before Propensity Score—MatchingAfter Propensity Score—Matching
Total
(N = 3040)
hTG-Only
(N = 1899)
hLDL-Only
(N = 1141)
p-ValueTotal
(N = 1598)
hTG-Only
(N = 799)
hLDL-Only
(N = 799)
p-Value
Total calories (kcal)1827.2 ± 805.01876.5 ± 833.91748.6 ± 750.3<0.0011906.6 ± 878.71938.3 ± 900.61875.4 ± 856.00.177
Carbohydrates (%)66.3 ± 11.966.6 ± 11.965.9 ± 11.80.14566.6 ± 11.867.8 ± 11.665.3 ± 11.9<0.001
Carbohydrates (g)296.9 ± 130.2305.7 ± 136.9282.8 ± 117.5<0.001296.0 ± 131.6303.0 ± 139.8289.0 ± 122.70.046
Proteins (%)14.8 ± 4.514.9 ± 4.514.7 ± 4.50.46914.7 ± 4.414.4 ± 4.115.0 ± 4.60.006
Proteins (g)68.4 ± 38.170.7 ± 39.464.7 ± 35.5<0.00167.0 ± 36.866.3 ± 36.067.7 ± 37.50.487
Fats (%)18.8 ± 9.718.5 ± 9.819.3 ± 9.60.03418.7 ± 9.717.8 ± 9.619.6 ± 9.70.003
Fats (g)40.7 ± 33.441.2 ± 33.939.8 ± 32.50.29840.1 ± 33.538.3 ± 31.741.9 ± 35.10.041
SFA (%)6.0 ± 3.75.9 ± 3.76.2 ± 3.60.0216.0 ± 3.75.7 ± 3.76.3 ± 3.60.004
MUFA (%)5.9 ± 3.95.8 ± 3.96.0 ± 3.90.0835.9 ± 3.95.6 ± 3.86.2 ± 4.00.003
PUFA (%)5.1 ± 2.85.1 ± 2.85.3 ± 2.90.0855.1 ± 2.84.8 ± 2.75.4 ± 2.9<0.001
PUFA/SFA1.11 ± 0.741.13 ± 0.761.07 ± 0.700.0371.11 ± 0.751.13 ± 0.771.09 ± 0.730.267
(PUFA + MUFA)/SFA2.13 ± 0.992.16 ± 1.012.07 ± 0.950.0322.14 ± 1.012.18 ± 1.042.11 ± 0.970.200
N-3 PUFA (%)0.92 ± 0.890.89 ± 0.870.95 ± 0.930.1170.91 ± 0.900.85 ± 0.790.97 ± 0.980.011
N-6 PUFA (%)4.21 ± 2.424.15 ± 2.414.30 ± 2.440.1364.18 ± 2.393.97 ± 2.304.38 ± 2.460.001
N-6 PUFA
N-3 PUFA
6.64 ± 4.456.69 ± 4.396.57 ± 4.550.5276.63 ± 4.556.60 ± 4.306.67 ± 4.790.782
Cholesterol (mg)217.9 ± 220.3220.7 ± 221.8213.5 ± 217.80.414212.6 ± 208.8205.3 ± 208.4219.8 ± 209.10.195
Fiber (g)25.7 ± 14.326.0 ± 14.325.2 ± 14.20.14726.0 ± 14.326.5 ± 14.725.4 ± 13.90.151
Na (mg)3.4 ± 2.23.6 ± 2.33.1 ± 2.0<0.0013.3 ± 2.13.4 ± 2.13.2 ± 2.10.246
K (mg)2.8 ± 1.42.9 ± 1.42.8 ± 1.30.0822.8 ± 1.42.8 ± 1.42.8 ± 1.30.724
Na/K1.26 ± 0.661.32 ± 0.671.18 ± 0.64<0.0011.22 ± 0.611.26 ± 0.631.19 ± 0.590.038
Data are mean ± standard deviation. LDL, low-density lipoprotein; hTG, hypertriglyceridemia; hLDL, hyper-LDL cholesterolemia; SFA, saturated fatty acids; MUFA, monounsaturated fatty acids; PUFA, polyunsaturated fatty acids; N-3, omega-3; N-6, omega-6; Na, sodium; K, potassium. p-values were calculated using the independent t-test.
Publisher’s Note: MDPI stays neutral with regard to jurisdictional claims in published maps and institutional affiliations.

