
Functional Frailty, Dietary Intake, and Risk of Malnutrition. Are Nutrients Involved in Muscle Synthesis the Key for Frailty Prevention?

 , , ,
, , ,  , , , , , ,
  and
and 
Abstract
:1. Introduction
2. Materials and Methods
2.1. Study Design and Participants
2.2. Ethics Statement
2.3. Short Physical Performance Battery
2.4. Anthropometrics and Body Composition Measurements
2.5. Mediterranean Diet Adherence
2.6. Mini Nutritional Assessment
2.7. Food Frequency Questionnaire
2.8. Statistical Analysis
3. Results
4. Discussion
5. Conclusions
Supplementary Materials
Author Contributions
Funding
Institutional Review Board Statement
Informed Consent Statement
Data Availability Statement
Acknowledgments
Conflicts of Interest
References
- Klein, B.E.; Klein, R.; Knudtson, M.D.; Lee, K.E. Frailty, morbidity and survival. Arch. Gerontol. Geriatr. 2005, 41, 141–149. [Google Scholar] [CrossRef] [PubMed]
- Xue, Q.-L. The Frailty Syndrome: Definition and Natural History. Clin. Geriatr. Med. 2011, 27, 1–15. [Google Scholar] [CrossRef] [Green Version]
- Fried, L.P.; Tangen, C.M.; Walston, J.D.; Newman, A.B.; Hirsch, C.; Gottdiener, J.S.; E Seeman, T.; Tracy, R.P.; Kop, W.J.; Burke, G.L.; et al. Frailty in Older Adults: Evidence for a Phenotype. J. Gerontol. Ser. A Boil. Sci. Med. Sci. 2001, 56, M146–M157. [Google Scholar] [CrossRef]
- Treacy, D.; Hassett, L. The Short Physical Performance Battery. J. Physiother. 2018, 64, 61. [Google Scholar] [CrossRef] [PubMed]
- Ramírez-Vélez, R.; De Asteasu, M.L.S.; Morley, J.E.; Cano-Gutierrez, C.A.; Izquierdo, M. Performance of the Short Physical Performance Battery in Identifying the Frailty Phenotype and Predicting Geriatric Syndromes in Community-Dwelling Elderly. J. Nutr. Health Aging 2021, 25, 209–217. [Google Scholar] [CrossRef]
- Buta, B.J.; Walston, J.D.; Godino, J.G.; Park, M.; Kalyani, R.R.; Xue, Q.-L.; Bandeen-Roche, K.; Varadhan, R. Frailty assessment instruments: Systematic characterization of the uses and contexts of highly-cited instruments. Ageing Res. Rev. 2016, 26, 53–61. [Google Scholar] [CrossRef] [Green Version]
- Pritchard, J.M.; Kennedy, C.C.; Karampatos, S.; Ioannidis, G.; Misiaszek, B.; Marr, S.; Patterson, C.; Woo, T.; Papaioannou, A. Measuring frailty in clinical practice: A comparison of physical frailty assessment methods in a geriatric out-patient clinic. BMC Geriatr. 2017, 17, 264. [Google Scholar] [CrossRef] [PubMed] [Green Version]
- Lim, Y.J.; Ng, Y.S.; Sultana, R.; Tay, E.L.; Mah, S.M.; Chan, C.H.N.; Latib, A.B.; Abu-Bakar, H.M.; Ho, J.C.Y.; Kwek, T.H.H.; et al. Frailty Assessment in Community-Dwelling Older Adults: A Comparison of 3 Diagnostic Instruments. J. Nutr. Health Aging 2020, 24, 582–590. [Google Scholar] [CrossRef]
- De Labra, C.; Guimaraes-Pinheiro, C.; Maseda, A.; Lorenzo, T.; Millán-Calenti, J.C. Effects of physical exercise interventions in frail older adults: A systematic review of randomized controlled trials. BMC Geriatr. 2015, 15, 154. [Google Scholar] [CrossRef] [Green Version]
- Lorenzo-López, L.; Maseda, A.; De Labra, C.; Regueiro-Folgueira, L.; Rodríguez-Villamil, J.L.; Millán-Calenti, J.C. Nutritional determinants of frailty in older adults: A systematic review. BMC Geriatr. 2017, 17, 108. [Google Scholar] [CrossRef] [Green Version]
- Cruz-Jentoft, A.J.; Kiesswetter, E.; Drey, M.; Sieber, C.C. Nutrition, frailty, and sarcopenia. Aging Clin. Exp. Res. 2017, 29, 43–48. [Google Scholar] [CrossRef]
- Cruz-Jentoft, A.J.; Bahat, G.; Bauer, J.; Boirie, Y.; Bruyère, O.; Cederholm, T.; Cooper, C.; Landi, F.; Rolland, Y.; Sayer, A.A.; et al. Sarcopenia: Revised European consensus on definition and diagnosis. Age Ageing 2019, 48, 16–31. [Google Scholar] [CrossRef] [Green Version]
- Azzolino, D.; Passarelli, P.C.; De Angelis, P.; Piccirillo, G.B.; D’Addona, A.; Cesari, M. Poor Oral Health as a Determinant of Malnutrition and Sarcopenia. Nutrients 2019, 11, 2898. [Google Scholar] [CrossRef] [Green Version]
- Starr, K.N.P.; McDonald, S.R.; Bales, C.W. Obesity and Physical Frailty in Older Adults: A Scoping Review of Lifestyle Intervention Trials. J. Am. Med. Dir. Assoc. 2014, 15, 240–250. [Google Scholar] [CrossRef] [Green Version]
- Kelaiditi, E.; van Kan, G.A.; Cesari, M. Frailty: Role of nutrition and exercise. Curr. Opin. Clin. Nutr. Metab. Care 2014, 17, 32–39. [Google Scholar] [CrossRef]
- O’Connell, M.L.; Coppinger, T.; McCarthy, A.L. The role of nutrition and physical activity in frailty: A review. Clin. Nutr. ESPEN 2020, 35, 1–11. [Google Scholar] [CrossRef]
- Coelho-Júnior, H.J.; Calvani, R.; Picca, A.; Gonçalves, I.O.; Landi, F.; Bernabei, R.; Cesari, M.; Uchida, M.C.; Marzetti, E. Protein-Related Dietary Parameters and Frailty Status in Older Community-Dwellers across Different Frailty Instruments. Nutrients 2020, 12, 508. [Google Scholar] [CrossRef] [Green Version]
- Bollwein, J.; Diekmann, R.; Kaiser, M.J.; Bauer, J.M.; Uter, W.; Sieber, C.C.; Volkert, D. Distribution but not amount of protein intake is associated with frailty: A cross-sectional investigation in the region of Nürnberg. Nutr. J. 2013, 12, 109. [Google Scholar] [CrossRef] [Green Version]
- Das, A.; Cumming, R.G.; Naganathan, V.; Blyth, F.; Ribeiro, R.V.; Le Couteur, D.G.; Handelsman, D.J.; Waite, L.M.; Simpson, S.J.; Hirani, V. Prospective Associations Between Dietary Antioxidant Intake and Frailty in Older Australian Men: The Concord Health and Ageing in Men Project. J. Gerontol. Ser. A Boil. Sci. Med. Sci. 2019, 75, 348–356. [Google Scholar] [CrossRef]
- Morante, J.J.H.; Martínez, C.G.; Morillas-Ruiz, J.M. Dietary Factors Associated with Frailty in Old Adults: A Review of Nutritional Interventions to Prevent Frailty Development. Nutrients 2019, 11, 102. [Google Scholar] [CrossRef] [Green Version]
- Fernández-García, Á.I.; Gómez-Cabello, A.; Moradell, A.; Navarrete-Villanueva, D.; Pérez-Gómez, J.; Ara, I.; Pedrero-Chamizo, R.; Subías-Perié, J.; Muniz-Pardos, B.; Casajús, J.A.; et al. How to Improve the Functional Capacity of Frail and Pre-Frail Elderly People? Health, Nutritional Status and Exercise Intervention. The EXERNET-Elder 3.0 Project. Sustainability 2020, 12, 6246. [Google Scholar] [CrossRef]
- Folstein, M.F.; Folstein, S.E.; McHugh, P.R. “Mini-mental state”: A practical method for grading the cognitive state of patients for the clinician. J. Psychiatr. Res. 1975, 12, 189–198. [Google Scholar] [CrossRef]
- Fernandez-Ballart, J.D.; Pinol, J.L.; Zazpe, I.; Corella, D.; Carrasco, P.; Toledo, E.; Perez-Bauer, M.; Martinez-Gonzalez, M.; Salas-Salvado, J.; Martin-Moreno, J. Relative validity of a semi-quantitative food-frequency questionnaire in an elderly Mediterranean population of Spain. Br. J. Nutr. 2010, 103, 1808–1816. [Google Scholar] [CrossRef] [Green Version]
- Guralnik, J.M.; Simonsick, E.M.; Ferrucci, L.; Glynn, R.J.; Berkman, L.F.; Blazer, D.G.; Scherr, P.A.; Wallace, R.B. A Short Physical Performance Battery Assessing Lower Extremity Function: Association With Self-Reported Disability and Prediction of Mortality and Nursing Home Admission. J. Gerontol. 1994, 49, M85–M94. [Google Scholar] [CrossRef]
- Trichopoulou, A.; A Martínez-González, M.; Tong, T.Y.; Forouhi, N.G.; Khandelwal, S.; Prabhakaran, D.; Mozaffarian, D.; De Lorgeril, M. Definitions and potential health benefits of the Mediterranean diet: Views from experts around the world. BMC Med. 2014, 12, 112. [Google Scholar] [CrossRef] [Green Version]
- Vellas, B.; Guigoz, Y.; Garry, P.J.; Nourhashemi, F.; Bennahum, D.; Lauque, S.; Albarede, J.L. The Mini Nutritional Assessment (MNA) and its use in grading the nutritional state of elderly patients. Nutrition 1999, 15, 116–122. [Google Scholar] [CrossRef]
- Bauer, J.M.; Kaiser, M.J.; Anthony, P.; Guigoz, Y.; Sieber, C.C. The Mini Nutritional Assessment®—Its History, Today’s Practice, and Future Perspectives. Nutr. Clin. Pr. 2008, 23, 388–396. [Google Scholar] [CrossRef]
- Martin-Moreno, J.M.; Boyle, P.; Gorgojo, L.; Maisonneuve, P.; Fernandez-Rodriguez, J.C.; Salvini, S.; Willett, W.C. Development and validation of a food frequency questionnaire in Spain. Int. J. Epidemiol. 1993, 22, 512–519. [Google Scholar] [CrossRef] [PubMed]
- Moreiras, O.; Carbajal, A.; Cabrera, L.C.C. Tablas de Composición de los Alimentos. GUÍA de Prácticas; Ed.Pirámide: Madrid, Spain, 2015. [Google Scholar]
- Mataix, J. Tabla de Composición de Alimentos, 5th ed.; Universidad de Granada: Granada, Spain, 2009. [Google Scholar]
- EFSA. Dietary Reference Values for Nutrients Summary Report; Wiley Online Library: Hoboken, NJ, USA, 2017. [Google Scholar]
- Michel, J.P.; Cruz-Jentoft, A.J.; Cederholm, T. Frailty, Exercise and Nutrition. Clin. Geriatr. Med. 2015, 31, 375–387. [Google Scholar] [CrossRef] [PubMed]
- Dupont, J.; Dedeyne, L.; Dalle, S.; Koppo, K.; Gielen, E. The role of omega-3 in the prevention and treatment of sarcopenia. Aging Clin. Exp. Res. 2019, 31, 825–836. [Google Scholar] [CrossRef] [PubMed] [Green Version]
- Gray, S.R.; Mittendorfer, B. Fish oil-derived n-3 polyunsaturated fatty acids for the prevention and treatment of sarcopenia. Curr. Opin. Clin. Nutr. Metab. Care 2018, 21, 104–109. [Google Scholar] [CrossRef] [Green Version]
- Balboa-Castillo, T.; A Struijk, E.; Lopez-Garcia, E.; Banegas, J.R.; Rodríguez-Artalejo, F.; Guallar-Castillon, P. Low vitamin intake is associated with risk of frailty in older adults. Age Ageing 2018, 47, 872–879. [Google Scholar] [CrossRef] [Green Version]
- Schoufour, J.D.; Franco, O.H.; Jong, J.C.K.-D.; Trajanoska, K.; Stricker, B.; Brusselle, G.; Rivadeneira, F.; LaHousse, L.; Voortman, T. The association between dietary protein intake, energy intake and physical frailty: Results from the Rotterdam Study. Br. J. Nutr. 2019, 121, 393–401. [Google Scholar] [CrossRef] [Green Version]
- Sandoval-Insausti, H.; Pérez-Tasigchana, R.F.; López-García, E.; García-Esquinas, E.; Rodríguez-Artalejo, F.; Guallar-Castillón, P. Macronutrients Intake and Incident Frailty in Older Adults: A Prospective Cohort Study. J. Gerontol. Ser. A Boil. Sci. Med. Sci. 2016, 71, 1329–1334. [Google Scholar] [CrossRef]
- Morley, J.E.; Vellas, B.; Van Kan, G.A.; Anker, S.D.; Bauer, J.M.; Bernabei, R.; Cesari, M.; Chumlea, W.; Doehner, W.; Evans, J.; et al. Frailty Consensus: A Call to Action. J. Am. Med. Dir. Assoc. 2013, 14, 392–397. [Google Scholar] [CrossRef] [Green Version]
- Soysal, P.; Veronese, N.; Arik, F.; Kalan, U.; Smith, L.; Isik, A.T. Mini Nutritional Assessment Scale-Short Form can be useful for frailty screening in older adults. Clin. Interv. Aging 2019, 14, 693–699. [Google Scholar] [CrossRef] [Green Version]
- Salminen, K.S.; Suominen, M.H.; Kautiainen, H.; Pitkälä, K.H. Associations Between Nutritional Status, Frailty and Health-Related Quality of Life Among Older Long-Term Care Residents in Helsinki. J. Nutr. Health Aging 2020, 24, 319–324. [Google Scholar] [CrossRef] [Green Version]
- Rizzoli, R.; Reginster, J.-Y.; Arnal, J.-F.; Bautmans, I.; Beaudart, C.; Bischoff-Ferrari, H.; Biver, E.; Boonen, S.; Brandi, M.-L.; Chines, A.; et al. Quality of Life in Sarcopenia and Frailty. Calcif. Tissue Int. 2013, 93, 101–120. [Google Scholar] [CrossRef]
- Welch, A.A.; Jennings, A.; Kelaiditi, E.; Skinner, J.; Steves, C.J. Cross-Sectional Associations Between Dietary Antioxidant Vitamins C, E and Carotenoid Intakes and Sarcopenic Indices in Women Aged 18–79 Years. Calcif. Tissue Int. 2020, 106, 331–342. [Google Scholar] [CrossRef] [Green Version]
- Behrouzi, P.; Grootswagers, P.; Keizer, P.L.C.; Smeets, E.T.H.C.; Feskens, E.J.M.; De Groot, L.C.P.G.M.; A Van Eeuwijk, F. Dietary Intakes of Vegetable Protein, Folate, and Vitamins B-6 and B-12 Are Partially Correlated with Physical Functioning of Dutch Older Adults Using Copula Graphical Models. J. Nutr. 2020, 150, 634–643. [Google Scholar] [CrossRef]
- Van Dronkelaar, C.; Van Velzen, A.; Abdelrazek, M.; Van Der Steen, A.; Weijs, P.J.; Tieland, M. Minerals and Sarcopenia; The Role of Calcium, Iron, Magnesium, Phosphorus, Potassium, Selenium, Sodium, and Zinc on Muscle Mass, Muscle Strength, and Physical Performance in Older Adults: A Systematic Review. J. Am. Med. Dir. Assoc. 2018, 19, 6–11.e3. [Google Scholar] [CrossRef]
- Arnaud, M.J. Update on the assessment of magnesium status. Br. J. Nutr. 2008, 99, S24–S36. [Google Scholar] [CrossRef] [Green Version]
- Stocks, J.; Valdes, A.M. Effect of dietary omega-3 fatty acid supplementation on frailty-related phenotypes in older adults: A systematic review and meta-analysis protocol. BMJ Open 2018, 8, e021344. [Google Scholar] [CrossRef]
- De Koning, E.J.; Van Schoor, N.M.; Penninx, B.W.; Elders, P.J.; Heijboer, A.C.; Smit, J.H.; Bet, P.M.; Van Tulder, M.W.; Heijer, M.D.; Van Marwijk, H.W.; et al. Vitamin D supplementation to prevent depression and poor physical function in older adults: Study protocol of the D-Vitaal study, a randomized placebo-controlled clinical trial. BMC Geriatr. 2015, 15, 151. [Google Scholar] [CrossRef] [Green Version]
- Oktaviana, J.; Zanker, J.; Vogrin, S.; Duque, G. The effect of protein supplements on functional frailty in older persons: A systematic review and meta-analysis. Arch. Gerontol. Geriatr. 2020, 86, 103938. [Google Scholar] [CrossRef]
- Buhl, S.F.; Beck, A.M.; Christensen, B.; Caserotti, P. Effects of high-protein diet combined with exercise to counteract frailty in pre-frail and frail community-dwelling older adults: Study protocol for a three-arm randomized controlled trial. Trials 2020, 21, 637. [Google Scholar] [CrossRef]


| Whole Sample (n = 101) | Robust (n = 13) | Pre-Frail (n = 68) | Frail (n = 20) | p Value | |
|---|---|---|---|---|---|
| Sex | 0.317 | ||||
| Males | 23 (22.8) | 1 (7.7) | 18 (26.5) | 4 (20.0) | |
| Females | 78 (77.2) | 12 (92.3) | 50 (73.5) | 16 (80.0) | |
| Age (years) | 80.4 ± 6.0 | 77.3 ± 5.4 | 80.0 ± 5.8 | 83.0 ± 5.7 | 0.005 |
| BMI (kg/m2) | 29.4 ± 5.4 | 27.2 ± 3.0 | 29.9 ± 5.0 | 29.4 ± 7.1 | 0.262 |
| Weight (kg) | 72.3 ± 14.2 | 66.0 ± 7.0 | 74.8 ± 13.7 | 69.2 ± 16.5 | 0.038 |
| BF% | 37.4 ± 6.9 | 37.6 ± 4.9 | 37.9 ± 7.1 | 36.2 ± 7.4 | 0.569 |
| FFM (kg) | 44.7 ± 8.7 | 41.0 ± 3.5 | 46.2 ± 9.3 | 43.1 ± 8.4 | 0.061 |
| MNA | 23.1 ± 3.1 | 24.6 ± 1.9 | 23.6 ± 3.0 | 21.2 ± 2.8 | <0.001 |
| Risk of malnutrition | 42 (41.6) | 3 (23.0) | 23 (33.8) | 16 (80.0) | <0.001 |
| No risk of malnutrition | 59 (58.4) | 10 (77.0) | 45 (66.2) | 4 (20.0) | |
| ADM | 7.6 ± 0.95 | 8.3 ± 2.4 | 7.5 ± 1.2 | 7.5 ± 2.7 | 0.363 |
| Low ADM | 78 (77.2) | 7 (53.8) | 54 (79.4) | 17 (85.0) | |
| High ADM | 23 (22.8) | 6 (46.2) | 14 (20.6) | 3 (15.0) | |
| Smoking | 3 (3.0) | 0 (0.0) | 3 (4.4) | 0 (.055) | 0.643 |
| MMSE | 26.6 ± 2.8 | 27.0 ± 3.0 | 26.8 ± 2.6 | 25.5 ± 2.8 | 0.134 |
| Robust (n = 13) | Pre-Frail (n = 68) | Frail (n = 20) | p Value | |
|---|---|---|---|---|
| Yogurt (g/day) | 71.2 ± 64.0 | 77.6 ± 62.0 | 88.2 ± 90.5 | 0.735 |
| Milk (g/day) | 190.0 ± 180.7 | 228.3 ± 167.5 | 300.0 ± 184.2 | 0.120 |
| Cheese (g/day) | 61.3 ± 41.1 | 27.0 ± 24.4 * | 37.2 ± 44.1 * | 0.002 |
| Eggs (g/day) | 27.4 ± 13.5 | 25.5 ± 12.8 | 25.1 ± 15.9 | 0.882 |
| Red meat (g/day) | 62.8 ± 51.0 | 57.7 ± 39.6 | 49.64 ± 6 | 0.614 |
| White meat (g/day) | 81.2 ± 71.7 | 64.6 ± 32.4 | 61.3 ± 41.1 | 0.331 |
| Lean meat products (g/day) | 32.6 ± 23 | 23.8 ± 20.9 | 19.1 ± 16.2 | 0.161 |
| Fat meat products (g/day) | 14.3 ± 19.5 | 11.4 ± 11.7 | 13.2 ± 12.6 | 0.671 |
| White fish (g/day) | 51.0 ± 30.1 | 45.5 ± 29.0 | 45.0 ± 30.5 | 0.809 |
| Oily fish (g/day) | 36.2 ± 41.1 | 25.2 ± 25.7 | 15.8 ± 17.5 | 0.079 |
| Seafood (g/day) | 25.3 ± 29.4 | 22.9 ± 28.6 | 30.4 ± 35.9 | 0.490 |
| Vegetables (g/day) | 463.9 ± 237.2 | 444.6 ± 218.1 | 391.34 ± 221.6 | 0.511 |
| Fruit (g/day) | 481.9 ± 222.0 | 454.4 ± 236.0 | 517.5 ± 637.6 | 0.753 |
| Nuts (g/day) | 42.1 ±43.30 | 33.6 ± 56.7 | 36.76 ± 58.7 | 0.871 |
| Legumes (g/day) | 22.8 ± 12.9 | 22.3 ± 13.5 | 28.6 ± 19.8 | 0.195 |
| Cereals and potatoes (g/day) | 169.9 ± 95.7 | 210 ± 106.6 | 200.5 ± 81.0 | 0.402 |
| Olive oil (g/day) | 32.9 ± 21.1 | 31.4 ± 21.6 | 31.1 ± 18.1 | 0.964 |
| Fats and other oils (g/day) | 4.5 ± 5.5 | 5.0 ± 6.7 | 3.86 ± 5.4 | 0.728 |
| Fruit juices and beverages (g/day) | 84.5 ± 91.9 | 67.3 ± 97.4 | 90.8 ± 127.3 | 0.964 |
| Coffee and tea (g/day) | 73.3 ± 52.1 | 57.6 ± 44.2 | 48.4 ± 58.5 | 0.331 |
| Savory snacks (g/day) | 48.3 ± 58.3 | 52.8 ± 71.1 | 92.3 ± 96.6 | 0.076 |
| Sweet snacks (g/day) | 92.1 ± 74.3 | 100.1 ± 75.6 | 107.6 ± 62.9 | 0.817 |
| Alcoholic consumers | (n = 10) | (n = 54) | (n = 15) | |
| Beer (g/day) | 65.7 ± 101.9 | 77.5 ± 169.0 | 13.8 ± 36.4 | 0.337 |
| Wine (g/day) | 48.8 ± 45.72 | 68.4 ± 76.8 | 66.6 ± 68.1 | 0.732 |
| Nutrient Intake | AI or PRI (M/F) | Robust (%) | Pre-Frail (%) | Frail (%) | p value |
|---|---|---|---|---|---|
| Retinol equivalents (ug/day) | 750/650 | 100 | 97.1 | 95.0 | 0.710 |
| Vitamin D (μg/day) | 15 | 15.4 | 0.0 | 0.0 | 0.001 |
| Vitamin E (mg/day) | 13/11 | 53.8 | 47.1 | 40 | 0.730 |
| Ascorbic acid (C) (mg/day) | 110/95 | 100.0 | 100.0 | 100.0 | NC |
| Thiamine (B1) (mg/day) | 1/0.8 | 100.0 | 100.0 | 100.0 | NC |
| Riboflavin (B2) (mg/day) | 1.6 | 100.0 | 77.9 | 70.0 | 0.105 |
| Niacin equivalents (B3) (mg/day) | 15.4/12.5 | 100.0 | 100.0 | 100.0 | NC |
| Pyridoxin (B6) (mg/day) | 1.7/1.6 | 100.0 | 94,1 | 90.0 | 0.494 |
| Folic acid (B9) (μg/day) | 330 | 92.3 | 85.3 | 72.0 | 0.373 |
| Cobalamin (B12) (ug/day) | 4 | 100.0 | 95.6 | 70.0 | 0.001 |
| Calcium (mg/day) | 950 | 76.9 | 60.3 | 76.9 | 0.427 |
| Iron (mg/day) | 11 | 100.0 | 100.0 | 100.0 | NC |
| Magnesium (mg/day) | 300 | 100.0 | 91.2 | 90.0 | 0.519 |
| Potassium (mg/day) | 3500 | 100.0 | 92.6 | 90.0 | 0.528 |
| Iodine (μg/day) | 150 | 84.6 | 80.9 | 85.0 | 0.887 |
| Selenium (μg/day) | 70 | 92.3 | 83.8 | 92.3 | 0.417 |
| Zinc (mg/day) | 16.3/12.7 | 69.2 | 38.2 | 35.0 | 0.092 |
| Phosphorus (mg/day) | 550 | 100.0 | 100.0 | 100 | NC |
| Nutrient intake | Robust (n = 13) | Pre-Frail (n = 68) | Frail (n = 20) | p Value |
|---|---|---|---|---|
| Mean (SD) | Mean (SD) | Mean (SD) | ||
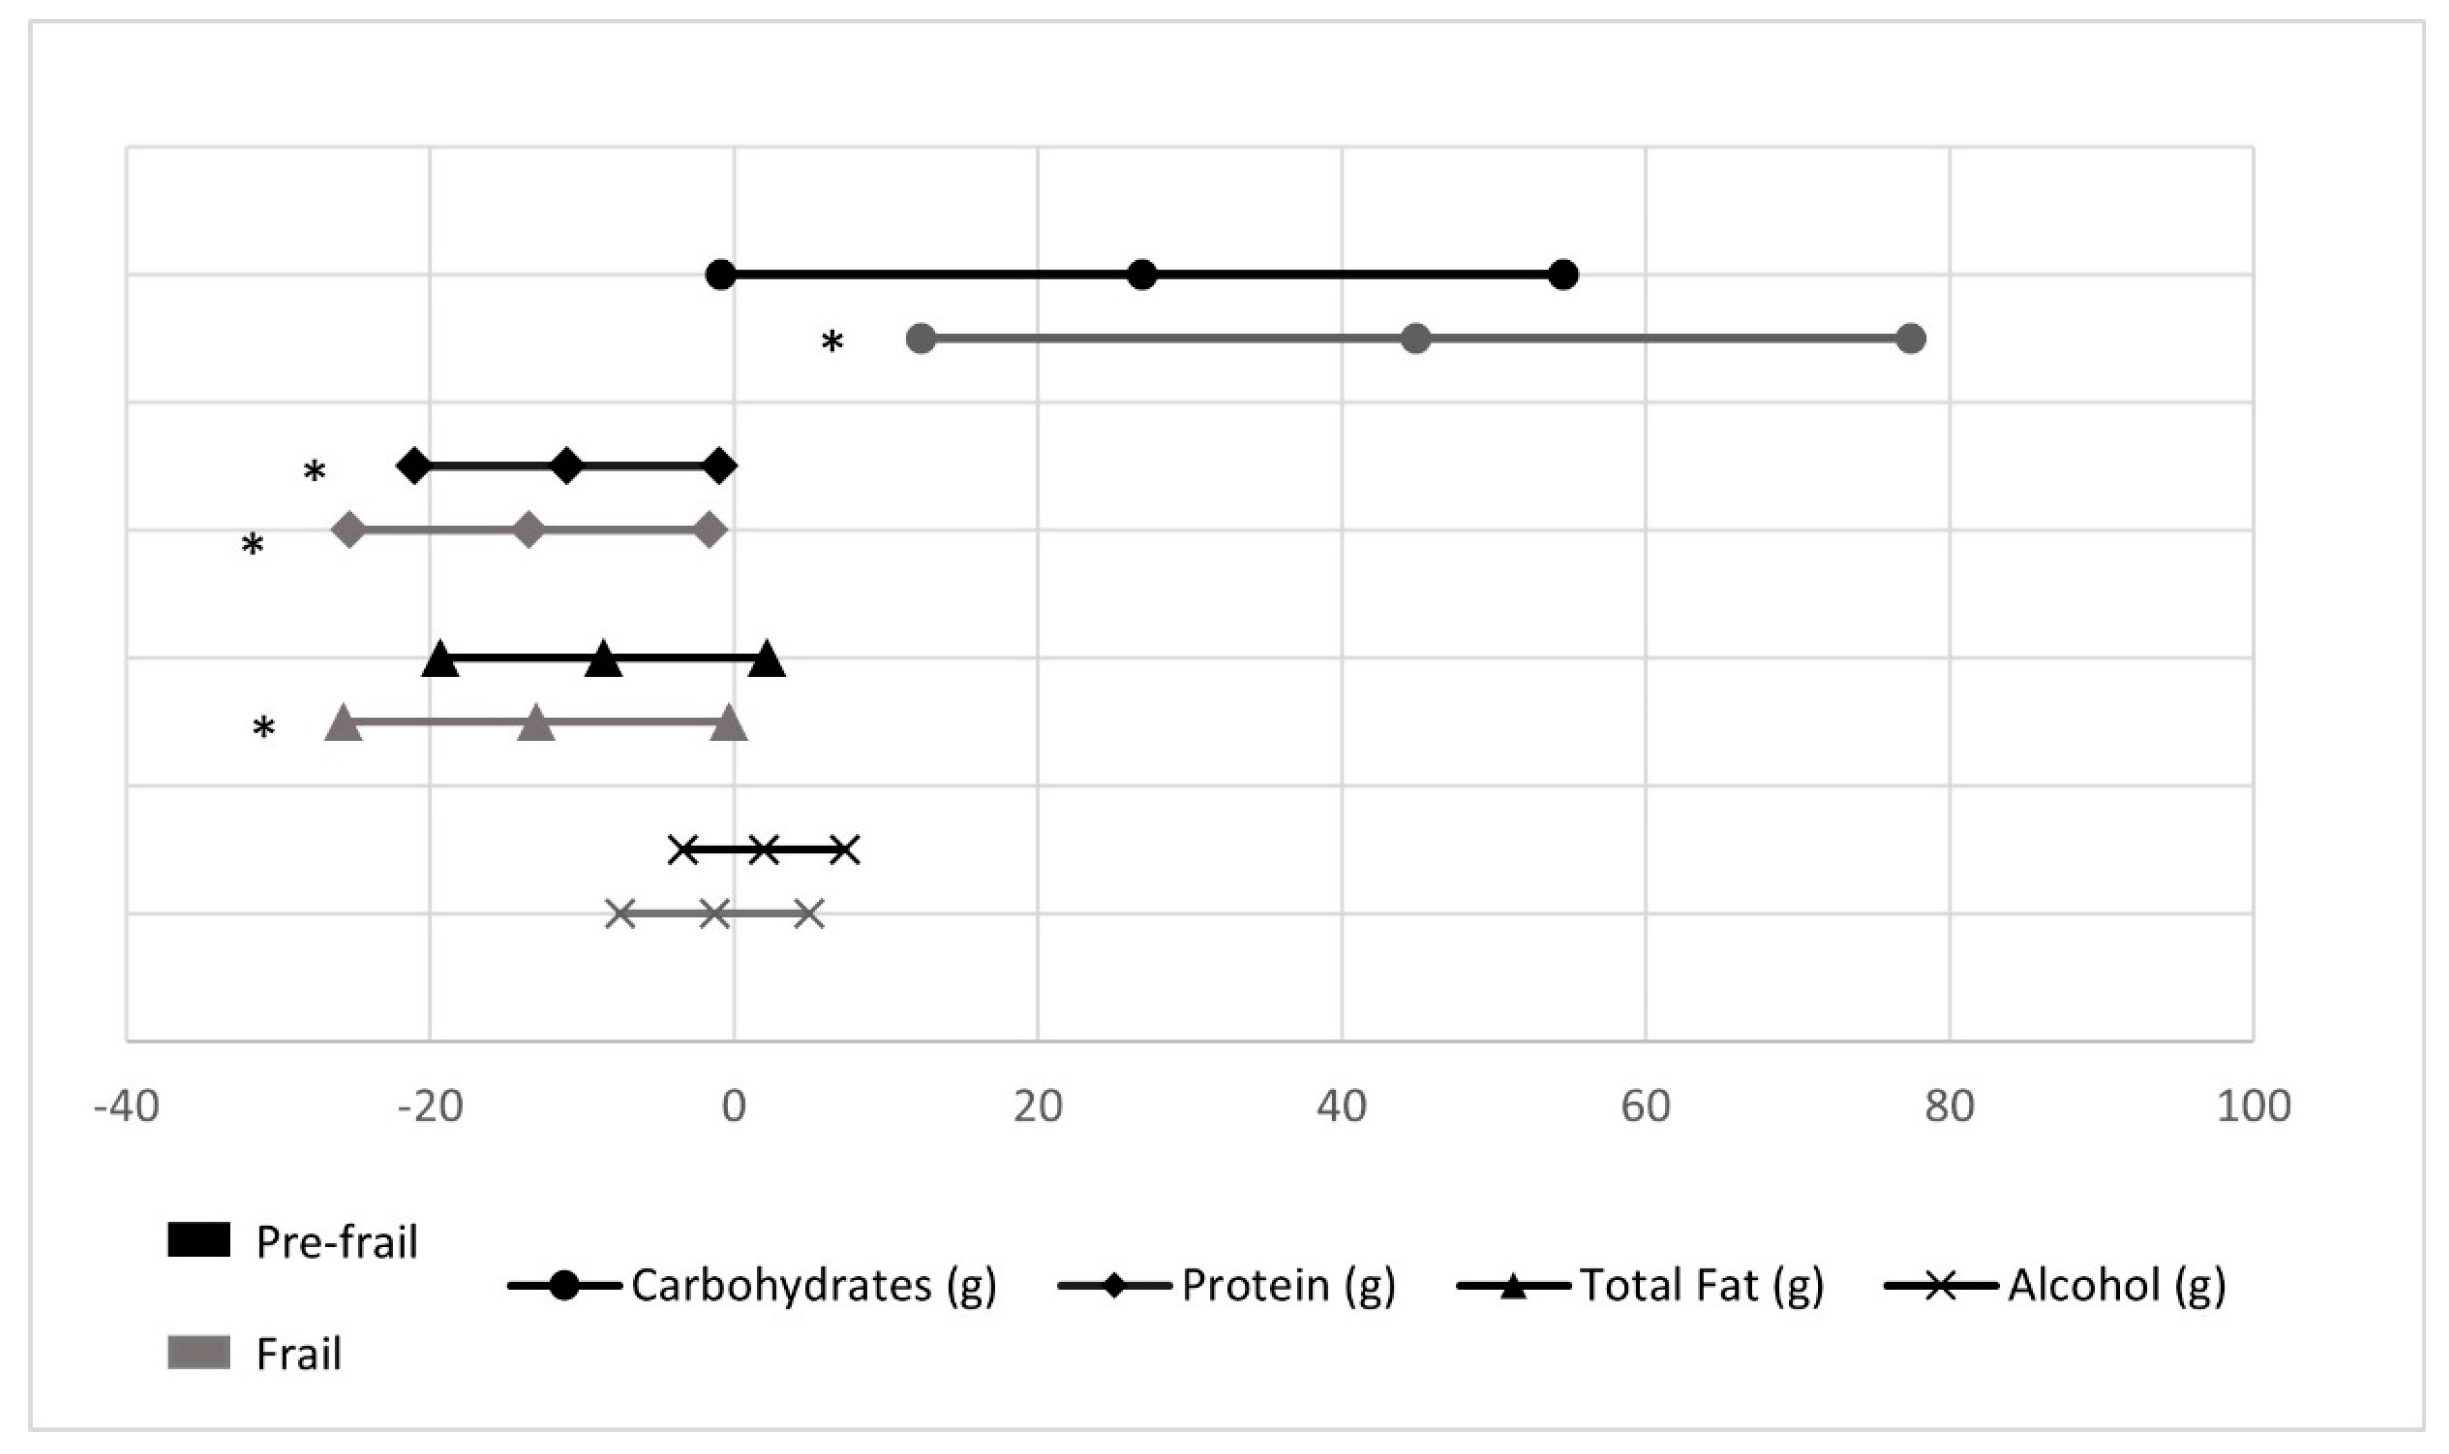
| Carbohydrates (g/day) | 234.3 ± 12.8 a | 261.1 ± 5.6 | 279.1 ± 10.3 | 0.027 |
| Protein (g/day) | 112.7 ± 4.6 a | 101.6 ± 2.0 b | 99.2 ± 3.7 | 0.062 |
| Total fat (g/day) | 114.9 ± 5.0 | 106.3 ± 2.2 | 101.9 ± 4.0 | 0.130 |
| Alcohol (g/day) | 4.1 ± 2.5 | 6.1 ± 1.1 | 2.9 ± 2.0 | 0.319 |
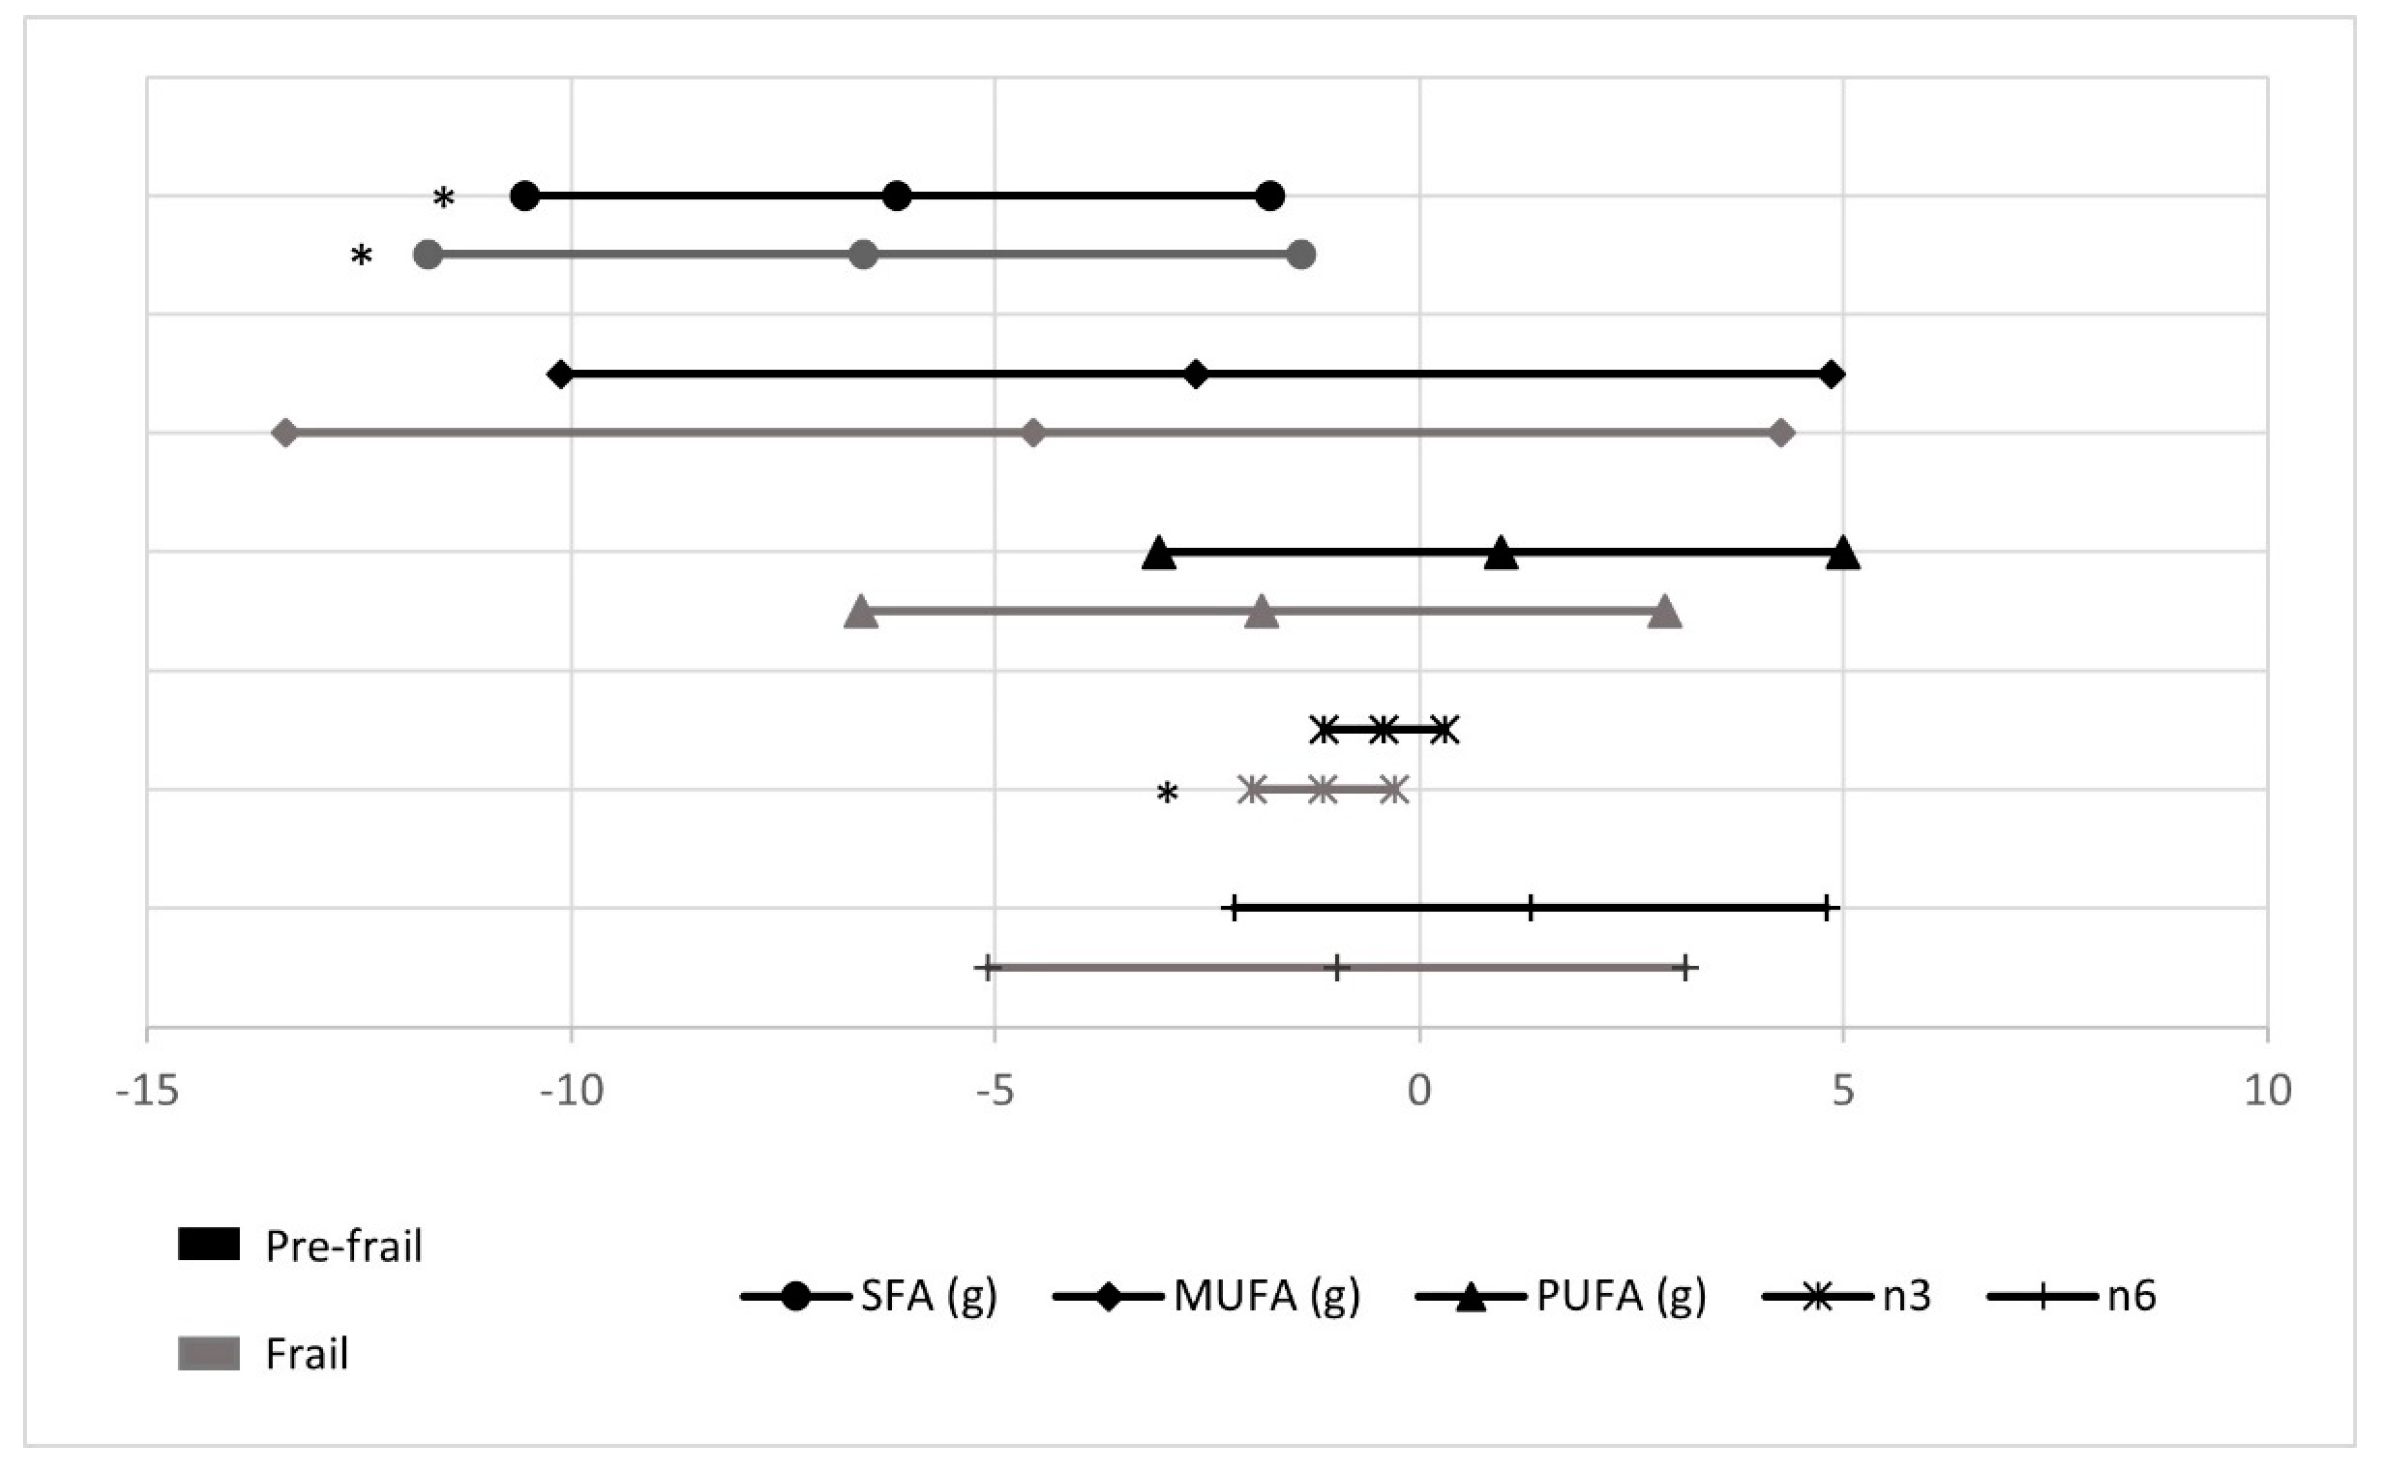
| n-3 (g/day) | 3.2 ± 0.3 a | 2.8 ± 0.1 | 2.0 ± 0.2 | 0.018 |
| n-6 (g/day) | 14.2 ± 1.6 | 15.5 ± 0.7 | 13.3 ± 1.3 | 0.277 |
| MUFA (g/day) | 51.5 ± 3.5 | 48.8 ± 1.5 | 46.9 ± 2.8 | 0.591 |
| PUFA (g/day) | 18.0 ± 1.9 | 19.0 ± 0.8 | 16.2 ± 1.5 | 0.254 |
| SFA (g/day) | 36.1 ± 2.0 a | 30.0 ± 0.9 b | 29.6 ± 1.6 | 0.018 |
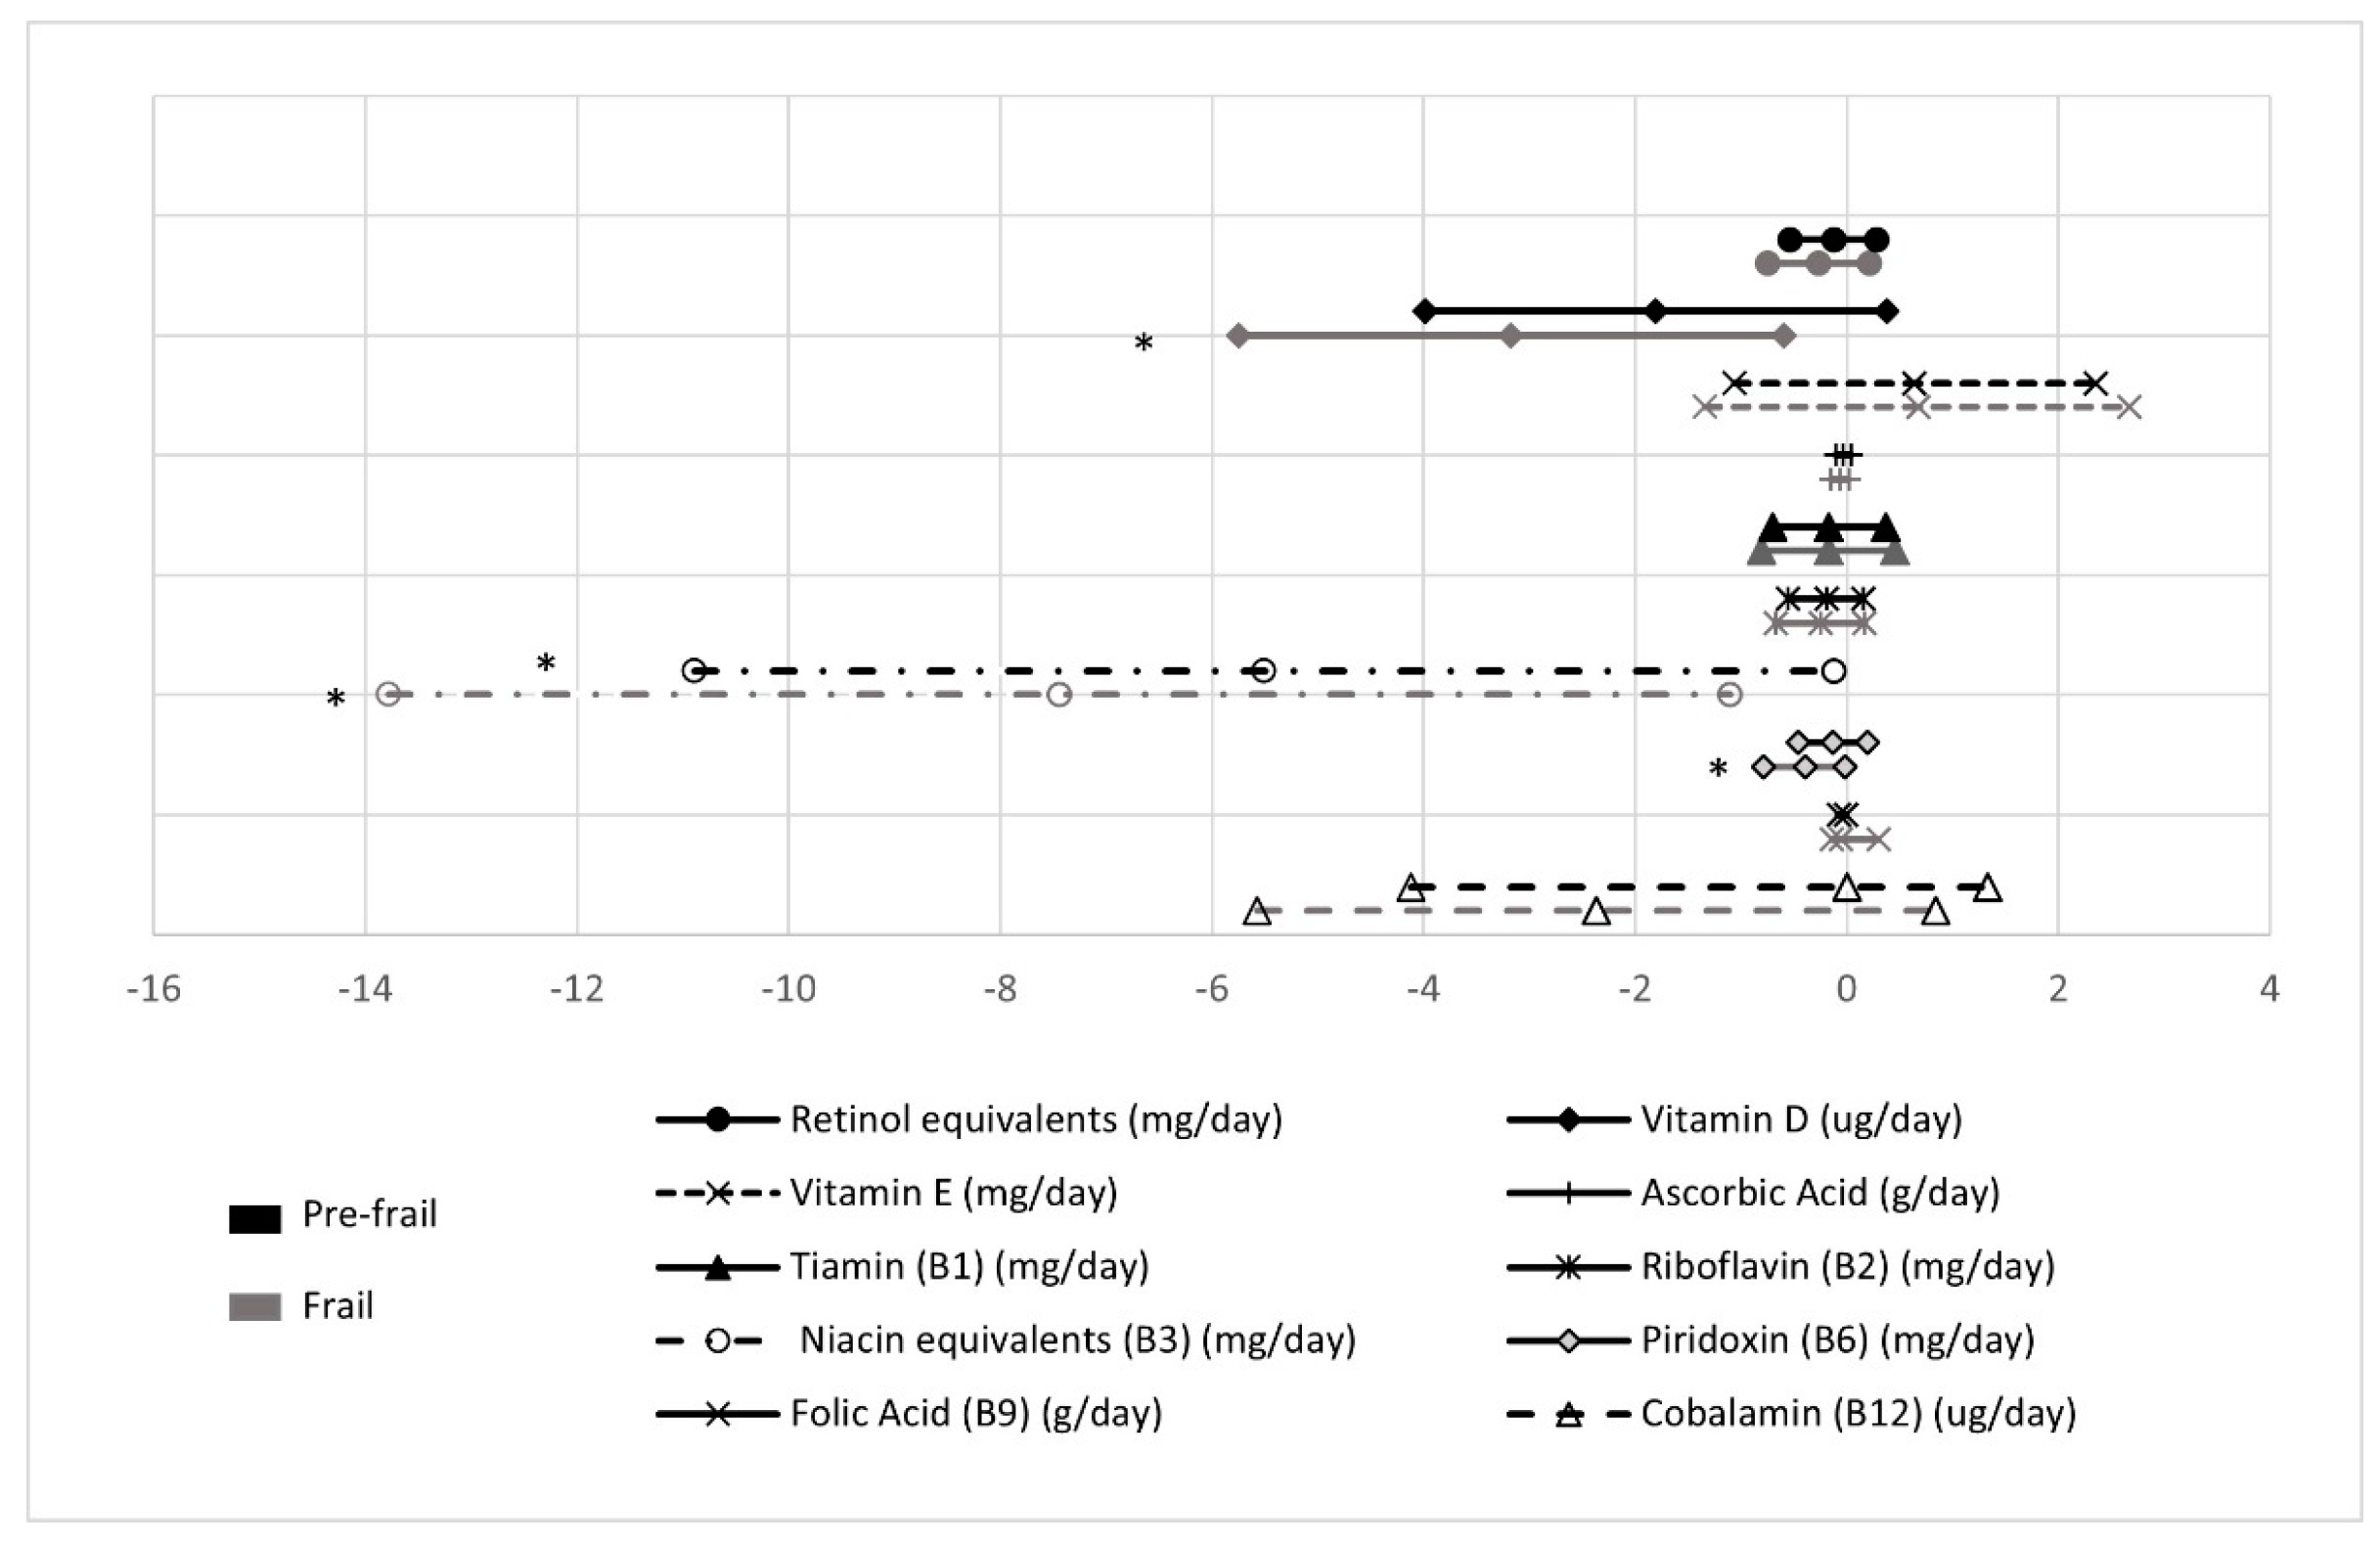
| Retinol equivalents (μg/day) | 1737.9 ± 189.3 | 1612.1 ± 82.6 | 1470.0 ± 152.2 | 0.530 |
| Vitamin D (μg/day) | 7.8 ± 1.0 a | 6.0 ± 0.4 | 4.6 ± 0.8 | 0.054 |
| Vitamin E (mg/day) | 10.9 ± 0.8 | 11.5 ± 0.3 | 11.6 ± 0.6 | 0.745 |
| Ascorbic acid (mg/day) | 306.3 ± 32.7 | 273.0 ± 14.3 | 237.0 ± 26.3 | 0.246 |
| Thiamine (B1) (mg/day) | 2.8 ± 0.3 | 2.6 ± 0.1 | 2.6 ± 0.2 | 0.801 |
| Riboflavin (B2) (mg/day) | 2.4 ± 0.2 | 2.2 ± 0.7 | 2.1 ± 0.1 | 0.460 |
| Niacin equivalents (B3) (mg/day) | 48.5 ± 2.5 | 43.0 ± 1.1 | 41.1 ± 2.0 | 0.063 |
| Pyridoxin (B6) (mg/day) | 2.8 ± 0.2 | 2.6 ± 0.6 | 2.4 ± 0.1 | 0.076 |
| Folic acid (B9) (μg/day) | 461.1 ± 33.8 | 450.4 ± 14.7 | 405.1 ± 27.2 | 0.294 |
| Cobalamin (B12) (ug/day) | 11.2 ± 1.3 | 9.8 ± 0.6 | 8.9 ± 1.0 | 0.346 |
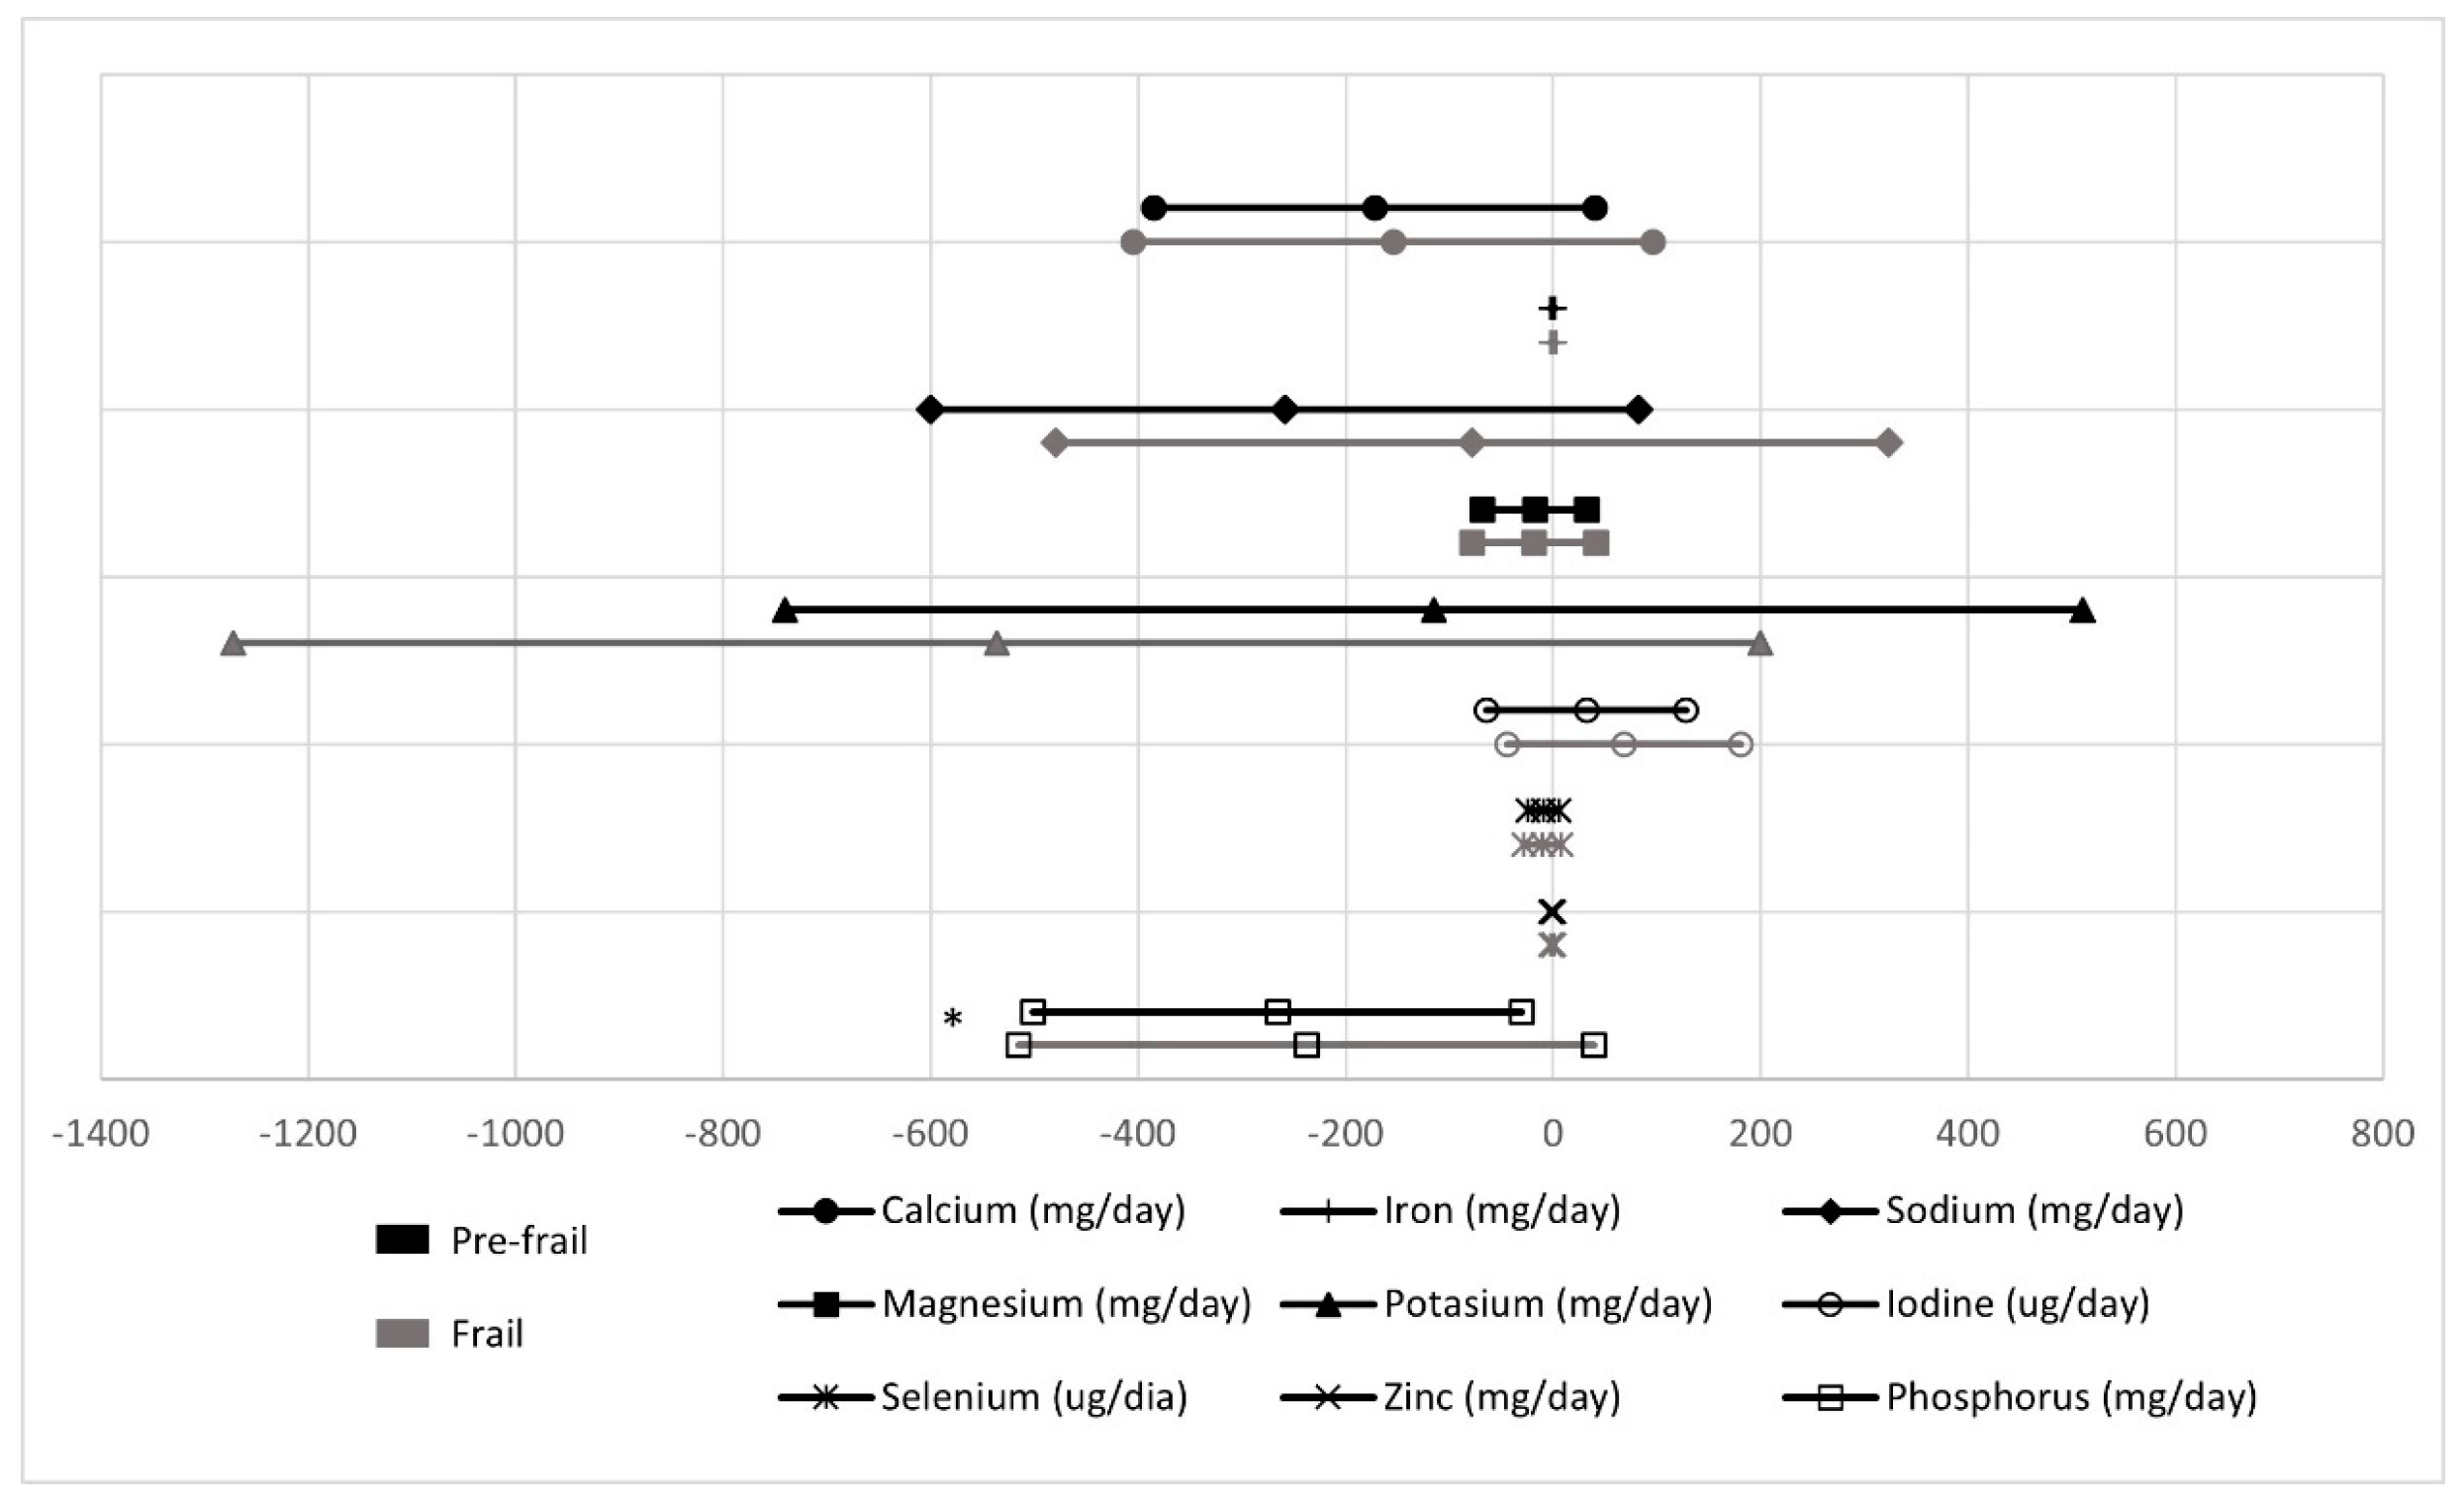
| Calcium (mg/day) | 1299.7 ± 98.2 | 1127.5 ± 42.8 | 1145.4 ± 78.9 | 0.278 |
| Iron (mg/day) | 18.1 ± 1.0 | 17.8 ± 0.4 | 17.75 ± 0.8 | 0.956 |
| Sodium (mg/day) | 2710.1 ± 157.6 | 2451.3 ± 68.7 | 2632.1 ± 126.7 | 0.204 |
| Magnesium (mg/day) | 446.3 ± 13.3 | 428.7 ± 10.2 | 427.8 ± 18.7 | 0.777 |
| Potassium (mg/day) | 5158.5 ± 288.8 | 5043.7 ± 126.0 | 4622.2 ± 32.2 | 0.227 |
| Iodine (ug/day) | 280.7 ± 44.2 | 312.7 ± 19.3 | 349.2 ± 35.6 | 0.467 |
| Selenium (μg/day) | 112.5 ± 6.9 | 103.1 ± 3.0 | 102.3 ± 5.6 | 0.431 |
| Zinc (mg/day) | 14.0 ± 0.6 | 13.0 ± 0.3 | 13.2 ± 0.5 | 0.389 |
| Phosphorus (mg/day) | 2152.1 ± 108.7 | 1886.7 ± 47.4 | 1914.4 ± 87.4 | 0.086 |
| Nutrient Intake | At Risk of Malnutrition (n = 26) | No Risk of Malnutrition (n = 55) | p Value |
|---|---|---|---|
| Mean (SD) | Mean (SD) | ||
| Energy (kcal) | 2485.3 ± 619.0 | 2444.5 ± 557.0 | 0.767 |
| Carbohydrates (%) | 42.3 ± 7.7 | 42.2 ± 7.2 | 0.959 |
| Protein (%) | 15.9 ± 3.3 | 17.6 ± 2.5 | 0.013 |
| Total fat (%) | 39.2 ± 7.0 | 39.1 ± 6.9 | 0.939 |
| Alcohol (g) | 2.6 ± 3.6 | 1.1 ± 1.9 | 0.020 |
| n-3 (mg/day) | 2.3 ± 1.0 | 3.2 ± 1.7 | 0.016 |
| n-6 (mg/day) | 15.3 ± 7.8 | 15.4 ± 7.7 | 0.924 |
| MUFA (%) | 18.4 ± 4.8 | 17.7 ± 4.7 | 0.559 |
| PUFA (%) | 6.3 ± 2.0 | 7.0 ± 2.7 | 0.258 |
| SFA (%) | 11.3 ± 2.7 | 11.2 ± 3.0 | 0.846 |
| Retinol equivalents (ug/day) | 1386.1 ± 552.8 | 1751.1 ± 722.4 | 0.025 |
| Vitamin D (μg/day) | 5.8 ± 3.3 | 6.5 ± 4.1 | 0.478 |
| Vitamin E (mg/day) | 11.1 ± 3.4 | 11.6 ± 3.2 | 0.505 |
| Ascorbic acid (C) (mg/day) | 238.2 ± 107.9 | 297.3 ± 128.4 | 0.041 |
| Thiamine (B1) (mg/day) | 2.5 ± 1.0 | 2.7 ± 0.9 | 0.290 |
| Riboflavin (B2) (mg/day) | 2.1 ± 0.6 | 2.7 ± 0.9 | 0.095 |
| Niacin equivalents (B3) (mg/day) | 40.4 ± 10.5 | 45.6 ± 10.5 | 0.040 |
| Pyridoxin (B6) (mg/day) | 2.4 ± 0.6 | 2.8 ± 0.6 | 0.003 |
| Folic acid (B9) (μg/day) | 403.9 ± 90.5 | 475.0 ± 131.3 | 0.014 |
| Cobalamin (B12) (μg/day) | 8.8 ± 3.8 | 10.7 ± 4.9 | 0.096 |
| Calcium (mg/day) | 1067.6 ± 325.5 | 1200.3 ± 402.8 | 0.146 |
| Iron (mg/day) | 16.5 ± 3.8 | 18.5 ± 4.6 | 0.055 |
| Sodium (mg/day) | 2487.9 ± 688.7 | 2506.5 ± 907.0 | 0.931 |
| Magnesium (mg/day) | 392.2 ± 83.9 | 451.3 ± 111.6 | 0.019 |
| Potassium (mg/day) | 4591.9 ± 829.8 | 5293.8 ± 1302.0 | 0.014 |
| Iodine (μg/day) | 272.2 ± 155.1 | 325.1 ± 161.1 | 0.167 |
| Selenium (ug/day) | 95.1 ± 32.9 | 109.4 ± 31.4 | 0.061 |
| Zinc (mg/day) | 12.3 ± 3.5 | 13.6 ± 3.3 | 0.090 |
| Phosphorus (mg/day) | 1795.1 ± 440.6 | 1997.7 ± 513.5 | 0.087 |
Publisher’s Note: MDPI stays neutral with regard to jurisdictional claims in published maps and institutional affiliations. |
© 2021 by the authors. Licensee MDPI, Basel, Switzerland. This article is an open access article distributed under the terms and conditions of the Creative Commons Attribution (CC BY) license (https://creativecommons.org/licenses/by/4.0/).
Share and Cite
Moradell, A.; Fernández-García, Á.I.; Navarrete-Villanueva, D.; Sagarra-Romero, L.; Gesteiro, E.; Pérez-Gómez, J.; Rodríguez-Gómez, I.; Ara, I.; Casajús, J.A.; Vicente-Rodríguez, G.; et al. Functional Frailty, Dietary Intake, and Risk of Malnutrition. Are Nutrients Involved in Muscle Synthesis the Key for Frailty Prevention? Nutrients 2021, 13, 1231. https://doi.org/10.3390/nu13041231
Moradell A, Fernández-García ÁI, Navarrete-Villanueva D, Sagarra-Romero L, Gesteiro E, Pérez-Gómez J, Rodríguez-Gómez I, Ara I, Casajús JA, Vicente-Rodríguez G, et al. Functional Frailty, Dietary Intake, and Risk of Malnutrition. Are Nutrients Involved in Muscle Synthesis the Key for Frailty Prevention? Nutrients. 2021; 13(4):1231. https://doi.org/10.3390/nu13041231
Chicago/Turabian StyleMoradell, Ana, Ángel Iván Fernández-García, David Navarrete-Villanueva, Lucía Sagarra-Romero, Eva Gesteiro, Jorge Pérez-Gómez, Irene Rodríguez-Gómez, Ignacio Ara, Jose A. Casajús, Germán Vicente-Rodríguez, and et al. 2021. "Functional Frailty, Dietary Intake, and Risk of Malnutrition. Are Nutrients Involved in Muscle Synthesis the Key for Frailty Prevention?" Nutrients 13, no. 4: 1231. https://doi.org/10.3390/nu13041231