
Interventions to Improve Hydration in Older Adults: A Systematic Review and Meta-Analysis


Abstract
:1. Introduction
2. Materials and Methods
2.1. Search Strategy
2.2. Eligibility Criteria
2.3. Data Extraction
2.4. Meta-Analysis
2.5. Assessment of Study Quality
3. Results
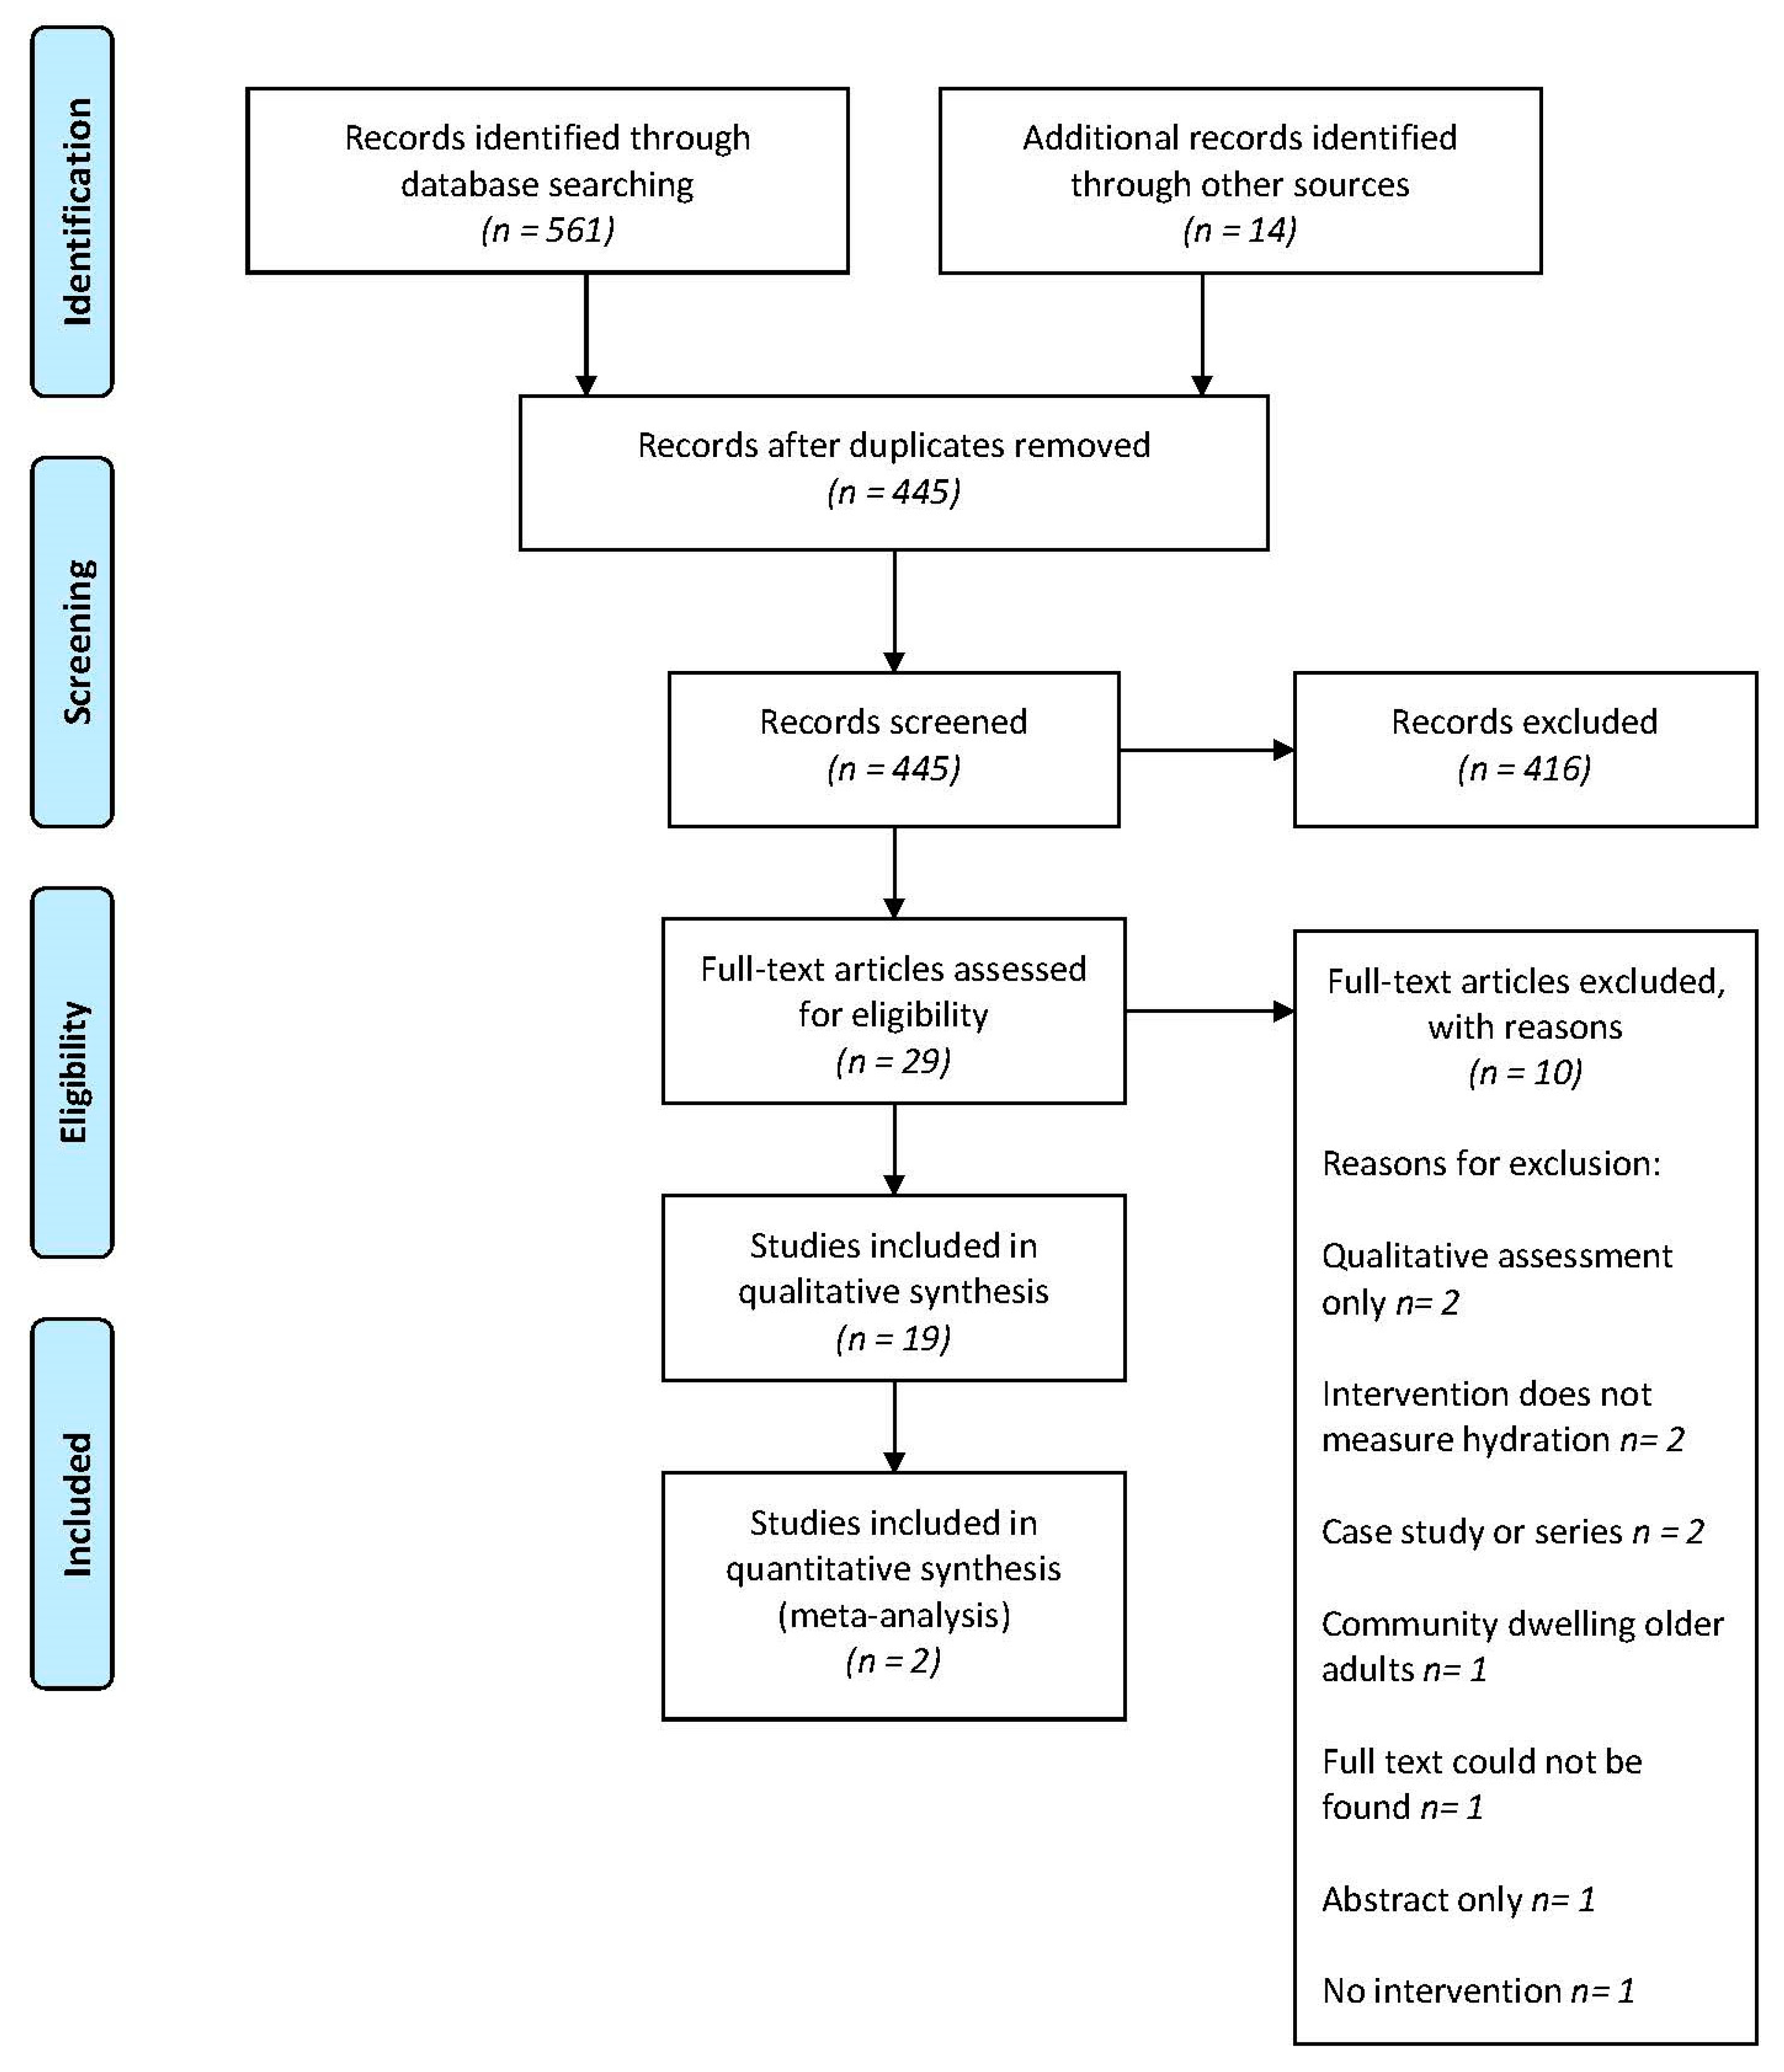
3.1. Study Selection
3.2. Study Characteristics
3.3. Risk of Bias
3.4. Participant Characteristics
3.5. Hydration Interventions
3.6. Behavioural Strategies
3.7. Environmental Strategies
3.8. Multifaceted Strategies
3.9. Nutritional Strategies
3.10. Hydration Linked Events
3.11. Patient Satisfaction
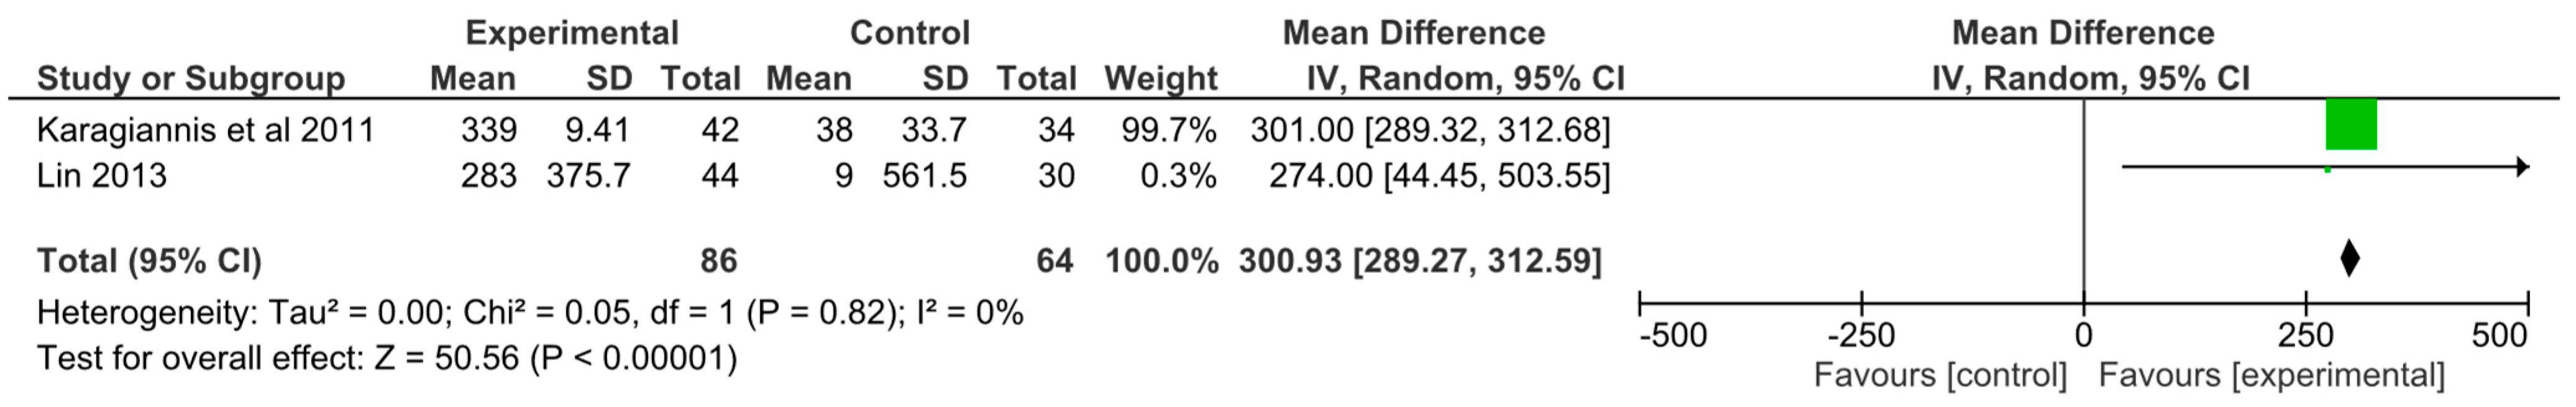
3.12. Meta-Analysis
4. Discussion
Supplementary Materials
Author Contributions
Funding
Institutional Review Board Statement
Informed Consent Statement
Data Availability Statement
Acknowledgments
Conflicts of Interest
References
- Begum, M.N.; Johnson, C.S. A review of the literature on dehydration in the institutionalized elderly. e-SPEN Eur. E-J. Clin. Nutr. Metab. 2010, 5, e47–e53. [Google Scholar] [CrossRef] [Green Version]
- Wotton, K.; Crannitch, K.; Munt, R. Prevalence, risk factors and strategies to prevent dehydration in older adults. Contemp. Nurse 2008, 31, 44–56. [Google Scholar] [CrossRef]
- Vivanti, A.; Harvey, K.; Ash, S.; Battistutta, D. Clinical assessment of dehydration in older people admitted to hospital: What are the strongest indicators? Arch. Gerontol. Geriatr. 2008, 47, 340–355. [Google Scholar] [CrossRef]
- Johnson, L.; Holyday, M. How Do We Stop Starving and Dehydrating Our Patients on Dysphagia Diets? Nutr. Diet. 2017, 74, 64. [Google Scholar]
- Murray, J.; Miller, M.; Doeltgen, S.; Scholten, I. Intake of thickened liquids by hospitalized adults with dysphagia after stroke. Int. J. Speech-Lang. Pathol. 2014, 16, 486–494. [Google Scholar] [CrossRef] [PubMed] [Green Version]
- Vivanti, A.P.; Campbell, K.L.; Suter, M.S.; Hannan-Jones, M.T.; Hulcombe, J.A. Contribution of thickened drinks, food and enteral and parenteral fluids to fluid intake in hospitalised patients with dysphagia. J. Hum. Nutr. Diet. 2009, 22, 148–155. [Google Scholar] [CrossRef] [PubMed] [Green Version]
- Howard, M.M.; Nissenson, P.M.; Meeks, L.; Rosario, E.R. Use of Textured Thin Liquids in Patients With Dysphagia. Am. J. Speech-Lang. Pathol. 2018, 27, 827–835. [Google Scholar] [CrossRef] [PubMed]
- Thomas, D.R.; Tariq, S.H.; Makhdomm, S.; Haddad, R.; Moinuddin, A. Physician misdiagnosis of dehydration in older adults. J. Am. Med. Dir. Assoc. 2004, 5, S31–S34. [Google Scholar] [CrossRef]
- Thomas, D.R.; Cote, T.R.; Lawhorne, L.; Levenson, S.A.; Rubenstein, L.Z.; Smith, D.A.; Stefanacci, R.G.; Tangalos, E.G.; Morley, J.E.; Council, D. Understanding clinical dehydration and its treatment. J. Am. Med. Dir. Assoc. 2008, 9, 292–301. [Google Scholar] [CrossRef]
- Anjo, I.; Amaral, T.F.; Afonso, C.; Borges, N.; Santos, A.; Moreira, P.; Padrao, P. Are hypohydrated older adults at increased risk of exhaustion? J. Hum. Nutr. Diet. 2020, 33, 23–30. [Google Scholar] [CrossRef]
- Mentes, J.C.; Kang, S. Hydration Management. J. Gerontol. Nurs. 2020, 46, 19–30. [Google Scholar] [CrossRef] [PubMed]
- Xiao, H.; Barber, J.; Campbell, E.S. Economic burden of dehydration among hospitalized elderly patients. Am. J. Health-Syst. Pharm. 2004, 61, 2534–2540. [Google Scholar] [CrossRef] [PubMed]
- Lacey, J.; Corbett, J.; Forni, L.; Hooper, L.; Hughes, F.; Minto, G.; Moss, C.; Price, S.; Whyte, G.; Woodcock, T.; et al. A multidisciplinary consensus on dehydration: Definitions, diagnostic methods and clinical implications. Ann. Med. 2019, 51, 232–251. [Google Scholar] [CrossRef]
- Handu, D.; Moloney, L.; Wolfram, T. Academy of Nutrition and Dietetics Methodology for Conducting Systematic Reviews for the Evidence Analysis Library. J. Acad. Nutr. Diet. 2016, 116, 311–318. [Google Scholar] [CrossRef] [PubMed]
- Armstrong, L.E. Assessing hydration status: The elusive gold standard. J. Am. Coll. Nutr. 2007, 26, 575S–584S. [Google Scholar] [CrossRef]
- Hooper, L.; Abdelhamid, A.; Attreed, N.J.; Campbell, W.W.; Channell, A.M.; Chassagne, P.; Culp, K.R.; Fletcher, S.J.; Fortes, M.B.; Fuller, N.; et al. Clinical symptoms, signs and tests for identification of impending and current water-loss dehydration in older people. Cochrane Database Syst. Rev. 2015. [Google Scholar] [CrossRef] [Green Version]
- Khajuria, A.; Krahn, J. Osmolality revisited—Deriving and validating the best formula for calculated osmolality. Clin. Biochem. 2005, 38, 514–519. [Google Scholar] [CrossRef]
- Hooper, L.; Bunn, D.K.; Abdelhamid, A.; Gillings, R.; Jennings, A.; Maas, K.; Twomlow, E.; Hunter, P.R.; Shepstone, L.; Potter, J.F.; et al. Water-loss (intracellular) dehydration assessed using urinary tests: How well do they work? Diagnostic accuracy in older people. Am. J. Clin. Nutr. 2016, 104, 121–131. [Google Scholar] [CrossRef] [PubMed] [Green Version]
- Hodgkinson, B.; Evans, D.; Wood, J. Maintaining oral hydration in older adults: A systematic review. Int. J. Nurs. Pract. 2003, 9, S19–S28. [Google Scholar] [CrossRef] [PubMed]
- Bunn, D.; Jimoh, F.; Wilsher, S.H.; Hooper, L. Increasing fluid intake and reducing dehydration risk in older people living in long-term care: A systematic review. J. Am. Med. Dir. Assoc. 2015, 16, 101–113. [Google Scholar] [CrossRef] [PubMed] [Green Version]
- Bak, A.; Wilson, J.; Tsiami, A.; Loveday, H. Drinking vessel preferences in older nursing home residents: Optimal design and potential for increasing fluid intake. Br. J. Nurs. 2018, 27, 1298–1304. [Google Scholar] [CrossRef] [PubMed]
- Robinson, S.B.; Rosher, R.B. Can a beverage cart help improve hydration? Geriatr. Nurs. 2002, 23, 208–211. [Google Scholar] [CrossRef] [PubMed]
- Karagiannis, M.J.; Chivers, L.; Karagiannis, T.C. Effects of oral intake of water in patients with oropharyngeal dysphagia. BMC Geriatr. 2011, 11, 9. [Google Scholar] [CrossRef] [Green Version]
- Murray, J.; Doeltgen, S.; Miller, M.; Scholten, I. Does a Water Protocol Improve the Hydration and Health Status of Individuals with Thin Liquid Aspiration Following Stroke? A Randomized Controlled Trial. Dysphagia 2016, 31, 424–433. [Google Scholar] [CrossRef] [PubMed] [Green Version]
- Simmons, S.F.; Alessi, C.; Schnelle, J.F. An intervention to increase fluid intake in nursing home residents: Prompting and preference compliance. J. Am. Geriatr. Soc. 2001, 49, 926–933. [Google Scholar] [CrossRef] [PubMed]
- Mentes, J.C.; Culp, K. Reducing hydration-linked events in nursing home residents. Clin. Nurs. Res. 2003, 12, 210–225. [Google Scholar] [CrossRef] [PubMed]
- Smith, M.; Velasco, R.; John, S.; Kaufman, R.S.; Melzer, E. An Innovative Approach to Adequate Oral Hydration in an Inpatient Geriatric Psychiatry Unit. J. Psychosoc. Nurs. Ment. Health Serv. 2019, 57, 15–20. [Google Scholar] [CrossRef] [PubMed]
- Wilson, J.; Bak, A.; Tingle, A.; Greene, C.; Tsiami, A.; Canning, D.; Myron, R.; Loveday, H. Improving hydration of care home residents by increasing choice and opportunity to drink: A quality improvement study. Clin. Nutr. 2019, 38, 1820–1827. [Google Scholar] [CrossRef]
- Dunne, T.E.; Neargarder, S.A.; Cipolloni, P.B.; Cronin-Golomb, A. Visual contrast enhances food and liquid intake in advanced Alzheimer’s disease. Clin. Nutr. 2004, 23, 533–538. [Google Scholar] [CrossRef]
- McCormick, S.E.; Stafford, K.M.; Saqib, G.; Chroinin, D.N.; Power, D. The efficacy of pre-thickened fluids on total fluid and nutrient consumption among extended care residents requiring thickened fluids due to risk of aspiration. Age Ageing 2008, 37, 714–715. [Google Scholar] [CrossRef] [Green Version]
- Shu-Yuan, L. A Pilot Study: Fluid Intake and Bacteriuria in Nursing Home Residents in Southern Taiwan. Nurs. Res. 2013, 62, 66–72. [Google Scholar] [CrossRef]
- Kenkmann, A.; Price Gill, M.; Bolton, J.; Hooper, L. Health, wellbeing and nutritional status of older people living in UK care homes: An exploratory evaluation of changes in food and drink provision. BMC Geriatr. 2010, 10, 28. [Google Scholar] [CrossRef] [Green Version]
- Schnelle, J.F.; Leung, F.W.; Rao, S.S.C.; Beuscher, L.; Keeler, E.; Clift, J.W.; Simmons, S. A Controlled Trial of an Intervention to Improve Urinary and Fecal Incontinence and Constipation. J. Am. Geriatr. Soc. (JAGS) 2010, 58, 1504–1511. [Google Scholar] [CrossRef] [Green Version]
- Go, A.S.; Mozaffarian, D.; Roger, V.L.; Benjamin, E.J.; Berry, J.D.; Borden, W.B.; Bravata, D.M.; Dai, S.; Ford, E.S.; Fox, C.S.; et al. Heart Disease and Stroke Statistics-2013 Update A Report From the American Heart Association. Circulation 2013, 127, E6–E245. [Google Scholar] [CrossRef]
- Holzapfel, S.K.; Ramirez, R.F.; Layton, M.S.; Smith, I.W.; Sagl-Massey, K.; DuBose, J.Z. Feeder position and food and fluid consumed by nursing home residents. J. Gerontol. Nurs. 1996, 22, 6–9. [Google Scholar] [CrossRef]
- Tanaka, Y.; Nagata, K.; Tanaka, T.; Kuwano, K.; Endo, H.; Otani, T.; Nakazawa, M.; Koyama, H. Can an individualized and comprehensive care strategy improve urinary incontinence (UI) among nursing home residents? Arch. Gerontol. Geriatr. 2008, 49, 278–283. [Google Scholar] [CrossRef]
- Taylor, K.A.; Barr, S.I. Provision of small, frequent meals does not improve energy intake of elderly residents with dysphagia who live in an extended-care facility. J. Am. Diet. Assoc. 2006, 106, 1115–1118. [Google Scholar] [CrossRef] [PubMed]
- Spangler, P.F.; RisLEY, T.R.; Bilyew, D.D. The management of dehydration and incontinence in nonambulatory geriatric patients. J. Appl. Behav. Anal. 1984, 17, 397–401. [Google Scholar] [CrossRef] [PubMed] [Green Version]
- Allen, V.J.; Methven, L.; Gosney, M. Impact of serving method on the consumption of nutritional supplement drinks: Randomized trial in older adults with cognitive impairment. J. Adv. Nurs. 2014, 70, 1323–1333. [Google Scholar] [CrossRef] [PubMed]
- Hooper, L.; Bunn, D.; Jimoh, F.O.; Fairweather-Tait, S.J. Water-loss dehydration and aging. Mech. Ageing Dev. 2014, 136–137, 50–58. [Google Scholar] [CrossRef] [Green Version]
- Squires, J.E.; Sullivan, K.; Eccles, M.P.; Worswick, J.; Grimshaw, J.M. Are multifaceted interventions more effective than single-component interventions in changing health-care professionals' behaviours? An overview of systematic reviews. Implement. Sci. 2014, 9, 152. [Google Scholar] [CrossRef] [Green Version]
- Walker, P.; Kifley, A.; Kurrle, S.; Cameron, I.D. Process outcomes of a multifaceted, interdisciplinary knowledge translation intervention in aged care: Results from the vitamin D implementation (ViDAus) study. BMC Geriatr. 2019, 19, 177. [Google Scholar] [CrossRef] [PubMed] [Green Version]
- Abdelhamid, A.; Bunn, D.; Copley, M.; Cowap, V.; Dickinson, A.; Gray, L.; Howe, A.; Killett, A.; Lee, J.; Li, F.; et al. Effectiveness of interventions to directly support food and drink intake in people with dementia: Systematic review and meta-analysis. BMC Geriatr. 2016, 16, 26. [Google Scholar] [CrossRef] [Green Version]
- Milisen, K.; Lemiengre, J.; Braes, T.; Foreman, M.D. Multicomponent intervention strategies for managing delirium in hospitalized older people: Systematic review. J. Adv. Nurs. 2005, 52, 79–90. [Google Scholar] [CrossRef]
- Godfrey, H.; Cloete, J.; Dymond, E.; Long, A. An exploration of the hydration care of older people: A qualitative study. Int. J. Nurs. Stud. 2012, 49, 1200–1211. [Google Scholar] [CrossRef] [PubMed]
- Hooper, L.; Abdelhamid, A.; Campbell, W.; Chassagne, P.; Fletcher, S.J.; Fortes, M.B.; Gaspar, P.M.; Gilbert, D.J.; Heathcote, A.C.; Kajii, F.; et al. O3.20: Non-invasive clinical and physical signs, symptoms and indications for identification of impending and current water-loss dehydration in older people: A diagnostic accuracy systematic review. Eur. Geriatr. Med. 2014, 5, S69–S70. [Google Scholar] [CrossRef]
- Popkin, B.M.; D’Anci, K.E.; Rosenberg, I.H. Water, hydration, and health. Nutr. Rev. 2010, 68, 439–458. [Google Scholar] [CrossRef] [PubMed]
- Schettino, M.S.T.B.; Silva, D.C.C.; Pereira-Carvalho, N.A.V.; Vicente, L.C.C.; Friche, A.A.d.L. Dehydration, stroke and dysphagia: Systematic review. Audiol.—Commun. Res. 2019, 24. [Google Scholar] [CrossRef] [Green Version]
- Geerligs, L.; Rankin, N.M.; Shepherd, H.L.; Butow, P. Hospital-based interventions: A systematic review of staff-reported barriers and facilitators to implementation processes. Implement. Sci. 2018, 13, 36. [Google Scholar] [CrossRef] [Green Version]
- Hooper, L.; Abdelhamid, A.; Ali, A.; Bunn, D.K.; Jennings, A.; Fairweather-Tait, S.J.; Potter, J.F.; Hunter, P.R.; Shepstone, L.; John, W.G.; et al. Diagnostic accuracy of calculated serum osmolarity to predict dehydration in older people: Adding value to pathology laboratory reports. BMJ Open 2015, 5, e008846. [Google Scholar] [CrossRef] [PubMed] [Green Version]
- Michie, S.; van Stralen, M.M.; West, R. The behaviour change wheel: A new method for characterising and designing behaviour change interventions. Implement. Sci. 2011, 6, 42. [Google Scholar] [CrossRef] [PubMed] [Green Version]


| PICO Component | Inclusion Criteria | Exclusion Criteria |
|---|---|---|
| Population | Acutely unwell patients in hospital or residents in nursing homes (>65 years) | Participants below 65 years, palliative patients and older adults living in the community |
| Intervention | Oral methods to improve hydration or fluid intake | Interventions using parenteral, enteral or intravenous methods |
| Comparator | Comparator such as usual care | |
| Outcome | Quantitative measures of hydration status or fluid intake in older adult patients or residents | Any measures not related to hydration status or fluid intake or qualitative assessment only |
| Author, Country and Study Type | Setting | Participant Characteristics | Intervention | Duration | Outcome(s) | Description of Outcome Assessment |
|---|---|---|---|---|---|---|
| Behavioural Strategies | ||||||
| Allen et al. 2013 [39] UK RCT | Eight nursing homes and three hospitals | 45 older adults Straw group: 19 (16 females, 3 males) Mean age: 85.4 ± 8.6 years MMSE: 13.1 ± 7.9/30 Glass/Beaker group: 26 (19 females, 7 males) Mean age: 88.4 ± 5.4 years MMSE: 14.6 ± 8.3/30 | Group 1: ONS drink with straw inserted Group 2: ONS drink served in a glass or beaker | 3x daily for 7 days | Fluid intake measured as the proportion of ONS consumed per day | Amount of ONS consumed was calculated by weighing the supplement and subtracting it from full amount. |
| Bak et al. 2018 [21] UK Pre-Post study | One nursing home | Phase 1: 37 residents Phase 2: 24 residents Gender: not reported. Age: not reported Residents did not have severe cognitive impairment. | Phase 1: Evaluation of drinking equipment Drinking vessels with different designs selected for evaluation Phase 2: Introduction of new drinking vessels Standard vessels were replaced with vessels rated highest from phase 1. Observations at breakfast on 3 consecutive days. | Phase 1: not recorded Phase 2: 3 days | Fluid intake per day Resident satisfaction | A questionnaire with a five-point Likert scale was used to evaluate ease of vessel use. Baseline fluid intake data compared to fluid intake data with new vessels. Method of collecting fluid intake not recorded. Resident opinions were sought via face to face questioning during and after intervention. |
| Lin 2013 [31] Taiwan Non randomised clinical trial | Six nursing homes | 74 incontinent residents Average age: 75.2 years Intervention: 44 (30 females, 14 males) Control: 30 (15 females, 15 males) SPMSQ: 5.9 ± 3.5 | Intervention: Advice to increase daily fluid intake >1500 mL, unrestricted drinks choice Control: Unrestricted drinks, residents could choose type and amount. | 6 weeks | Fluid intake per day Hydration status measured by change in urine specific gravity | Intake/output chart was recorded by nursing staff. Method of fluid measurement not recorded. Urine specimens collected at baseline and post intervention. Specimens sent to lab for testing within 2 h of collection. |
| Simmons, Alessi and Schnelle 2001 [25] USA RCT | Two community nursing homes | 63 incontinent nursing home residents. Intervention: 88.7 ± 7.1 years (44 females, 4 males), MMSE = 12.1 ± 7.9 Control: 86.3 ± 6.1 years, (10 females, 5 males), MMSE = 13.9 ± 6.5 | Phase 1: four verbal prompts to drink per day Phase 2: eight verbal prompts to drink per day Phase 3: eight verbal prompts to drink per day plus compliance with resident beverage preferences. | 32 weeks Phase 1: 16 weeks Phase 2: 8 weeks Phase 3: 8 weeks | Fluid intake per day Hydration status measured by change in BUN:Cr ratio and serum osmolality | Fluid intake between meals measured by research staff using measured drinking cups. Hydration status assessed by BUN:Cr ratio and serum osmolality at baseline, 8 and 32 weeks. |
| Schnelle et al. 2010 [33] USA RCT | Six nursing homes | 112 residents with urinary and faecal incontinence Intervention: 58 (49 females, 9 males) Mean age: 85.8 ± 9.4 Mean MMSE: 12.9 ± 8.4 Control: 54 (44 females, 10 males) Mean age: 86.1 ± 10.5 Mean MMSE: 9.6 ± 8.4 | Intervention: to increase fluid intake. Staff offered additional food and fluids between meals Control: ‘usual care’ (not described) | 12 weeks (weekdays between 7am-330pm h) | Change in between meal fluid intake daily | Fluid intake was observed at baseline and for 6 meal and 6 in between meal observations. Fluid intake was assessed using a photographic assessment method. |
| Spangler et al. 1984 [38] USA RCT | One nursing home | 16 non ambulatory residents with incontinence Gender: 2 males, 14 females Age: 59–96 years (mean age not reported) Cognition: not reported | Staff offered beverage choice by circulating a beverage cart every 1.5 h. Staff would offer assistance with consuming beverages and with toileting. | 50 days | Hydration status measured by change in urine specific gravity | Two urine samples were collected in the morning per resident on the first and third day of data collection. Urine specific gravity was measured with a urinometer. |
| Tanaka et al. 2009 [36] Japan Pre-Post study | 17 nursing homes | 122 residents Gender: 18 males, 104 females Mean age: 85.2 years Dementia levels, n: I (mild): 2, II: 18, III: 59, IV (severe): 42 | Staff aimed to increase fluid intake to 1500 mL/day by providing beverages at 1000, 1500 and before bedtime. Staff provided encouragement to drink and offered choice. | 12 weeks | Mean change in daily fluid intake | 3 day baseline intake and 12 week intake assessment completed. Method not recorded. |
| Environmental Strategies | ||||||
| Dunne et al. 2004 [29] USA Pre-Post study | One care home | 9 males with advanced Alzheimer’s Disease Study 1: mean age 82.7 years Study 2: mean age 83.1 years | Study 1: white tableware (control), high contrast red tableware Study 2 (1 year later): white (control), high contrast blue, low contrast red, low contrast blue. | Study 1: 30 days Study 2: 70 days | Change in mean % of daily fluid intake | Food and fluid intake recorded daily for each participant at lunch and supper. Amount consumed expressed as a percentage of amount served. Amount served weighed in ounces. |
| Holzapfel et al. 1996 [35] USA RCT | One nursing home | 39 residents requiring complete feeding assistance Gender: 3 females, 36 males Mean age: 75 years Cognition: n = 22 had dementia | Intervention: Feeding assistants sat for two weeks, then stood for 2 weeks and crossed over. Control: feeders determined which position to assume at each mealtime | 4 weeks (lunch meals Monday–Friday) | Change in daily mean fluid intake at day 1, 5, 10, 15 and 20. | Fluid consumed at lunch meals was recorded by feeder using a likert scale of percentage groups (0–25%, 26–50%, 51–75%, 76–100%) |
| Kenkmann et al. 2010 [32] UK Non randomised clinical trial | Six care homes | 120 residents 85 females, 35 males Mean age: 87 years Two homes were for dementia care | Intervention: restaurant atmosphere, extended mealtimes, increased choice of foods, social experience, encouragement to eat, availability of drinks and snacks Control: ‘usual care’ (not described) | 12 months | Number of residents with dehydration Number of falls. -Resident satisfaction | Assessment of dehydration (visual assessment of tongue) by a trained nurse. Number of participants dehydrated at second interview were used to calculate a relative risk of dehydration. Number of falls was collected from care notes. Satisfaction questionnaires were distributed before and after intervention. |
| Robinson and Rosher 2002 [22] USA Pre-Post study | One nursing home | 51 residents 43 females, 8 males Mean age: 83.5 years Cognition: not reported. | Goal: to drink 8 ounces of fluid twice a day. Hydration assistant utilised for fluid administration. Increased choice through using a colourful beverage cart, jugs and glasses. | Baseline: 2 weeks Intervention: 5 weeks Follow-up: 2 weeks | Number of participants drinking extra fluid. Changes in TBW. Number of HLEs (delirium, respiratory infections, constipation, UTIs, falls) Resident satisfaction | Fluid intake recorded at mid-morning and afternoon only. BIA weekly measurements to determine changes in TBW. Number of hydration-linked events tracked through medication and bowel charts. A record of comments made by residents or their family were kept to reflect the value of the program. |
| Multifaceted Strategies | ||||||
| Mentes and Culp 2003 [26] USA Pre-Post study | Four long term care facilities | 49 residents 25 females, 22 males Intervention: mean age 80.6 years, MMSE = 22 Control: mean age 83 years, MMSE = 24.6 | Intervention: Calculation of weight-based fluid intake goal. Providing standardised 180 mL water with medications, fluid rounds twice daily and happy hours or tea time twice a week in the afternoon. Control: Usual care (not described) | 8 weeks | Number of HLEs (acute confusion, UTI, respiratory infection) Urine colour and specific gravity % meeting daily fluid goal. | Urine colour determined by standard urine colour chart. Urine specific gravity was determined using Chemstrip Mini Urine Analyzer. Fluid intake records taken at baseline and during intervention (method not described). HLEs were documented when they occurred. Acute confusion assessment was used if acute confusion was suspected. |
| Smith et al. 2019 [27] USA Pre-Post study | One hospital (geriatric psychiatry unit) | 50 patients ≥65 years with a neurocognitive disorder Gender: not reported. | Offered flavoured water, increased cup size and nursing staff to encourage fluid intake. | Baseline: 7 days Follow-up: 7 days | Change in mean daily fluid intake. | Fluid intake form was developed to track daily intake. Standardised cups were used to determine amount of fluid consumed. |
| Wilson et al. 2019 [28] UK Pre-Post study | Two care homes | Number of residents: not reported Gender: not reported Age: ≥65 years Cognition: not reported | Drinks provided before breakfast and after main meals. Implementation of protected drinks time (PDT). Increasing choice through a drinks menu. | Home A: Drinks before breakfast = 4 days, PDT and drinks menu = 8 weeks. Home B: PDT and drinks menu = 9 weeks | Change in mean daily fluid intake Number of HLEs (UTIs, respiratory infection, falls) Change in laxative and antibiotic use | Fluid intake was measured every 4 weeks by observing volume consumed of 6 randomly selected residents. Information on adverse health events was collected weekly (method not described). Antibiotics and laxatives used were gathered from prescription charts every 4 weeks. |
| Nutritional Strategies | ||||||
| Howard et al. 2018 [7] USA Retrospective analysis | One hospital (inpatient rehabilitation facility) | 20 patients with dysphagia. 11 females, 9 males Mean age = 79 years Cognition: not reported. | Retrospective analysis of patients who received both nectar thick and textured thin liquids during their hospital stay. | Nectar thick: 8.3 days Textured thin: 5.8 days | Prevalence of dehydration Patient satisfaction | Lab values (Na, serum urea and Cr) were used to determine dehydration. Two clinician initiated questions were used to assess satisfaction. |
| Karagiannis et al. 2011 [23] Australia RCT | One hospital (subacute unit) | 91 patients with dysphagia 34 males, 42 females Intervention: mean age 80 years Control: mean age 79 years 18 participants had Alzheimer’s disease or dementia. | Intervention: consumed thickened fluids but also received water upon request for five days Control: consumed only thickened fluids | Baseline: 3 days Intervention: 5 days | Incidence of lung problems. Change in mean fluid intake Patient satisfaction | Chest status was examined by physicians and core body temperature taken 3 times per day. Daily fluid intake for each participant was recorded. Method of measurement not recorded. Quality of life surveys were administered in the pre and post intervention period. |
| McCormick et al. 2006 [30] Ireland RCT | One geriatric care facility | 11 patients with dysphagia 8 females, 3 males Mean age: 76 years Cognition: not reported. | Week 1–6: Group A received commercially prepared pre-thickened fluids. Group B received drinks thickened at the bedside. Week 6–12: Group B received commercially prepared pre-thickened fluids. Group A received drinks thickened at the bedside. | 12 weeks (6 weeks per group) | Difference in amount of thickened fluids consumed. Rates of constipation | Daily assessment of total fluid intake using graduated cups. Constipation rates were recorded using the British stool chart. |
| Murray et al. 2016 [24] Australia RCT | Two acute hospitals and three rehabilitation facilities | 14 patients post stroke with dysphagia 10 males, 4 females Mean age: 80 years 5 patients were cognitively impaired | Intervention: had access to thickened fluids but could also have water between meals. Control: consumed thickened fluids only | 2 weeks | Change in mean daily beverage intake Change in hydration Incidence of pneumonia, constipation, UTIs Patient satisfaction | Daily intake recorded on fluid balance charts. Hydration status was assessed using the BUN:Cr ratio. Incidence of UTIs, constipation and pneumonia were recorded. A five question Likert scale survey was completed at weekly intervals throughout the study. |
| Taylor and Barr 2006 [37] Canada RCT | One extended care facility | 31 residents with dysphagia Gender: 5 males, 26 females Mean age: 85 ± 6.4 years Cognition: not reported | Group 1: 5 meals/d for 4 d, Group 2: 3 meals/d for 4 d and then crossover 4 weeks later | 4 weeks | Change in fluid intake at mealtimes | Weight of fluid consumed recorded by registered dietitian before and after meals. |
| Description of Results | |
|---|---|
| Allen et al. 2013 [39] | Plasma osmolality (mOsm/kg); Lab values; BIA (Ohms); Urinary indices; Number of HLEs: not reported Fluid intake (mL): Glass/beaker consumption: 64.6 ± 34.3% supplement volume; Straw: 57.3 ± 37.0% supplement volume (p = 0.027) |
| Bak et al. 2018 [21] | Plasma osmolality (mOsm/kg); Lab values; BIA (Ohms); Urinary indices; Number of HLEs: not reported Fluid intake (mL): Mean intake at breakfast increased from 139mL (±84 mL) to 205 mL (±12 mL), p = 0.003 Patient satisfaction: 20 residents provided feedback; 80% reported they preferred the test mugs to the standard cups. No p value reported. |
| Dunne et al. 2004 [29] | Plasma osmolality (mOsm/kg); Lab values; BIA (Ohms); Urinary indices; Number of HLEs: not reported Study 1: Mean 84% fluid increase per day between baseline and intervention (p = 0.001). Study 2: Mean 29.8% fluid increase per day for high contrast blue (p < 0.05). Low contrast blue and red interventions were ineffectual. No volume (mls) reported. |
| Holzapfel et al. 1996 [35] | Plasma osmolality (mOsm/kg); Lab values; BIA (Ohms); Urinary indices; Number of HLEs: not reported Group 1 = control, Group 2 = stand then sit, Group 3 = sit then stand Group 1 and 2, Group 1 and 3, Group 2 and 3, respectively Day 1: p = 0.600, p = 0.209, p = 0.533 Day 5: p = 0.019 *, p = 0.012 *, p = 0.776 Day 10: p = 0.597, p = 0.625, p = 0.743 Day 15: p = 0.506, p = 0.830, p = 0.625 Day 20: p = 0.707, p = 0.972, p = 0.710 * statistically significant result p < 0.05 |
| Howard et al. 2018 [7] | Plasma osmolality (mOsm/kg); BIA (Ohms); Fluid intake (mL); Urinary indices; Number of HLEs: not reported Lab values: Nectar thick diet—Serum urea rose from 8.2 mmol/L to 9.6 mmol/L (p = 0.07). Cr rose from 104.3 umol/L to 153.8 umol/L (p = 0.047) Na levels peaked after a nectar thick diet (p = 0.014) Nectar thick to textured thin liquids—Serum urea dropped into normal range (p = 0.006). Cr decreased into normal range but was not significant (p > 0.05). Patient satisfaction: Patients reported being able to consume a greater variety of liquids (p = 0.06). They also reported that their thirst was quenched better when receiving textured thin liquids compared to nectar thick fluids (p = 0.0059) |
| Karagiannis et al. 2011 [23] | Plasma osmolality (mOsm/kg); Lab values; BIA (Ohms); Urinary indices: not reported Fluid intake (mL) preintervention period: Intervention: 1428 ± 7.0 mL per day; Control: 1340 ± 9.5 mL per day Fluid intake (mL) Intervention period: Intervention: 1767 ± 10.7 mL per day (p < 0.01); Control: 1378 ± 33.7 mL per day HLEs (Incidence of lung complications): Intervention: 6 patients (14.3%); Control: 0 patients (p < 0.05) Patient satisfaction: The intervention group reported higher levels of satisfaction than the intervention group (p < 0.001). General positive feeling was higher than control group but was less than in pre intervention period (p = 0.111) |
| Kenkmann et al. 2010 [32] | Plasma osmolality (mOsm/kg); Lab values; BIA (Ohms); fluid intake (ml), Urinary indices: not reported HLEs: intervention group had reduced rate of falls by 24% but was not statistically significant (p = 0.06). Dehydration rates dropped in both groups. RR of being dehydrated in an intervention home vs. control home was 0.36 (p = 0.025) Patient Satisfaction: Resident perception of drink enjoyment was slightly higher in control group (p = 0.237) |
| Lin 2013 [31] | Plasma osmolality (mOsm/kg); Lab values; BIA (Ohms); HLEs: not reported Fluid intake (mL): Intervention: baseline: 1449 ± 421 mL, post: 1732 ± 301 mL per day. Control: baseline: 1539 ± 565 mL, post: 1548 ± 558 mL per day. Fluid intake was statistically significant in the intervention group (p < 0.01). Urinary Indices: Baseline: Intervention: USG 1.012 Control: USG 1.009. Values remained the same post intervention. No p value reported. |
| McCormick et al. 2006 [30] | Plasma osmolality (mOsm/kg); Lab values; BIA (Ohms); Urinary indices: not reported Fluid intake (mL): ‘Usual thickener’: 785 mL per day; Pre-thickened: 795 mL, p ≤ 0.47 HLEs: No difference in constipation rates. No p-value reported. |
| Mentes and Culp 2003 [26] | Plasma osmolality (mOsm/kg); Lab values; BIA (Ohms): not reported % meeting fluid goal per day: Intervention: baseline: 99, mean over intervention period: 95 (p = 0.08); Control: baseline: 107, mean over intervention period: 89 (p = 0.08) No amount (mls) reported. Urinary Indices: Intervention and control respectively Baseline: USG (1.0166, 1.0189) (p = 0.002), urine colour (2.2, 2.6) Mean over intervention period: USG (1.0163, 1.0178) (p = 0.07) urine colour (2.2, 2.8) (p = 0.08) HLEs: Intervention: 3 events per 63 days of follow-up; Control: 6 events per 60 days of follow-up. RR = 0.48, 95% CI 0.18–1.26 (p = 0.039) |
| Murray et al. 2016 [24] | Plasma osmolality (mOsm/kg); BIA (Ohms); Urinary indices:not reported Lab values: Baseline: 71% BUN:Cr > 20 (dehydrated) Intervention: trend of improvement (day 0 = 22.46 ± 3.70, day 7 = 21.09 ± 2.47, day 14 = 20.56 ± 3.70). Control: trend of deterioration (day 0 = 20.28 ± 3.88, day 7 = 21.63 ± 7.54, day 14 = 24.70 ± 12.71) (p = 0.427) Fluid intake (mL): Intervention: 1103 ± 215 mL (299 mL water); Control: 1103 ± 247 mL, (p = 0.998) HLEs: Thickened liquids only group had a significantly higher proportion of UTIs compared to water protocol group (p = 0.024) Patient satisfaction: Difference in satisfaction ratings between water and thickened fluids were not significant (p = 0.655) |
| Robinson and Rosher 2002 [22] | Plasma osmolality (mOsm/kg); Lab values; Urinary indices: not reported BIA (Ohms): Fluid in each body compartment increased during intervention and declined after program cessation (p = 0.001) Fluid intake (mL): 53% met 450 mL daily goal; 24% did not meet the goal every time. No p-value or mL amount reported. HLEs: Increase in number of bowel movements (p = 0.04), decline in number of falls (p = 0.05) Satisfaction: Positive comments were generally made about the program. No p value was reported. |
| Schnelle et al. 2010 [33] | Plasma osmolality (mOsm/kg); Lab values; BIA (Ohms); Urinary indices: not reported Fluid intake (mL): Intervention: 399 ± 186 mL; Control: 56.2 ± 118 mL. Significant increase from baseline (baseline values not reported, p < 0.001) HLEs: Fewer intervention subjects met the criterion for constipation compared to baseline p < 0.001 |
| Simmons, Alessi and Schnelle 2001 [25] | BIA (Ohms); Urinary indices; Number of HLEs: not reported Plasma Osmolality (mOsm/kg): Intervention and control respectively Baseline: 303.6 ± 9.1, 303.4 ± 8.5 8 weeks: 300.5 ± 9.1, 298.6 ± 10.5 32 weeks: 297.0 ± 10.8*, 294.7 ± 11.9 Significant decline in both groups overtime (p < 0.05). Lab Values: BUN:Cr ratio (intervention and control respectively) Baseline: 24.0 (±4.6), 21.7 (±6.1); 8 weeks: 26.2 (±8.8), 22.3 (±5.7); 32 weeks: 22.9 (±5.6), 23.8 (±7.2) Changes not significant (p > 0.05) Fluid Intake (ml): Between meals; Phase 1: 290 ± 136 mL; Phase 2: 476 ± 296 mL; Phase 3: 633 ± 376 mL. Significant increase between phase 1 and 2 (p < 0.001). Significant increase between phase 2 and 3 (p < 0.001). |
| Smith et al. 2019 [27] | Plasma osmolality (mOsm/kg); Lab values; BIA (Ohms); Urinary indices; Number of HLEs: not reported Fluid intake (mL): Adjusted mean fluid intake at baseline: 1550.51 mL. Adjusted mean fluid intake post: 2224.81 mL. No p value reported. |
| Spangler et al. 1984 [38] | Plasma osmolality (mOsm/kg); Lab values; BIA (Ohms); Number of HLEs: not reported Urinary Indices: Baseline: 25% of residents had scores >20 (dehydration); Post: All residents had scores <20 (absence of dehydration) p < 0.002. |
| Tanaka et al. 2009 [36] | Plasma osmolality (mOsm/kg); Lab values; BIA (Ohms); Urinary indices; Number of HLEs: not reported Fluid intake (mL): Baseline: 881.1 ± 263.8 per day; Post: 1146.4 ± 365.2 per day, p < 0.001. |
| Taylor and Barr 2006 [37] | Plasma osmolality (mOsm/kg); Lab values; BIA (Ohms); Urinary indices; Number of HLEs: not reported Fluid intake (mL): 3 meal menu: 612 ±176 mL; 5 meal menu: 698 ± 156 mL. Fluid intake was higher with 5 meals vs. 3 meals (p = 0.003). |
| Wilson et al. 2019 [28] | Plasma osmolality (mOsm/kg); Lab values; BIA (Ohms); Urinary indices: not reported Fluid intake (mL): Home A: daily mean fluid intakes <1500 mL; Home B: daily mean fluid intakes >1500 mL. No p value or soecific amount (mL) reported. HLEs: No change in HLEs. Significant decrease in average daily use of laxatives at both homes (p < 0.05). No change in use of antibiotics. |
| Intervention Functions | Included Articles |
|---|---|
| Education | None reported |
| Persuasion | Lin, Simmons et al., Smith et al., Tanaka et al. |
| Incentivisation | None reported |
| Coercion | None reported |
| Training | None reported |
| Enablement | Allen et al., Bak et al., Robinson and Rosher, Smith et al., Wilson et al., Mentes and Culp, Howard et al., Karagiannis, Chivers and Karagiannis, Murray et al., McCormick et al., Schnelle et al., Spangler et al. |
| Modelling | None reported |
| Environmental restructuring | Dunne et al., Holzapfel et al., Kenkmann et al., Taylor and Barr, Wilson et al. |
| Restrictions | None reported |
Publisher’s Note: MDPI stays neutral with regard to jurisdictional claims in published maps and institutional affiliations. |
© 2021 by the authors. Licensee MDPI, Basel, Switzerland. This article is an open access article distributed under the terms and conditions of the Creative Commons Attribution (CC BY) license (https://creativecommons.org/licenses/by/4.0/).
Share and Cite
Bruno, C.; Collier, A.; Holyday, M.; Lambert, K. Interventions to Improve Hydration in Older Adults: A Systematic Review and Meta-Analysis. Nutrients 2021, 13, 3640. https://doi.org/10.3390/nu13103640
Bruno C, Collier A, Holyday M, Lambert K. Interventions to Improve Hydration in Older Adults: A Systematic Review and Meta-Analysis. Nutrients. 2021; 13(10):3640. https://doi.org/10.3390/nu13103640
Chicago/Turabian StyleBruno, Chevonne, Annaleise Collier, Margaret Holyday, and Kelly Lambert. 2021. "Interventions to Improve Hydration in Older Adults: A Systematic Review and Meta-Analysis" Nutrients 13, no. 10: 3640. https://doi.org/10.3390/nu13103640