Micronutrient Dilution and Added Sugars Intake in U.S. Adults: Examining This Association Using NHANES 2009–2014

 ,
,
Abstract
:1. Introduction
2. Methods
2.1. Data Source and Participants
2.2. Added Sugars and Micronutrient Intakes
2.3. Statistical Analysis
3. Results
3.1. Added Sugars Intakes
3.2. Relationship of Added Sugars Intake to Micronutrient Adequacy
4. Discussion
5. Conclusions
Author Contributions
Funding
Acknowledgments
Conflicts of Interest
References
- U.S. Department of Health and Human Services and U.S. Department of Agriculture. 2015–2020 Dietary Guidelines for Americans, 8th ed.; Government Printing Office: Washington, DC, USA, 2015.
- World Health Organization. 2015 Guideline: Sugars Intake for Adults and Children. Available online: http://www.who.int/nutrition/publications/guidelines/sugars_intake/en/ (accessed on 10 June 2018).
- Food and Drug Administration. Food Labeling: Revision of the Nutrition and Supplement Facts Labels, Final Rule. Available online: https://www.regulations.gov/document?D=FDA-2012-N-1210-0875 (accessed on 10 June 2018).
- Health Canada. Regulations Amending the Food and Drug Regulations (Nutrition Labelling, Other Labelling Provisions and Food Colours). Available online: http://www.gazette.gc.ca/rp-pr/p2/2016/2016-12-14/html/sor-dors305-eng.html (accessed on 10 June 2018).
- Malik, V.S.; Schulz, M.B.; Hu, F.B. Intake of sugar-sweetened beverages and weight gain: A systematic review. Am. J. Clin. Nutr. 2006, 84, 274–288. [Google Scholar] [CrossRef] [PubMed]
- Imamura, F.; O’Connor, L.; Ye, Z.; Mursu, J.; Hayashino, Y.; Bhupathiraju, S.N.; Forouhi, N.G. Consumption of sugar sweetened beverages, artificially sweetened beverages, and fruit juice and incidence of type 2 diabetes: Systematic review, meta-analysis, and estimation of population attributable fraction. BMJ 2015, 351, h3576. [Google Scholar] [CrossRef] [PubMed] [Green Version]
- Te Morenga, L.A.; Howatson, A.J.; Jones, R.M.; Mann, J. Dietary sugars and cardiometabolic risk: Systematic review and meta-analyses of randomized controlled trials of the effects on blood pressure and lipids. Am. J. Clin. Nutr. 2014, 100, 65–79. [Google Scholar] [CrossRef] [PubMed] [Green Version]
- Keller, A.; Heitmann, B.L.; Olsen, N. Sugar-sweetened beverages, vascular risk factors and events: A systematic literature review. Public Health Nutr. 2015, 18, 1145–1154. [Google Scholar] [CrossRef] [PubMed] [Green Version]
- Yang, Q.; Zhang, Z.; Gregg, E.W.; Flanders, W.D.; Merritt, R.; Hu, F.B. Added sugar intake and cardiovascular diseases mortality among US adults. JAMA Intern. Med. 2014, 174, 516–524. [Google Scholar] [CrossRef] [PubMed] [Green Version]
- Livingstone, M.B.W.; Rennie, K.L. Added sugars and micronutrient dilution. Obes. Rev. 2009, 10 (Suppl. 1), 34–40. [Google Scholar] [CrossRef]
- Kranz, S.; Smiciklas-Wright, H.; Siega-Riz, A.M.; Mitchell, D. Adverse effect of high sugar consumption on dietary intake in American preschoolers. J. Pediatr. 2005, 146, 105–111. [Google Scholar] [CrossRef]
- Wang, J.W.; Shang, L.; Light, K.; O’Loughlin, J.; Paradis, G.; Gray-Donald, K. Associations between added sugar (solid vs. liquid) intakes, diet quality, and adiposity indicators in Canadian children. Appl. Physiol. Nutr. Metab. 2015, 40, 835–841. [Google Scholar] [CrossRef] [Green Version]
- Gibson, S.; Francis, L.; Newens, K.; Livingstone, B. Associations between free sugars and nutrient intakes among children and adolescents in the UK. Br. J. Nutr. 2016, 116, 1265–1274. [Google Scholar] [CrossRef] [Green Version]
- Marriott, B.P.; Olsho, L.; Hadden, L.; Connor, P. Intake of added sugars and selected nutrients in the United States, National Health and Nutrition Examination Survey (NHANES) 2003–2006. Crit. Rev. Food Sci. Nutr. 2010, 50, 228–258. [Google Scholar] [CrossRef]
- Charlton, K.E.; Kolbe-Alexander, T.L.; Nel, J.H. Micronutrient dilution associated with added sugar intake in elderly black South African women. Eur. J. Clin. Nutr. 2005, 59, 1030–1042. [Google Scholar] [CrossRef] [Green Version]
- Moshtaghian, H.; Louie, J.; Charlton, K.E.; Probst, Y.C.; Gopinath, B.; Mitchell, P.; Flood, V.M. Added sugar intake that exceeds current recommendations is associated with nutrient dilution in older Australians. Nutrition 2016, 32, 937–942. [Google Scholar] [CrossRef] [Green Version]
- Gonzalez-Padilla, E.; Dias, J.A.; Ramne, S.; Olsson, K.; Nalsen, C.; Sonestedt, E. Association between added sugar intake and micronutrient dilution: A cross-sectional study in two adult Swedish populations. Nutr. Metab. 2020, 17, 15. [Google Scholar] [CrossRef]
- Mullie, P.; Mertens, E.; Charlier, R.; Knaeps, S.S.; Lefevre, J.; Clarys, P. Relation between sugar-sweetened beverage consumption and micronutrient intake in a prospective study. Eur. J. Clin. Nutr. 2018, 72, 170–173. [Google Scholar] [CrossRef] [PubMed]
- Mok, A.; Ahmad, R.; Rangan, A.; Louie, J. Intake of free sugars and micronutrient dilution in Australian adults. Am. J. Clin. Nutr. 2018, 107, 94–104. [Google Scholar] [CrossRef] [PubMed] [Green Version]
- Keast, D.R.; Fulgoni, V.L., III; Nicklas, T.A.; O’Neil, C.E. Food sources of energy and nutrients among children in the United States: National Health and Nutrition Examination Survey 2003–2006. Nutrients 2013, 5, 283–301. [Google Scholar] [CrossRef] [PubMed] [Green Version]
- Centers for Disease Control and Prevention, National Center for Health Statistics. About the National Health and Nutrition Examination Survey. Available online: https://www.cdc.gov/nchs/nhanes/about_nhanes.htm (accessed on 15 November 2018).
- Centers for Disease Control and Prevention, National Center for Health Statistics. Survey Methods and Analytic Guidelines. Available online: https://wwwn.cdc.gov/Nchs/Nhanes/AnalyticGuidelines.aspx (accessed on 15 November 2018).
- Moshfegh, A.J.; Rhodes, D.G.; Baer, D.J.; Murayi, T.; Clemens, J.C.; Rumpler, W.V.; Paul, D.R.; Sebastian, R.S.; Kuczynski, K.J.; Ingwersen, L.A.; et al. The US Department of Agriculture Automated Multiple-Pass Method reduces bias in the collection of energy intakes. Am. J. Clin. Nutr. 2008, 88, 324–332. [Google Scholar] [CrossRef]
- Centers for Disease Control and Prevention, National Center for Health Statistics. NCHS Research Ethics Review Board (ERB) Approval. Available online: https://www.cdc.gov/nchs/nhanes/irba98.htm (accessed on 15 November 2018).
- USDA, Agricultural Research Service. Food Patterns Equivalents Database (FPED). Available online: https://www.ars.usda.gov/northeast-area/beltsville-md-bhnrc/beltsville-human-nutrition-research-center/food-surveys-research-group/docs/fped-overview/ (accessed on 15 January 2017).
- Tooze, J.A.; Kipnis, V.; Buckman, D.W.; Carroll, R.J.; Freedman, L.S.; Guenther, P.M.; Krebs-Smith, S.M.; Subar, A.F.; Dodd, K.W. A mixed-effects model approach for estimating the distribution of usual intake of nutrients: The NCI method. Stat. Med. 2010, 29, 2857–2868. [Google Scholar] [CrossRef] [Green Version]
- Food and Nutrition Board, Institute of Medicine. Dietary Reference Intakes: Applications in Dietary Assessment; National Academies Press: Washington, DC, USA, 2000.
- Ervin, R.B.; Ogden, C.L. Consumption of Added Sugars among U.S. Adults, 2005–2010; NCHS data brief, no 122; National Center for Health Statistics: Hyattsville, MD, USA, 2013.
- Becker, W.; Lindroos, A.K.; Nalsen, C.; Lemming, W.; Ohrvik, V. Dietary habits, nutrient intake and biomarkers for folate, vitamin D, iodine and iron status among women of childbearing age in Sweden. Ups. J. Med. Sci. 2016, 121, 271–275. [Google Scholar] [CrossRef] [Green Version]
- Powell, E.S.; Smith-Taillie, L.P.; Popkin, B.M. Added sugar intake across the distribution of US children and adult consumers: 1977–2012. J. Acad. Nutr. Diet. 2016, 116, 1543–1550. [Google Scholar] [CrossRef] [Green Version]
- Gibson, S.; Ashwell, M.; Arthur, J.; Bagley, L.; Lennox, A.; Rogers, P.J.; Stanner, S. What can the food and drink industry do to help achieve the 5% free sugars goal? Perspect. Public Health 2017, 137, 237–247. [Google Scholar] [CrossRef]
- Bailey, R.L.; Fulgoni, V.L., III; Cowan, A.E.; Gaine, P.C. Sources of added sugars in young children, adolescents, and adults with low and high intakes of added sugars. Nutrients 2018, 10, 102. [Google Scholar] [CrossRef] [Green Version]
- Millen, B.E.; Abrams, S.; Adams-Campbell, L.; Anderson, C.A.M.; Brenna, J.T.; Campbell, W.W.; Clinton, S.; Hu, F.; Nelson, M.; Neuhouser, M.L.; et al. The 2015 Dietary Guidelines Advisory Committee Scientific Report: Development and major conclusions. Adv. Nutr. 2016, 7, 438–444. [Google Scholar] [CrossRef] [PubMed]
- Ruxton, C.H.; Derbyshire, E.; Toribio-Mateas, M. Role of fatty acids and micronutrients in healthy ageing: A systematic review of randomised controlled trials set in the context of European dietary surveys of older adults. J. Hum. Nutr. Diet. 2016, 29, 308–324. [Google Scholar] [CrossRef] [PubMed]
- Iolascon, G.; Gimigliano, R.; Bianco, M.; De Sire, A.; Moretti, A.; Giusti, A.; Malavolta, N.; Migliaccio, S.; Migliore, A.; Napoli, N.; et al. Are Dietary Supplements and Nutraceuticals Effective for Musculoskeletal Health and Cognitive Function? A Scoping Review. J. Nutr. Health Aging 2017, 21, 527–538. [Google Scholar] [CrossRef] [PubMed]
- Leech, R.M.; Livingstone, K.M.; Worsley, A.; Timperio, A.; McNaughton, S.A. Meal frequency but not snack frequency is associated with micronutrient intakes and overall diet quality in Australian men and women. J. Nutr. 2016, 146, 2027–2034. [Google Scholar] [CrossRef] [PubMed] [Green Version]
- Hedrick, V.E.; Davy, B.M.; You, W.; Porter, K.J.; Estabrooks, P.A.; Zoellner, J.M. Dietary quality changes in response to a sugar-sweetened beverage–reduction intervention: Results from the Talking Health randomized controlled clinical trial. Am. J. Clin. Nutr. 2017, 105, 824–833. [Google Scholar] [CrossRef] [PubMed] [Green Version]


| Age Group | D 31 | D2 | D3 | D4 | D5 | D6 | D7 | D8 | D9 | D10 |
|---|---|---|---|---|---|---|---|---|---|---|
| 19+ y | <3.79 | ≥3.79–≤5.93 | >5.93–≤7.66 | >7.66–≤9.26 | >9.26–≤10.95 | >10.95–≤12.88 | >12.88–≤15.27 | >15.27–≤18.24 | >18.24–≤23.25 | >23.25 |
| 19–50 y | <3.96 | ≥3.96–≤6.27 | >6.27–≤8.10 | >8.10–≤9.91 | >9.91–≤11.80 | >11.80–≤14.07 | >14.07–≤16.46 | >16.46–≤19.76 | >19.76–≤25.20 | >25.20 |
| 51+ y | <3.63 | ≥3.63–≤5.45 | >5.45–≤7.22 | >7.22–≤8.70 | >8.70‒≤10.10 | >10.10–≤11.55 | >11.55–≤13.66 | >13.66–≤16.42 | >16.42–≤21.04 | >21.04 |
| Age Group | ||||||
|---|---|---|---|---|---|---|
| 19+ y | 19–50 y | 51+ y | ||||
| ß * ± SE | p ** | ß ± SE | p | ß ± SE | p | |
| Minerals | ||||||
| Calcium | 1.47 ± 0.98 | 0.1727 | 2.42 ± 1.10 | 0.0589 | 0.72 ± 0.94 | 0.4675 |
| Copper | 0.27 ± 0.37 | 0.4969 | 0.33 ± 0.35 | 0.3735 | 0.13 ± 0.36 | 0.7287 |
| Iron | 0.16 ± 0.12 | 0.2282 | 0.33 ± 0.19 | 0.1234 | −0.01 ± 0.03 | 0.7076 |
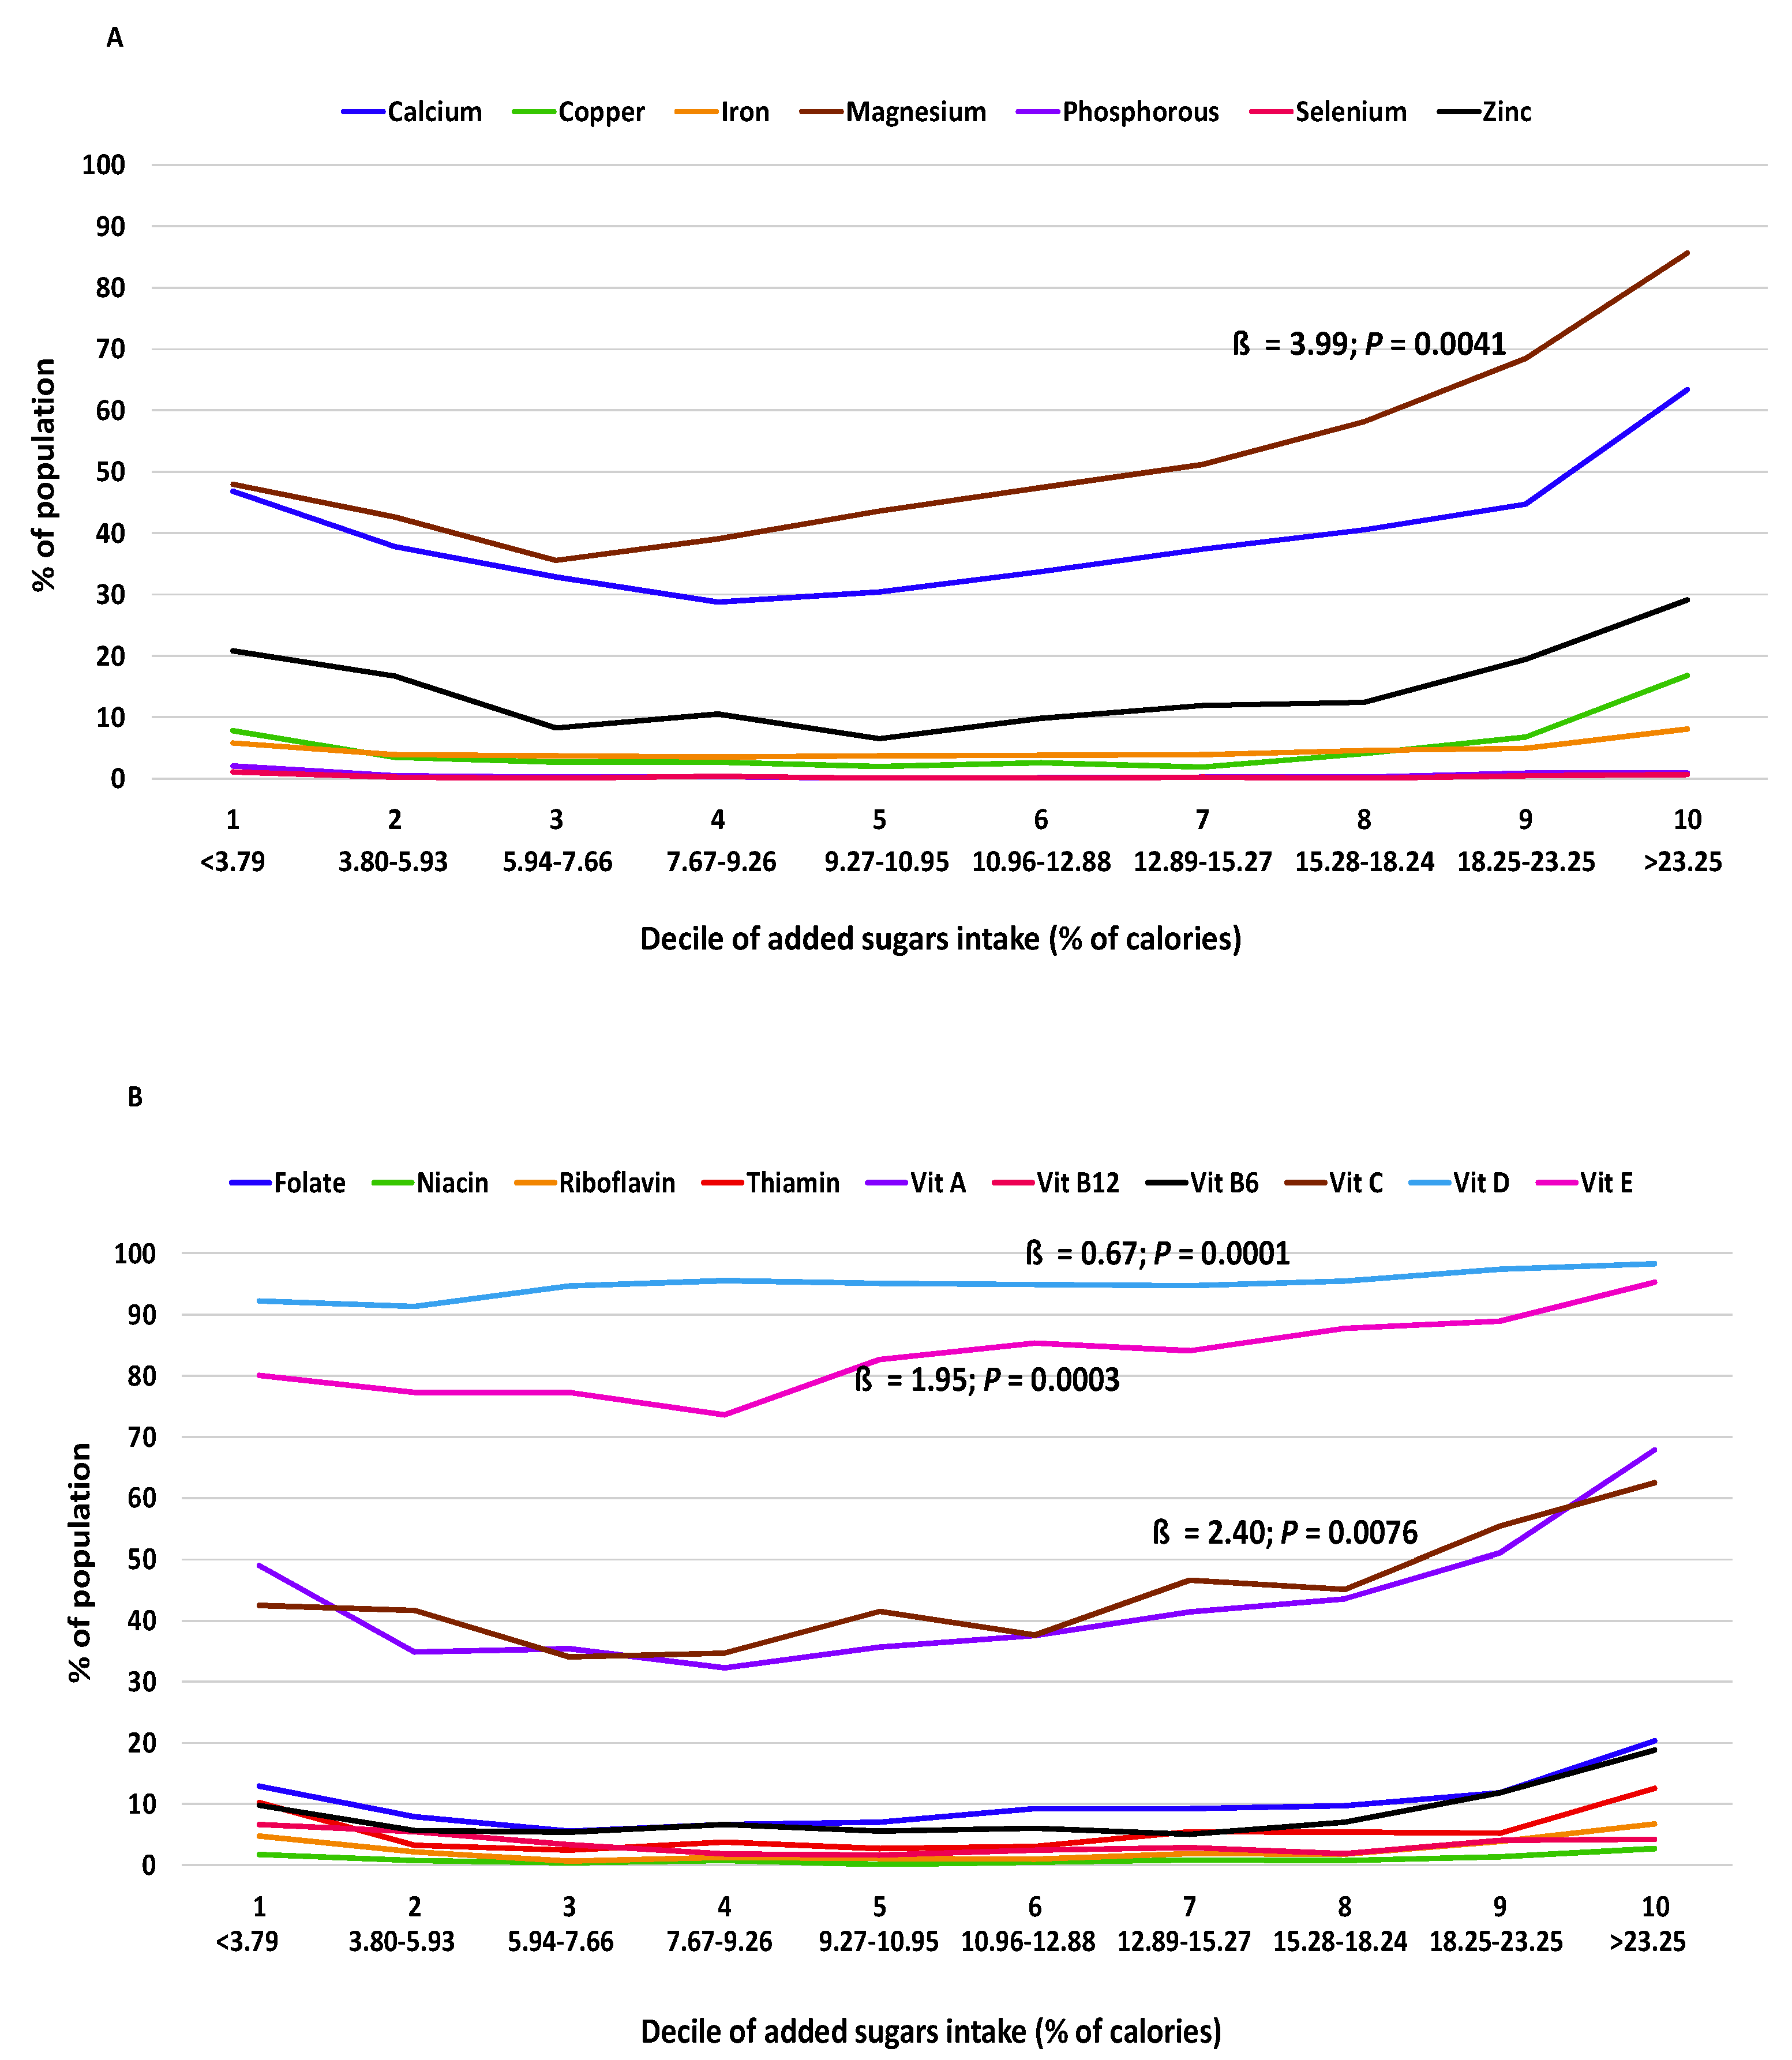
| Magnesium | 3.99 ± 1.00 | 0.0041 | 5.51 ± 0.95 | 0.0004 | 2.92 ± 1.12 | 0.0310 |
| Phosphorus | −0.02 ± 0.05 | 0.6471 | 0.0007 ± 0.0274 | 0.9790 | −0.04 ± 0.07 | 0.5540 |
| Selenium | 0.003 ± 0.022 | 0.8828 | −0.001 ± 0.009 | 0.8945 | 0.01 ± 0.04 | 0.8238 |
| Zinc | 0.51 ± 0.72 | 0.4978 | 0.56 ± 0.59 | 0.3634 | 0.35 ± 0.96 | 0.7285 |
| Vitamins | ||||||
| Folate | 0.53 ± 0.36 | 0.1760 | 0.89 ± 0.34 | 0.0310 | 0.26 ± 0.42 | 0.5451 |
| Niacin | 0.005 ± 0.087 | 0.9569 | 0.02 ± 0.05 | 0.6968 | 0.004 ± 0.146 | 0.9786 |
| Riboflavin | 0.18 ± 0.16 | 0.2747 | 0.23 ± 0.17 | 0.2076 | 0.10 ± 0.15 | 0.5313 |
| Thiamin | 0.29 ± 0.27 | 0.3115 | 0.41 ± 0.20 | 0.0729 | 0.13 ± 0.35 | 0.7182 |
| Vitamin A | 1.82 ± 0.92 | 0.0828 | 3.40 ± 0.91 | 0.0057 | 0.43 ± 1.00 | 0.6793 |
| Vitamin B12 | −0.23 ± 0.19 | 0.2661 | −0.19 ± 0.16 | 0.2681 | −0.27 ± 0.22 | 0.2532 |
| Vitamin B6 | 0.28 ± 0.34 | 0.4460 | 0.22 ± 0.18 | 0.2576 | 0.56 ± 0.57 | 0.3490 |
| Vitamin C | 2.40 ± 0.68 | 0.0076 | 3.37 ± 0.59 | 0.0004 | 1.10 ± 0.79 | 0.2052 |
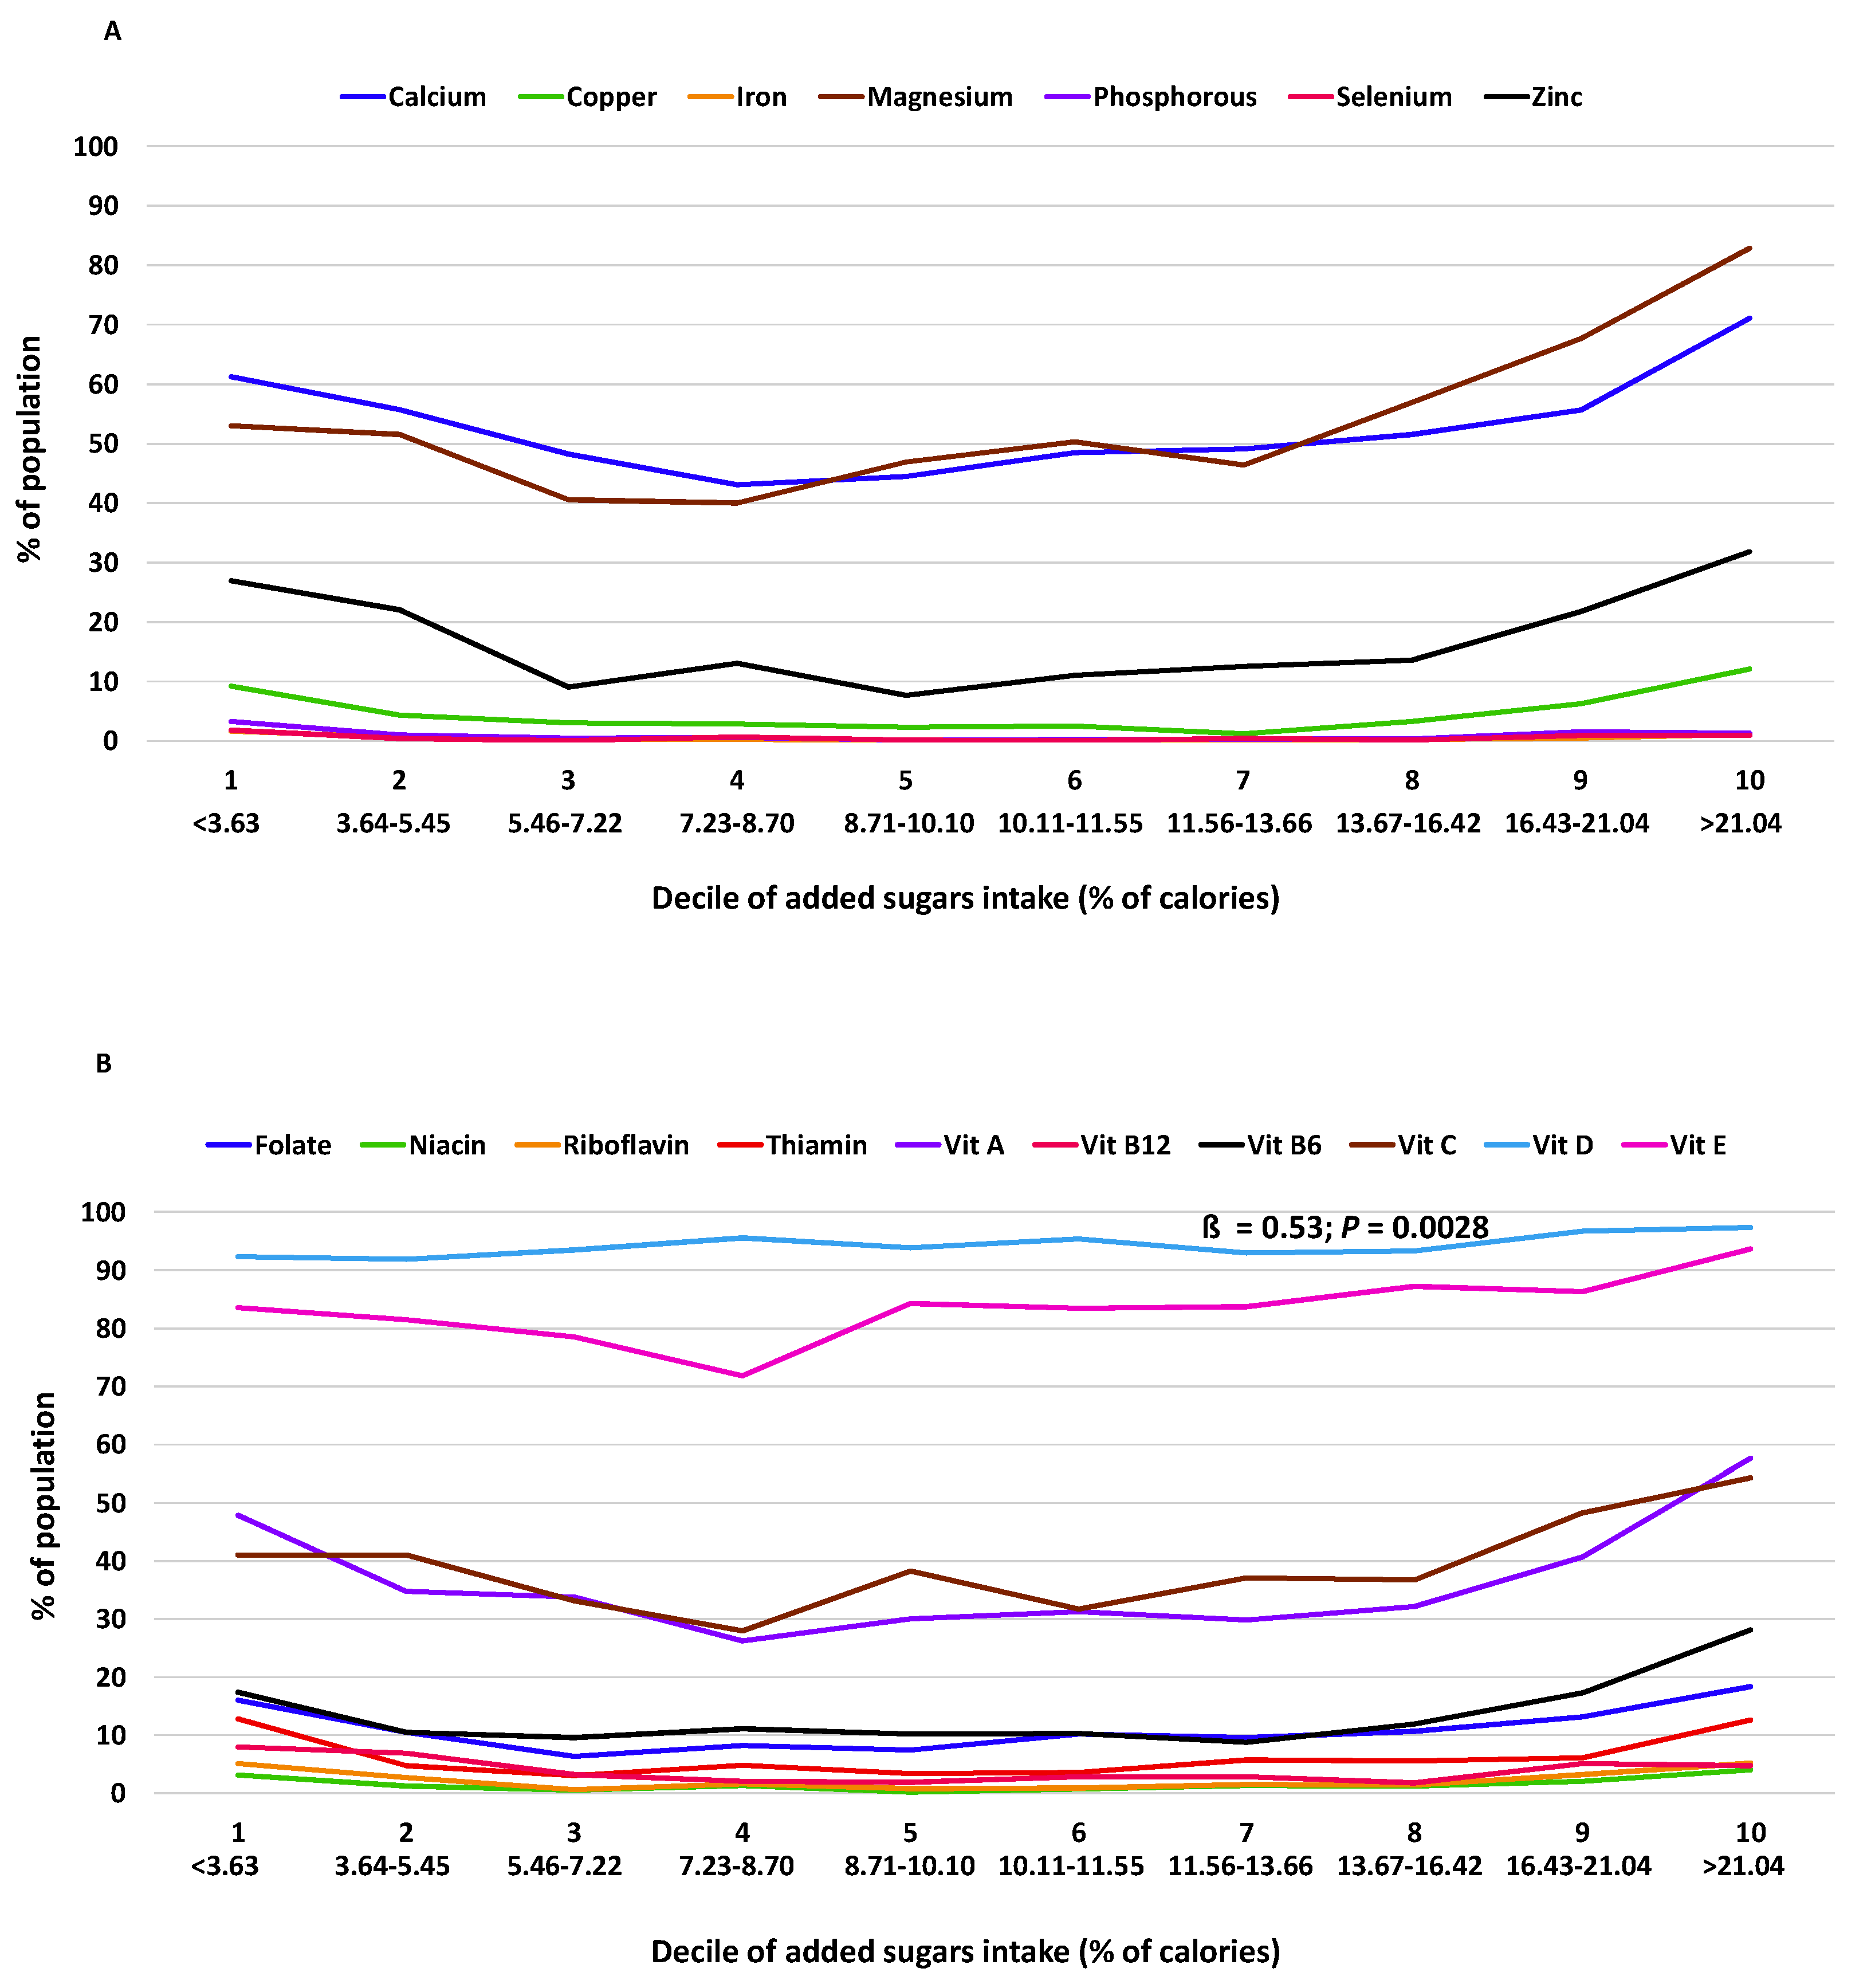
| Vitamin D | 0.67 ± 0.09 | 0.0001 | 0.73 ± 0.09 | <0.0001 | 0.53 ± 0.12 | 0.0028 |
| Vitamin E | 1.95 ± 0.32 | 0.0003 | 2.54 ± 0.26 | <0.0001 | 1.23 ± 0.38 | 0.0122 |
| Age Group | ||||||
|---|---|---|---|---|---|---|
| 19+ y | 19–50 y | 51+ y | ||||
| ß * ± SE | p ** | ß ± SE | p | ß ± SE | p | |
| Minerals | ||||||
| Calcium | 1.54 ± 0.62 | 0.0477 | 1.96 ± 0.65 | 0.0243 | 0.52 ± 0.72 | 0.4989 |
| Copper | 0.16 ± 0.22 | 0.4860 | 0.18 ± 0.26 | 0.5364 | −0.04 ± 0.24 | 0.8713 |
| Iron | 0.12 ± 0.05 | 0.0608 | 0.25 ± 0.07 | 0.0147 | −0.01 ± 0.02 | 0.6135 |
| Magnesium | 3.35 ± 0.82 | 0.0064 | 4.93 ± 0.60 | 0.0002 | 1.70 ± 1.16 | 0.1921 |
| Phosphorus | −0.004 ± 0.034 | 0.9100 | 0.01 ± 0.02 | 0.6995 | −0.03 ± 0.05 | 0.6492 |
| Selenium | 0.01 ± 0.02 | 0.5533 | 0.0005 ± 0.0076 | 0.9544 | 0.02 ± 0.03 | 0.5330 |
| Zinc | 0.64 ± 0.67 | 0.3739 | 0.64 ± 0.53 | 0.2768 | 0.31 ± 0.92 | 0.7473 |
| Vitamins | ||||||
| Folate | 0.55 ± 0.21 | 0.0363 | 0.76 ± 0.14 | 0.0015 | 0.47 ± 0.31 | 0.1810 |
| Niacin | 0.03 ± 0.08 | 0. 6940 | 0.03 ± 0.05 | 0.5197 | 0.05 ± 0.14 | 0.7279 |
| Riboflavin | 0.19 ± 0.12 | 0.1753 | 0.26 ± 0.12 | 0. 0743 | 0.11 ± 0.13 | 0.4354 |
| Thiamin | 0.39 ± 0.14 | 0.0305 | 0.43 ± 0.09 | 0.0028 | 0.31 ± 0.18 | 0.1249 |
| Vitamin A | 2.11 ± 0.43 | 0.0027 | 3.34 ± 0.37 | 0.0001 | 0.42 ± 0.62 | 0.5230 |
| Vitamin B12 | −0.11 ± 0.21 | 0.6003 | −0.12 ± 0.18 | 0.5171 | −0.16 ± 0.22 | 0.5098 |
| Vitamin B6 | 0.29 ± 0.22 | 0.2467 | 0.23 ± 0.15 | 0.1618 | 0.41 ± 0.31 | 0.2255 |
| Vitamin C | 1.98 ± 0.76 | 0.0393 | 2.94 ± 0.70 | 0.0056 | 0.92 ± 0.98 | 0.3816 |
| Vitamin D | 0.54 ± 0.17 | 0.0177 | 0.64 ± 0.18 | 0.0126 | 0.37 ± 0.23 | 0.1533 |
| Vitamin E | 1.89 ± 0.36 | 0.0021 | 2.53 ± 0.26 | 0.0001 | 1.01 ± 0.49 | 0.0858 |
| Age Group | ||||||
|---|---|---|---|---|---|---|
| 19+ y | 19–50 y | 51+ y | ||||
| ß * ± SE | p ** | ß ± SE | p | ß ± SE | p | |
| Minerals | ||||||
| Calcium | 1.72 ± 0.64 | 0.0535 | 2.67 ± 0.74 | 0.0203 | 0.95 ± 0.63 | 0.2083 |
| Copper | 0.09 ± 0.20 | 0.6852 | 0.18 ± 0.26 | 0.5364 | −0.13 ± 0.21 | 0.5653 |
| Iron | 0.15 ± 0.06 | 0.0617 | 0.26 ± 0.12 | 0.0958 | −0.002 ± 0.004 | 0.6086 |
| Magnesium | 4.34 ± 0.24 | 0.0001 | 5.45 ± 0.35 | 0.0001 | 3.03 ± 0.79 | 0.0185 |
| Phosphorus | 0.001 ± 0.025 | 0.9706 | 0.01 ± 0.02 | 0.5784 | −0.02 ± 0.04 | 0.5505 |
| Selenium | 0.01 ± 0.01 | 0.6101 | −0.001 ± 0.009 | 0.8945 | 0.01 ± 0.02 | 0.5915 |
| Zinc | 0.70 ± 0.34 | 0.1102 | 0.75 ± 0.41 | 0.1414 | 0.72 ± 0.42 | 0.1566 |
| Vitamins | ||||||
| Folate | 0.91 ± 0.14 | 0.0030 | 0.99 ± 0.14 | 0.0020 | 0.82 ± 0.20 | 0.0148 |
| Niacin | 0.07 ± 0.10 | 0. 5614 | 0.05 ± 0.06 | 0.4361 | 0.13 ± 0.17 | 0.5016 |
| Riboflavin | 0.23 ± 0.06 | 0.0225 | 0.31 ± 0.08 | 0.9183 | 0.14 ± 0.07 | 0.1236 |
| Thiamin | 0.55 ± 0.22 | 0.0716 | 0.64 ± 0.16 | 0.0729 | 0.45 ± 0.22 | 0.1064 |
| Vitamin A | 1.98 ± 0.41 | 0.0088 | 3.51 ± 0.51 | 0.0023 | −0.14 ± 0.60 | 0.8213 |
| Vitamin B12 | −0.06 ± 0.17 | 0.7375 | 0.003 ± 0.193 | 0.9868 | −0.16 ± 0.14 | 0.3151 |
| Vitamin B6 | 0.05 ± 0.19 | 0.8202 | 0.02 ± 0.16 | 0.9255 | 0.10 ± 0.26 | 0.7119 |
| Vitamin C | 2.32 ± 0.79 | 0.0423 | 3.86 ± 0.88 | 0.0119 | 0.88 ± 1.01 | 0.4329 |
| Vitamin D | 0.05 ± 0.09 | 0.6351 | 0.27 ± 0.16 | 0.1639 | −0.25 ± 0.28 | 0.4196 |
| Vitamin E | 2.40 ± 0.61 | 0.0167 | 2.71 ± 0.50 | 0.0057 | 2.00 ± 0.78 | 0.0616 |
| Age Group | ||||||
|---|---|---|---|---|---|---|
| 19+ y | 19–50 y | 51+ y | ||||
| ß * ± SE | p ** | ß ± SE | p | ß ± SE | p | |
| Minerals | ||||||
| Calcium | 1.10 ± 0.13 | 0.0001 | 1.19 ± 0.15 | 0.0001 | 1.00 ± 0.11 | <0.0001 |
| Copper | 0.37 ± 0.08 | 0.0020 | 0.36 ± 0.08 | 0.0026 | 0.37 ± 0.07 | 0.0012 |
| Iron | 0.12 ± 0.03 | 0.0028 | 0.18 ± 0.05 | 0.0065 | 0.03 ± 0.01 | 0.0291 |
| Magnesium | 1.12 ± 0.10 | <0.0001 | 1.09 ± 0.13 | 0.0001 | 1.18 ± 0.16 | 0.0002 |
| Phosphorus | 0.04 ± 0.01 | 0.0131 | 0.03 ± 0.01 | 0.0035 | 0.07 ± 0.02 | 0.0101 |
| Selenium | 0.02 ± 0.01 | 0.2077 | 0.008 ± 0.004 | 0.0991 | 0.03 ± 0.02 | 0.1485 |
| Zinc | 0.81 ± 0.12 | 0.0003 | 0.66 ± 0.08 | 0.0001 | 1.03 ± 0.18 | 0.0007 |
| Vitamins | ||||||
| Folate | 0.35 ± 0.08 | 0.0040 | 0.31 ± 0.09 | 0.0124 | 0.42 ± 0.09 | 0.0022 |
| Niacin | 0.08 ± 0.02 | 0.0014 | 0.04 ± 0.01 | 0.0035 | 0.14 ± 0.03 | 0.0022 |
| Riboflavin | 0.17 ± 0.05 | 0.0071 | 0.19 ± 0.04 | 0.0023 | 0.15 ± 0.05 | 0.0185 |
| Thiamin | 0.22 ± 0.09 | 0.0450 | 0.13 ± 0.08 | 0.1503 | 0.31 ± 0.10 | 0.0155 |
| Vitamin A | 1.07 ± 0.16 | 0.0003 | 1.03 ± 0.17 | 0.0005 | 1.12 ± 0.16 | 0.0002 |
| Vitamin B12 | 0.19 ± 0.04 | 0.0027 | 0.15 ± 0.04 | 0.0049 | 0.23 ± 0.06 | 0.0056 |
| Vitamin B6 | 0.35 ± 0.09 | 0.0048 | 0.18 ± 0.07 | 0.0431 | 0.57 ± 0.11 | 0.0013 |
| Vitamin C | 0.64 ± 0.12 | 0.0012 | 0.52 ± 0.13 | 0.0061 | 0.75 ± 0.15 | 0.0017 |
| Vitamin D | 0.03 ± 0.04 | 0.5328 | 0.004 ± 0.042 | 0.9265 | 0.04 ± 0.05 | 0.5283 |
| Vitamin E | 0.32 ± 0.09 | 0.0107 | 0.27 ± 0.08 | 0.0102 | 0.34 ± 0.12 | 0.0250 |
© 2020 by the authors. Licensee MDPI, Basel, Switzerland. This article is an open access article distributed under the terms and conditions of the Creative Commons Attribution (CC BY) license (http://creativecommons.org/licenses/by/4.0/).
Share and Cite
Fulgoni, V.L., III; Gaine, P.C.; Scott, M.O.; Ricciuto, L.; DiFrancesco, L. Micronutrient Dilution and Added Sugars Intake in U.S. Adults: Examining This Association Using NHANES 2009–2014. Nutrients 2020, 12, 985. https://doi.org/10.3390/nu12040985
Fulgoni VL III, Gaine PC, Scott MO, Ricciuto L, DiFrancesco L. Micronutrient Dilution and Added Sugars Intake in U.S. Adults: Examining This Association Using NHANES 2009–2014. Nutrients. 2020; 12(4):985. https://doi.org/10.3390/nu12040985
Chicago/Turabian StyleFulgoni, Victor L., III, P. Courtney Gaine, Maria O. Scott, Laurie Ricciuto, and Loretta DiFrancesco. 2020. "Micronutrient Dilution and Added Sugars Intake in U.S. Adults: Examining This Association Using NHANES 2009–2014" Nutrients 12, no. 4: 985. https://doi.org/10.3390/nu12040985