Dietary Intakes Are Associated with HDL-Cholesterol in Survivors of Childhood Acute Lymphoblastic Leukaemia


 , and
, and
Abstract
:1. Introduction
2. Materials and Methods
2.1. Study Population
2.2. Anthropometric Assessment
2.3. Biochemical Assessment
2.4. Assessment of Dietary Intake
2.5. Assessment of Physical Activity
2.6. Assessment of Estimated Energy Requirement, Energy Balance and Recommended Dietary Allowance
2.7. Statistical Analysis
3. Results
3.1. Descriptive Statistics
3.2. Association between Macro- and Micronutrient Intake and Low HDL-C
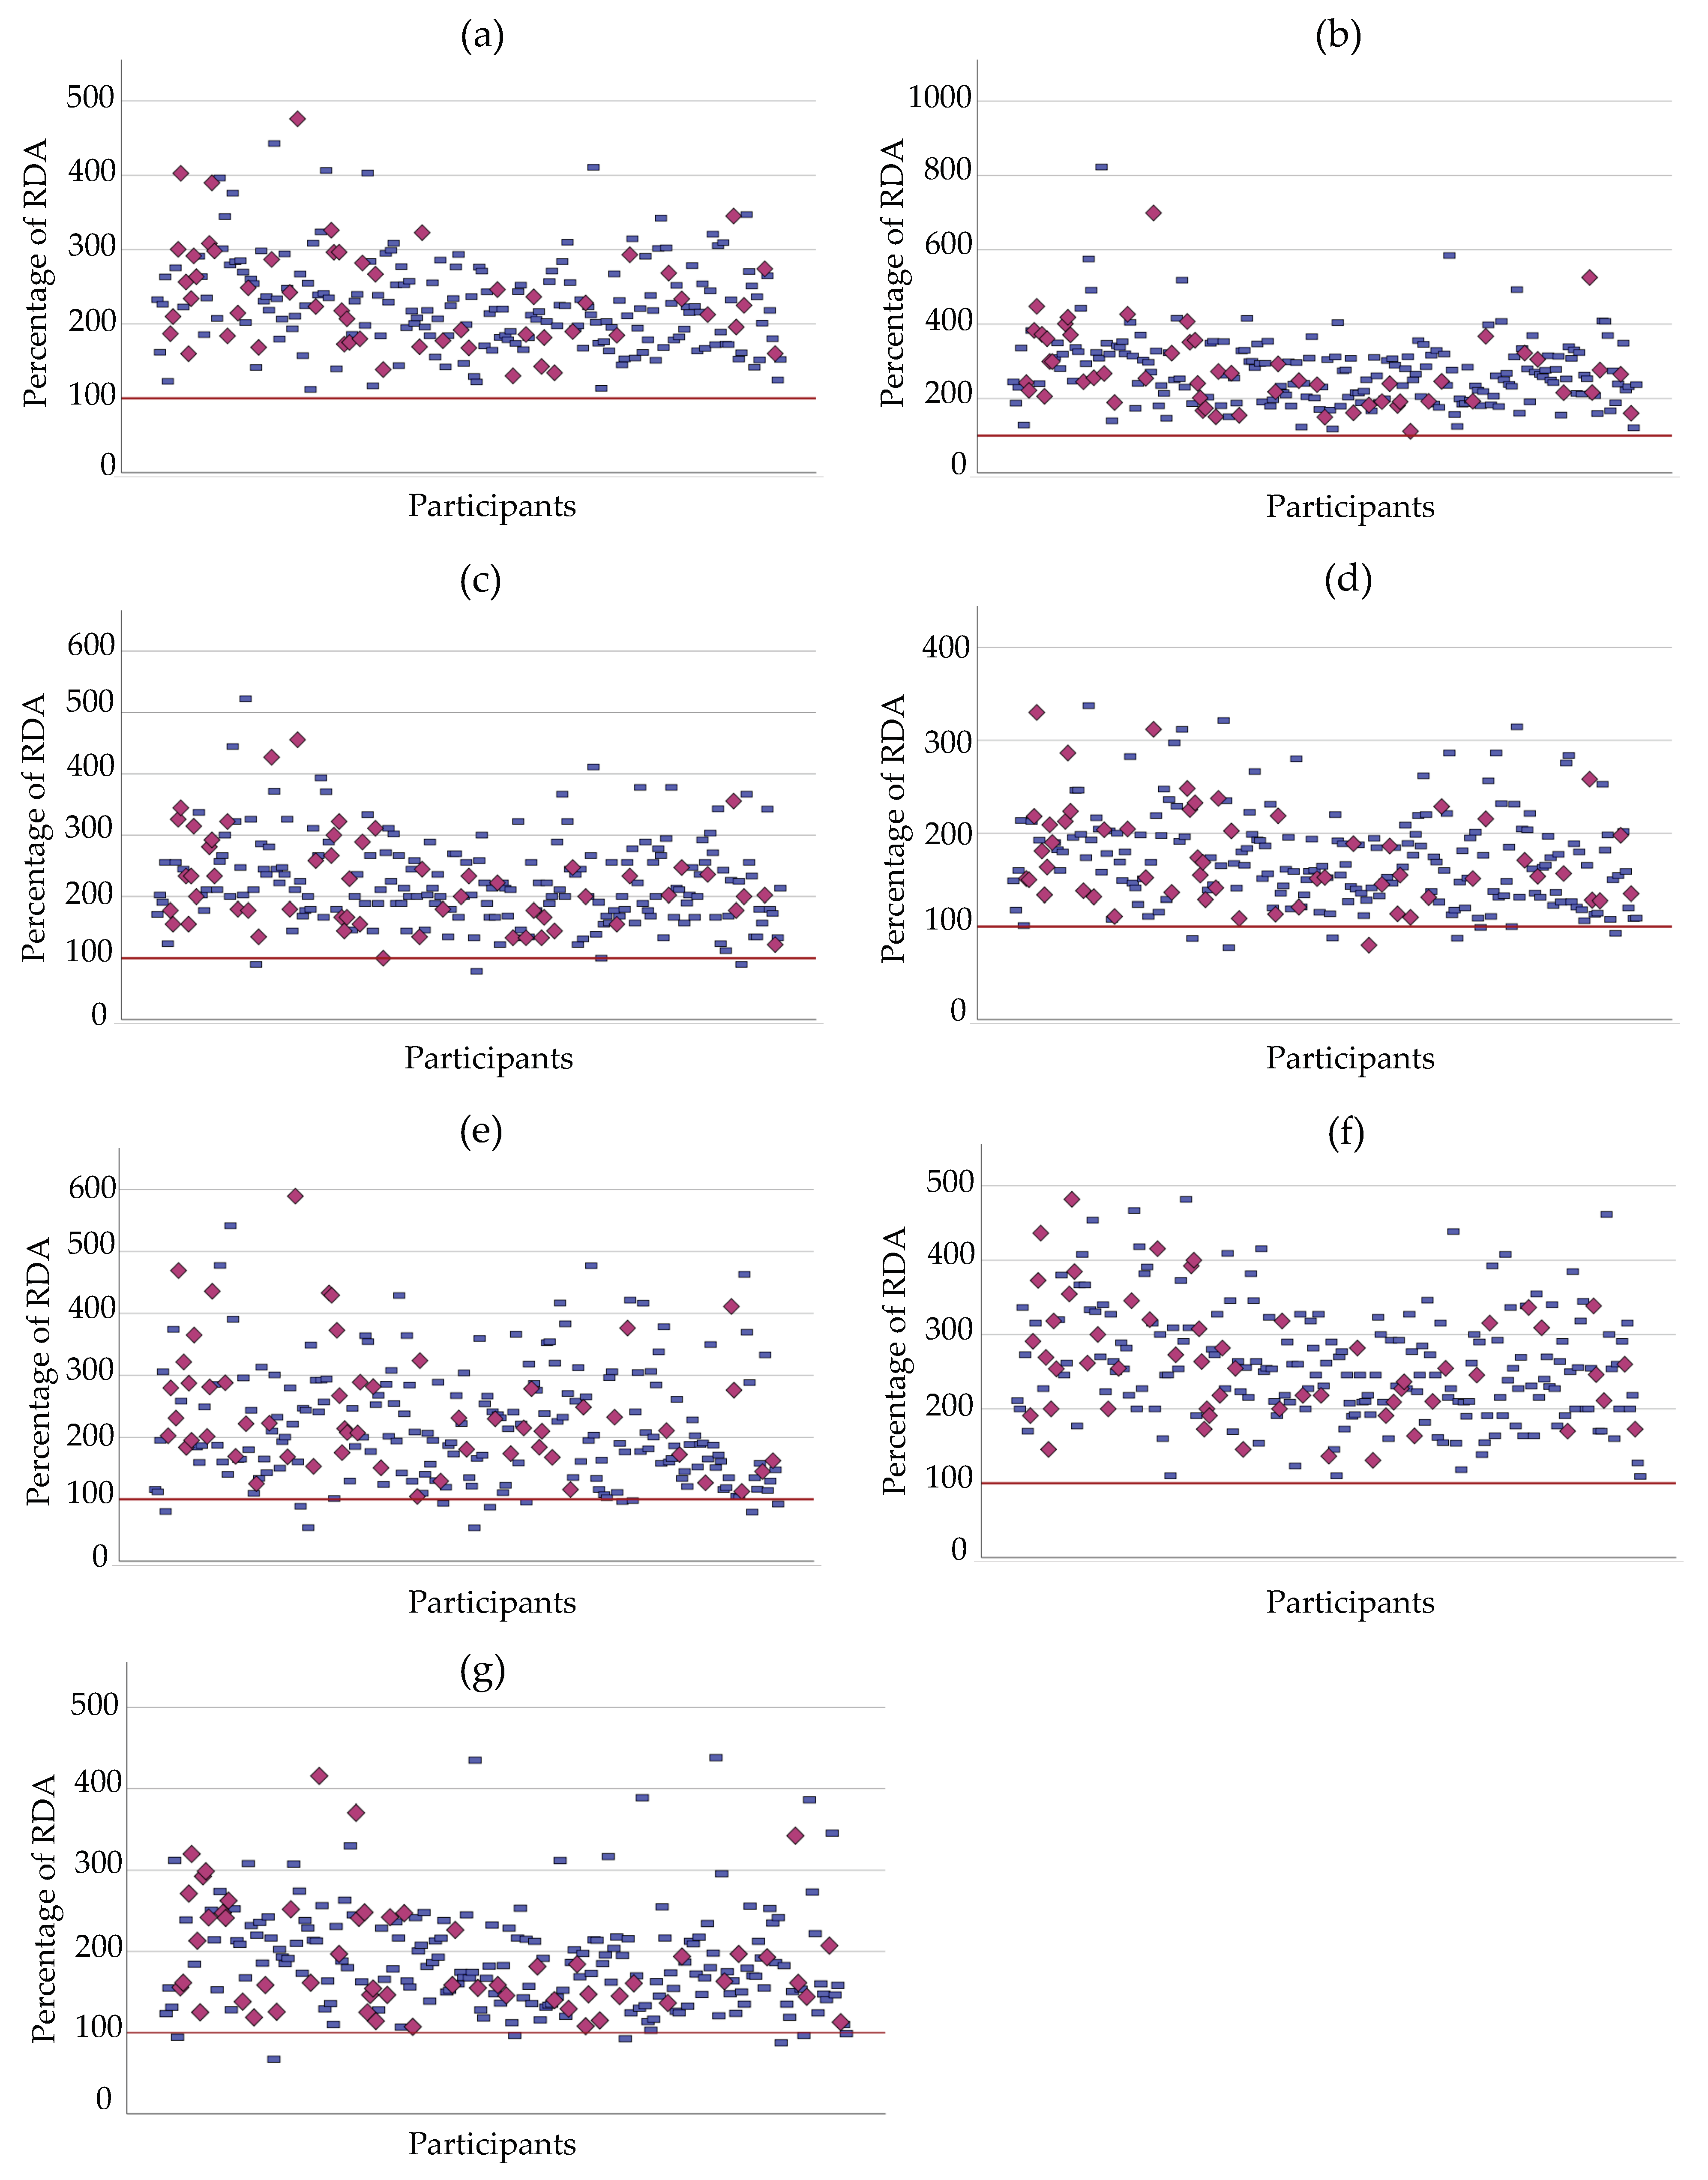
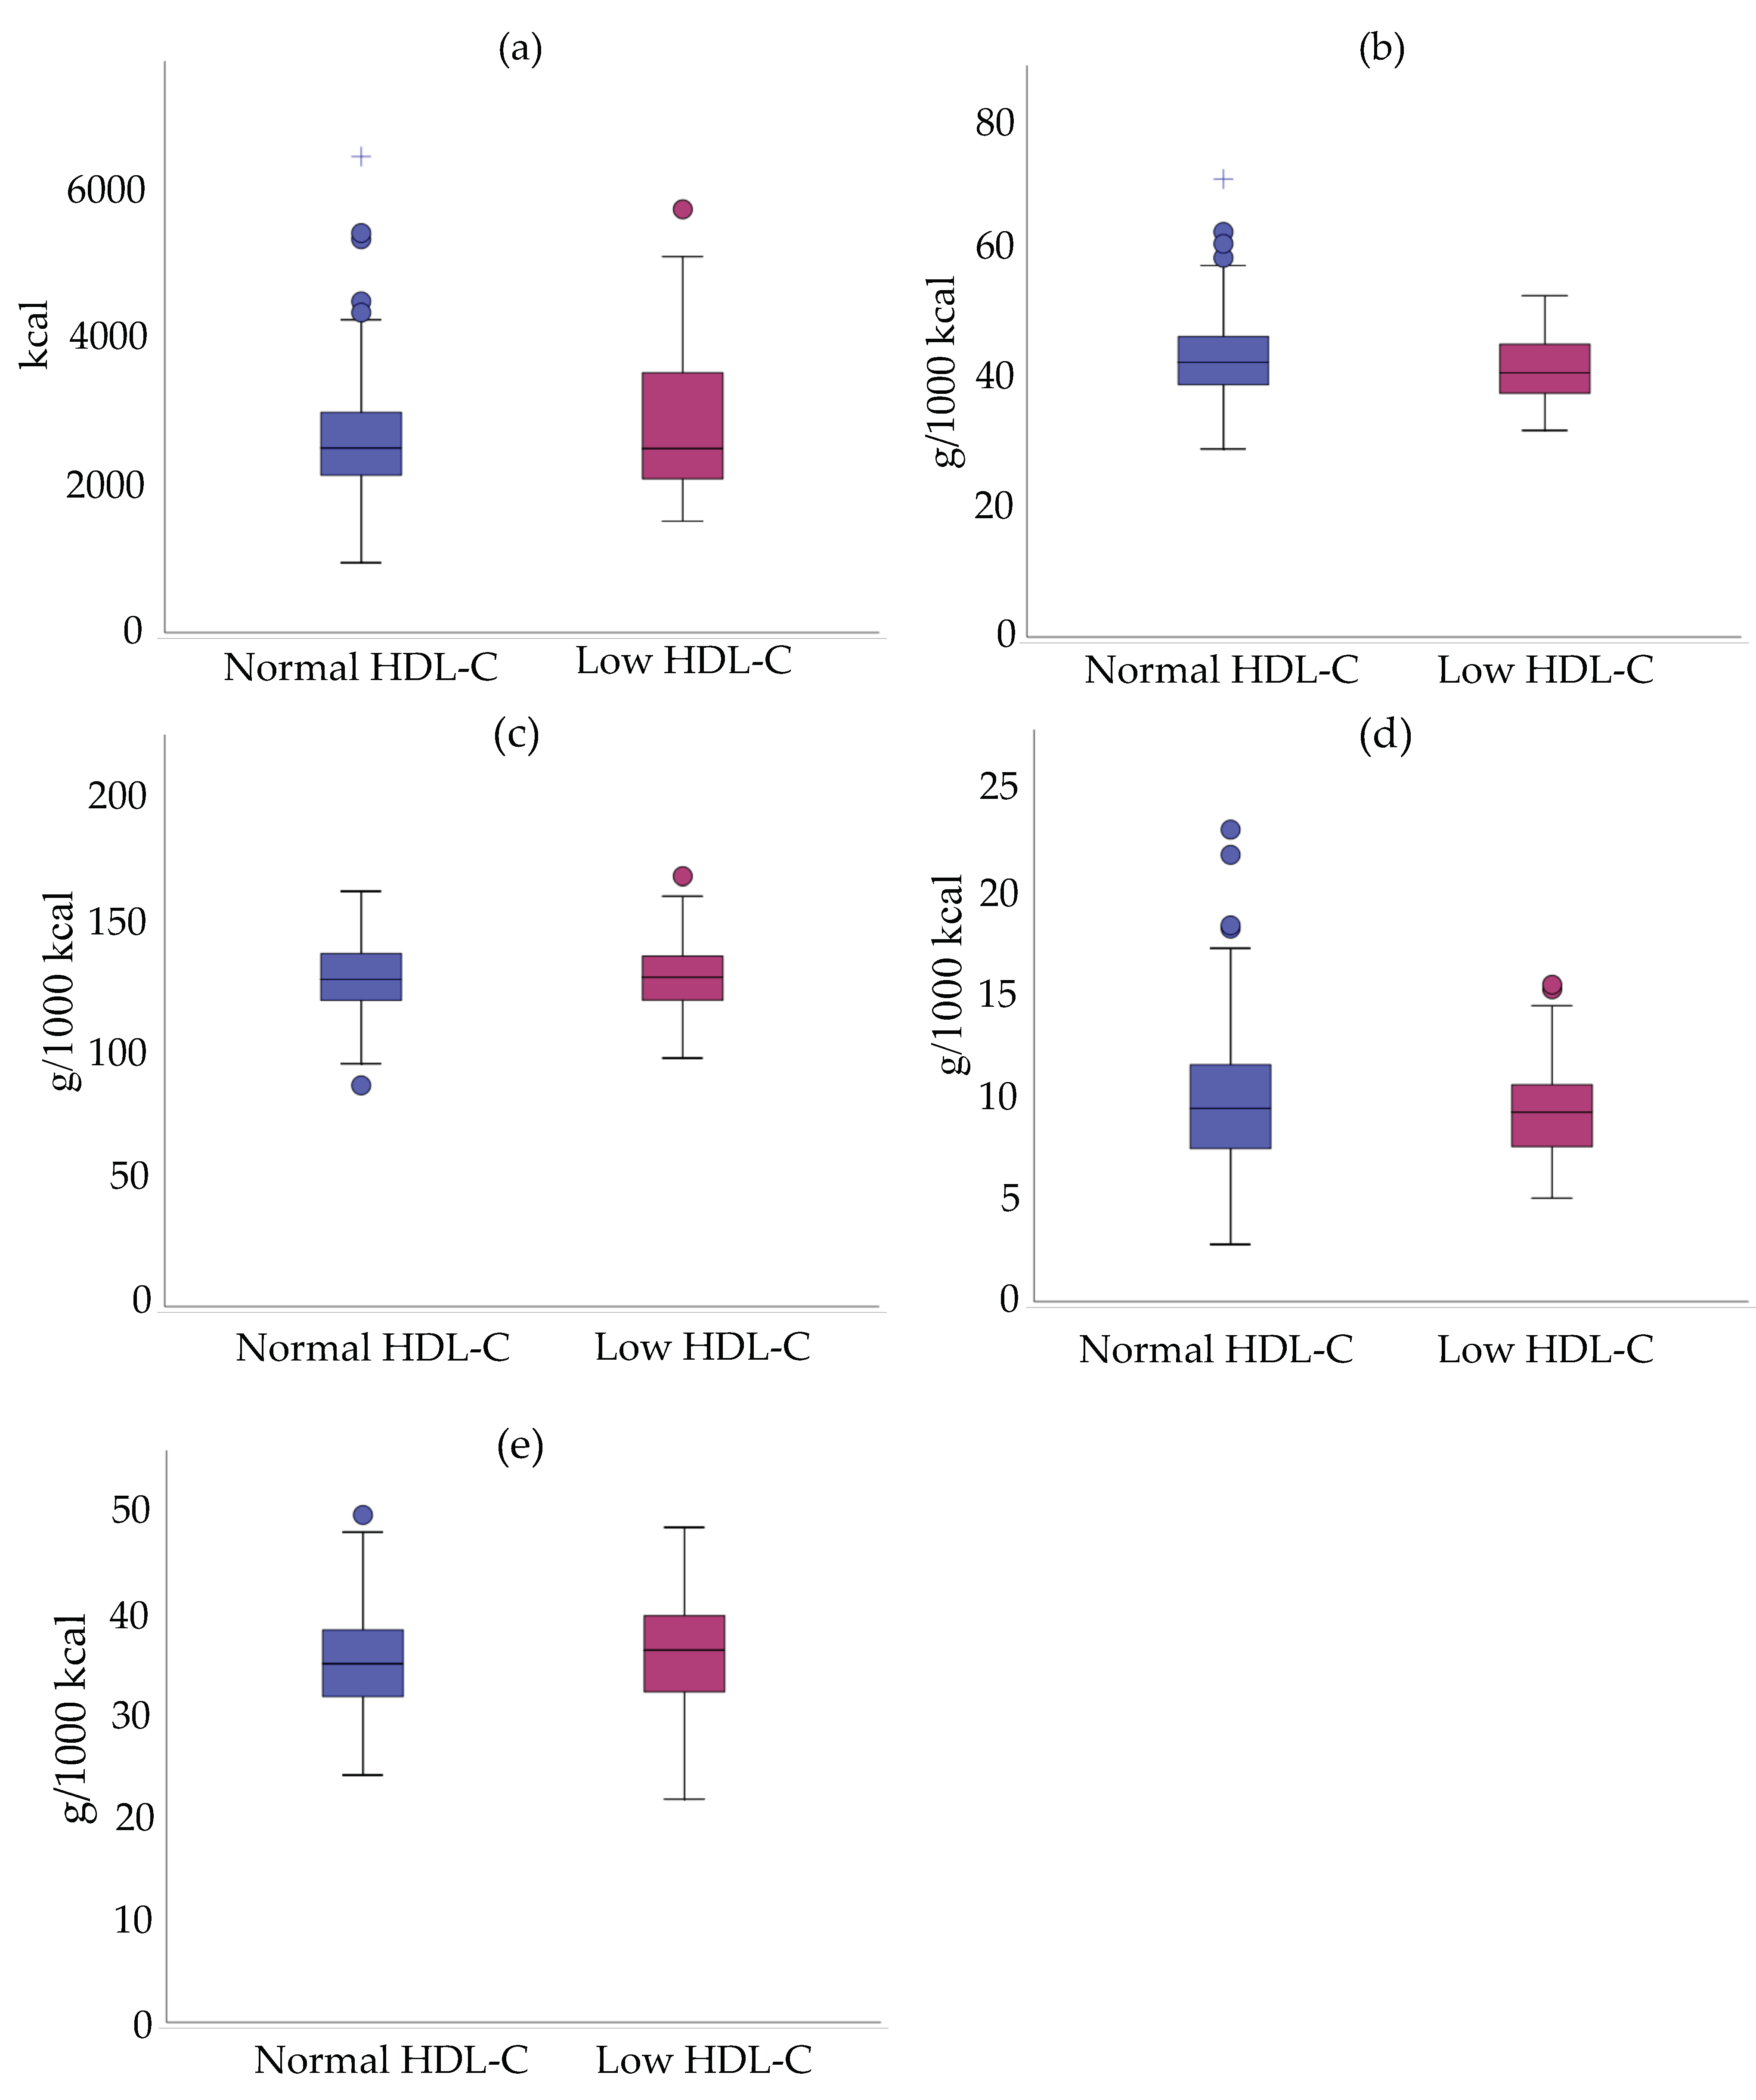
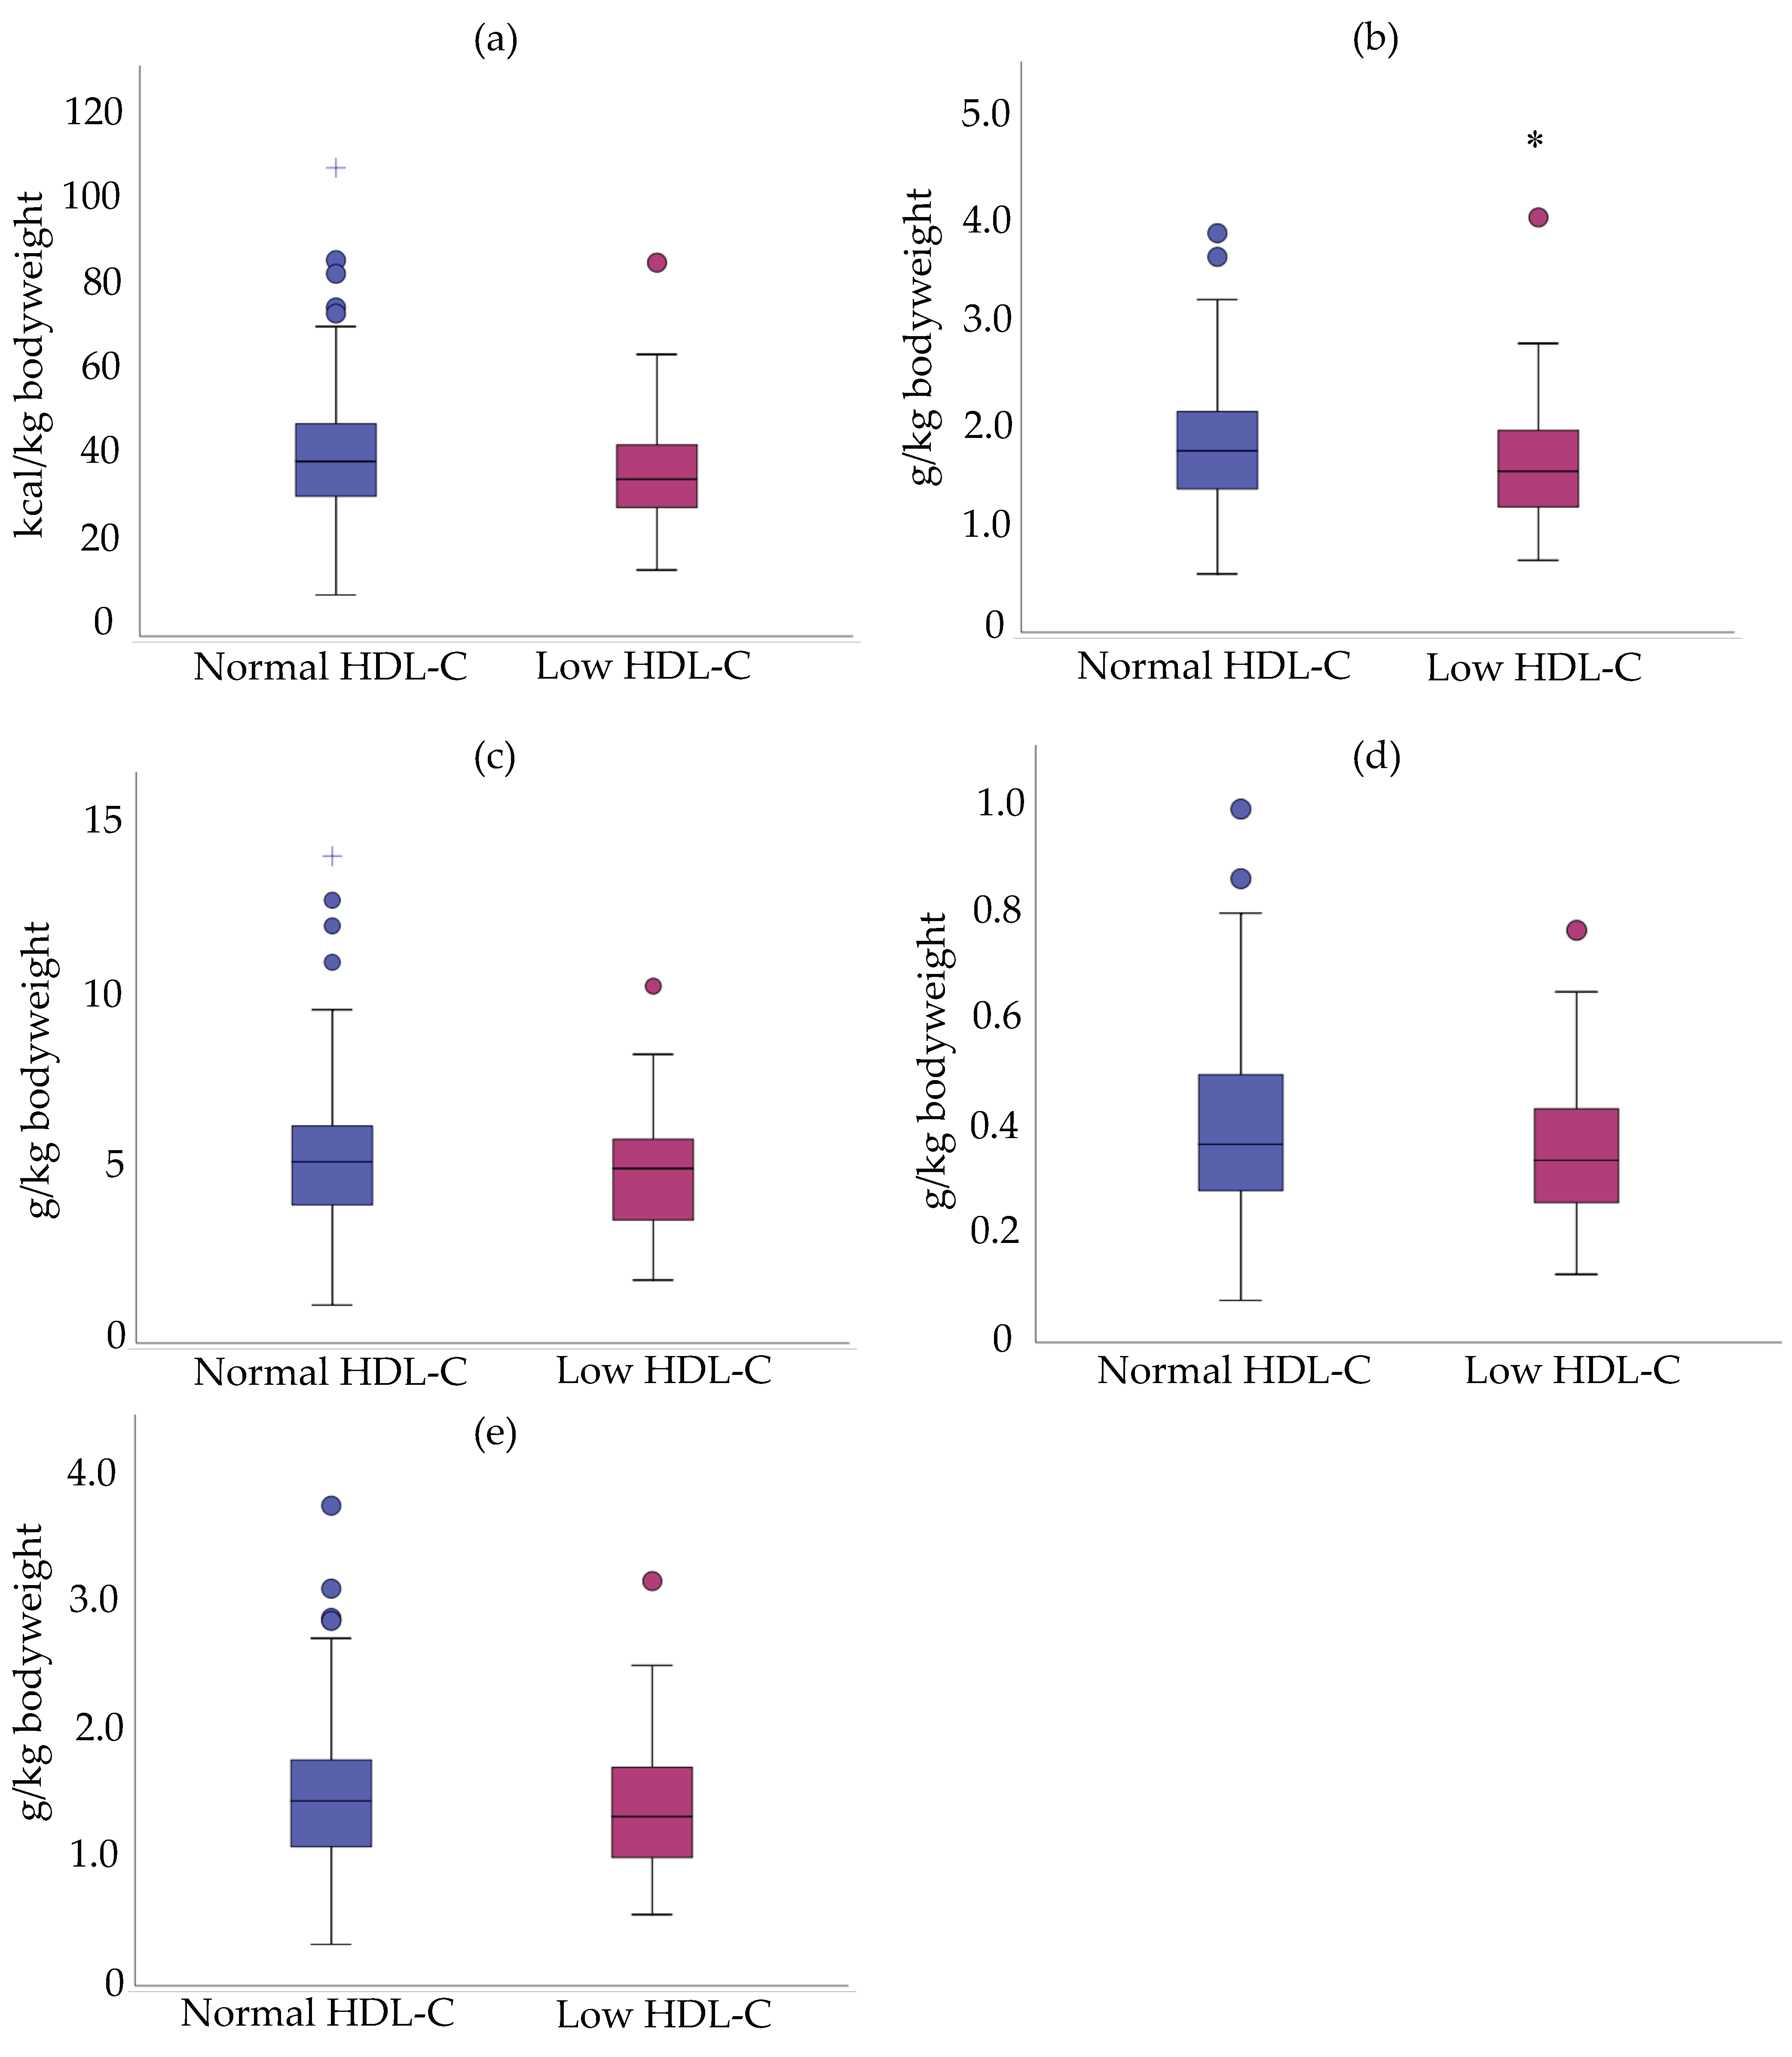
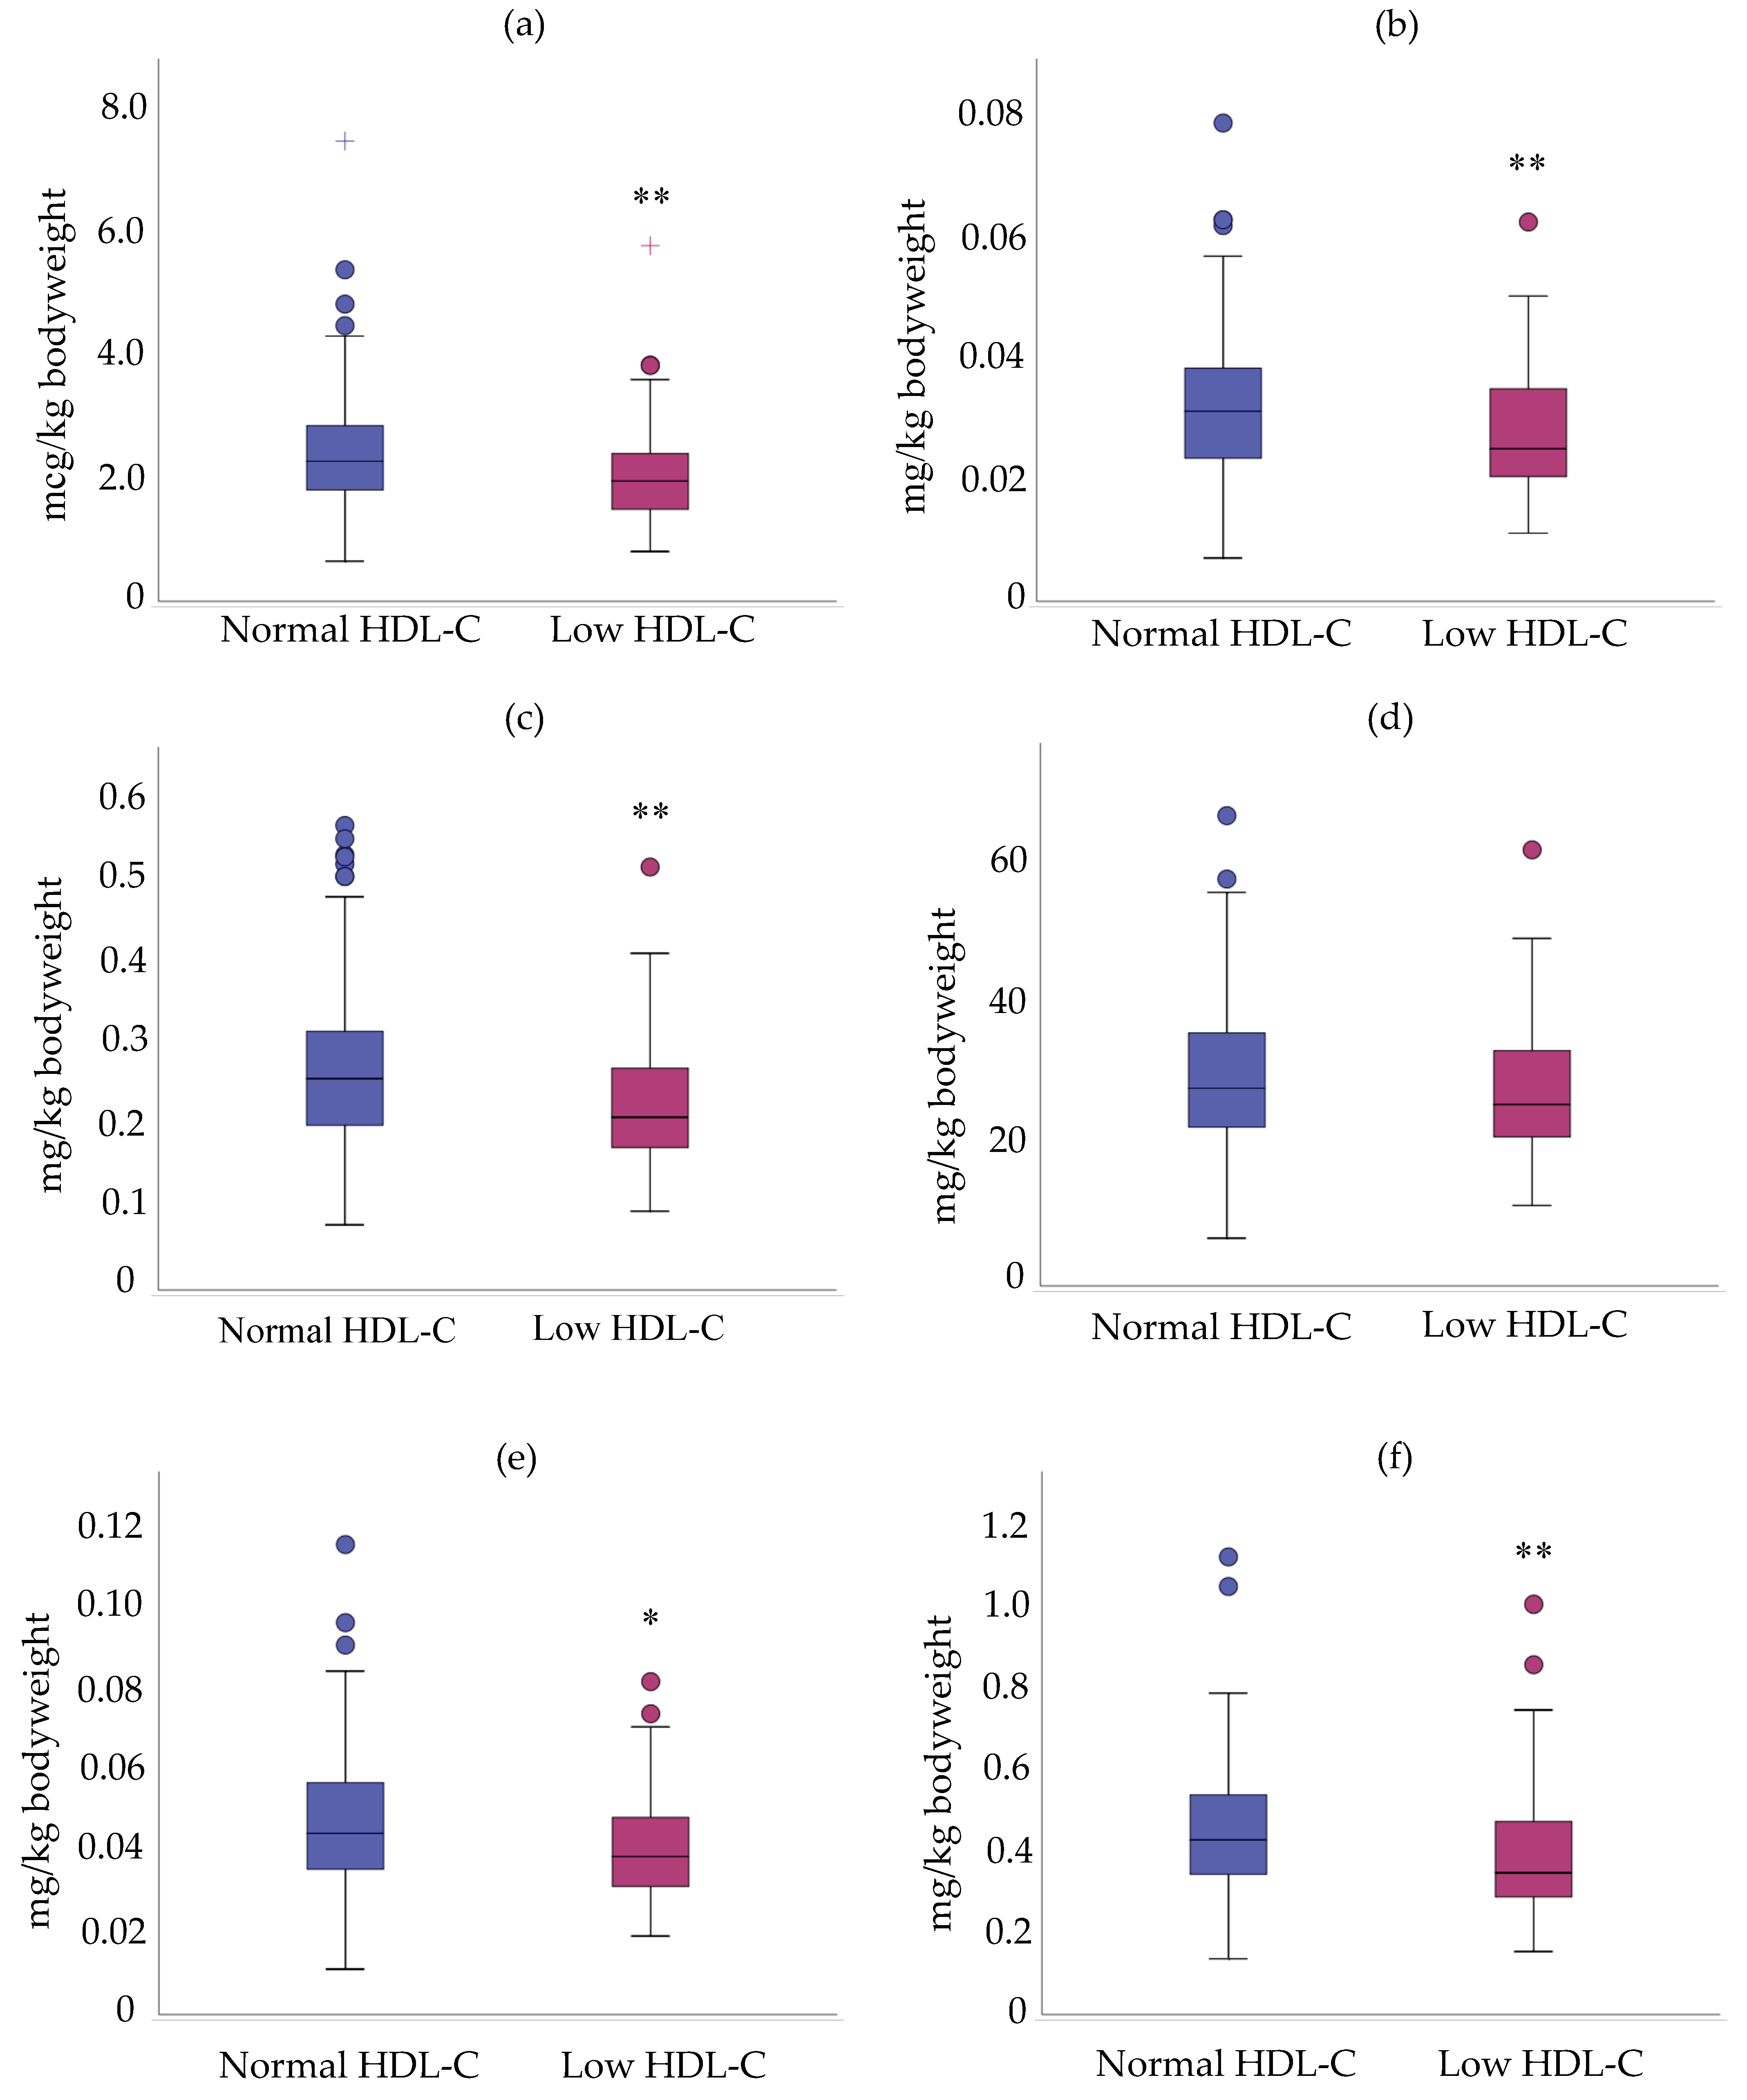
3.3. Relationship between Mean Density Intake/Daily Intake and HDL-C Status
4. Discussion
5. Conclusions
Supplementary Materials
Author Contributions
Funding
Acknowledgments
Conflicts of Interest
References
- Pui, C.-H.; Mullighan, C.G.; Evans, W.E.; Relling, M.V. Pediatric acute lymphoblastic leukemia: Where are we going and how do we get there? Blood 2012, 120, 1165–1174. [Google Scholar] [CrossRef] [PubMed] [Green Version]
- Essig, S.; Li, Q.; Chen, Y.; Hitzler, J.; Leisenring, W.; Greenberg, M.; Sklar, C.; Hudson, M.M.; Armstrong, G.T.; Krull, K.R.; et al. Risk of late effects of treatment in children newly diagnosed with standard-risk acute lymphoblastic leukaemia: A report from the Childhood Cancer Survivor Study cohort. Lancet Oncol. 2014, 15, 841–851. [Google Scholar] [CrossRef] [Green Version]
- Mody, R.; Li, S.; Dover, D.C.; Sallan, S.; Leisenring, W.; Oeffinger, K.C.; Yasui, Y.; Robison, L.L.; Neglia, J.P. Twenty five year follow-up among survivors of childhood acute lymphoblastic leukemia: A report from the Childhood Cancer Survivor Study. Blood 2008, 111, 5515–5523. [Google Scholar] [CrossRef] [PubMed] [Green Version]
- Janiszewski, P.M.; Oeffinger, K.C.; Church, T.S.; Dunn, A.L.; Eshelman, D.A.; Victor, R.G.; Brooks, S.; Turoff, A.J.; Sinclair, E.; Murray, J.C.; et al. Abdominal obesity, liver fat, and muscle composition in survivors of childhood acute lymphoblastic leukemia. J. Clin. Endocrinol. Metab. 2007, 92, 3816–3821. [Google Scholar] [CrossRef] [PubMed] [Green Version]
- Chow, E.J.; Pihoker, C.; Hunt, K.; Wilkinson, K.; Friedman, D.L. Obesity and hypertension among children after treatment for acute lymphoblastic leukemia. Cancer 2007, 110, 2313–2320. [Google Scholar] [CrossRef] [PubMed]
- Neville, K.A.; Cohn, R.J.; Steinbeck, K.S.; Johnston, K.; Walker, J.L. Hyperinsulinemia, impaired glucose tolerance, and diabetes mellitus in survivors of childhood cancer: Prevalence and risk factors. J. Clin. Endocrinol. Metab. 2006, 91, 4401–4407. [Google Scholar] [CrossRef] [Green Version]
- Malhotra, J.; Tonorezos, E.S.; Rozenberg, M.; Vega, G.L.; Sklar, C.A.; Chou, J.; Moskowitz, C.S.; Eshelman-Kent, D.A.; Janiszewski, P.; Ross, R.; et al. Atherogenic low density lipoprotein phenotype in long-term survivors of childhood acute lymphoblastic leukemia. J. Lipid Res. 2012, 53, 2747–2754. [Google Scholar] [CrossRef] [Green Version]
- Link, K.; Moell, C.; Garwicz, S.; Cavallin-Stahl, E.; Bjork, J.; Thilen, U.; Ahren, B.; Erfurth, E.M. Growth hormone deficiency predicts cardiovascular risk in young adults treated for acute lymphoblastic leukemia in childhood. J. Clin. Endocrinol. Metab. 2004, 89, 5003–5012. [Google Scholar] [CrossRef]
- Oeffinger, K.C.; Adams-Huet, B.; Victor, R.G.; Church, T.S.; Snell, P.G.; Dunn, A.L.; Eshelman-Kent, D.A.; Ross, R.; Janiszewski, P.M.; Turoff, A.J.; et al. Insulin resistance and risk factors for cardiovascular disease in young adult survivors of childhood acute lymphoblastic leukemia. J. Clin. Oncol. 2009, 27, 3698–3704. [Google Scholar] [CrossRef] [Green Version]
- Nottage, K.A.; Ness, K.K.; Li, C.; Srivastava, D.; Robison, L.L.; Hudson, M.M. Metabolic syndrome and cardiovascular risk among long-term survivors of acute lymphoblastic leukaemia—From the St. Jude Lifetime Cohort. Br. J. Haematol. 2014, 165, 364–374. [Google Scholar] [CrossRef]
- Morel, S.; Leahy, J.; Fournier, M.; Lamarche, B.; Garofalo, C.; Grimard, G.; Poulain, F.; Delvin, E.; Laverdiere, C.; Krajinovic, M.; et al. Lipid and lipoprotein abnormalities in acute lymphoblastic leukemia survivors. J. Lipid Res. 2017, 58, 982–993. [Google Scholar] [CrossRef] [PubMed] [Green Version]
- Fournier, M.; Bonneil, E.; Garofalo, C.; Grimard, G.; Laverdiere, C.; Krajinovic, M.; Drouin, S.; Sinnett, D.; Marcil, V.; Levy, E. Altered proteome of high-density lipoproteins from paediatric acute lymphoblastic leukemia survivors. Sci. Rep. 2019, 9, 4268. [Google Scholar] [CrossRef] [PubMed] [Green Version]
- Kontush, A.; Chapman, M.J. Antiatherogenic function of HDL particle subpopulations: Focus on antioxidative activities. Curr. Opin. Lipidol. 2010, 21, 312–318. [Google Scholar] [CrossRef] [PubMed]
- Soran, H.; Schofield, J.D.; Durrington, P.N. Antioxidant properties of HDL. Front. Pharmacol. 2015, 6, 222. [Google Scholar] [CrossRef] [Green Version]
- Ruiz, M.; Okada, H.; Dahlback, B. HDL-associated ApoM is anti-apoptotic by delivering sphingosine 1-phosphate to S1P1 & S1P3 receptors on vascular endothelium. Lipids Health Dis. 2017, 16, 36. [Google Scholar] [CrossRef] [Green Version]
- Ebtehaj, S.; Gruppen, E.G.; Parvizi, M.; Tietge, U.J.F.; Dullaart, R.P.F. The anti-inflammatory function of HDL is impaired in type 2 diabetes: Role of hyperglycemia, paraoxonase-1 and low grade inflammation. Cardiovasc. Diabetol. 2017, 16, 132. [Google Scholar] [CrossRef] [Green Version]
- Adams, V.; Besler, C.; Fischer, T.; Riwanto, M.; Noack, F.; Hollriegel, R.; Oberbach, A.; Jehmlich, N.; Volker, U.; Winzer, E.B.; et al. Exercise training in patients with chronic heart failure promotes restoration of high-density lipoprotein functional properties. Circ. Res. 2013, 113, 1345–1355. [Google Scholar] [CrossRef] [Green Version]
- van der Stoep, M.; Korporaal, S.J.; Van Eck, M. High-density lipoprotein as a modulator of platelet and coagulation responses. Cardiovasc. Res. 2014, 103, 362–371. [Google Scholar] [CrossRef] [Green Version]
- Yoo, S.; Nicklas, T.; Baranowski, T.; Zakeri, I.F.; Yang, S.J.; Srinivasan, S.R.; Berenson, G.S. Comparison of dietary intakes associated with metabolic syndrome risk factors in young adults: The Bogalusa Heart Study. Am. J. Clin. Nutr. 2004, 80, 841–848. [Google Scholar] [CrossRef] [Green Version]
- Wirfalt, E.; Hedblad, B.; Gullberg, B.; Mattisson, I.; Andren, C.; Rosander, U.; Janzon, L.; Berglund, G. Food patterns and components of the metabolic syndrome in men and women: A cross-sectional study within the Malmo Diet and Cancer cohort. Am. J. Epidemiol. 2001, 154, 1150–1159. [Google Scholar] [CrossRef] [Green Version]
- Lutsey, P.L.; Steffen, L.M.; Stevens, J. Dietary intake and the development of the metabolic syndrome: The Atherosclerosis Risk in Communities study. Circulation 2008, 117, 754–761. [Google Scholar] [CrossRef] [PubMed] [Green Version]
- Tovar, J.; Johansson, M.; Bjorck, I. A multifunctional diet improves cardiometabolic-related biomarkers independently of weight changes: An 8-week randomized controlled intervention in healthy overweight and obese subjects. Eur. J. Nutr. 2016, 55, 2295–2306. [Google Scholar] [CrossRef] [PubMed]
- Erlund, I.; Koli, R.; Alfthan, G.; Marniemi, J.; Puukka, P.; Mustonen, P.; Mattila, P.; Jula, A. Favorable effects of berry consumption on platelet function, blood pressure, and HDL cholesterol. Am. J. Clin. Nutr. 2008, 87, 323–331. [Google Scholar] [CrossRef] [PubMed] [Green Version]
- Bradbury, K.E.; Crowe, F.L.; Appleby, P.N.; Schmidt, J.A.; Travis, R.C.; Key, T.J. Serum concentrations of cholesterol, apolipoprotein A-I and apolipoprotein B in a total of 1694 meat-eaters, fish-eaters, vegetarians and vegans. Eur. J. Clin. Nutr. 2014, 68, 178–183. [Google Scholar] [CrossRef] [Green Version]
- Satija, A.; Bhupathiraju, S.N.; Rimm, E.B.; Spiegelman, D.; Chiuve, S.E.; Borgi, L.; Willett, W.C.; Manson, J.E.; Sun, Q.; Hu, F.B. Plant-Based Dietary Patterns and Incidence of Type 2 Diabetes in US Men and Women: Results from Three Prospective Cohort Studies. PLoS Med. 2016, 13, e1002039. [Google Scholar] [CrossRef] [Green Version]
- Steffen, L.M.; Kroenke, C.H.; Yu, X.; Pereira, M.A.; Slattery, M.L.; Van Horn, L.; Gross, M.D.; Jacobs, D.R., Jr. Associations of plant food, dairy product, and meat intakes with 15-y incidence of elevated blood pressure in young black and white adults: The Coronary Artery Risk Development in Young Adults (CARDIA) Study. Am. J. Clin. Nutr. 2005, 82, 1169–1177. [Google Scholar] [CrossRef]
- Kaliora, A.C.; Dedoussis, G.V. Natural antioxidant compounds in risk factors for CVD. Pharmacol. Res. 2007, 56, 99–109. [Google Scholar] [CrossRef]
- Robien, K.; Ness, K.K.; Klesges, L.M.; Baker, K.S.; Gurney, J.G. Poor adherence to dietary guidelines among adult survivors of childhood acute lymphoblastic leukemia. J. Pediatric Hematol. Oncol. 2008, 30, 815–822. [Google Scholar] [CrossRef] [Green Version]
- Tylavsky, F.A.; Smith, K.; Surprise, H.; Garland, S.; Yan, X.; McCammon, E.; Hudson, M.M.; Pui, C.H.; Kaste, S.C. Nutritional intake of long-term survivors of childhood acute lymphoblastic leukemia: Evidence for bone health interventional opportunities. Pediatric Blood Cancer 2010, 55, 1362–1369. [Google Scholar] [CrossRef] [Green Version]
- Tonorezos, E.S.; Robien, K.; Eshelman-Kent, D.; Moskowitz, C.S.; Church, T.S.; Ross, R.; Oeffinger, K.C. Contribution of diet and physical activity to metabolic parameters among survivors of childhood leukemia. Cancer Causes Control 2013, 24, 313–321. [Google Scholar] [CrossRef] [Green Version]
- Landy, D.C.; Lipsitz, S.R.; Kurtz, J.M.; Hinkle, A.S.; Constine, L.S.; Adams, M.J.; Lipshultz, S.E.; Miller, T.L. Dietary quality, caloric intake, and adiposity of childhood cancer survivors and their siblings: An analysis from the cardiac risk factors in childhood cancer survivors study. Nutr. Cancer 2013, 65, 547–555. [Google Scholar] [CrossRef] [PubMed]
- Hernaez, A.; Castaner, O.; Fito, M. Response to Letter Regarding Article, “Mediterranean Diet Improves High-Density Lipoprotein Function in High-Cardiovascular-Risk Individuals: A Randomized Controlled Trial”. Circulation 2017, 136, 342–343. [Google Scholar] [CrossRef] [PubMed]
- Kim, D.S.; Burt, A.A.; Ranchalis, J.E.; Jarvik, L.E.; Eintracht, J.F.; Furlong, C.E.; Jarvik, G.P. Effects of dietary components on high-density lipoprotein measures in a cohort of 1,566 participants. Nutr. Metab. 2014, 11, 44. [Google Scholar] [CrossRef] [PubMed] [Green Version]
- Marcoux, S.; Drouin, S.; Laverdiere, C.; Alos, N.; Andelfinger, G.U.; Bertout, L.; Curnier, D.; Friedrich, M.G.; Kritikou, E.A.; Lefebvre, G.; et al. The PETALE study: Late adverse effects and biomarkers in childhood acute lymphoblastic leukemia survivors. Pediatric Blood Cancer 2016. [Google Scholar] [CrossRef] [PubMed]
- Health, N.I.O. Clinical guidelines for the identification, evaluation, and treatment of overweight and obesity in adults-the evidence report. Obes. Res. 1998, 6, 51S–209S. [Google Scholar]
- Friedewald, W.; Levy, R.; Fredickson, D. Estimation of the Concentration of Low-Density Lipoprotein Cholesterol in Plasma, Without Use of the Preparative Ultracentrifuge. Clin. Chem. 1976, 18, 499–502. [Google Scholar]
- Genest, J.; McPherson, R.; Frohlich, J.; Anderson, T.; Campbell, N.; Carpentier, A.; Couture, P.; Dufour, R.; Fodor, G.; Francis, G.A.; et al. 2009 Canadian Cardiovascular Society/Canadian guidelines for the diagnosis and treatment of dyslipidemia and prevention of cardiovascular disease in the adult—2009 recommendations. Can. J. Cardiol. 2009, 25, 567–579. [Google Scholar] [CrossRef] [Green Version]
- Expert Panel on Integrated Guidelines for Cardiovascular Health and Risk Reduction in Children and Adolescents; National Heart; Lung; Blood Institute. Expert panel on integrated guidelines for cardiovascular health and risk reduction in children and adolescents: Summary report. Pediatrics 2011, 128, S213–S256. [Google Scholar] [CrossRef] [Green Version]
- Morel, S.; Portolese, O.; Chertouk, Y.; Leahy, J.; Bertout, L.; Laverdiere, C.; Krajinovic, M.; Sinnett, D.; Levy, E.; Marcil, V. Development and relative validation of a food frequency questionnaire for French-Canadian adolescent and young adult survivors of acute lymphoblastic leukemia. Nutr. J. 2018, 17, 45. [Google Scholar] [CrossRef] [Green Version]
- Taylor, H.L.; Jacobs, D.R., Jr.; Schucker, B.; Knudsen, J.; Leon, A.S.; Debacker, G. A questionnaire for the assessment of leisure time physical activities. J. Chronic Dis. 1978, 31, 741–755. [Google Scholar] [CrossRef]
- Kriska, A.M.; Caspersen, C.J. Introduction to a collection of physical activity questionnaires. Med. Sci. Sports Exerc. 1997, 29, 5–9. [Google Scholar] [CrossRef]
- Montoye, H.J. Estimation of habitual physical activity by questionnaire and interview. Am. J. Clin. Nutr. 1971, 24, 1113–1118. [Google Scholar] [CrossRef] [PubMed]
- Ridley, K.; Ainsworth, B.E.; Olds, T.S. Development of a compendium of energy expenditures for youth. Int. J. Behav. Nutr. Phys. Act 2008, 5, 45. [Google Scholar] [CrossRef] [PubMed] [Green Version]
- Governement of Canada. Dietary Reference Intakes Tables. Available online: https://www.canada.ca/en/health-canada/services/food-nutrition/healthy-eating/dietary-reference-intakes/tables.html (accessed on 9 September 2019).
- Khoury, M.; Manlhiot, C.; McCrindle, B.W. Role of the waist/height ratio in the cardiometabolic risk assessment of children classified by body mass index. J. Am. Coll. Cardiol. 2013, 62, 742–751. [Google Scholar] [CrossRef] [PubMed] [Green Version]
- Ashwell, M.; Gunn, P.; Gibson, S. Waist-to-height ratio is a better screening tool than waist circumference and BMI for adult cardiometabolic risk factors: Systematic review and meta-analysis. Obes. Rev. 2012, 13, 275–286. [Google Scholar] [CrossRef] [PubMed]
- Pasiakos, S.M.; Lieberman, H.R.; Fulgoni, V.L. Higher-protein diets are associated with higher HDL cholesterol and lower BMI and waist circumference in US adults. J. Nutr. 2015, 145, 605–614. [Google Scholar] [CrossRef] [Green Version]
- Andraski, A.B.; Singh, S.A.; Lee, L.H.; Higashi, H.; Smith, N.; Zhang, B.; Aikawa, M.; Sacks, F.M. Effects of Replacing Dietary Monounsaturated Fat With Carbohydrate on HDL (High-Density Lipoprotein) Protein Metabolism and Proteome Composition in Humans. Arterioscler. Thromb. Vasc. Biol. 2019. [Google Scholar] [CrossRef]
- Mansoor, N.; Vinknes, K.J.; Veierod, M.B.; Retterstol, K. Effects of low-carbohydrate diets v. low-fat diets on body weight and cardiovascular risk factors: A meta-analysis of randomised controlled trials. Br. J. Nutr. 2016, 115, 466–479. [Google Scholar] [CrossRef]
- Kang, Y.E.; Kim, J.M.; Joung, K.H.; Lee, J.H.; You, B.R.; Choi, M.J.; Ryu, M.J.; Ko, Y.B.; Lee, M.A.; Lee, J.; et al. The Roles of Adipokines, Proinflammatory Cytokines, and Adipose Tissue Macrophages in Obesity-Associated Insulin Resistance in Modest Obesity and Early Metabolic Dysfunction. PLoS ONE 2016, 11, e0154003. [Google Scholar] [CrossRef] [Green Version]
- Farb, M.G.; Gokce, N. Visceral adiposopathy: A vascular perspective. Horm. Mol. Biol. Clin. Investig. 2015, 21, 125–136. [Google Scholar] [CrossRef]
- Tangvarasittichai, S.; Pongthaisong, S.; Meemark, S.; Tangvarasittichai, O. Abdominal Obesity Associated with Elevated Serum Butyrylcholinesterase Activity, Insulin Resistance and Reduced High Density Lipoprotein-Cholesterol Levels. Indian J. Clin. Biochem. 2015, 30, 275–280. [Google Scholar] [CrossRef] [PubMed] [Green Version]
- Taylor, A.E.; Ebrahim, S.; Ben-Shlomo, Y.; Martin, R.M.; Whincup, P.H.; Yarnell, J.W.; Wannamethee, S.G.; Lawlor, D.A. Comparison of the associations of body mass index and measures of central adiposity and fat mass with coronary heart disease, diabetes, and all-cause mortality: A study using data from 4 UK cohorts. Am. J. Clin. Nutr. 2010, 91, 547–556. [Google Scholar] [CrossRef] [PubMed] [Green Version]
- Roever, L.S.; Resende, E.S.; Diniz, A.L.; Penha-Silva, N.; Veloso, F.C.; Casella-Filho, A.; Dourado, P.M.; Chagas, A.C. Abdominal Obesity and Association With Atherosclerosis Risk Factors: The Uberlandia Heart Study. Med. Baltim. 2016, 95, e1357. [Google Scholar] [CrossRef] [PubMed]
- Tresaco, B.; Moreno, L.A.; Ruiz, J.R.; Ortega, F.B.; Bueno, G.; Gonzalez-Gross, M.; Warnberg, J.; Gutierrez, A.; Garcia-Fuentes, M.; Marcos, A.; et al. Truncal and abdominal fat as determinants of high triglycerides and low HDL-cholesterol in adolescents. Obes. Silver Spring 2009, 17, 1086–1091. [Google Scholar] [CrossRef] [PubMed]
- Wang, Y.; Xu, D. Effects of aerobic exercise on lipids and lipoproteins. Lipids Health Dis. 2017, 16, 132. [Google Scholar] [CrossRef] [Green Version]
- Kodama, S.; Tanaka, S.; Saito, K.; Shu, M.; Sone, Y.; Onitake, F.; Suzuki, E.; Shimano, H.; Yamamoto, S.; Kondo, K.; et al. Effect of aerobic exercise training on serum levels of high-density lipoprotein cholesterol: A meta-analysis. Arch. Intern. Med. 2007, 167, 999–1008. [Google Scholar] [CrossRef] [Green Version]
- Aadahl, M.; Kjaer, M.; Jorgensen, T. Associations between overall physical activity level and cardiovascular risk factors in an adult population. Eur. J. Epidemiol. 2007, 22, 369–378. [Google Scholar] [CrossRef]
- Doddamani, S.; Nikam, S.; Nikam, P.; Patil, V. HDL, Apolipoprotein AI and Lecithin cholesterol acyl transferase activity in athletes. Biomed. Res. 2014, 25, 339–342. [Google Scholar]
- Olchawa, B.; Kingwell, B.A.; Hoang, A.; Schneider, L.; Miyazaki, O.; Nestel, P.; Sviridov, D. Physical fitness and reverse cholesterol transport. Arterioscler. Thromb. Vasc. Biol. 2004, 24, 1087–1091. [Google Scholar] [CrossRef]
- O’Donovan, G.; Stensel, D.; Hamer, M.; Stamatakis, E. The association between leisure-time physical activity, low HDL-cholesterol and mortality in a pooled analysis of nine population-based cohorts. Eur. J. Epidemiol. 2017, 32, 559–566. [Google Scholar] [CrossRef] [Green Version]
- World Health Organization. Protein and Amino Acid Requirements in Human Nutrition; World Health Organization: Geneva, Switzerland, 2007; Volume 935. [Google Scholar]
- Institute of Medicine. Dietary Reference Intakes for Energy, Carbohydrate, Fiber, Fat, Fatty Acids, Cholesterol, Protein, and Amino Acids (Macronutrients); National Academy Press: Washington, DC, USA, 2005. [Google Scholar]
- Duffey, K.J.; Gordon-Larsen, P.; Steffen, L.M.; Jacobs, D.R., Jr.; Popkin, B.M. Regular consumption from fast food establishments relative to other restaurants is differentially associated with metabolic outcomes in young adults. J. Nutr. 2009, 139, 2113–2118. [Google Scholar] [CrossRef] [PubMed]
- Rohrmann, S.; Overvad, K.; Bueno-de-Mesquita, H.B.; Jakobsen, M.U.; Egeberg, R.; Tjonneland, A.; Nailler, L.; Boutron-Ruault, M.C.; Clavel-Chapelon, F.; Krogh, V.; et al. Meat consumption and mortality--results from the European Prospective Investigation into Cancer and Nutrition. BMC Med. 2013, 11, 63. [Google Scholar] [CrossRef] [PubMed]
- Chen, G.C.; Lv, D.B.; Pang, Z.; Liu, Q.F. Red and processed meat consumption and risk of stroke: A meta-analysis of prospective cohort studies. Eur. J. Clin. Nutr. 2013, 67, 91–95. [Google Scholar] [CrossRef] [PubMed]
- Johnston, B.C.; Zeraatkar, D.; Han, M.A.; Vernooij, R.W.M.; Valli, C.; El Dib, R.; Marshall, C.; Stover, P.J.; Fairweather-Taitt, S.; Wojcik, G.; et al. Unprocessed Red Meat and Processed Meat Consumption: Dietary Guideline Recommendations From the Nutritional Recommendations (NutriRECS) Consortium. Ann. Intern. Med. 2019. [Google Scholar] [CrossRef] [PubMed] [Green Version]
- Zeraatkar, D.; Johnston, B.C.; Bartoszko, J.; Cheung, K.; Bala, M.M.; Valli, C.; Rabassa, M.; Sit, D.; Milio, K.; Sadeghirad, B.; et al. Effect of Lower Versus Higher Red Meat Intake on Cardiometabolic and Cancer Outcomes: A Systematic Review of Randomized Trials. Ann. Intern. Med. 2019. [Google Scholar] [CrossRef] [Green Version]
- Vernooij, R.W.M.; Zeraatkar, D.; Han, M.A.; El Dib, R.; Zworth, M.; Milio, K.; Sit, D.; Lee, Y.; Gomaa, H.; Valli, C.; et al. Patterns of Red and Processed Meat Consumption and Risk for Cardiometabolic and Cancer Outcomes: A Systematic Review and Meta-analysis of Cohort Studies. Ann. Intern. Med. 2019. [Google Scholar] [CrossRef] [Green Version]
- Dyer, O. No need to cut red meat, say new guidelines. BMJ 2019, 367, l5809. [Google Scholar] [CrossRef]
- O’Connor, L.E.; Paddon-Jones, D.; Wright, A.J.; Campbell, W.W. A Mediterranean-style eating pattern with lean, unprocessed red meat has cardiometabolic benefits for adults who are overweight or obese in a randomized, crossover, controlled feeding trial. Am. J. Clin. Nutr. 2018, 108, 33–40. [Google Scholar] [CrossRef]
- O’Connor, L.E.; Kim, J.E.; Campbell, W.W. Total red meat intake of >/=0.5 servings/d does not negatively influence cardiovascular disease risk factors: A systemically searched meta-analysis of randomized controlled trials. Am. J. Clin. Nutr. 2017, 105, 57–69. [Google Scholar] [CrossRef] [Green Version]
- Schwingshackl, L.; Hoffmann, G.; Iqbal, K.; Schwedhelm, C.; Boeing, H. Food groups and intermediate disease markers: A systematic review and network meta-analysis of randomized trials. Am. J. Clin. Nutr. 2018, 108, 576–586. [Google Scholar] [CrossRef]
- Wallace, T.C.; McBurney, M.; Fulgoni, V.L. Multivitamin/mineral supplement contribution to micronutrient intakes in the United States, 2007–2010. J. Am. Coll. Nutr. 2014, 33, 94–102. [Google Scholar] [CrossRef]
- Shenkin, A. Micronutrients in health and disease. Postgrad. Med. J. 2006, 82, 559–567. [Google Scholar] [CrossRef] [Green Version]
- Papp, L.V.; Lu, J.; Holmgren, A.; Khanna, K.K. From selenium to selenoproteins: Synthesis, identity, and their role in human health. Antioxid. Redox Signal. 2007, 9, 775–806. [Google Scholar] [CrossRef]
- Bleys, J.; Navas-Acien, A.; Stranges, S.; Menke, A.; Miller, E.R.; Guallar, E. Serum selenium and serum lipids in US adults. Am. J. Clin. Nutr. 2008, 88, 416–423. [Google Scholar] [CrossRef] [Green Version]
- Stranges, S.; Laclaustra, M.; Ji, C.; Cappuccio, F.P.; Navas-Acien, A.; Ordovas, J.M.; Rayman, M.; Guallar, E. Higher selenium status is associated with adverse blood lipid profile in British adults. J. Nutr. 2010, 140, 81–87. [Google Scholar] [CrossRef] [Green Version]
- Rayman, M.P.; Stranges, S.; Griffin, B.A.; Pastor-Barriuso, R.; Guallar, E. Effect of supplementation with high-selenium yeast on plasma lipids: A randomized trial. Ann. Intern. Med. 2011, 154, 656–665. [Google Scholar] [CrossRef] [Green Version]
- Hasani, M.; Djalalinia, S.; Sharifi, F.; Varmaghani, M.; Zarei, M.; Abdar, M.E.; Asayesh, H.; Noroozi, M.; Kasaeian, A.; Gorabi, A.M. Effect of Selenium Supplementation on Lipid Profile: A Systematic Review and Meta-Analysis. Horm. Metab. Res. 2018, 50, 715–727. [Google Scholar] [CrossRef]
- Maywald, M.; Wessels, I.; Rink, L. Zinc signals and immunity. Int. J. Mol. Sci. 2017, 18, 2222. [Google Scholar] [CrossRef] [Green Version]
- Ranasinghe, P.; Wathurapatha, W.; Ishara, M.; Jayawardana, R.; Galappatthy, P.; Katulanda, P.; Constantine, G. Effects of Zinc supplementation on serum lipids: A systematic review and meta-analysis. Nutr. Metab. 2015, 12, 26. [Google Scholar] [CrossRef]
- Bo, S.; Durazzo, M.; Gambino, R.; Berutti, C.; Milanesio, N.; Caropreso, A.; Gentile, L.; Cassader, M.; Cavallo-Perin, P.; Pagano, G. Associations of dietary and serum copper with inflammation, oxidative stress, and metabolic variables in adults. J. Nutr. 2008, 138, 305–310. [Google Scholar] [CrossRef]
- Alarcon-Corredor, O.M.; Guerrero, Y.; Ramirez de Fernandez, M.; D’Jesus, I.; Burguera, M.; Burguera, J.L.; Di Bernardo, M.L.; Garcia, M.Y.; Alarcon, A.O. (Effect of copper supplementation on lipid profile of Venezuelan hyperlipemic patients). Arch. Latinoam. Nutr. 2004, 54, 413–418. [Google Scholar] [PubMed]
- Rojas-Sobarzo, L.; Olivares, M.; Brito, A.; Suazo, M.; Araya, M.; Pizarro, F. Copper supplementation at 8 mg neither affects circulating lipids nor liver function in apparently healthy Chilean men. Biol. Trace Elem. Res. 2013, 156, 1–4. [Google Scholar] [CrossRef] [PubMed]
- Shin, W.Y.; Kim, J.H. Low riboflavin intake is associated with cardiometabolic risks in Korean women. Asia Pac. J. Clin. Nutr. 2019, 28, 285–299. [Google Scholar] [CrossRef] [PubMed]
- Minto, C.; Vecchio, M.G.; Lamprecht, M.; Gregori, D. Definition of a tolerable upper intake level of niacin: A systematic review and meta-analysis of the dose-dependent effects of nicotinamide and nicotinic acid supplementation. Nutr. Rev. 2017, 75, 471–490. [Google Scholar] [CrossRef] [PubMed]
- Guyton, J.R. Niacin in cardiovascular prevention: Mechanisms, efficacy, and safety. Curr. Opin. Lipidol. 2007, 18, 415–420. [Google Scholar] [CrossRef]
- Mahalle, N.; Garg, M.; Naik, S.; Kulkarni, M. Association of dietary factors with severity of coronary artery disease. Clin. Nutr. ESPEN 2016, 15, 75–79. [Google Scholar] [CrossRef]
- Hassan, M.; Philip, P. CANHEART: Is HDL cholesterol a cardiovascular specific risk factor? Glob. Cardiol. Sci. Pract. 2016, 2016, e201634. [Google Scholar] [CrossRef] [Green Version]
- Parish, S.; Peto, R.; Palmer, A.; Clarke, R.; Lewington, S.; Offer, A.; Whitlock, G.; Clark, S.; Youngman, L.; Sleight, P.; et al. The joint effects of apolipoprotein B, apolipoprotein A1, LDL cholesterol, and HDL cholesterol on risk: 3510 cases of acute myocardial infarction and 9805 controls. Eur. Heart J. 2009, 30, 2137–2146. [Google Scholar] [CrossRef] [Green Version]
- Walldius, G.; Jungner, I. Apolipoprotein B and apolipoprotein A-I: Risk indicators of coronary heart disease and targets for lipid-modifying therapy. J. Intern. Med. 2004, 255, 188–205. [Google Scholar] [CrossRef]
- Molag, M.L.; de Vries, J.H.; Ocké, M.C.; Dagnelie, P.C.; van den Brandt, P.A.; Jansen, M.C.; van Staveren, W.A.; van’t Veer, P. Design characteristics of food frequency questionnaires in relation to their validity. Am. J. Epidemiol. 2007, 166, 1468–1478. [Google Scholar] [CrossRef] [Green Version]


| Total n = 241 | Adults n = 156 | Children n = 85 | |
|---|---|---|---|
| Median (range or interquartile range 1) | |||
| Age at visit, years (range) | 21.3 (8.5–40.9) | 24.6 (18.0–40.9) | 16.2 (8.5–17.9) |
| Age at cancer diagnosis, years (range) | 4.7 (0.9–18.0) | 6.5 (0.9–18.0) | 3.5 (1.3–10.9) |
| Time since end of treatment, years (range) | 12.9 (3.3–26.1) | 16.11 (3.9–26.1) | 9.60 (3.3–13.4) |
| Gender (male, %) | 49.4 | 57.3 | 49.4 |
| ALL types 2 | |||
| Pre-B ALL (n, %) | 208 (88.5) | 128 (84.8) | 80 (95.2) |
| Pre-T ALL (n, %) | 27 (11.5) | 23 (15.2) | 4 (4.8) |
| ALL subtypes 3 | |||
| Hyperdiploidy (n, %) | 33 (21.6) | 18 (19.8) | 15 (24.2) |
| Pre-B or Pre-T with recurrent genetic abnormalities (n, %) | 52 (34.0) | 28 (30.8) | 24 (38.7) |
| Hypodiploidy (n, %) | 4 (2.6) | 3 (3.3) | 1 (1.6) |
| Others (NOS) (n, %) | 64 (41.8) | 42 (46.1) | 22 (35.5) |
| Metabolic data | |||
| Physical activity 4 (min/day) | 20.6 (7.6–39.5) | 15.7 (3.95–36.6) | 28.9 (14.1–46.5) |
| Estimated energy requirement (kcal) | 2328 (2011–2721) | 2373 (2039–2707) | 2224 (1964–2834) |
| Energy balance (kcal) | 142 (−213–649) | 133 (−224–644) | 148 (−172–679) |
| BMI (kg/m2) | 23.5 (20.9–26.1) | 24.3 (21.7–27.4) | 21.8 (19.2–24.1) |
| Waist-to-height ratio | 0.50 (0.46–0.55) | 0.51 (0.48–0.58) | 0.49 (0.45–0.52) |
| Glucose (mmol/L) | 5.0 (4.8–5.3) | 5.0 (4.8–5.4) | 5.0 (4.8–5.3) |
| Insulin (pmol/L) | 53.3 (37.6–75.8) | 50.1 (35.2–68.6) | 58.1 (42.9–81.1) |
| HOMA-IR | 1.7 (1.2–2.5) | 1.7 (1.1–2.3) | 1.9 (1.3–2.7) |
| Total cholesterol (mmol/L) | 4.37 (3.87–5.01) | 4.59 (4.10–5.15) | 4.18 (3.61–4.63) |
| Triglyceride (mmol/L) | 0.91 (0.66–1.25) | 0.97 (0.72–1.38) | 0.82 (0.62–1.07) |
| LDL-C (mmol/L) | 2.57 (2.13–3.16) | 2.73 (2.22–3.32) | 2.36 (2.04–2.82) |
| HDL-C (mmol/L) | 1.30 (1.12–1.49) | 1.31 (1.13–1.52) | 1.29 (1.09–1.45) |
| Total | Tertile 1 | Tertile 2 | Tertile 3 | |
|---|---|---|---|---|
| Median (interquartile range 1) | ||||
| Energy intake (kcal) | 2512 (2143–3077) | 1897 | 2511 | 3398 |
| Macronutrients | ||||
| Proteins (g) | 109 (87.3–131) | 80.4 | 108.9 | 144.0 |
| Carbohydrates (g) | 318 (267–391) | 247.8 | 317.9 | 426.4 |
| Dietary fibers (g) | 23.8 (19.0–29.6) | 16.6 | 24.0 | 33.4 |
| Lipids (g) | 90.2 (71.6–114.8) | 63.0 | 90.2 | 123.1 |
| Omega-6 (g) | 4.4 (3.1–6.5) | 2.6 | 4.4 | 7.9 |
| Omega-3 (g) | 0.8 (0.6–1.4) | 0.5 | 0.8 | 1.8 |
| Ratio ω-6/ω-3 | 5.3 (4.0–6.9) | 3.6 | 5.4 | 7.5 |
| Micronutrients | ||||
| Calcium (mg) | 1349 (1047–1782) | 931 | 1349 | 1993 |
| Iron (mg) | 16.3 (13.6–21.5) | 12.7 | 16.3 | 23.5 |
| Magnesium (mg) | 405 (342–497) | 311 | 406 | 547 |
| Phosphorus (mg) | 1810 (1452–2192) | 1351 | 1810 | 2445 |
| Potassium (mg) | 3975 (3337–4763) | 3028 | 3975 | 5202 |
| Sodium (mg) | 3428 (2673–4522) | 2372 | 3428 | 4996 |
| Zinc (mg) | 15.6 (12.4–19.5) | 11.6 | 15.6 | 21.2 |
| Copper (mg) | 1.9 (1.5–2.3) | 1.4 | 1.8 | 2.4 |
| Manganese (mg) | 4.1 (3.2–5.2) | 2.8 | 4.1 | 5.8 |
| Selenium (mcg) | 139 (112–176) | 102 | 139 | 192 |
| Retinol (mcg) | 469 (330–681) | 286 | 469 | 744 |
| Folic acid (mcg) | 628 (505–781) | 445 | 627 | 871 |
| Niacin (mg) | 26.5 (21.0–33.6) | 19.0 | 26.2 | 35.9 |
| Riboflavin (mg) | 2.8 (2.3–3.5) | 2.1 | 2.8 | 3.8 |
| Thiamine (mg) | 2.2 (1.8–2.8) | 1.5 | 2.2 | 3.0 |
| Vitamin B6 (mg) | 2.4 (1.9–2.9) | 1.7 | 2.3 | 3.1 |
| Vitamin B12 (mcg) | 5.7 (4.3–7.7) | 3.8 | 5.7 | 8.6 |
| Choline (mg) | 283 (224–355) | 201 | 283 | 389 |
| Vitamin C (mg) | 210 (136–275) | 114 | 210 | 319 |
| Vitamin D (mcg) | 5.6 (4.1–8.4) | 3.5 | 5.6 | 9.80 |
| Vitamin K (mcg) | 122 (87.4–170) | 74.1 | 122 | 204 |
| Food groups | ||||
| Meat | 1.8 (1.3–2.6) | 1.0 | 1.8 | 3.0 |
| Fish and seafood | 0.3 (0.1–0.5) | 0.03 | 0.3 | 0.7 |
| Dairy | 3.2 (2.1–4.7) | 1.6 | 3.2 | 5.0 |
| Fat | 1.5 (1.0–2.4) | 0.7 | 1.5 | 3.1 |
| Vegetables | 3.1 (2.0–4.5) | 1.5 | 3.1 | 5.1 |
| Legumes | 0.03 (0.0–0.1) | 0.0 | 0.03 | 0.2 |
| Fruits | 1.9 (1.2–3.1) | 0.9 | 1.9 | 3.6 |
| Macronutrients | Odds Ratio | 95% CI | p Value |
|---|---|---|---|
| Proteins | |||
| Tertile 2 vs. Tertile 1 | 0.300 | 0.12–0.74 | 0.009 |
| Tertile 3 vs. Tertile 1 | 0.289 | 0.08–1.00 | 0.05 |
| Carbohydrates | |||
| Tertile 2 vs. Tertile 1 | 0.705 | 0.29–1.70 | 0.436 |
| Tertile 3 vs. Tertile 1 | 0.612 | 0.17–2.19 | 0.450 |
| Fats | |||
| Tertile 2 vs. Tertile 1 | 0.723 | 0.30–1.74 | 0.468 |
| Tertile 3 vs. Tertile 1 | 0.876 | 0.26–2.91 | 0.829 |
| Fibers | |||
| Tertile 2 vs. Tertile 1 | 0.914 | 0.41–2.02 | 0.824 |
| Tertile 3 vs. Tertile 1 | 0.603 | 0.23–1.59 | 0.308 |
| Omega-3 | |||
| Tertile 2 vs. Tertile 1 | 1.347 | 0.59–3.05 | 0.475 |
| Tertile 3 vs. Tertile 1 | 1.002 | 0.40–2.53 | 0.995 |
| Omega-6 | |||
| Tertile 2 vs. Tertile 1 | 0.897 | 0.39–2.10 | 0.800 |
| Tertile 3 vs. Tertile 1 | 0.652 | 0.26–1.61 | 0.354 |
| Ratio omega-3: omega-6 | |||
| Tertile 2 vs. Tertile 1 | 1.087 | 0.48–2.44 | 0.840 |
| Tertile 3 vs. Tertile 1 | 1.385 | 0.62–3.09 | 0.426 |
| Minerals | Odds Ratio | 95% CI | p Value |
|---|---|---|---|
| Calcium | |||
| Tertile 2 vs. Tertile 1 | 0.774 | 0.33–1.80 | 0.553 |
| Tertile 3 vs. Tertile 1 | 0.830 | 0.31–2.22 | 0.711 |
| Magnesium | |||
| Tertile 2 vs. Tertile 1 | 0.624 | 0.27–1.42 | 0.262 |
| Tertile 3 vs. Tertile 1 | 0.350 | 0.11–1.12 | 0.078 |
| Phosphorus | |||
| Tertile 2 vs. Tertile 1 | 0.362 | 0.15–0.88 | 0.024 |
| Tertile 3 vs. Tertile 1 | 0.333 | 0.10–1.13 | 0.077 |
| Potassium | |||
| Tertile 2 vs. Tertile 1 | 0.754 | 0.32–1.79 | 0.523 |
| Tertile 3 vs. Tertile 1 | 0.692 | 0.22–2.18 | 0.528 |
| Sodium | |||
| Tertile 2 vs. Tertile 1 | 0.382 | 0.15–0.97 | 0.044 |
| Tertile 3 vs. Tertile 1 | 1.134 | 0.35–3.65 | 0.832 |
| Iron | |||
| Tertile 2 vs. Tertile 1 | 0.478 | 0.21–1.11 | 0.086 |
| Tertile 3 vs. Tertile 1 | 0.395 | 0.12–1.27 | 0.118 |
| Zinc | |||
| Tertile 2 vs. Tertile 1 | 0.311 | 0.13–0.76 | 0.010 |
| Tertile 3 vs. Tertile 1 | 0.257 | 0.08–0.84 | 0.025 |
| Copper | |||
| Tertile 2 vs. Tertile 1 | 0.32 | 0.13–0.76 | 0.009 |
| Tertile 3 vs. Tertile 1 | 0.27 | 0.09–0.81 | 0.020 |
| Manganese | |||
| Tertile 2 vs. Tertile 1 | 0.616 | 0.27–1.39 | 0.243 |
| Tertile 3 vs. Tertile 1 | 0.639 | 0.25–1.60 | 0.340 |
| Selenium | |||
| Tertile 2 vs. Tertile 1 | 0.377 | 0.16–0.89 | 0.026 |
| Tertile 3 vs. Tertile 1 | 0.175 | 0.05–0.62 | 0.007 |
| Vitamins | Odds Ratio | 95% CI | p Value |
|---|---|---|---|
| Retinol | |||
| Tertile 2 vs. Tertile 1 | 0.639 | 0.28–1.47 | 0.291 |
| Tertile 3 vs. Tertile 1 | 0.609 | 0.24–1.56 | 0.301 |
| Alpha-carotene | |||
| Tertile 2 vs. Tertile 1 | 1.444 | 0.66–3.16 | 0.356 |
| Tertile 3 vs. Tertile 1 | 0.880 | 0.39–2.00 | 0.760 |
| Beta-carotene | |||
| Tertile 2 vs. Tertile 1 | 1.523 | 0.67–3.44 | 0.312 |
| Tertile 3 vs. Tertile 1 | 0.887 | 0.37–2.15 | 0.790 |
| Thiamin | |||
| Tertile 2 vs. Tertile 1 | 0.634 | 0.27–1.51 | 0.302 |
| Tertile 3 vs. Tertile 1 | 0.741 | 0.26–2.11 | 0.575 |
| Riboflavin | |||
| Tertile 2 vs. Tertile 1 | 0.300 | 0.12–0.74 | 0.009 |
| Tertile 3 vs. Tertile 1 | 0.248 | 0.07–0.86 | 0.028 |
| Niacin | |||
| Tertile 2 vs. Tertile 1 | 0.268 | 0.11–0.65 | 0.004 |
| Tertile 3 vs. Tertile 1 | 0.263 | 0.08–0.88 | 0.030 |
| Vitamin B6 | |||
| Tertile 2 vs. Tertile 1 | 0.871 | 0.38–2.01 | 0.747 |
| Tertile 3 vs. Tertile 1 | 0.395 | 0.12–1.27 | 0.119 |
| Choline | |||
| Tertile 2 vs. Tertile 1 | 0.480 | 0.20–1.16 | 0.104 |
| Tertile 3 vs. Tertile 1 | 0.518 | 0.18–1.50 | 0.225 |
| Folic acid | |||
| Tertile 2 vs. Tertile 1 | 0.624 | 0.26–1.47 | 0.281 |
| Tertile 3 vs. Tertile 1 | 0.571 | 0.20–1.66 | 0.304 |
| Vitamin B12 | |||
| Tertile 2 vs. Tertile 1 | 0.713 | 0.31–1.63 | 0.424 |
| Tertile 3 vs. Tertile 1 | 0.580 | 0.22–1.55 | 0.276 |
| Vitamine C | |||
| Tertile 2 vs. Tertile 1 | 0.850 | 0.37–1.93 | 0.698 |
| Tertile 3 vs. Tertile 1 | 0.864 | 0.36–2.07 | 0.744 |
| Vitamin D | |||
| Tertile 2 vs. Tertile 1 | 0.713 | 0.32–1.60 | 0.414 |
| Tertile 3 vs. Tertile 1 | 0.633 | 0.26–1.53 | 0.309 |
| Vitamin K | |||
| Tertile 2 vs. Tertile 1 | 1.181 | 0.51–2.71 | 0.695 |
| Tertile 3 vs. Tertile 1 | 0.988 | 0.41–2.40 | 0.978 |
| Food Groups | Odd Ratio | 95% CI | p Value |
|---|---|---|---|
| Meat | |||
| Tertile 2 vs. Tertile 1 | 0.572 | 0.23–1.40 | 0.222 |
| Tertile 3 vs. Tertile 1 | 0.277 | 0.09–0.83 | 0.022 |
| Fish and seafood | |||
| Tertile 2 vs. Tertile 1 | 1.166 | 0.49–2.80 | 0.731 |
| Tertile 3 vs. Tertile 1 | 0.630 | 0.24–1.63 | 0.339 |
| Dairy | |||
| Tertile 2 vs. Tertile 1 | 0.886 | 0.36–2.18 | 0.792 |
| Tertile 3 vs. Tertile 1 | 1.155 | 0.43–3.09 | 0.775 |
| Fat | |||
| Tertile 2 vs. Tertile 1 | 1.179 | 0.48–2.92 | 0.722 |
| Tertile 3 vs. Tertile 1 | 1.581 | 0.57–4.39 | 0.379 |
| Vegetables | |||
| Tertile 2 vs. Tertile 1 | 1.165 | 0.44–3.07 | 0.757 |
| Tertile 3 vs. Tertile 1 | 1.282 | 0.46–3.54 | 0.632 |
| Legumes | |||
| Tertile 2 vs. Tertile 1 | 1.016 | 0.41–2.51 | 0.971 |
| Tertile 3 vs. Tertile 1 | 0.902 | 0.39–2.08 | 0.809 |
| Fruits | |||
| Tertile 2 vs. Tertile 1 | 0.261 | 0.10–0.70 | 0.008 |
| Tertile 3 vs. Tertile 1 | 0.920 | 0.38–2.24 | 0.854 |
| Fast food | |||
| Tertile 2 vs. Tertile 1 | 2.405 | 1.03–5.63 | 0.043 |
| Tertile 3 vs. Tertile 1 | 2.260 | 0.85–6.03 | 0.104 |
© 2019 by the authors. Licensee MDPI, Basel, Switzerland. This article is an open access article distributed under the terms and conditions of the Creative Commons Attribution (CC BY) license (http://creativecommons.org/licenses/by/4.0/).
Share and Cite
Morel, S.; Amre, D.; Teasdale, E.; Caru, M.; Laverdière, C.; Krajinovic, M.; Sinnett, D.; Curnier, D.; Levy, E.; Marcil, V. Dietary Intakes Are Associated with HDL-Cholesterol in Survivors of Childhood Acute Lymphoblastic Leukaemia. Nutrients 2019, 11, 2977. https://doi.org/10.3390/nu11122977
Morel S, Amre D, Teasdale E, Caru M, Laverdière C, Krajinovic M, Sinnett D, Curnier D, Levy E, Marcil V. Dietary Intakes Are Associated with HDL-Cholesterol in Survivors of Childhood Acute Lymphoblastic Leukaemia. Nutrients. 2019; 11(12):2977. https://doi.org/10.3390/nu11122977
Chicago/Turabian StyleMorel, Sophia, Devendra Amre, Emma Teasdale, Maxime Caru, Caroline Laverdière, Maja Krajinovic, Daniel Sinnett, Daniel Curnier, Emile Levy, and Valérie Marcil. 2019. "Dietary Intakes Are Associated with HDL-Cholesterol in Survivors of Childhood Acute Lymphoblastic Leukaemia" Nutrients 11, no. 12: 2977. https://doi.org/10.3390/nu11122977