Article

Simulation of the Grazing Effects on Grassland Aboveground Net Primary Production Using DNDC Model Combined with Time-Series Remote Sensing Data—A Case Study in Zoige Plateau, China

1
Institute of Mountain Hazards and Environment, Chinese Academy of Sciences, Chengdu 610041, China
2
University of Chinese Academy of Sciences, Beijing 100049, China
*
Author to whom correspondence should be addressed.
These authors contributed equally to this work.
Remote Sens. 2016, 8(3), 168; https://doi.org/10.3390/rs8030168
Submission received: 11 December 2015 / Revised: 17 February 2016 / Accepted: 17 February 2016 / Published: 23 February 2016

Abstract

:
Measuring the impact of livestock grazing on grassland above-ground net primary production (ANPP) is essential for grass yield estimation and pasture management. However, since there is a lack of accurate and repeatable techniques to obtain the details of grazing locations and stocking rates at the regional scale, it is an extremely challenging task to study the influence of regional grazing on the grassland ANPP. Taking Zoige County as a case, this paper proposes an approach to quantify the spatial and temporal variation of grazing intensity and grazing period through time-series remote sensing data, simulated grassland ANPP through the denitrification and decomposition (DNDC) model, and then explores the impact of grazing on grassland ANPP. The result showed that the model-estimated ANPP while considering grazing had a significant relationship with the field-observed ANPP, with the coefficient of determination (R2) of 0.75, root mean square error (RMSE) of 122.86 kgC/ha, and average relative error (RE) of 8.77%. On the contrary, if grazing activity was not considered in simulation, a large uncertainty was found when the model-estimated ANPP was compared with the field observation, showing R2 of 0.4, RMSE of 211.51 kgC/ha, and average RE of 32.5%. For the whole area of Zoige County in 2012, the statistics of the estimation showed that the total regional ANPP was up to 3.815 × 10⁵ tC, while the total regional ANPP, without considering grazing, would be overestimated by 44.4%, up to 5.51 × 10⁵ tC. This indicates that the grazing parameters derived in this study could effectively improve the accuracy of ANPP simulation results. Therefore, it is feasible to combine time-series remote sensing data with the process model to simulate the grazing effects on grassland ANPP. However, some issues, such as selecting proper remote sensing data, improving the quality of model input parameters, collecting more field data, and exploring the data assimilation approaches, still should be considered in the future work.

Graphical Abstract

1. Introduction

As one of the most important living environments for human beings [1], grasslands cover approximately 24% of the world’s land surface area [2]. Grassland ecosystems accumulate up to 18% of the total global terrestrial carbon sink each year and play an important role in the global carbon cycle [3]. However, due to global warming and unreasonable human disturbance [4], they are subjected to serious progressive degradation [5] so that the dynamic balance of the carbon cycle in grassland ecosystems has been broken [6]. Dynamically monitoring the ecological environment changes of grassland ecosystems is critical to understand the role of grasslands in the global carbon cycle and is desirable for the local government to manage the grasslands resource.
Primary production represents the major input of carbon and energy into ecosystems [7] and above-ground net primary production (ANPP) is considered as an integrative variable of the function of terrestrial ecosystems because of its relationships with animal biomass, secondary productivity, and nutrient cycling [8,9]. Grassland ANPP is one of the most direct indicators of grassland ecological environment status [10]. Methodologically, grassland ANPP could be estimated through the ecosystem models, which have always been regarded as essential and indispensable tools in simulating net primary production (NPP), owing to their ability to describe the response of the grassland ecosystem to changing environmental conditions and human disturbances [11]. Since the 1980s, a variety of process-based ecological models have been developed to estimate grassland ANPP [12]. Among them, denitrification and decomposition (DNDC) is considered as one of the most widely used and successful biogeochemical models [13], and it has been applied to simulate the amount and dynamics of carbon for almost all terrestrial ecosystems [14]. At the International Workshop on Global Change for Asia Pacific Region in 2000, the DNDC model was designated as one of the biogeochemical models applicable for the Asia Pacific region [15]. Although the DNDC model provides a powerful tool to estimate ANPP, significant uncertainties still exist when it is used to simulate the regional ANPP for grasslands because of the human disturbances, especially the grazing impact.
Grazing could significantly influence primary production, vegetation composition, and root biomass [16], and it would have a more direct and rapid impact on standing biomass than other factors, such as management practices, edaphic conditions, and climate in the short term [17]. Therefore, how to quantify the variation of the grazing effects on grassland ANPP is critical to simulate regional grassland ANPP. Despite a lot of debate about whether or not grazing can increase grassland ANPP at the individual site [18], due to the lack of sufficient historic grazing data, there have not been enough systematic and comprehensive investigations conducted on the regional grazing effects by far, especially in the nomadic or semi-nomadic pastures. Although the grazing data derived from the “Gridded Livestock of the World” (GLW) data could be used to model the grazing effect on dry grassland carbon cycling, it was too coarse to reflect the spatial variation of grazing intensity [19]. Additionally, because of the large area for livestock grazing, the relatively long duration of active interaction between animals and plants, and the difficulty encountered in measuring the forage consumed by free-ranging animals [20], it is even hard to assess regional grazing effects in free grazing systems. A significant obstacle to quantifying the regional grazing effects is the difficulty in getting the data regarding the grazing locations and stocking rates through conducting grazing experiments at a large enough scale [21]. Moreover, there is a lack of accurate and repeatable techniques to obtain the details of grazing intensity and grazing period at regional scale [22]. Limited regional monitoring makes it difficult to pinpoint the regional impact of livestock on the grassland ANPP [23].
With the development of satellite and computer technologies, remote sensing techniques have become highly promising tools in monitoring spatial and temporal changes of the grassland ecosystem at regional scales with rapid data acquisition and at lower cost [24]. In view of the different vegetation status between grazing and non-grazing areas, and the good relationships between the vegetation indices and vegetation coverage, the vegetation indices are usually used to explore the ability of remote sensing data to quantify the grazing intensity or evaluate the grazing effects. For example, Kawamura et al. (2005) investigated the spatial distribution of grazing intensity based on the Normalized Difference of Vegetation Index (NDVI) and the tracking data recorded by global positioning system (GPS) [25]. Blanco et al. (2009) applied the NDVI to detect the spatial and temporal patterns of vegetation in two different grazing systems (i.e., continuous and two-paddocks rest-rotation) [22]. Yu et al. (2010) estimated the grazing capacity using the NDVI, above-ground biomass data, and theoretical livestock carrying capacity [26]. Li et al. (2014) identified the mowing and grazing regions from the NDVI data and then obtained grazing intensity through the grazing steppe area and annual sheep units [27]. These studies indicated that the spatial pattern of the vegetation indices (e.g., NDVI) could be used to identify regional changes resulting from livestock grazing that may not be apparent from local monitoring [23]. Therefore, it is feasible to employ the vegetation indices to quantify the spatial distribution of grazing intensity at regional scale [28,29]. However, there has been little research on the grazing period and the variation of grazing intensity within and between seasons [30]. To simulate regional grassland ANPP in free grazing systems, especially for a short time, it is necessary not only to quantify the spatial distribution of regional grazing intensity, but also to obtain the grazing period of grazing pastures.
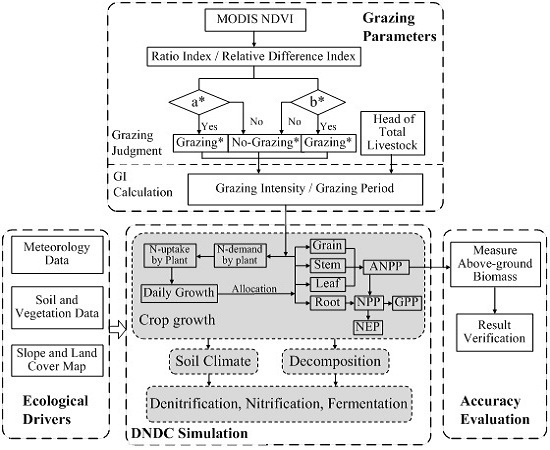
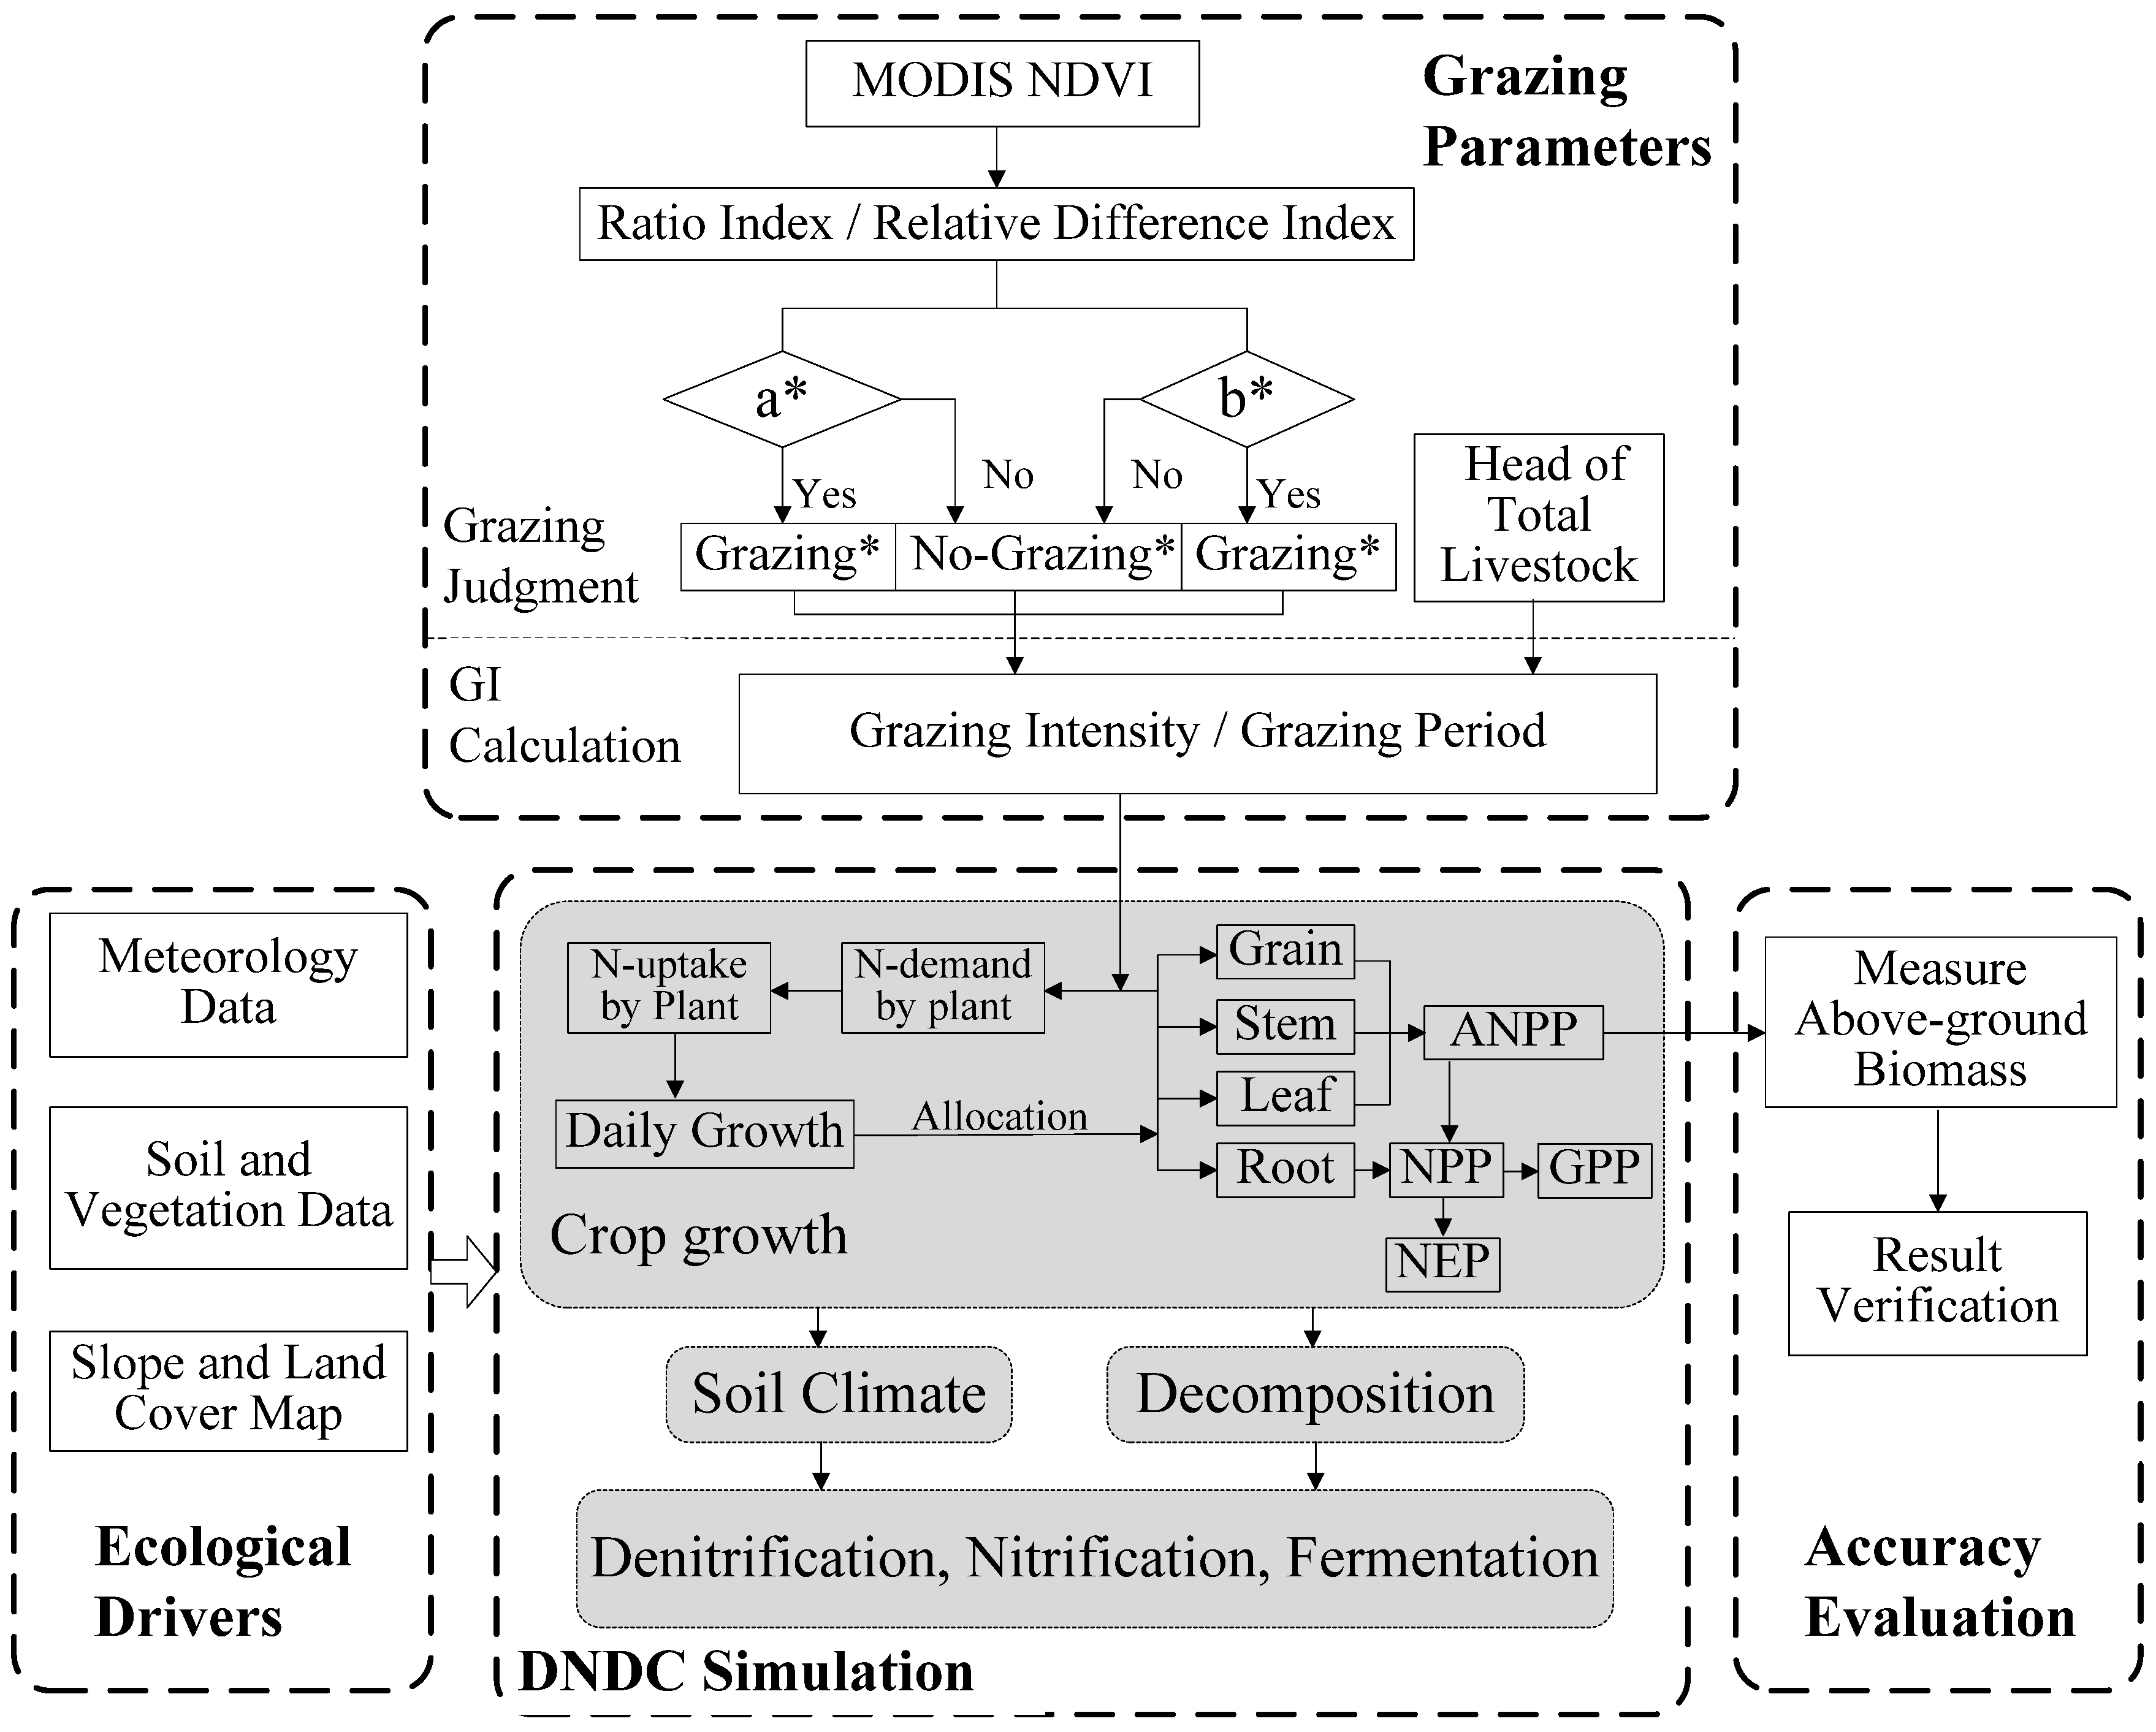
Since being highly correlated with vegetation phenology and easily available [31], a time series of the Moderate Resolution Imaging Spectroradiometer (MODIS) NDVI product (MOD13Q1) was chose to develop an approach to directly estimate the regional grazing intensity and grazing period. Taking the grassland-wetland ecosystems on the Zoige Plateau in China as a case, we aimed to simulate grassland ANPP under grazing conditions based on DNDC model and, thereby, evaluated the spatial and temporal variation of grazing effects and the impact of grazing on grassland ANPP. The specific objectives of this paper were to (1) develop a methodology to quantify regional grazing parameters, including grazing intensity, and grazing period; and (2) simulate the grassland ANPP and investigate its response to grazing activity.

2. Study Area

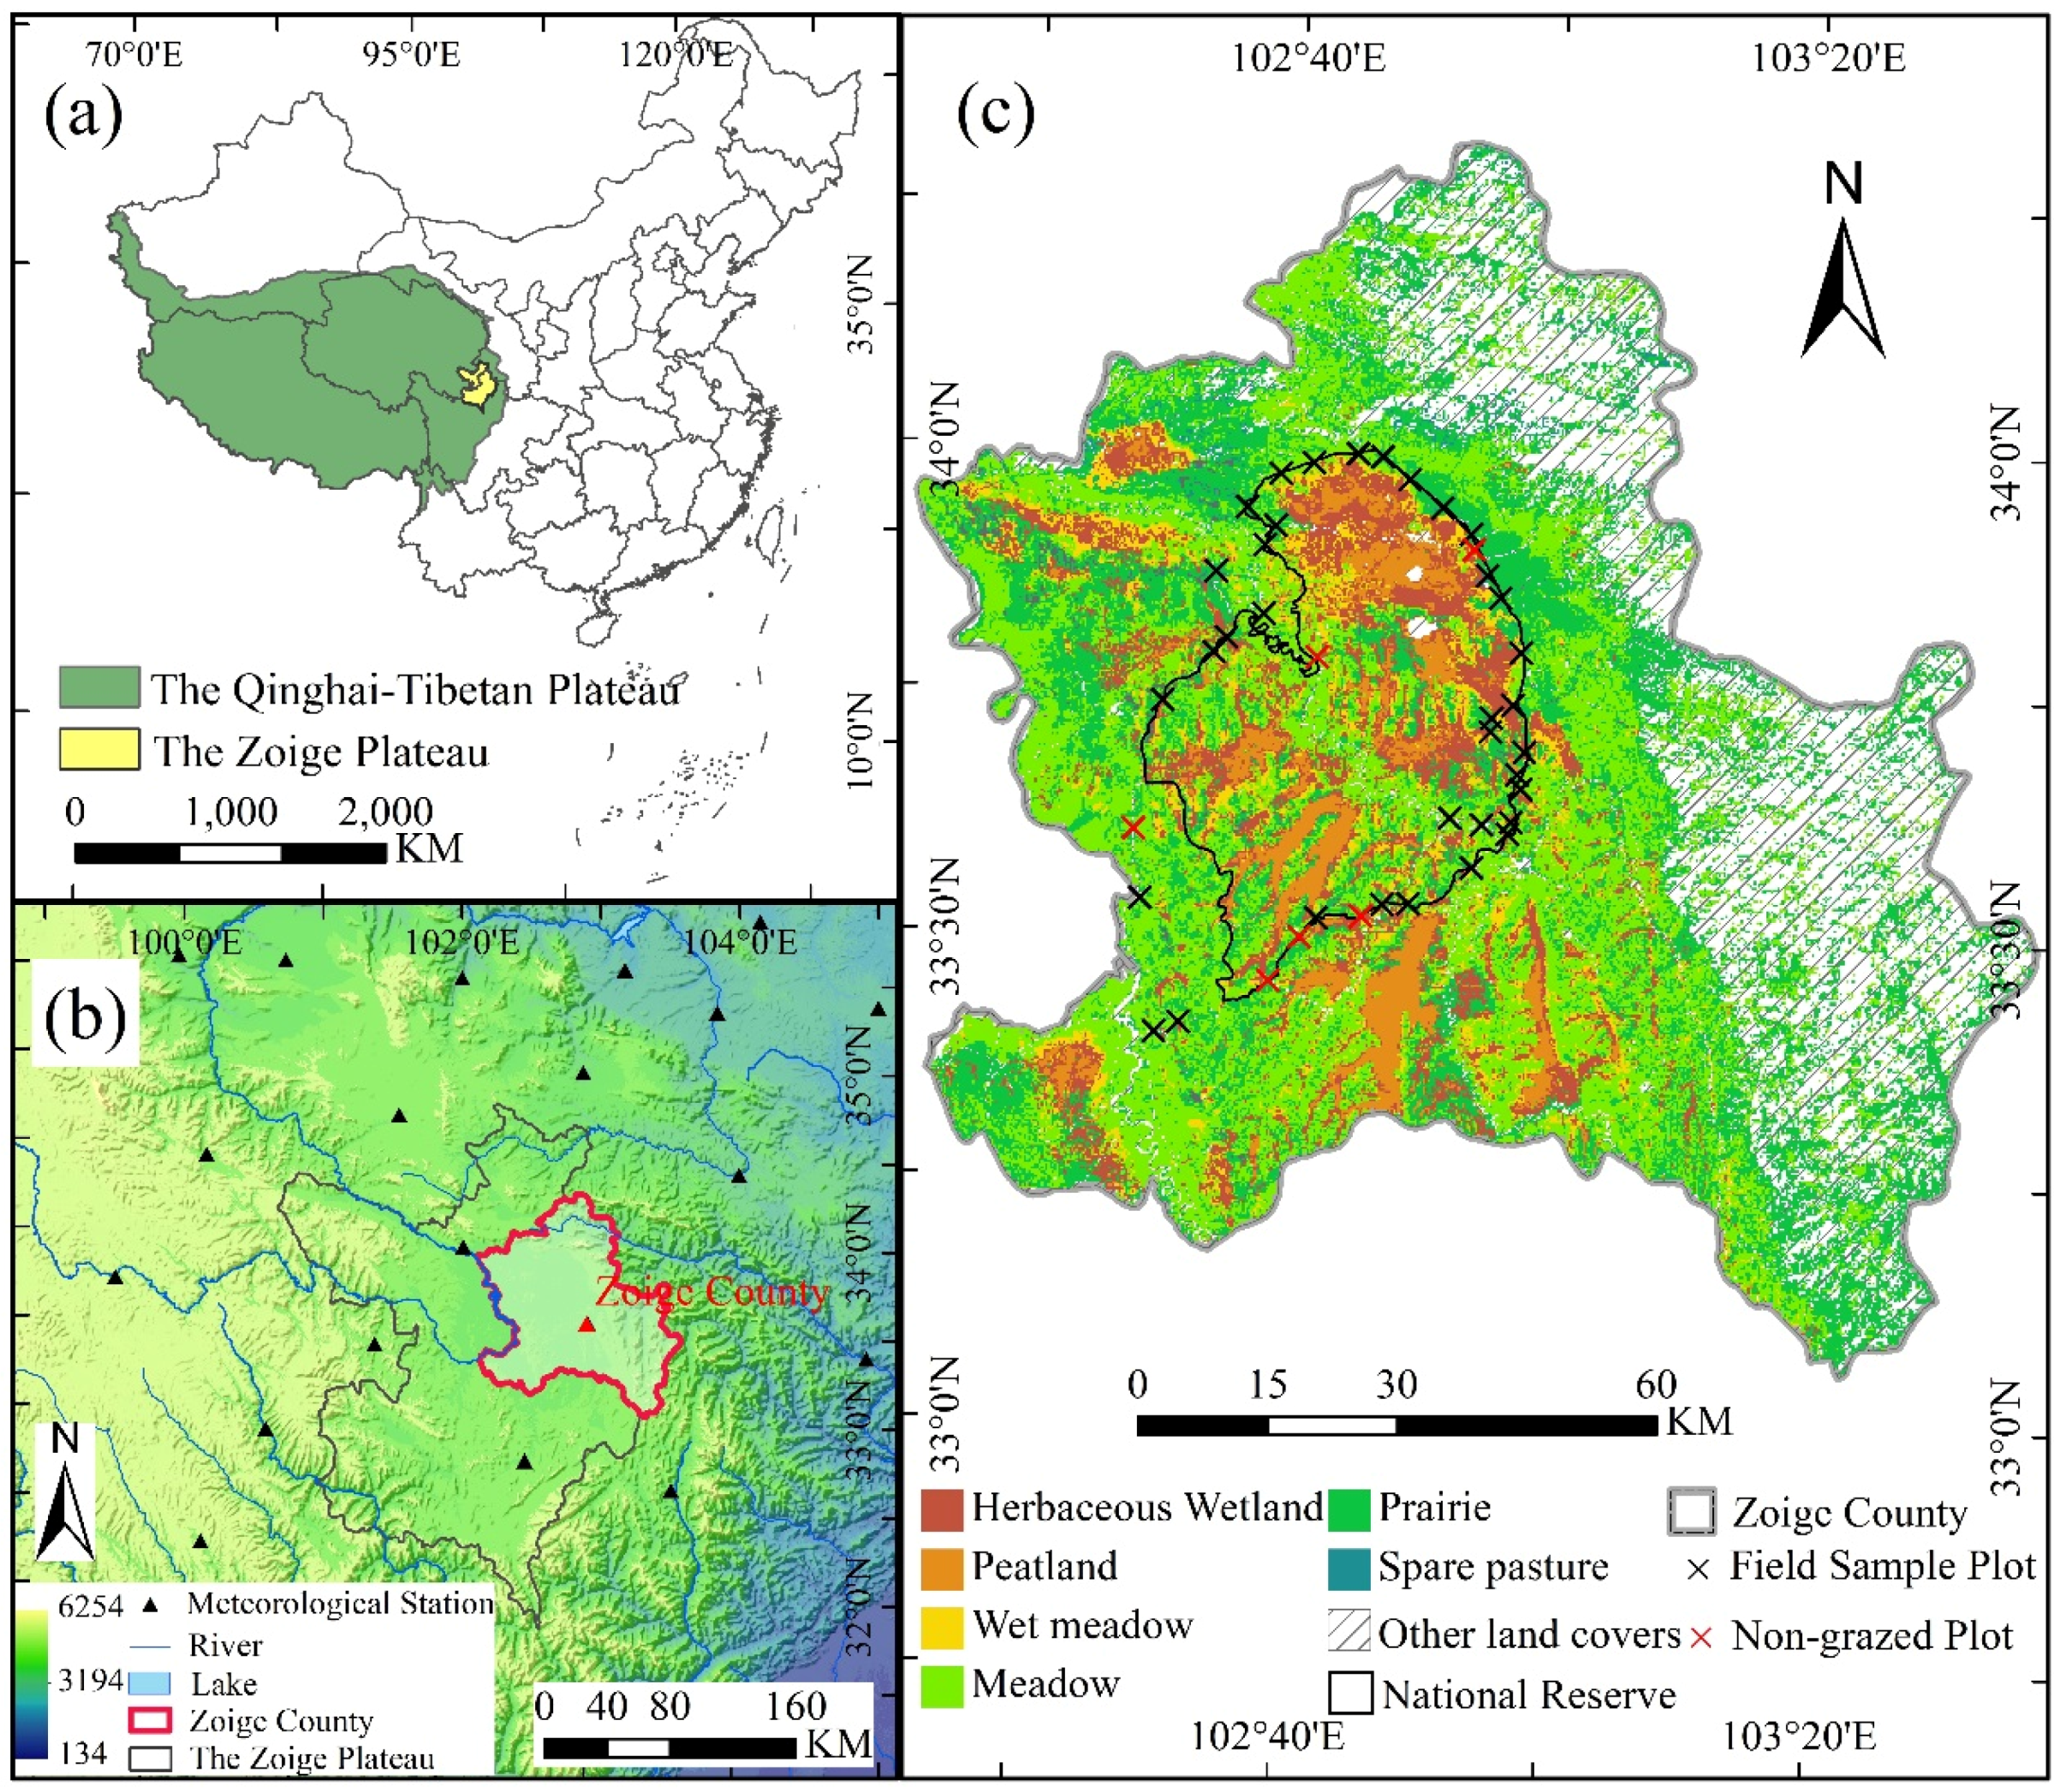
The Zoige Plateau (101°30′–103°30′ E, 32°20′–34°00′ N, 3400 m a.s.l), located at the eastern edge of the Qinghai-Tibetan Plateau in China (Figure 1a), covers an area of approximately 4600 km2 of peatlands [32]. It is regarded as one of the largest alpine peat swamp in the world with about 40 percent of peat stocks in China [33]. This paper takes Zoige County as a case area which is a major and typical region on Zoige Plateau (Figure 1b) [34]. The study area is mainly covered by wetlands and grasslands and there is a national nature reserve established in the center region of Zoige County to serve as functions for ecological conservation (Figure 1c). Due to global climate change and human disturbance (e.g., drainage, grazing, and peat harvest), since 1970s, the wetlands and grasslands in this area had experienced degradation, and the typical landscape degradation gradient was characterized by wetlands, moisture grasslands, dry grasslands and deserts. Over the past decades, the wetland area had been decreasing at a rate of about 3.85% per year [35]. After the middle of 1980s, human activities like livestock grazing has become one of most critical factors influencing the ANPP in this region [36]. These situations would make Zoige County representative and suitable for carrying out simulation of the grazing effect on alpine grassland ANPP.
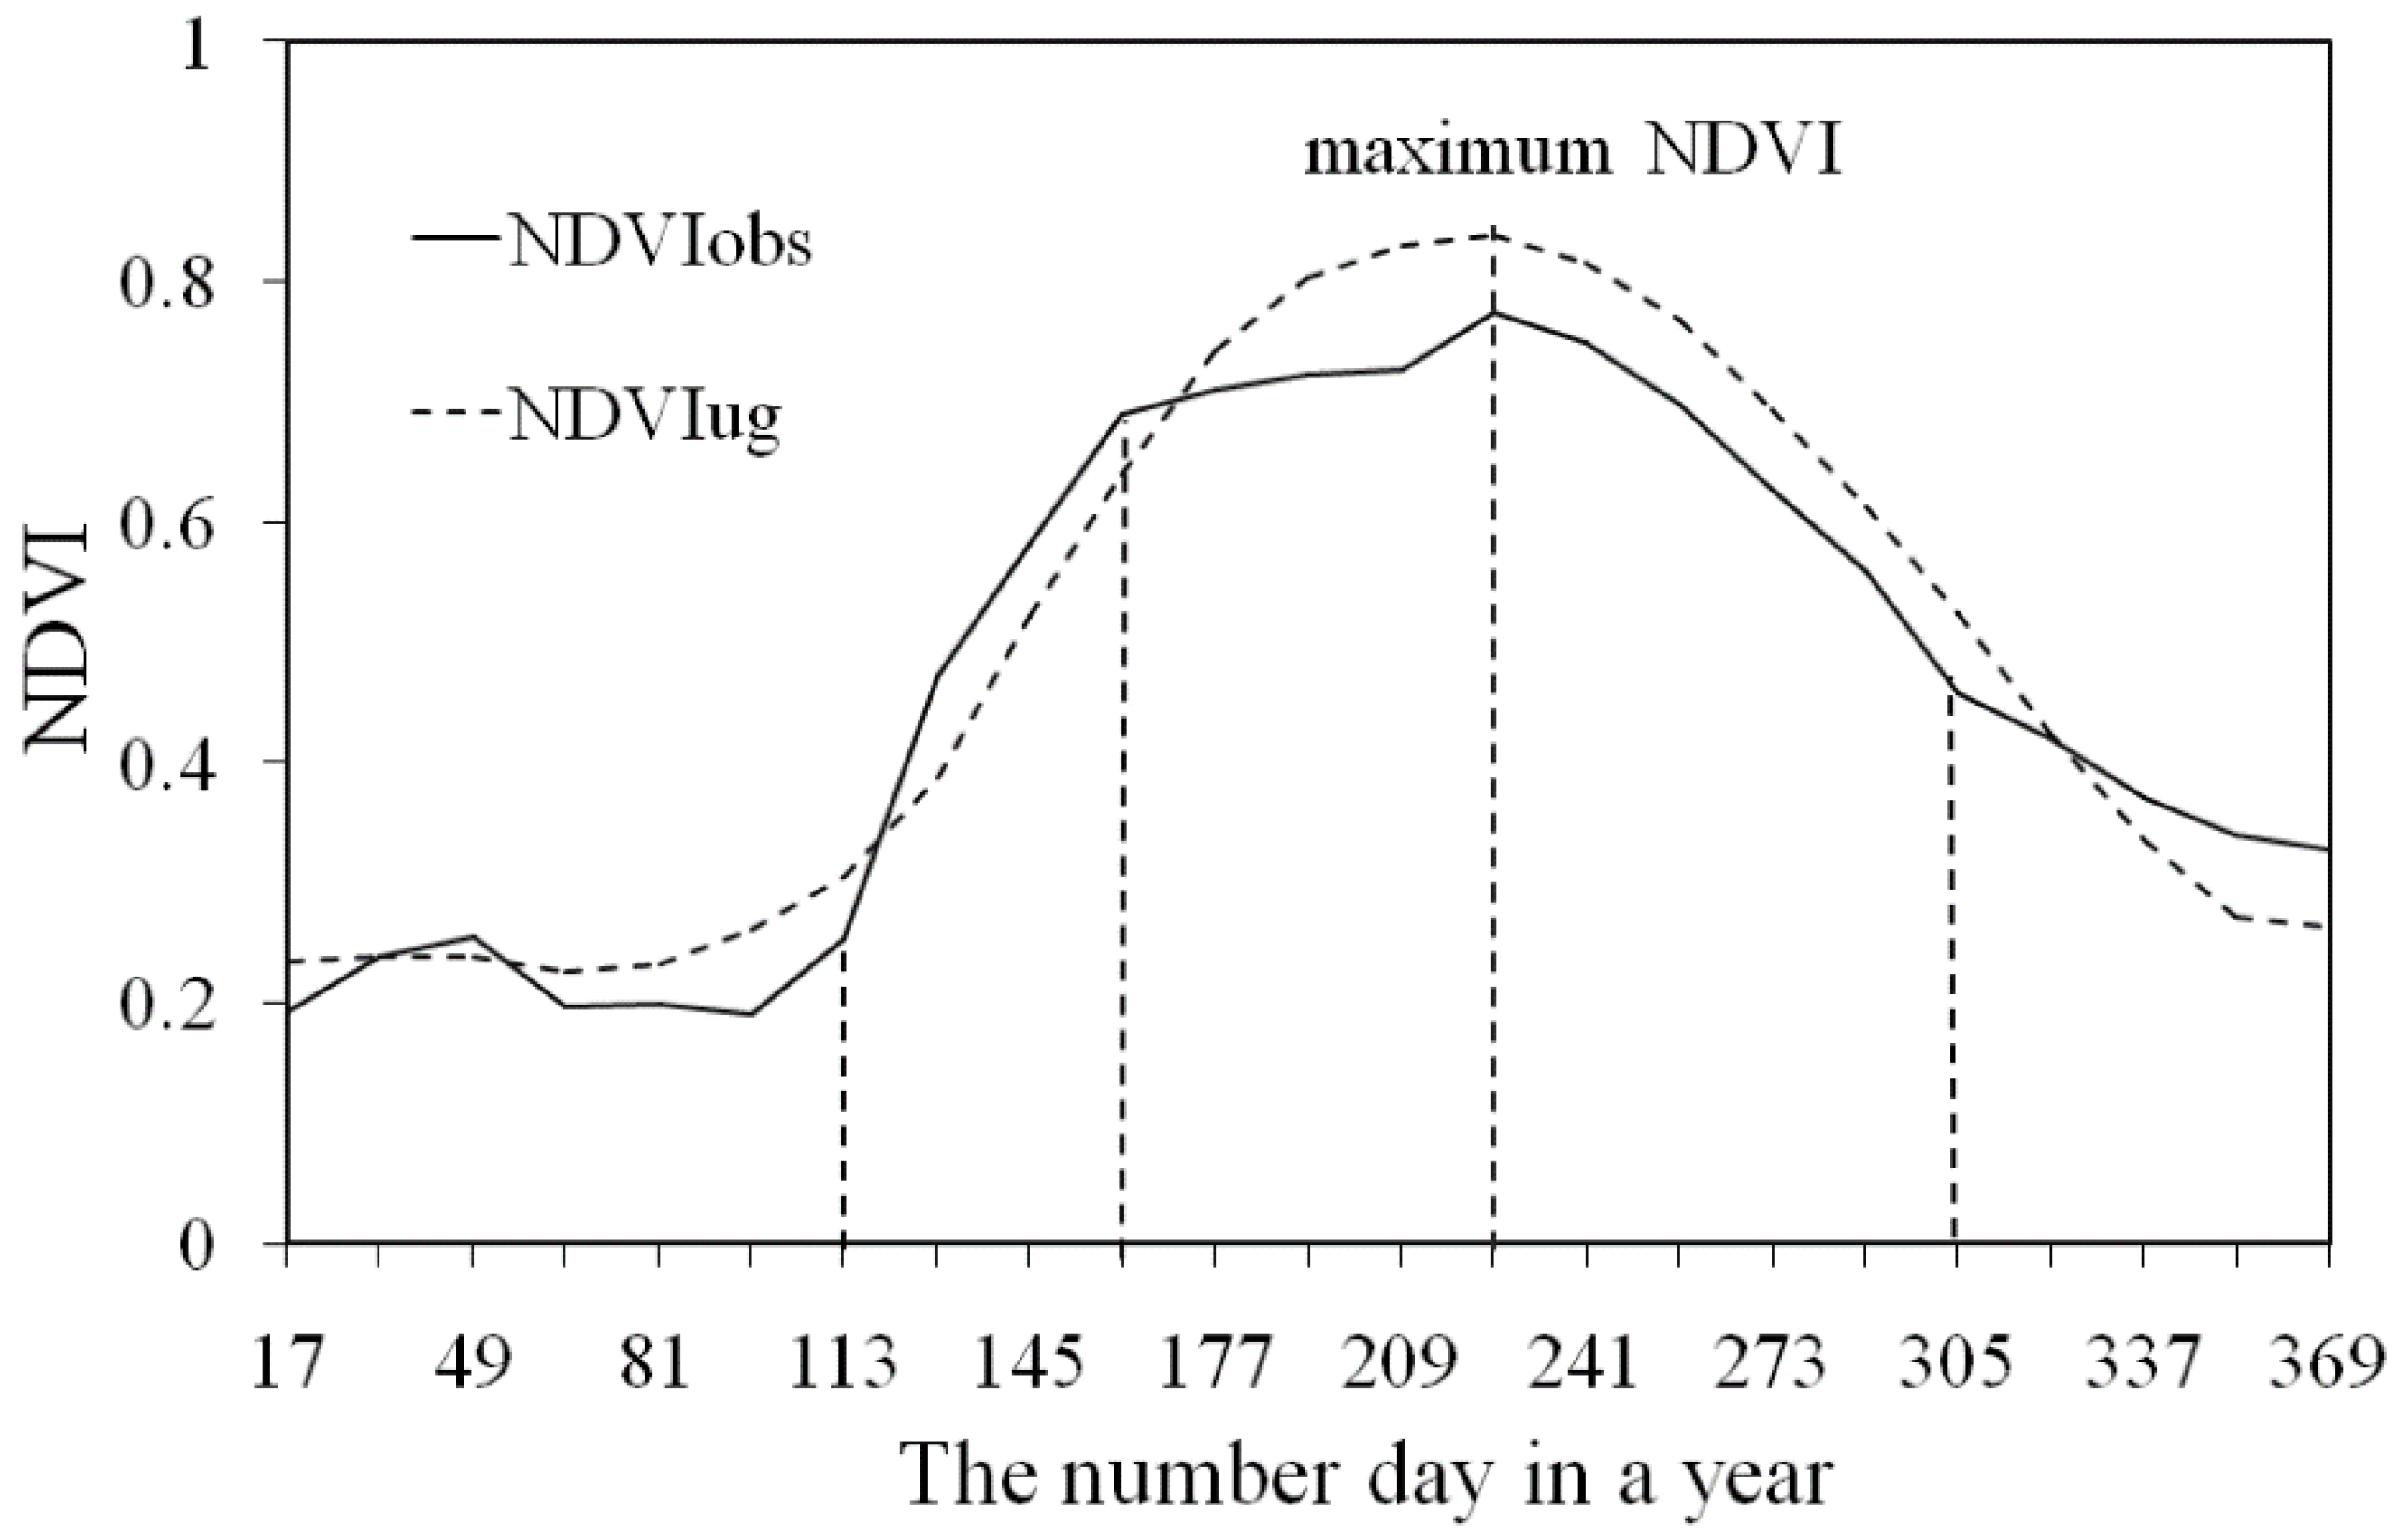
The climate of Zoige County is typical of alpine regions, with low temperature and high humidity. Based on the meteorological data measured at Zoige meteorological station from 1957 to 2012, the annual mean temperature was 1.21 °C and the average annual precipitation ranged from 464.8 to 862.9 mm (mainly concentrated in May–August). The growing period is from late March to Early September [34], and the NDVI would be up to the maximum value at the end of July to early August. The native grasslands are divided into summer pastures, winter pastures and all-year pastures by local people [37]. In the summer pastures, continuous livestock grazing will last from June to October, which is the best season for forage production. The grazing pastures from November to May of the next year are defined as the winter pastures, where grazing period would last seven months or even longer. In different kinds of pastures, the grazing systems are characterized by nomadic grazing.

3. Methodology

3.1. Overall Description

The DNDC model was adopted to simulate the impact of livestock grazing on the grassland ANPP in this paper. Grazing practice in this model is defined by specifying the grazing parameters, such as livestock type, heads and the grazing duration [38]. Given that NDVI is better predictor for rangeland biomass than other vegetation indices [39], in order to obtain these input parameters at regional scale, the time-series NDVI, and the statistical data of livestock heads were used to calculate grazing intensity and grazing period. After being converted into the normal sheep units, the grazing intensity was input into DNDC model as the heads of livestock per one hectare, and the grazing period (i.e., the time interval between two adjacent images) would be seen as the grazing duration. Then, based on the grazing parameters and the ecological driving factors (i.e., meteorology, soil, vegetation, slope and land cover), the raster information of all input parameters would be resampled into 250 m and the DNDC model would be run taking each pixel as a simulation site. In the end, the simulation results of grassland ANPP would be validated with the above-ground biomass measured at field scale from Zoige County. The total framework of this study can be seen in Figure 2.

3.2. Grazing Parameters Retrieval

3.2.1. NDVI Data

The time-series NDVI data used to explore the method describing the grazing effects, were from the MODIS NDVI product (MOD13Q1) in 2012, including 23 temporal NDVI images. MOD13Q1 data are provided every 16 days at 250-meter spatial resolution as a gridded level-three product (available at [40]). Since providing consistent spatial and temporal comparisons of global vegetation conditions, such MODIS NDVI products can be used to monitor the vegetation conditions and simulate above-ground productivity [26,41]. However, these NDVI products might be affected by cloud, atmosphere, and ice-snow cover. Although maximum value composite and cloud detection methods had been used in the processing of the NDVI time-series dataset, there are still lots of residual noises. Due to the success in offering high-quality long time-series NDVI for monitoring the ecosystem on the Zoige Plateau [42], a Savitzky–Golay (S–G) filter was chosen to reconstruct the MODIS NDVI time-series dataset before calculating grazing parameters. More detailed information about the S–G filter could be found by referring to the previous publication [42].

3.2.2. Grazing Intensity

Livestock grazing is a major form of land use in Zoige County and it is also the main human driving factor in simulating the grassland-wetland ecosystem with the DNDC model [27]. As shown in Figure 3, after the S–G filter application, the NDVI time-series profiles at undisturbed grassland would be approximately a parabola (see the dot line). If one region is used for grazing, the NDVI time-series profile should be different from the NDVI curve of non-grazing areas. In order to obtain the regional spatial and temporal patterns of grazing intensity of the study area, based on the different land use types, the NDVI time series data acquired from each simulation site would be compared with the NDVI time series data of the non-grazing regions.
As shown in Figure 2, there are two steps set in this paper to calculate the change rate of the grazing intensity. The first step is to determine whether the study area is used for grazing or not. Referring to the previous research [22,27], we used the time-series NDVI to develop two new indices, including the ratio index (RI) and relative difference index (RDI) (Equations (1) and (2)).
R I = N D V I i N D V I u g i
R D I = Δ N D V I Δ N D V I u g = N D V I j N D V I i N D V I u g j N D V I u g i ( j > i 1 )
where NDVIi and NDVIj are, respectively, the value of NDVI at time i and j for one remote sensing pixel which would be judged whether it is used for grazing. NDVIugi and NDVIugj are the values of NDVI for non-grazing regions at time i and j. ΔNDVI is the difference between NDVI at times i and j, and ΔNDVIug is the difference between NDVI for non-grazing regions at times i and j. Notably, if the method above is used to determine whether grazing has taken place at the study area, it needs to know the values of NDVI associated with non-grazing in that area. In this paper, the non-grazing areas were confirmed by the field investigation. Based on the locations of the non-grazing areas, the NDVI values for different land use types (i.e., wetland, moist grassland, and dry grassland) would be derived from the NDVI products, which would be used as the reference values of NDVI in non-grazing area.
RI judges whether one pixel is used for grazing through comparing the NDVI value of the pixel with the NDVI of non-grazing areas. For one pixel, if only RI is less than one or more than one, we could not simply recognize this pixel as a grazing pixel or a non-grazing pixel. For example, as presented in Figure 3, before the vegetation NDVI reaches the maximum value, the NDVI of the 113th day is 0.2522, less than NDVI value (0.3038) of non-grazing areas, and the RI in 113th is less than one. It might be unreasonable to determine the pixel as the grazing pixel at 113th day just only relying on RI. Since RDI is about 1.43, there might be no livestock grazing during the 97th–113th day after grazing at the 97th day. In addition, after the vegetation NDVI reaches the maximum value, the RI at the 305th day is also less than one, and RDI is more than one These two indices combined to show that there might exist grazing disturbance from 289th day to the 305th day and the grazing activity made the observed NDVI value decrease faster.
Additionally, RDI provides a measure of grazing impact using the variation of NDVI of one pixel. Likewise, we should not only depend on RDI to determine whether one pixel is used for grazing. For example, before the vegetation NDVI reaches the maximum value, the RDI from the 145th to the 161st day is less than one (0.91). However, the pixel could not be easily judged as a grazing pixel. Because the RI at 161st day is more than one (1.08), and vegetation growth might be restricted by natural conditions (e.g., heat or water conditions), not by livestock grazing.
Therefore, RI and RDI need to be combined to determine whether a single pixel has been used for grazing. Meanwhile, as discussed above, if one pixel is used for grazing, the RI must be less than one. However, before and after the vegetation NDVI value reaches the maximum value, the RDI of the grazing areas would be different. Accordingly, as seen in Figure 2, a* and b* are deduced to judge whether a pixel used for grazing as follows:
(a*)
Before the vegetation NDVI reaches the maximum value, the regions with RI < 1 and RDI < 1 would be taken as grazing areas;
(b*)
After the vegetation NDVI reaches the maximum value, the regions with RI < 1and RDI > 1 would be identified as grazing areas.
Subsequently, the second step is to calculate the grazing intensity. In free-grazing grassland, we can obtain the grazing intensity of one pixel based on the number of livestock supported by the variation of NDVI within a certain period of time. In order to subtract the change of NDVI caused by the different natural conditions, the NDVI in grazing areas would be compared with the NDVI in non-grazing areas. The calculation formula of grazing intensity can be expressed as follows:
G I = | Δ N D V I g Δ N D V I u g | | Δ N D V I g Δ N D V I u g | × S U
therein , Δ N D V I g = N D V I g j N D V I g i   Δ N D V I u g = N D V I u g j N D V I u g i
where SU is annual total livestock heads in study area, which was calculated from the number of heads of livestock recorded in the statistical yearbook of the Zoige County in 2012 provided by Zoige County government [43]. In this paper, SU need be converted into sheep units according to “animal unit equivalent” standard provided by Sichuan Provincial Agricultural Department [44]. GI is the grazing intensity for each pixel from time i to time j, and the unit of GI is the heads of sheep unit per hectare in one day (SUD/ha). NDVIgi and NDVIgj are, respectively, the NDVI values in grazing regions at time i and j. ΔNDVIg − ΔNDVIug is the variation of NDVI for one grazing pixel. ∑|ΔNDVIg − ΔNDVIug| is the sum of the NDVI changes during a certain period of time for the total study area.
Based on previous research results about the grazing in Zoige Plateau [45] grazing could be divided into very light grazing, light grazing, moderate grazing, heavy grazing, and very heavy grazing (Table 1). Light grazing was defined as 5 SUD/ha, which is the maximum number of sheep per ha (within a range of 1 to 5 SUD/ha) that ensured little grazing utilization (less than 30%). Moderate grazing was defined as 10 SUD/ha, which was as the maximum number of sheep that could make the grazing utilization less than 60%. Heavy grazing occurred at GI of 10–20 SUD/ha, and resulted in grassland degradation. Very light grazing and very heavy grazing are, respectively, defined as less than 1 SUD/ha and more than 20 SUD/ha.

3.2.3. Grazing Period

Grazing period is usually defined as the number of days when a pasture is grazed. In this paper, the grazing period for one year can be obtained through accumulating the grazing durations. Based on the method described above, from January 1st to December 31st in 2012, 22 maps of grazing intensity (except the first day in 2012) were obtained from the 23 time-series MODIS NDVI images. The grazing duration would be calculated from the time interval between two adjacent images which was inferred that there was livestock grazing. Taking one pixel as an example, if this pixel at 17th day was recognized for grazing, the grazing duration would be 16 days (i.e., 1st–17th day). Otherwise, the grazing duration would be zero day. For each map of grazing intensity, one corresponding spatial map of grazing duration would be obtained. Finally, there are 22 maps of grazing duration would be used to calculate the grazing period in 2012.
In view of the grazing duration results for the study area, according to the character of the period of time for livestock grazing, the spatial distribution of the different pasture types (i.e., non-grazing areas, winter pastures, summer pastures, and all-year pastures) could be discriminated from the whole study area.

3.3. DNDC Model

3.3.1. Model Description

The DNDC model (version 9.5, available at [46]), developed at the University of New Hampshire, is a process-based ecosystem model which was originally used for estimating carbon sequestration and nitrogen trace gas emissions from the agricultural ecosystem [47]. Through long-term applications, this model has been used to simulate biogeochemical carbon cycle for almost all terrestrial ecosystem (i.e., farmland, forest, wetland, and grassland) and validated to be one of the most widely accepted biogeochemical models in the world [48].
This model consists of six interacting sub-models (simulating the process of soil and climate, vegetation growth, decomposition, nitrification, denitrification, and fermentation separately) and is mainly driven by four primary ecological drivers (namely climate, soil, vegetation, and management practices) (Figure 2). With the six sub-models and a large number of ecological input parameters, the DNDC model can directly simulate the variations of NPP for the grassland-wetland ecosystem. Based on the estimation results of NPP, the DNDC model was improved to calculate ANPP through the Equation (5):
A N P P = N P P × f g r a i n + f l e a f + f s t e m f g r a i n + f l e a f + f s t e m + f r o o t
where fgrain, fleaf, fstem and froot are respectively the grain, leaf, stem, and root fractions of total biomass at maturity and they were obtained from the vegetation data.
In DNDC model, grazing activity would directly affect the ANPP simulation results through changing the standing live aboveground biomass and having an influence on the nitrogen demand of vegetation growth. As shown in Figure 2, the grazing parameters would be input into the process model to calculate the residual biomass after grazing and the nitrogen demand of plant material.

3.3.2. Input Parameters

There are generally 38 input parameters in DNDC model without considering management practices (e.g., livestock grazing), including climate, soil, vegetation, slope, and land use data.
The meteorological data in 2012 (1 January–31 December) for 28 meteorological stations around the study area (see Figure 1b) were provided by the Chinese Meteorological Administration (available at [49]), including daily temperatures, daily precipitation, daily wind speed, daily radiation, and daily humidity data. Based on the ANUSPLINE software package [50], incorporating the variation in elevation, the five climate databases were interpolated to obtain 250 m × 250 m grid. Other meteorological parameters, such as nitrogen concentration in rainfall, atmospheric background NH3 and CO2 concentration, were set to the default values of the DNDC model.
The soil property data were derived from the Chinese soil map at a scale of 1:1,000,000 (available at [51]), including soil type, soil organic carbon (SOC), bulk density, soil pH, and soil clay. The dominant soil type in Zoige County is loam, covering >83.2% of the study area. The values of main soil parameters (listed in Table 2) could be set by references to the parameter values derived from the Chinese soil map at scale of 1:1,000,000 or the default values of the DNDC model.
The vegetation data was built according to the Sichuan province vegetation type map at the scale 1:1,000,000 (provided by our research team). As seen in Table 3, the dominant vegetation communities in Zoige County are Kobresia setchwanensis, Carex muliensis, Kobresia pygmaea, Kobresia capillifolia, Kobresia schoenoides, Elymus nutans, and Polygonum macrophyllum. The relevant parameters came from the field survey or referred to the relevant papers and the default values of the DNDC model.
The slope data was generated from the Shuttle Radar Topographic Mission (SRTM) 90m digital elevation model (DEM) dataset (Figure 1b), which could be available from International Scientific and Technical Data Mirror Site [52].
The land cover map with a 30-m spatial resolution was provided by our research team (Figure 1 c). It was derived from TM images and auxiliary data such as DEM and time-series NDVI by the matter-element fuzzy decision-making classifier, with an overall precision of 89.89% [53]. As shown in Figure 1c, in Zoige County, the wetlands and grasslands account for about 77.2% of the whole study area, including herbaceous wetland, peatland, wet meadow, meadow, prairie, and sparse pasture. In accordance with the requirements of the DNDC model, these six land cover types would be classified into three categories: wetland (herbaceous wetland and peatland), moisture grassland (wet meadow), and dry grassland (meadow, prairie, and sparse pasture).

3.4. The Ground Measurements

Since the grasses would accumulate the maximum biomass at the end of growing season [34], we chose the relatively flat area to conduct the field sampling measurements in mid-August 2012. As shown in Figure 1c, a total of 39 monitoring field plots with GPS record in Zoige County were collected. At each monitoring site, one sample plot with the size of 100 m × 100 m is designed to have nine samples with a size of 1 m × 1 m distributed uniformly in the sample plot. For nine samples, above-ground grass would be harvested and dried. The above-ground biomass were then converted into ANPP through multiplying by an empirical coefficient of 0.475 [59]. In each sample plot, there were nine above-ground biomass samples and their average value would be assigned to the sample plot.
Among all monitoring field plots, six field plots are located inside an exclosure which were not used for grazing (Figure 1c), including one wetland plot, one moisture grassland plot, and four dry grassland plots. For these non-grazing plots, based on each NDVI image, we derived the minimum NDVI values for each land use type as the NDVI threshold values of different land use types in non-grazing areas. Then, there would be 23 NDVI values of non-grazing areas in 2012 obtained from the NDVI time series dataset and a NDVI curve of the non-grazing areas for wetland, moist grassland, and dry grassland would be generated.

4. Results and Analysis

4.1. Validation of DNDC-Simulated Results

In order to evaluate the accuracy of the model simulation results, using the ground measurements and the model simulation results, we calculated the coefficient of determination (R2), root mean square error (RMSE), and relative error (RE) to evaluate the performance of the DNDC model.
As shown in Figure 4a, if grazing was considered, the ANPP simulation results of the sample plots were very close to the observed data, with R2 of 0.75 and RMSE of 122.86 kgC/ha. The RE ranged from 0.51% to 37.58% and the average RE was 8.77%. This indicated that the model estimations were consistent with the observed ANPP of Zoige sample fields. It is reasonable to believe that the DNDC model could be used to simulate the ANPP under grazing condition in Zoige County. If grazing was not considered, the ANPP simulation values had poor accuracy, with RMSE of 211.51 kgC/ha and average RE of 32.5%. As shown in Figure 4b, the DNDC-simulated ANPP were different from the field measurements, with R2 of 0.4. Therefore, the combination of DNDC and the remote sensing-derived grazing parameters could effectively improve the accuracy of ANPP simulation results.

4.2. Spatial Variation of Regional ANPP

Figure 5a illustrates the spatial distribution of simulated ANPP of the Zoige County wetland-grassland ecosystem in 2012 with the consideration of grazing activity. For the whole area, the total above-ground productivity was up to 3.815 × 10⁵ tC. The regional average ANPP was calculated to be 483.47 kgC/ha, with values ranging from a lowest ANPP of 7.67 kgC/ha in sparse pastures to a highest ANPP of 3869.76 kgC/ha in herbaceous wetlands. As shown in Table 4, the areas with higher regional average ANPP mainly located in herbaceous wetlands, peatlands, and wet meadows. Meadows and prairies, covering the largest areas in Zoige County, generally had the ANPP of 100–500 kgC/ha, with the regional average ANPP of 422.46 kgC/ha and 389.71 kgC/ha, respectively. Sparse pastures had a smaller area and lower ANPP, and the regional average ANPP was 328.84 kgC/ha.

4.3. Effect of Grazing on ANPP

If grazing was not considered, as shown in Figure 5b, the ANPP simulation results had a similar spatial pattern with those considering the grazing activity, but the former values were slightly larger than the latter ones. The maximum and minimum values of ANPP without considering grazing would be, respectively, 3880.44 and 109.76 kgC/ha. For the whole area, the regional ANPP in Zoige County would be overestimated by 44.4%, up to 5.51 × 10⁵ tC and the regional average ANPP was 698.3 kgC/ha.
As seen in Figure 5c, the regional average difference of ANPP between the non-grazing and grazing scenarios was about 214.84 kgC/ha and the total difference of regional ANPP was up to 1.695 × 10⁵ tC. For different land cover types (Table 4), the variation in ANPP under different grazing conditions mainly occurred in the dry grasslands (e.g., meadow, prairie, and sparse pasture), with the difference of ANPP above 200 kgC/ha. Compared with the simulated ANPP without considering grazing, the regional average ANPP while considering grazing in peatlands did not change much as the difference was 28.49 kgC/ha.
With the change of the grazing intensity levels, if grazing was considered, the values of ANPP would vary more greatly than ones without considering grazing. As seen in the Table 5, light to moderate grazing would make ANPP decrease 100–300 kgC/ha and heavy grazing would reduce ANPP more. When the grazing intensity in grass growth period was less than 1 SUD/ha (Table 5), the ANPP would increase or remain unchanged. Especially for peatlands would remain almost pristine marsh due to less human activity.

5. Discussions

5.1. Credibility of the Derived Grazing Parameters

Using time-series remote sensing data, this paper proposed an approach to estimate regional grazing parameters (i.e., grazing intensity and grazing period). Compared with previous studies, the method used in this study had some characteristics to make the derived grazing information credible.
This method combining RI and RDI would be more suitable for identifying grazing areas than other methods used in studies such as [27]. Specifically, the RI/RDI constituted by the NDVI of grazing and non-grazing areas could reduce some impact of environmental factors, avoid the errors caused by setting the threshold values and prevent using one grazing intensity/period for one place in a whole year.
Significantly, the spatial variation of grazing intensity could be present in this study. The regional annual average grazing intensity was 2.745 SUD/ha, with the range from 0.559 SUD/ha in peatlands to 4.419 SUD/ha in sparse pastures (Table 6), which were close to the grazing intensity (2.83 SUD/ha) calculated from the stock carrying capacity of Zoige County in [60]. Therefore, it is reasonable to believe that the values of the grazing intensity calculated in this paper are convincing. Significantly, this method can avoid using low-resolution grazing intensity input into ecological models to estimate ANPP. For instance, the GLW (available at [61]), developed by Food and Agriculture Organization (FAO) in collaboration with the Environmental Research Group Oxford (ERGO), is the data about the distribution of livestock, with spatial resolution of 0.05°. Although the GLW data had been used in estimating the grazing intensity [19], it could not reflect the real grazing intensity in Zoige County for its low-resolution (Figure 6a). On the contrary, the grazing intensity calculated from time-series remote sensing data in this paper can offer high-quality data for regional scales, with spatial resolution of 250 m (Figure 6b). It is obvious that the grazing intensity used in this paper can illustrate the spatial distribution of the grazing intensity better than the data from FAO.
Simultaneously, the time-series grazing intensity and the grazing period, which had been hardly reported in previous studies [8,17,25,27,28] and could not be provided by FAO (Figure 6a), were also provided in this study. It allows us to quantify the temporal changes of grazing intensity in nomadic grazing patterns and analyze the types of pastures.
For one whole year, the average grazing intensities of Zoige County varied from 2.58 SUD/ha to 3.95 SUD/ha (except the 353rd day) (see Figure 7), which were also verified by the stock carrying capacity of Zoige County in the paper [60]. From the 17th day to the 337th day, the values of grazing intensity decreased first, and then increased, up to the peak in January or December. Among them, the average grazing intensity in 177th day was 3.687 SUD/ha, even more than ones in January. This is reasonable because it is consistent with the results of the previous research [62], which documented that the day-grazing time in summer was longest and the stocking rate was too high in summer pastures. Another reason for the high grazing intensity in summer might be that abundant production was stored in summer to feed the livestock in other season. On the contrary, the grazing intensity in the 353rd day was calculated to be more than 300 SUD/ha, which was obviously unreasonable because the grass yield of one hectare could not feed so many sheep in Zoige County [60]. This error was associated with the limited above-biomass and the small variation of the vegetation NDVI for whole study area in winter, which might make the grazing intensity over-estimated.
In addition, the spatial distribution of the grazing period in Zoige County was presented in Figure 6c, with average grazing period of 118.82 days. For different land cover types, the grazing period for wetlands and moisture grasslands was generally less than the grazing period for other land cover types (Table 6). Especially for peatlands, the annual grazing period was 7.110 days, which was much shorter than other land cover types. This is also consistent with the actual situation in Zoige County. For example, the peatlands locate in the national wetland nature reserve, where the grazing is strictly limited. Moreover, the peatlands are too wet to fit for the livestock grazing [32]. Therefore, it is reasonable to believe that the grazing period calculated in this paper could be used to monitor the spatial distribution of the different types of pastures in nomadic grazing systems. As shown in Figure 6d, all-year pastures, summer, and winter pastures accounted for 73.4%, 10.6% and 8.3% of the Zoige County, respectively. The area of the all-year pastures was far more than other types of pastures. These might corroborate that the average area of pastures each family held in Zoige County (less than 10.15 ha) [63] was not large enough to be divided into several regions for grazing rotation.

5.2. Error Sources of Regional ANPP Simulation

Compared with the model-simulated ANPP without considering grazing activity, although the accuracy of model-simulated ANPP while considering grazing impact could be improved significantly with R2 of 0.75, there are still some errors between the model-simulated ANPP and the observed data with RMSE of 122.86 kgC/ha. This might be because there are a number of uncertainties deriving from the initial input parameters in simulating process [64]. In our previous work [65], some input parameters of the DNDC model, such as the daily temperature [66], root biomass C/N ratio and annual nitrogen demand [67], atmospheric background CO2 concentration, land use type, and soil type, had been proved to have a significant impact on the accuracy of the model simulation results. The low resolution or accuracy of these input parameters would directly result in poor model simulation results. For example, soil type from the map at the scale 1:1,000,000 would bring errors into regional ANPP simulation result for their low resolution, and regional meteorological data derived from the interpolation method could not provide enough precise information by lack of the observation stations [68]. Therefore, the development of high-quality datasets of regional ecological parameters is essential for highly accurate regional model simulations [19]. In addition, no matter what circumstances, there was still a large uncertainty introduced in the analysis of terrestrial C dynamics for model deficiencies, uncertain parameters over large areas or other factors, especially at regional scale [69]. Thus, the data assimilation approaches, which could effectively combine the observation information and process-based models to improve parameterization of biogeochemical models and the accuracy of simulation [70], should be explored to obtain the accurate simulation results in the future work.

5.3. Merits and Limitations of Current Work

Due to the lack of enough grazing data at regional scale, there is little research studying the influence of grazing on the regional ANPP [71]. This study tried to combine the time-series remote sensing data with the process model to develop a methodology to simulate the grazing effects on grassland ANPP at regional scale. Compared with previous studies, this method has some merits in simulating the grazing effects on ANPP. On the one hand, it could avoid being constrained by the field observations and provide high-resolution data about the regional grazing intensity and grazing period. Furthermore, it would allow us to monitor the temporal changes of grazing intensity in nomadic grazing patterns and analyze the grazing period of the pastures. On the other hand, it could successfully simulate the grassland ANPP under grazing conditions and investigate the response of grassland ANPP to grazing. For example, compensatory or overcompensatory growth existing between ANPP and grazing [18] and over-grazing could easily be expressed in the time-series remote sensing data. Moreover, the grazing would be confirmed to have influence on ground cover in a short term [72], and very light grazing could improve the ANPP [19].
Although the method above has been proved to have many advantages for estimating the grazing effects on regional ANPP, there are still questions needed to be solved in future work.
According to the Equations (1)–(3), the calculation of grazing parameters assumes that the deviation from the non-grazed temporal dynamic of the NDVI was only induced by the grazing activity. However, in fact, the variation of the vegetation NDVI between the grazing and non-grazing areas might be due to meteorological, soil, and topographical conditions [73], especially for the different years. And the NDVI time-series profile of non-grazing areas would directly affect the accuracy of the grazing parameters calculation results. Therefore, in order to reduce the influence of these environmental factors on vegetation NDVI and employ reasonable NDVI threshold values, it needs enough field investigations of non-grazing areas for each year to ensure reference NDVI curve in non-grazing areas representative and adequate for the study area. However, for a large region, it is impossible to obtain enough field samples. If a perfect NDVI curve in non-grazing areas could be created through the plant growth models or by other means, it might be able to ensure that the grazing intensity/period is more reliable.
Obviously, the accuracy of the grazing period estimated in this paper would be affected by the time of the NDVI data. In this paper, the grazing parameters came from the MOD13Q1 vegetation indices product, which is generated by the Constrained View angle—Maximum Value Composite (CV-MVC) method. The CV-MVC method tends to select pixel observation with the highest NDVI value to represent the entire period (16 days). In the extreme case, there would be one day or 30 days between two adjacent NDVI images and there would be large errors in the grazing period. Thus, the daily NDVI data (e.g., MODIS MOD09GQ) was suggested to be an alternative data in estimating the grazing parameters. However, due to the interrupt of clouds or cloud shadow, aerosol and data transmission errors, etc., it might be also hard to obtain a perfect grazing intensity/period. Therefore, it is worth exploring how to improve the calculation accuracy of the grazing parameters (i.e., grazing intensity and grazing period) in our future work.
In addition, lacking the spatial and temporal grazing information on Zoige County, it is hard to verify the accuracy of the grazing intensity or grazing period in this paper. In future work, the field experimentations needs to be developed, such as GPS tracking [25], plant community surveying [74], livestock fecal material evaluating [74], livestock surveying [75], or other approaches to obtain the validation data of the grazing. Moreover, some changes associated with ANPP and the livestock grazing, such as soil properties, micrometeorology, and water [76], also need to be explored by combining the remote sensing with the filed samples in the future work.

6. Conclusions

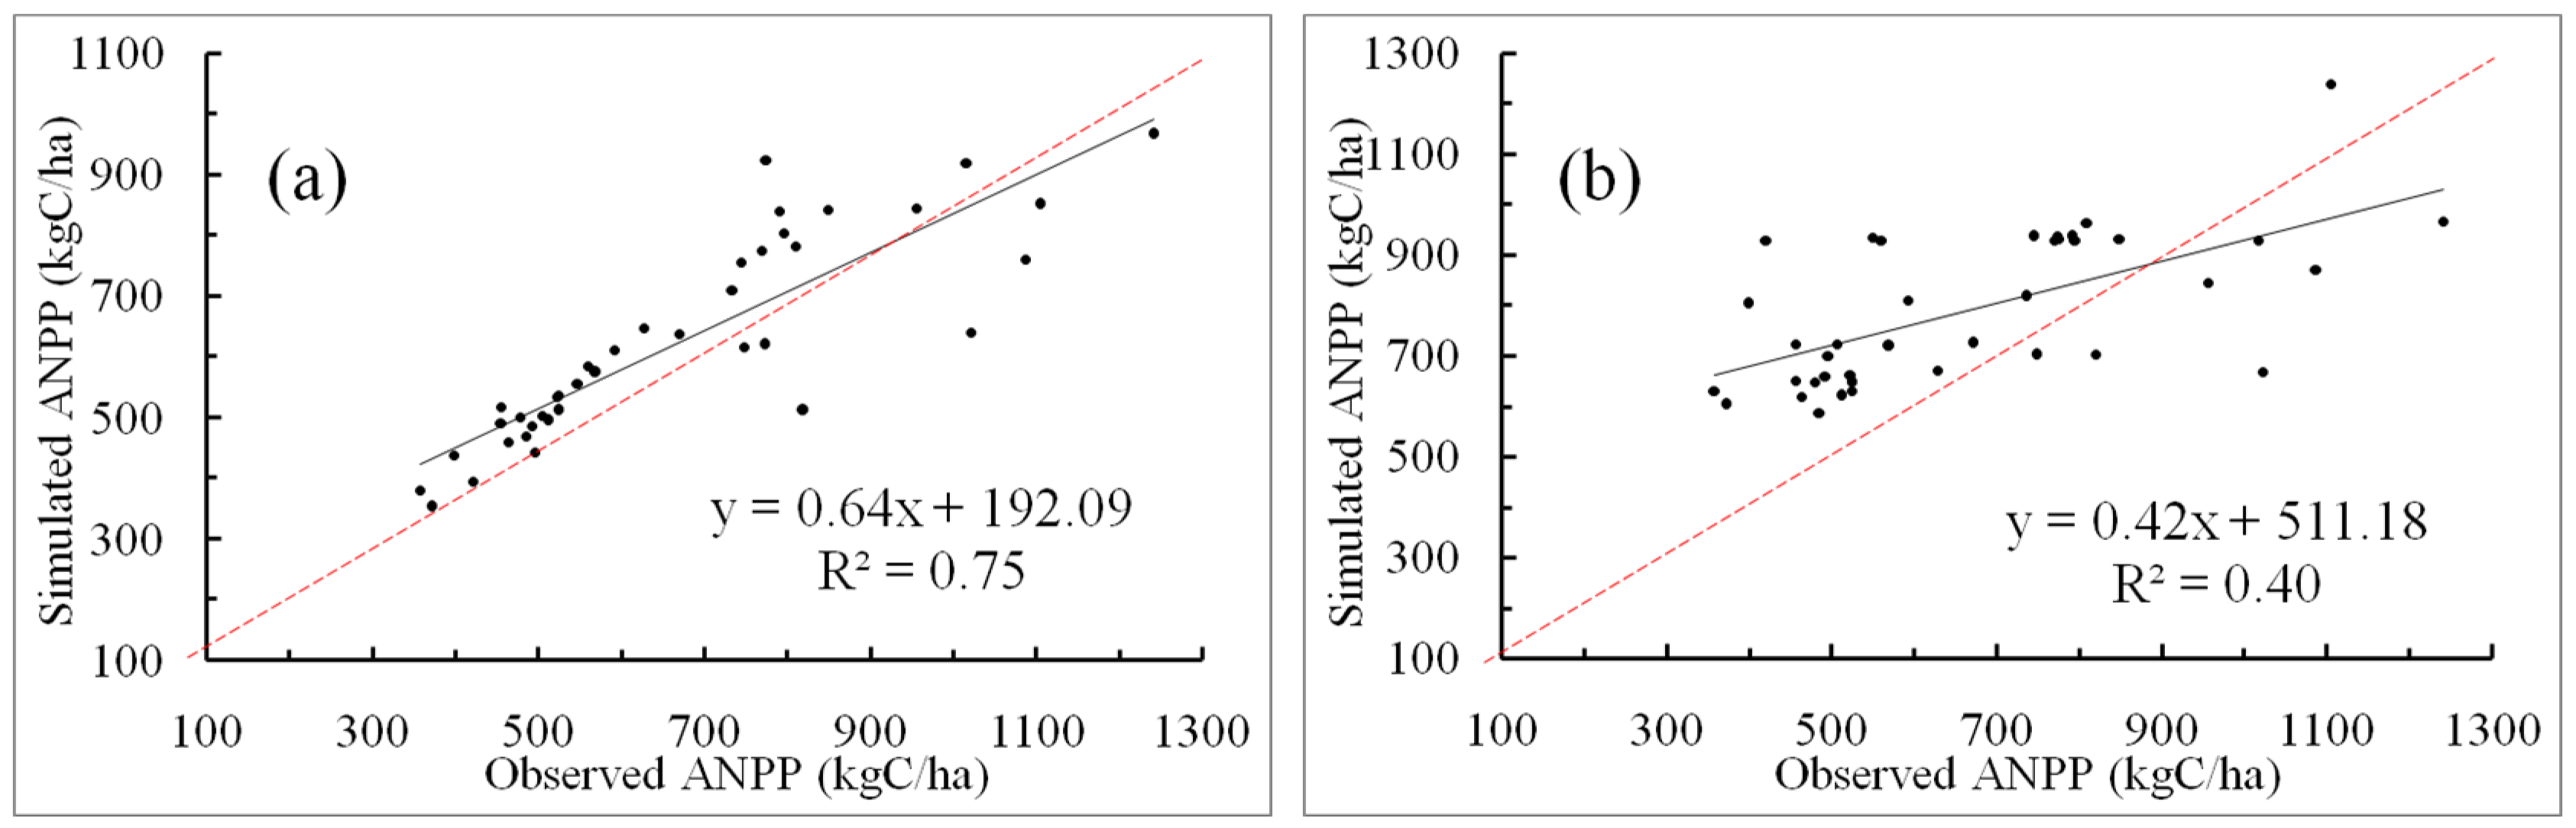
Taking the Zoige Plateau grassland-wetland ecosystem of China as a case, this study proposed an approach to simulate the grazing effects on ANPP using time-series remote sensing data and a process-based ecosystem model. Compared with the ANPP simulation results without considering grazing, the ANPP estimated had more significant relationship with the observed ANPP, with R2 of 0.75, RMSE of 122.86 kgC/ha, and average RE of 8.77%. Therefore, this method can successfully estimate the grassland ANPP under grazing conditions at regional scale.
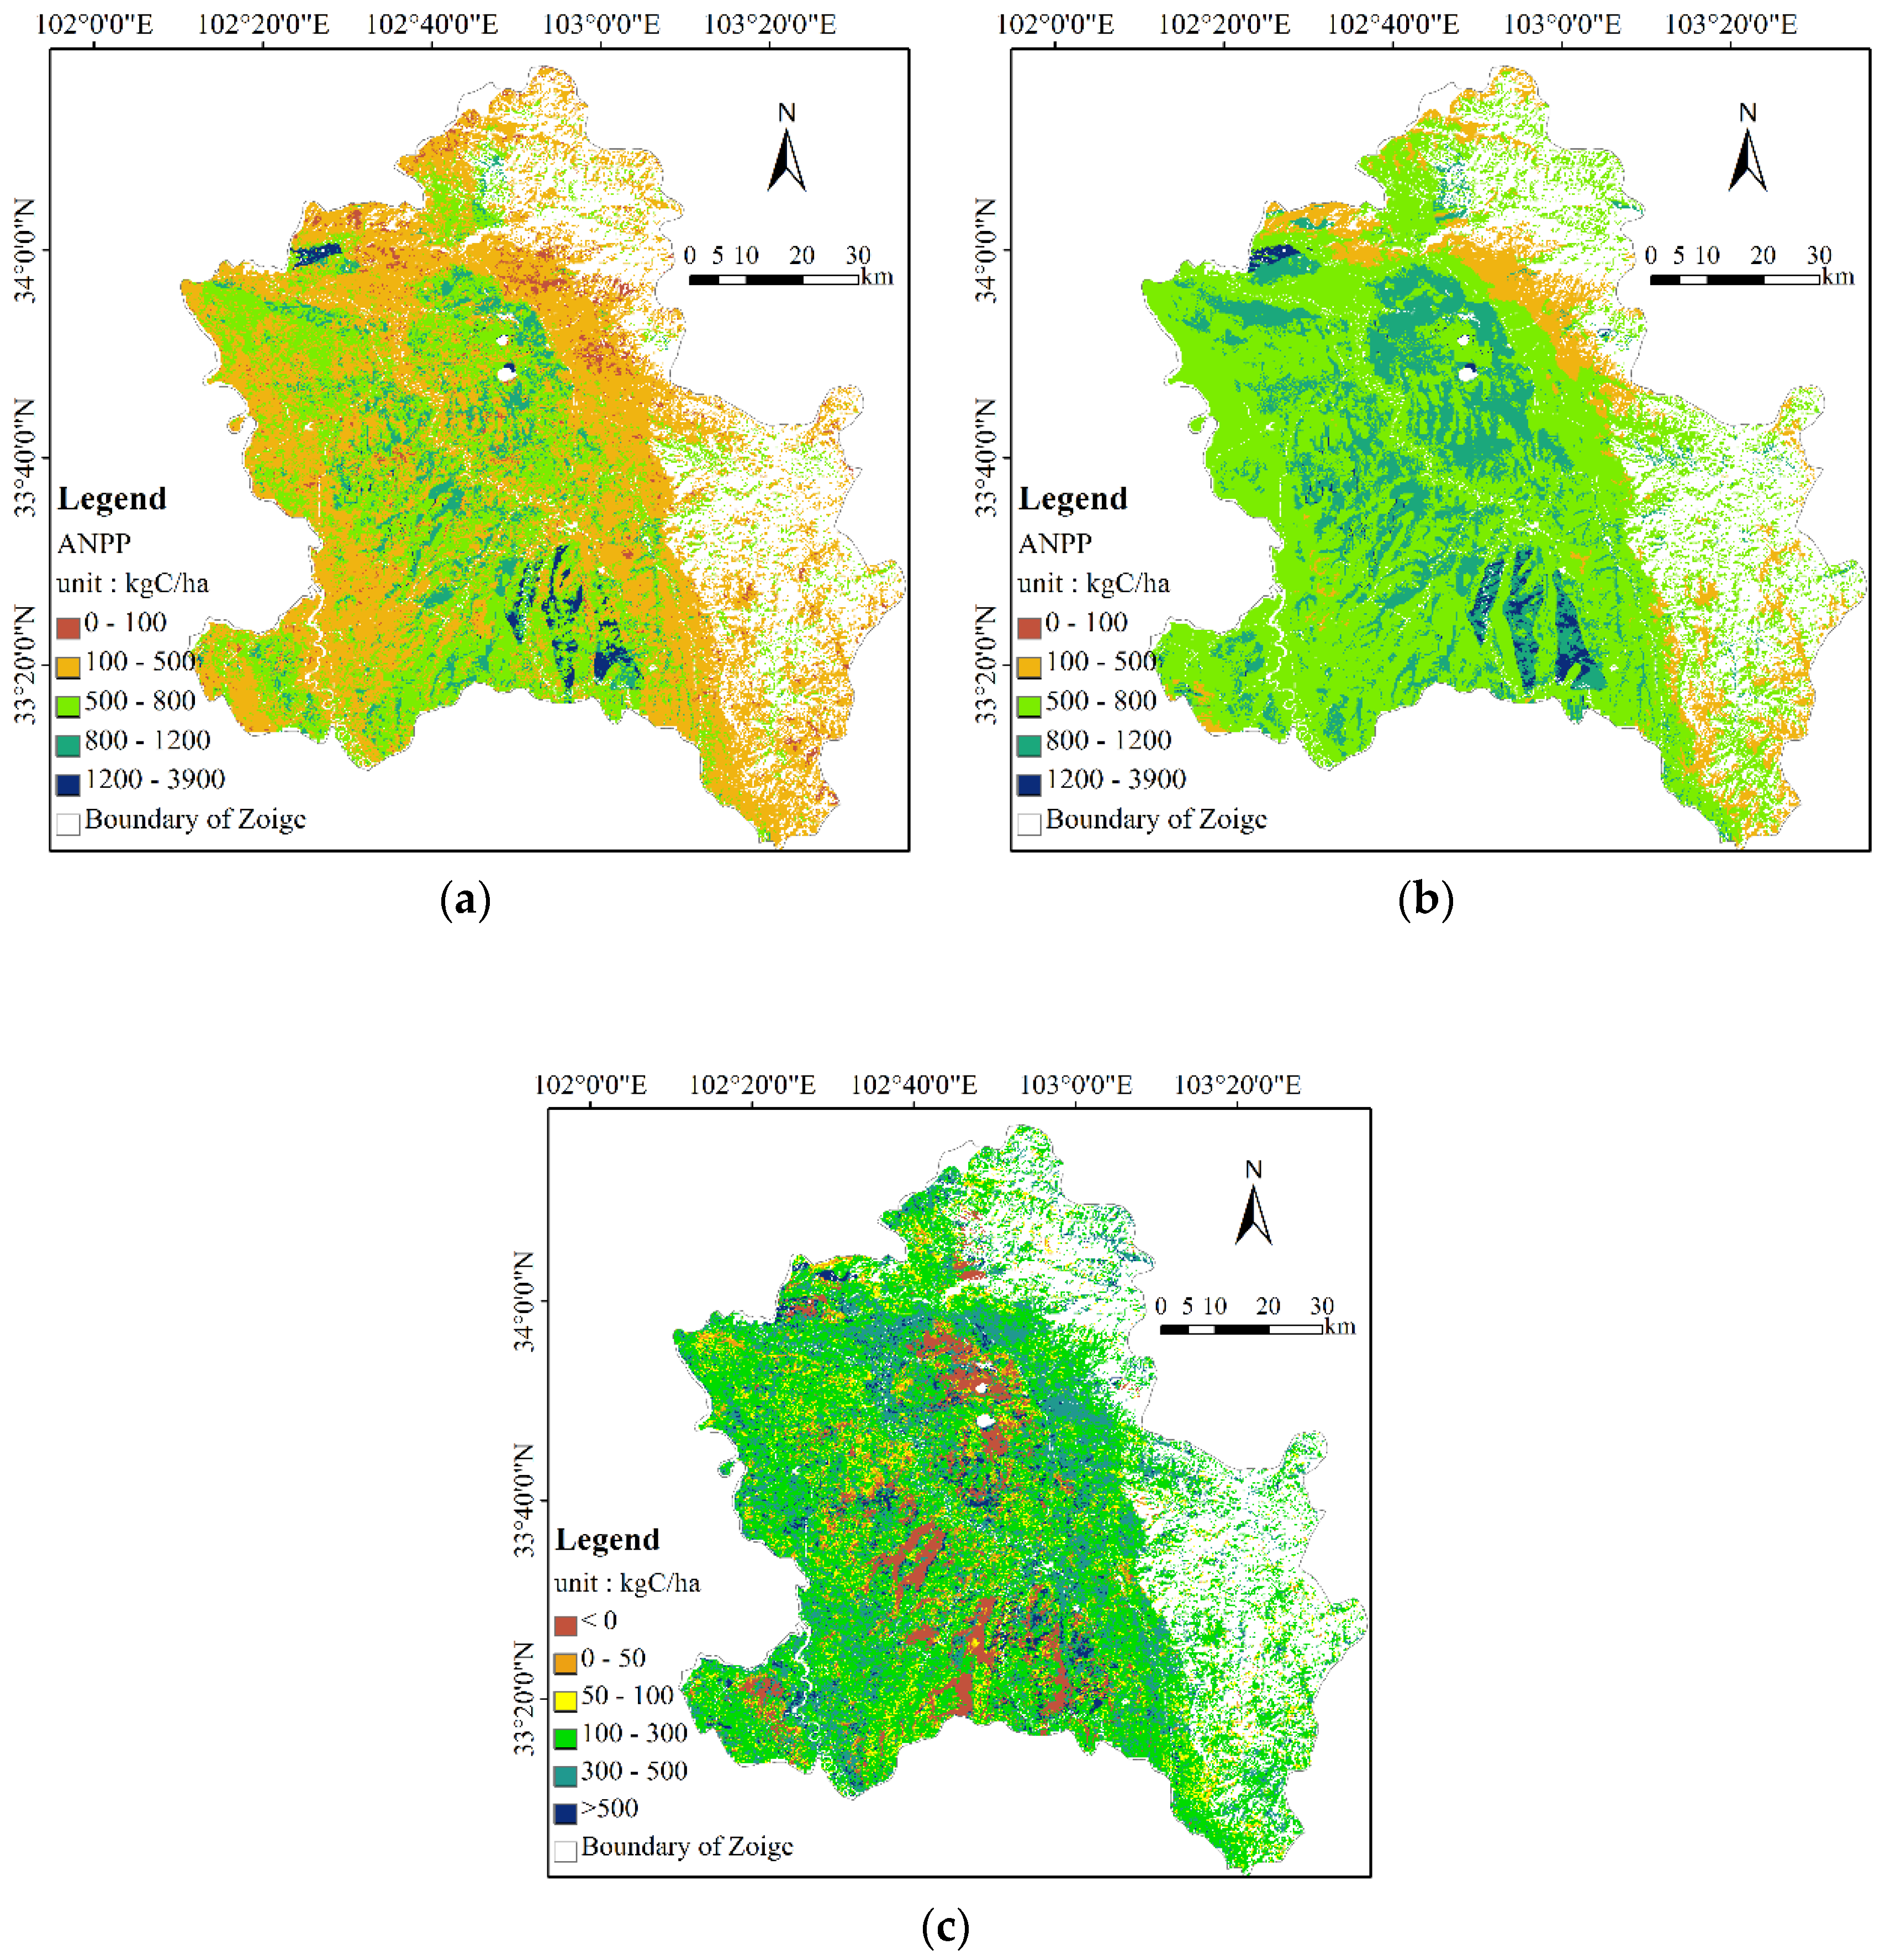
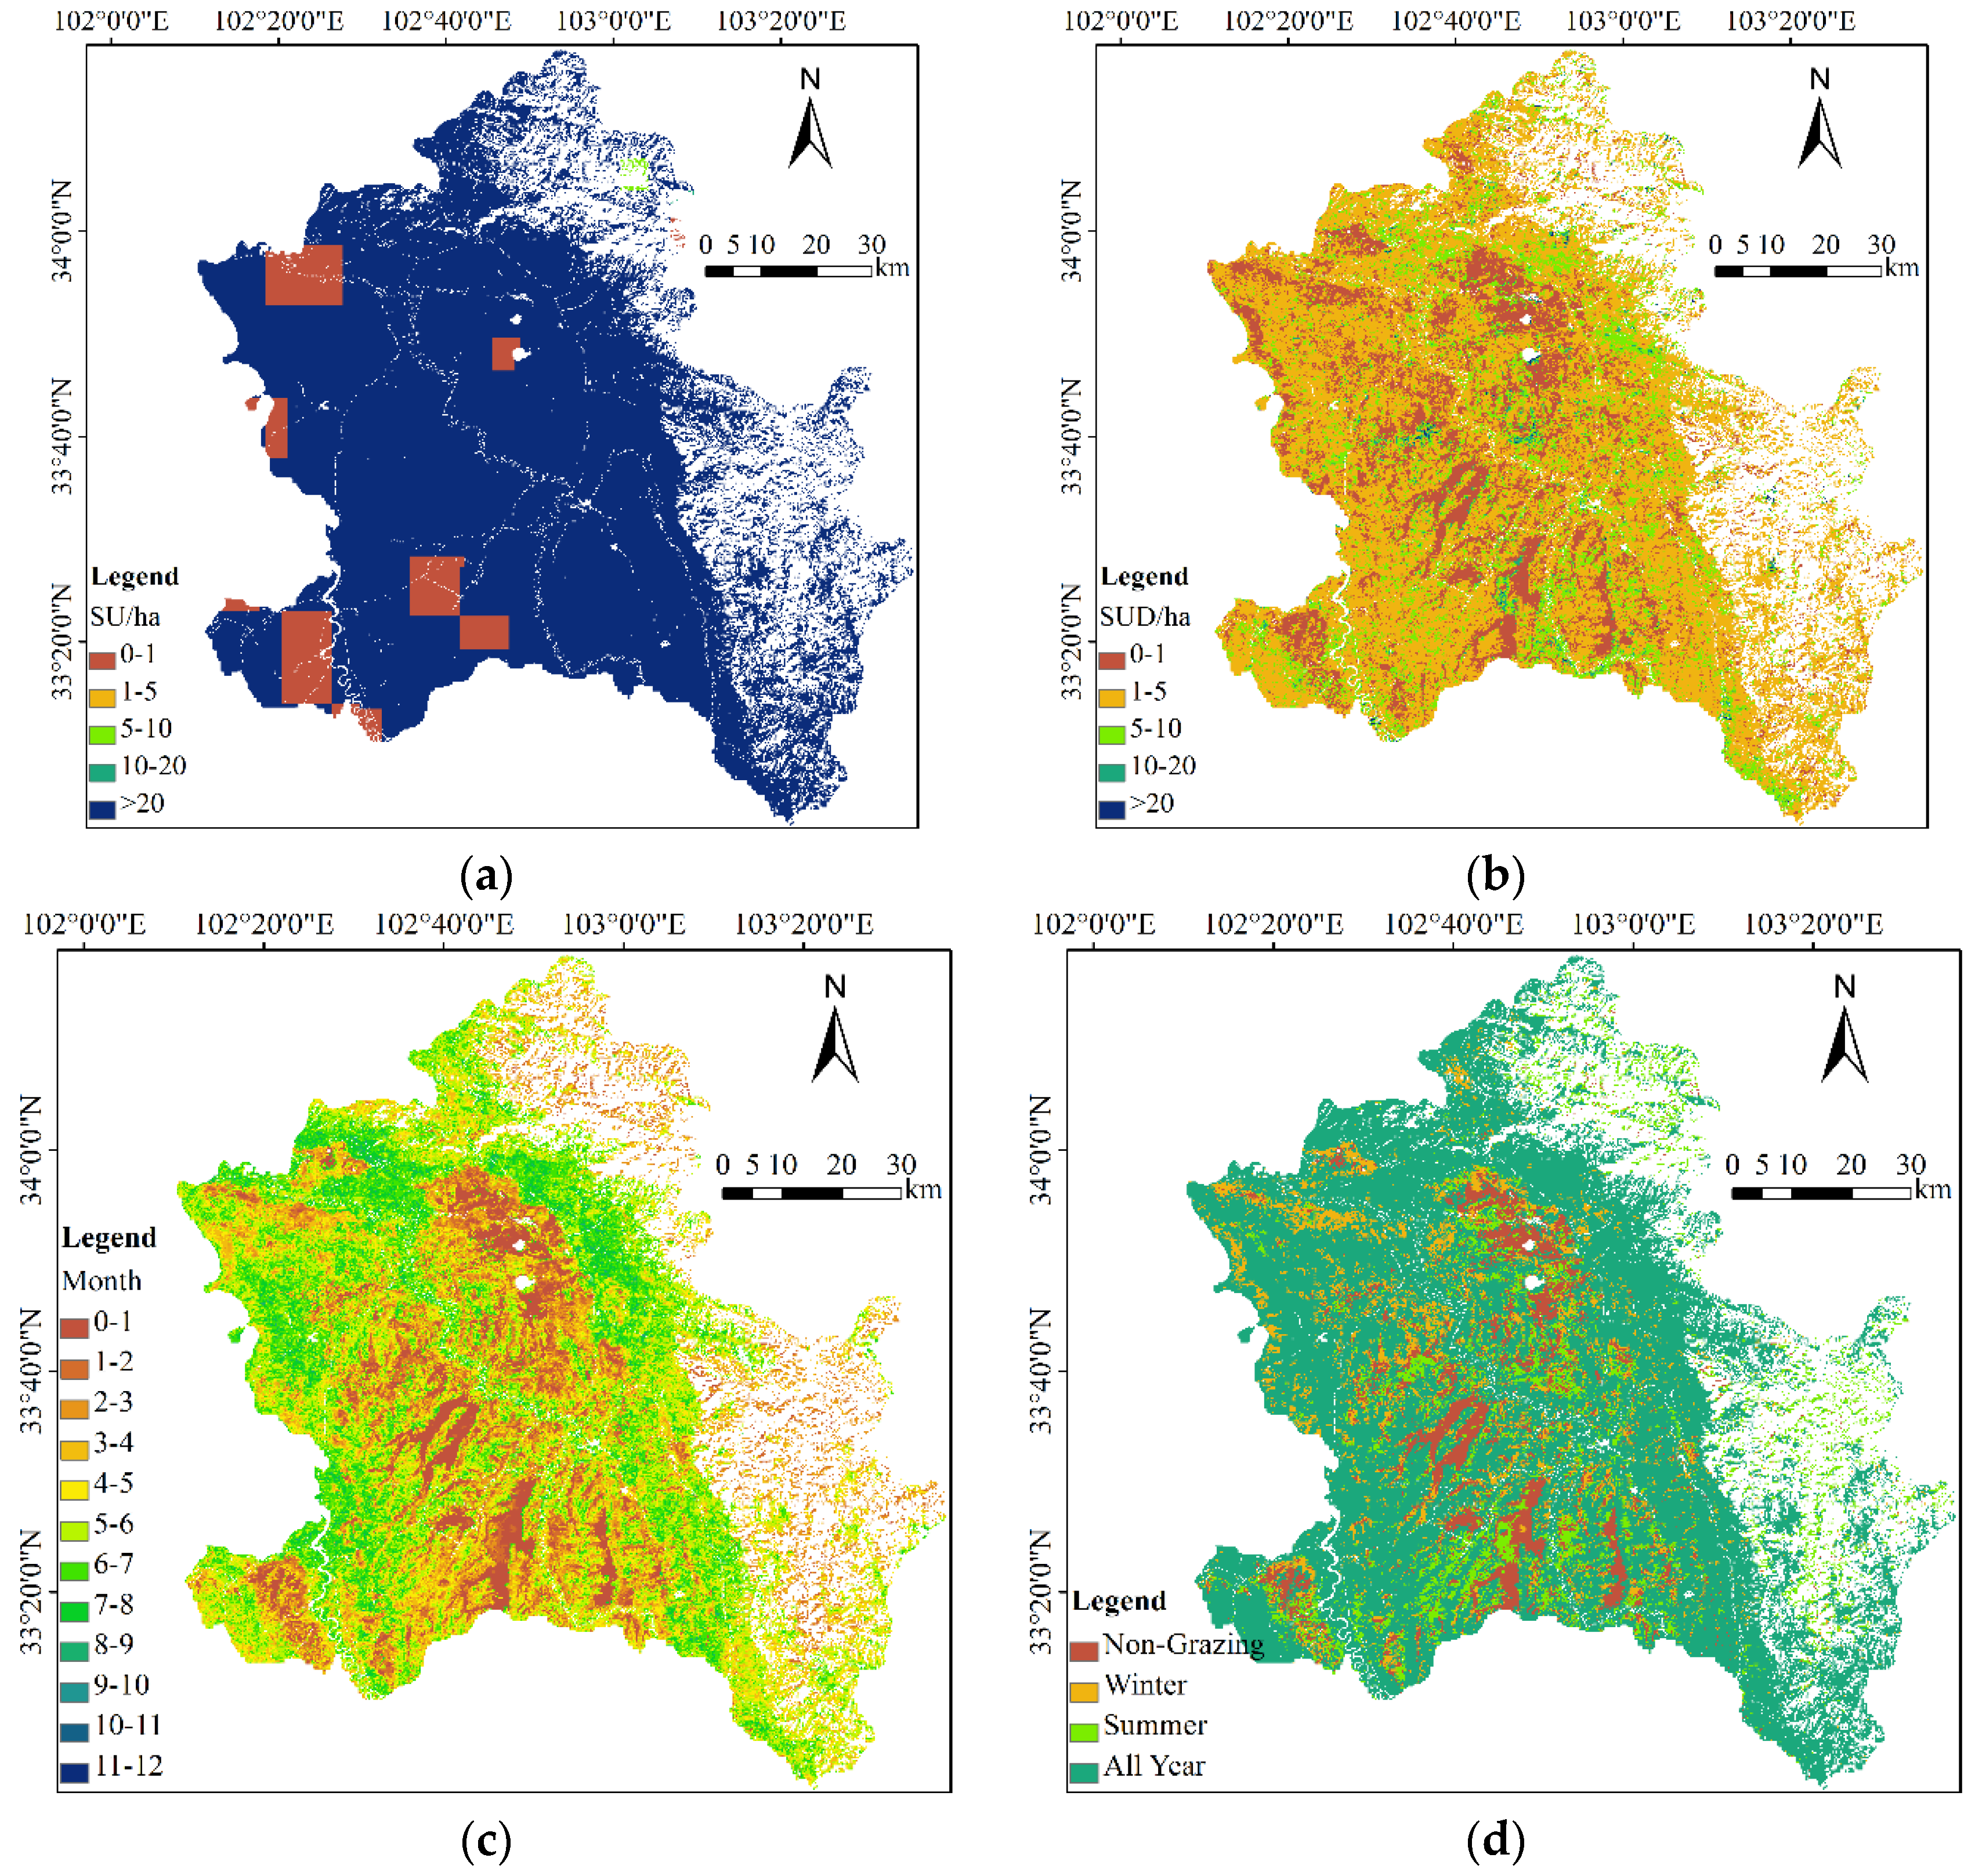
In Zoige County, the total regional ANPP in 2012 was up to 3.815 × 10⁵ tC. If grazing activity was not considered in simulating the ANPP, the regional ANPP would be overestimated by 44.4%, up to 5.51 × 10⁵ tC. For the whole study area, livestock grazing and ANPP would change with the land cover types. For instance, peatlands had remained almost pristine marsh due to less human activity, with average ANPP of 794.97 kgC/ha. Herbaceous wetlands and wet meadows also had higher above-ground productivity (more than 800 kgC/ha). For lower grazing intensity (<2.6 SUD/ha) and shorter grazing period (less than 82 days), the ANPP of herbaceous wetlands and wet meadows were 680.4 kgC/ha and 733.32 kgC/ha, respectively. Meadows, prairies, and sparse pastures, accounting for 75% of the study area, were considered to be major grazing pastures, with the annual average grazing intensity more than 3.3 SUD/ha and the grazing period more than 159 days.
In conclusion, the combination of the time-series remote sensing data and a process-based ecosystem model could provide high resolution data about the regional grazing intensity and grazing period, monitor the spatial variations of the grazing intensity, identify the kinds of the pastures, simulate the grassland ANPP under grazing conditions, and investigate the response of grassland ANPP to grazing. If following our method, it is worth paying close attention to how to obtain the perfect vegetation indices’ curves for non-grazing areas without the disturbance of the environment factors. Meanwhile, it is essential to try to use the proper NDVI data and high quality drive data (including meteorological, soil and vegetation data) at the regional scale in simulating regional above-ground biomass. In addition, the grazing data and the grassland ANPP at regional scale should be further verified through the field experimentations or by other means (e.g., remote sensing). Moreover, the mechanisms about ANPP and grazing still need to be explored by combining the remote sensing with the field samples in future work. Lastly, the data assimilation approaches should be explored to obtain accurate simulation results in the future work.

Acknowledgments

We thank the anonymous referees for their valuable comments and suggestions. We gratefully acknowledge financial support from National Natural Science Foundation of China (41271433, 41571373), STS-Network Plan, CAS (KFJ-EW-STS-020-02), the Strategic Leader Science and Technology project (XDA05050105) and “Hundred Talents” Project of Chinese Academy of Sciences.

Author Contributions

All authors have made major and unique contributions. Jiyan Wang processed the major data sources, developed the method, and drafted the preliminary version of this paper. Ainong Li designed the framework of this research work, and finished the final version of this paper. Jinhu Bian took part in data collection.

Conflicts of Interest

The authors declare no conflict of interest.

References

  1. Yang, X. Assessing Responses of Grassland to Grazing Management Using Remote Sensing Approaches. Ph.D. Thesis, University of Saskatchewan, Saskatoon, SK, Canada, April 2012. [Google Scholar]
  2. Shantz, H. The place of grasslands in the Earth’s cover. Ecology 1954, 35, 143–145. [Google Scholar] [CrossRef]
  3. Xia, J.; Liu, S.; Liang, S.; Chen, Y.; Xu, W.; Yuan, W. Spatio-Temporal Patterns and Climate Variables Controlling of Biomass Carbon Stock of Global Grassland Ecosystems from 1982 to 2006. Remote Sens. 2014, 6, 1783–1802. [Google Scholar] [CrossRef]
  4. Tan, Y.; Wang, X.; Li, C.; Cai, Y.; Yang, Z.; Wang, Y. Estimation of ecological flow requirement in Zoige Alpine Wetland of southwest China. Environ. Earth Sci. 2012, 66, 1525–1533. [Google Scholar] [CrossRef]
  5. Bai, J.; Lu, Q.; Wang, J.; Zhao, Q.; Ouyang, H.; Deng, W.; Li, A. Landscape pattern evolution processes of alpine wetlands and their driving factors in the Zoige Plateau of China. J. Mountain Sci. 2013, 10, 54–67. [Google Scholar] [CrossRef]
  6. Bäckstrand, K.; Crill, P.; Jackowicz-Korczyñski, M.; Mastepanov, M.; Christensen, T.R.; Bastviken, D. Annual carbon gas budget for a subarctic peatland, Northern Sweden. Biogeosciences 2010, 7, 95–108. [Google Scholar] [CrossRef]
  7. Sala, O.E.; Austin, A.T. Methods of estimating aboveground net primary productivity. Springer: New York, NY, USA, 2000. [Google Scholar]
  8. Blanco, L.J.; Aguilera, M.O.; Paruelo, J.M.; Biurrun, F.N. Grazing effect on NDVI across an aridity gradient in Argentina. J. Arid Environ. 2008, 72, 764–776. [Google Scholar] [CrossRef]
  9. McNaughton, S.J.; Oesterheld, M.; Frank, D.A.; Williams, K.J. Ecosystem-level Patterns of Primary Productivity and Herbivory in Terrestial Habitats. Nature 1989, 341, 142–144. [Google Scholar] [CrossRef] [PubMed]
  10. Zhao, F.; Xu, B.; Yang, X.C.; Jin, Y.; Li, J.; Xia, L.; Chen, S.; Ma, H. Remote Sensing Estimates of Grassland Aboveground Biomass Based on MODIS Net Primary Productivity (NPP): A Case Study in the Xilingol Grassland of Northern China. Remote Sens. 2014, 6, 5368–5386. [Google Scholar] [CrossRef]
  11. Dorigo, W.; Zurita-Milla, R.; de Wit, A.J.; Brazile, J.; Singh, R.; Schaepman, M.E. A review on reflective remote sensing and data assimilation techniques for enhanced agroecosystem modeling. Int. J. Appl. Earth Obs. Geoinf. 2007, 9, 165–193. [Google Scholar] [CrossRef]
  12. Wang, W.; Ichii, K.; Hashimoto, H.; Michaelis, A.R.; Thornton, P.E.; Law, B.E.; Nemani, R.R. A hierarchical analysis of terrestrial ecosystem model Biome-BGC: Equilibrium analysis and model calibration. Ecol. Model. 2009, 220, 2009–2023. [Google Scholar] [CrossRef]
  13. Qiu, J.; Wang, L.; Tang, H.; Li, H.; Li, C.S. Studies on the situation of soil organic carbon storage in croplands in northeast of China. Agric. Sci. China 2005, 4, 101–105. [Google Scholar]
  14. Li, C.; Mosier, A.; Wassmann, R.; Cai, Z.; Zheng, X.; Huang, Y.; Tsuruta, H.; Boonjawat, J.; Lantin, R. Modeling greenhouse gas emissions from rice-based production systems: Sensitivity and upscaling. Glob. Biogeochem. Cycles 2004, 18, GB1043. [Google Scholar] [CrossRef]
  15. Qin, X.; Wang, H.; Li, Y.; Li, Y.; McConkey, B.; Lemke, R.; Li, C.; Brandt, K.; Gao, Q.; Wan, Y.; et al. A long-term sensitivity analysis of the denitrification and decomposition model. Environ. Model. Softw. 2013, 43, 26–36. [Google Scholar] [CrossRef]
  16. Christensen, L.; Coughenour, M.B.; Ellis, J.E.; Chen, Z. Sustainability of inner Mongolian grasslands: Application of the Savanna model. J. Range Manag. 2003, 56, 319–327. [Google Scholar] [CrossRef]
  17. Numata, I.; Roberts, D.A.; Chadwick, O.A.; Schimel, J.; Sampaio, F.R.; Leonidas, F.C.; Soares, J.V. Characterization of pasture biophysical properties and the impact of grazing intensity using remotely sensed data. Remote Sens. Environ. 2007, 109, 314–327. [Google Scholar] [CrossRef]
  18. Luo, G.; Han, Q.; Zhou, D.; Li, L.; Chen, X.; Li, Y.; Hu, Y.; Li, B.L. Moderate grazing can promote aboveground primary production of grassland under water stress. Ecol. Complex. 2012, 11, 126–136. [Google Scholar] [CrossRef]
  19. Han, Q.; Luo, G.; Li, C.; Xu, W. Modeling the grazing effect on dry grassland carbon cycling with Biome-BGC model. Ecol. Complex. 2014, 17, 149–157. [Google Scholar] [CrossRef]
  20. Chen, Y.; Lee, G.; Lee, P.; Oikawa, T. Model analysis of grazing effect on above-ground biomass and above-ground net primary production of a Mongolian grassland ecosystem. J. Hydrol. 2007, 333, 155–164. [Google Scholar] [CrossRef]
  21. Christensen, L.; Coughenour, M.B.; Ellis, J.E.; Chen, Z.Z. Vulnerability of the Asian typical steppe to grazing and climate change. Clim. Chang. 2004, 63, 351–368. [Google Scholar] [CrossRef]
  22. Blanco, L.J.; Ferrando, C.A.; Biurrun, F.N. Remote Sensing of Spatial and Temporal Vegetation Patterns in Two Grazing Systems. Rangel. Ecol. Manag. 2009, 62, 445–451. [Google Scholar] [CrossRef]
  23. Bradley, B.A.; O’Sullivan, M.T. Assessing the short-term impacts of changing grazing regime at the landscape scale with remote sensing. Int. J. Remote Sens. 2011, 32, 5797–5813. [Google Scholar] [CrossRef]
  24. Yang, X.; Guo, X.; Fitzsimmons, M. Assessing light to moderate grazing effects on grassland production using satellite imagery. Int. J. Remote Sens. 2012, 33, 5087–5104. [Google Scholar] [CrossRef]
  25. Kawamura, K.; Akiyama, T.; Yokota, H.; Tsutsumi, M.; Yasuda, T.; Watanabe, O.; Wang, S.P. Quantifying grazing intensities using geographic information systems and satellite remote sensing in the Xilingol steppe region, Inner Mongolia, China. Agric. Ecosyst. Environ. 2005, 107, 83–93. [Google Scholar] [CrossRef]
  26. Yu, L.; Zhou, L.; Liu, W.; Zhou, H. Using Remote Sensing and GIS Technologies to Estimate Grass Yield and Livestock Carrying Capacity of Alpine Grasslands in Golog Prefecture, China. Pedosphere 2010, 20, 342–351. [Google Scholar] [CrossRef]
  27. Li, R.H.; Li, X.B.; Li, G.Q.; Wen, W.Y. Simulation of soil nitrogen storage of the typical steppe with the DNDC model: A case study in Inner Mongolia, China. Ecol. Indic. 2014, 41, 155–164. [Google Scholar] [CrossRef]
  28. Feng, X.M.; Zhao, Y.S. Grazing intensity monitoring in Northern China steppe: Integrating CENTURY model and MODIS data. Ecol. Indic. 2011, 11, 175–182. [Google Scholar] [CrossRef]
  29. Sha, Z.; Brown, D.G.; Xie, Y.; Welsh, W.F.; Bai, Y. Response of spectral vegetation indices to a stocking rate experiment in Inner Mongolia, China. Remote Sens. Lett. 2014, 5, 912–921. [Google Scholar] [CrossRef]
  30. Knapp, A.K.; Hoover, D.L.; Blair, J.M.; Buis, G.; Burkepile, D.E.; Chamberlain, A.; Collins, S.L.; Fynn, R.W.S.; Kirkman, K.P.; Smith, M.D.; et al. A test of two mechanisms proposed to optimize grassland aboveground primary productivity in response to grazing. J. Plant Ecol. 2012, 5, 357–365. [Google Scholar] [CrossRef]
  31. Wilkes, P.; Jones, S.D.; Suarez, L.; Mellor, A.; Woodgate, W.; Soto-Berelov, M.; Haywood, A.; Skidmore, A.K. Mapping Forest Canopy Height Across Large Areas by Upscaling ALS Estimates with Freely Available Satellite Data. Remote Sens. 2015, 7, 12563–12587. [Google Scholar] [CrossRef]
  32. Wang, M.; Yang, G.; Gao, Y.; Chen, H.; Wu, N.; Peng, C.; Zhu, Q.; Zhu, D.; Wu, J.; He, Y.; et al. Higher recent peat C accumulation than that during the Holocene on the Zoige Plateau. Quat. Sci. Rev. 2015, 114, 116–125. [Google Scholar] [CrossRef]
  33. Chen, H.; Yang, G.; Peng, C.; Zhang, Y.; Zhu, D.; Zhu, Q.; Hu, J.; Wang, M.; Zhan, W.; Zhu, E.; et al. The carbon stock of alpine peatlands on the Qinghai–Tibetan Plateau during the Holocene and their future fate. Quat. Sci. Rev. 2014, 95, 151–158. [Google Scholar] [CrossRef]
  34. Li, A.; Bian, J.; Lei, G.; Huang, C. Estimating the Maximal Light Use Efficiency for Different Vegetation through the CASA Model Combined with Time-Series Remote Sensing Data and Ground Measurements. Remote Sens. 2012, 4, 3857–3876. [Google Scholar] [CrossRef]
  35. Xiang, S.; Guo, R.; Wu, N.; Sun, S. Current status and future prospects of Zoige Marsh in Eastern Qinghai-Tibet Plateau. Ecol. Eng. 2009, 35, 553–562. [Google Scholar] [CrossRef]
  36. Wang, G.; Li, Y.; Wang, Y.; Chen, L. Typical alpine wetland system changes on the Qinghai-Tibet Plateau in recent 40 years. Acta Geogr. Sin. 2007, 62, 481–491. [Google Scholar]
  37. Dong, Q.; Ma, Y.; Li, Q. Effects of Grazing Intensity on the Growth of Yaks. Acta Geogr. Sin. 2003, 11, 256–260. [Google Scholar]
  38. Li, C. User’s Guide for the DNDC Model, version 9.5; Institute for the Study of Earth, Oceans and Space, University of New Hampshire: Durham, NC, USA, 2012. [Google Scholar]
  39. Brinkmann, K.; Dickhoefer, U.; Schlecht, E.; Buerkert, A. Quantification of aboveground rangeland productivity and anthropogenic degradation on the Arabian Peninsula using Landsat imagery and field inventory data. Remote Sens. Environ. 2011, 115, 465–474. [Google Scholar] [CrossRef]
  40. Land Processes Distributed Active Archive Center (LP DAAC). Available online: https://lpdaac.usgs.gov/ dataset_discovery/modis /modis_products_table/mod13q1 (accessed on 11 December 2015).
  41. Reeves, M.C.; Baggett, L.S. A remote sensing protocol for identifying rangelands with degraded productive capacity. Ecol. Indic. 2014, 43, 172–182. [Google Scholar] [CrossRef]
  42. Bian, J.; Li, A.; Song, M.; Ma, L.; Jiang, J. Reconstructing NDVI time-series data set of MODIS based on the Savitzky-Golay filter. J. Remote Sens. 2010, 14, 725–741. [Google Scholar]
  43. Zoige County Government. Available online: http://www.ruoergai.gov.cn/gkxx/jbxq/ (accessed on 11 December 2015).
  44. Sichuan Provincial Agricultural Department. Available online: http://www.scagri.gov.cn/zwgk/msgc/ cybjzc/201112/t20111207_146854.html (accessed on 11 December 2015).
  45. Han, D.; Yang, Y.; Yang, Y.; Li, K. Species composition and succession of swamp vegetation along grazing gradients in the Zoige Plateau, China. Acta Ecol. Sin. 2011, 31, 5946–5955. [Google Scholar]
  46. The DNDC Model. Available online: http://www.dndc.sr.unh.edu (accessed on 11 December 2015).
  47. Aber, J.D.; Federer, C.A. A generalized, lumped-parameter model of photosynthesis, evapotranspiration and net primary production in temperate and boreal forest ecosystems. Oecologia 1992, 92, 463–474. [Google Scholar] [CrossRef]
  48. Zhang, Y.; Sachs, T.; Li, C.; Boike, J. Upscaling methane fluxes from closed chambers to eddy covariance based on a permafrost biogeochemistry integrated model. Glob. Chang. Biol. 2012, 18, 1428–1440. [Google Scholar] [CrossRef]
  49. China Meteorological Data Sharing Service System. Available online: http://cdc.nmic.cn/home.do (accessed on 11 December 2015).
  50. Hutchinson, M.F. Interpolation of rainfall data with thin plate smoothing splines. Part II: Analysis of topographic dependence. J. Geogr. Inf. Decis. Anal. 1998, 2, 152–167. [Google Scholar]
  51. Cold and Arid Regions Science Data Center. Available online: http://westdc.westgis.ac.cn/ (accessed on 11 December 2015).
  52. Geospatial Data Cloud. Available online: http://www.gscloud.cn/ (accessed on 11 December 2015).
  53. Li, A.; Jiang, J.; Bian, J.; Deng, W. Combining the matter element model with the associated function of probability transformation for multi-source remote sensing data classification in mountainous regions. ISPRS J. Photogramm. Remote Sens. 2012, 67, 80–92. [Google Scholar] [CrossRef]
  54. Tian, Y.; Xiong, M.; Xiong, X.; Song, G. The organic carbon distribution and flow in wetland soil-pland system in Ruoergai Plateau (In Chinese). Acta Phytoecol. Sin. 2003, 27, 490–495. [Google Scholar]
  55. Wang, Q.; Zhou, X.; Zhang, Y.; Shen, Z. Community structure and biomass dynamic of the Kobresia pygmaea steep meadow. Acta Phytoecol. Sin. 1995, 19, 225–235. [Google Scholar]
  56. Dong, S. The Stability of Mixture Grassland of Cultivated Perennial Grass and Its Regulation in Alpine Region of Qinghai-Tibetan Plateau of China. Ph.D. Thesis, Gansu Agricultural University, Lanzhou, China, June 2001. [Google Scholar]
  57. Ma, Q. Ecosystem carbon storage in Zoige alpine marsh of Southwest China. Ph.D. Thesis, Doctor of Ecology-Chinese Academy of Forestry, Beijing, China, 2013. [Google Scholar]
  58. Fan, Y. Effects of Fencing and Grazing on Plant Morphology, Community Characteristics and Carbon Banlance of Kobresia pygmaea Meadow in the Three Headwater Resourece Regions. Ph.D. Thesis, Gansu Agricultural University, Lanzhou, China, June 2013. [Google Scholar]
  59. Fang, J.; Liu, G.; Xu, S. Biomass and net production of forest vegetation in China. Acta Ecologica Sinica 1996, 15, 497–508. [Google Scholar]
  60. Wang, X.; He, P.; Kang, W. Research on the Desertification Grassland Services and Their Value Losses in Ruoergai County. J. Soil Water Conserv. 2014, 28, 62–70. [Google Scholar]
  61. Animal Production and Health. Available online: http://www.fao.org/ag/againfo/resources/en/glw/ GLW_dens.html (accessed on 11 December 2015).
  62. Ding, L.; Long, R.; Yang, Y.; Wang, C. Study on Grazing Behaviour of Yaks in Summer, Autumn and Winter. Animal Prod. 2007, 43, 52–55. [Google Scholar]
  63. Liu, Y. Study on the Herdsmens’ Behavior and Ragulated Countermeasures on Grassland Degrdation: Survey of Herdsmen in two Pastoral Countries of the Northwestern Sichuan Province. Master’s Thesis, Sichuan Agricultural University, Chengdu, China, June 2008. [Google Scholar]
  64. Petropoulos, G.; Wooster, M.; Carlson, T.; Kennedy, M.; Scholze, M. A global Bayesian sensitivity analysis of the 1d SimSphere soil–vegetation–atmospheric transfer (SVAT) model using Gaussian model emulation. Ecol. Model. 2009, 220, 2427–2440. [Google Scholar] [CrossRef]
  65. Wang, J.; Li, A.; Jin, H. Sensitivity analysis of the Denitrification and Decomposition model for simulating regional carbon budget at the wetland-grassland area on the Zoige Plateau, China. J. Mountain Sci. 2016. [Google Scholar] [CrossRef]
  66. Sjoegersten, S.; Llurba, R.; Ribas, A.; Yanez-Serrano, A.; Sebastia, M.T. Temperature and Moisture Controls of C Fluxes in Grazed Subalpine Grasslands. Arct. Antarct. Alpine Res. 2012, 44, 239–246. [Google Scholar] [CrossRef]
  67. Schulze, E.-D.; Wirth, C.; Heimann, M. Managing forests after Kyoto. Science 2000, 289, 2058–2059. [Google Scholar] [CrossRef] [PubMed]
  68. Dobesch, H.; Dumolard, P.; Dyras, I. Spatial Interpolation for Climate Data: The Use of GIS in Climatology and Meteorology; ISTE: London, UK, 2007. [Google Scholar]
  69. Quaife, T.; Lewis, P.; De Kauwe, M.; Williams, M.; Law, B.E.; Disney, M.; Bowyer, P. Assimilating canopy reflectance data into an ecosystem model with an Ensemble Kalman Filter. Remote Sens. Environ. 2008, 112, 1347–1364. [Google Scholar] [CrossRef]
  70. Weng, E.; Luo, Y.; Gao, C.; Oren, R. Uncertainty analysis of forest carbon sink forecast with varying measurement errors: A data assimilation approach. J. Plant Ecol. 2011, 4, 178–191. [Google Scholar] [CrossRef]
  71. Thiel-Egenter, C.; Risch, A.C.; Jurgensen, M.F.; Page-Dumroese, D.S.; Kruesi, B.O.; Schuetz, M. Response of a subalpine grassland to simulated grazing: Aboveground productivity along soil phosphorus gradients. Community Ecol. 2007, 8, 111–117. [Google Scholar] [CrossRef]
  72. Bastin, G.; Scarth, P.; Chewings, V.; Sparrow, A.; Denham, R.; Schmidt, M.; O'Reagain, P.; Shepherd, R.; Abbott, B. Separating grazing and rainfall effects at regional scale using remote sensing imagery: A dynamic reference-cover method. Remote Sens. Environ. 2012, 121, 443–457. [Google Scholar] [CrossRef]
  73. Schweiger, A.K.; Risch, A.C.; Damm, A.; Kneubuhler, M.; Haller, R.; Schaepman, M.E.; Schutz, M. Using imaging spectroscopy to predict above-ground plant biomass in alpine grasslands grazed by large ungulates. J. Veg. Sci. 2015, 26, 175–190. [Google Scholar] [CrossRef]
  74. Ware, I.M.; Terletzky, P.; Adler, P.B. Conflicting management objectives on the Colorado Plateau: Understanding the effects of bison and cattle grazing on plant community composition. J. Nat. Conserv. 2014, 22, 293–301. [Google Scholar] [CrossRef]
  75. Oesterheld, M.; DiBella, C.M.; Kerdiles, H. Relation between NOAA-AVHRR satellite data and stocking rate of rangelands. Ecol. Appl. 1998, 8, 207–212. [Google Scholar] [CrossRef]
  76. Li, S.G.; Harazono, Y.; Oikawa, T.; Zhao, H.L.; He, Z.Y.; Chang, X.L. Grassland desertification by grazing and the resulting micrometeorological changes in Inner Mongolia. Agric. For. Meteorol. 2000, 102, 125–137. [Google Scholar]
Figure 1. (a) Location of the Zoige Plateau in China; (b) the digital elevation model (DEM) of the study area and the spatial distribution of meteorological stations around the Zoige County; and (c) land cover types in study area and the spatial distribution of field sample plots used for model validation.
Remotesensing 08 00168 g001
Figure 2. The framework for simulating the grassland ANPP under grazing condition for each simulation site with the DNDC model. a* and b* are conditions to judge whether a pixel where to be used for grazing; and Grazing* indicates that the pixel is used for grazing, while No-Grazing* implies that the pixel is identified as an non-grazing area.
Remotesensing 08 00168 g002
Figure 3. Comparison of observed NDVI of one pixel with the NDVI of non-grazing areas (the solid line named NDVIobs is the observed NDVI value of one pixel which would be judged whether it is used for grazing, and the dot line curve is the trend line of NDVI in non-grazing areas).
Remotesensing 08 00168 g003
Figure 4. Comparison of ANPP between the field data and the model estimation (a) with considering grazing and (b) without considering grazing in Zoige County.
Remotesensing 08 00168 g004
Figure 5. Spatial distribution of the Zoige wetland-grassland ANPP in 2012 (a) with considering grazing and (b) without considering grazing, and (c) the difference between them.
Remotesensing 08 00168 g005
Figure 6. Spatial distribution of the grazing intensity obtained respectively from (a) “Gridded Livestock of the World” (unit: sheep unit per ha, SU/ha); (b) time-series remote sensing data (annual average grazing intensity, unit: SUD/ha); (c) the grazing period of the pastures in 2012 (unit: month); and (d) the pasture types in Zoige County.
Remotesensing 08 00168 g006
Figure 7. Average grazing intensity and its trend line of Zoige County in 2012.
Remotesensing 08 00168 g007
Table 1. Standard of grazing intensity.
TypeGrazing Intensity (SUD/ha)Grazing Utilization (%)
Very light grazing<1<20
Light grazing1–520–30
Moderate grazing5–1030–60
Heavy grazing10–2060–70
Very grazing>20>70
Table 2. Values of input soil parameters used in the DNDC model.
ParametersSandy LoamLoamClay LoamSandy ClayClayPristine Peat Soil
SOC at surface soil (0–5 cm) (kgC/kg) a0.002350.00235–0.0050330.0656670.0012330.0037830.065667
Bulk density (g/cm3) a1.511.38–1.401.321.411.211.21–1.39
pH a5.76.4–85.67.76.15.6–6.6
Clay fraction (0–1) a0.060.20–0.230.320.230.560.22–0.56
Field capacity (0–1) b0.320.490.570.60.750.55
Wilting point (0–1) b0.150.220.270.280.450.26
Porosity (0–1) b0.4350.4510.4760.4260.4820.701
Hydro-conductivity (m/h) b0.12480.0250.00880.00780.00460.0072
a refers to the parameters derived from the Chinese soil map at a scale of 1:1,000,000; b refers to the parameters derived from the default values of the DNDC model.
Table 3. Values of input vegetation parameters used in the DNDC model.
ParametersKobresia setchwanensisCarex muliensisKobresia capillifoliaKobresia schoenoidesElymus nutansPolygonum macrophyllum
Maximum biomass production (kgC/ha) a15,00015,00015,00015,00020,00015,000
Grain Leaf and stem fraction of biomass b0.0840.0870.0840.0760.220.084
Root fraction of biomass b0.9160.9130.9160.9240.780.916
C/N ratio of above plant c18.75118.75118.75118.75119.17717.591
C/N ratio of root c62.30462.30462.30462.30462.30462.304
Water requirement (kg water/kg dry matter) d800800800800200200
TDD (°C) c150012001500120020001500
N fixation index d1.51.51.51.51.51.5
R/S c10.910.5110.912.123.5510.9
C/N, carbon/nitrogen; TDD, thermal degree days for maturity; R/S, root/shoot ratio; a refers to the parameters derived from the field observation; b refers to the parameters derived from the papers [54,55]; c refers to the parameters derived from the papers [56,57,58]; d refers to the parameters derived from the default values of the DNDC model.
Table 4. The regional average ANPP of the different land cover types in Zoige County considering grazing (ANPPg) and without considering grazing (ANPPug).
Land Cover TypesArea (ha)ANPPg (kgC/ha)ANPPug (kgC/ha)Difference between ANPPug and ANPPg (kgC/ha)
Herbaceous Wetland95,181680.4882.93202.53
Peatland45,906794.97823.4628.49
Wet Meadow50,450733.32892.56159.24
Meadow318,793422.46667.48245.02
Prairie270,143389.71614.50224.79
Sparse Pasture4543328.84576.41247.57
Table 5. The regional average grazing intensity, the regional average ANPP considering grazing (ANPPg) and without considering grazing (ANPPug) for different grazing intensity levels in Zoige County.
Grazing Intensity LevelsGrazing Intensity (SUD/ha)ANPPg (kgC/ha)ANPPug (kgC/ha)Difference between ANPPug and ANPPg (kgC/ha)
Very Light Grazing0.4331020.425880.461−139.964
Light Grazing2.92715.017811.05296.035
Moderate Grazing6.282325.851639.460313.609
Heavy Grazing12.404275.251640.739365.488
Very Heavy Grazing26.621239.253602.701363.449
Table 6. Annual average grazing intensity and annual grazing period for different land cover types.
Land Cover TypesGrazing Intensity (SUD/ha)Grazing Period (day)
Herbaceous Wetland2.52081.314
Peatland0.5597.110
Wet Meadow2.03970.588
Meadow3.325159.843
Prairie3.599159.166
Sparse Pasture4.419166.426

