Article

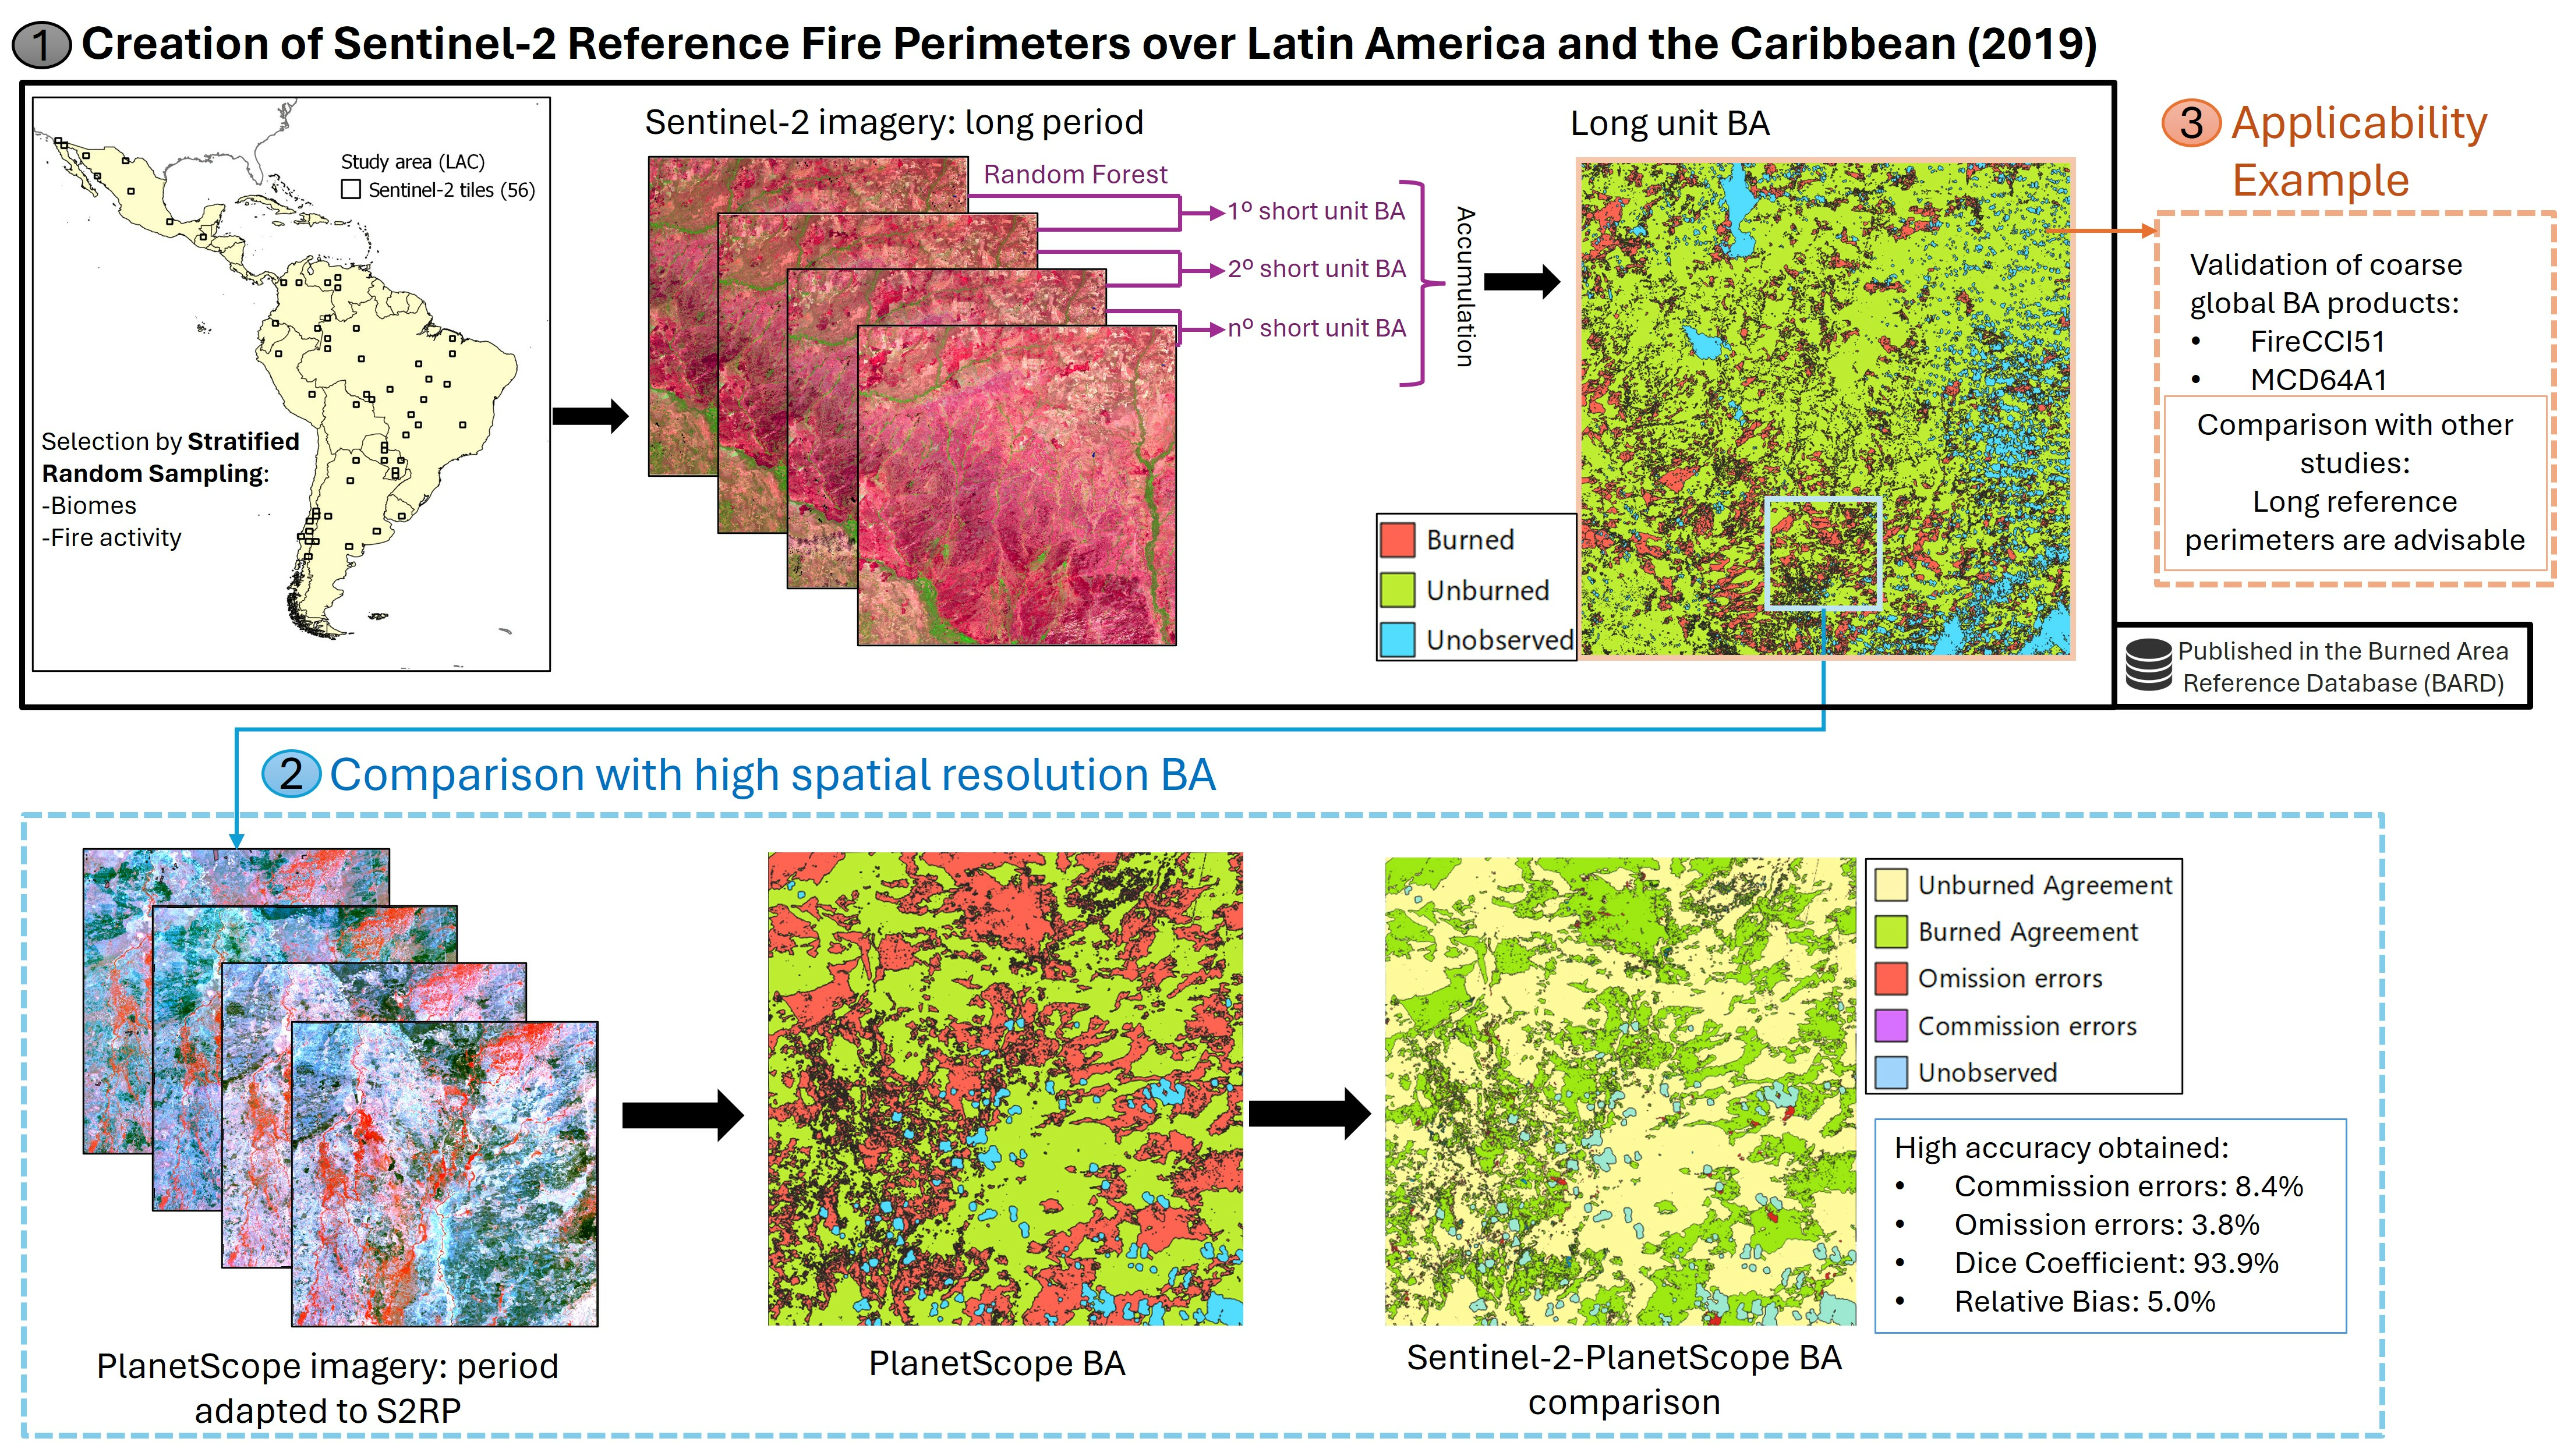
Sentinel-2 Reference Fire Perimeters for the Assessment of Burned Area Products over Latin America and the Caribbean for the Year 2019

by
Jon Gonzalez-Ibarzabal
1,2,*,
Magí Franquesa
3,
Armando Rodriguez-Montellano
4 and
Aitor Bastarrika
1,2
1
Department of Mining and Metallurgical Engineering and Materials Science, School of Engineering of Vitoria-Gasteiz, University of the Basque Country UPV/EHU, Nieves Cano 12, 01006 Vitoria-Gasteiz, Spain
2
Built Heritage Research Group, University of the Basque Country UPV/EHU, 01006 Vitoria-Gasteiz, Spain
3
Instituto Pirenaico de Ecología, Consejo Superior de Investigaciones Científicas (IPE-CSIC), 50059 Zaragoza, Spain
4
Fundación Amigos de la Naturaleza, Km. 7 1/2 Doble Vía a La Guardia, Santa Cruz 2241, Bolivia
*
Author to whom correspondence should be addressed.
Remote Sens. 2024, 16(7), 1166; https://doi.org/10.3390/rs16071166
Submission received: 13 February 2024 / Revised: 19 March 2024 / Accepted: 24 March 2024 / Published: 27 March 2024
(This article belongs to the Collection Sentinel-2: Science and Applications)

Abstract

:
The increasing availability of products generating burned area (BA) maps in recent years necessitates the creation of more accurate reference perimeters to validate these products and provide users with information about their accuracy. For this purpose, reference perimeters were created using Sentinel-2 images in Latin America and the Caribbean (LAC) for the year 2019. The sampling was adapted to the peculiarities of the Sentinel-2 tiling grid system, and statistically representative sample units were selected for biomes and fire activity through stratified random sampling. Fire perimeters were extracted using a Random Forest supervised classification and results were manually supervised and refined. Efforts were made to maximize the temporal length covered by the reference perimeters for each sample, aiming to minimize temporal errors when using the perimeters for validation. The dataset covers 569,214.2 k m 2 (3.5% burned, 88.7% unburned, and 7.8% unobserved). These perimeters were compared with higher spatial resolution PlanetScope-derived perimeters, resulting in 8.4% commission errors and 3.8% omission errors. As a validation exercise, MCD64A1 and FireCCI51 global burned area products were validated using the Sentinel-2 reference dataset created, confirming that the temporal extent of the reference perimeters significantly affects the validation of such products. The reference fire perimeters are publicly available in the Burned Area Reference Database (BARD).

Graphical Abstract

1. Introduction

The increasing availability of satellite data over the last decades has facilitated Earth Observation (EO), with the acquisition of spectral information of the land surface at different spatial, temporal, and spectral resolutions. Utilizing this data, the scientific community has developed diverse types of satellite derived products, such as long-time series coarse-resolution burned area (BA) products [1,2,3,4,5], which are key for many applications, such as fire impact assessment [6], vegetation recovery assessment [7], carbon emissions estimation [8], fire regime and fire dynamics analysis [9], or fire–climate interaction assessment [10], creating a knowledge that can be useful for environmental management.
Nevertheless, these products require validation for two primary purposes: first, to inform users about limitations when applying them with management or research approaches, and second, to provide valuable information for developers to create improved versions of the product [11]. Validation is based on assessing the accuracy of the product through a comparison with more precise independent reference datasets. Since the systematic mapping of BA in situ at large scales is impractical, EO based on satellite data with higher spatial resolution than the product has been demonstrated as a feasible method to create reference fire perimeters [12]. Due to the growing demand of BA validation datasets and the public availability of the Sentinel and Landsat satellites imagery in recent years, various authors have created reference fire perimeters [11,13,14,15,16]. Additionally, a Burned Area Reference Database (BARD) has been designed to compile several global and regional BA datasets created to facilitate validation and calibration activities [17].
For the generation of reference fire perimeters, the Land Product Validation (LPV) subgroup from the Committee on Earth Observation Satellites (CEOS) adopted a standard protocol document more than a decade ago [12]. This document sets up some general aspects for the generation of reference data: the use of image pairs from the same region with different acquisition dates to map BA between both dates, the thematic content (mapped region, burned areas, unmapped areas), and the final format with appropriate descriptive information for any user. Building upon this protocol, different methodologies aligned with the specified guidelines have been employed to create reference fire perimeters.
Initially, Landsat images were commonly used for this purpose [14,15,18,19,20,21], given their spatial resolution of 30 m, enabling the creation of more precise perimeters compared with global BA products, which, currently, have a much coarser spatial resolution. However, the launch of the Sentinel-2A satellite in mid-2015 and Sentinel-2B in March 2017 provided another alternative of globally available periodic images, with a spatial resolution of 10 m across various spectral bands, surpassing that of Landsat. Furthermore, for both combined Sentinel-2 satellites, global acquisitions occur at a minimum frequency of every 5 days, whereas for Landsat, the minimum interval between two images is 16 days or 8 days when combining two Landsat satellites.
However, for global or continental validation studies, it was more practical to use Landsat than Sentinel-2. This is because defining the geometry of the sampling units is simple based on Thiessen Scene Areas (TSA) [22,23,24], designed on the Worldwide Reference System (WRS-2) of Landsat. This design ensures that sampling units are contiguous and do not overlap, while also guaranteeing direct access to images for download and processing. For Sentinel-2, the use of TSA is not feasible due to the overlap between different Sentinel-2 tiles in the tiling grid system. Nevertheless, a recent study by Stroppiana et al. (2022) [13] proposed a strategy to facilitate sampling based on the Sentinel-2 tiling grid system, avoiding the overlap of different tiles used as sampling units. This methodology was implemented at a continental scale for Subsaharan Africa.
Beyond the satellite employed, an additional difference among the various methodologies used to create reference fire perimeters is the temporal length of them. While early validation studies commonly used short reference periods, i.e., the time period between two consecutive image acquisitions, more recent studies have documented that employing longer periods reduces error percentages related to temporal dating errors in burning events [11,14]. Therefore, for a more accurate assessment of the spatial precision of a product, the temporal length of reference perimeters should be extended.
In this paper, we present the methodology employed for the creation of the ‘RP_LAC_2019_S2: reference fire perimeters obtained from Sentinel-2 imagery over Latin America and the Caribbean for the year 2019′ database (hereafter S2RP), publicly available in the BARD [25]. This database consists of continental-scale reference fire perimeters for the year 2019 in Latin America and the Caribbean (LAC). These perimeters were generated using Sentinel-2 imagery with the objective of achieving long temporal reference units. Besides, fire perimeters of higher spatial resolution have been generated based on PlanetScope imagery, to compare them with S2RP. Finally, S2RP has been used for the validation of the FireCCI51 [2] and MCD64A1 [1] coarse resolution global BA products as an example of the applicability of the S2RP database.

2. Materials and Methods

2.1. Data

2.1.1. Sentinel-2

Sentinel-2 is a mission part of the European Space Agency’s (ESA) Copernicus program [26], composed of two identical satellites, Sentinel-2A and Sentinel-2B, operating on polar sun-synchronous orbits. Images are acquired by a multispectral sensor, of which spatial resolution ranges from 10 to 60 m depending on the spectral band. Since the launch of Sentinel-2B in July 2017, the combined use of both satellites has enabled the Sentinel-2 mission to achieve a minimum revisiting time of five days at the equator.
We accessed Sentinel-2 data via the cloud platform Google Earth Engine (GEE), under the tag “COPERNICUS/S2_SR”: https://developers.google.com/earth-engine/datasets/catalog/COPERNICUS_S2_SR, accessed on 1 February 2024. This is the Sentinel-2 MultiSpectral Instrument Level-2A product, which provides surface reflectance data, structured into 110 × 110 km tiles within the WGS84 datum and UTM projection. Since the Sentinel-2 tile grid is not aligned with the orbit acquisitions, some tiles are not fully covered by the same orbit, causing different acquisition dates over the same footprint. Besides, in adjacent UTM zones, Sentinel-2 tiles have a tendency to spatially overlap, as noted by Stroppiana et al. (2022) [13].

2.1.2. Ecoregions 2017 © Resolve

Ecoregions 2017 © Resolve [27] is the revised map of Olson world ecoregion map [28], and divides the land surface into 14 different biomes. To aggregate biomes based on their fire regimes similarities, the same reclassification made by Franquesa et al. (2022) [11] was used as the first stratification criteria. This way, the biomes within the study area are categorized into six groups: “Tropical Forest”, “Tropical Savanna”, “Temperate Forest”, “Temperate Savanna”, “Mediterranean”, and “Deserts & Xeric Shrublands”.

2.1.3. MCD64A1 v061

The MCD64A1 version 6.1 is the latest version of NASA’s standard global BA product available at https://doi.org/10.5067/MODIS/MCD64A1.061, accessed on 2 February 2024. The algorithm is based on a burn-sensitive vegetation index derived from MODIS 500 m SWIR bands, combined with 1 km active fire observations of the same sensor [1]. The product has been available from November 2000 to the present, and is distributed in MODIS standard tiles, with an approximate dimension of 1200 × 1200 km containing monthly information at 500 m resolution about the burn date, its uncertainty, Quality Assurance (QA) indicator, and first and last day of reliable change detection. We accessed the data via GEE, under the tag “MODIS/061/MCD64A1”: https://developers.google.com/earth-engine/datasets/catalog/MODIS_061_MCD64A1, accessed on 2 February 2024.

2.1.4. FireCCI51 v5.1

MODIS Fire_cci BA version 5.1 (FireCCI51) is a global coverage BA product developed within ESA’s Fire_cci project. It is founded upon a hybrid algorithm that combines MODIS 250 m Near Infrared (NIR) band and thermal channels’ active fire information [2]. The product ranges from 2001 to 2020 and is delivered at a pixel-level spatial resolution of approximately 250 m for monthly burned area estimations with Day Of the Year detection (DOY), the Land Cover (LC) of burned pixels, and the confidence level of detection. The access to this product was made under the tag “ESA/CCI/FireCCI/5_1” in GEE: https://developers.google.com/earth-engine/datasets/catalog/ESA_CCI_FireCCI_5_1, accessed on 2 February 2024.

2.1.5. PlanetScope

PlanetScope, operated by Planet Labs company, is a constellation of approximately 130 satellites with the capacity of acquiring 200 million km2/day imagery with around 3.7 m per pixel resolution. Imagery is obtained along the swath in the form of a continuous series of individual frame images referred to as “scenes” [29]. Such scenes are not captured over the same geographical area at regular intervals, and while there is almost daily coverage over most of Earth’s locations, the accessibility of images fluctuates due to the dynamic nature of the imagery acquisitions.
Three different satellite generations have been released since the first launch in 2014, of which two of them acquired imagery in 2019 (the last generation named SuperDove was not launched until 2020). The Dove Classic is the only instrument type covering whole 2019, with the earliest imagery available of the Dove-R in March of the same year. Both instruments capture data in four spectral bands, three in the visible wavelengths and one in the NIR wavelengths, but the spectral range captured for each band is different between both generations [30]. Besides, the size of the scenes is also variable: 25.0 × 11.5 km for the Dove Classic and 25.0 × 23.0 km for the Dove-R.
Through a project proposal submitted to the ESA, we obtained access to download a total of 30,000 km2 of PlanetScope imagery from 2019 in LAC.

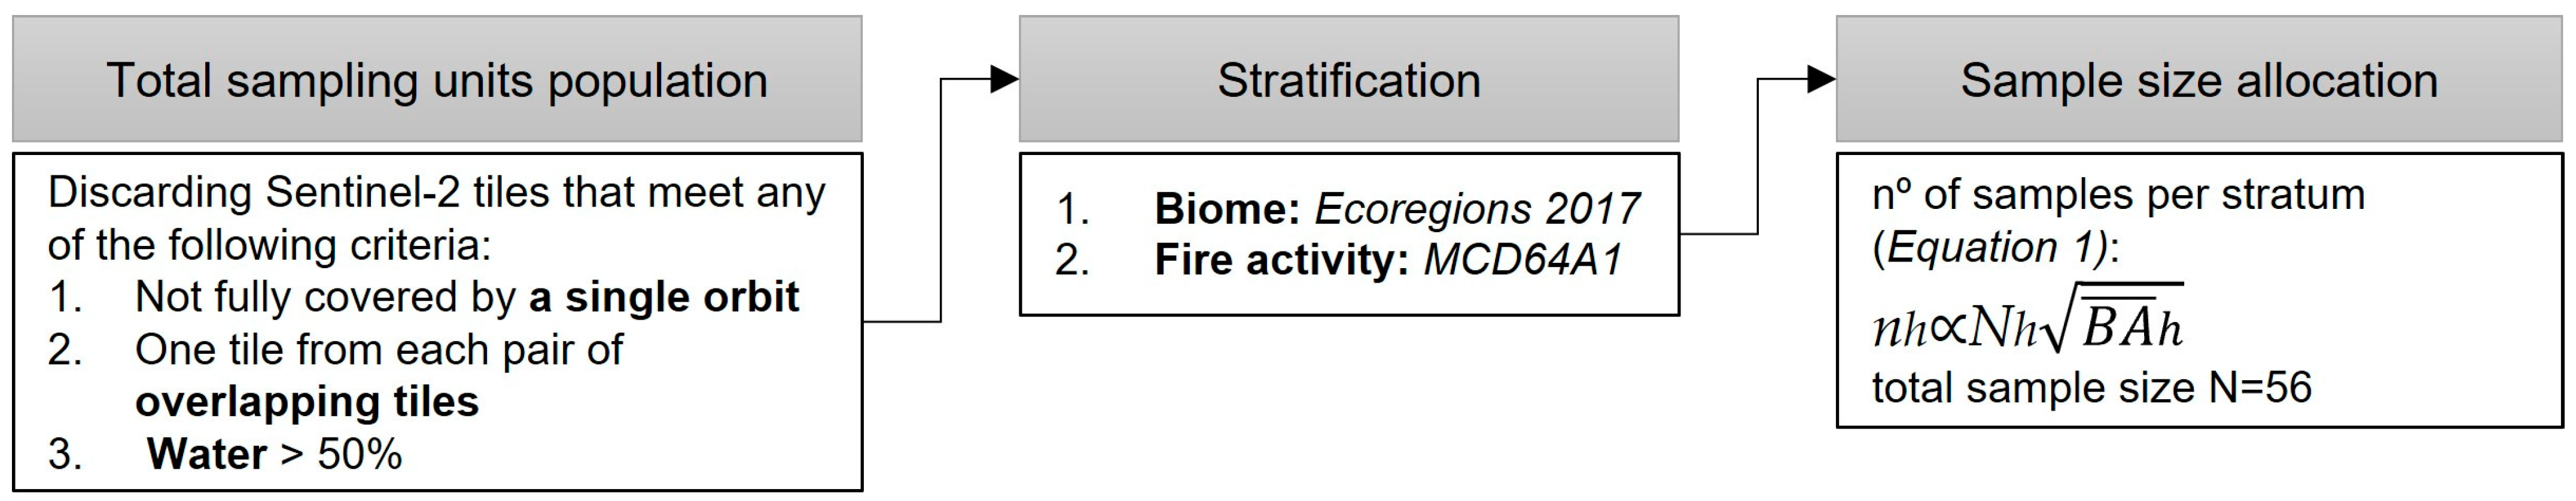
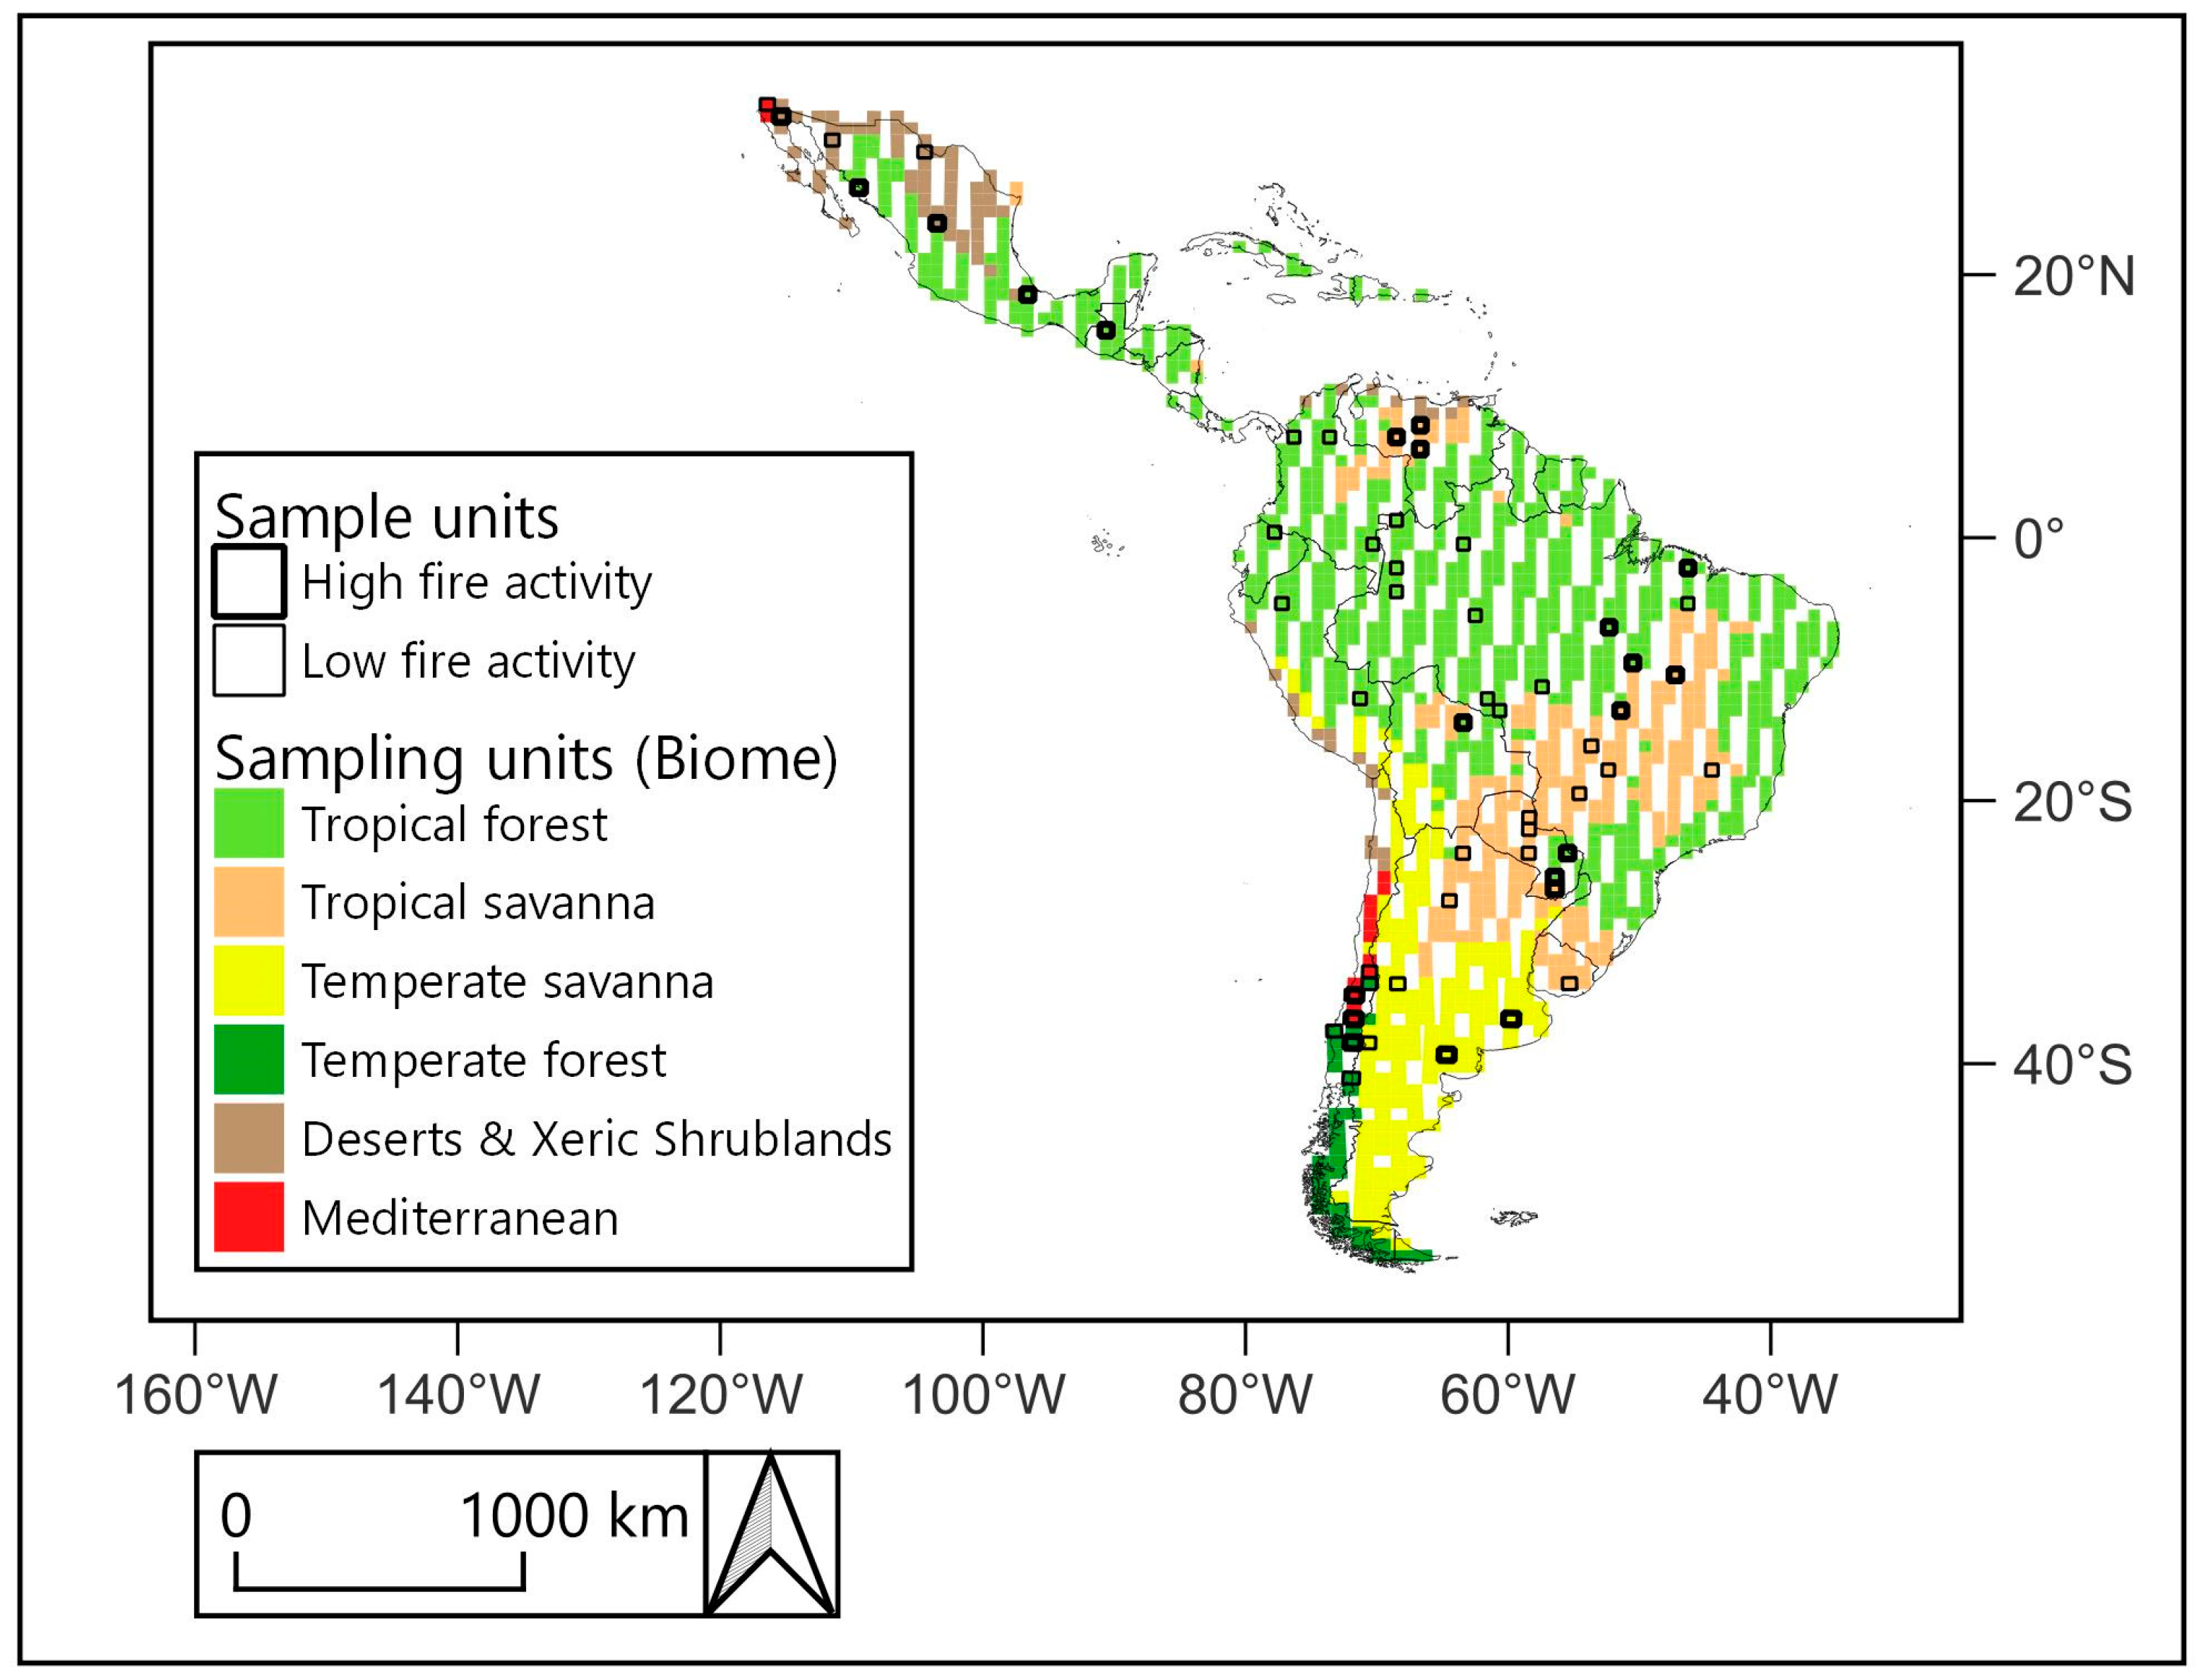
2.2. Sampling Design

Following the good practices on accuracy assessment [31], the sampling design to create the S2RP dataset was based on probability sampling, using a stratified random sampling design. The methodology used to select the sample units (Figure 1) begins with the identification of the tiles suitable to be used as sampling units, as they ensure robust statistical sampling, considering the Sentinel-2 tiling grid system [13]. Subsequently, stratification according to the corresponding biome and fire occurrence was made. Finally, a random selection of the stratified sampling units was applied after defining the number of sample units to be sampled among strata [20].

2.2.1. Identification of Sampling Units

The use of Sentinel-2 tiles as sampling units offers practical benefits in terms of simplification during data downloading and processing. However, due to the inherent misalignment between orbit acquisition and certain tiles, along with overlapping in UTM adjacent zones due to the tiling grid system, Stroppiana et al. (2022) [13] described two filtering criteria to ensure robust statistical sampling and prevent overlap between units. The first criterion involves discarding tiles not entirely covered by at least one of the orbits, ensuring uniform acquisition dates over the tile’s footprint. The second criterion entails the random elimination of one tile from each pair that overlaps in UTM adjacent zones, thus preventing an increased sampling probability in common land areas.
For our study, we applied both criteria for the tile grid over LAC, and additionally, we discarded the tiles covering a water percentage higher than 50%, to ensure a minimum land cover to map BA.
In terms of the temporal dimension of the sample units, Boschetti et al. (2016) [24] defined each continuous pair of images’ time interval as the temporal coverage for each sampling unit. However, such short temporal sampling units are more affected by temporal errors, since in a short reference period, the probability of a burned area being wrongly outdated with respect to the reference period is higher than in a longer period, potentially affecting spatial assessments due to those dating misalignments between the reference data and the product. In contrast, Padilla et al. (2018) [14] defined a minimum temporal length of 100 days, establishing stringent criteria based on a maximum allowed cloud cover and a fixed interval between images. The approach of these criteria required consecutive images with a cloud cover of less than 30%. However, this methodology presents disadvantages, as the total population size can result very limited. Additionally, it may constrain options for obtaining longer reference units. To avoid these limitations, we decided not to establish any criteria based on metadata or a minimum time length. Therefore, similarly to Franquesa et al. (2022) [11], we initially defined the entire year 2019 as the starting temporal period. However, we were aware that achieving complete temporal coverage for the entire year would not be feasible due to clouds. Consequently, the actual period for each sampling unit was defined after a visual analysis of the available images, as will be explained later in Section 2.3.1.

2.2.2. Biome and Fire Activity Stratification

Stratification enables the assurance of diverse conditions within the sample units. In our study, we stratified the sampling units based on two criteria: first, their primary biome to represent the diverse fire regime characteristics depending on the environment, and second, fire activity to ensure samples with both high and low fire occurrence. These strata have been previously proposed in studies for validating global and continental BA products following CEOS’s Stage 3 protocol [11,18,32].
Each sampling unit was categorized according to its predominant aggregated biome, utilizing the stratification layer described in Section 2.1.2. Next, each sampling unit was labeled either as high or low fire activity. To accomplish this, the MCD64A1 product was used for calculating the BA proportion detected for each sampling unit in 2019. Following this calculation, the threshold to classify the sampling units into high or low fire activity was set as the 80th percentile of the BA proportion within each biome, a methodology employed in previous studies [11,18]: sampling units above the 80th percentile of the BA proportion for a specific biome were designated to the high BA stratum, while samples below this threshold were labeled as low BA.

2.2.3. Sample Size Allocation

The total number of sample units for each stratum was determined by Equation (1) [20]:
n h N h B A ¯ h
where nh is the total number of units to be sampled for the stratum h, Nh is the total number of sampling units available to be sampled in the stratum, and B A ¯ h is the average of total BA in such stratum. A minimum value of 2 was assigned to nh for ensuring at least two samples for each stratum, even if the BA extent is low. Total sample size N was set to 56 sample units.
Once the sample size allocation was determined, the sample units were selected via simple random sampling without replacement from the population of each stratum.

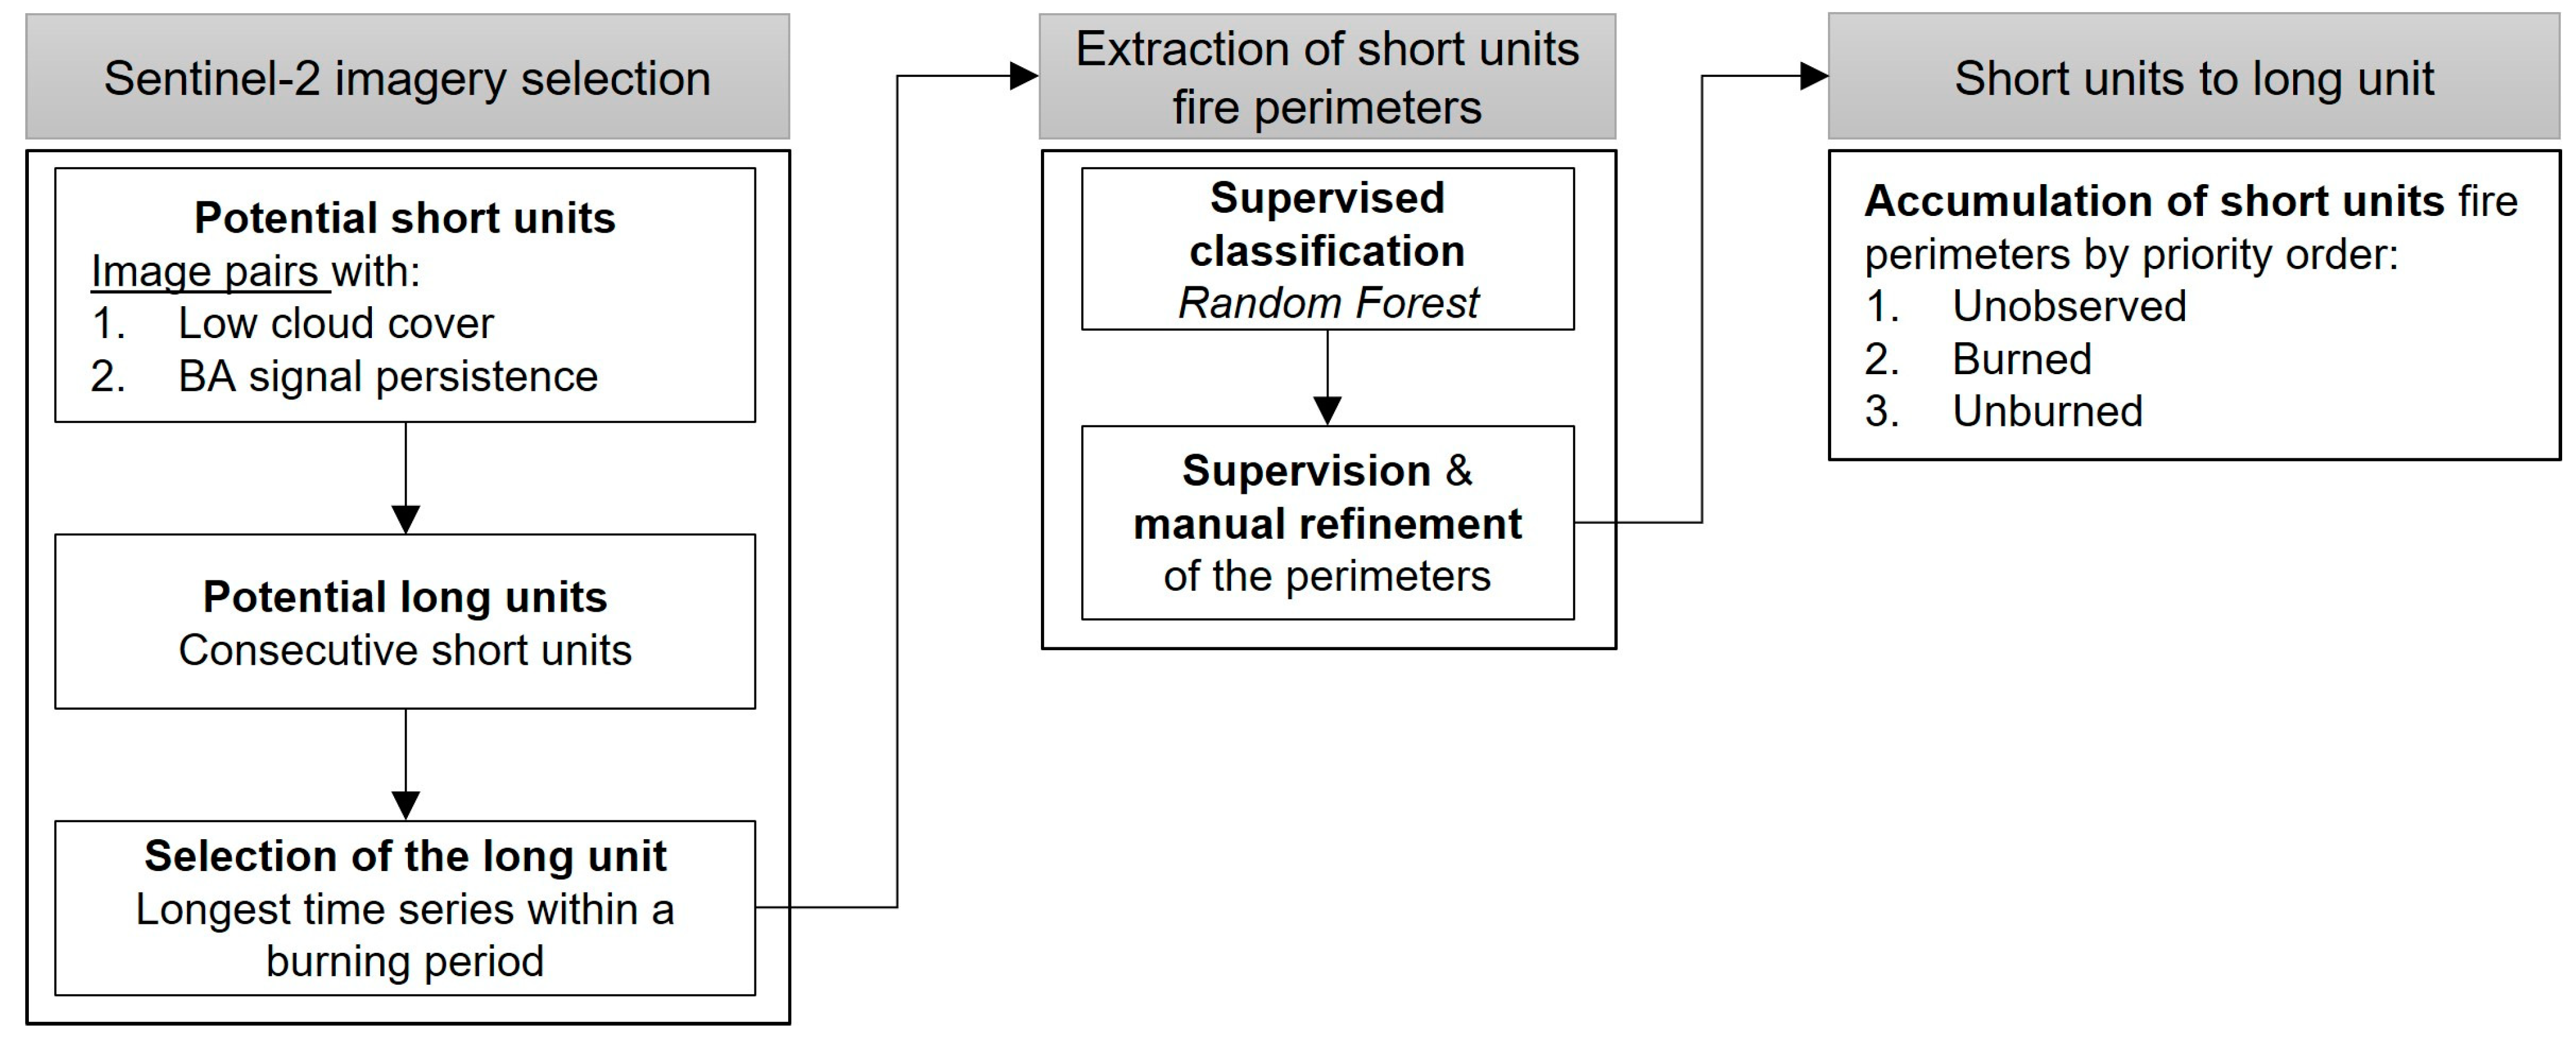
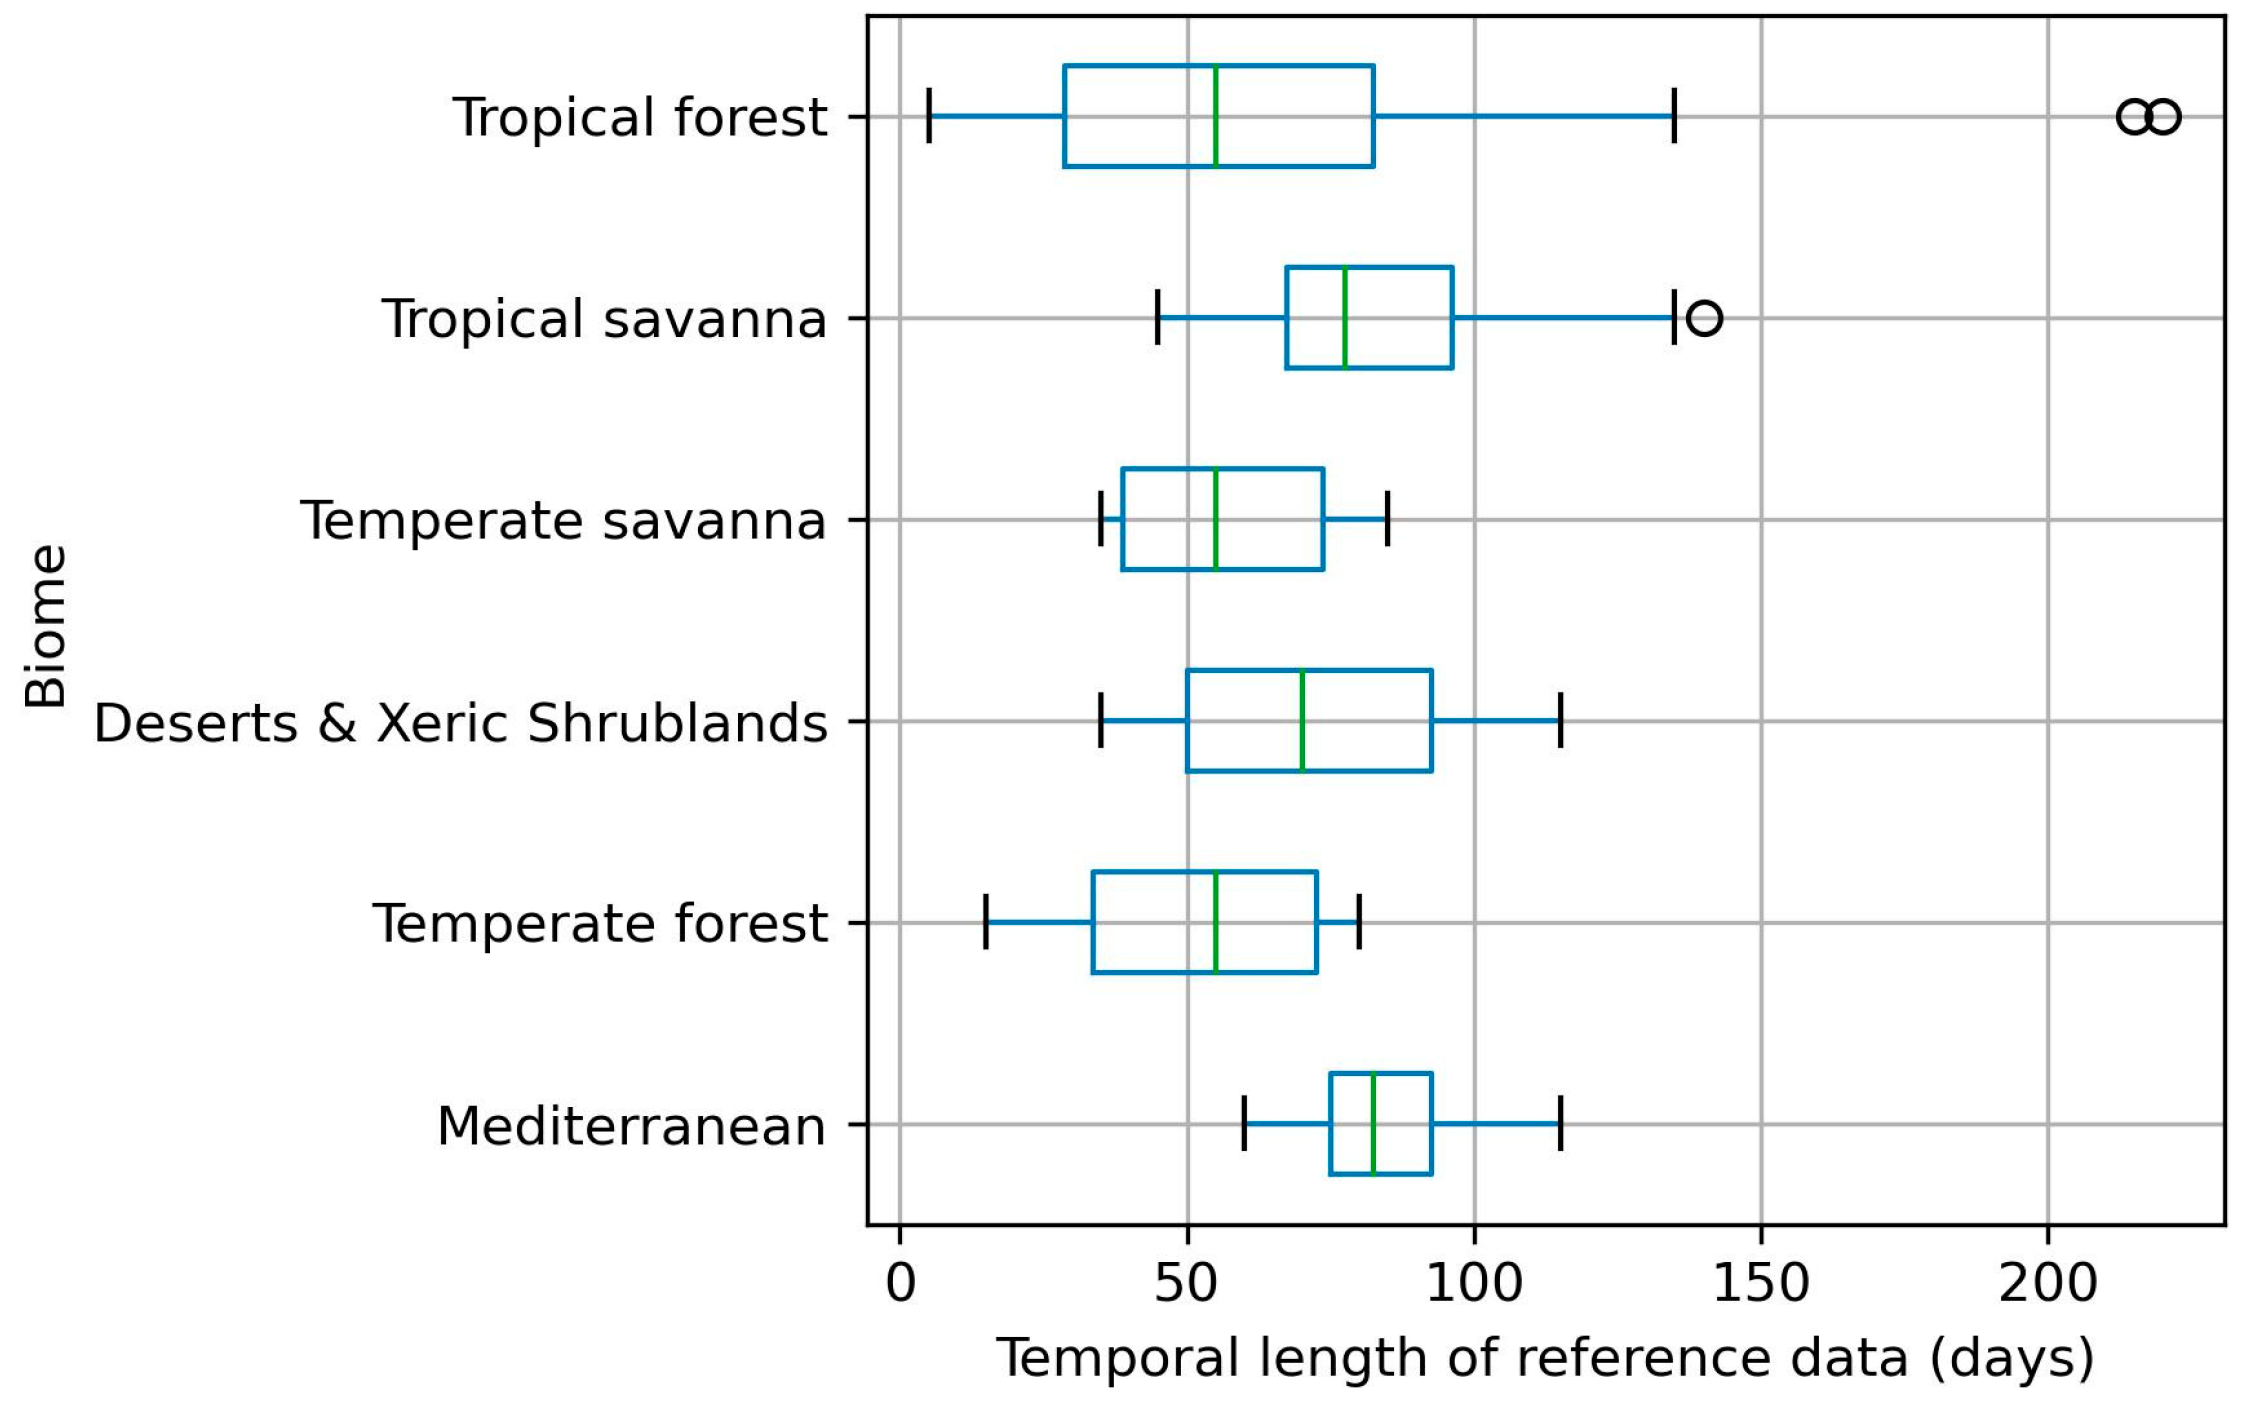
2.3. Extraction of Reference Fire Perimeters

For the extraction of reference fire perimeters within the selected sample units (Figure 2), the process began by selecting Sentinel-2 imagery to map the BA. This selection considered the fire periods, cloud cover, and temporal criteria. BA classification was performed to extract short temporal units of fire perimeters (short units) for each consecutive image pair, using an adapted version of the Reference Perimeters (RP) tool developed by Roteta et al. (2021) [33]. These short units represent the boundaries of the burned area detected between the preceding and subsequent images over a short period. Finally, all short units generated within every sample unit were aggregated to create a single long temporal unit fire perimeter (long unit) per sample unit, generating fire perimeters of a longer period. The aim of generating long units is to minimize the errors associated with burn dating when these perimeters for evaluating other BA products are utilized [11].

2.3.1. Selection of Sentinel-2 Images

Sentinel-2 images used to map BA were manually selected for each sample unit. The approach involved a visual analysis of all imagery available for the year 2019. On that analysis, the cloud cover for each image was evaluated. Several studies have used metadata cloud coverage values to discard the cloudiest images [13,14]. However, occasionally a significant portion of the cloudy pixels are cirrus clouds, which, in some cases, do not hinder the accurate detection of BA. This limits the overall pool of imagery available for BA mapping. Therefore, we opted to discard images by visually analyzing the cloud coverage on a one-by-one basis.
Standard protocol for BA products’ validation [12] recommends generating BA reference data using two satellite images, mapping the BA occurred between the two acquisition dates. We checked which consecutive images could be utilized together to map the reference fire units. Two available images were considered part of the same potential short unit if the burned signal persisted. The persistence of this signal depends on several factors as biome, land-cover, and post-fire weather conditions [34]. To ensure the persistence of the burned signal, we verified that areas visibly burned in the previous image were still visible in a subsequent image, without a fixed time interval between the previous and posterior images, thereby avoiding limitations on the availability of imagery for constructing the fire perimeters. This process resulted in different potential collections of imagery suitable for mapping long units in each sample unit, particularly when the post-image of a short unit could serve as the pre-image of the next short unit. Among these options, we selected the longest time sequence within a burning period.

2.3.2. Extraction of Short Unit Fire Perimeters

To extract the fire perimeters between consecutive pair of images, we implemented an adapted version of the RP tool developed by Roteta et al. (2021) [33]. This tool, a supervised classifier, operates on GEE, a cloud-computing platform with available ready-to-use satellite data and products. The algorithm employs a Random Forest (RF) classifier [35] to map the burned areas between the time lag from the pre-fire image to the post-fire one. The user creates training polygons for both burned and unburned areas through image interpretation, over a Long SWIR/NIR/Red color composition. To facilitate burned area detection, VIIRS 375 m [36] and MODIS 1000 m collection 6 [37] hotspots between both acquisition dates were added to the GEE interface. The RF is trained using VIS, NIR, SWIR1, and SWIR2 bands, along with the calculated NBR (Normalized Burn Ratio) [38], NBR2 [39], and NDVI (Normalized Difference Vegetation Index) [40] spectral indices of the post-fire image and the post–pre difference image.
A two-phased strategy [33] is applied to the output burned probability image of the RF model. This strategy aims to achieve a balance between omission and commission errors. In this approach, patches of pixels with a probability exceeding 50%, using a 4-node connection, are labeled as burned if they contain at least one seed pixel inside. The seed pixel is identified as having a higher probability than the average of the mean RF probabilities obtained for the training polygons. While the original RP tool uses the Sentinel-2 Scene Classification Layer (SCL) to mask cloudy areas, we opted to use an empirical mask based on a threshold of the Sentinel-2 Coastal aerosol band (B1). This approach was chosen to prevent overestimation of areas unable to detect BA, as using the SCL layer might mask regions with cirrus clouds that mostly do not inhibit the BA detection, leading to a reduction in the total observed area. We adjusted the B1 threshold one by one for each pair of images to mask only the clouds that hinder the detection of BA. To mask shadows, the SCL layer was used (value 3—cloud shadows), as in the original RP tool. The algorithm was adapted to aggregate both clouds and shadows to the mask. The output layer for each pair of images was categorized into three groups of polygons: unobserved (derived from the clouds and shadows mask), burned, and unburned. The results were modified, if necessary, with new training polygons added until an accurate classification was achieved.
Finally, the perimeters were downloaded from GEE to a local computer and displayed with a GIS desktop application. The short unit results were manually refined.

2.3.3. Conversion of Fire Perimeters from Short to Long Unit

The generation of long units involves utilizing the perimeters of all short units generated for the sample unit. The methodology employed was consistent with that outlined by Franquesa et al. (2022) [11], wherein burned and unobserved pixels are accumulated, with priority given to the unobserved pixels. In practical terms, if a pixel is labeled as burned in one short unit and as unobserved in another, it will be categorized as unobserved in the long unit. Similarly, a pixel must be labeled as unburned in all the short units to maintain the same category in the long unit.

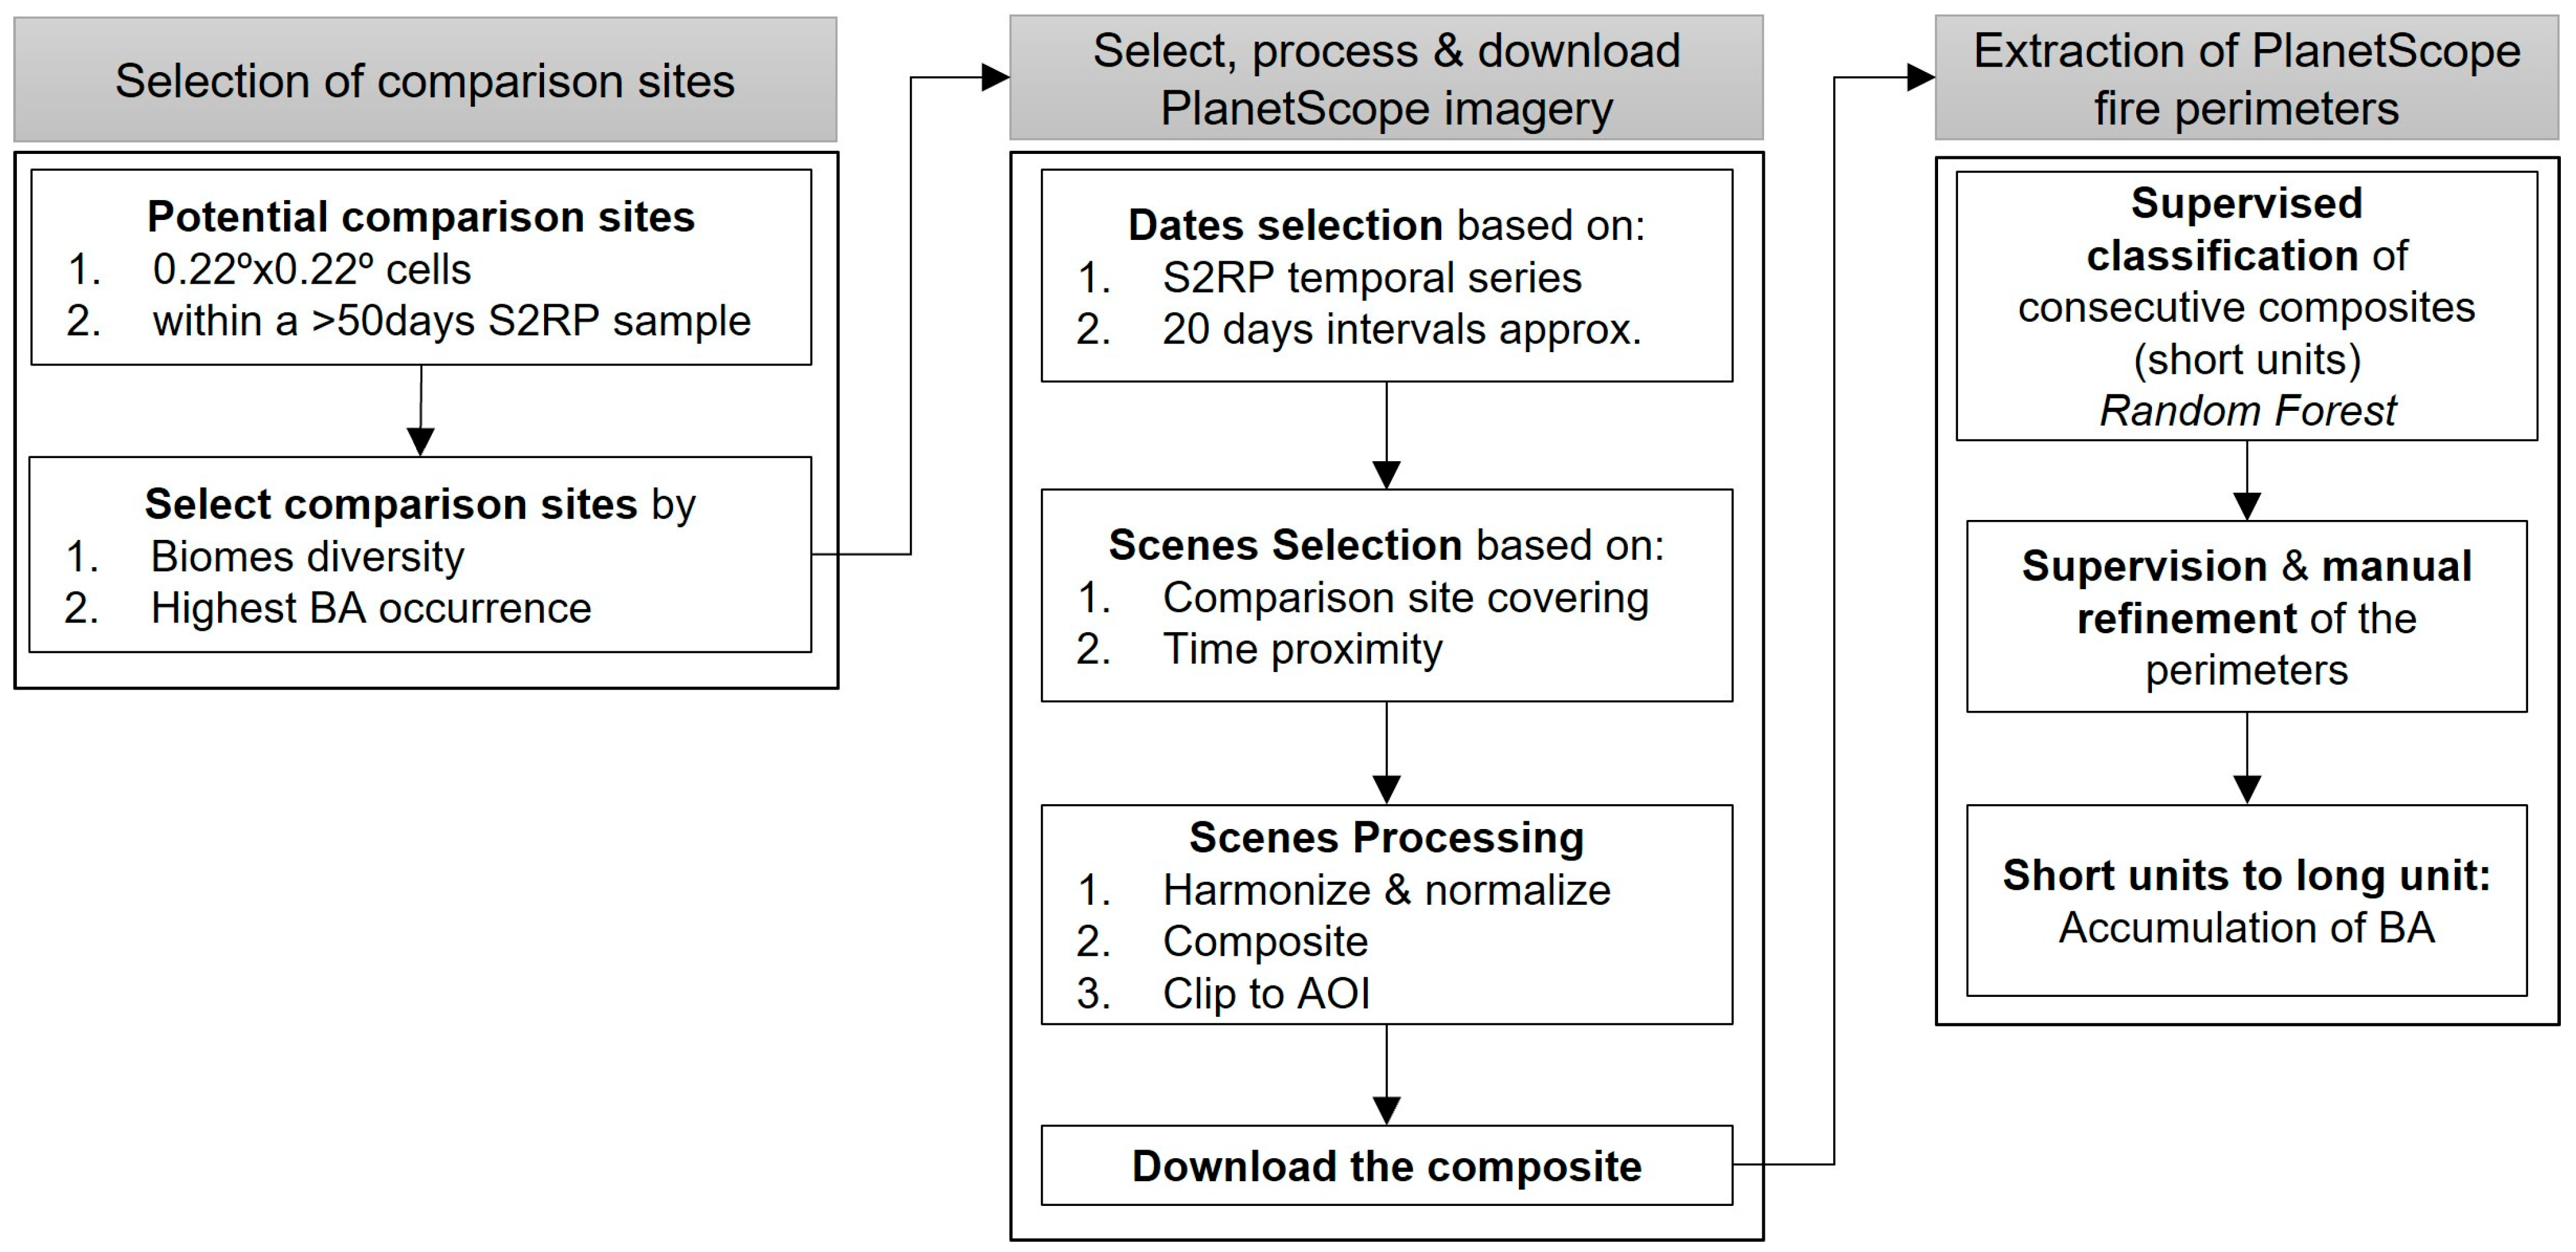
2.4. Sentinel-2 and PlanetScope Reference Fire Perimeters Comparison

To assess the accuracy of the Sentinel-2 reference fire perimeters, PlanetScope imagery was utilized to generate higher-resolution fire perimeters over a subset area of S2RP where both datasets were compared. We followed a strategy to select diverse comparison sites to best represent S2RP biome variability considering the PlanetScope download quota before extracting the fire perimeters (Figure 3).

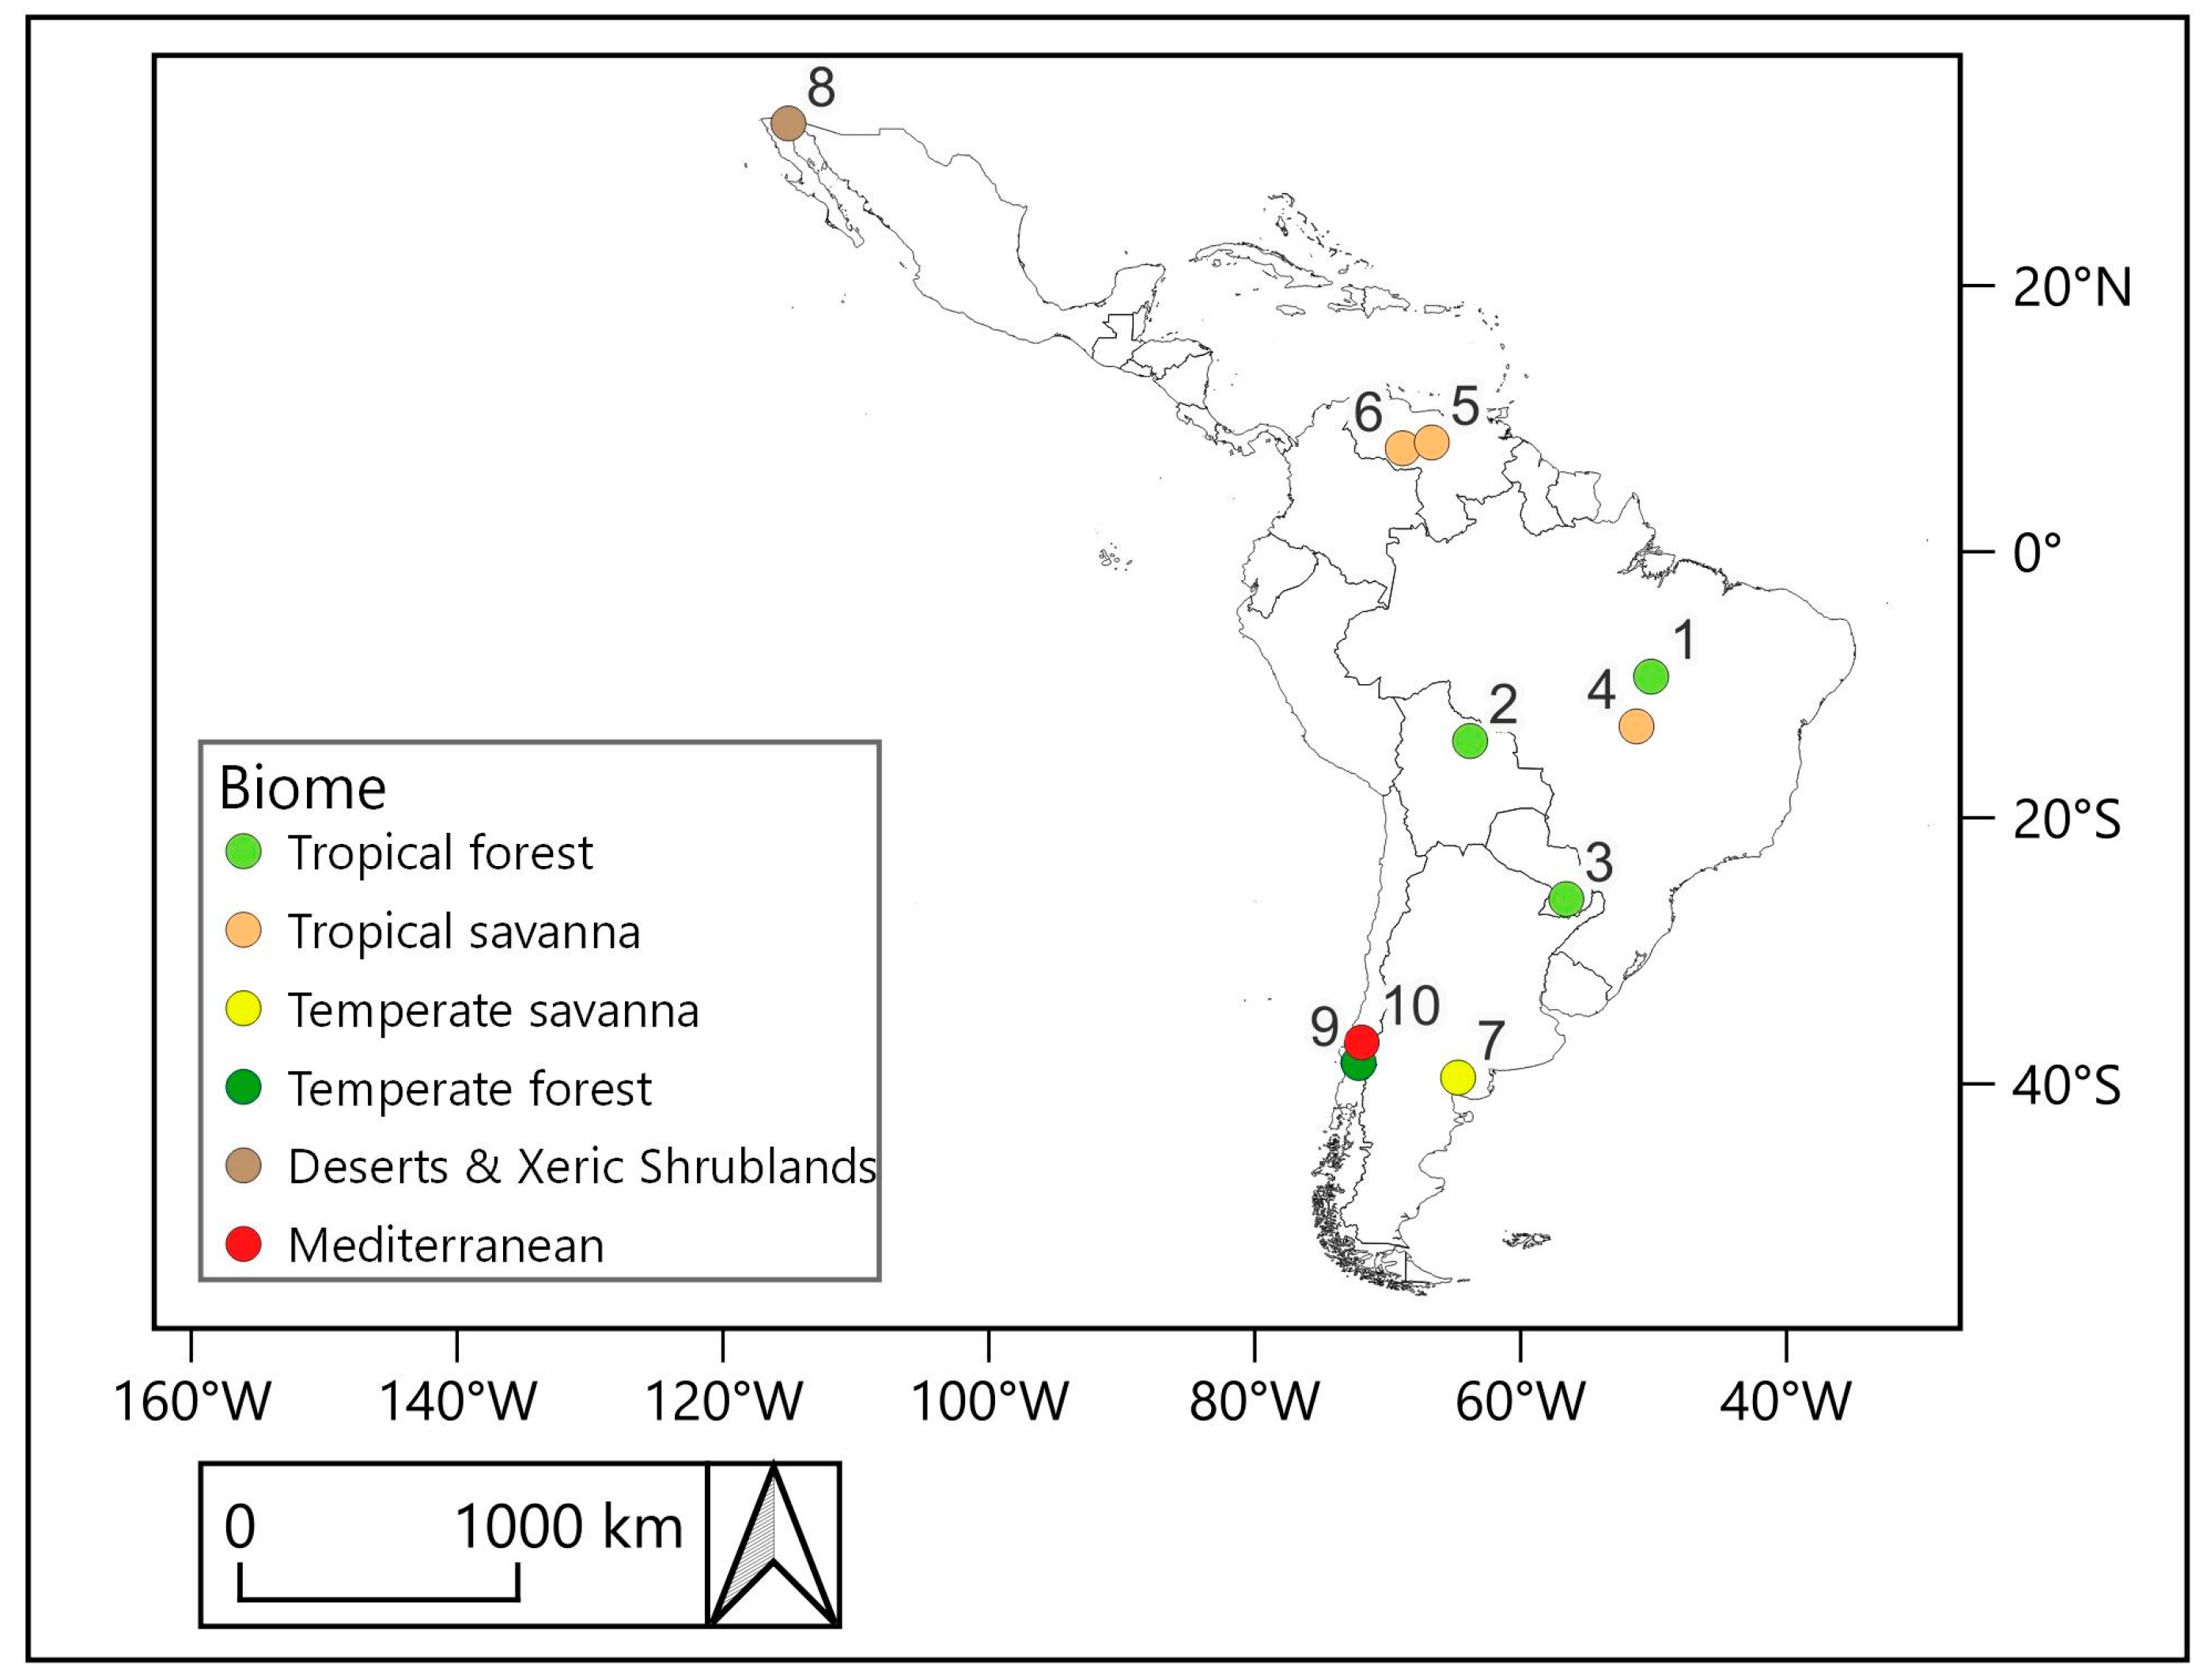
2.4.1. Selection of the Sentinel-2—PlanetScope Comparison Sites

A grid network of 0.22° × 0.22° (approximately 500 km2) was established across LAC, where every cell was a potential comparison site. To minimize potential accuracy errors arising from temporal imprecision, a filter was applied to the grid to retain only the cells that overlap with any sample unit from S2RP with a minimum temporal length of 50 days. For each of these cells, the percentage of burned, unburned, and unobserved areas based on the S2RP perimeters was computed. Additionally, the information regarding the tile name of the overlapping S2RP sample unit and its respective biome was assigned to each cell. This way, cells were selected as comparison sites considering the percentage of different categories according to S2RP, opting for those with the highest percentage of burned area for each biome, and moreover, ensuring that the unobserved percentage was lower than 5%. Once a comparison site was secured for each biome, additional ones were defined for the biomes more represented in S2RP, following the same criterion, but avoiding repeating the S2RP overlapping sample unit, to increase the variability. The total number of comparison sites was determined by the limit of the PlanetScope imagery download quota.

2.4.2. Selection, Processing, and Download of PlanetScope Imagery

Following the identification of the comparison sites, the PlanetScope imagery was selected. Since the extent of its scenes is smaller than that of the comparison sites, multiple scenes were chosen for each date to collectively cover the entire extent. In cases where there were not enough scenes of the same day available to fill the entire comparison site, additional scenes from days as close as possible were also selected. To minimize temporal imprecision errors, efforts were made to ensure that the initial and final dates of the PlanetScope images closely approximated those of the sample units in S2RP. Scene selection also considered the cloud percentage according to metadata, prioritizing scenes with very low cloud cover percentages.
In the scenes download procedure, Planet provides users with various tools to facilitate image preprocessing [41], from which three were utilized. Firstly, both the composite tool and the clipping tool were used to optimize the utilization of the image download quota. By creating a mosaic of images prior to downloading, the quota was not wasted on areas where multiple scenes overlapped. Additionally, areas of scenes outside the designated sites were not downloaded. Secondly, the harmonization tool was used to enable the combination of scenes from different satellite generations, despite their distinct spectral responses. The tool also normalizes the reflectance data to correct variations between scenes caused by other parameters [42]. For every site, diverse composites were generated and downloaded approximately every 20 days.

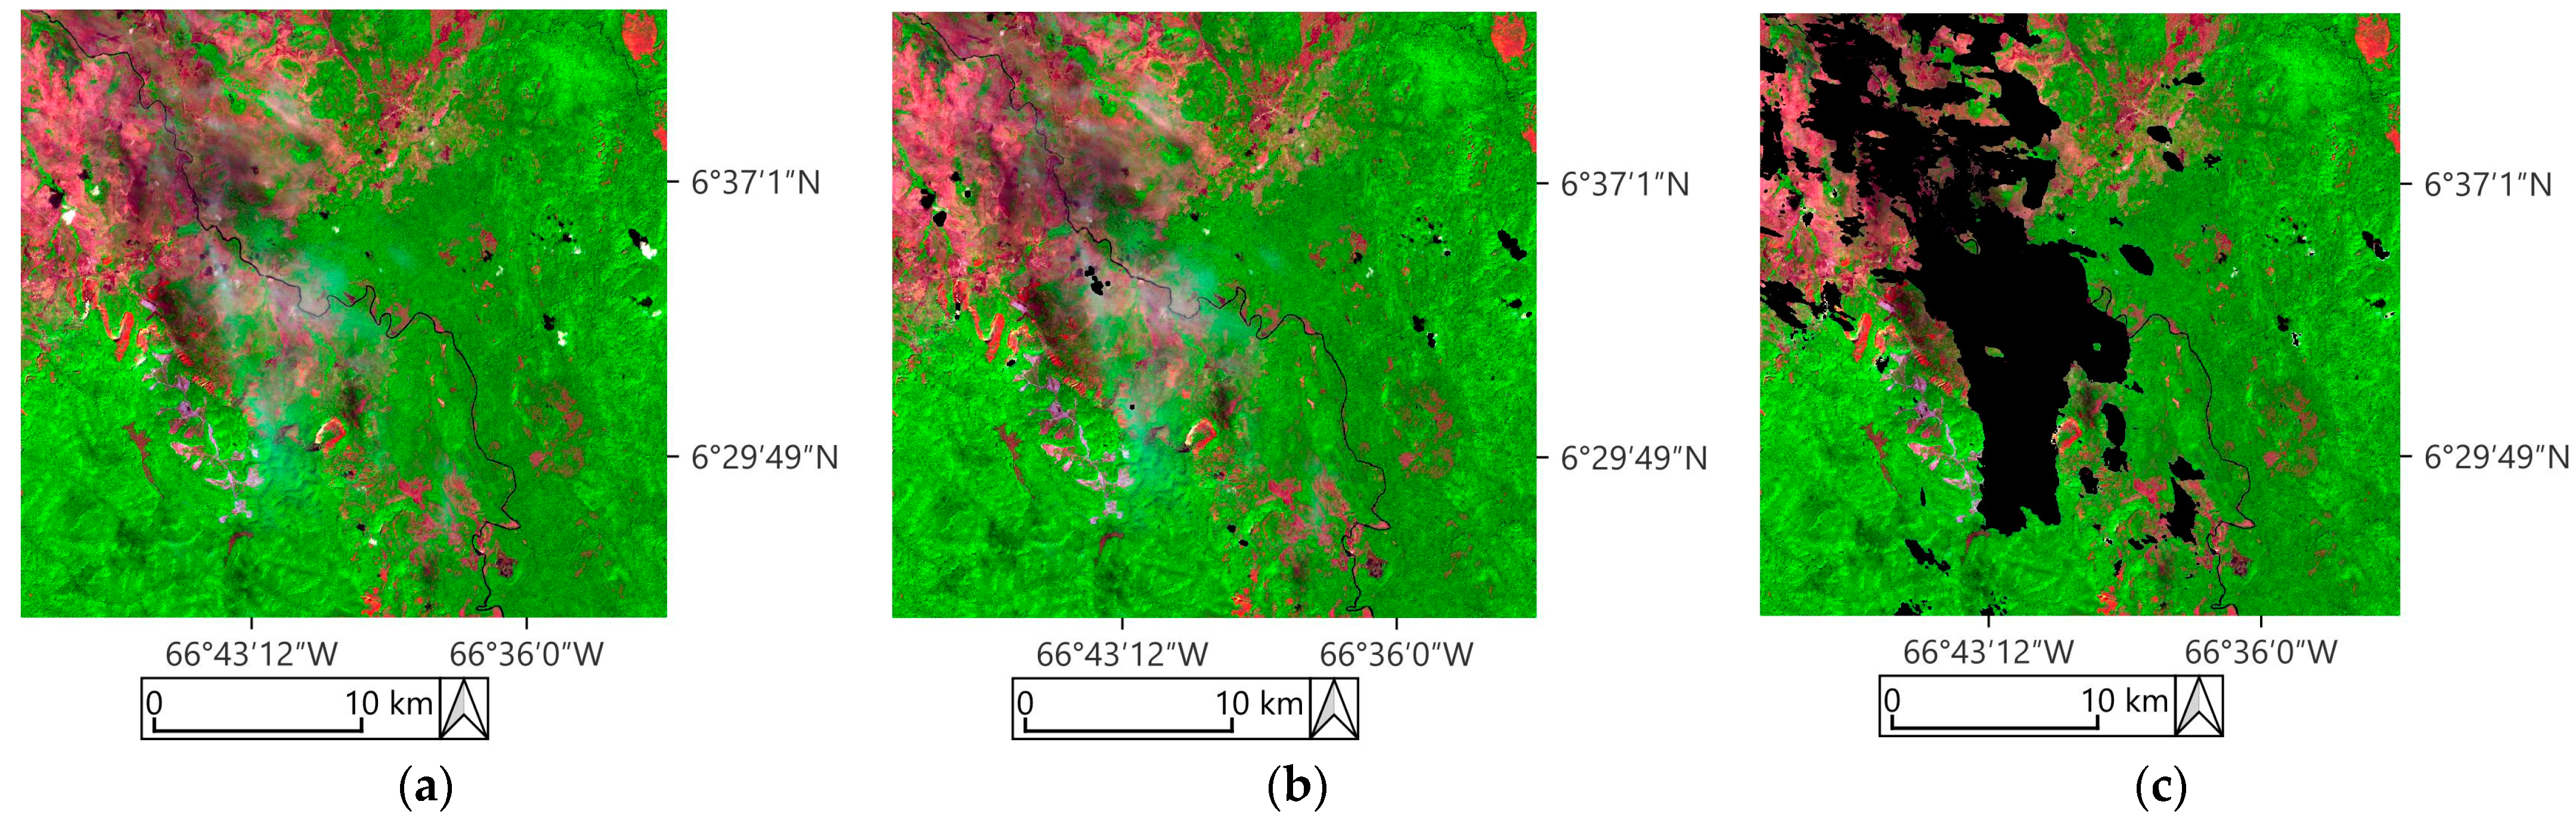
2.4.3. Extraction of PlanetScope Fire Perimeters

Following the methodology of Stroppiana et al. (2022) [13], the process for the extraction of PlanetScope fire perimeters was similar to the explained in the Section 2.3.2 and Section 2.3.3 for Sentinel-2. The main difference is that since only VIS and NIR bands were available for PlanetScope imagery, RF was adapted to that spectral resolution. Thus, the classifier was trained with the values of blue, green, red, and NIR bands, and the NDVI spectral index. The training set was independently collected with respect to the ones used with Sentinel-2 imagery. We did not apply any masking to PlanetScope imagery, since the cloudiness of all scenes downloaded was inexistent or very low. The perimeters of all PlanetScope short units were downloaded from GEE to be refined with a local desktop GIS application. Finally, long units were generated accumulating the burned polygons of the short units.

2.4.4. Accuracy Metrics from the S2RP–PlanetScope Comparison

Finally, PlanetScope and S2RP perimeters were compared between them. The confusion matrix (Table 1) was computed to subsequently calculate accuracy metrics (Table 2) that quantify the agreement and disagreement between both fire perimeters. For that, areas cataloged as unobserved in S2RP were discarded from the analysis. Following previous studies [11,13,18], we calculated the commission error (Ce), omission error (Oe), Dice Coefficient (DC) [43], and relative bias (relB) metrics for each comparison site. Ce refers to the percentage wrongly classified as burned in the product, while Oe represents the percentage wrongly classified as unburned. DC combines both Ce and Oe to provide information about the agreement in a single measure, while relB informs if the validated product overestimates (positive values) or underestimates (negative values) BA.

2.5. Accuracy Assesment of Global BA Products

MCD64A1 Collection 6.1 [1] and FireCCI51 [2] global BA products were assessed with S2RP. For computing the areas, a raster analysis has been applied to the global BA products, with a spatial resolution of 1 m. The confusion matrix and the same metrics as described in the Section 2.4.4 have been computed, but in this case the results are inferenced to the whole LAC, as described in Franquesa et al. (2022) [11].

3. Results

3.1. Sampling

From the 2649 Sentinel-2 tiles covering LAC, 1491 tiles guaranteed the same acquisition date across the entire area and non-overlapping with another tiles. Moreover, 1292 of them were determined to be suitable as sampling units, due to their water percentage being lower than 50%. The stratification based on biome and fire activity was achieved for the 1292 sampling units. The threshold calculated according to the MCD64A1 product for the year 2019 for each biome to assign high or low fire activity for each stratum can be consulted in Table S1 of the Supplementary Materials.
The total number of sample units to be selected for each stratum (Table 3) was calculated following Equation (1), where 56 was the total sample size. The spatial distribution of both the entire population of sampling units and the selected sample units, determined through stratified random sampling, is illustrated in Figure 4.
Most sampling units in the entire population belong to “Tropical Forest” (~55%), followed by “Tropical Savanna” (~21%) and “Temperate Savanna” (~15%). Additionally, the biomes with the highest BA, as detected by MCD64A1 in 2019, are “Tropical Savanna” and “Tropical Forest”, in that order. Due to the prevalence of these two biomes in the sampling population and their high BA, 24 sample units were selected from the “Tropical Forest” biome and 16 from the “Tropical Savanna” biome. In contrast, each of the remaining biomes contributed only four sample units, adhering to a minimum of two units established for each high/low fire activity stratum.
Details of the whole population of 1292 sampling units used in the stratified random sampling and the 56 sample units selected can be consulted in the S2RP database published in the Burned Area Reference Database (BARD) [17], publicly available at https://doi.org/10.21950/GZU7II, accessed on 7 February 2024.

3.2. Sentinel-2 Reference Fire Perimeters

Over the 56 sample units, 258 short units were generated, with a total of 314 Sentinel-2 images processed, to subsequently convert them in the corresponding 56 long units. The temporal length of these long units resulted variable from 5 to 220 days, from which 17 were <50 days long, 30 between 50 and 100 days long, and 9 more than 100 days long, with a median of 70 days long and an average of 72 days long. Across all biomes, the median value varied between 55 and 85 days long, and the Tropical Forest biome was the one with the most variability in the temporal length, where most perimeters had a temporal length between 5 and 135 days, and another 2 even larger than 200 days (Figure 5).
The total area covered by the reference units is 569,214.2 k m 2 , of which 19,760.7 k m 2 was mapped as burned (3.5%), 505,174.9 k m 2 as unburned (88.7%), and 44,278.6 k m 2 (7.8%) as unobserved. The results by biome are illustrated in Table S2 of the Supplementary Materials. The biome with most burned area was the ‘Tropical Savanna’ biome, with 8.3% of the total area catalogued as burned. In contraposition, the ‘Temperate Savanna’ biome was the one with less BA, with only 0.6% of the total area categorized as burned. From all biomes, Tropical Forest was the biome with most unobserved area (13.6%).

3.3. Comparison with PlanetScope Reference Perimeters

The location of the selected comparison sites is illustrated in Figure 6, and specific information about every one of them and its overlapping S2RP area can be consulted in Table S3 of the Supplementary Materials. In total, 10 comparison sites could be chosen until reaching the download quota limit. As the Tropical Forest and Tropical Savanna biomes are the most represented in S2RP, they are also the most represented in the PlanetScope perimeters, with three comparison sites for each. Meanwhile, each of the other biomes is represented by a single comparison site. The total comparison area is 5170.9 km2, with each comparison site ranging from 456.3 km2 to 589.8 km2. From the entire validated area, 30.56% was classified as burned by S2RP, and 0.77% as unobserved. A total of 54 PlanetScope composites were downloaded to fully cover the entire spatial and temporal extent of the comparison sites, requiring the use of at least a portion of 508 PlanetScope scenes.
Regarding the temporal period, most scenes used to generate the initial and final PlanetScope composites belong to the same day or, if not available, to a day before or after the S2RP period. However, in some cases, the scenes available on those dates were not sufficient to cover the entire site, requiring the use of scenes from more distant dates. The scenes composing the composites initiating the PlanetScope comparison periods have a maximum mismatch of 1 day before and 4 days after the initial date of the S2RP perimeters. The 4-day mismatch occurs in sites 8 and 10. For site 10, scenes with this mismatch represent 5.75% of the total composite area, and for site 8, this percentage is 1.73%. Regarding the composites concluding the PlanetScope comparison periods, the maximum mismatch is 1 day before and 13 days after. The 13-day mismatch occurs in site 10, with such scenes representing 12.25% of the composite. Another noteworthy mismatch is a maximum of 10 days in the final composite of site 1, with those scenes representing 1.5% of the total composite. The characteristics of the selected comparison sites can be consulted in detail in Table S3 of the Supplementary Materials.
Table 4 presents the results of the accuracy metrics calculated for S2RP using the PlanetScope reference fire perimeters. The results are illustrated for each comparison site, globally and by biome in terms of Dice Coefficient (DC), Commission Errors (Ce), Omission Errors (Oe), and relative Bias (relB).
In total, the S2RP achieved DC = 93.9%. Ce were higher than Oe, indicating a tendency to overestimate BA (Ce = 8.4%, Oe = 3.8%, relB = 5.0%). Among biomes, Temperate Savanna yielded the best results for all metrics (DC = 97.7%, Ce = 2.8%, Oe = 1.8%, relB = 1.0%), followed by Tropical Savanna and Tropical Forest, respectively. All biomes except Deserts & Xeric Shrublands obtained a DC greater than 89%, Ce lower than 14%, and Oe lower than 16%, while this biome experienced the highest commission errors (Ce = 44.8%, DC = 67.4%, relB = 56.4%). It is also noteworthy that S2RP overestimated BA in all biomes except Temperate Forest (relB = −10.5%, Oe = 15.4%), indicating an underestimation of BA, and presenting the highest Oe among all comparison sites.

3.4. Accuracy Estimates for MCD64A1 and FireCCI51

Table 5 presents accuracy estimates and standard errors calculated using S2RP for MCD64A1 and FireCCI51 datasets, both globally and by biome.
For the global population, Oe was higher for both FireCCI51 (56.4% ( ± 7.7)) and MCD64A1 (57.6% ( ± 8.0)), compared to Ce: FireCCI51 (23.3% ( ± 3.9)) and MCD64A1 (25.9% ( ± 4.3)). RelB indicates the underestimation of BA for both products: the FireCCI51 (−43.1% ( ± 7.6)) and the MCD64A1 (−42.8% ( ± 8.1 )). In terms of DC, FireCCI51 exhibited slightly superior results (DC = 55.6% ( ± 7.2)) than MCD64A1 (53.9% ( ± 7.5)).
Across biomes, Temperate Savanna showed the most favorable outcomes for both products in DC, Oe, and relB, followed by Tropical Savanna in terms of DC and relB. Concerning Ce, FireCCI51 demonstrated its lowest errors in the Tropical Savanna, while MCD64A1performed best in the Mediterranean biome. Conversely, the lowest accuracies for both products across all metrics were found in the Deserts & Xeric Shrublands biome. On that biome, there was a substantial disparity in Ce, with FireCCI51 recording 40.8% ( ± 10.7) and MCD64A1 recording 70.3% ( ± 25.6). The difference for Ce was also high in the Mediterranean biome, where FireCCI51 (Ce = 39.8% ( ± 1.9)) reported higher errors compared to MCD64A1 (Ce = 19.9% ( ± 4.3 )). The highest differences in DC, Oe, and relB were in Temperate Forest, where omission errors were high for MCD64A1 (Oe = 81.4% ( ± 14.8 )). Moreover, relB indicated an underestimation of BA detection for both products in all biomes, but the errors were more balanced for Temperate Savanna, especially for FireCCI51 (relB = −1.4% ( ± 8.6)).

4. Discussion

In this paper, S2RP was created, a reference fire perimeters dataset over LAC derived from Sentinel-2 imagery for the year 2019, with validation approaches for global BA products, such as FireCCI51 and MCD64A1, which have been assessed as an example of the utility of S2RP. Additionally, PlanetScope high-resolution imagery was used for accuracy estimation of S2RP.
To select the Sentinel-2 tiles employable as sampling units for a statistically robust sampling, we applied for LAC the same approach of tiling grid system filtering conditions proposed by Stroppiana et al. (2022) [13] for Subsaharan Africa. This way, we discarded overlapping tiles from adjacent UTM zones, and the tiles not fully covered by a single orbit to assure the same acquisition date over the whole image. To those filtering conditions, we added an extra filter that discarded the tiles with a higher water percentage than 50%, obtaining a total of 1292 sampling units. In contrast to Stroppiana et al. (2022) [13], we did not apply rigid criteria for the time series selection with a maximum metadata cloud coverage or an established time interval between consecutive images.
In our study, a total of 56 Sentinel-2 tiles were selected as sample units for LAC, while other recent validation studies such as Stroppiana et al. (2022) [13] selected 50 to represent Subsaharan Africa and Franquesa et al. (2022) [11] employed 105 or 106 sample units of 100 × 100 km from Landsat imagery for each year validated to represent the whole Earth land. The stratified random sampling was based on biomes and fire activity, and the total number of sample units to be selected for each stratum was determined by Equation (1). This equation causes a higher representation for the strata with higher BA and more samples. Consequently, 24 (43%) of the sample units belong to the ‘Tropical Forest’ biome and 16 (29%) to the ‘Tropical Savanna’ biome. Thus, the representation of the ‘Temperate Savanna’, ‘Deserts and Xeric Shrublands’, ‘Temperate Forest’, and ‘Mediterranean’ biomes is more limited with the minimum of four sample units selected for each of them.
Similar to the approach by Franquesa et al. (2022) [11], we evaluated the image pairs for generating BA on a case-by-case basis for every sample unit, to ensure the persistence of burned signal with minimal cloud coverage. This way, we focused on minimizing the total unobserved area, to have the best amount of data available for validation. In this regard, it is noteworthy that the decision not to establish strict criteria before the sampling regarding cloud coverage based on metadata or the time interval between consecutive images, similar to Stroppiana et al. (2022) [13], had both advantages and disadvantages. The main advantage was that not setting these criteria prevented the exclusion of many valid tiles from the sampling, making the dataset more representative of LAC than it would have been with such criteria in place. However, it is true that in our case, the stratified random sampling without establishing prior cloudiness criteria led to the selection of some sample units with most images exhibiting such high cloud cover that it was impossible to find many consecutive images under optimal conditions for detecting BA. This resulted in a lower temporal length than desired for some reference units.
The fire perimeters were created utilizing a modified version of the RP Tool developed by Roteta et al. (2021) [33] within the GEE cloud platform. By leveraging the processing capabilities of GEE and its accessibility to diverse preloaded datasets, we employed the Random Forest supervised classification algorithm. This approach facilitated the generation of highly accurate fire perimeters by creating training polygons for each image pair. Additionally, we integrated active fire points into the map interface, successfully streamlining the image interpretation process. Furthermore, the modification we implemented for cloud masking, using a threshold of the Sentinel-2 Coastal aerosol band B1 visually determined for each image pair, was satisfactory. This modification helped us avoid unnecessary masking for areas where BA detection was possible, even in the presence of cirrus clouds. Consequently, we achieved a greater observed area compared to the observed area attainable using the original mask based on the Sentinel-2 Scene Classification (SCL) layer. In Figure 7 it is illustrated an example of how we reduced masked areas where land surface is observable even in the presence of clouds.
Before accumulating the perimeters of the short units to create the long unit of each sample unit from S2RP, all short units were supervised and manually refined when necessary to make the result more feasible. Most of the corrections were made to reduce commission errors in croplands, where the reflectance changes of recently harvested or ploughed parcels and the decrease of the photosynthetic activity is sometimes similar to BA, causing land cover with higher Ce and Oe rates compared to different studies [44,45,46].
To assess the accuracy of S2RP, high spatial resolution reference perimeters were created using PlanetScope images. There is a prior study conducted by Stroppiana et al. (2022) [13] regarding the comparison of BA perimeters derived from Sentinel-2 images on a continental scale using PlanetScope images. Nevertheless, the procedure we have proposed has some differences compared to that study. The fundamental distinction lies in the selection of comparison sites, as we designed a procedure to capture the biome variability of the dataset. For that, as we had a limited download quota, we defined an extent of approximately 500 km2 for each comparison site, which is smaller than the comparison sites utilized by Stroppiana et al. (2022) [13], which ranged between 974 and 1588 km2. Additionally, in our study, we validate sites based on perimeters from the same S2RP dataset, whereas Stroppiana et al. (2022) [13] created separate Sentinel-2 perimeters for comparison with PlanetScope images. Finally, in our case, the PlanetScope perimeters have been manually refined to achieve the most accurate result possible.
The Planet composite, clip, and harmonization tools were highly beneficial to exploit the download quota and all the imagery of interest available as best as possible, even if conducting a statistically robust sampling was impractical due to the limitations of data scarcity and the non-systematic acquisition of PlanetScope data, which makes probability sampling, as with Sentinel-2, impossible. Therefore, the results are not generalizable to the entire dataset. Nevertheless, the procedure followed in the selection of comparison sites focused on best representing the biome variability in the S2RP dataset. Additionally, to minimize errors due to temporal imprecision, we ensured that the temporal length in all comparison sites was equal to or greater than 50 days. Besides, the selected validated sites exhibited high percentages of BA according to the S2RP dataset to ensure a significant BA for comparison. This procedure led to the comparison of 10 sites, each approximately 500 km2 in size, providing a more extensive representation of the predominant biomes in S2RP. Simultaneously, it ensured at least one comparison site for each biome.
The fact that the PlanetScope constellation captures a large volume of images over the Earth’s surface every day has facilitated the temporal alignment of PlanetScope perimeters with the S2RP period, and there are not significant misalignments in most of the sites. However, since the acquisition of PlanetScope scenes is not systematic, there are significant date misalignments over limited areas of different comparison sites. However, we do not have access to any other constellation with a systematic acquisition of images at this spatial resolution.
Similar to Stroppiana et al. (2022) [13], PlanetScope perimeters were extracted using a comparable approach to S2RP, adjusting the Random Forest algorithm to the PlanetScope bands, and the approach was satisfactory. Nevertheless, it should be noted that the fact that PlanetScope sensors do not capture electromagnetic energy in the SWIR wavelengths is a disadvantage compared to Sentinel-2 images. Having access to bands in the SWIR range would have allowed the calculation of burn indices such as NBR or NBR2, which would likely have further improved the classification.
The precision metrics obtained after comparing the PlanetScope perimeters with S2RP demonstrate overall satisfactory results, reflecting a significant agreement between both datasets (DC = 93.9%, Ce = 8.4%, Oe = 3.8%, relB = 5.0%). This shows a higher agreement than the obtained by Stroppiana et al. (2022) [13] in the comparison between their Sentinel-2 and PlanetScope derived BA fire perimeters in Subsaharan Africa (DC = 86.1%, Ce = 11.6%, Oe = 15.6%, RelB = −4.0%). The higher agreement obtained in our comparison could be related to the better temporal alignment of PlanetScope and Sentinel-2 time series in almost all comparison sites, minimizing the temporal errors compared to Stroppiana et al. (2022) [13].
Most of the comparison sites have also yielded results indicating a high agreement between both datasets, except for comparison site 8 in the Deserts & Xeric Shrublands biome, which exhibited the highest commission errors (Ce = 44.79%), along with relatively large omission errors (Oe = 13.63%). Upon visual analysis of the errors in this comparison site, they mostly occur on croplands (Figure 8). Similarly, in comparison site 10, located in the Mediterranean biome, it has also been observed that many of both commission and omission errors occur on croplands.
On the other hand, since most of the PlanetScope scenes comprising the first and last composite of the temporal series align perfectly or with a mismatch of just one day to the preceding and subsequent dates of S2RP, generally, not many errors caused by temporal misalignment between both datasets have been observed, except for comparison site 9 in the Temperate Forest biome. In this site, which has the highest Oe value (15.44%), errors caused by temporal mismatch have been observed in an area where the closing PlanetScope composite of the temporal series is created with scenes from three days later than the final date of S2RP (Figure 9).
Despite these errors due to the rapid loss of burned signal in croplands and temporal precision issues, most differences between both datasets are mainly due to the lower spatial resolution of S2RP (10 m) compared to the PlanetScope reference perimeters (3 m). This difference has allowed the PlanetScope perimeters to better detect small fires, as well as small unburned areas within large fires. Additionally, it has enabled more accurate delineation of the borders of the fires. Despite its limitations, PlanetScope imagery was effective to compare a subset of S2RP with a high spatial resolution product.
The validation of the global BA products showed an underestimation of BA in LAC, with high Oe and negative relB for both FireCCI51 (Oe = 56.4%, relB = −43.1%) and MCD64A1 (Oe = 57.6%, relB = −42.8%). FireCCI51 (DC = 55.6%, Ce = 23.3%) obtained slightly better results than MCDA64A1 (DC = 53.9%, Ce = 25.9%). There are different studies where accuracy metrics for both products have been calculated at different levels, such as for different regional scales and specific land uses [47,48], or only for a specific biome [49], some of them based on Sentinel-2 derived fire perimeters, similar to the accuracy assessment conducted by Katagis and Gitas (2022) [16] for Mediterranean ecosystems and the validation in croplands of Ukraine by Hall et al. (2021) [50]. However, there are fewer validation approaches in a continental scale utilizing Sentinel-2 imagery, and to the best of our knowledge, our validation using Sentinel-2 imagery for LAC is the first of its kind, while Stroppiana et al. (2022) [13] conducted a similar validation at a continental level but focused on Subsaharan Africa. Furthermore, other authors [11,14,15] conducted global validations employing Landsat imagery, which has a lower spatial resolution (30 m). We compare the accuracy metrics obtained on those global validations and on the validation for Subsaharan Africa with Sentinel-2 imagery [13] with the obtained on this study in Table 6. The results obtained for our study indicate in almost all metrics less precision for the global products than the studies of Stroppiana et al. (2022) [13] and Franquesa et al. (2022) [11], but better precision than Padilla et al. (2018) [14] and Boschetti et al. (2019) [15].
It must be said that the validation studies introduced in Table 6 are not ideal for comparing with each other since the reference sample units belong to different geographical areas, time periods, and sensors. However, such differences between different studies for the same global BA algorithms could not be explained exclusively by those factors. As suggested by Franquesa et al. (2022) [11], the main reason for the differences reported among different studies with a similar methodological approach could be attributed to the temporal length of the reference units. Franquesa et al. (2022) [11] employed reference units with a minimum temporal length of 48 days, and the median length exceeded 100 days. In the study by Stroppiana et al. (2022) [13], the minimum length was 35 days, and 86% of the reference units ranged from 100 and 200 days. In contrast, our study’s reference units generally have a shorter temporal length compared to Franquesa et al. (2022) [11] and Stroppiana et al. (2022) [13], with a minimum of only 5 days and a median of 70 days. This shorter period could be due to the generally higher cloud coverage of LAC compared to most of the extent of the rest of the globe. Nevertheless, the temporal length of our reference units is generally higher than that of Padilla et al. (2018) [14] and Boschetti et al. (2019) [15], where all reference units had temporal lengths between 8–16 days and 16 days, respectively. Thus, this analysis reinforces the idea that the use of longer reference units is preferable for validation exercises, to minimize the temporal imprecisions that are wrongly attributed to spatial disagreements.
By biomes, the best results in terms of DC were achieved for savannas (in Temperate Savanna: FireCCI51 DC = 66.7%, MCD64A1 DC = 67.3%; in Tropical Savanna: FireCCI51 DC = 62.7%, MCD64A1 DC = 60.6%). Meanwhile, the worst accuracy metrics were for Deserts and Xeric Shrublands, where omission errors were very high (FireCCI51 Oe = 98.0%, MCD64A1 Oe = 98.9%), most of them related to croplands and small fires. Nevertheless, the accuracy results by biome should be interpreted with caution for the Temperate Savanna, Deserts and Xeric Shrublands, Temperate Forest, and Mediterranean biomes, since only four samples are represented for each of them.
The Tropical Forest biome and the Tropical Savanna biome are better represented in S2RP, with 24 and 16 samples, respectively. In Table 7, commission and omission errors of FireCCI51 and MCD64A1 obtained for both biomes by our study and by Franquesa et al. (2022) [11] are illustrated. Since Franquesa et al. (2022) [11] validated both products for three different years, we have compared our metrics with the range of values obtained for those three years. The accuracy metrics obtained for the Tropical Forest biome are similar for both studies. Such low accuracies for this biome, with especially high omission errors, could be explained by the fact that tropical forests show a fast understory vegetation regrowth, and with the influence of unburned canopies in the spectral signal, complicating the detection of BA [34]. Regarding to the Tropical Savanna biome, metrics show a higher accuracy compared to the forest. Franquesa et al. (2022) [11] obtained in general slightly better precisions for that biome than in our study, especially related to omission errors. Nevertheless, the differences are always lower than 10%, and could be related to the different geographical area covered or to the sensors employed.
Finally, it must be noted that the reason why we used the FireCCI51 and MCD64A1 global BA products as examples of a validation approach is that since their accuracy assessment is largely addressed in the literature, it is possible to contextualize our validation results. Nevertheless, S2RP is suitable for validating any other BA product with a coarser spatial resolution (>10 m) that covers LAC for the year 2019.

5. Conclusions

S2RP is a database of reference fire perimeters in LAC for the year 2019, created using Sentinel-2 images. The database was developed following a statistically robust sampling methodology adapted to the Sentinel-2 tiling grid system [13], and a procedure was followed to ensure that the temporal period of the reference perimeters was as long as possible to minimize temporal errors when using these perimeters to validate BA products [11]. Not establishing rigid metadata-based criteria to discard tiles before sampling made it more representative of the Sentinel-2 tiles in LAC. Although the achieved temporal length is generally shorter than in other studies that adopted strict criteria, S2RP remains a valid database for validating global BA products. Its comparison with reference perimeters created using high-resolution PlanetScope images indicates high accuracy metrics. Although the comparison cannot be generalizable to the entire dataset, the results obtained after selecting comparison sites to account for the variability of S2RP biomes are favorable. Finally, S2RP has been used to validate the global products FireCCI51 and MCD64A1, yielding results that generally align well with previous validations for these products by different works. Notably, in comparison with other validation studies, global products in our research exhibited lower errors when compared to studies that used reference perimeters of shorter temporal length and higher errors when compared to studies that used perimeters of longer temporal length. This reinforces the idea that using perimeters of longer temporal length is advisable for spatial accuracy studies of global BA products. The S2RP database can be downloaded at https://doi.org/10.21950/GZU7II, accessed on 7 February 2024.

Supplementary Materials

The following supporting information can be downloaded at: https://www.mdpi.com/article/10.3390/rs16071166/s1, Table S1: Threshold values determined to each biome for the high/low fire activity stratification. The value was defined in the 80th percentile. Table S2: Total burned, unburned, and unobserved area, and corresponding percentage (%) for each biome. Table S3: The characteristics of the selected S2RP-PlanetScope comparison sites: n° and country of the site; the coordinates of the site centroid and its total area; the biome, burned, and unobserved percentage, and the period of the overlapping sample unit and its tile; and the PlanetScope period, number of PlanetScope scenes employed, and the composites downloaded.

Author Contributions

Conceptualization, A.B. and A.R.-M.; methodology, A.B., M.F., A.R.-M. and J.G.-I.; validation, A.B. and J.G.-I.; data curation, J.G.-I., M.F. and A.B.; writing—original draft preparation, J.G.-I.; writing—review and editing, A.B., J.G.-I. and M.F.; supervision, A.B.; project administration, A.B.; funding acquisition, A.B. All authors have read and agreed to the published version of the manuscript.

Funding

This research was funded by the University of the Basque Country (UPV/EHU) under the project “PES20/54”.

Data Availability Statement

Sentinel-2-based reference fire perimeters generated during the study can be found at https://doi.org/10.21950/GZU7II, accessed on 7 February 2024.

Acknowledgments

We thank the Planet Team for the provision of PlanetScope images and for the technical support received.

Conflicts of Interest

The authors declare no conflicts of interest. The funders had no role in the design of the study; in the collection, analyses, or interpretation of data; in the writing of the manuscript; or in the decision to publish the results.

References

  1. Giglio, L.; Boschetti, L.; Roy, D.P.; Humber, M.L.; Justice, C.O. The Collection 6 MODIS Burned Area Mapping Algorithm and Product. Remote Sens. Environ. 2018, 217, 72–85. [Google Scholar] [CrossRef]
  2. Lizundia-Loiola, J.; Otón, G.; Ramo, R.; Chuvieco, E. A Spatio-Temporal Active-Fire Clustering Approach for Global Burned Area Mapping at 250 m from MODIS Data. Remote Sens. Environ. 2020, 236, 111493. [Google Scholar] [CrossRef]
  3. Otón, G.; Ramo, R.; Lizundia-Loiola, J.; Chuvieco, E. Global Detection of Long-Term (1982–2017) Burned Area with AVHRR-LTDR Data. Remote Sens. 2019, 11, 2079. [Google Scholar] [CrossRef]
  4. Otón, G.; Lizundia-Loiola, J.; Pettinari, M.L.; Chuvieco, E. Development of a Consistent Global Long-Term Burned Area Product (1982–2018) Based on AVHRR-LTDR Data. Int. J. Appl. Earth Obs. Geoinf. 2021, 103, 102473. [Google Scholar] [CrossRef]
  5. Alonso-Canas, I.; Chuvieco, E. Global Burned Area Mapping from ENVISAT-MERIS and MODIS Active Fire Data. Remote Sens. Environ. 2015, 163, 140–152. [Google Scholar] [CrossRef]
  6. Chuvieco, E.; Yue, C.; Heil, A.; Mouillot, F.; Alonso-Canas, I.; Padilla, M.; Pereira, J.M.; Oom, D.; Tansey, K. A New Global Burned Area Product for Climate Assessment of Fire Impacts. Glob. Ecol. Biogeogr. 2016, 25, 619–629. [Google Scholar] [CrossRef]
  7. Potter, C. Recovery Rates of Wetland Vegetation Greenness in Severely Burned Ecosystems of Alaska Derived from Satellite Image Analysis. Remote Sens. 2018, 10, 1456. [Google Scholar] [CrossRef]
  8. Van Wees, D.; Van Der Werf, G.R.; Randerson, J.T.; Rogers, B.M.; Chen, Y.; Veraverbeke, S.; Giglio, L.; Morton, D.C. Global Biomass Burning Fuel Consumption and Emissions at 500 m Spatial Resolution Based on the Global Fire Emissions Database (GFED). Geosci. Model. Dev. 2022, 15, 8411–8437. [Google Scholar] [CrossRef]
  9. Yang, S.; Zeng, A.; Tigabu, M.; Wang, G.; Zhang, Z.; Zhu, H.; Guo, F. Investigating Drought Events and Their Consequences in Wildfires: An Application in China. Fire 2023, 6, 223. [Google Scholar] [CrossRef]
  10. Bedair, H.; Alghariani, M.S.; Omar, E.; Anibaba, Q.A.; Remon, M.; Bornman, C.; Kiboi, S.K.; Rady, H.A.; Salifu, A.-M.A.; Ghosh, S.; et al. Global Warming Status in the African Continent: Sources, Challenges, Policies, and Future Direction. Int. J. Environ. Res. 2023, 17, 45. [Google Scholar] [CrossRef]
  11. Franquesa, M.; Lizundia-Loiola, J.; Stehman, S.V.; Chuvieco, E. Using Long Temporal Reference Units to Assess the Spatial Accuracy of Global Satellite-Derived Burned Area Products. Remote Sens. Environ. 2022, 269, 112823. [Google Scholar] [CrossRef]
  12. Boschetti, L.; Roy, D.P.; Justice, C.O. International Global Burned Area Satellite Product Validation Protocol Part I-Production and Standardization of Validation Reference Data (to Be Followed by Part II-Accuracy Reporting); Committee on Earth Observation Satellites: College Park, MD, USA, 2009. [Google Scholar]
  13. Stroppiana, D.; Sali, M.; Busetto, L.; Boschetti, M.; Ranghetti, L.; Franquesa, M.; Pettinari, M.L.; Chuvieco, E. Sentinel-2 Sampling Design and Reference Fire Perimeters to Assess Accuracy of Burned Area Products over Sub-Saharan Africa for the Year 2019. ISPRS J. Photogramm. Remote Sens. 2022, 191, 223–234. [Google Scholar] [CrossRef]
  14. Padilla, M.; Wheeler, J.; Tansey, K. ESA Climate Change Initiative-Fire_cci D4.1.1 Product Validation Report, Version 2.1. 2018. Available online: https://climate.esa.int/media/documents/Fire_cci_D4.1.1_PVR_v2.1.pdf (accessed on 25 January 2024).
  15. Boschetti, L.; Roy, D.P.; Giglio, L.; Huang, H.; Zubkova, M.; Humber, M.L. Global Validation of the Collection 6 MODIS Burned Area Product. Remote Sens. Environ. 2019, 235, 111490. [Google Scholar] [CrossRef]
  16. Katagis, T.; Gitas, I.Z. Assessing the Accuracy of MODIS MCD64A1 C6 and FireCCI51 Burned Area Products in Mediterranean Ecosystems. Remote Sens. 2022, 14, 602. [Google Scholar] [CrossRef]
  17. Franquesa, M.; Vanderhoof, M.K.; Stavrakoudis, D.; Gitas, I.Z.; Roteta, E.; Padilla, M.; Chuvieco, E. Development of a Standard Database of Reference Sites for Validating Global Burned Area Products. Earth Syst. Sci. Data 2020, 12, 3229–3246. [Google Scholar] [CrossRef]
  18. Padilla, M.; Stehman, S.V.; Chuvieco, E. Validation of the 2008 MODIS-MCD45 Global Burned Area Product Using Stratified Random Sampling. Remote Sens. Environ. 2014, 144, 187–196. [Google Scholar] [CrossRef]
  19. Padilla, M.; Stehman, S.V.; Ramo, R.; Corti, D.; Hantson, S.; Oliva, P.; Alonso-Canas, I.; Bradley, A.V.; Tansey, K.; Mota, B.; et al. Comparing the Accuracies of Remote Sensing Global Burned Area Products Using Stratified Random Sampling and Estimation. Remote Sens. Environ. 2015, 160, 114–121. [Google Scholar] [CrossRef]
  20. Padilla, M.; Olofsson, P.; Stehman, S.V.; Tansey, K.; Chuvieco, E. Stratification and Sample Allocation for Reference Burned Area Data. Remote Sens. Environ. 2017, 203, 240–255. [Google Scholar] [CrossRef]
  21. Chuvieco, E.; Lizundia-Loiola, J.; Lucrecia Pettinari, M.; Ramo, R.; Padilla, M.; Tansey, K.; Mouillot, F.; Laurent, P.; Storm, T.; Heil, A.; et al. Generation and Analysis of a New Global Burned Area Product Based on MODIS 250 m Reflectance Bands and Thermal Anomalies. Earth Syst. Sci. Data 2018, 10, 2015–2031. [Google Scholar] [CrossRef]
  22. Kennedy, R.E.; Yang, Z.; Cohen, W.B. Detecting Trends in Forest Disturbance and Recovery Using Yearly Landsat Time Series: 1. LandTrendr—Temporal Segmentation Algorithms. Remote Sens. Environ. 2010, 114, 2897–2910. [Google Scholar] [CrossRef]
  23. Cohen, W.B.; Yang, Z.; Kennedy, R. Detecting Trends in Forest Disturbance and Recovery Using Yearly Landsat Time Series: 2. TimeSync—Tools for Calibration and Validation. Remote Sens. Environ. 2010, 114, 2911–2924. [Google Scholar] [CrossRef]
  24. Gallego Pinilla, F.J. Stratified Sampling of Satellite Images with a Systematic Grid of Points. ISPRS J. Photogramm. Remote Sens. 2005, 59, 369–376. [Google Scholar] [CrossRef]
  25. Gonzalez-Ibarzabal, J.; Bastarrika, A.; Franquesa Fuentetaja, M.; Rodriguez-Montellano, A. RP_LAC_2019_S2: Reference Fire Perimeters Obtained from Sentinel-2 Imagery over Latin America and Caribbean for the Year 2019. e-cienciaDatos, V2. Available online: https://edatos.consorciomadrono.es/dataset.xhtml?persistentId=doi:10.21950/GZU7II (accessed on 10 January 2024).
  26. European Space Agency Sentinel Online: Sentinel-2. Available online: https://sentinels.copernicus.eu/web/sentinel/copernicus/sentinel-2 (accessed on 15 January 2024).
  27. Dinerstein, E.; Olson, D.; Joshi, A.; Vynne, C.; Burgess, N.D.; Wikramanayake, E.; Hahn, N.; Palminteri, S.; Hedao, P.; Noss, R.; et al. An Ecoregion-Based Approach to Protecting Half the Terrestrial Realm. Bioscience 2017, 67, 534–545. [Google Scholar] [CrossRef] [PubMed]
  28. Olson, D.M.; Dinerstein, E.; Wikramanayake, E.D.; Burgess, N.D.; Powell, G.V.N.; Underwood, E.C.; D’amico, J.A.; Itoua, I.; Strand, H.E.; Morrison, J.C.; et al. Terrestrial Ecoregions of the World: A New Map of Life on Earth: A New Global Map of Terrestrial Ecoregions Provides an Innovative Tool for Conserving Biodiversity. Bioscience 2001, 51, 933–938. [Google Scholar] [CrossRef]
  29. Planet PlanetScope Product Specifications. 2023. Available online: https://assets.planet.com/docs/Planet_PSScene_Imagery_Product_Spec_letter_screen.pdf (accessed on 10 January 2024).
  30. Frazier, A.E.; Hemingway, B.L. A Technical Review of Planet Smallsat Data: Practical Considerations for Processing and Using Planetscope Imagery. Remote Sens. 2021, 13, 3930. [Google Scholar] [CrossRef]
  31. Olofsson, P.; Foody, G.M.; Herold, M.; Stehman, S.V.; Woodcock, C.E.; Wulder, M.A. Good Practices for Estimating Area and Assessing Accuracy of Land Change. Remote Sens. Environ. 2014, 148, 42–57. [Google Scholar] [CrossRef]
  32. Boschetti, L.; Stehman, S.V.; Roy, D.P. A Stratified Random Sampling Design in Space and Time for Regional to Global Scale Burned Area Product Validation. Remote Sens. Environ. 2016, 186, 465–478. [Google Scholar] [CrossRef] [PubMed]
  33. Roteta, E.; Bastarrika, A.; Franquesa, M.; Chuvieco, E. Landsat and Sentinel-2 Based Burned Area Mapping Tools in Google Earth Engine. Remote Sens. 2021, 13, 816. [Google Scholar] [CrossRef]
  34. Melchiorre, A.; Boschetti, L. Global Analysis of Burned Area Persistence Time with MODIS Data. Remote Sens. 2018, 10, 750. [Google Scholar] [CrossRef]
  35. Breiman, L. Random Forests. Mach. Learn. 2001, 45, 5–32. [Google Scholar] [CrossRef]
  36. Schroeder, W.; Oliva, P.; Giglio, L.; Csiszar, I.A. The New VIIRS 375m Active Fire Detection Data Product: Algorithm Description and Initial Assessment. Remote Sens. Environ. 2014, 143, 85–96. [Google Scholar] [CrossRef]
  37. Giglio, L.; Schroeder, W.; Justice, C.O. The Collection 6 MODIS Active Fire Detection Algorithm and Fire Products. Remote Sens. Environ. 2016, 178, 31–41. [Google Scholar] [CrossRef] [PubMed]
  38. Coffelt, J.L.; Livingston, R.K. Second U.S. Geological Survey Wildland Fire Workshop: Los Alamos, New Mexico, October 31–November 3, 2000; U.S. Geological Survey: Denver, CO, USA, 2002. [CrossRef]
  39. USGS Landsat Normalized Burn Ratio 2. Available online: https://www.usgs.gov/landsat-missions/landsat-normalized-burn-ratio-2 (accessed on 26 January 2024).
  40. Rouse, J.W.; Haas, R.H.; Schell, J.A.; Deering, D.W. Monitoring vegetation systems in the great plains with ERTS. In Proceedings of the Third Earth Resources Technology Satellite-1 Symposium, NASA SP-351, Washington, DC, USA, 10–14 December 1973; Volume 1. Secttion A. [Google Scholar]
  41. Planet Labs PBC Developers Planet Orders API Tools. Available online: https://developers.planet.com/apis/orders/tools/ (accessed on 26 January 2024).
  42. Kington, J.; Collison, A. Scene Level Normalization and Harmonization of Planet Dove Imagery. 2022. Available online: https://assets.planet.com/docs/scene_level_normalization_of_planet_dove_imagery.pdf (accessed on 20 December 2023).
  43. Dice, L.R. Measures of the Amount of Ecologic Association Between Species. Ecology 1945, 26, 297–302. [Google Scholar] [CrossRef]
  44. Filipponi, F. Exploitation of Sentinel-2 Time Series to Map Burned Areas at the National Level: A Case Study on the 2017 Italy Wildfires. Remote Sens. 2019, 11, 622. [Google Scholar] [CrossRef]
  45. Hawbaker, T.J.; Vanderhoof, M.K.; Beal, Y.-J.; Takacs, J.D.; Schmidt, G.L.; Falgout, J.T.; Williams, B.; Fairaux, N.M.; Caldwell, M.K.; Picotte, J.J.; et al. Mapping Burned Areas Using Dense Time-Series of Landsat Data. Remote Sens. Environ. 2017, 198, 504–522. [Google Scholar] [CrossRef]
  46. Long, T.; Zhang, Z.; He, G.; Jiao, W.; Tang, C.; Wu, B.; Zhang, X.; Wang, G.; Yin, R. 30m Resolution Global Annual Burned Area Mapping Based on Landsat Images and Google Earth Engine. Remote Sens. 2019, 11, 489. [Google Scholar] [CrossRef]
  47. Vetrita, Y.; Cochrane, M.A.; Suwarsono; Priyatna, M.; Sukowati, K.A.D.; Khomarudin, M.R. Evaluating Accuracy of Four MODIS-Derived Burned Area Products for Tropical Peatland and Non-Peatland Fires. Environ. Res. Lett. 2021, 16, 035015. [Google Scholar] [CrossRef]
  48. Jiao, M.; Quan, X.W.; Yao, J.S. Evaluation of Four Satellite-Derived Fire Products in the Fire-Prone, Cloudy, and Mountainous Area Over Subtropical China. IEEE Geosci. Remote Sens. Lett. 2022, 19, 6513405. [Google Scholar] [CrossRef]
  49. Campagnolo, M.L.; Libonati, R.; Rodrigues, J.A.; Pereira, J.M.C. A Comprehensive Characterization of MODIS Daily Burned Area Mapping Accuracy across Fire Sizes in Tropical Savannas. Remote Sens. Environ. 2021, 252, 112115. [Google Scholar] [CrossRef]
  50. Hall, J.V.; Argueta, F.; Giglio, L. Validation of MCD64A1 and FireCCI51 Cropland Burned Area Mapping in Ukraine. Int. J. Appl. Earth Obs. Geoinf. 2021, 102, 102443. [Google Scholar] [CrossRef]
Figure 1. Scheme of the sampling design methodology employed.
Remotesensing 16 01166 g001
Figure 2. Scheme of the Sentinel-2 reference fire perimeters’ extraction methodology.
Remotesensing 16 01166 g002
Figure 3. Scheme of the PlanetScope fire perimeters’ extraction methodology.
Remotesensing 16 01166 g003
Figure 4. The 1292 sampling units of the population stratified by biome. In black, the selected 56 sample units stratified by high or low fire activity. The blank spaces in the map belong to the Sentinel-2 tiles discarded, since they were not suitable to use as sampling units.
Remotesensing 16 01166 g004
Figure 5. Temporal length distribution of generated reference data in days across different biomes. The box extends from the Q1 to Q3 quartile values of the data and the green line is the median value (Q2). Whiskers extend to 1.5 times the interquartile range (Q3–Q1), and the circles are outliers.
Remotesensing 16 01166 g005
Figure 6. Location of the selected comparison sites, their biome, and identification number.
Remotesensing 16 01166 g006
Figure 7. Example of cloud masking for a central region of the 19NGH tile, on 10 January 2019. The masked regions are those areas in black. (a) The image without masking (the darkest zones are cloud shadows); (b) the same image masked employing B1 threshold; and (c) the image masked based on Roteta et al. (2021) [33], utilizing the Scene Classification Layer (SCL).
Remotesensing 16 01166 g007
Figure 8. Agreement map of the comparison site 8 of Deserts & Xeric Shrublands biome.
Remotesensing 16 01166 g008
Figure 9. Illustration of the omission errors caused by a temporal delay in the final dates of the PlanetScope composite in a region of the comparison site 10, of Temperate Forest biome. (a) The PlanetScope difference image of the last PlanetScope reference short unit (dates: 10 March 2019 to 2 April 2019); (b) the Sentinel-2 difference image of the last S2RP short unit (dates: 20 March 2019 to 30 March 2019); and (c) the agreement map between both datasets.
Remotesensing 16 01166 g009
Table 1. BA confusion matrix. Rows represent BA products classification and columns the reference fire perimeters classification. A represents the area, where A 11   a n d   A 22 correspond to the agreement for the burned and unburned categories, respectively. Meanwhile, A 12   (commission error, burned for the product class and unburned for the reference class) and A 21   (omission error, unburned for the product class and burned for the reference class) represent disagreement. A 1 + and A 2 + represent, respectively, the total burned and unburned area for the product classification, while A + 1 and A + 2 represent, respectively, the total burned and unburned area for the reference classification. A t represents the total area interpreted.
Reference ClassTotal
BurnedUnburned
Product ClassBurned A 11 A 12 A 1 +
Unburned A 21 A 22 A 2 +
Total A + 1 A + 2 A t
Table 2. Accuracy metrics computed from the confusion matrix.
Accuracy MetricFormula
Commission error C e = A 12 A 1 +
Omission error O e = A 21 A + 1
Dice Coefficient D C = 2 A 11 2 A 11 + A 12 + A 21
Relative Bias r e l B = A 12 A 21 A + 1
Table 3. For each biome and high/low fire activity stratum, the number of sampling units in the population (Nh) and the number of the ones selected as sample units (nh).
High Fire StratumLow Fire StratumTotal
Biome StratumNhnhNhnhNhnh
Tropical Forest141105641470524
Tropical Savanna5462131026716
Temperate Savanna38215321914
Deserts & Xeric Shrublands172672844
Temperate Forest62252314
Mediterranean32112144
Total25924103332129256
Table 4. Accuracy metrics [%] calculated for all comparison sites and by biome for S2RP.
SiteS2RP TileDC [%]Ce [%]Oe [%]relB [%]BiomeDC [%]Ce [%]Oe [%]relB [%]
122LEQ96.85.50.85.0Tropical
Forest
94.87.82.55.8
220LMK90.814.53.113.3
321JWM92.97.76.61.2
422LDL97.34.11.32.9Tropical
Savanna
95.66.42.44.3
519PGK92.310.15.15.5
619NEJ94.68.91.58.1
720HLB97.72.81.81.0Temperate Savanna97.72.81.81.0
811SPR67.444.813.656.4Deserts & Xeric Shrublands67.444.813.656.4
919HBT89.35.515.4−10.5Temperate Forest89.35.515.4−10.5
1019HBV89.813.76.38.6Mediterranean89.813.76.38.6
TOTAL93.98.43.85.0
Table 5. Estimated accuracy metrics [%] and their standard error in parentheses by biome for the FireCCI51 and MCD64A1 global BA products.
Product
FIRECCI51MCD64A1
BiomeDC [%]Ce [%]Oe [%]relB [%]DC [%]Ce [%]Oe [%]relB [%]
Tropical Forest39.1
(10.8)
30.2
(5.9)
72.8
(9.9)
−61.1
(12.2)
38.9
(8.3)
35.2
(7.1)
72.2
(7.3)
−57.1
(7.5)
Tropical Savanna62.7
(8.6)
20.5
(4.3)
48.3
(10.0)
−34.9
(9.3)
60.6
(9.3)
23.1
(5.0)
50.0
(11.0)
−35.0
(11.1)
Temperate Savanna66.7
(8.7)
32.8
(9.0)
33.8
(9.4)
−1.4
(8.6)
67.3
(11.3)
23.3
(4.9)
40.0
(15.1)
−21.8
(15.1)
Deserts & Xeric Shrublands3.9
(2.8)
40.8
(10.7)
98.0
(1.5)
−96.6
(2.6)
2.1
(1.8)
70.3
(25.6)
98.9
(0.9)
−96.2
(0.3)
Temperate Forest52.3
(8.6)
35.1
(3.5)
56.2
(10.4)
−32.4
(12.4)
29.9
(19.2)
23.5
(0.7)
81.4
(14.8)
−75.7
(19.1)
Mediterranean43.4
(2.0)
39.8
(1.9)
66.1
(2.2)
−43.7
(3.7)
50.9
(11.6)
19.9
(4.3)
62.7
(11.5)
−53.5
(11.9)
Total55.6
(7.2)
23.3
(3.9)
56.4
(7.7)
−43.1
(7.6)
53.9
(7.5)
25.9
(4.3)
57.6
(8.0)
−42.8
(8.1)
Table 6. Accuracy metrics of FireCCI51 and MCD64A1 obtained by Boschetti et al. (2019) [15], Franquesa et al. (2022) [11], Padilla et al. (2018) [14], Stroppiana et al. (2022) [13], and this study. All metrics are expressed in percentages.
FIRECCI51MCD64A1
MetricThis StudyStroppiana et al. (2022) [13] Franquesa et al. (2022) [11]Padilla et al. (2018) [14]This StudyStroppiana et al. (2022) [13]Franquesa et al. (2022) [11]Padilla et al. (2018) [14]Boschetti et al. (2018) [15]
DC [%]5660672854586248-
Ce [%]232519542621193540
Oe [%]564943675854496273
relB [%]−43−32−29−28−43−42−38−41−54
Table 7. Commission and omission errors [%] of FireCCI51 and MCD64A1 obtained by Franquesa et al. (2022) [11] and this study for the Tropical Forest and the Tropical Savanna biomes. The range of values of the study of Franquesa et al. (2022) [11] expresses the minimum and maximum between the three years validated.
FireCCI51MCD64A1
Ce [%]Oe [%]Ce [%]Oe [%]
BiomeThis
Study
Franquesa et al. (2022) [11]This
Study
Franquesa et al. (2022) [11]This
Study
Franquesa et al. (2022) [11]This
Study
Franquesa et al. (2022) [11]
Tropical forest30.222.0–34.072.866.7–72.235.220.6–35.772.770.9–78.6
Tropical Savanna20.515.1–20.648.334.8–39.923.113.8–22.750.039.9–45.2
Disclaimer/Publisher’s Note: The statements, opinions and data contained in all publications are solely those of the individual author(s) and contributor(s) and not of MDPI and/or the editor(s). MDPI and/or the editor(s) disclaim responsibility for any injury to people or property resulting from any ideas, methods, instructions or products referred to in the content.

