
Near-Surface Geophysical Characterization of a Marble Deposit to Promote a Sustainable Small-Scale Mining

 , , ,
, , ,
Abstract
:
1. Introduction
2. Geology of the Study Area
3. Materials and Methods
3.1. Geophysical Methods
3.1.1. Electrical Resistivity
3.1.2. Capacitive Resistivity
3.1.3. Transient Electromagnetic (TEM)
3.1.4. Ground Penetration Radar (GPR)
3.2. Acquisition and Processing of Geophysical Data
3.2.1. Electrical Resistivity
3.2.2. Capacitive Resistivity
3.2.3. TEM
3.2.4. GPR
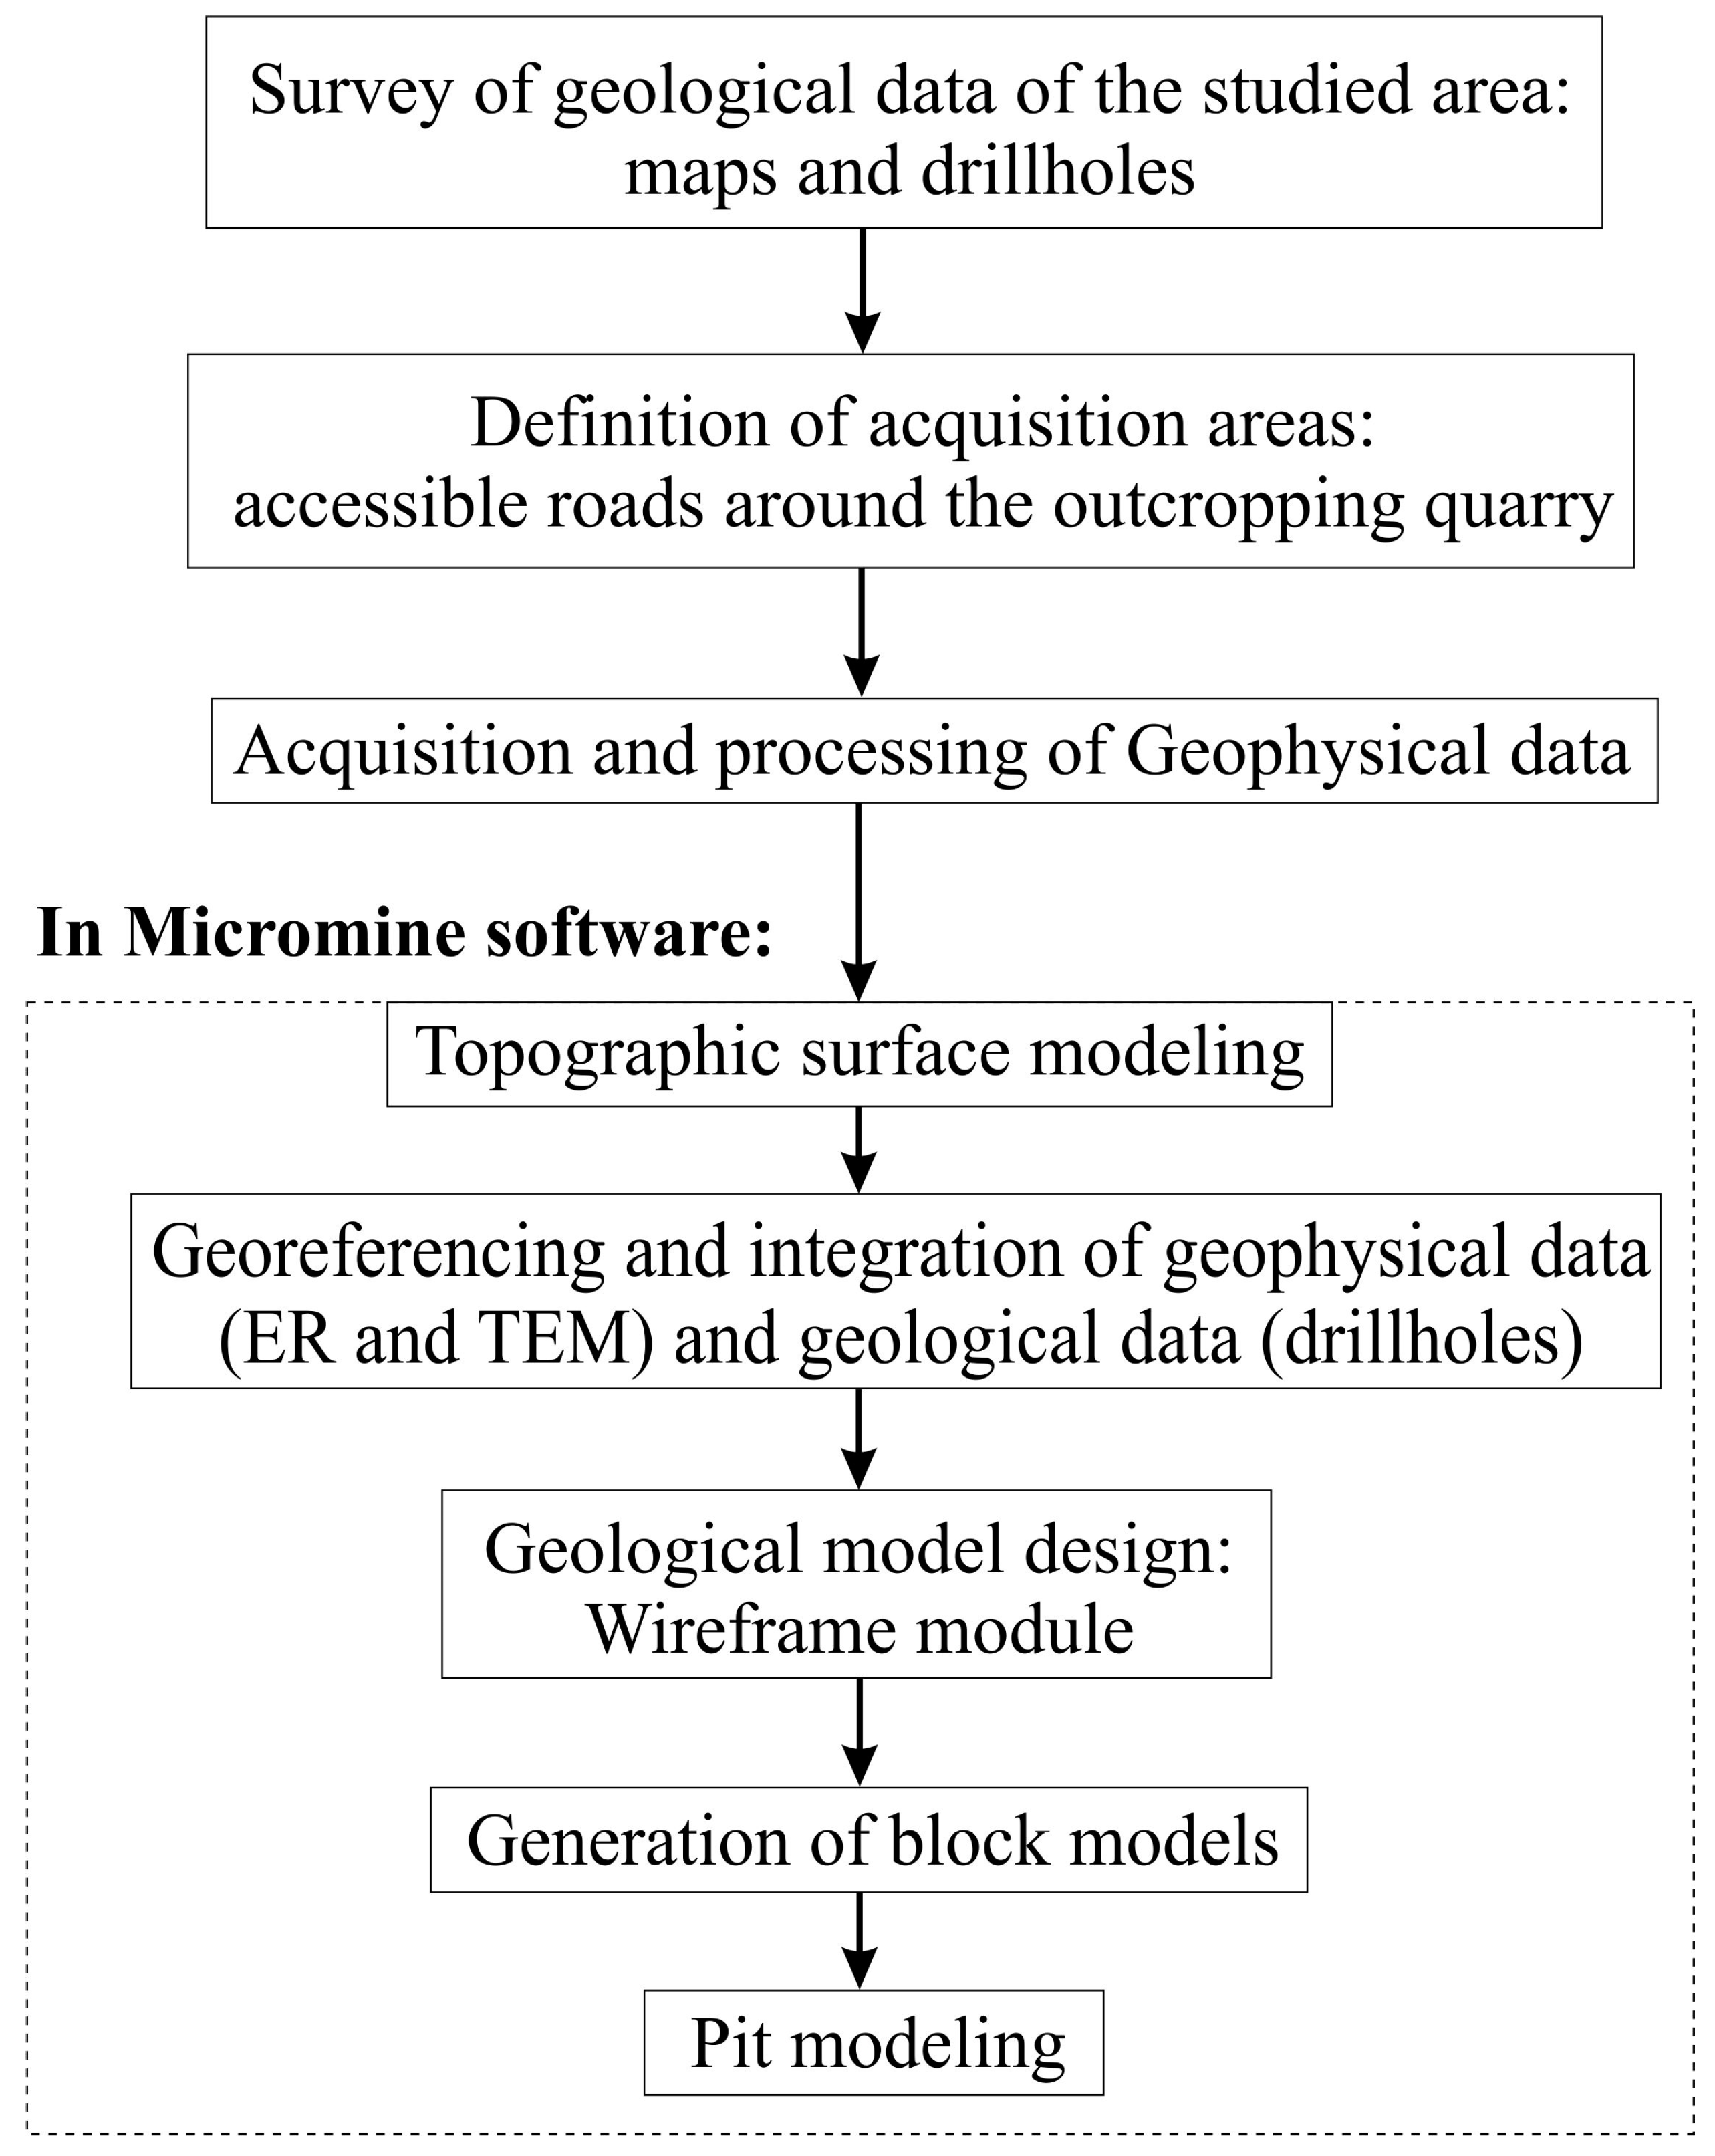
3.3. Geological and Conceptual Pit Models
4. Results and Interpretation
4.1. Geophysical Characterization
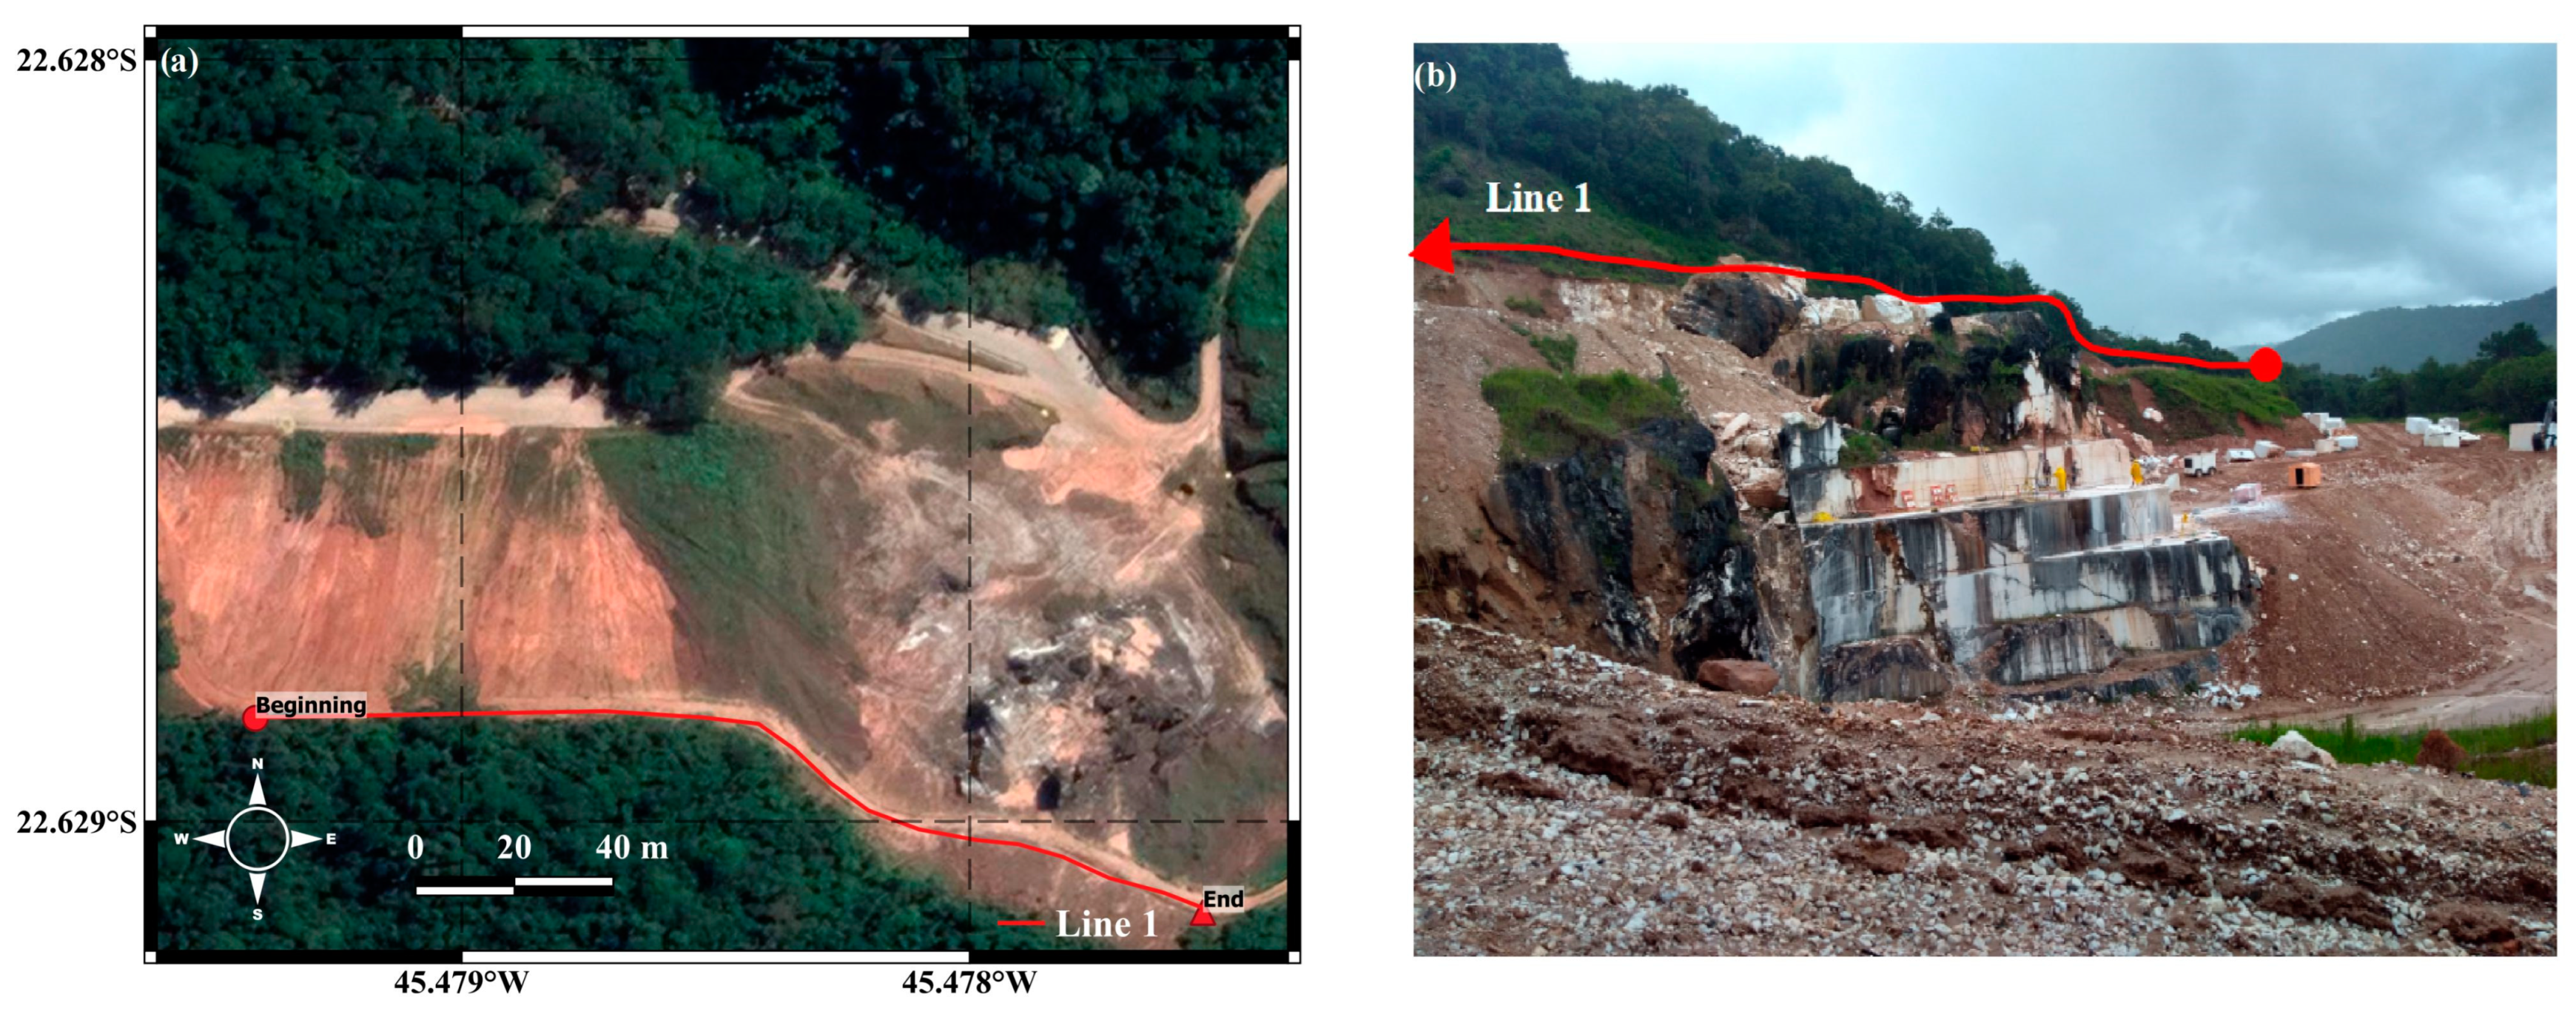
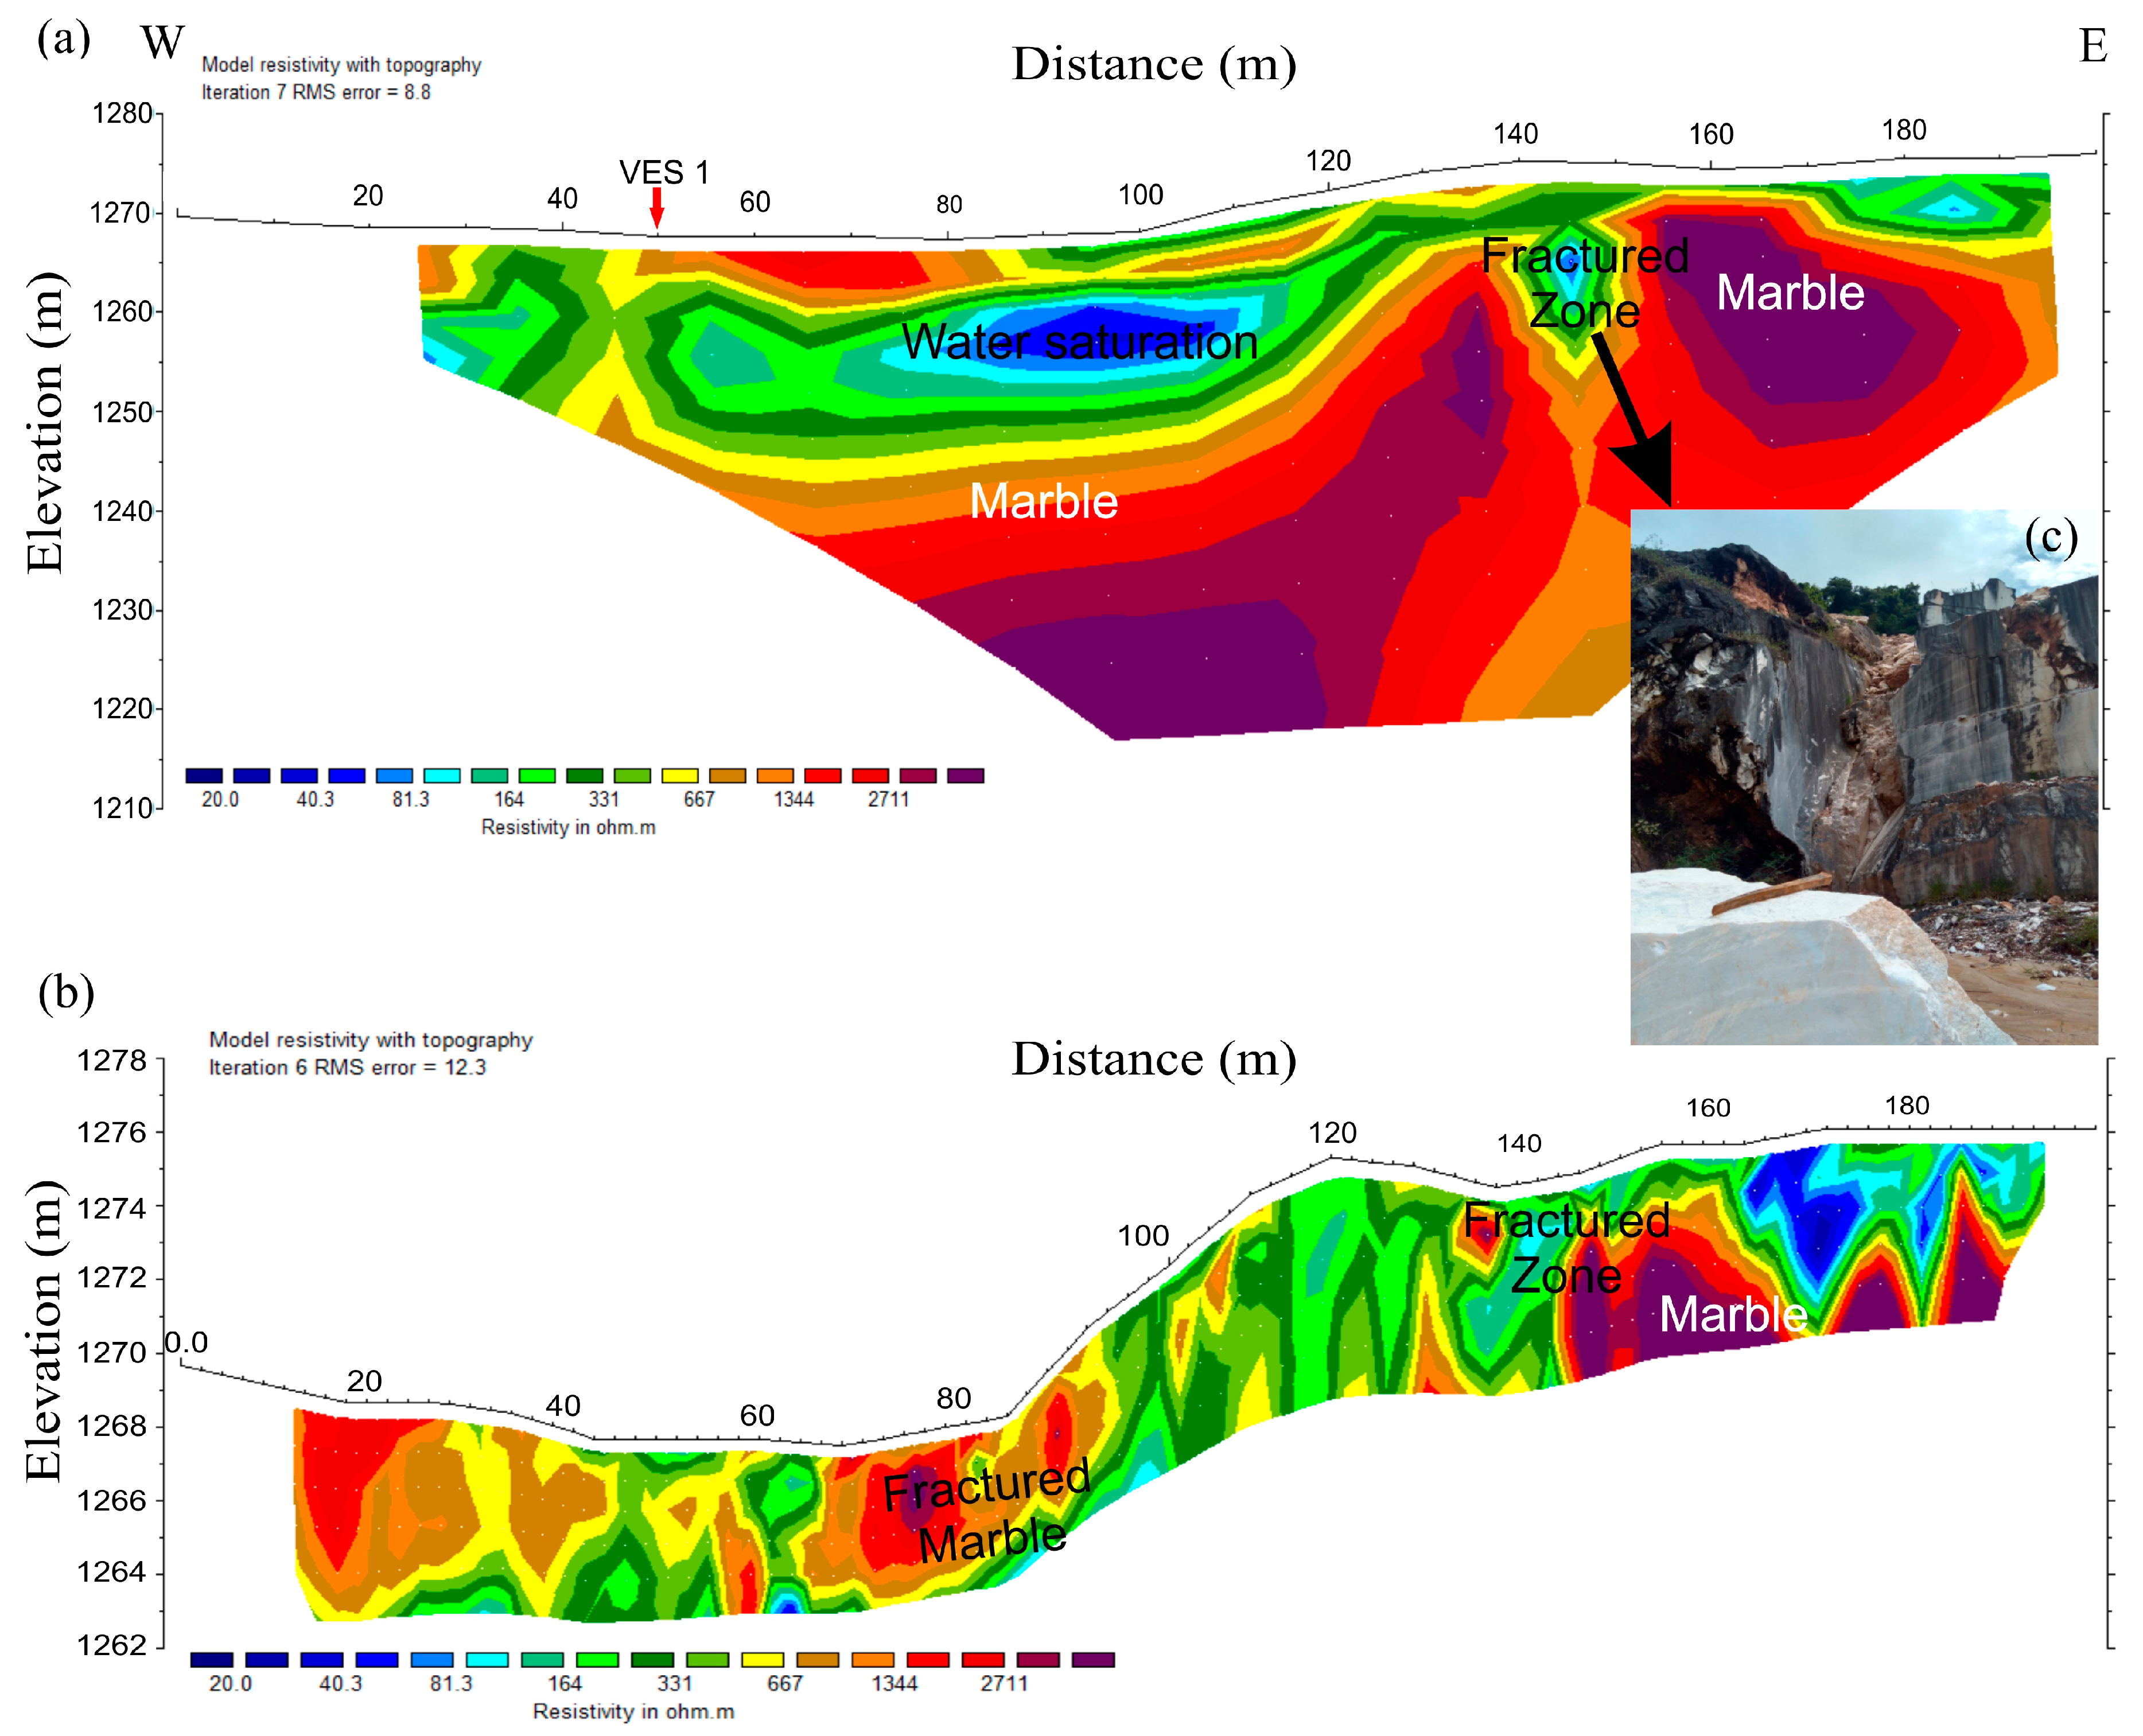
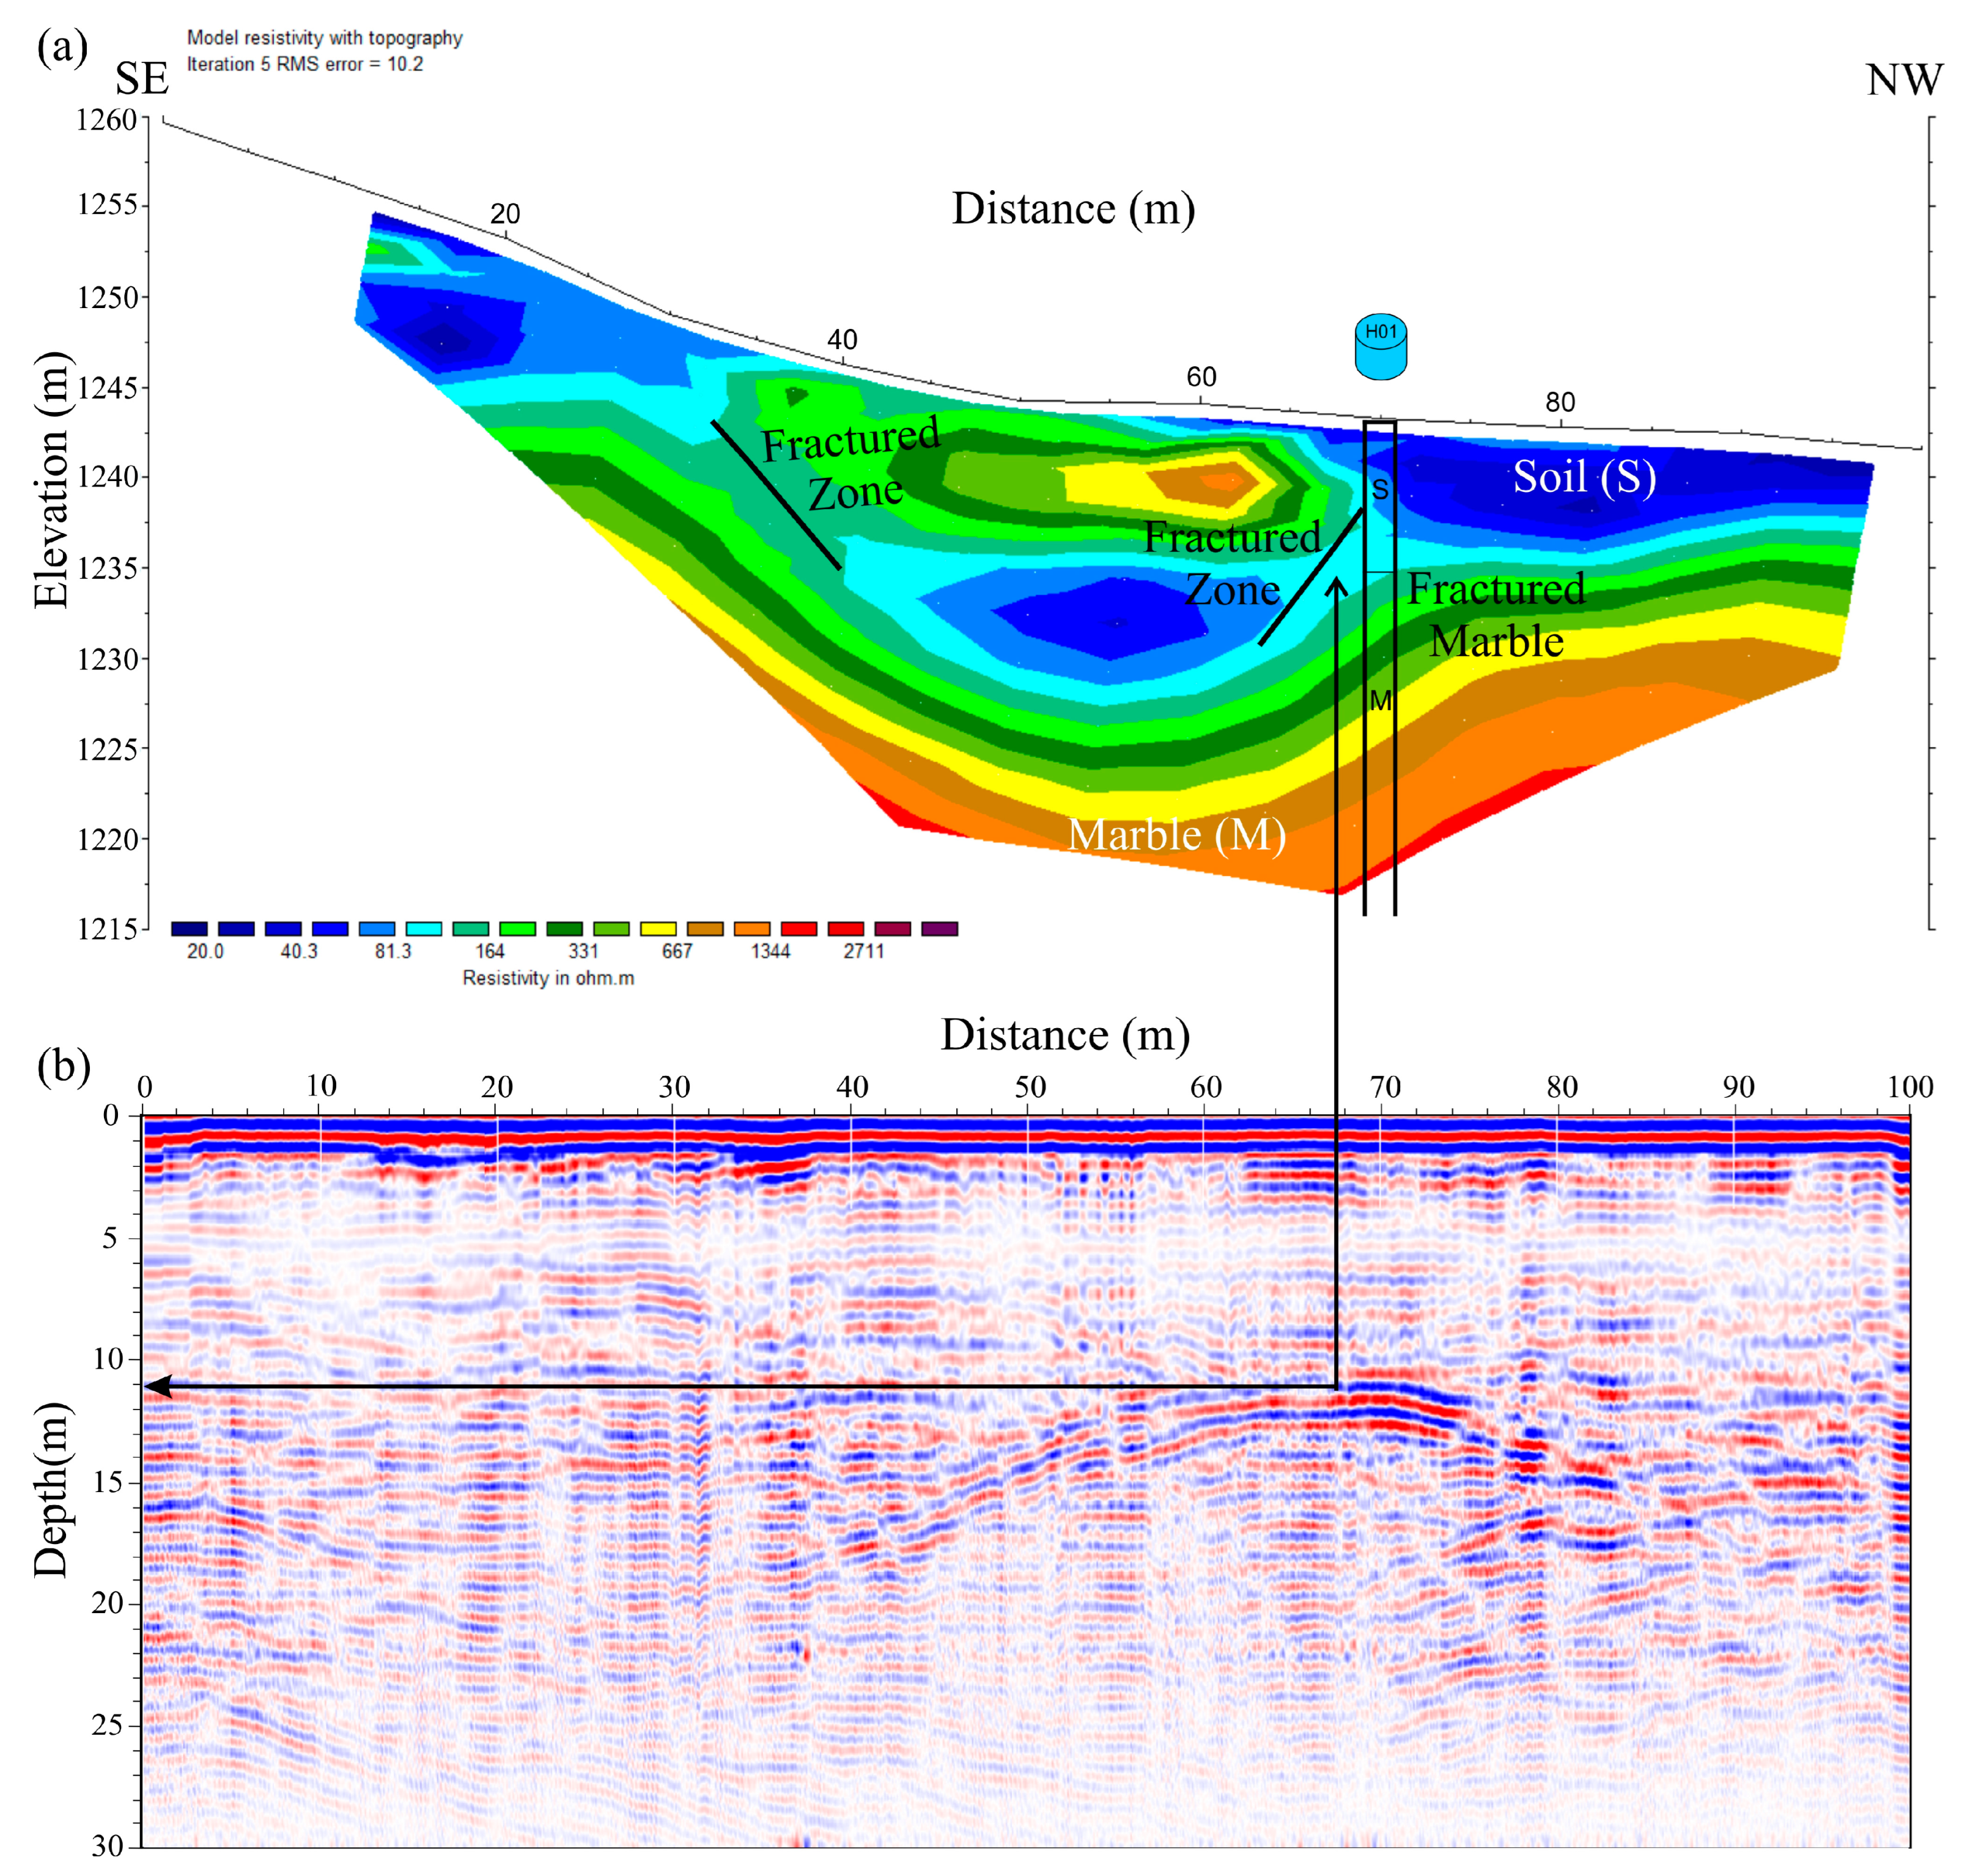
4.1.1. Line 1
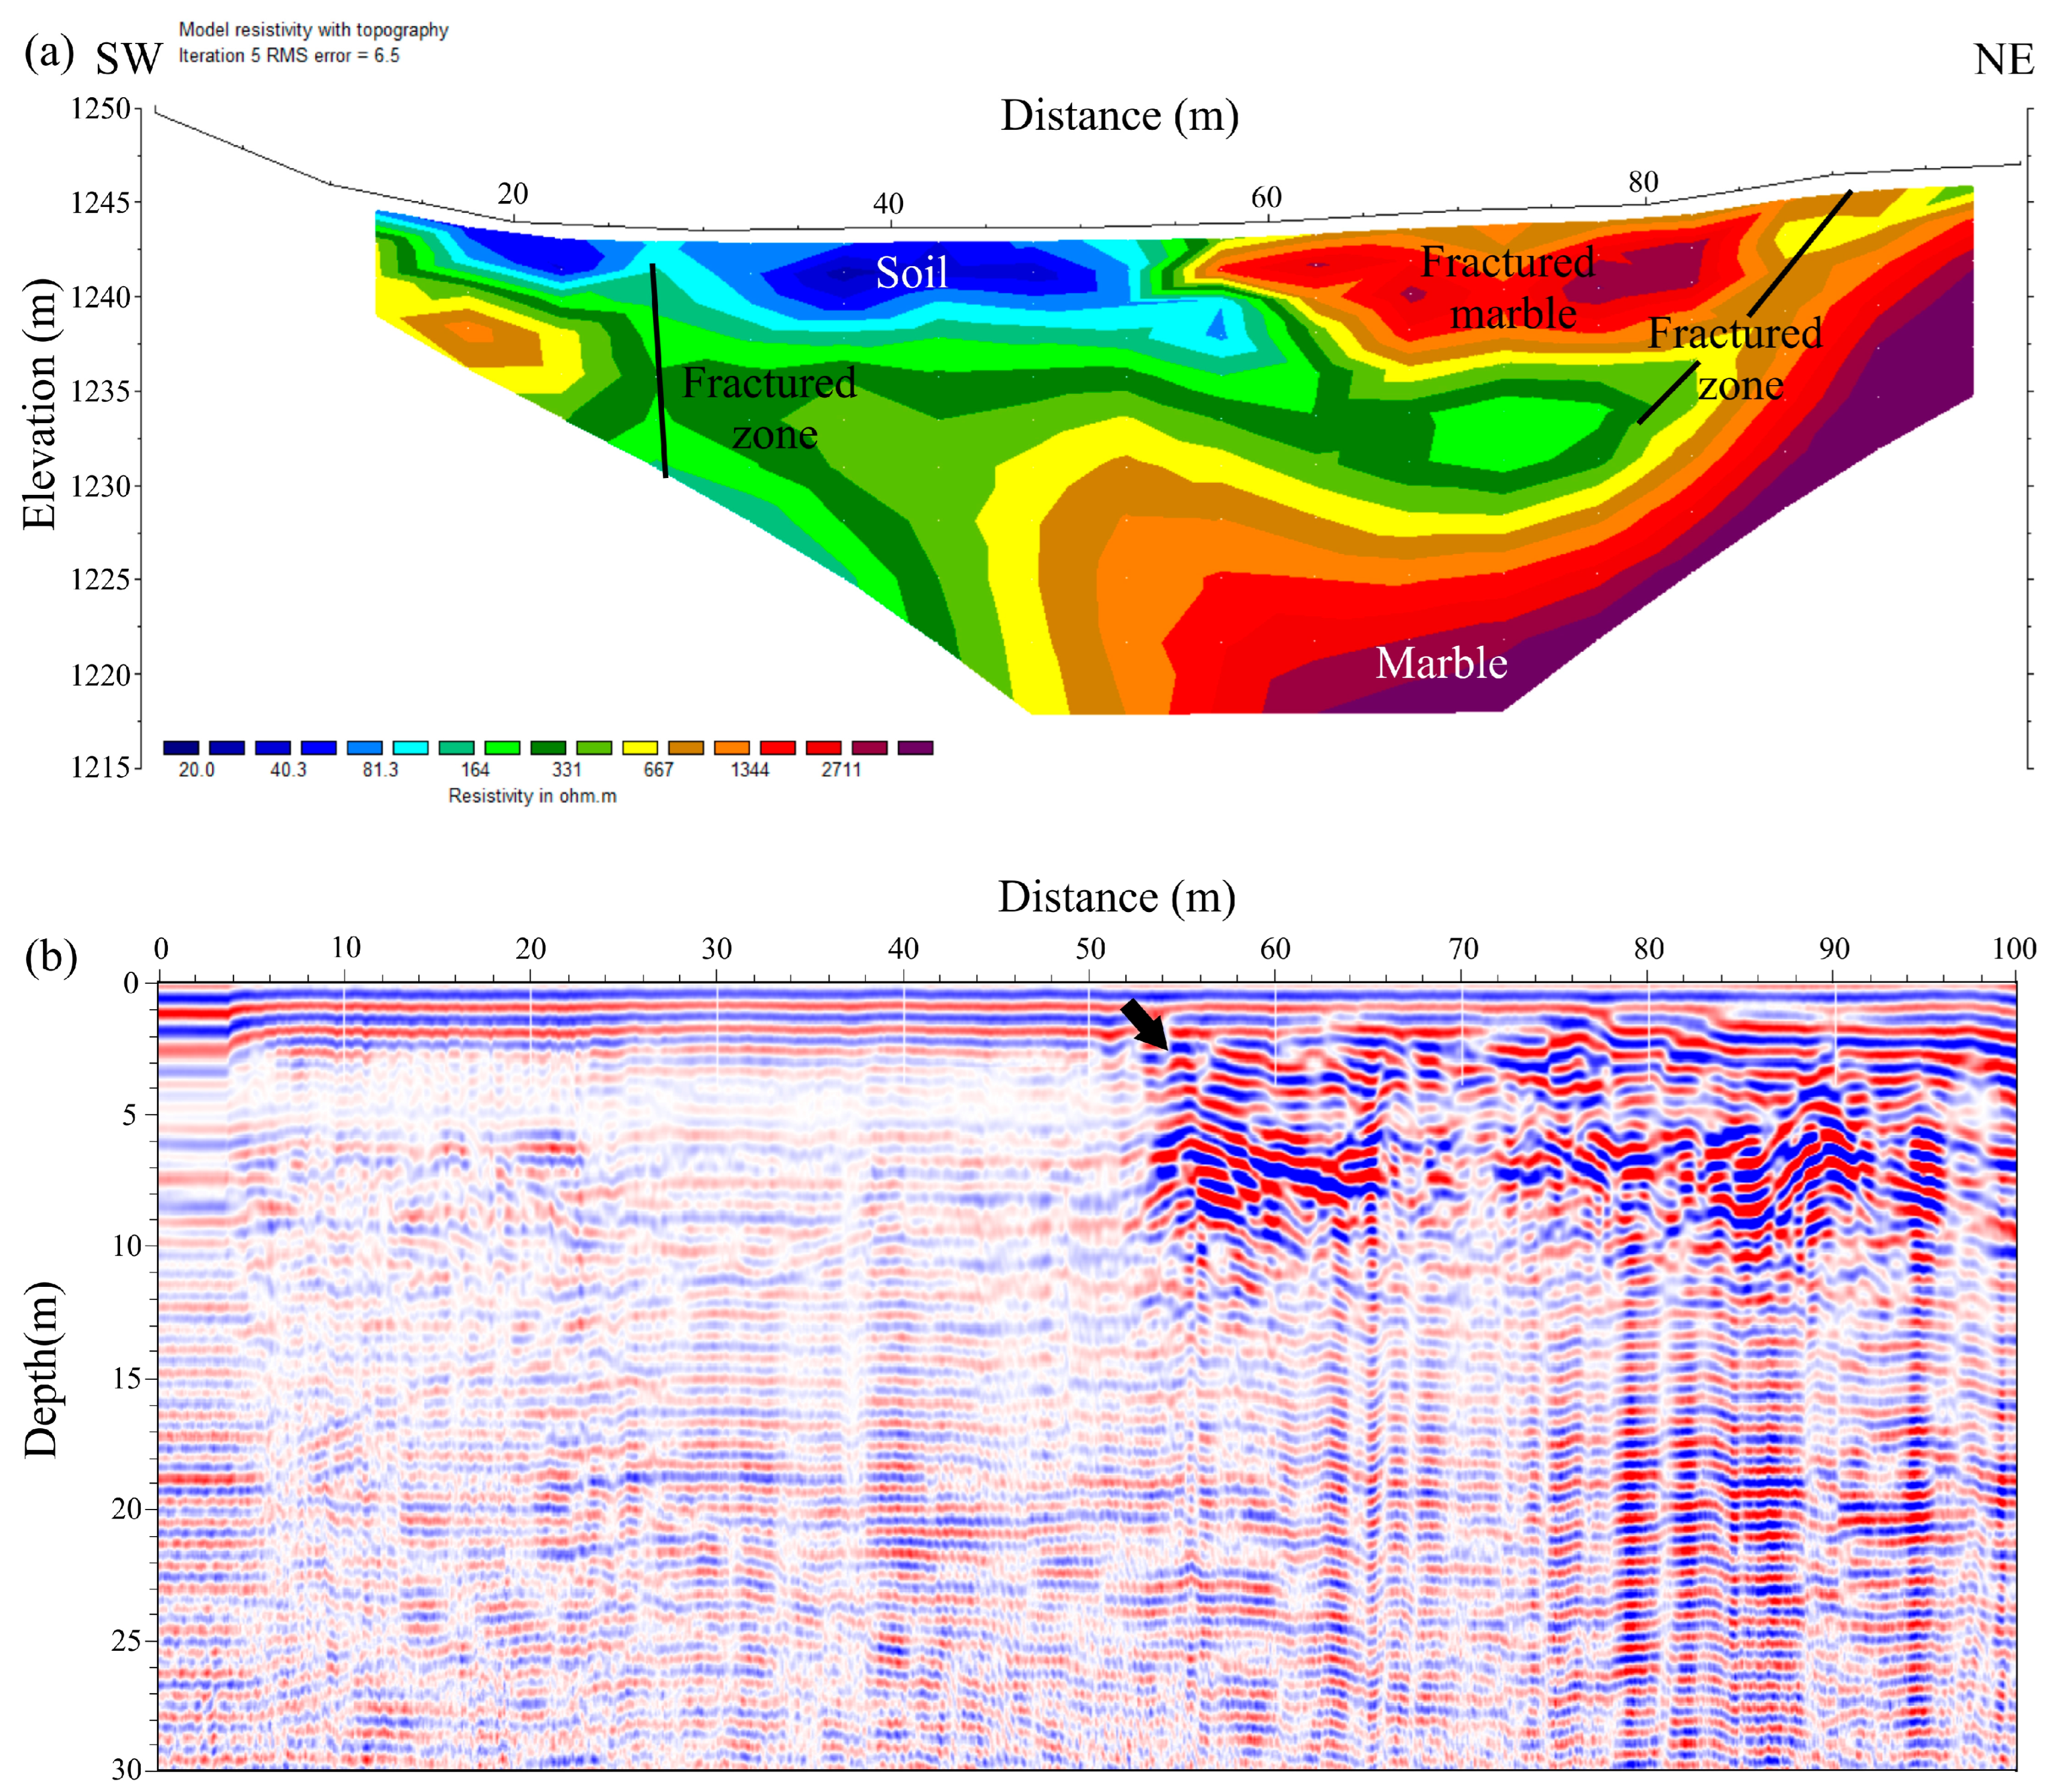
4.1.2. Line 2
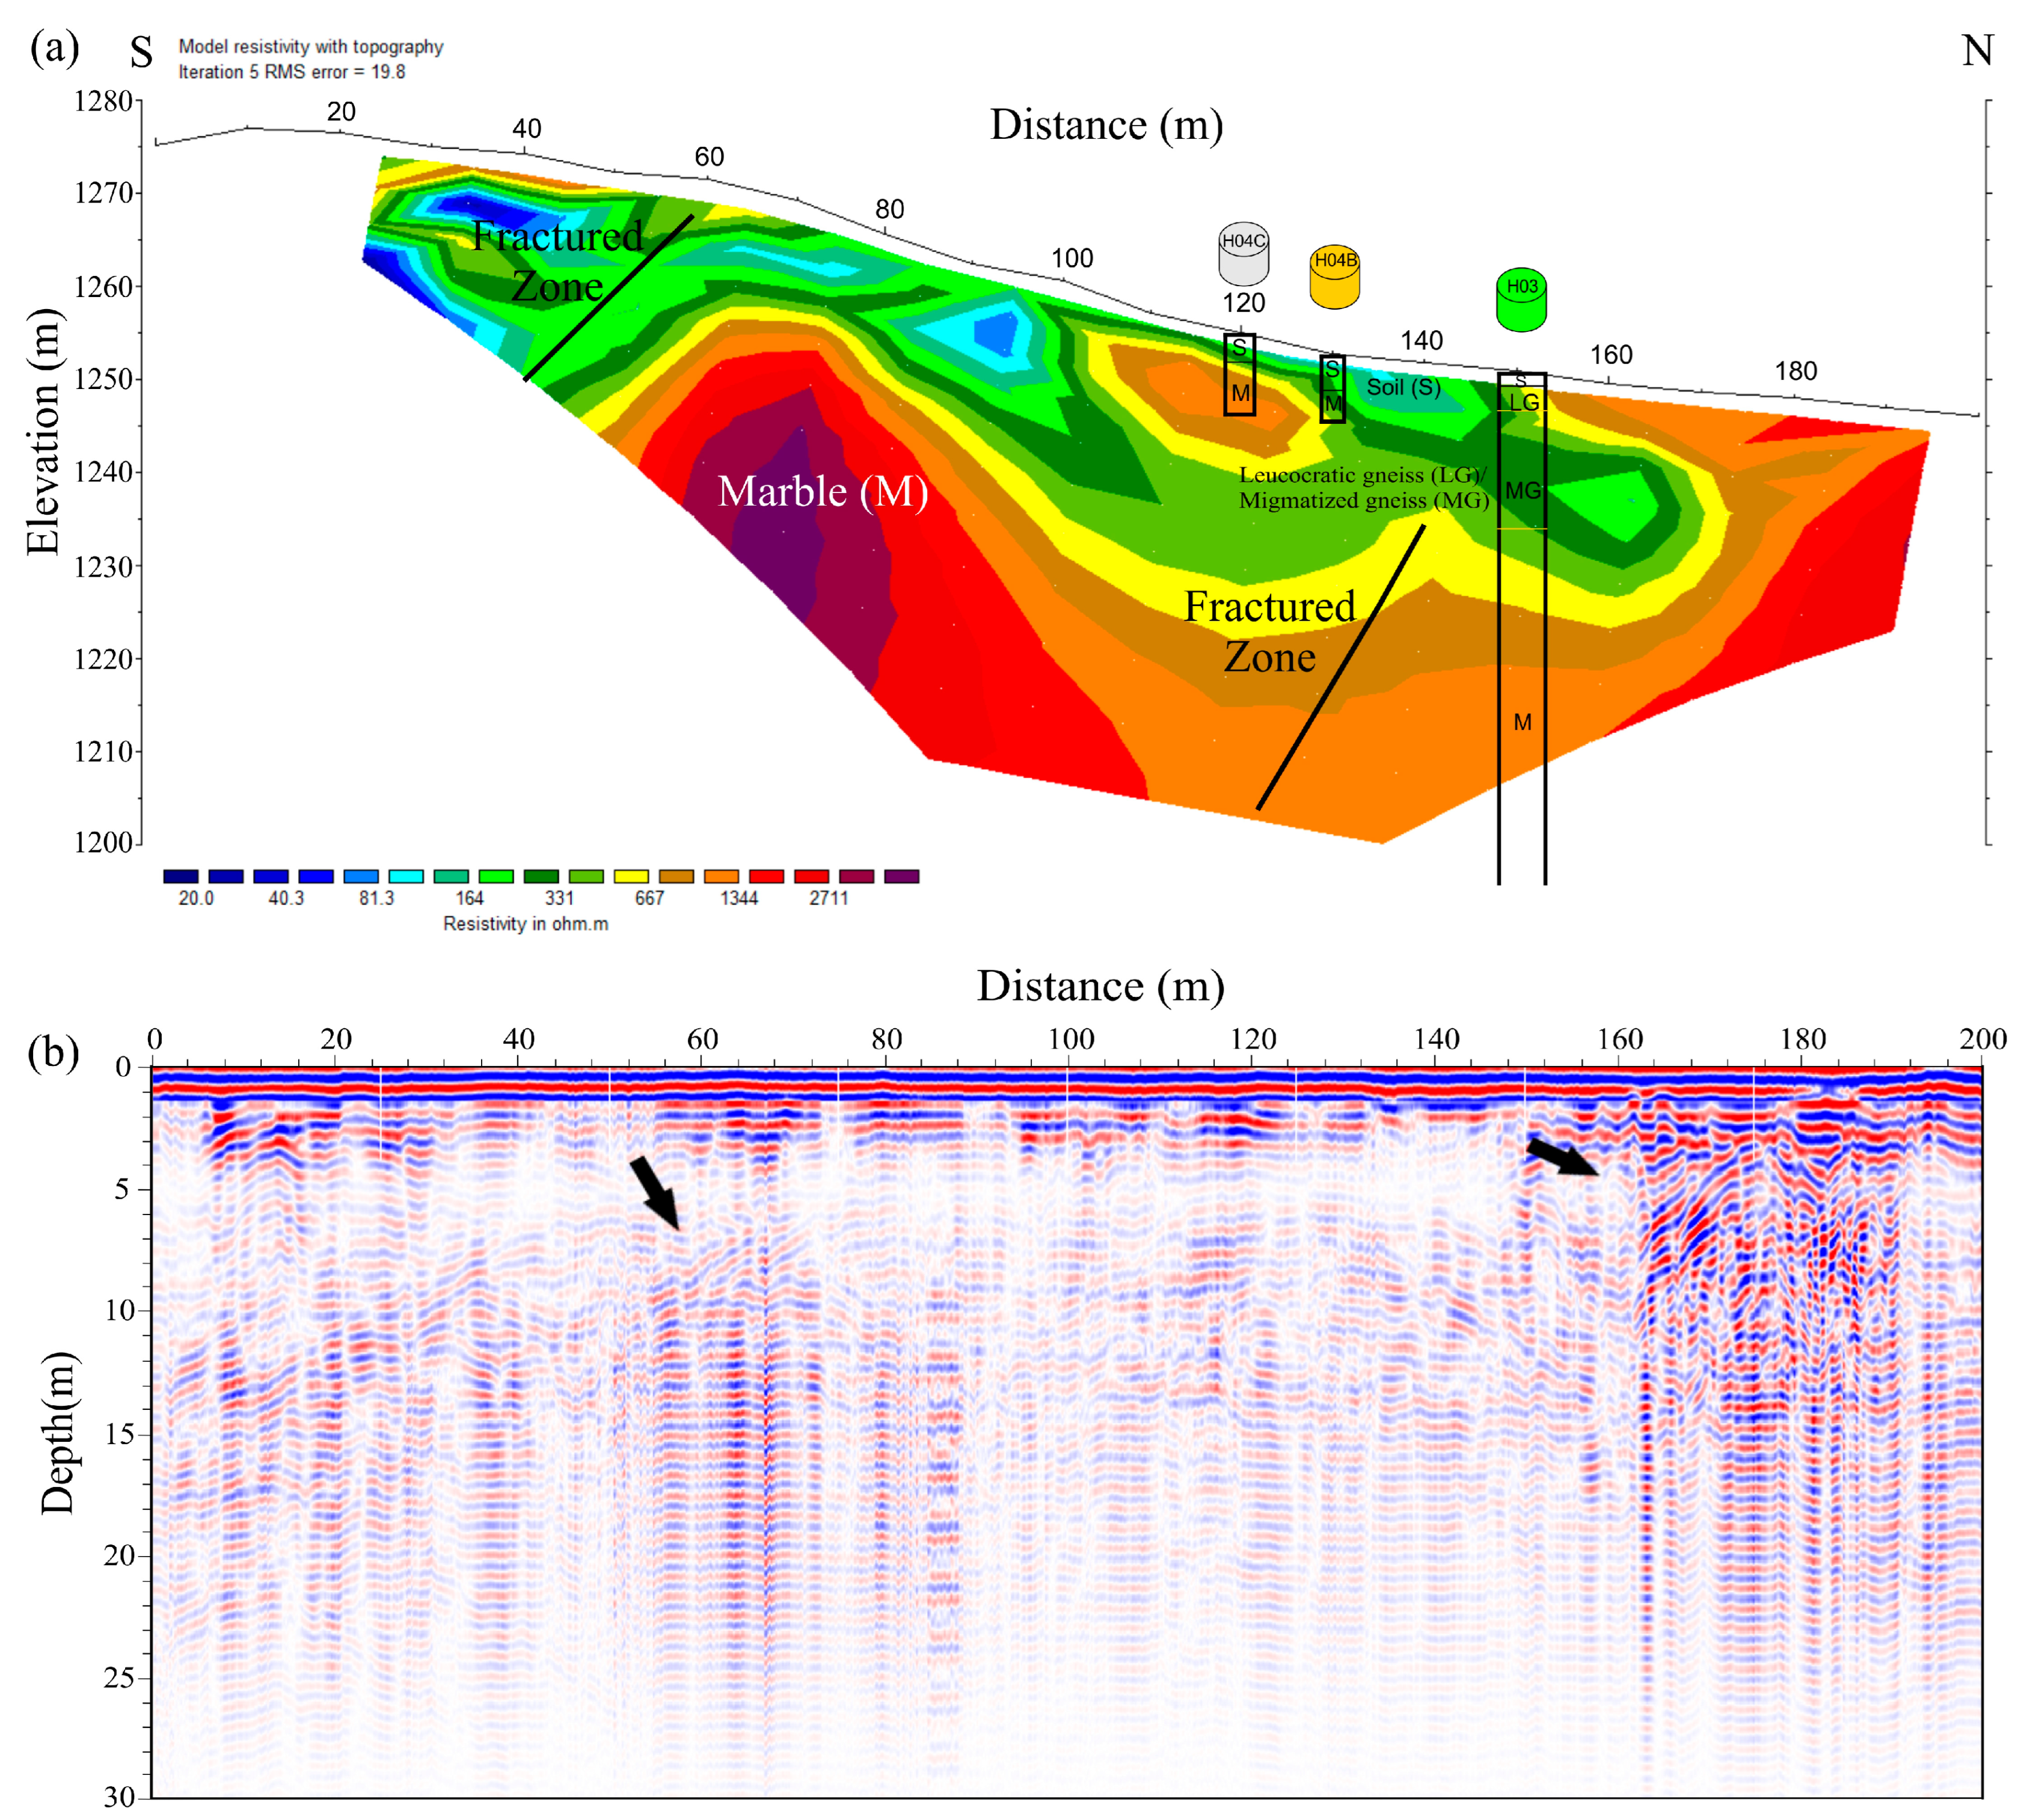
4.1.3. Line 3
4.1.4. Line 4
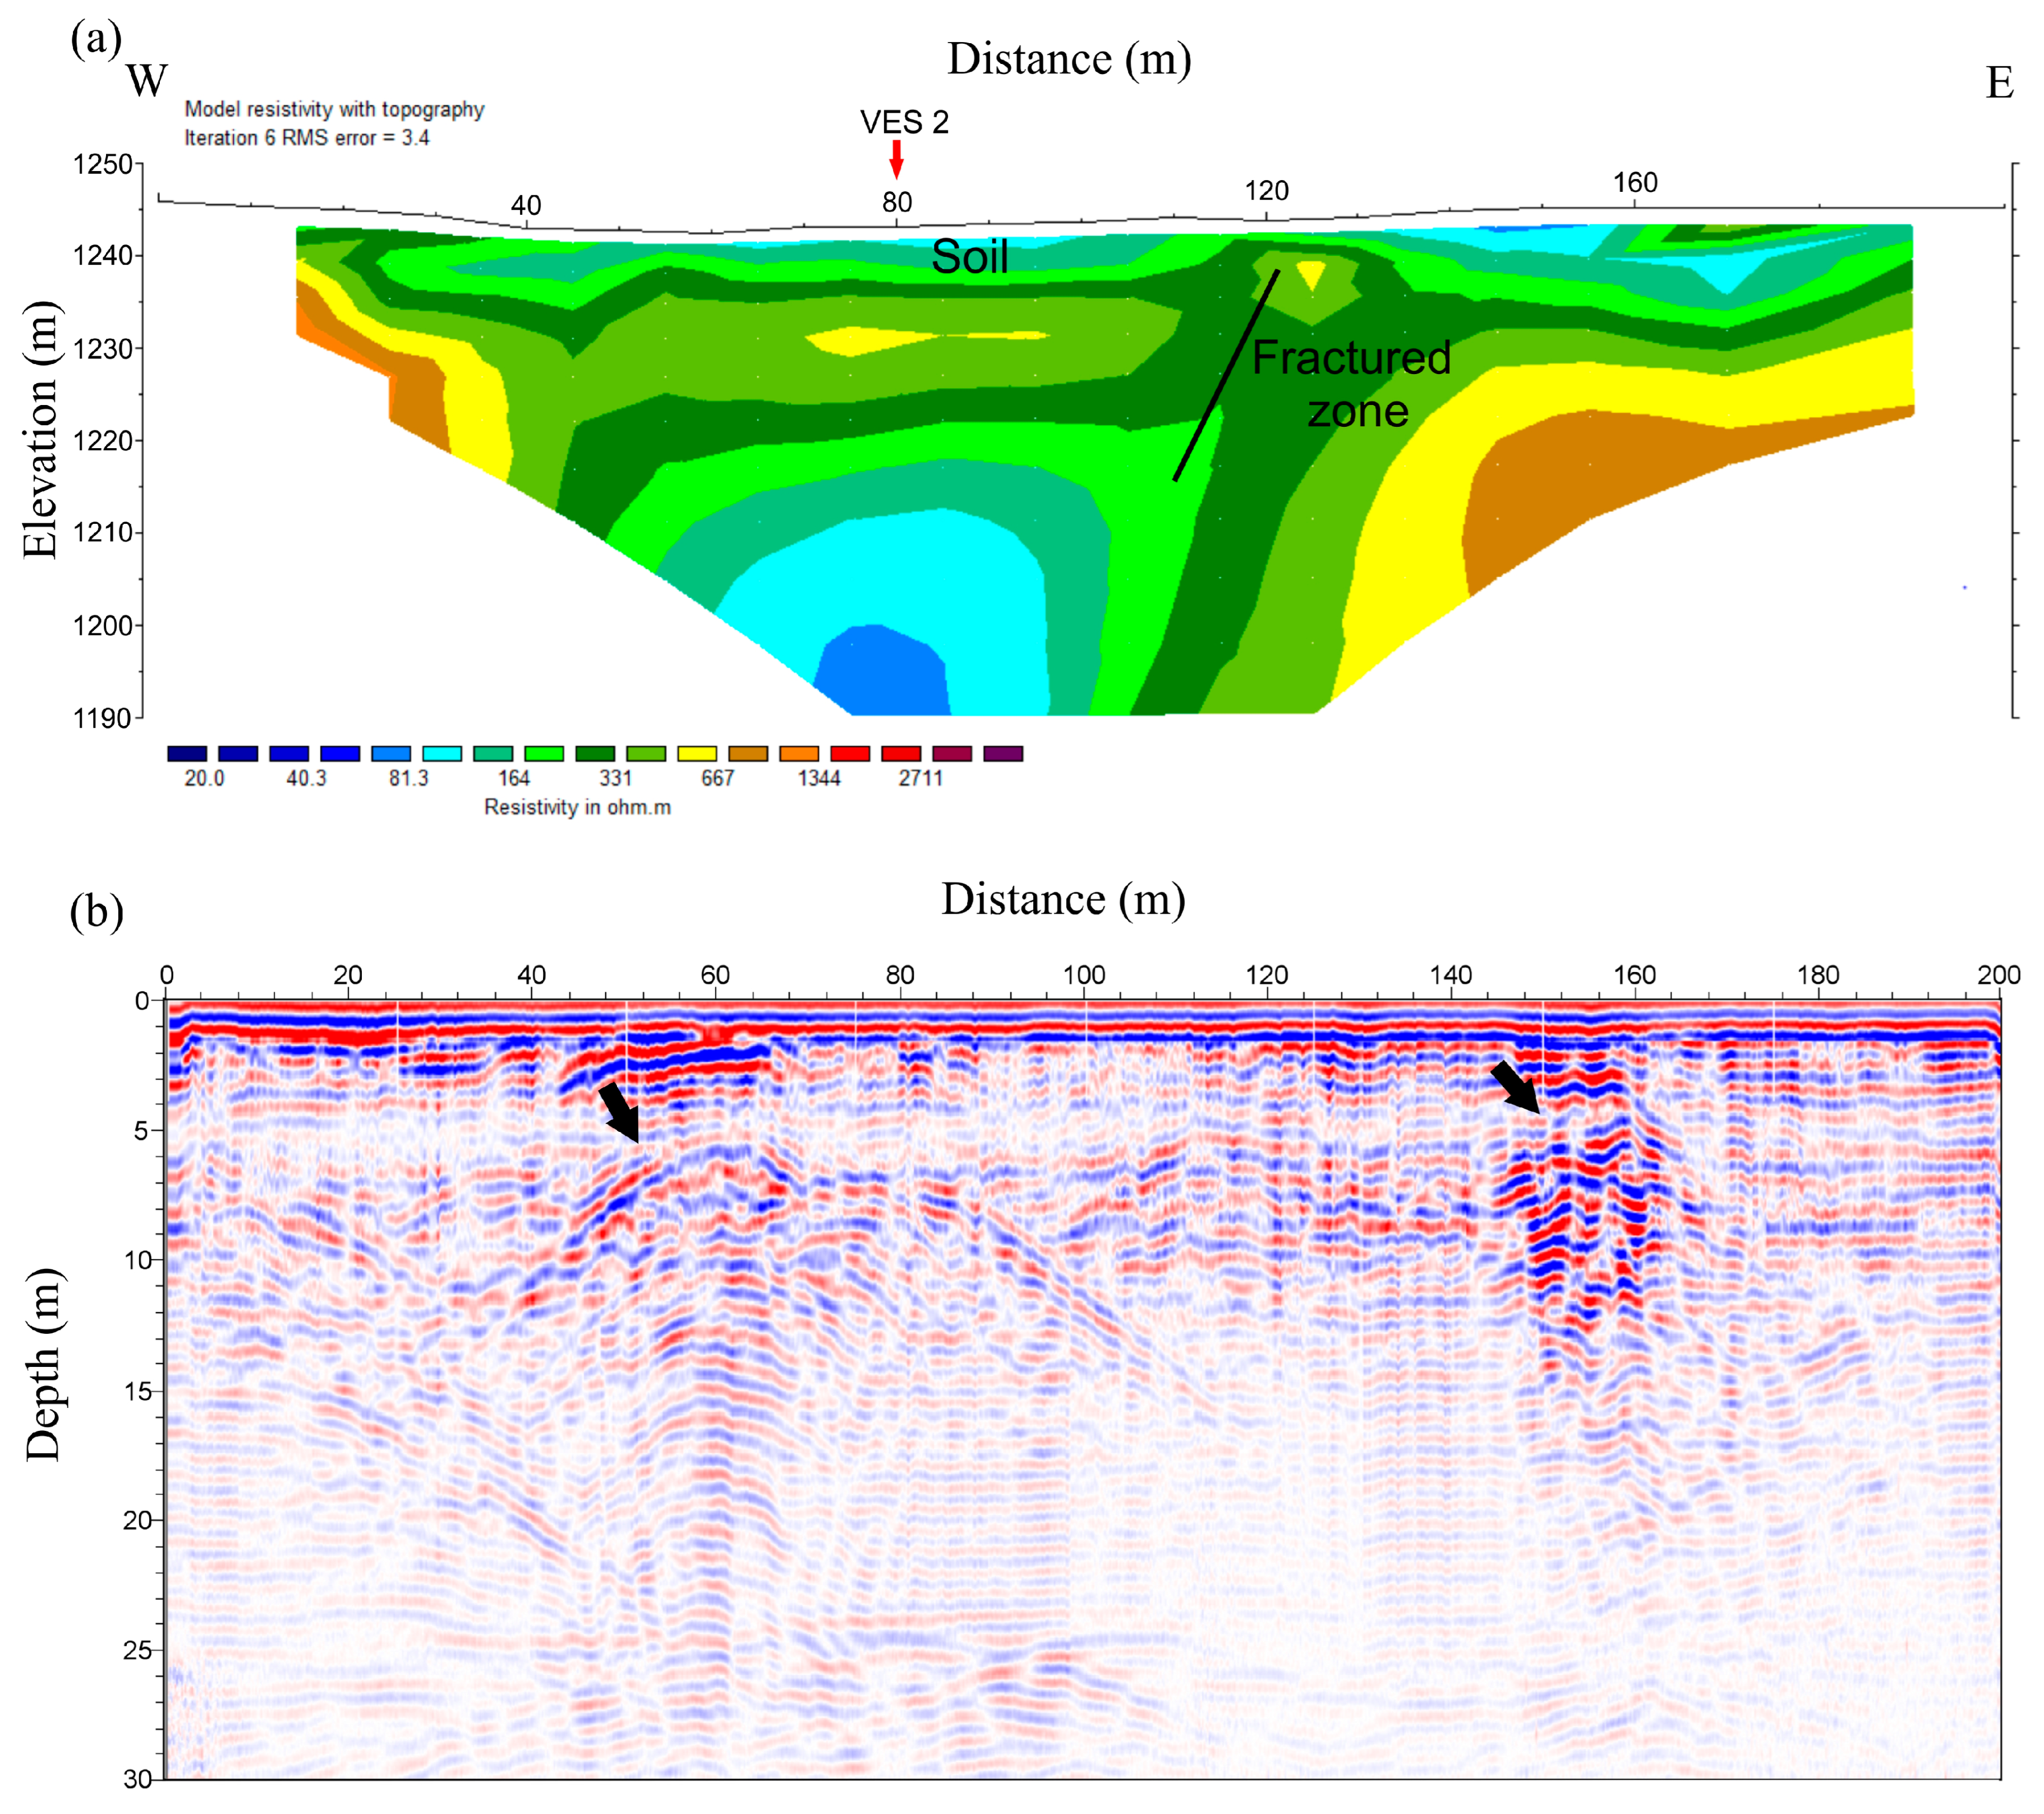
4.1.5. Line 5
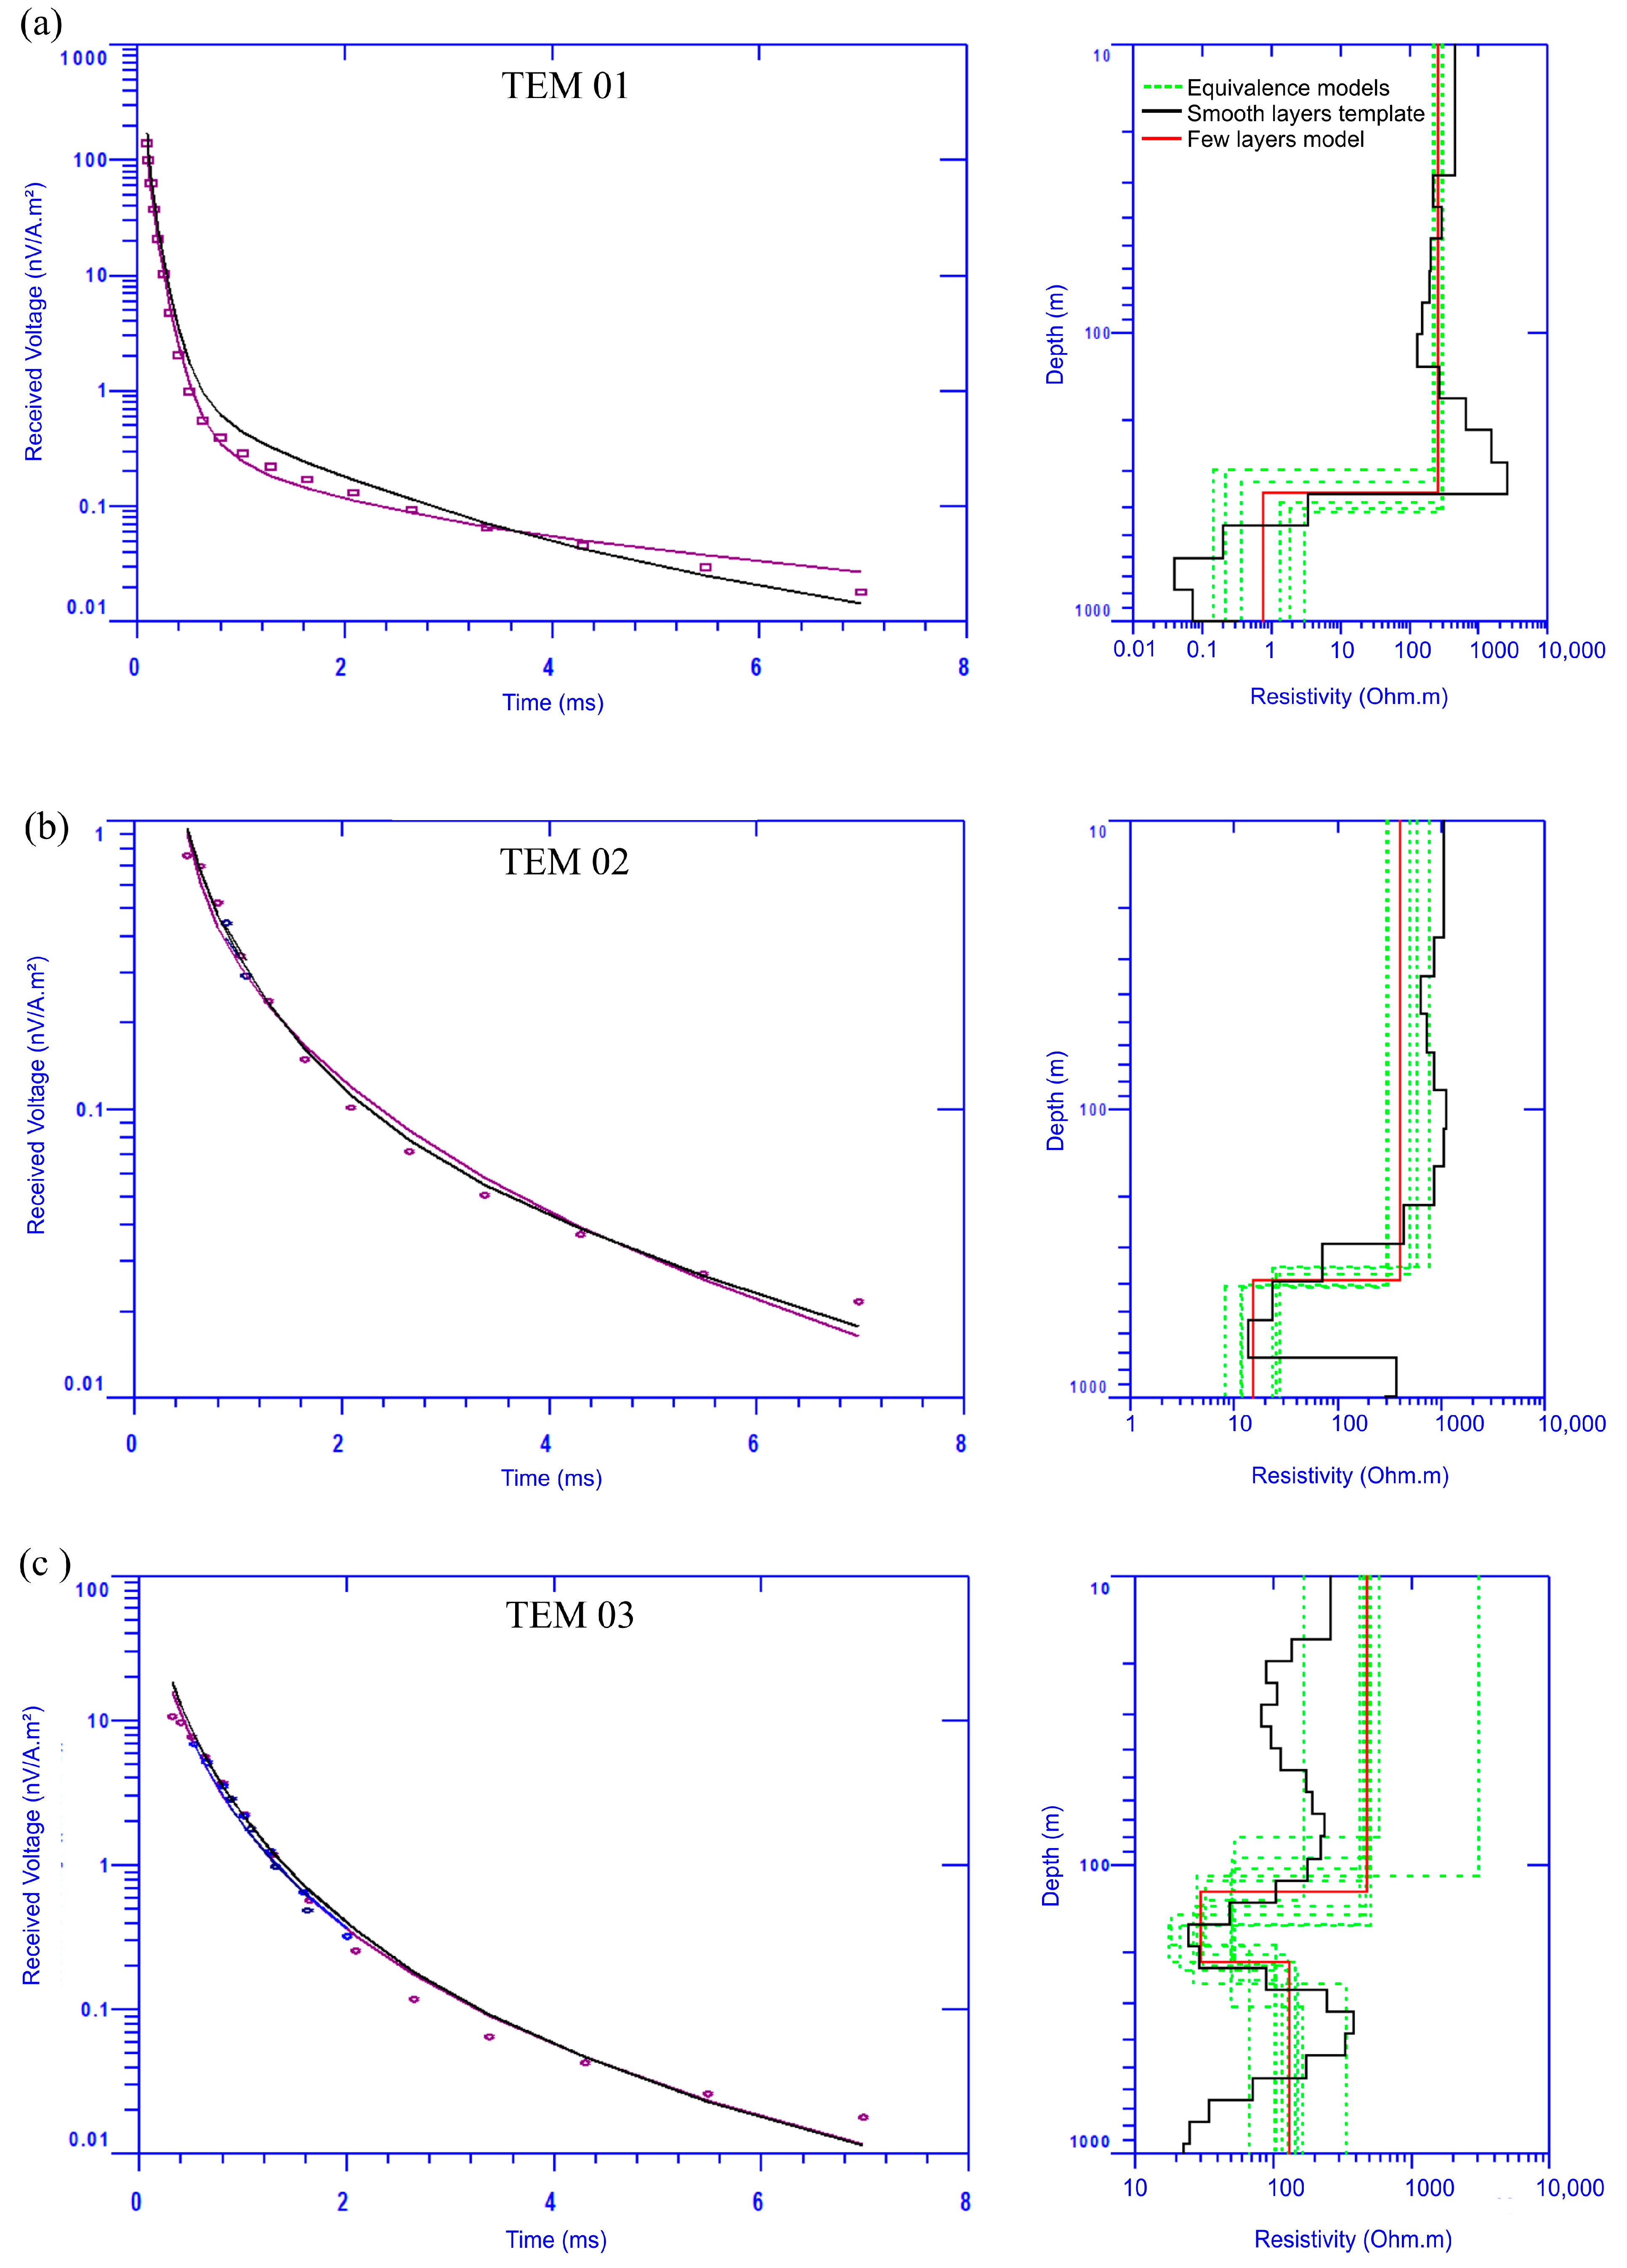
4.1.6. TEM Soundings
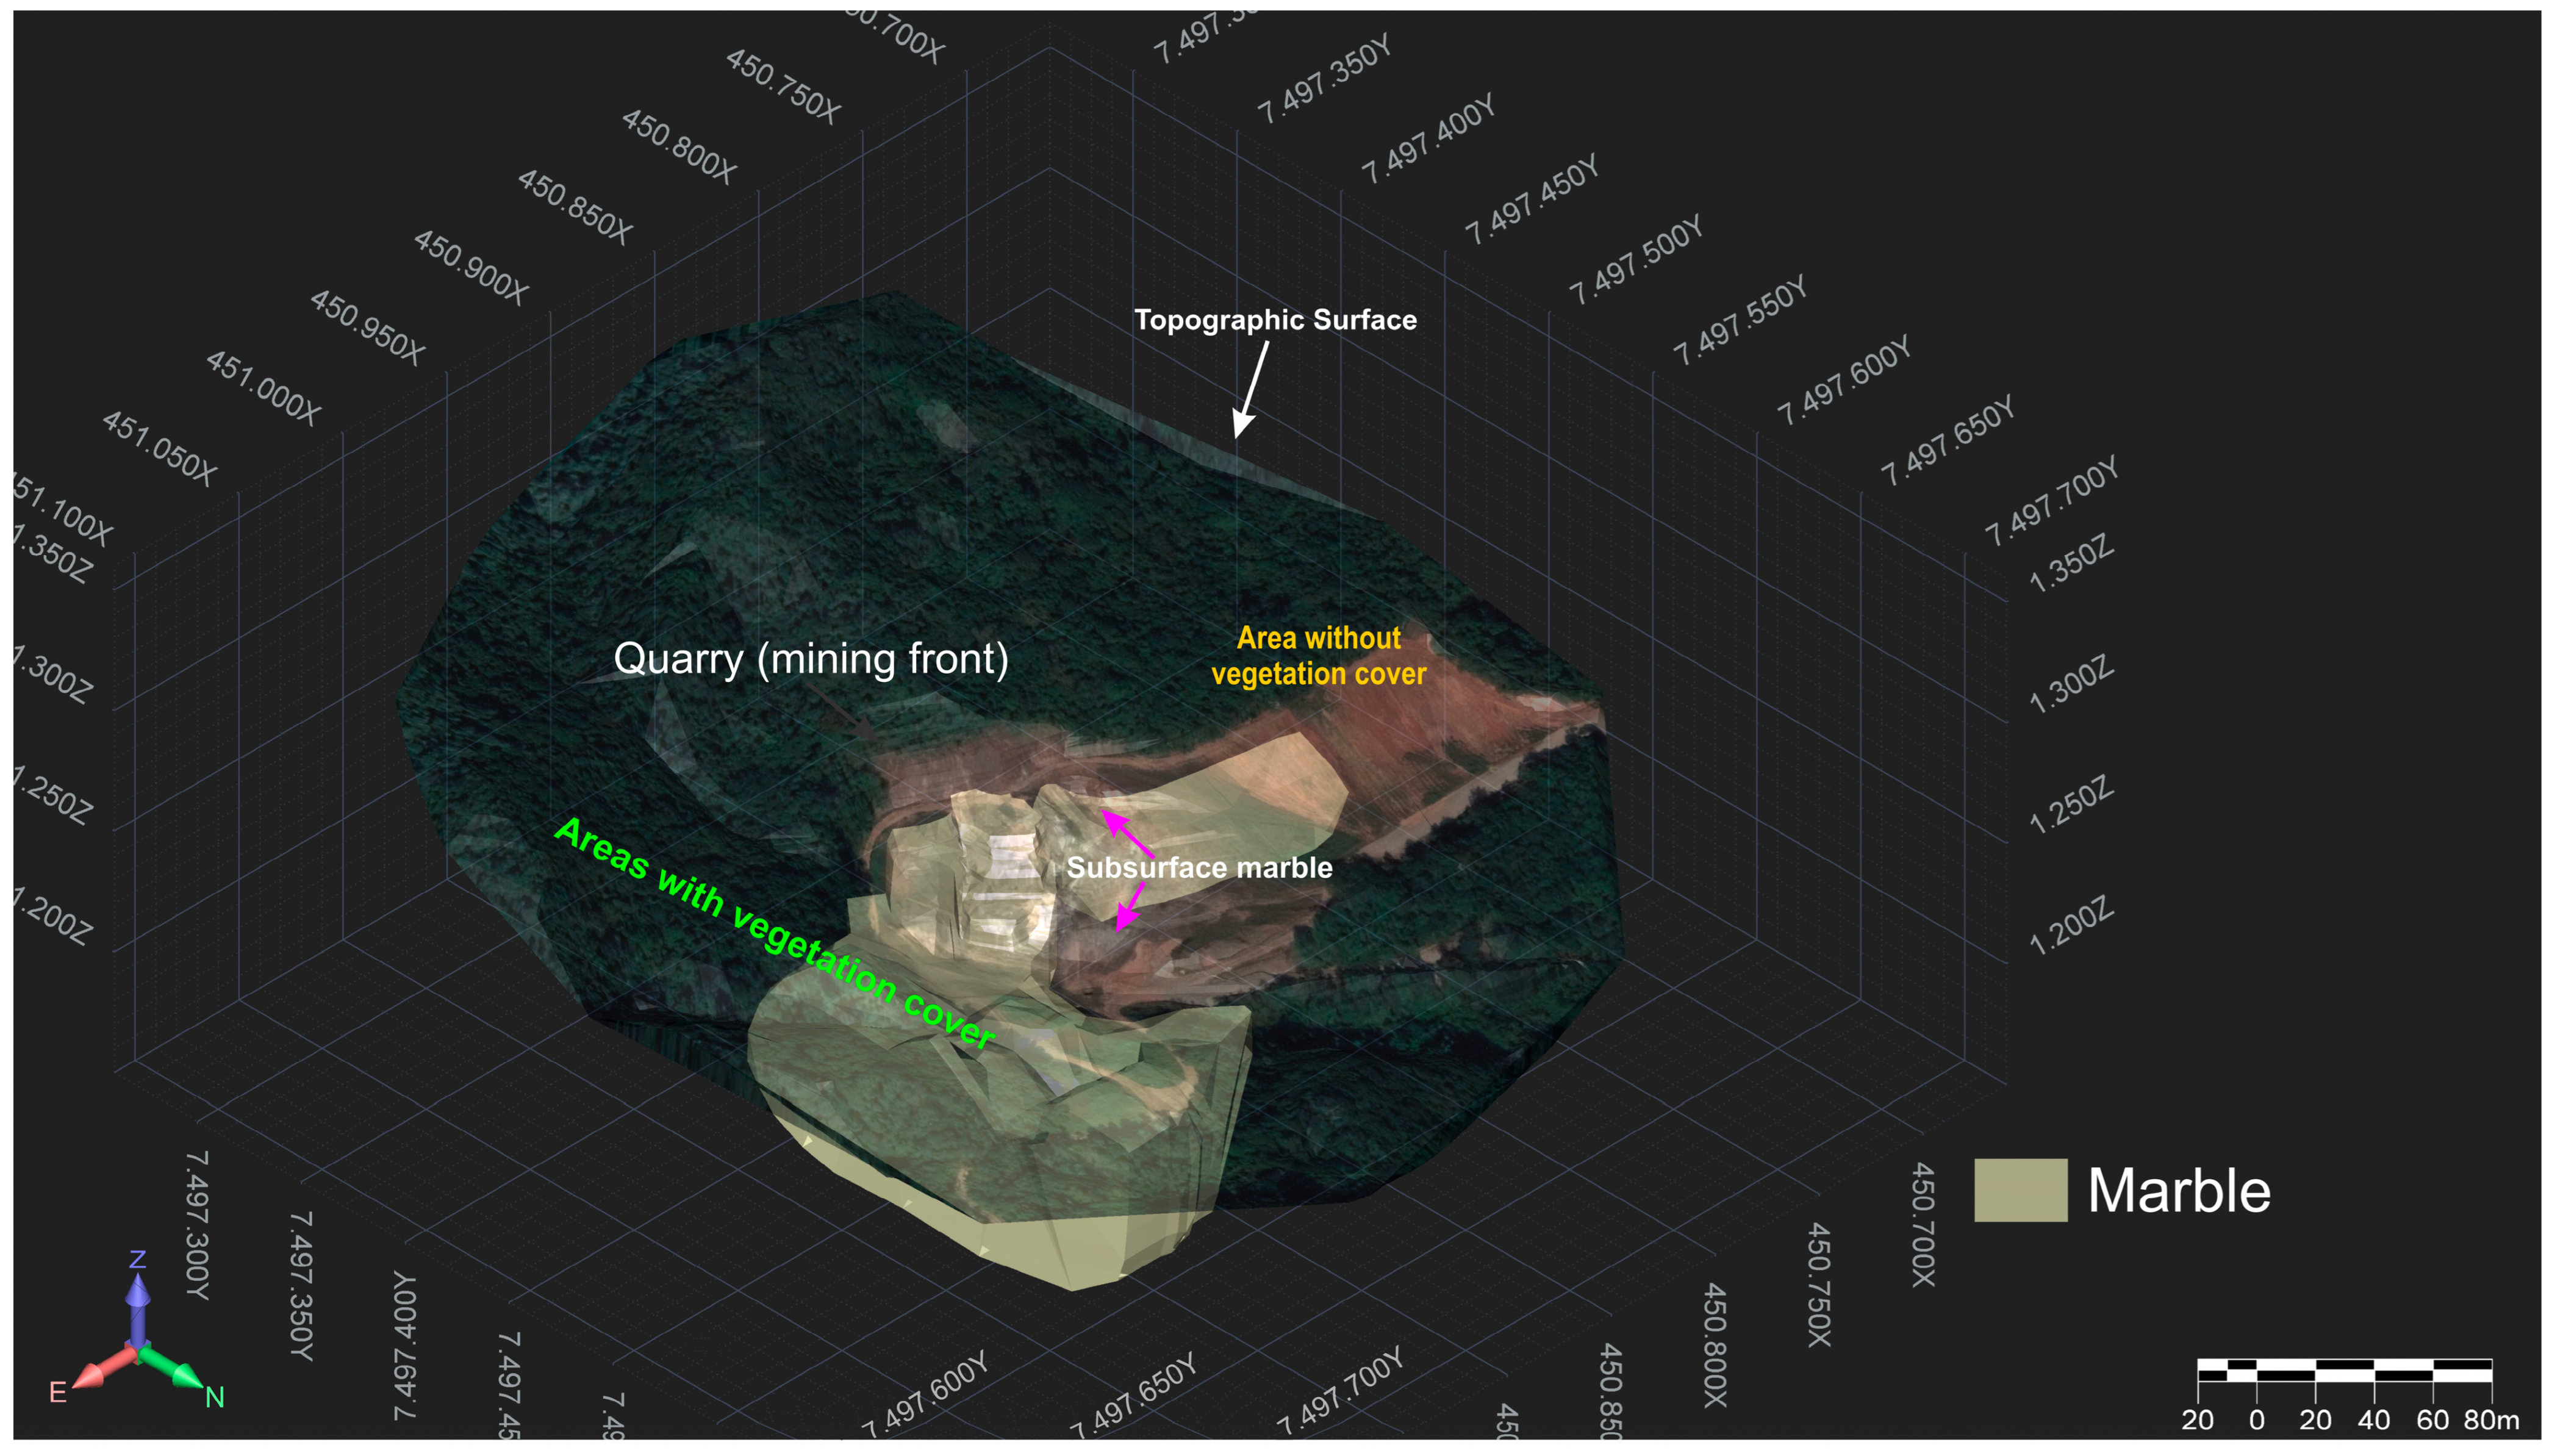
4.2. Geological and Conceptual Pit Models
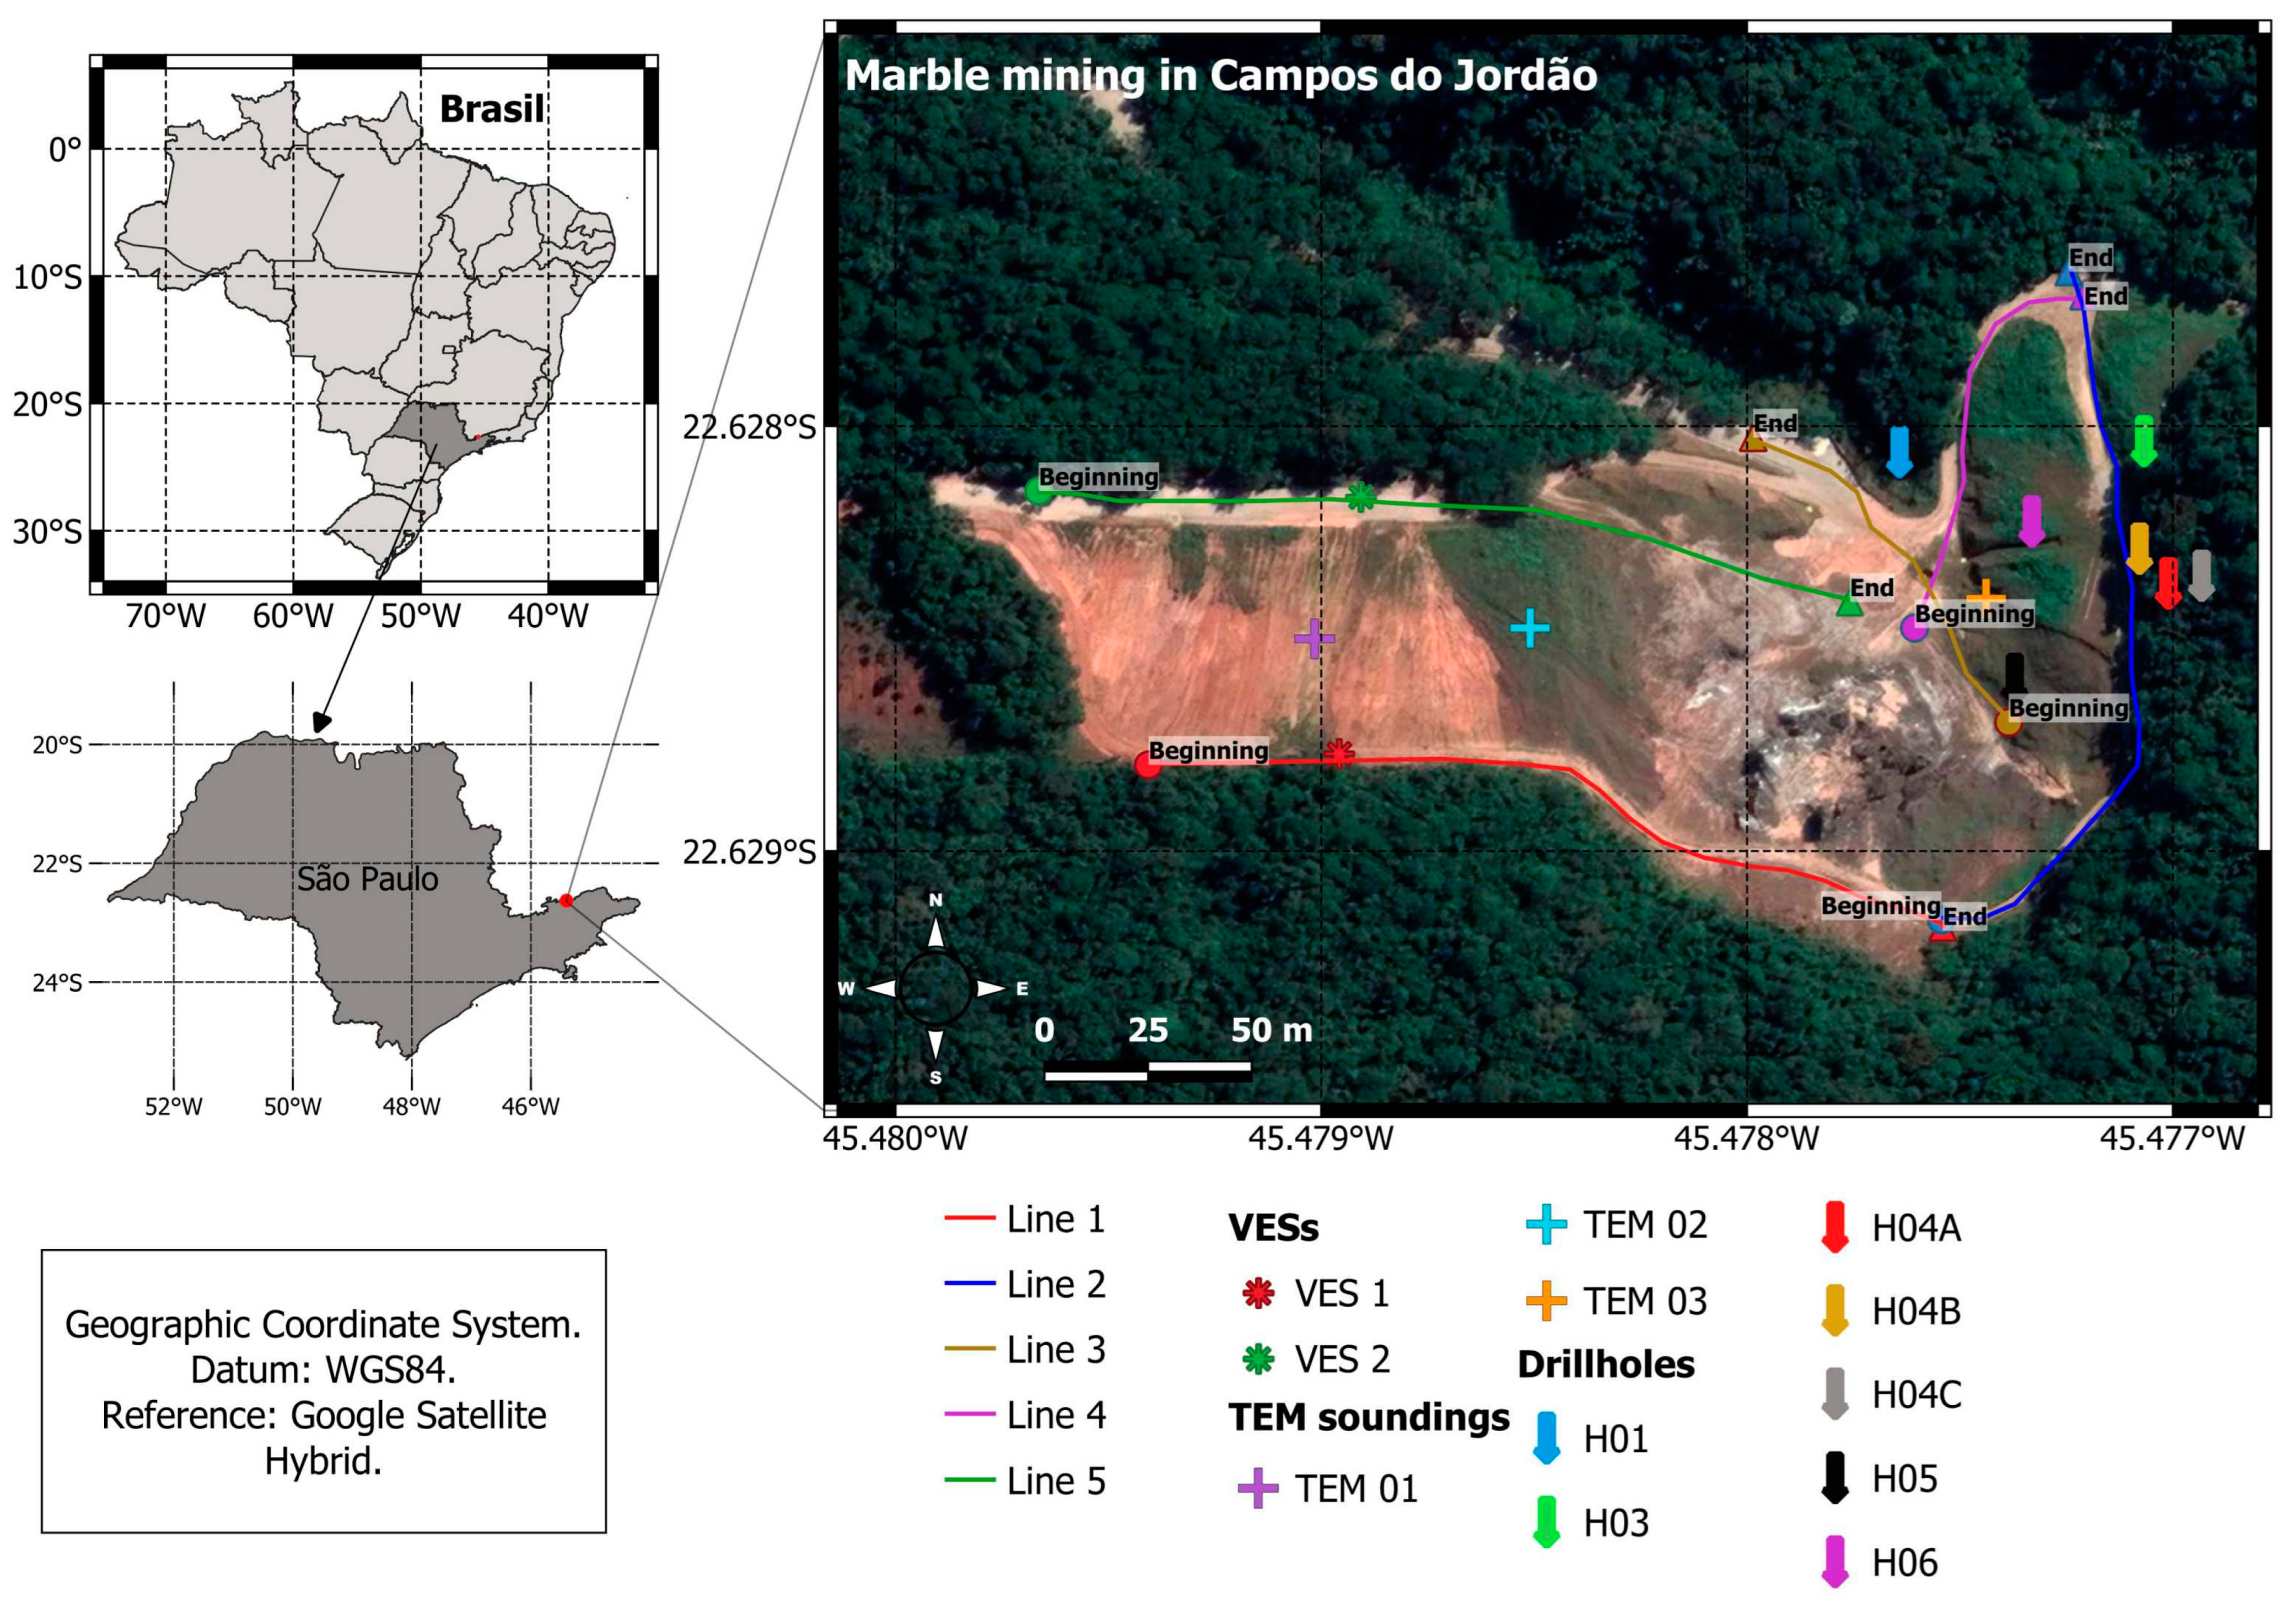
- The continuity of the marble deposit was inferred from resistivity profiles (Line 2 starts at the end of Line 1; Line 4 crosses Line 2, and Line 3 crosses Line 4) and the drill-hole data (H01, H03, H04B, H04C, and H06);
- The maximum depth of the resistive layer to the east was defined based on Line 1 ER profiles (~55 m, Figure 4a);
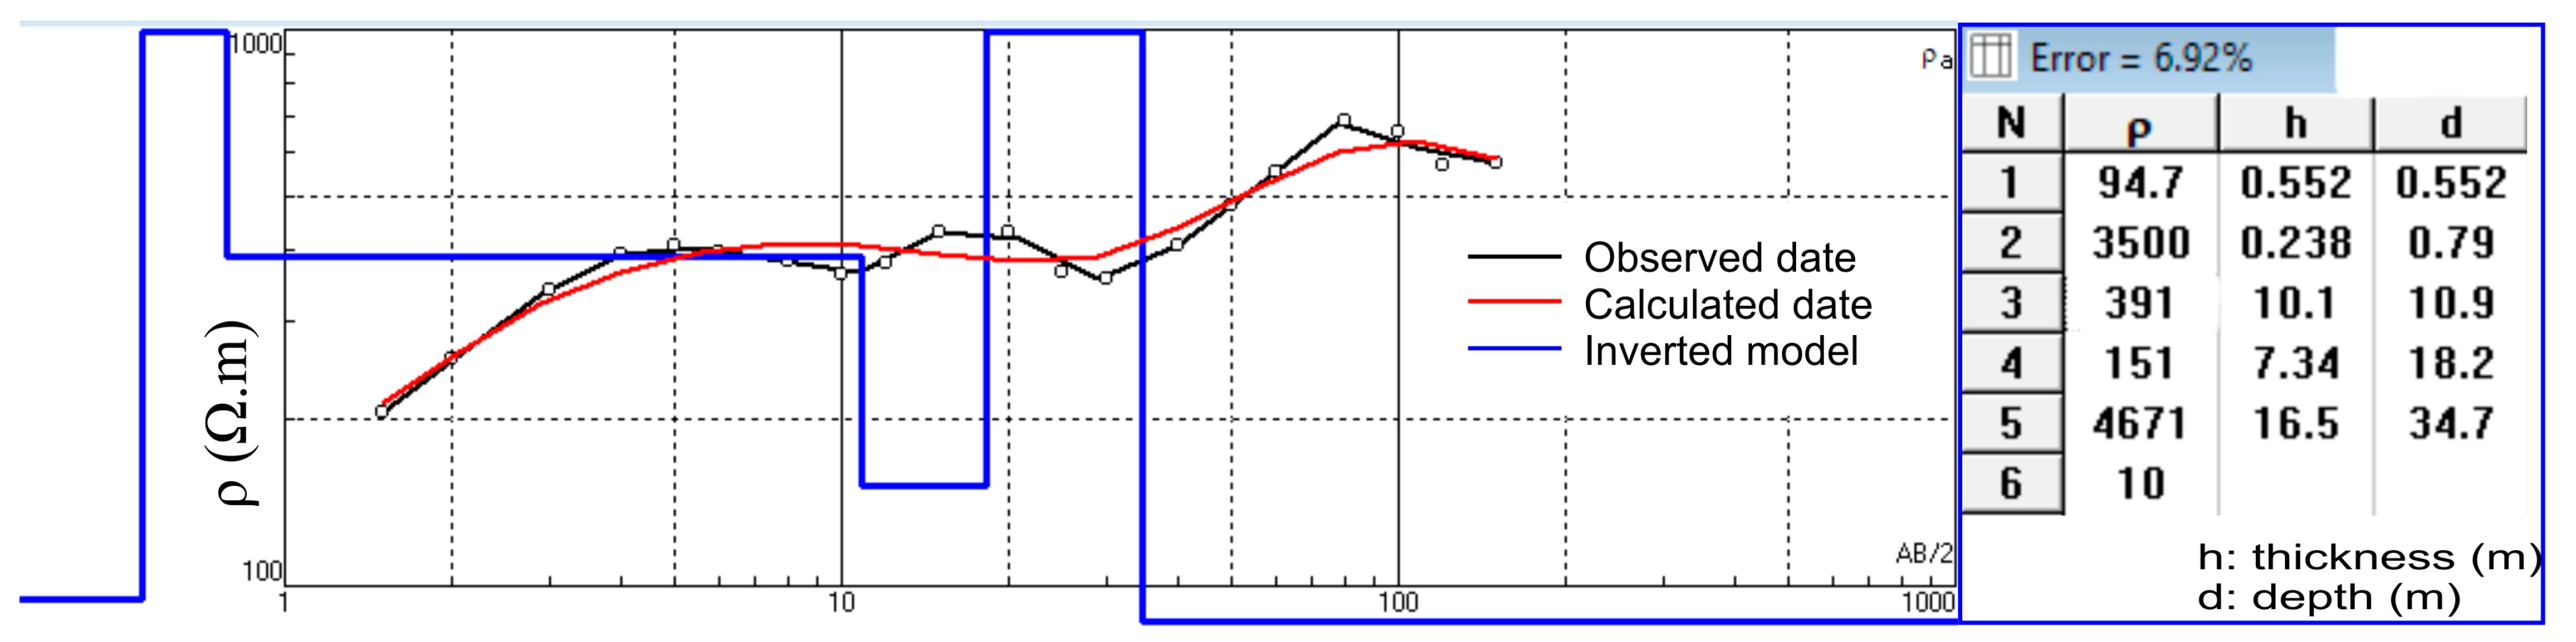
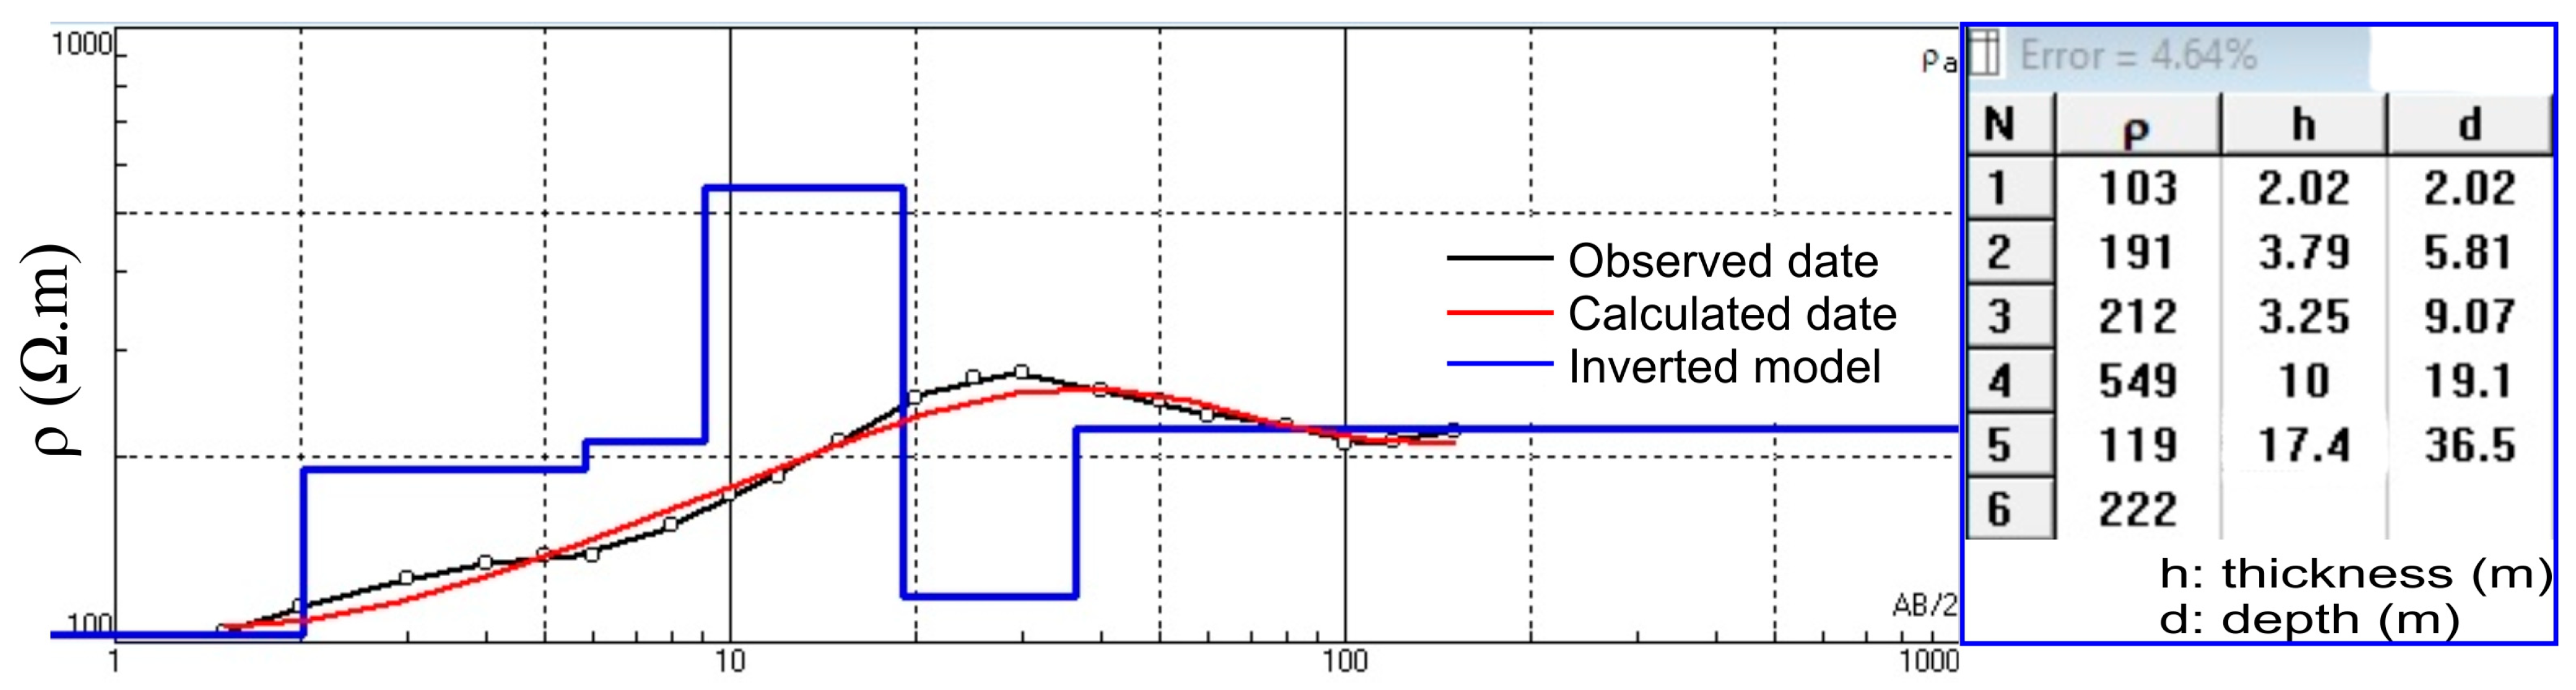
- The portion of the marble body to the west in the Line 1 resistivity profile had its maximum depth limited by VES1 (~35 m, Figure 5);
- Finally, the maximum depth of the marble deposit (80 m) that extends from Line 2 was defined based on drill hole H03 (Table 1).
5. Conclusions
Author Contributions
Funding
Data Availability Statement
Acknowledgments
Conflicts of Interest
References
- Buxton, A. Responding to the Challenge of Artisanal and Small-Scale Mining: How Can Knowledge Networks Help? London: International Institute for Environment and Development. II ED Sustainable Markets. 2013. Available online: http://pubs.iied.org/16532IIED.html (accessed on 17 August 2021).
- Fritz, M.; McQuilken, J.; Collins, N.; Weldegiorgis, F. Global Trends in Artisanal and Small-Scale Mining (ASM): A Review of Key Numbers and Issues; International Institute for Sustainable Development (IISD): Winnipeg, MB, Canada, 2018; Available online: https://www.iisd.org/system/files/publications/igf-asm-global-trends.pdf (accessed on 20 July 2022).
- Ministério de Minas e Energia. Diagnóstico Socioeconômico e Ambiental da Mineração em Pequena Escala (MPE) no Brasil: Relatório Final; Ministério de Minas e Energia: São Paulo, Brazil, 2018. Available online: http://antigo.mme.gov.br//documents/20182/d24586f3-bb15-9a72-3b94-693a9ab9b69a (accessed on 17 August 2021).
- Seccatore, J. Gestão Sustentável de Recursos e Reservas para Mineração a Pequena Escala. Ph.D. Thesis, Universidade de São Paulo, São Paulo, Brazil, 2014. Available online: https://www.teses.usp.br/teses/disponiveis/3/3134/tde-24042015-145743/publico/TESE_JacopoSeccatore.pdf (accessed on 20 July 2022).
- Silvestre, C.P.; Da Silva, A.L.C. Problemas ambientais decorrentes da exploração de rochas ornamentais no Município de Santo Antônio de Pádua–RJ. Rev. Geonorte 2012, 3, 281–289. [Google Scholar]
- Macedo, A. O Papel das Cooperativas na Mineração Artesanal e em Pequena Mineração no Brasil. XLV Encontro da ANPAD (EnANPAD), Versão Online 2177–2576. 2021. Available online: https://www.researchgate.net/profile/Alex-Dos-Santos-Macedo/publication/355175573_O_papel_das_cooperativas_na_Mineracao_Artesanal_e_em_Pequena_Mineracao_no_Brasil/links/616469520bf51d4817716875/O-papel-das-cooperativas-na-Mineracao-Artesanal-e-em-Pequena-Mineracao-no-Brasil.pdf (accessed on 20 July 2022).
- Martínez, J.; Montiel, V.; Rey, J.; Cañadas, F.; Vera, P. Utilization of integrated geophysical techniques to delineate the extraction of mining bench of ornamental rocks (Marble). Remote Sens. 2017, 9, 1322. [Google Scholar] [CrossRef]
- Mello, E.F.; De Almeida, C.N.; Coelho, J.M.; De Barros, L.A.; Araújo, R.N.P. O Polo Produtor de Mármores do Sul do Espírito Santo, Brasil: Ordenamento Territorial e Desenvolvimento Sustentável em Regiões Caracterizadas por Mineração em Pequena Escala. Anuário Inst. Geociências 2018, 41, 36–51. [Google Scholar] [CrossRef]
- Jalalian, M.H.; Bagherpour, R.; Khoshouei, M. Wastes production in dimension stones industry: Resources, factors, and solutions to reduce them. Environ. Earth Sci. 2021, 80, 560. [Google Scholar] [CrossRef]
- Chiodi Filho, C.; de Paula Rodrigues, E.; Artur, A.C. Panorama técnico-econômico do setor de rochas ornamentais no Brasil. Geosciences 2004, 23, 5–20. [Google Scholar]
- Telford, W.M.; Geldart, L.P.; Sheriff, R.E. Applied Geophysics; Cambridge University Press: Cambridge, UK, 1990. [Google Scholar]
- Kearey, P.; Brooks, M.; Hill, I. Geofísica de Exploração; Oficina de textos: São Paulo, Brasil, 2009. [Google Scholar]
- Dentith, M.; Mudge, S.T. Geophysics for the Mineral Exploration Geoscientist; Cambridge University Press: Cambridge, UK, 2014. [Google Scholar]
- Luodes, H. Natural stone assessment with ground penetrating radar. Est. J. Earth Sci. 2008, 57, 3. [Google Scholar] [CrossRef]
- Uhlemann, S.; Chambers, J.; Falck, W.E.; Tirado Alonso, A.; Fernández González, J.L.; Espín de Gea, A. Applying Electrical Resistivity Tomography in Ornamental Stone Mining: Challenges and Solutions. Minerals 2018, 8, 491. [Google Scholar] [CrossRef]
- Magnusson, M.K.; Fernlund, J.M.; Dahlin, T. Geoelectrical imaging in the interpretation of geological conditions affecting quarry operations. Bull. Eng. Geol. Environ. 2010, 69, 465–486. [Google Scholar] [CrossRef]
- Periotto, A.J. Determinação da Cava Ótima em Mineração a Céu Aberto Através de Programação Paralela. Ph.D. Thesis, Universidade Federal do Rio de Janeiro, Rio de Janeiro, Brazil, 1992. Available online: https://www.pesc.coppe.ufrj.br/uploadfile/1339608654.pdf (accessed on 22 July 2022).
- Caccetta, L.; Hill, S.P. An application of branch and cut to open pit mine scheduling. J. Glob. Optim. 2003, 27, 349–365. [Google Scholar] [CrossRef]
- Flores, B.A.; Cabral, I.E. Análise de sensibilidade na otimização econômica de uma cava. Ver. Esc. Minas 2008, 61, 449–454. [Google Scholar] [CrossRef]
- Fernandes, A.J.; Campos Neto, M.C.; Figueiredo, M.C.H. O Complexo Embú no leste do Estado de São Paulo: Limites e evolução geológica. Master’s Thesis, Universidade de São Paulo, São Paulo, Brazil, 1991. Available online: https://www.teses.usp.br/teses/disponiveis/44/44134/tde-29082013-160727/publico/Fernandes_mestrado.pdf (accessed on 14 December 2023).
- Janasi, V.A.; Alves, A.; Vlach, S.R.F.; Leite, R.J. Granitos peraluminosos da porção central da Faixa Ribeira, Estado de São Paulo: Sucessivos eventos de reciclagem da crosta continental no Neoproterozóico. Geol. USP 2003, 3, 13–24. [Google Scholar] [CrossRef]
- Trouw, R.A.J.; Peternel, R.P.M.; Duffles, P.; Vinagre, R.; Coutinho, G.R.; Matos, G.C.D.; Ramos, R. Geologia e Recursos Minerais da Folha Pindamonhangaba SF. 23-YB-VII, Estados de Minas Gerais e São Paulo. 2020. Available online: https://rigeo.cprm.gov.br/xmlui/handle/doc/17707 (accessed on 27 July 2022).
- Heilbron, M.; Valeriano, C.M.; Tassinari, C.C.G.; Almeida, J.C.H.; Tupinambá, M.; Siga, O., Jr.; Trouw, R.A.J. Correlation of Neoproterozoic terranes between the Ribeira Belt, SE Brazil and its African counterpart: Comparative tectonic evolution and open questions. In West Gondwana Pre-Cenozoic Correlations across the South Atlantic Region; Pankhurst, R.J., Trouw, R.A.J., Brito-Neves, B.B., de Wit, M., Eds.; Geological Society of London: London, UK, 2008; Volume 294, pp. 211–232. [Google Scholar]
- Kirsch, R. (Ed.) Groundwater Geophysics: A Tool for Hydrogeology; Springer: Berlin/Heidelberg, Germany, 2006. [Google Scholar]
- Kuras, O.; Beamish, D.; Meldrum, P.I.; Ogilvy, R.D. Fundamentals of the capacitive resistivity technique. Geophysics 2006, 71, G135–G152. [Google Scholar] [CrossRef]
- Cavenaghi, V.L.S. Caracterização Geoelétrica de Alvos Rasos no Sítio Controlado de Geofísica Rasa-II-IAG/USP Através do Uso de Resistividade Capacitiva. Master’s Thesis, Universidade de São Paulo, São Paulo, Brazil, 2017; 148p. [Google Scholar] [CrossRef]
- Carmona, E.; Barbosa, A.; Ustra, A.; Elis, V.; Mendonça, C. Aplicação do método resistivo-capacitivo para investigação de uma área contaminada por creosoto. In Proceedings of the VIII Simpósio Brasileiro de Geofísica, Salinópolis, Brazil, 18–20 September 2018; Available online: https://sbgf.org.br/mysbgf/eventos/expanded_abstracts/VIII_SimBGf/Aplicação%20do%20método%20resistivo-capacitivo%20para%20investigação%20de%20uma%20área%20contaminada%20por%20creosoto.pdf (accessed on 14 December 2023).
- Osella, A.; Bongiovanni, M.V.; De La Vega, M. Development of a Geoelectric Device of Capacitive Contact for Studying Archaeological Targets in Very Resistive Zones. In Proceedings of the Near Surface Geoscience 2012—18th European Meeting of Environmental and Engineering Geophysics, Paris, France, 3–5 September 2012; EAGE Publications BV: Utrecht, The Netherlands, 2012; p. cp-306. Available online: https://www.earthdoc.org/content/papers/10.3997/2214-4609.20143455 (accessed on 14 December 2023).
- McNeill, J.D. Principles and Application of Time Domain Electromagnetic Techniques for Resistivity Sounding. 1994. Available online: http://www.geonics.com/pdfs/technicalnotes/tn27.pdf (accessed on 14 December 2023).
- Porsani, J.L. Ground Penetrating Radar (GPR): Proposta Metodológica de Emprego em Estudos Geológico-Geotécnicos Nas Regiões de Rio Claro e Descalvado–SP. Ph.D. Thesis, São Paulo State University, São Paulo, Brazil, 1999; 145p. [Google Scholar]
- Annan, A.P. Ground Penetrating Radar Workshop Notes; Sensors & Software Inc.: Mississauga, ON, Canada, 2001. [Google Scholar]
- Porsani, J.L.; Oliveira, N.C.; Penna, N.S.; Costa, V.H.H.; Stangari, M.C.; Sousa, C.C.B.F. Emprego do GPR para orientar a exploração de mármore na região de Campos do Jordão, SP: Resultados preliminares. In Anais do SimSBGf; IX Simpósio Brasileiro de Geofísica; SBGf: Curitiba, Brasil, 2022; Available online: https://www.sbgf.org.br/simposio/progfinal.pdf (accessed on 14 December 2023).
- DEMIN. Projetos e Linhas de Pesquisa. Departamento de Engenharia de Minas, UFMG. 2023. Available online: https://www.demin.ufmg.br/textoproj01.php (accessed on 20 January 2023).
- Pereira, T.F. Proposta de Retomada e Expansão para uma mina de Calcário. Unipampa, Tecnologia em Informação. 2017. Available online: https://cursos.unipampa.edu.br/cursos/tecnologiaemmineracao/files/2019/08/proposta-de-retomada-e-expansao-para-uma-mina-de-calcario.pdf (accessed on 20 January 2023).
- Curi, A. Minas a Céu Aberto: Planejamento de Lavra; Oficina de Textos: São Paulo, Brazil, 2014. [Google Scholar]
- Leite, T.M.G. Comparação Entre Métodos de Cálculo de Cava Final: Lerchs Grossmann vs. Sequenciamento Direto de Blocos. Monografia, Centro Federal de Educação Tecnológica de Minas Gerais. 2017. Available online: https://www.eng-minas.araxa.cefetmg.br/wp-content/uploads/sites/170/2018/05/Tiago_Mozart_FINAL1.pdf (accessed on 8 June 2023).
- Martins, A.C.C. Impacto da Aplicação da Geofísica no Planejamento de Lavra da Mineração de Pequena Escala. Ph.D. Thesis, Universidade de São Paulo, São Paulo, Brazil, 2017; 107p. [Google Scholar] [CrossRef]
- Micromine. Micromine Beyond: Pit Optimisation. 2023. Available online: https://www.micromine.com/micromine-training-pit-optimisation/ (accessed on 24 April 2023).
- Porsani, J.L.; Sauck, W.A.; Souza, A.O., Jr. GPR for mapping fractures and as a guide for the extraction of ornamental granite from a quarry: A case study from southern Brazil. J. Appl. Geophys. 2006, 58, 177–187. [Google Scholar] [CrossRef]


| Drill Holes | Depth (m) | Description |
|---|---|---|
| H01 | 0 to 11.0 | Soil |
| 11.0 to 43.4 | Marble | |
| H03 | 0 to 1.0 | Soil |
| 1.0 to 3.2 | Leucocratic gneiss | |
| 3.2 to 26.4 | Migmatized gneiss | |
| 26.4 to 80.0 | Marble | |
| H04A | 0 to 12.0 | Soil |
| H04B | 0 to 10.0 | Soil |
| 10.0 to 16.9 | Marble | |
| H04C | 0 to 3.5 | Soil |
| 3.5 to 12.5 | Marble | |
| H05 | 0 to 10.0 | Soil |
| H06 | 0 to 1.9 | Soil |
| 1.9 to 10.1 | Marble |
| Lines (Length) | Electrical Resistivity | Capacitive Resistivity | GPR |
|---|---|---|---|
| Line 1 (200 m) | Two ERT profiles: | Six profiles: Three with Tx and Rx dipoles distance of 5 m. Three with Tx and Rx dipoles distance of 10 m. Non-conductive rope of 2.5 m, 5 m, and 10 m lengths (variable parameter in the set of 3 profiles). | One GPR profile with 40 MHz antenna. |
| AB = 10 m and 20 m. | |||
| One VES with max. AB/2 = 150 m. | |||
| Line 2 (200 m) | Two ERT profiles: | One GPR profile with 40 MHz antenna. | |
| AB = 10 m and 20 m. | |||
| Line 3 (100 m) | Two ERT profiles: | One GPR profile with 40 MHz antenna. | |
| AB = 5 m and 10 m. | |||
| Line 4 (100 m) | Two ERT profiles: | One GPR profile with 40 MHz antenna. | |
| AB = 5 m and 10 m. | |||
| Line 5 (200 m) | Two ERT profiles: | One GPR profile with 40 MHz antenna. | |
| AB = 10 m and20 m. | |||
| One VES with max. AB/2 = 150 m. |
| Item | Value |
|---|---|
| Mass of marble (t) | 2,344,525 |
| Volume of Marble (m3) | 822,640 |
| Mass of waste (t) | 5,374,650 |
| Volume of waste (m3) | 1,990,611 |
| Strip Ratio | 2.44 |
| NPV (R$) | 2,250,921,566 |
Disclaimer/Publisher’s Note: The statements, opinions and data contained in all publications are solely those of the individual author(s) and contributor(s) and not of MDPI and/or the editor(s). MDPI and/or the editor(s) disclaim responsibility for any injury to people or property resulting from any ideas, methods, instructions or products referred to in the content. |
© 2024 by the authors. Licensee MDPI, Basel, Switzerland. This article is an open access article distributed under the terms and conditions of the Creative Commons Attribution (CC BY) license (https://creativecommons.org/licenses/by/4.0/).
Share and Cite
Penna, N.d.S.; Porsani, J.L.; Rangel, R.C.; Costa, V.H.H.; Oliveira, N.C.d.; Stangari, M.C.; Sousa, C.d.C.B.d.F. Near-Surface Geophysical Characterization of a Marble Deposit to Promote a Sustainable Small-Scale Mining. Remote Sens. 2024, 16, 1147. https://doi.org/10.3390/rs16071147
Penna NdS, Porsani JL, Rangel RC, Costa VHH, Oliveira NCd, Stangari MC, Sousa CdCBdF. Near-Surface Geophysical Characterization of a Marble Deposit to Promote a Sustainable Small-Scale Mining. Remote Sensing. 2024; 16(7):1147. https://doi.org/10.3390/rs16071147
Chicago/Turabian StylePenna, Nathália de Souza, Jorge Luís Porsani, Rodrigo Corra Rangel, Victor Hugo Hott Costa, Nicolas Correa de Oliveira, Marcelo Cesar Stangari, and Conrado de Carvalho Braz de Faria Sousa. 2024. "Near-Surface Geophysical Characterization of a Marble Deposit to Promote a Sustainable Small-Scale Mining" Remote Sensing 16, no. 7: 1147. https://doi.org/10.3390/rs16071147