Article

From Space to Field: Combining Satellite, UAV and Agronomic Data in an Open-Source Methodology for the Validation of NDVI Maps in Precision Viticulture

by
David Govi
1,2,
Salvatore Eugenio Pappalardo
3,*,
Massimo De Marchi
2 and
Franco Meggio
4,5
1
Polaris Engineering Spa, Via Turati 29, 20121 Milano, Italy
2
Advanced Master GIScience and UAS, Department of Civil, Environmental and Architectural Engineering (ICEA), University of Padova, 35100 Padova, Italy
3
Laboratory GIScience and Drones for Good, Department of Civil, Environmental and Architectural Engineering (ICEA), University of Padova, 35100 Padova, Italy
4
Department of Agronomy, Food, Natural Resources, Animals and Environment (DAFNAE), University of Padova, 35020 Padova, Italy
5
Interdepartmental Research Centre for Viticulture and Enology (CIRVE), University of Padova, Via XXVIII Aprile 14, 31015 Treviso, Italy
*
Author to whom correspondence should be addressed.
Remote Sens. 2024, 16(5), 735; https://doi.org/10.3390/rs16050735
Submission received: 30 December 2023 / Revised: 3 February 2024 / Accepted: 17 February 2024 / Published: 20 February 2024

Abstract

:
Recent GIS technologies are shaping the direction of Precision Agriculture and Viticulture. Sentinel-2 satellites and UAVs are key resources for multi-spectral analyses of vegetation. Despite being extensively adopted in numerous applications and scenarios, the pros and cons of both platforms are still debated. Researchers have currently investigated different aspects of these sources, mainly comparing different vegetation indexes and exploring potential relationships with agronomic variables. However, due to the costs and limitations of such an approach, a standardized methodology for agronomic purposes is still missing. This study aims to fill such a methodology gap by overcoming the potential flaws or shortages of previous works. To achieve this, an image acquisition campaign covering 6 months and over 17 hectares was carried out, followed by an NDVI comparison between Sentinel-2 and UAV to eventually explore relationships with agronomic variables. Comparative analyses were performed by using both classical (Ordinary Least Squares regression and Pearson Correlation) and spatial (Moran’s Index) statistical approaches: here, 90% of cases show r and MI scores above 0.6 for plain images, with these scores expectedly lowering to 72% and 52% when considering segmented images. Moreover, NDVI thematic maps were classified into clusters and validated by the Chi-squared test. Finally, the relationship and distribution of agronomic variables within NDVI and clustered maps were consistently validated through the ANOVA test. The proposed open-source pipeline allows to strengthen existing UAV and satellite applications in Precision Agriculture by integrating more agronomic variables.

Graphical Abstract

1. Introduction

Precision Agriculture (PA) has been shaping modern agriculture in the last decades. PA is characterized by a wide number of techniques and technologies aimed at optimizing crop management and resources [1]. What made the rise of PA possible was the emergence of advanced modeling by Geographic Information Systems (GIS) and remote sensing technologies combined; they can provide affordable and reliable instruments, such as satellite platforms and devices for the acquisition of remote and field-based geospatial data [2]. In particular, Precision Viticulture (PV), the specialization of PA techniques for viticulture, started to develop significantly later than other crops (later in the middle of the 2000s decade), while experiencing rapid growth [3]. At present, the most recent technologies make it possible to carry out monitoring operations surveys through Unmanned Aerial Vehicles, UAVs. The availability of multi-spectral sensors on a commercial scale, ready to work on board these vehicles, makes it possible to perform spatial analyses by using different vegetation indexes at a sub-meter pixel size resolution. However, in the current fragmentation of the Italian wine-growing regions, being characterized by a mean size of about 1 ha [4], the use of UAV technologies can still be expensive for the agricultural business, both in terms of the monetary aspect and of the active effort required for the data collection [5]. Furthermore, the effects of climate change at regional and local scales make it more complex to collect historical data series that can be consistent over time and suitable to perform predictive analysis [6]. An alternative to vehicle-based monitoring in PV is represented by the European Program for Earth Observation represented by Copernicus. The dedicated satellites of this program among the Sentinel families, (Sentinel-2), active since 2015, are designed to collect multi-spectral images. This type of passive sensor brings numerous advantages for PV: the very first is the effortless collection of open big spatial data at a negligible monetary cost for the final users, able to perform territorial analyses over time. In fact, Sentinel-2 continuously scans the Earth’s surface, capturing multi-spectral images with a temporal frequency between 2 and 10 days depending on the latitudes, delivering post-produced products with a spatial resolution ranging from 10 to 30 m pixel size. Moreover, the Copernicus program makes historical satellite data available, allowing for both spatial and temporal analyses. The main downside of such a tool in PV applications is its low spatial resolution, especially when compared with the centimeter resolution provided by UAV platforms. Although more than sufficient for monitoring operations on a global scale [7], a decametric spatial resolution can represent a relevant issue for surveying operations on a scale such as that of single vineyards. Vineyards are indeed characterized by a regular canopy distribution but with the disadvantage of not being particularly dense and with inter-rows often covered by weeds or cover crops. This means that a single Sentinel-2 pixel can contain all these elements: vines, inter-row bare soil, weeds, or cover crops, with the latest representing a non-negligible source of noise when focusing on vine vigor assessment.
So far in the scientific literature, the issue has generally been investigated by comparing the Normalized Difference Vegetation Index (NDVI) values produced from both Satellite and UAV images with the aim of measuring their relationship. In fact, NDVI is the most widely adopted vegetation index in PV, and it can be useful for several purposes as a tool at the farmers’ disposal [8,9]. Multiple studies have investigated and analyzed this issue, with most of them focusing on different prominent aspects. This study takes into account a sample of these studies in order to elaborate a synthesis of their best practices and methodologies: Sozzi et al. (2020) considered a large area of about 42 hectares while collecting UAV data only once for spatial analyses comparison by focusing on the impact of border pixels and comparing data from both sources using Pearson Correlation and an Ordinary Least Squares regression (OLS) model [10]. With the condition of removing mixed pixels and edges, the authors concluded Sentinel-2 images to be comparable to UAV images as a source for broad canopy and vine management decisions within and between vineyard blocks, though currently unable to provide vine-specific information. Nonni et al. (2018) surveyed two blocks for a total of two hectares using classical OLS models for the comparison [11], noting how preliminary results show the potential for using open-source Sentinel platforms to monitor vineyards. However, in this case, the authors declared that further research was necessary in order to evaluate the possibility of using Sentinel-2 data for the long-term monitoring of vineyards. Also, Di Gennaro et al. (2019) preferred OLS methods for the comparison, while gathering insight about the relationship with agronomic variables such as biomass, yield, and grape composition sampled within different vigor zones at harvest time [12]. Here, the authors confirm the continuity of NDVI maps at a visual inspection but refine the analysis by filtering out ground pixels from UAV maps. The latter study also shows good correlation between NDVI maps elaborated from both platforms, especially considering filtered UAV data and agronomic key parameters. Khaliq et al. (2019) performed four surveys over 2.5 hectares, performing comparisons between maps using the Pearson Correlation before dividing them into different vigor clusters and testing their variance with the ANOVA test [13]. This latter study also considers vines-only maps to be most effective in describing the observed vineyard vigor. In fact, the NDVI maps derived from the satellite imagery were found not to be in accordance with the in-field crop vigor assessment. Instead, NDVI maps from UAV imagery, generated by considering vines-only pixels, were observed to be effective in describing the vigor of a vineyard. Pastonchi et al. (2020) collected images on a single 1.4-hectare block over three different years for a total of six surveys while tracking data about yield and pruning weight, putting emphasis on the need to move from classical statistical methods to spatially savvy techniques [14]. Matese et al. (2019) surveyed a single block of 7.5 hectares once per two years, using both OLS and spatial statistical methods for their comparison [15], underlining how the use of the latter provides a more robust and powerful tool to evaluate the implications of variability within vineyards. All covered studies tend to agree on the necessity to overcome classical statistical techniques in favor of spatial statistical methods since the latter proved to help prevent the overestimation of correlation when spatial patterns are not present and are considered to constitute a more robust evaluation tool. However, each study covered different portions of time and space, whereas studies that covered a larger number of hectares were being held for fewer surveys, and vice versa. Moreover, analysis of the relationship between agronomic variables and NDVI maps built from both aerial platforms was not always included. At last, most studies point out the need to expand the conducted analysis by covering both longer periods of time and larger crop extensions.
This study aims to harmonize what was conducted in previous works by taking advantage of the virtuous methodologies and good practices they employed and expanding the analysis on both a temporal (six surveys over six months) and a spatial (17 hectares) dimension. To achieve this, a multi spatio-temporal comparison between Satellite and UAV NDVI values has been carried out along with the integration of ground-truthed agronomic variables to further validate the correspondence between the vegetation index and actual geometrical measures taken on a number of monitored vines. To do so, after pre-processing both UAV and satellite images, NDVI maps were calculated using data from both platforms; UAV-derived maps were then filtered using a segmentation algorithm in order to remove ground-related pixels and to produce NDVI maps including only pixels related to the vines. UAV images, segmented and nonsegmented, were then co-registered to the corresponding Sentinel-2 images passing from a 4 cm/pixel to a 10 m/pixel resolution by averaging their original values. Once produced, the internal consistency of all sets of images was checked, introducing the Moran’s Index (MI) as a first spatial statistical method. Later, a comparison between Satellite and UAV NDVI values was performed by using more classical approaches and parameters, such as the R 2 of an OLS model and the Pearson Correlation coefficient (r) along with spatial correlation measures such as the Bivariate MI as suggested, for example, by Matese et al. (2019) [15]. NDVI maps from both sources were then classified into three vigor clusters based on their distribution terciles as seen in the works of Matese et al. (2019) and Di Gennaro et al. (2019), and their relationship was tested using the Chi-squared test [12,15]. At last, the relationship and distribution of agronomic variables with NDVI and clustered maps were analyzed through Analysis of Variance (ANOVA) [12]. In this study, since the correlation between qualitative grape parameters and NDVI values was deemed weak [12], two quantitative variables were monitored to verify their relationship with NDVI maps: the Average Length of Shoots and the Leaf Wall Area (LWA). These are two relevant parameters for wineries’ technical directors. The Average Length of Shoots is a parameter taken into account to plan for the beginning of phytosanitary treatments, while the LWA is directly related to the health status of vines and is often considered a relevant parameter for the dosage of phytosanitary treatments [16]. Both variables are not necessarily easy to monitor from flying platforms, hence the necessity of testing their relationship with NDVI values registered from above. The relationship and distribution of the values of the two agronomic variables within NDVI and clustered maps were consistently validated through the ANOVA test. Finally, the obtained results are compared with those shown in previous research, and the feasibility and interchangeability of both platforms for different applications in Precision Viticulture is discussed.

2. Materials and Methods

As stated in the introduction, this study aims to develop a standardized methodology for the multi spatio-temporal validation of NDVI maps. To achieve this goal, the proposed statistical analysis was built to include the best practices found in the covered previous research and synthesize them in the workflow depicted in Figure 1. The workflow is composed of the following steps, each of which is explored and detailed later within this section: the first block of the workflow is dedicated to data collection and pre-processing. Satellite images are downloaded from dedicated services, while UAV images and agronomic data are collected on the field. Satellite images are then cleaned from the presence of cloudy pixels, while UAV images are co-registered to match the resolution of the firsts. The second block of the workflow is dedicated to the calculation of NDVI maps and their division into clusters based on their tercile distribution. The final block comprehends all the statistical analyses carried out. NDVI maps are evaluated using both classical and spatial statistics; NDVI clusters are first tested using the Chi-squared test, and then the distribution of the agronomic variables over the clusters is evaluated with the ANOVA test.

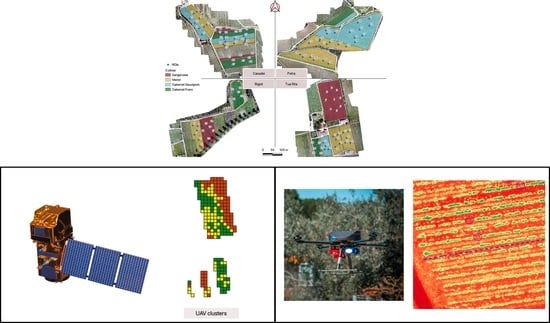
2.1. Monitoring Sites, Plant Material and Weather Data

The area of study was that of the Consorzio di Suvereto e Val di Cornia Wine located in Alta Maremma, on the coast of Tuscany in central Italy. The Consorzio comprehends the municipalities of Suvereto, Campiglia Marittima, Piombino, San Vincenzo, Sassetta, and Monteverdi, as depicted in Figure 2. The area is particularly suited to the production of high-quality wines, given its strategic position close to the Tyrrhenian Sea, the minerality of the soils, and a non-negligible centuries-old tradition.
Out of more than thirty wineries, four were selected as study sites, with the intent to represent the diversity available in the area in terms of agronomic management, exposure, and macro composition of the soil, namely, Tenuta Casadei (Casadei), Società Agricola Petra (Petra), Azienda Vinicola Rigoli (Rigoli), and Tua Rita Società Semplice Agricola (Tua Rita) as shown in Figure 3, with their charachteristics summarized in Table 1.
To account for temporal variability, the presented analysis was repeated once per month during the vegetative season. Six surveys were planned to match UAV flights with the passage of Sentinel-2. The dates, shown in Table 2, were picked by checking the Sentinel-2 acquisition calendar at Spectator [17].
Grape varieties can represent another source of variability in terms of expressed vigor. To account for this, vineyards from the four wineries were also selected to be, as much as possible, equally distributed among the four most relevant Vitis vinifera grape varieties present in the area: Sangiovese, Merlot, Cabernet Sauvignon, and Cabernet Franc. In total, the study covered an area of about 17 hectares spatially distributed as displayed in Figure 3 and divided among different cultivars as shown in Table 1.
The 2022 season was characterized by one of the worst periods of drought in recent years [18], with practically no precipitation in the most critical months for grape fructification, during June and July (Figure 4). Relevant rainfall was finally observed during the month of August, when recorded precipitations were sufficient to safeguard the quality of the wine products. The exceptional drought, along with the high positive temperature anomalies registered during the summer, not only influenced the seasonal vegetative vigor, yield, and quality but also prevented the growth of cover crops and weeds in the vineyard alleys during the warmest months of the season (June, July and August), with a couple of exceptions arising during the second part of August as witnessed in Table 3.
Since weeds and cover crops are expected to have an impact on the statistical comparison of NDVI values, the four wineries were selected to account for such variability. At the Rigoli study area, weeds were left free to grow until late April before being mowed and controlled for the rest of the season. At the Casadei and Tua Rita study areas, cover crops were largely used (mostly Vicia faba minor L.) as a natural fertilizer and mowed by the end of April. At Petra, the study area presented a mixture of cover crops used on alternate rows. No other techniques to manage the vigor of the vines, and that could affect the recorded NDVI values, were used by the producers during the monitored period.

2.2. Satellite Images

Sentinel-2 products can be freely downloaded from the Copernicus Open Access Hub [20]. For this study, only Level-2A products were used, as they were available for all mentioned dates. Among all available products, only two spectral bands, band 4 (665 nm) and band 8 (842 nm), and the Scene Classification (SC) were considered. The two downloaded bands, respectively RED and NIR, were those needed to compute the NDVI spatial analysis according to Rouse et al. (1974) [8]:
N D V I = N I R R E D N I R + R E D
Once computed, Satellite NDVI output was cleaned using the SC layer as a mask. The SC comes at a resolution of 20 m spatial resolution, where pixel values range from 0 to 1 as in Figure 5. This product was extremely useful for masking out unwanted pixels and unnecessary noise from Sentinel-2 multi-spectral images. In this case, all pixels from the Satellite NDVI not corresponding to values 4 (Vegetation) and 5 (Not-vegetated) of the SC were removed. This process was performed mostly to avoid noisy pixels or pixels classified as clouds, which may loom over the studied vineyards, being included in the NDVI calculation.

2.3. Unmanned Aerial Vehicles Images

The UAV platform used for the present study was projected and realized by MAVTech Srl, a spin-off company from the Politecnico di Torino, with the collaboration of LIBRA SRL. This custom UAV platform, namely, the MAV-4QL-01/APR, was equipped with a Micasense Rededge M multi-spectral sensor characterized as described in Table 4.
All surveys were conducted in the central hours of the day, between 10:00 and 14:00. To maintain a level of coherence within the collected data, the visiting order to the four wineries was always maintained the same for all three dates: Rigoli, Tua Rita, Casadei and finally Petra. Aerial images were acquired at a nominal resolution of 1280 × 960 pixels, from an average flight height of 60 m above the ground, proceeding at an average speed of 2 m/s and with an 80% forward and vertical overlap of the images. Since the drone had no RTK module, all images were georeferenced, exploiting the permanent elements of the landscape already present in the sites of the study as Ground Control Points (GCPs). For each site, at least 10 GCPs at the border of the vineyards and at least 5 GCPs within the perimeter of the vineyards were identified. This allowed for the coordinates of the GCPs to be recorded only during the first survey by making sure the selected GCPs were always going to be visible during the period of the study. The procedure was carried out with a differential GNSS system, namely, the Leica GPS1200, with an accuracy of 0.03 m. The collected pictures were then processed with photogrammetry techniques by the software Agisoft Metashape 1.8.3© to produce the required orthophotos. A camera geometric calibration procedure was performed before the image alignment task; moreover, a radiometric calibration was applied to the image blocks by using the reference images of the Micasense calibrated reflectance panel acquired before and after each UAV flight. Once multi-spectral images were collected, NDVI maps from UAV were calculated with Equation (1).
It must be noted that a calibration issue occurred at F1 at Tua Rita, at F2 at Casadei, and at F3 at Petra. All data corresponding to these surveys were removed from the study.

2.4. Images Alignment, Segmentation and Consistency Analysis

NDVI maps from both platforms were processed to be matched. In particular, UAV images needed to be re-sampled to match the Sentinel-2 images’ pixel size. To achieve this, Coregistration, an image-to-image automatic co-registration processing QGIS plugin, was employed [21,22]. UAV images were therefore brought from a 4 cm/pixel to a 10 m/pixel resolution by averaging the original values, and co-registered to the Sentinel-2 images. The vineyards’ polygons were then dissolved and given a 10 m internal buffer. This was performed since the inclusion of vineyard borders is well known to decrease the correlation between registered Sentinel and UAV data [10]. Though other studies have already applied masks for border effects, a statistical justification is still missing [23]. At this point, the previously computed NDVI maps were clipped using the buffered vineyards polygons, allowing maps derived from both platforms to perfectly match as shown in Figure 6.
As mentioned, vineyards are row-structured crops and, particularly at the early phenological stages when the LWA is still small as compared to the inter-alley distance, vine canopies are not the element of a vineyard that covers the highest percentage of pixels in an aerial image. Soil, shadows, weeds, and cover crops represent a prominent part of orthomosaics. In order to assess the relationship between satellite images and agronomic variables with pure-vine NDVI maps derivable from UAV images, a segmentation process was carried out to remove all non-vine pixels from images.
Correctly classifying UAV images to recognize vines, soil, and weeds/cover crops is one of the most important steps to ensure the high quality of the produced maps. For this purpose, many advanced techniques have been developed in the last few years, with Deep Learning algorithms being seemingly the most promising ones [24]. However, these techniques are still experimental and need more refining. At present, unsupervised algorithms have proved to be accessible and solid solutions for this task. Among the many available, for this study, the K-Means algorithm for RGB image segmentation, as described in Cinat et al. (2019) [25], was implemented in Python 3.10. Basically, the algorithm takes an RGB image of a vineyard as input and converts it into CIE-L*a*b* format to augment the performance of the K-Means algorithm. In the L*a*b* color space, colors are seen in a spatial distribution line of Luminance (L*), green-red line (a*), and yellow-blue distribution line (b*) [25]. The conversion from RGB to L*a*b* was performed with the skimage library, using the d65 reference white that simulates the not exposed colors. K-Means was then set to identify k = 5 clusters. The cluster with the lower value of a*, the strongest intensity of green, was identified as vines, while the shadows cluster was selected as the one with a positive value of a* and a lower value of b*. The remaining three clusters were identified as soil. The algorithm provided good results but resulted to be memory expensive. This was not a major issue for this work but it is still worth noting. Overall, the algorithm was quite capable of correctly classify vines, shadows, and soil as visible in Figure 7.
Operationally, to manage the memory workload, UAV RGB images were clipped by the vineyard polygons and fed to the algorithm. The returned segmented scenes were then remapped, giving a value of 1 to the vines cluster and a value of 0 to all other clusters, and merged back together. The mask built with this procedure allowed to remove non-vine pixels from UAV NDVI maps at their original resolution. At this point, the co-registration process described before was replicated, but only pixels corresponding to those belonging to the vines cluster were averaged to match the Sentinel resolution.
The described processing led to the production of three datasets, with each dataset composed of 24 images:
  • NDVI S2: NDVI maps derived from Sentinel-2 multi-spectral images;
  • NDVI UAVplain: NDVI maps derived from full UAV multi-spectral images;
  • NDVI UAVvines: NDVI maps derived segmenting vines-only pixels from UAVplain images.
Once produced, all images of the three datasets were tested for their internal consistency. To achieve this, the Moran’s Index (MI), a measure of spatial autocorrelation, was used [26]. MI is a measure of global spatial autocorrelation of the data within an analyzed area. Its value ranges from 1 to +1: for an observation at position i, a positive autocorrelation means that values in the neighborhood are similar to zi, while a negative spatial autocorrelation implies dissimilar values at nearby locations, and the zero value (MI = 0) indicates the absence of spatial autocorrelation. Univariate MI returns information about the correlation between a variable X and its spatial lag, formed by averaging all values of X for the neighboring polygons [26]. The analysis was processed using GeoDa 1.20.0.20 [27]. At first, the calculation of spatial weights was necessary since they are used to measure nearness and proximity between observations. GeoDa gives the possibility to manage the spatial weights.
As expected, all results shown in Table 5 were positive and show high MI scores. In fact, only two results scored a MI value lower than 0.6, indicating high spatial consistency for all produced images. p-values and z-scores were not reported, as they were all respectively <0.001 and >2.58.

2.5. Comparative Spatial Analyses

The classical approach in comparative studies is to use OLS models and analyze correlations measured as their coefficient of determination ( R 2 ) values and Pearson Correlation between the interested variables. However, this kind of comparison has been deemed possibly biased, as common regression methods can only analyze the relationship between dependent and independent drivers but cannot consider spatial dependence [28,29]. To overcome such issues, a spatial statistical approach was integrated to provide higher reliability to the comparisons. In fact, Bivariate MI helps measure the spatial autocorrelation between a variable X and the spatial lag of a second variable Y, formed by averaging all values of Y for the neighboring polygons. For each flight campaign, NDVI maps from UAV images were compared to NDVI S2 values using either classical or spatial statistical approaches. The latter, unlike the classical method, considered the structure and geospatial variability present within the vineyard. All these comparisons were performed using the GeoDa software Version 1.22.
Continuous NDVI maps are indeed a valuable tool for wineries’ technical directors. These thematic maps can be further elaborated to produce more intelligible insights. Continuous values can, in fact, be divided into clusters to determine areas of Low, Medium, and High vigor as exemplified in Figure 8. These clusters, available in Appendix A, can give technical directors a valuable piece of information that can allow them more efficient vineyard management practices. In order to assess the quality of the information provided by such clustering, the values from all NDVI maps were separated on the terciles of their distributions, as seen in the works of Matese et al. (2019) and Di Gennaro et al. (2019), and tested using a Chi test, used to determine whether there is a significant association between two categorical variables in data [12,15]. Clustering by terciles allows to place the thresholds of the three clusters relative to the NDVI values of each parcel and to represent the internal variability of the latter.

2.6. In-Field Validation and Ground Data

To further evaluate Satellite and UAV data, 107 Regions of Interest (ROIs) were identified in order to monitor vigor-related parameters, such as the Average Length of Shoots and the LWA at each monitoring date during the season. Every ROI encompassed five vines representative of the area. At each plant, measures for both the considered agronomic variables were taken manually using a measuring tape. In particular, for the Average Length of Shoots, the average length of the four shoots more representative of the health state of the plant was recorded. The reported values were then averaged to obtain the Average Length of Shoots for each ROI. The LWA was calculated for each plant by multiplying the height of its leaf wall (hence, the previously obtained Average Length of Shoots) with the horizontal length of its leaf wall. Then, similarly to what was previously performed with the Average Length of Shoots, the reported values were then averaged to obtain the LWA for each ROI. The position of the ROIs was decided to respect the shape and variability of the vineyards as shown in Figure 3. Once determined, the spatial coordinates of all ROIs were recorded with the differential GNSS system.
To test the agronomic variables’ correspondence to what is visible through Satellite and UAV images, their distribution over NDVI clusters was tested using the ANOVA test. The ANOVA test, in this case, allowed to verify whether the observed distribution of the agronomic variables over the NDVI clusters created from all three datasets had a meaningful statistical difference [30].

3. Results

After detailing the context of the study and the proposed methodology, in this section, the obtained results are presented. In the first section, the results obtained from classical statistical approaches are shown in Table 6 and Table 7. Afterward, the results from the spatial statistical analysis, such as the Bivariate MI, described in Section 2.5, are presented in Table 8 and Table 9. At the end, the distribution of both agronomic variables over the NDVI clusters created from the three datasets is evaluated (Table 10, Table 11 and Table 12), before being deepened with the ANOVA test (Tables 16–18).

3.1. Classical Statistical Approach: Ordinary Least Square Regression

In Table 6, the coefficients of determination ( R 2 ) obtained using a classical OLS model are reported. The model was implemented using NDVI S2 and NDVI UAVplain as variables, the VIs computed from Sentinel-2 and full UAV imagery, respectively. It is possible to notice that about 90% of the resulting R 2 values were higher than 0.6 with the only low value being at F2 at Tua Rita, possibly due to the mowing of the cover crops having just taken place at the time of the survey. All Pearson Correlation values showed good correlations with values above 0.6.
The same procedure was applied considering NDVI S2 and NDVI UAVvines; indeed, the NDVI maps derived segmenting pure vine pixels from UAVplain images (Table 7). In this case, at F1, no values are reported since no foliage to be segmented was available before the budburst stage (24 March 2022). As expected, lower coefficient of determination values were obtained as compared to previous analysis (Table 6), with about 44% of registered R 2 values being higher than 0.6. The relationship between NDVI S2 and NDVI UAVvines was expected to provide lower values, as under such discontinuous tree crop (vineyard), only a small part is represented by the vine canopy, and thus, in the mixed pixels of the NDVI S2, most of the effect is related to the background. Both Table 6 and Table 7 show values in line with what was highlighted by previous studies [10,11,12,14,15].

3.2. Spatial Statistical Analysis: Bivariate Moran’s Index

The spatial statistic approach was used to give a more unbiased insight into the correspondence of two spatially distributed variables by determining the presence or absence of spatial autocorrelation among them. The Bivariate MI analysis was performed comparing the NDVI maps of Sentinel-2 imagery with the NDVI computed on UAVplain (Table 8) and UAVvines (Table 9), respectively. In about 90% of the cases (flight dates and sites), the MI score resulted in being higher than 0.6, while the values resulted in being lower when segmenting UAV pure vines pixels (UAVvines) where only 52% of maps showed R 2 values higher than 0.6 (Table 9). While these results could be apparently considered similar to those obtained using the classical OLS model, they are more representative of the inner relationships existing between S2 and UAV maps, as MI compare the values in a nearby matrix and not only cell by cell. As observed for OLS analysis, the relationship between NDVI S2 and NDVI UAVvines (pure vine pixels) resulted in being coherently lower than the one performed on full UAV multi-spectral images (NDVI UAVplain). Only two observations such as F4 and F5 at Petra site showed unexpectedly low values, yielding R 2 values of about 0.189 and 0.057, respectively. Even though at F4 and F5 cover crops were registered as absent from every vineyard in Table 3, at the Petra site, upon visual analysis there still were a few green patches that sent the segmentation algorithm astray, thus making behaviors such as this and that observed in Table 7 for the same flights possibly imputable to shortages in the segmentation process.
The comparison of NDVI clustered maps allowed to deepen the analysis between NDVI S2, NDVI UAVplain and NDVI UAVvines. All produced maps (provided as supplementary material in Appendix A (Figure A1, Figure A2, Figure A3, Figure A4, Figure A5 and Figure A6) showed appreciable results in terms of the tightness of the clusters. This was expected considering that in the results obtained using the Monovariate MI analysis, the NDVI values were deemed to be not randomly clustered. This notion was further strengthened by the use of the Chi-squared test [31]. The results obtained by the Chi-squared test performed between the datasets showed high significance (p-values < 0.001) in all cases, meaning that the categorical variables obtained (clusters) were correctly associated with each other, and, coherently, a spatial correlation between them existed.

3.3. Distribution Assessment of Agronomic Variables over NDVI Clusters

To assess for significant relationships resulting between NDVI clusters and ground-truth agronomic variables, indeed, the Average Length of Shoots and the LWA, different methods are required than those used to compare NDVI maps. To evaluate the accuracy of the agronomic variables’ correspondence with the three NDVI datasets, the values of both variables were further divided into the three NDVI clusters and averaged. For each variable and each dataset, it was possible to observe whether cells from NDVI maps classified as Low were showing lower values than those clustered as Medium and whether the latest were showing lower values than those clustered as High. This relationship was further quantified using the ANOVA, a statistical test used to analyze the difference between the means of more than two groups. Table 13, Table 14, Table 15 and Tables 19–21 report the correspondence of the agronomic variables collected in the field with the NDVI clustered maps for the NDVI S2, NDVI UAVplain and NDVI UAVvines maps, respectively.
Table 10 reports the NDVI S2 dataset. It is possible to observe that in 80% of the cases, cells classified as Low NDVI well reported Average Length of Shoots values lower than those found in Medium NDVI ones. This percentage remained roughly consistent (85%) when considering NDVI UAVplain (Table 11), while it is significantly increased to 100% of the cases when considering the NDVI UAVvines (Table 12). In the cells classified as High NDVI, higher Average Length of Shoots values were registered as compared to those found in Medium NDVI on 95%, 85%, and 95% of the cases when considering NDVI S2 (Table 10), NDVI UAVplain (Table 11), and 95% when dealing with NDVI UAVvines (Table 12), respectively.
The ANOVA test increases the depth of the analysis around the distribution of agronomic variables over NDVI clusters. Table 13 shows how only in 15% of the cases, at least two out of three categories have significant differences in their means (p-value < 0.05) when considering NDVI S2, while this percentage increases to 35% in the case of NDVI UAVplain (Table 14) and to 80% in case of NDVI UAVvines (Table 15).
The same analysis was repeated for the LWA. Table 16 shows how, considering NDVI S2, in 81% of the cases, cells with Low NDVI registered LWA values lower than those found in Medium NDVI. This percentage slightly lowers to 75% when considering NDVI UAVplain (Table 17), while increasing to 94% when dealing with NDVI UAVvines (Table 18). Moreover, cells with High NDVI register LWA values higher than those found in Medium NDVI in 81% of the cases when considering NDVI S2 (Table 16), 75% of the cases when considering NDVI UAVplain (Table 17) and 100% of the cases when dealing with NDVI UAVvines (Table 18).
For this variable, the ANOVA test shows slightly lower results, with 12.5% of the cases where at least two out of three categories have a significant difference in their means (p-value < 0.05) when considering NDVI S2 (Table 19), while this percentage increases to 31% in the case of NDVI UAVplain (Table 20) and to 69% in the case of NDVI UAVvines (Table 21).

4. Discussion

The obtained results help to better understand the relationship between S2 and UAV data and how they can be used to power applications able to monitor relevant agronomic variables. NDVI S2 and NDVI UAVplain were indeed strongly related. In fact, when compared with classical methods such as OLS models, they showed high scores in both R 2 and r with the only outlier (at Tua Rita at F2) possibly being justified by the fact that just mowed cover crops could represent a non-negligible source of noise. The obtained results as seen in Table 6 show that in 90% of the cases, the value of r is higher than 0.60, resembling that seen in Khaliq et al., with such cases comprising 65% of the total [13].More generally, the correlation between NDVI S2 and UAVplain, also explored in terms of the Pearson Correlation by Sozzi et al. and in terms of R 2 of an OLS model by Pistonchi et al., Di Gennaro et al., and Nonni et al., shows good and consistent values [10,11,14]. The values of the same coefficient were expectedly lower when comparing NDVIplain and NDVIvines. Khaliq et al. register a drop in values, where 75% of the r scores are lower than 0.41. This is in contrast to that seen in this study, where the number of cases found to have r scores higher than 0.6 drops but not excessively, from 90% to 72%. A higher drop is seen in R 2 though, going from 90% to 44% of cases, showing results higher than 0.6. The work of Pastonchi et al. also suggests a declining trend in OLS scores when comparing the correlation of NDVI S2 with NDVIplain and NDVIvines [14]. This seems to suggest that NDVI S2 should not be expected to be able to approximate NDVI values computed by looking at pure-vine pixels from UAV images. As already indicated though, classical statistical methods are to be taken lightly in a setting such as that considered in the present work. Stronger indications come by looking at more reliable measures such as the multivariate MI as already suggested by Matese et al. [15]. Table 8 and Table 9 indeed show how NDVI S2 and NDVI UAVplain consistently produced better results than NDVI S2 and NDVI UAVvines, confirming what was already glimpsed using classical statistical approaches. This complements what was reported by Pastonchi et al., where in some cases bivariate MI comparisons of NDVI S2 and NDVI UAVplain show better results than comparisons of NDVI S2 and NDVIvines [14]. This is indeed plausible but remains a minority among cases in terms of visibility when considering a higher number of cases as performed in this study.The NDVI value, though it is not necessarily valuable information by itself, gains value in its spatial relationship with a neighborhood of other values. The comparison of spatially clustered NDVI maps comes to help in this sense. In this case, in fact, the Chi-squared test returns significant results for all produced maps, indicating a relationship between NDVI clusters as created from all three datasets. As it was possible to expect, upon visual assessment, NDVI clusters from NDVI UAVplain are extremely similar to those generated by grouping NDVI S2 values, while with NDVI UAVvines, it is actually possible to spot a few relevant differences as seen, for example, at Petra at F4 (Figure A4) and F5 (Figure A5) (actually the two flights with the lowest results with both comparison methods). Even though there is a difference in NDVI S2 and NDVI UAVvines, as testified by comparisons undergone with both OLS and multivariate MI, the first still managed to convey a relevant portion of the information carried by the second in terms of spatial distribution of NDVI data.
Despite the highest percentage of pixels in an image being represented by soil, NDVI values related to this element have very low variability, as they all physiologically tend to 0, thus enabling the distribution of vines vigor to come out, especially starting from F4 (27 June 2023) when the track of cover crops generally disappeared. Vice versa, at the time of the first three flights, cover crops were still present, even though with a decreasing presence, thus affecting the variation of values in NDVI S2. At the same time, the first flights represented a period of limited expressed vegetative vigor, hence, a period where monitoring a vineyard by the use of S2 images was predictably less feasible. As S2 NDVI clusters are considered to be similar to those producible by NDVI UAVvines, they can represent a valid tool for monitoring vigor distribution in a vineyard through NDVI on broad scenarios and a valid source of information to support agronomic decisions. A conclusion shared by most other works present in the literature and taken into account by the present study [10,11,14], with the exception of Khaliq et al. that, even though from a smaller data sample, found NDVI S2 capabilities to be insufficient to monitor the spatial variability of vineyards’ vigor [13]. It is thus possible to state that NDVI S2 can be, with higher reliability in periods where cover crops are not present and foliage and vegetation are in advanced stages, a valuable and sufficiently reliable tool for broad applications.
On the other hand, UAV images could be used to complement this information, especially in the first stages of the season when cover crops and weeds might still be present and vine vegetation is at its initial and most delicate moment. For this purpose, it was relevant to analyze the ability of the two platforms to monitor the considered ground-truthed agronomic variables, the Average Length of Shoots and the LWA. Considering the first one, it was possible to observe how its values distribution among NDVI clusters was coherent in the majority of the cases for all three datasets (Table 10, Table 12 and Table 14). More interesting to observe were the results of the ANOVA test, which failed in most cases to denote significant differences between the means of the clusters when considering NDVI S2 (85%) and NDVI UAVplain (65%) as shown in Table 13 and Table 14. This could be due to the fact that most of the NDVI UAVplain information is related to soil and partially shadows, flattening the ability to show information about agronomic variables. In NDVI UAVvines, instead, the selection of pure-vine pixels allowed a better assessment of cluster differences as seen in Table 15. Such conclusions resemble those found in other works, such as those of Khaliq et al. and Di Gennaro et al. [12,13]. The same goes if considering the LWA: its value distribution is mostly well separated within the three clusters for all three datasets (Table 16, Table 17 and Table 18), but their score values for the ANOVA test show a trend similar to that found for the Average Shoots Length. In fact, the ANOVA test scores are significant in determining differences between the means of the clusters when considering NDVI S2 only in 12,5% of cases (Table 19), while increasing to 31% (Table 20) and 69% (Table 21) of the times when considering UAVplain and UAVvines. NDVIvines thus show to have a higher correlation than the other two datasets with agronomic variables. This reinforces the idea that satellite data are not suitable for vine-specific tasks and must be limited to broader monitoring activities, while segmented UAV images can help to gather NDVI values highly correlated with most agronomic variables.
Figure 9 helps to resume the information gathered during the discussion of the results of the statistical analysis and to conjugate the different possible usages of satellite and UAV data. NDVI maps from Sentinel-2 imagery proved to be a consistent and trustworthy tool for large-scale applications, with NDVI clusters such as those provided in the Appendix A (Figure A1, Figure A2, Figure A3, Figure A4, Figure A5 and Figure A6) are to be considered a valuable output for wineries’ technical directors. However, NDVI maps from satellite data suffer from some limitations which come to surface in the case that the monitoring is conducted during the vines’ early phenological stages or in the case that grassing or cover crops are present in the inter-rows of the monitored vineyard. UAV platforms have the ability to cover such shortages: despite having their own flaws, segmentation algorithms allow to separate inter-row pixels from UAV-derived NDVI maps and thus provide clean and reliable information. Moreover, given the existing correlation with quantitative agronomic variables, UAV platforms could provide insights into the early stages of the growing season. More in general, despite their usage coming at a greater cost, UAVs remain the preferred platform for performing vine-specific tasks.

5. Conclusions

Multi-spectral images from aerial platforms may represent an important source of information for the field of PA and PV. In the last decades, different studies have assessed the quality of information provided by satellite platforms with the intent to give agronomists and farmers valuable tools for decision support. Comparisons of S2 and UAV images were reported in several studies by highlighting the limitations and potentialities of both platforms. In this frame, the present study connected the most relevant points touched by previous works and conducted the analysis over a broad and consistent space and time span. The results obtained allow to stress the importance of bypassing the dichotomy between the usage of S2 and UAV and sustaining the necessity of their integration. This study shows evidence that S2 can be a valuable platform for large-scale monitoring, as it passively produces multi-spectral images at a tendentiously irrelevant cost, providing a strong correspondence with UAV imagery. In this case, the creation of NDVI clusters turned out to be a more useful output compared to the values of single cells. An NDVI value does not tell much about what happens in its 10 m/pixel cells, but it better explains if in its neighborhood similar and coherently clustered values are present. It is nonetheless relevant to understand how and how much this information can be disturbed by the presence of cover crops and weeds, especially when they are not uniformly distributed. These flaws can be efficiently bridged by UAV platforms that make the monitoring of grass-covered vineyards possible. Moreover, segmented UAV data show a good relationship with agronomic variables, thus becoming the reference for precision applications, especially in the initial stages of vine growth. Both these tools can take advantage of their integration by representing an invaluable source of information for agronomists and farmers in wineries and in other agricultural businesses.

Author Contributions

Conceptualization, D.G., S.E.P., M.D.M. and F.M.; methodology, D.G., S.E.P. and F.M.; software, D.G.; validation, S.E.P., M.D.M. and F.M.; formal analysis, D.G.; investigation, D.G.; resources, D.G. and M.D.M.; data curation, D.G.; writing—original draft preparation, D.G.; writing—review and editing, D.G., S.E.P., M.D.M. and F.M.; visualization, D.G., S.E.P. and F.M.; supervision, S.E.P., M.D.M. and F.M.; project administration, S.E.P., M.D.M. and F.M.; funding acquisition, D.G. and M.D.M. All authors have read and agreed to the published version of the manuscript.

Funding

This research received no external funding.

Data Availability Statement

Data are contained within the article.

Acknowledgments

The authors are grateful to Silvia Pulice and Marco Magazzini (LIBRA SRL) for technical support on UAV image acquisition. They also acknowledge Casadei, Petra, Rigoli and Tua Rita wineries for having hosted the experimental activities.

Conflicts of Interest

David Govi is employed by Polaris Engineering Spa. All the other authors declare no conflicts of interest.

Abbreviations

The following abbreviations are used in this manuscript:
ANOVAAnalysis of Variance
GISGeographic Information System
GCPsGround Control Points
LWALeaf Wall Area
MIMoran’s Index
NDVINormalized Difference Vegetation Index
OLSOrdinary Least Squares regression
ROIRegion of Interest
PAPrecision Agriculture
PVPrecision Viticulture
SCScene Classification
UAVUnmanned Aerial Vehicles

Appendix A. NDVI Clusters

Figure A1. NDVI clusters at F1.
Remotesensing 16 00735 g0a1
Figure A2. NDVI clusters at F2.
Remotesensing 16 00735 g0a2
Figure A3. NDVI clusters at F3.
Remotesensing 16 00735 g0a3
Figure A4. NDVI clusters at F4.
Remotesensing 16 00735 g0a4
Figure A5. NDVI clusters at F5.
Remotesensing 16 00735 g0a5
Figure A6. NDVI clusters at F6.
Remotesensing 16 00735 g0a6

References

  1. Crookston, R.K. A top 10 list of developments and issues impacting crop management and ecology during the past 50 years. Crop Sci. 2006, 46, 2253–2262. [Google Scholar] [CrossRef]
  2. Weiss, M.; Jacob, F.; Duveiller, G. Remote sensing for agricultural applications: A meta-review. Remote Sens. Environ. 2020, 236, 111402. [Google Scholar] [CrossRef]
  3. Santesteban, L.G. Precision viticulture and advanced analytics. A short review. Food Chem. 2019, 279, 58–62. [Google Scholar] [CrossRef]
  4. ISTAT. Stima Sulla Superficie Vitivinicola e Produzione Vinicola; ISTAT: Roma, Italy, 2021.
  5. Malone, P.; Apgar, H.; Stukes, S.; Sterk, S. Unmanned aerial vehicles unique cost estimating requirements. In Proceedings of the 2013 IEEE Aerospace Conference, Big Sky, MT, USA, 2–9 March 2013; pp. 1–8. [Google Scholar]
  6. D’Odorico, P.; Gonsamo, A.; Damm, A.; Schaepman, M.E. Experimental evaluation of Sentinel-2 spectral response functions for NDVI time-series continuity. IEEE Trans. Geosci. Remote Sens. 2013, 51, 1336–1348. [Google Scholar] [CrossRef]
  7. Segarra, J.; Buchaillot, M.L.; Araus, J.L.; Kefauver, S.C. Remote sensing for precision agriculture: Sentinel-2 improved features and applications. Agronomy 2020, 10, 641. [Google Scholar] [CrossRef]
  8. Rouse, J.W., Jr.; Haas, R.H.; Deering, D.; Schell, J.; Harlan, J.C. Monitoring the Vernal Advancement and Retrogradation (Green Wave Effect) of Natural Vegetation. No. E75-10354. 1974. Available online: https://ntrs.nasa.gov/citations/19730017588 (accessed on 2 May 2023).
  9. Huang, S.; Tang, L.; Hupy, J.P.; Wang, Y.; Shao, G. A commentary review on the use of normalized difference vegetation index (NDVI) in the era of popular remote sensing. J. For. Res. 2021, 32, 1–6. [Google Scholar] [CrossRef]
  10. Sozzi, M.; Kayad, A.; Marinello, F.; Taylor, J.; Tisseyre, B. Comparing vineyard imagery acquired from Sentinel-2 and Unmanned Aerial Vehicle (UAV) platform. Oeno One 2020, 54, 189–197. [Google Scholar] [CrossRef]
  11. Nonni, F.; Malacarne, D.; Pappalardo, S.E.; Codato, D.; Meggio, F.; De Marchi, M. Sentinel-2 Data Analysis and Comparison with UAV Multispectral Images for Precision Viticulture. GI Forum 2018, 1, 105–116. [Google Scholar] [CrossRef]
  12. Di Gennaro, S.F.; Dainelli, R.; Palliotti, A.; Toscano, P.; Matese, A. Sentinel-2 validation for spatial variability assessment in overhead trellis system viticulture versus UAV and agronomic data. Remote Sens. 2019, 11, 2573. [Google Scholar] [CrossRef]
  13. Khaliq, A.; Comba, L.; Biglia, A.; Ricauda Aimonino, D.; Chiaberge, M.; Gay, P. Comparison of satellite and UAV-based multispectral imagery for vineyard variability assessment. Remote Sens. 2019, 11, 436. [Google Scholar] [CrossRef]
  14. Pastonchi, L.; Di Gennaro, S.F.; Toscano, P.; Matese, A. Comparison between satellite and ground data with UAV-based information to analyse vineyard spatio-temporal variability: This article is published in cooperation with the XIIIth International Terroir Congress November 17-18 2020, Adelaide, Australia. Guest editors: Cassandra Collins and Roberta De Bei. Oeno One 2020, 54, 919–934. [Google Scholar]
  15. Matese, A.; Di Gennaro, S.F.; Santesteban, L.G. Methods to compare the spatial variability of UAV-based spectral and geometric information with ground autocorrelated data. A case of study for precision viticulture. Comput. Electron. Agric. 2019, 162, 931–940. [Google Scholar] [CrossRef]
  16. Walklate, P.; Cross, J. An examination of Leaf-Wall-Area dose expression. Crop Prot. 2012, 35, 132–134. [Google Scholar] [CrossRef]
  17. Spectator. Available online: http://app.spectator.earth (accessed on 2 May 2023).
  18. CNR Institute of Atmospheric Sciences and Climate—Climate Monitoring for Italy. Available online: https://www.isac.cnr.it/climstor/ (accessed on 2 May 2023).
  19. Weather Underground. Available online: https://www.wunderground.com/ (accessed on 2 May 2023).
  20. Copernicus Open Access Hub. Available online: https://scihub.copernicus.eu/ (accessed on 2 May 2023).
  21. QGIS Development Team. QGIS Geographic Information System; Open Source Geospatial Foundation: Chicago, IL, USA, 2009. [Google Scholar]
  22. Xavier Corredor Llano. Coregistration QGIS Plugin; Colombian Forest Monitoring System, SMByC: Colombia, 2021; Available online: https://github.com/SMByC/ (accessed on 2 May 2023).
  23. Devaux, N.; Crestey, T.; Leroux, C.; Tisseyre, B. Potential of Sentinel-2 satellite images to monitor vine fields grown at a territorial scale. Oeno One 2019, 53, 52–59. [Google Scholar] [CrossRef]
  24. Barros, T.; Conde, P.; Gonçalves, G.; Premebida, C.; Monteiro, M.; Ferreira, C.S.S.; Nunes, U.J. Multispectral vineyard segmentation: A deep learning comparison study. Comput. Electron. Agric. 2022, 195, 106782. [Google Scholar] [CrossRef]
  25. Cinat, P.; Di Gennaro, S.F.; Berton, A.; Matese, A. Comparison of unsupervised algorithms for Vineyard Canopy segmentation from UAV multispectral images. Remote Sens. 2019, 11, 1023. [Google Scholar] [CrossRef]
  26. Moran, P.A. Notes on continuous stochastic phenomena. Biometrika 1950, 37, 17–23. [Google Scholar] [CrossRef] [PubMed]
  27. Anselin, L.; Syabri, I.; Kho, Y. GeoDa: An introduction to spatial data analysis. In Handbook of Applied Spatial Analysis: Software Tools, Methods and Applications; Springer: Berlin/Heidelberg, Germany, 2009; pp. 73–89. [Google Scholar]
  28. Taylor, J.; Bates, T. A discussion on the significance associated with Pearson’s correlation in precision agriculture studies. Precis. Agric. 2013, 14, 558–564. [Google Scholar] [CrossRef]
  29. Anselin, L.; Rey, S.J. Modern Spatial Econometrics in Practice: A Guide to GeoDa, GeoDaSpace and PySAL. 2014. Available online: https://sergerey.org/giasp16/pdfs/anselin_rey_weights.pdf (accessed on 2 May 2023).
  30. St, L.; Wold, S. Analysis of variance (ANOVA). Chemom. Intell. Lab. Syst. 1989, 6, 259–272. [Google Scholar]
  31. Ugoni, A.; Walker, B.F. The Chi square test: An introduction. COMSIG Rev. 1995, 4, 61. [Google Scholar]
Figure 1. The workflow for the statistical analysis followed during the study.
Remotesensing 16 00735 g001
Figure 2. The area of the Consorzio di Suvereto e Val di Cornia Wine.
Remotesensing 16 00735 g002
Figure 3. The vineyards under study belonging to the four wineries, labeled for cultivar, and ROIs positions.
Remotesensing 16 00735 g003
Figure 4. Total precipitation and air temperature in the area and period of the study compared with the long-term data for the period 2001–2021 as per the data available at Weather Spark [19].
Remotesensing 16 00735 g004
Figure 5. Scene Classification and NDVI map with noisy pixels removed.
Remotesensing 16 00735 g005
Figure 6. An example of co-registration of an UAV NDVI map to a Satellite NDVI map.
Remotesensing 16 00735 g006
Figure 7. Example of a segmented UAV image obtained with the K-Means algorithm.
Remotesensing 16 00735 g007
Figure 8. Example of NDVI clustering realized from S2 and UAV imagery.
Remotesensing 16 00735 g008
Figure 9. Workflow for the integration of alternative usages of satellite and UAV imagery for PV.
Remotesensing 16 00735 g009
Table 1. Summary of the characteristics of the four wineries.
WinerySoil TextureSoil ManagementLayout (m)CultivarExtension (ha)Training Method
CasadeiSilty clay loamAlternated cover crop1.80 × 0.80Sangiovese0.45Double spurred cordon
Merlot1.21Spurred Cordon
Cabernet Sauvignon1.11Spurred Cordon
Cabernet Franc1.24Double Spurred Cordon
PetraClay loamAlternated cover crop1.60 × 0.80Sangiovese//
Merlot2.82Guyot
Cabernet Sauvignon3.39Guyot
Cabernet Franc0.47Spurred Cordon
RigoliSandy clay loamSpontaneous grassing2.20 × 0.80Sangiovese0.88Spurred Cordon
Merlot0.76Spurred Cordon
Cabernet Sauvignon//
Cabernet Franc0.62Guyot
Tua RitaLoamAlternated cover crop1.40 × 0.80Sangiovese2.22Double Spurred Cordon
Merlot1.49Double Spurred Cordon
Cabernet Sauvignon0.41Double Spurred Cordon
Cabernet Franc0.27Double Spurred Cordon
Table 2. Dates of the six flights performed with UAV platforms.
FlightDate
F124 March 2022
F228 April 2022
F323 May 2022
F427 June 2022
F522 July 2022
F626 August 2022
Table 3. Cover crops status at different wineries as found in different surveys.
F1F2F3F4F5F6
CasadeiOn alternated rowsJust mowedAbsentAbsentAbsentAbsent
PetraOn alternated rows, unevenOn alternated rows, unevenAbsentAbsentAbsentPartially present
RigoliSpontaneousJust mowedJust mowedAbsentAbsentPartially present
Tua RitaOn alternated rowsJust mowedAbsentAbsentAbsentAbsent
Table 4. Micasense Rededge M multi-spectral sensor specifics.
Focal distance5.5 mm
GSD8 cm/pixel (per band) at 120 m AGL
Field of View47.2° HFOV
Resolution1280 × 960
B (475 nm ± 20 nm)
G (560 nm ± 20 nm)
Spectral bandsR (668 nm ± 10 nm)
Red Edge (717 nm ± 10 nm)
NIR (840 nm ± 40 nm)
Table 5. Univariate MI for the three datasets.
SiteF1F2F3F4F5F6
Univariate MI for
NDVI S2
Casadei0.848/0.7690.8020.8570.857
Petra0.9010.868/0.7190.7580.785
Rigoli0.6620.8510.9340.8820.8870.867
Tua Rita/0.7430.7530.6730.8550.863
Univariate MI for
NDVI UAVplain
Casadei0.624/0.7180.8590.7740.756
Petra0.8450.812/0.6400.7060.699
Rigoli0.6260.7000.8560.7590.8520.825
Tua Rita/0.6730.7850.7180.7360.433
Univariate MI for
NDVI UAVvines
Casadei0.695/0.5660.8310.7770.856
Petra0.8170.833/0.6840.7170.778
Rigoli0.7930.8980.8830.5450.9600.675
Tua Rita/0.6820.6370.8230.7260.717
Table 6. Coefficient of determination ( R 2 ) between NDVI S2 and NDVI UAVplain.
F1F2F3F4F5F6
Casadei0.709/0.8080.7450.7780.814
Petra0.9200.902/0.7030.7210.792
Rigoli0.8020.6680.8900.6930.8250.642
Tua Rita/0.3380.5890.6930.8250.642
F1–F6 represent the monitoring dates. Values are formatted according to the consistency of the relationship: R 2 ≤ 0.6 (normal); 0.6 ≤ R 2 < 0.7 (italic); 0.7 ≤ R 2 < 0.8 (bold-italic) and R 2 ≥ 0.8 (red bold-italic). The empty cells (/) means missing data. Pearson Correlation coefficient is not shown since all correlations were positive with values above 0.6.
Table 7. Coefficient of determination ( R 2 ) and Pearson Correlation coefficient (r) between NDVI S2 and NDVI UAVvines.
F1F2F3F4F5F6
R 2 r R 2 r R 2 r R 2 r R 2 r R 2 r
Casadei////0.4350.6600.6550.8090.7150.8450.8010.895
Petra//0.5270.726//0.1180.3430.0410.2030.2870.536
Rigoli//0.6250.7900.7870.8870.2560.5060.4690.6840.6780.823
TuaRita//0.3690.6070.1520.3890.3960.6290.6740.8210.7630.873
F1–F6 represent the monitoring dates. Values are formatted according to the consistency of the relationship: r, R 2 ≤ 0.6 (normal); 0.6 ≤ r, R 2 < 0.7 (italic); 0.7 ≤ r, R 2 < 0.8 (bold-italic); and r, R 2 ≥ 0.8 (red bold-italic). The empty cells (/) mean missing data.
Table 8. Bivaraite MI between lagged NDVI S2 and NDVI UAVplain.
F1F2F3F4F5F6
Casadei0.733/0.7190.7730.7970.799
Petra0.8530.806/0.6220.6400.701
Rigoli0.6380.7500.8690.7710.8220.714
Tua Rita/0.3480.6790.6160.7760.439
Values are formatted according to the consistency of the relationship: MI score ≤ 0.6 (normal); 0.6 ≤ MI score < 0.7 (italic); 0.7 ≤ MI score < 0.8 (bold-italic) and MI score ≥ 0.8 (red bold-italic). The empty cells (/) means missing data.
Table 9. Bivariate MI between lagged NDVI S2 and NDVI UAVvines.
F2F3F4F5F6
Casadei/0.5460.7370.7650.836
Petra0.628/0.1890.0570.417
Rigoli0.7570.8400.4300.6390.747
Tua Rita0.4110.3420.5090.6910.765
Values are formatted according to the consistency of the relationship: MI score ≤ 0.6 (normal); 0.6 ≤ MI score < 0.7 (italic); 0.7 ≤ MI score < 0.8 (bold-italic) and MI score ≥ 0.8 (red bold-italic). The empty cells (/) mean missing data.
Table 10. Average Length of Shoots distribution on NDVI clusters based on NDVI S2.
CasadeiPetraRigoliTua Rita
LowMediumHighLowMediumHighLowMediumHighLowMediumHigh
F29.8310.514.838.813.1814.275.133.677.1489.912.67
F347.8659.576374808642.553.296254.8353.561.25
F464.7570.4090.3390.3898.921057592.4393.3360.2962.8670.60
F569.8668.4071.7597.5098.1798.5677.5093.8696.6757.8962.1765.67
F663.8371.8692100.6093.36969195.7593.3360.386262.62
Table 11. Average Length of Shoots distribution on NDVI clusters based on NDVI UAVplain.
CasadeiPetraRigoliTua Rita
LowMediumHighLowMediumHighLowMediumHighLowMediumHigh
F210.4310.7514.89.1711.8314.674.055.77.878.7813.11
F347.8657.8364.4074.3884.2984.0942.450.57625254.7564
F459.1476.719593.1791.7106.2775.4397.809058.6064.4367.29
F562.47275.510890.8997.8279.2994.496.2558.1163.6764.44
F659.2075.8683.7595.5794.3696.7889.597.2593.3357.562.8867
Table 12. Average Length of Shoots distribution on NDVI clusters based on NDVI UAVvines.
CasadeiPetraRigoliTua Rita
LowMediumHighLowMediumHighLowMediumHighLowMediumHigh
F28.511.1714.838.889.3316.85359.364.839.1413.27
F347.8657.7166.2564.580.2397.144251.7562.6745.556.2564.63
F461.5764.8096.583.8696.10109.7073.389.897.658.864.3370
F556.1479.838294.6797.22102.56749495.6056.6764.1465.75
F656.8078.89092.7595.597.8992.894.3393.3358.5762.2063.25
Table 13. ANOVA scores for Average Length of Shoots on NDVI S2.
CasadeiPetraRigoliTua Rita
F Statisticp  ValueF Statisticp  ValueF Statisticp  ValueF Statisticp  Value
F23.3590.0672.2020.1321.8020.2041.7580.197
F33.8540.0450.6370.5385.9820.0140.4550.640
F41.5040.2592.1850.1343.4760.0621.8360.192
F50.0230.9780.0080.9924.7070.0292.6640.093
F62.4050.1290.7290.4930.2490.7860.1850.833
Values are formatted according to the consistency of the relationship: 0.01 < p-value ≤ 0.05 (bold-italic) and p-value ≤ 0.01 (red bold-italic).
Table 14. ANOVA scores for Average Length of Shoots on NDVI UAVplain.
CasadeiPetraRigoliTua Rita
F Statisticp  ValueF Statisticp  ValueF Statisticp  ValueF Statisticp  Value
F22.1690.1543.0290.0672.6340.114.4270.025
F34.5820.0280.6710.5216.2930.0121.8360.184
F42.9150.093.8490.0355.4650.0191.1790.333
F50.420.6652.9630.0713.9140.0471.8950.175
F62.1550.1560.1020.9030.7390.5084.1930.029
Values are formatted according to the consistency of the relationship: 0.01 < p-value ≤ 0.05 (bold-italic) and p-value ≤ 0.01 (red bold-italic).
Table 15. ANOVA scores for Average Length of Shoots on NDVI UAVvines.
CasadeiPetraRigoliTua Rita
F Statisticp  ValueF Statisticp  ValueF Statisticp  ValueF Statisticp  Value
F24.420.03418.014<0.00125.897<0.00112.496<0.001
F35.2120.0196.4590.0065.3230.025.9180.009
F45.2590.02113.433<0.0016.6490.017.0020.007
F53.1590.0760.6320.548.0560.0054.4320.025
F63.1720.0760.4050.6720.0230.9770.9010.421
Values are formatted according to the consistency of the relationship: 0.01 < p-value ≤ 0.05 (bold-italic) and p-value ≤ 0.01 (red bold-italic).
Table 16. LWA distribution on NDVI clusters based on NDVI S2.
CasadeiPetraRigoliTua Rita
LowMediumHighLowMediumHighLowMediumHighLowMediumHigh
F332.1547.7645.6372.9687.8393.4323.9348.5754.2749.2142.6550.87
F459.9459.0398.6692.67106.72107.1658.2787.7490.1849.0559.2270.31
F569.3666.8267.1295.24100.87101.1454.9885.0393.5350.5757.3966.94
F663.3272.2379.399696.1996.0685.5898.1796.2850.1961.7366.38
Table 17. LWA distribution on NDVI clusters based on NDVI UAVplain.
CasadeiPetraRigoliTua Rita
LowMediumHighLowMediumHighLowMediumHighLowMediumHigh
F332.1546.5146.5174.8498.1889.0223.5643.5455.9646.1439.9454.92
F446.6478.3897.7897.7595.28112.0759.54101.4977.5151.5455.3266.37
F566.8569.0167.68103.1397.3499.4759.9983.9491.5248.1859.8567.69
F662.6970.1579.79101.2894.793.8385.4889.08108.5347.2263.9173.8
Table 18. LWA distribution on NDVI clusters based on NDVI UAVvines.
CasadeiPetraRigoliTua Rita
LowMediumHighLowMediumHighLowMediumHighLowMediumHigh
F332.1542.4155.056.186.1115.6123.5644.4757.6236.948.9656.05
F447.1363.2106.283.22101.71117.2554.8584.0896.9633.8162.670.61
F554.7875.2584.3690.8100.49107.8548.0384.0492.2749.9258.0168.31
F656.7776.0679.288.6497.14101.6288.4685.31108.5343.2558.5869.22
Table 19. ANOVA scores for LWA on NDVI S2.
CasadeiPetraRigoliTua Rita
F Statisticp  ValueF Statisticp  ValueF Statisticp  ValueF Statisticp  Value
F32.9280.0840.4720.62915.203<0.0010.5680.575
F42.9190.090.8970.4212.7150.1031.8080.196
F50.0150.9850.1460.8655.0590.0243.0450.069
F60.5420.594<0.0011.00.7260.5132.2660.129
Values are formatted according to the consistency of the relationship: 0.01 < p-value ≤ 0.05 (bold-italic) and p-value ≤ 0.01 (red bold-italic).
Table 20. ANOVA scores for LWA on NDVI UAVplain.
CasadeiPetraRigoliTua Rita
F Statisticp  ValueF Statisticp  ValueF Statisticp  ValueF Statisticp  Value
F32.8910.0870.7210.49711.7550.0011.3230.288
F45.8740.0151.360.2765.1170.0230.9260.417
F50.0090.9910.1250.8833.1240.0784.9460.017
F60.630.5480.2060.8153.0450.1048.9970.002
Values are formatted according to the consistency of the relationship: 0.01 < p-value ≤ 0.05 (bold-italic) and p-value ≤ 0.01 (red bold-italic).
Table 21. ANOVA scores for LWA on NDVI UAVvines.
CasadeiPetraRigoliTua Rita
F Statisticp  ValueF Statisticp  ValueF Statisticp  ValueF Statisticp  Value
F34.9210.0235.4570.01111.5430.0014.2350.029
F419.247<0.0014.9660.0165.2120.02212.0360.001
F52.0090.1741.3680.2749.5160.0033.7970.039
F61.430.2750.6080.5533.0070.1069.5830.001
Values are formatted according to the consistency of the relationship: 0.01 < p-value ≤ 0.05 (bold-italic) and p-value ≤ 0.01 (red bold-italic).
Disclaimer/Publisher’s Note: The statements, opinions and data contained in all publications are solely those of the individual author(s) and contributor(s) and not of MDPI and/or the editor(s). MDPI and/or the editor(s) disclaim responsibility for any injury to people or property resulting from any ideas, methods, instructions or products referred to in the content.

