Article

Extraction of Tobacco Planting Information Based on UAV High-Resolution Remote Sensing Images

1
School of Software Engineering, Chengdu University of Information Technology, Chengdu 610025, China
2
Sichuan Province Engineering Technology Research Center of Support Software of Informatization Application, Chengdu 610225, China
3
School of Automation Engineering, University of Electronic Science and Technology of China, Chengdu 611731, China
4
China Tobacco Corporation Sichuan Provincial Company, Chengdu 610225, China
5
Sichuan Tobacco Company Liangshan Prefecture Company, Xichang 615000, China
6
College of Agriculture, Sichuan Agricultural University, Chengdu 611130, China
7
Chengdu Song Xing Technology Co., Ltd., Chengdu 610225, China
*
Author to whom correspondence should be addressed.
Remote Sens. 2024, 16(2), 359; https://doi.org/10.3390/rs16020359
Submission received: 16 October 2023 / Revised: 6 January 2024 / Accepted: 11 January 2024 / Published: 16 January 2024

Abstract

:
Tobacco is a critical cash crop in China, so its growing status has received more and more attention. How to acquire accurate plant area, row spacing, and plant spacing at the same time have been key points for its grow status monitoring and yield prediction. However, accurately detecting small and densely arranged tobacco plants during the rosette stage poses a significant challenge. In Sichuan Province, the contours of scattered tobacco fields with different shapes are not well-extracted. Additionally, there is a lack of simultaneous methods for extracting crucial tobacco planting information, including area, row spacing, and plant spacing. In view of the above scientific problems, we proposed a method to extract the planting information of tobacco at the rosette stage with Unmanned Aerial Vehicle (UAV) remote sensing images. A detection model, YOLOv8s-EFF, was constructed for the small and weak tobacco in the rosette stage. We proposed an extraction algorithm for tobacco field area based on extended contours for different-shaped fields. Meanwhile, a planting distance extraction algorithm based on tobacco coordinates was presented. Further, four experimental areas were selected in Sichuan Province, and image processing and sample label production were carried out. Four isolated tobacco fields with different shapes in four experimental areas were used to preliminarily verify the effectiveness of the model and algorithm proposed. The results show that the precision ranges of tobacco field area, row spacing, and plant spacing were 96.51~99.04%, 90.08~99.74%, and 94.69~99.15%, respectively. And another two experimental areas, Jiange County, Guangyuan, and Dazhai County, Gulin County, and Luzhou, were selected to evaluate the accuracy of the method proposed in the research in practical application. The results indicate that the average accuracy of tobacco field area, row spacing, and plant spacing extracted by this method reached 97.99%, 97.98%, and 98.31%, respectively, which proved the extraction method of plant information is valuable.

Graphical Abstract

1. Introduction

As a major agricultural country with 2 billion acres of basic farmland, China requires a large amount of agricultural machinery to assist in field operations every year. With the integration of deep learning technology with drone products and agricultural scenarios, it promotes the qualitative improvement of agricultural management levels driven by informationization [1,2]. Such technologies provide not only more accurate data support for the planting, management, and yield prediction of traditional crops but also new perspectives and solutions for agricultural environmental monitoring, resource utilization optimization, etc. [3,4,5].
Tobacco, as an important economic crop in China, is particularly prevalent in the southwestern regions of Sichuan, Yunnan, and Guizhou provinces. The rapid and accurate acquisition of tobacco planting information can provide a reference basis for tobacco management departments to predict tobacco production, monitor the tobacco growth environment, formulate tobacco variety promotion plans, and adjust tobacco planting plans. However, due to the special geographical environment of high altitude, complex terrain, and inconvenient transportation, dynamic monitoring of planting information (such as area, density, row spacing, plant spacing, and yield prediction) has always been a challenge faced by the Southwest region. Traditional manual statistical and measurement methods have been proven to have shortcomings and high costs, making it difficult to quickly and accurately obtain tobacco planting information. Drone remote sensing technology, with its high efficiency, accuracy, and low cost, provides a powerful data source for precision agriculture and plays an important role in monitoring tobacco planting area, growth, and yield. At the same time, the application of this technology has also played a crucial role in the sustainable development of tobacco production and the construction of tobacco smart agriculture [6,7].
Currently, remote sensing images are widely used in agricultural applications such as crop detection and weed identification. Tian et al. addressed the problem of changing light, complex backgrounds, and overlapping objects in orchards through image enhancement with the YOLOv3 network optimized with DenseNet, which can effectively detect apples even in different grow conditions and complex environments [8]. Huang et al. designed a two-stage model for intra-row crop detection and localization and completed the detection and positioning of single rice plants in complex environments with diverse rice morphologies and partial overlap of rice [9]. Zhao et al. proposed an improved method based on YOLOv5 for detecting wheat spikes from UAV images (small size, high density, and overlapping spikes) and detected wheat spikes under occlusion and overlapping conditions through the fusion of the refined detection process and the multi-resolution prediction boxes [10]. Lu et al. combined the YOLOv5 with the Swin Transformer to identify overlapping bunches of grapes with a dense canopy under two different weather conditions and two different stages of berry ripening [11]. Jin et al. addressed the problems of weed species and appearance diversity, occlusion, and overlapping and different growth stages in vegetable fields by detecting vegetable crops through CNN, and the experiment took plants outside the detection box as weeds indirectly, which avoided the complex scenarios of directly detecting weeds and improved the accuracy of weed detection [12].
The current method of extracting crop area mainly relies on remote sensing images, which include crop classification and field segmentation. Zhu et al. proposed a method combining convolution and morphology to extract tobacco planting area in UAV remote sensing images with 95.93% accuracy [13]. After classifying the land cover from images, Fang et al. calculated the crop area by cropping the research area following administrative boundaries [14]. Wu et al. proposed a method by combining remote sensing data segmentation with sample strip sampling that can estimate crop acreage in complex agricultural landscapes with high accuracy [15]. Du et al. used the deeplabv3+model to classify and extract the crop area from remote sensing images, and the accurate crop position and the crop area were obtained in a small area [16]. De Macedo et al. applied the CLSTM network for crop recognition based on remote sensing data and realized the classification of soybean, corn, and cotton. Moreover, the estimation of crop area was obtained in large areas [17]. Huang et al. constructed a tobacco semantic segmentation dataset using unmanned aerial remote sensing images in highland mountainous areas and realized accurate extraction of tobacco field planting area on all four semantic segmentation models [18]. Furthermore, remote sensing imagery has been extensively investigated in various domains, including road and building detection [19,20,21], natural disaster monitoring [22,23], land use planning [24,25], as well as air quality assessment [26,27].
In the field of agriculture, the utilization of remote sensing images has demonstrated significant potential, particularly in crop area extraction and crop detection. However, the current research rarely effectively combines the two tasks. This limitation leads to scenarios where the results of crop target detection cannot be used for crop area extraction or the methods of crop area extraction cannot make full use of the information about crop target detection. Moreover, there is a scarcity of small and dense tobacco detection literature specifically based on remote sensing.
To address this issue, we selected tobacco as the research subject and designed a tobacco planting information extraction algorithm based on high-resolution UAV images. First, we integrated Squeeze-and-Excitation Networks (SENet) [28] and adaptively spatial feature fusion (ASFF) [29] into YOLOv8s [30], creating a detection model named YOLOv8s-Enhanced Feature Fusion (EFF). This model can rapidly and accurately detect densely arranged small tobacco plants in UAV images. Subsequently, we utilize the tobacco detection results to effectively extract the planting area of tobacco fields with various shapes. Lastly, building upon this foundation, we innovatively designed an algorithm for the extraction of row spacing and plant spacing in tobacco fields. This algorithm further achieves precise extraction of row spacing and plant spacing in tobacco fields, thereby enhancing the accuracy and efficiency of tobacco production management.
The main contributions and significance of this paper are as follows:
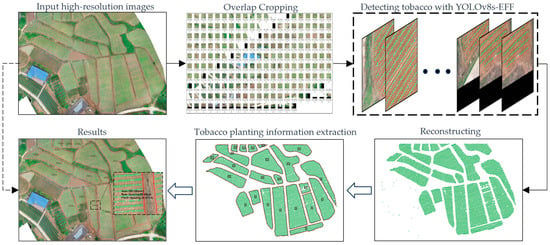
  • For large-area tobacco planting monitoring, we propose a tobacco planting information extraction method based on UAV images that can effectively identify and locate small and densely planted tobacco plants and obtain the area, row spacing, and plant spacing synchronously.
  • Aiming to detect small and dense tobacco, we built a tobacco detection model, YOLOv8s-EFF, based on YOLOv8s. YOLOv8s-EFF integrates SENet and ASFF to learn more fine-grained features of tobacco images, enhancing the detection performance of tobacco.
  • We proposed a tobacco planting distance extraction algorithm based on tobacco coordinates. The algorithm uses tobacco detection coordinates to realize the calculation of plant spacing and row spacing. Meanwhile, the quantile method with a specific threshold is applied to detect outliers, which alleviates the problem of over- or under-detection in scenes of dense tobacco planting or small tobaccos and improves the accuracy of the calculation results.
  • The shape of the tobacco field is variable in the real environment due to the planting method, topography, etc. We creatively constructed an algorithm for extracting the area of the tobacco field based on expanding contours. The algorithm can accurately extract the contours and areas of tobacco fields with different shapes based on discrete tobacco detection coordinates.

2. Materials and Methods

2.1. Experimental Area

We selected the Chongzhou Modern Agricultural R&D Base of Sichuan Agricultural University (103°39′24″E, Latitude 30°33′42″N), Jiange County, Guangyuan City, Sichuan Province (105°27′02″E, 32°00′49″N), Dazhai, Gulin County, Luzhou City, Sichuan Province (105°38′46″E, 28°07′35″N), and Shifang City, Deyang City, Sichuan Province (104°06′41E, 31°06′31N) as the experimental areas (Figure 1), and then UAV images of the tobacco at the rosette stage were taken. We use a DJI UAV equipped with a high-definition digital camera to obtain tobacco images. The model of the UAV is the DJI Phantom 4 Pro quadrotor UAV, with a net fuselage mass of 1.38 kg and a maximum endurance time of 28 min. The high-definition digital camera adopts a Sony Cyber-shot DSC-QX100; the image sensor is a 20 million-pixel CMOS sensor with automatic focus and an electronic shutter speed of 1/8000 s. The collection of UAV remote sensing images was conducted under bright sunlight and minimal cloud cover. The selected flight time window was from 11:00 to 13:00. The flight altitude was maintained at 30 m, and the spatial resolution of the images was 0.8 cm.

2.2. Data and Preprocessing

We synchronously measured the ground data of some tobacco fields when obtaining high-resolution UAV tobacco images. We measured 5 evenly set sample plots in the tobacco field and took the average row spacing of consecutive 5 rows as the sample one in each sample plot. In addition, we arranged the average row spacing of 20 consecutive plants as the sample plant spacing and used the average row spacing and plant spacing of 5 sample plots as the final row spacing and plant spacing of the tobacco field. In the tobacco field, the irregular tobacco field was divided into multiple approximately regular areas, and each area was measured separately. Finally, we cumulatively add the measured areas of each region to obtain the ultimate manually measured tobacco field area. Additionally, for large tobacco fields with a side length exceeding 30 m, we measure the GPS coordinates of distinct turning points along the edge of the tobacco field. And we connect them sequentially to form the contour of the tobacco field to obtain the measured area of a large tobacco field.
Focusing on tobacco detection, the tobacco dataset contains 1380 images with a resolution of 1024 × 1024, and then the dataset was randomly divided into 1103 training images and 277 test images. In addition, in order to improve the generalization ability of the model and prevent overfitting, we employed the image augmentation library, ‘imgaug’, to perform data augmentation on the training images. This involved creating an augmentation sequence incorporating brightness transformation, image scaling, flipping, and rotation. Specifically, the random seed was set to 2023, brightness transformation varied between 0.8 and 1.2 times the original intensity, image scaling ranged from 0.8 to 1.2 times the original size, rotation angles spanned from −25° to +25°, and the probability of image flipping was set to 0.5. Utilizing this augmentation sequence, we generated tobacco images that simultaneously included the effects of the four mentioned augmentations along with the corresponding transformed annotations. In conjunction with the original 1103 images, we obtained a total of 2206 training images. The composition of the data for each experimental area is shown in Table 1. In the process of manually annotating tobacco targets, the cropping of images resulted in the fragmentation of tobacco near the image edges. To address this issue, we established the criterion that tobacco regions occupying less than 40% of their original size were excluded from annotation. Figure 2 shows some manually labeled tobacco images and the corresponding enhancement results.

2.3. Methods

2.3.1. Overall Process for Extracting Tobacco Planting Information

We constructed a tobacco detection model using YOLOv8s as the foundation and tailored the network structure to address the smaller characteristics of tobacco at the rosette stage, which is called YOLOv8s-Enhanced Feature Fusion (YOLOv8s-EFF). Additionally, when detecting large-scale tobacco images captured by UAVs, we optimized the model’s prediction process by adjusting parameters related to image overlap and non-maximum suppression. This adjustment addresses issues such as varying tobacco planting density, differences in tobacco size across different planting areas, and instances of under-detection or over-detection of tobacco at the image edges. Subsequently, we built a tobacco detection model for large-scale planting areas, which provides the center coordinates of tobacco targets in UAV images. Leveraging the center coordinates of tobacco’s output by the object detection model, we applied the Density-Based Spatial Clustering of Applications with Noise (DBSCAN) algorithm [31] to partition different tobacco fields in UAV images. On this basis, we propose a planting distance extraction algorithm based on tobacco coordinates to achieve the calculation of tobacco row spacing and plant spacing. Specifically, we calculate the distance between the tobacco row and its nearest neighbor as the plant spacing and the average of the vertical distance between the tobacco row and another tobacco coordinate as the row spacing. Finally, by extending the initial contour of the tobacco field obtained by the Alpha Shape algorithm, a tobacco planting area extraction algorithm based on the extended contour is designed. This algorithm facilitates the extraction of the tobacco field area within each region. The overall process of the proposed method is shown in Figure 3.

2.3.2. Object Detection Model and Tobacco Field Region Division

Figure 4 illustrates the network architecture of YOLOv8s-EFF. The model structure is divided into three components: Backbone, Neck, and Head. The model adopts CSPDarkNet as its backbone, enhancing the gradient flow to extract rich feature information from the input image. The Neck section constructs PANet through bottom-up and top-down path aggregation, as well as feature fusion [32,33]. This structure intelligently integrates feature information from various levels, improving the feature and position information of objects at different scales in object detection. The Head portion of the model separates classification from detection and replaces the anchor-based approach with an anchor-free one. It is responsible for object classification, localization, and generating detection results.
In the network structure of YOLOv8s-EFF, we used SENet after the first C2f layer in the backbone network to utilize shallow features and improve the detection performance of small tobacco plants. This addition enhances the network’s awareness of channel features. And the output of the SENet is fused with the shallow layers of PANet, providing more precise positional and detailed information for small tobacco plants. This structure is called SEBlock. In addition, considering PANet directly fuses feature maps of the different scales, we introduce the ASFF module after PANet. This module adapts information from different scales by learning weights, allowing the detection network to better adapt to targets of various sizes. The ASFF module incorporates a spatial attention mechanism when fusing features, aiding the model in more accurately localizing tobacco plants of different scales.
During the inference phase, our primary objectives were twofold: first, to enhance the subsequent calculations’ precision, and second, to ensure the comprehensive detection of all tobacco targets. To achieve these goals, we employed a cropping strategy with overlapping regions (20% by default) in the input test images, as visually depicted in Figure 5, where the yellow dashed lines in the large image and the red regions in the small image indicate the overlapping areas. To ensure that cropping can be performed in multiples of 1024 window sizes, we applied zero-value padding at the image edges. This approach served a dual purpose: it maximized the likelihood of detecting tobacco targets while compensating for the potential loss of tobacco plants due to cropping of images. However, it introduced a novel issue—duplicate detection at the cropped edges.
To address this issue, we applied a non-maximum suppression (NMS) method, which allowed us to resolve the issue of duplicate detection. This suppression method was applied following the mapping of the detection box’s position from the cropped small image back to its true location. Subsequently, we converted the resulting tobacco detection frames into center coordinates, representing the precise coordinates of each tobacco plant.
For the tobacco field region division, the center point coordinates were obtained from the tobacco detection model. However, it was challenging to accurately determine the number of tobacco fields in an image. Additionally, it was difficult to distinguish the coordinates that belonged to the same tobacco field. To address these issues, we have adopted the DBSCAN algorithm, which clusters tobacco coordinates to identify and separate distinct tobacco fields. This algorithm relies on two key parameters: Eps and MinPts. Eps is the neighborhood radius to calculate the density, and MinPts is the minimum number of points required within a field to define a core point. These two parameters can be automatically adjusted by the k-distance curve [31], which is formed by descending the distance between each coordinate point and its k-nearest point. The first valley on the curve can be used as Eps. In addition, if D is the distance from point P to its k-th nearest neighbor, then the D neighborhood of P contains at least k + 1 points (including P itself), so MinPts is usually set to k + 1. Therefore, if the value of k is determined, the automatic setting of these two parameters will complete. When k is set to 4, the tobacco coordinates can be effectively clustered and divided into different clusters. Each cluster represents each tobacco field.

2.3.3. Planting Distance Extraction Algorithm and Outlier Detection

After obtaining the precise spatial coordinates of tobacco plants within each field, we introduced an innovative planting distance extraction algorithm predicated upon these tobacco coordinates. This algorithm addresses a series of critical issues arising from object detection, such as over-detection and under-detection, by facilitating the computation of tobacco field row spacing and plant spacing. Additionally, the algorithm incorporates a mechanism designed to mitigate the impact of inaccurate tobacco plant coordinates on the planting distance extraction process. This is achieved through the application of statistical methods, including averaging methods and outlier detection, which serve to enhance the reliability and robustness of the extracted planting distances. The following is our definition and calculation method for plant spacing:
For each tobacco plant, the Euclidean distance between two nearest tobacco plants is taken as the two plant distances of the tobacco. If the current tobacco coordinates are ( x , y ) and other tobacco coordinates are ( x i , y i ) , then the plant spacing d can be calculated by Formula (1), where minD means to select the minimum and second-smallest distance between other points and the current point as the plant spacing. Next, all the plant spacing in each tobacco field area is arranged to obtain the average plant spacing d ¯ in this area, as shown in Formula (2). In the process, we use the quartile method to detect outliers and filter abnormally large or small plant spacing, d . d j is the plant spacing value filtered according to the quartile of the corresponding limit. Q p is the quantile shown in Formula (3), p is the percentage (for example, p in Q 25 is 25%), N is the total number of data, x is the integer part of x , x is the decimal part of x , and D x indicates the corresponding row spacing or row spacing at the x position after the row spacing or row spacing is arranged from small to large.
d = m i n D ( x x i ) 2 + ( y y i ) 2 ,   i ( 1 , n )
d ¯ = j = 1 n d j / n ,   d j 1.5 Q 25 0.5 Q 75 , 2 Q 75 Q 25
Q p = 1 x × D x + p × N 1 × D x + 1 ,   x = p × N 1 ,
For row spacing, we calculate it as follows: the tobacco in the field is roughly distributed in a regular grid, and the spatial relationship between adjacent tobacco is shown in Figure 6. The current tobacco coordinate, the adjacent tobacco coordinate, and the coordinates of other tobacco are set as P ( x , y ) , P 0 ( x 0 , y 0 ) , and P i ( x i , y i ) , respectively. θ is the angle between P P 0 and P P i , sin θ = P P 0 × P P i / P P 0 × P P i . Then row spacing l in Figure 6 can be calculated by Formula (4), where m i n L denotes the smallest distance in the perpendicular distance between the selected P i ( x i , y i ) and the straight line P P 0 (greater than d ¯ ). In the standard cultivation of tobacco, the row spacing is generally 2 to 3 times the plant spacing. Therefore, when traversing P i , we restrict the range of its horizontal and vertical coordinates within ± 3 d ¯ . This way, we only need to calculate the vertical distance between the tobacco coordinates P i ( x i , y i ) in the nearby one or two rows and the coordinates of the current row. This reduces the number of times we need to calculate the vertical distance when traversing P i , improving the overall computational efficiency. In the actual tobacco planting environment, as illustrated in Figure 7, we only need to traverse the coordinates of tobacco points within the square dashed region centered at P ( x , y ) with a side length of 6 d ¯ to calculate the vertical distance and record the tobacco row spacing. Subsequently, we averaged all row spacings within each tobacco field region to obtain the average row spacing l ¯ shown in Formula (5). Similarly, we used the quartile method to filter and correct the line spacing. l j as the row spacing after filtering according to the interquartile of the corresponding inner limit.
l = m i n L P P 0 × P P i P P 0 × P P i × ( x x i ) 2 + ( y y i ) 2 ,   i 1 , n
l ¯ = j = 1 n l j / n ,   l j 1.5 Q 25 0.5 Q 75 , 2.5 Q 75 1.5 Q 25 ,

2.3.4. Extracting Tobacco Field Area Based on Expanding Contour

In previous studies, crop area was often obtained through image segmentation. It would be redundant for us to go back and build a tobacco segmentation model to estimate the size of tobacco fields. Therefore, this research explores how to utilize tobacco detection results to calculate the tobacco field area efficiently.
The tobacco coordinates obtained from the detection model are discrete, which makes it impractical to directly compute the field area by pixel counting. Hence, a natural solution is to consider utilizing tobacco field contours for area calculation. So, in order to obtain various shapes of tobacco field area, we designed an area extraction algorithm based on tobacco field contour. The steps of the improved Alpha Shape algorithm to obtain the initial tobacco field contour are shown below:
  • Construction of Delaunay triangulation [34,35] based on tobacco coordinate points.
  • Traverse the Delaunay triangulation, calculate the circumscribed circle radius of each triangle, and eliminate the triangles whose radius is greater than the alpha value.
  • In the remaining triangles, the edges that appear only once are reserved and connected in turn in a counterclockwise direction to obtain the initial contour of the tobacco field.
The radius of the outer circle of the triangle is calculated as shown in Formula (6), where e d g e x is the side of the triangle and S Δ is the area of the triangle.
R = e d g e 1 × e d g e 2 × e d g e 3 / 4 S Δ ,
The results show that when Alpha = Eps, the triangles with large side lengths can be better eliminated, and a reasonable contour of the tobacco field can be obtained.
Certainly, the initial tobacco field contours we obtain are based solely on the tobacco coordinate points. A proper tobacco field contour should extend further outward to encompass the space for tobacco to grow on the ground accurately. Therefore, for the purpose of calculating the actual area of the tobacco field more accurately and improving the accuracy of the tobacco field contour, we use the calculated plant spacing as the expansion length to expand the initial contour of the tobacco field, which can be suitable for the actual contour of the tobacco field, and obtain a more accurate tobacco field area. The initial contour of the tobacco field can be expanded in the following ways: in the contour sorted counterclockwise ( P 0 P n ) (Figure 8), assuming that there are edges P 0 P 1 , P 1 P 2 in the initial contour, it is necessary to expand the point P 1 to the point Q by using the average spacing d ¯ , and α is taken as the angle between v 1 , v 2 . From Figure 8, we can get P 1 Q = v 1 + v 2 , so the coordinates of point Q can be obtained by calculating v 1 , v 2 . The modulus of v 1 , v 2 is equal to the average plant spacing d ¯ divided by sin α (Formula (7)). Then v 1 , v 2 can be calculated by Formula (8) and (9), and Q ( x , y ) = v 1 + v 2 + P 1 x 1 , y 1 .
v 1 = v 2 = d ¯ / P 1 P 0 × P 1 P 2 P 1 P 0 × P 1 P 2
v 1 = v 1 P 1 P 2 × P 1 P 2
v 2 = v 2 P 1 P 0 × P 1 P 0 ,
If the points P 0 ( x 0 , y 0 ) , P 1 ( x 1 , y 1 ) and P 2 ( x 2 , y 2 ) are co-linear, i.e., α is 0, then the coordinates of point Q can be calculated from the slope of P 1 P 2 and the pointing from P 1 to P 2 . If the slope angle from P 1 to P 2 is set as θ π 2 , π 2 , the slope as k ( , + ) , the pointing from P 1 to P 2 can be denoted by x 2 x 1 .Further, the point Q x , y can be obtained from Formula (10). Note that k and x 2 x 1 will not both be 0 at the same time.
Q ( x , y ) = x 1 + d ¯ × sin θ , y 1 d ¯ × cos θ ,   k 0 , x 2 x 1 0 x 1 d ¯ × sin θ , y 1 + d ¯ × cos θ ,   k 0 , x 2 x 1 < 0 x 1 + d ¯ × cos θ + π 2 , y 1 + d ¯ × sin θ + π 2 ,   k < 0 , x 2 x 1 < 0 x 1 d ¯ × cos θ + π 2 , y 1 d ¯ × sin θ + π 2 ,   k < 0 , x 2 x 1 0 ,
Finally, we multiply the area enclosed by the extended contour by the spatial resolution to obtain the planting area of the tobacco field. The area of the tobacco field can be calculated by Formula (11), where r is the spatial resolution.
S = 0.5 × r 2 × i = 0 n 1 y i + 1 + y i x i + 1 x i .

3. Results and Discussion

3.1. Tobacco Detection

We compared YOLOv8s-EFF with four other detection models (YOLOv8s [30], YOLOv5s [36], RetinaNet [37], and Faster R-CNN [38]) on the tobacco dataset we constructed. In addition, we provide the results of ablation experiments using the SEBlock and ASFF modules separately in YOLOv8s. In our research, we used a specific experimental setting to train and evaluate our models: Python 3.8.16, i7-8700k, NVIDIA GeForce 2080Ti 11GB, 32GB RAM, 1TB SSD, and 2TB HDD. All models use pre-training weights from the MSCOCO dataset [39] to speed up the training process. The optimizer applies stochastic gradient descent (SGD). The model training employed initial hyperparameters, which comprised an initial learning rate of 0.001, a batch size of 2, input image dimensions established at 1024 × 1024, and a momentum value of 0.9. After 300 epochs of training, the model’s performance on the current dataset appears to stabilize, indicating that 300 epochs are sufficient to meet the training requirements. The evaluation metrics of the model are shown in Table 2, where AP0.5 means the average accuracy (AP) when IoU = 0.5, and AP0.75 is the same. AP0.5:0.95 refers to the average accuracy of 10 different thresholds when IOU increases from 0.5 to 0.95 in steps of 0.05. APS, APM, and APL are the average accuracy of small, medium, and large object sizes, respectively.
According to Table 2, the average accuracy (AP0.5:0.95) of improved YOLOv8s-EFF was 0.16 to 0.644 compared with the baseline YOLOv8s. The AP0.5 of each model is at a high level, reaching about 0.82. However, in order to obtain more accurate tobacco coordinates, the model should have higher accuracy under a higher IoU threshold. YOLOv8s-EFF outperforms YOLOv8s, with an AP0.75 of 0.789, indicating superior accuracy in detection results. So, YOLOv8s-EFF can better meet such requirements. Additionally, YOLOv8s-EFF exhibits robust adaptability in object detection across different size ranges (APS, APM, and APL), with AP values of 0.498, 0.642, and 0.785, respectively. These results highlight the advantages of YOLOv8s-EF compared with other models.
Figure 9, Figure 10 and Figure 11, respectively, illustrate the detection results of each model in different environments for tobacco. It can be observed that when the tobacco size is small, both YOLOv8s-EFF and YOLOv5s can detect all tobacco in the images, but YOLOv5s may have some issues with duplicate detections. On the other hand, RetinaNet-R101 and Faster R-CNN-R101 may miss some smaller tobacco instances. In scenarios with dense and overlapping tobacco, YOLOv8s-EFF is capable of detecting all tobacco, while other models exhibit errors in detection and missed instances. In environments where tobacco is uniformly distributed and relatively large, YOLOv5s and Faster R-CNN-R101 show a few missed detections, while YOLOv8s-EFF and RetinaNet-R101 can detect all tobacco. However, RetinaNet-R101 has an issue with incorrect overlapping detections. In summary, YOLOv8s-EFF consistently outperforms other models in tobacco detection across several testing environments.
The primary cause of over-detection during prediction is attributed to image cropping. As observed in the test images from the previous section, even partially visible tobacco plants at the image edges (occupying only a few pixels) may trigger detections. Consequently, a single tobacco plant might be associated with multiple non-overlapping detection boxes. To alleviate this issue, we propose a solution involving image cropping with overlapping regions and the application of NMS to remove redundant detection boxes. Taking the detection results of a tobacco field in Chongzhou as an example, the introduction of overlapping cropping substantially mitigated the issue of over-detection in the detection box plot (Figure 12a,b), resulting in a more even and accurate distribution of tobacco coordinates in the scatter plot (Figure 12c,d). Simultaneously, this method ensures the maximum possible detection of tobacco targets. In other words, even if the tobacco in the preceding image cannot be accurately detected, it can still be identified through overlapping portions in the subsequent image, addressing the issue of under-detection resulting from image cropping. Although this method can resolve the majority of issues, there may still be a small number of cases, similar to those depicted in Figure 12b, where overlapping boxes are retained below the NMS threshold.

3.2. Tobacco Planting Information Extraction

3.2.1. Isolated Tobacco Field

To validate the accuracy of the model and algorithm proposed in this research, four distinct tobacco fields (Chongzhou (CZ), Dazhai (DZ), Jiange (JG), and Shifang (SF)) were selected from four experimental areas based on their diverse shapes. We then applied the algorithms designed in this paper to calculate the area, row spacing, and plant spacing of these selected tobacco fields.
While we optimized the detection coordinates of tobacco, the calculation of row spacing and plant spacing still yielded a few outliers, either excessively large or small (Figure 13). To further mitigate the impact of these outliers on the final results, we employed the quartile method to identify and filter out outliers in the computed row and plant spacing. The data after filtering outliers is shown in Figure 14. For visual representation, we utilized a boxplot as a data visualization tool, which includes distinct elements. The central rectangular box within the plot delineates the interquartile range (IQR), spanning from the first quartile (Q1) to the third quartile (Q3), encapsulating the central 50% of the data’s distribution. Within this box, a central line designates the median, signifying the centrality of the data distribution. The whiskers extend from the box and typically include the maximum and minimum data values within the range of 1.5 times the IQR. Data points that deviate significantly from the box are considered outliers.
The tobacco field contour could be obtained based on the contour algorithm (Figure 15c). The solid straight line is the initial contour, and the dashed line is the contour after equidistant expansion using plant spacing. From Figure 15, it can be observed that we accurately obtained the external contours of tobacco fields with various shapes. Furthermore, to encompass the correct planting area corresponding to the growing space of tobacco plants, we accurately expanded the initial contours based on the calculated plant spacing. Moreover, the use of overlapping cropped images and the NMS method significantly reduces the problem of multiple detections of tobacco plants at the edges of small images or the inability to detect them. This is well demonstrated by the evenly distributed coordinates of tobacco plants in Figure 15b. The term “edges of small images” refers to the fact that detection involves cropping the images from the large aerial images captured by the drone into smaller sections, which are then fed into the detection network. On the edges of these smaller images, a single tobacco plant might be divided into several sections, leading to the problem of either detecting the same tobacco plant multiple times or not detecting it at all.
We tabulated the actual measurement data and calculation results for four tobacco fields. MV and CV denote measured and calculated values, respectively. ACC denotes the accuracy, which is calculated as shown in Equation (12).
A C C = 1 M V C V / M V × 100 % ,
Table 3 shows the calculation accuracy of tobacco field area, row spacing, and plant spacing ranges from 96.51% to 99.04%, 90.08% to 99.74%, and 94.69% to 99.15%, respectively. The algorithm designed realizes the accurate extraction of planting information for an isolated tobacco field. It shows the feasibility of using the tobacco coordinate output from the detection model to calculate the tobacco planting information on the high-resolution UAV image.
While the calculation results exhibit a commendable level of accuracy, it is important to acknowledge that some degree of error remains inevitable. The primary source of error lies in the detection model, influencing the computation of tobacco field area, row spacing, and plant spacing. Specifically:
For the tobacco field area, over- or under-detection of the model within the tobacco field will not affect the extraction of the tobacco field contour. At this point, the calculated area of the tobacco field is accurate. However, if the under-detection occurs at the edge of a tobacco field, the formed contour will be connected to the internal tobacco coordinate or the next edge tobacco coordinate (the connection method depends on the relationship between the triangle edge length and the alpha value in the Delaunay triangulation network built based on tobacco coordinates), so that the calculated tobacco field area is slightly smaller or larger.
For the row spacing and plant spacing, over-detection or under-detection of the model will make the calculated row spacing and plant spacing smaller or larger. In the inference process, employing the overlap cropping image and NMS method effectively mitigates common issues of over- or under-detection in many models. Additionally, the use of the quartile method helps eliminate errors in row spacing and plant spacing caused by over-detection or under-detection. These two aspects collectively ensure the accuracy of the extracted row spacing and plant spacing results.
Another factor contributing to the calculation errors in row spacing and plant spacing is related to the spatial resolution of the images. In this paper, the spatial resolution of the UAV images is 0.8 cm. The positioning accuracy of tobacco coordinates by the detection model and the data accuracy in the calculation process (rounding, decimal operations, etc.) may introduce a deviation of several pixels, resulting in an actual distance of approximately 1–3 cm. The calculation errors are more pronounced when the row spacing and plant spacing are relatively small.
Additional clarification is required regarding the extraction of tobacco field contours. If the actual area of internal voids within a tobacco field, caused by occlusion or other factors, is less than or equal to 12 m2, we opt to discard it, as illustrated in Figure 15c(DZ,SF). This decision was reached following discussions with agricultural experts and tobacco management authorities.

3.2.2. Composite Tobacco Fields

This paper proposes a tobacco planting information extraction algorithm based on high-resolution UAV images. The feasibility of the proposed approach is validated through the results obtained from multiple isolated tobacco fields. To further verify the applicability of the model and algorithm in real-world production environments, we conducted tobacco planting information extraction on large stitched UAV images.
Figure 16a,b are from the Jiange and Dazhai experimental areas, respectively, as illustrated in Figure 1. The Jiange experimental area is located in a mountainous region where tobacco fields are scattered, exhibiting irregular shapes and significant variations in size. The tobacco planting is relatively dense. In contrast, the Dazhai experimental area is situated in a plain where tobacco fields are closer to each other, featuring relatively regular shapes, and tobacco planting is sparser. As shown in Figure 16, the algorithm designed in this paper successfully identified 23 and 5 tobacco fields in Jiange and Dazhai, respectively.
However, issues were encountered in regions where tobacco plants at the edges of two fields were connected, as observed in Figure 16b(D2). The current algorithm design proved insufficient to partition them into distinct tobacco fields.
The parameters of the DBSCAN algorithm are automatically determined by constructing the k-distance curve based on the tobacco detection coordinates. Nevertheless, in large-scale unmanned aerial vehicle tobacco images, this curve is influenced by non-tobacco areas such as roads, buildings, and other crops, resulting in a larger clustering radius Eps. Consequently, in the extensive tobacco field region shown in Figure 16a, different tobacco fields are more effectively separated from non-tobacco areas like ridges, yielding a result more consistent with the human visual perspective using the adaptive parameter DBSCAN algorithm.
In contrast, Figure 16b illustrates lower separability between different tobacco fields, underscoring the need to further refine existing methods or explore innovative techniques for more effective separation of interconnected tobacco fields.
Additionally, we calculated the area, row spacing, and plant spacing for each identified tobacco field (Figure 17 and Figure 18). Unlike the aforementioned isolated tobacco fields, the large stitched UAV images encompass multiple tobacco fields. Therefore, before calculating the area, row spacing, and plant spacing, the DBSCAN algorithm was applied to cluster tobacco coordinates. This allows the separation of multiple tobacco fields in the high-resolution drone image and filters out inaccurately detected coordinates. From Figure 17 and Figure 18, we can see that the row and plant spacing in the Dazhai tobacco fields are larger than those in the Jiange tobacco fields. This aligns with our earlier statement that “tobacco planting in the Jiange experimental area is dense, while in the Dazhai experimental area, it is sparse”. In the Jiange experimental area, the extracted area ranges from 25.45 m2 to 780.73 m2, with row spacing and plant spacing approximately around 95 cm and 40cm, respectively. In the Dazhai experimental area, the extracted area ranges from 1501.09 m2 to 7378.31 m2, with row spacing and plant spacing approximately around 110 cm and 58cm, respectively. We can see that the calculated row spacing and plant spacing in each experimental area show no significant fluctuations. This also highlights the adaptability and stability of the algorithm designed in this paper to the differences in planting norms in different experimental areas.
Due to the presence of numerous tobacco fields in the Jiange experimental area, we measured the area, row spacing, and plant spacing of five representative tobacco fields, as shown in Figure 16. The five fields are labeled J3, J11, J14, J15, and J18, respectively. A comparison was made with the calculated results, as illustrated in Figure 19. The average accuracy rates of area, row spacing, and plant spacing were 97.13%, 97.52%, and 97.63%, respectively. From the results, it can be seen that our proposed tobacco planting information extraction algorithm achieves an overall calculation accuracy of around 97% in the Jiange experimental area, demonstrating the reliability of the method. However, we observe that the accuracy of row spacing and plant spacing in J14 is relatively lower. This is due to the fact that J14 comprises a mixture of several tobacco planting directions, affecting the calculation results of row spacing and plant spacing. For specific details, refer to Figure 15(JG).
Similarly, we measured the area, row spacing, and plant spacing of five tobacco fields in the Dazhai experimental area, labeled as D1, D2, D3, D4, and D5, as shown in Figure 16. The extraction accuracy of planting information for these five fields is shown in Figure 20. The average accuracy rates for area, row spacing, and plant spacing were 98.86%, 98.43%, and 98.99%, respectively. The overall calculation accuracy exceeded 98%, further demonstrating the effectiveness of the algorithm proposed in this paper for extracting tobacco planting information.
Considering both experimental areas, the overall average accuracy rates for the extraction of area, row spacing, and plant spacing reached 97.99%, 97.98%, and 98.31%, respectively.

4. Conclusions

The research proposed an automatic calculation method for tobacco row spacing, plant spacing, and tobacco field area based on dense small and medium-sized object detection in UAV images. The experiment selected four typical areas in Sichuan Province of China as experimental examples and extracted tobacco planting information by solving the problems of a complex geographical environment, irregular shapes of tobacco fields, small tobacco objects in the cluster stage, and dense tobacco planting. First, we realized the detection of dense small tobacco objects and the acquisition of tobacco spatial coordinates based on the improved object detection model YOLOv8s-EFF. According to the tobacco dataset we constructed, the AP0.5:0.95 of YOLOv8s-EFF reached 0.644, which was much higher than that of other models. Second, based on the tobacco coordinate output from the detection model, the DBSCAN algorithm was applied with adaptive parameters to effectively divide the tobacco fields into different regions. Third, for the divided tobacco coordinates, we designed a planting distance extraction algorithm based on outlier detection. The algorithm defined the calculation method of tobacco row spacing and plant spacing and filtered abnormal outliers through quartile detection, which reduced the impact of object detection model error on planting distance calculation. Finally, a tobacco field area extraction algorithm based on the extended contour was proposed. The algorithm extracted the contours of different tobacco field shapes based on the improved Alpha Shape algorithm and expanded the contour equidistantly according to the plant spacing so that the expanded contour could be closer to the actual edge of the tobacco field and could calculate a more accurate and reasonable tobacco field area. We verified the feasibility and accuracy of the tobacco planting information extraction algorithm for isolated tobacco fields with different shapes and in the actual production environment with composite tobacco fields. In the actual production environment, the average calculation accuracy of the extracted tobacco field area, row spacing, and plant spacing reached 97.99%, 97.98%, and 98.31%, respectively. The successful application of the algorithm in both isolated and composite tobacco field scenarios suggests its potential for real-world implementation in precision agriculture. The method provides a reference for the calculation of crop spacing, row spacing, and tobacco field area on UAV high-resolution images and provides valuable information support for precision agriculture. In addition, we also note that there are some calculation errors due to the influence of image resolution, model detection accuracy, and algorithmic calculation methods. In the future, more work should be conducted to improve the algorithm and optimize the tobacco detection model to further improve the stability and accuracy of tobacco planting information calculation.

Author Contributions

Conceptualization, L.H. and K.L.; methodology, K.L. and Y.L.; validation, K.L., J.Z., R.Q. and X.F.; investigation, L.H., Y.L., B.L. and Y.W.; resources, L.H., Y.L. and S.J.; writing—original draft preparation, K.L. and L.H.; writing—review and editing, L.H. and Y.L.; supervision, Y.L.; project administration, L.H., Y.L. and L.L.; funding acquisition, L.H. All authors have read and agreed to the published version of the manuscript.

Funding

This work was supported by the Key Projects of Global Change and Response of Ministry of Science and Technology of China under Grant 2020YFA0608203 and supported by the Science and Technology Support Project of Sichuan Province under Grant 2023YFS0366, 2021YFS0335, and Grant 2023YFG0020, in part by the Science and Technology Project of China Tobacco Corporation Sichuan Province Company under Grant SCYC202107, and supported in part by the Natural Science Foundation of Sichuan Province under Grants 2022NSFSC0207 and 2023NSFSC0751.

Data Availability Statement

Due to the confidentiality of the dataset for this study, participants in this study did not agree to share their data publicly, and therefore supporting data could not be provided.

Acknowledgments

The authors appreciate the reviewers for their constructive comments and kind help to improve the manuscript.

Conflicts of Interest

Bin Li was employed by China Tobacco Corporation Sichuan Provincial Company, Chengdu 610225, China. Yong Wang was employed by Sichuan Tobacco Company Liangshan Prefecture Company, Xichang 615000, China. Sichun Jian was employed by Chengdu Song Xing Technology Co., Ltd., Chengdu 610225, China. The remaining authors declare that the research was conducted in the absence of any commercial or financial relationships that could be construed as a potential conflict of interest.

References

  1. Kim, J.; Kim, S.; Ju, C.; Son, H.I. Unmanned Aerial Vehicles in Agriculture: A Review of Perspective of Platform, Control, and Applications. IEEE Access 2019, 7, 105100–105115. [Google Scholar] [CrossRef]
  2. Javaid, M.; Haleem, A.; Khan, I.H.; Suman, R. Understanding the potential applications of Artificial Intelligence in Agriculture Sector. Adv. Agrochem 2023, 2, 15–30. [Google Scholar] [CrossRef]
  3. Koirala, A.; Walsh, K.B.; Wang, Z.; McCarthy, C. Deep learning–Method overview and review of use for fruit detection and yield estimation. Comput. Electron. Agric. 2019, 162, 219–234. [Google Scholar] [CrossRef]
  4. Maimaitijiang, M.; Sagan, V.; Sidike, P.; Daloye, A.M.; Erkbol, H.; Fritschi, F.B. Crop Monitoring Using Satellite/UAV Data Fusion and Machine Learning. Remote Sens. 2020, 12, 1357. [Google Scholar] [CrossRef]
  5. Maktab Dar Oghaz, M.; Razaak, M.; Kerdegari, H.; Argyriou, V.; Remagnino, P. Scene and Environment Monitoring Using Aerial Imagery and Deep Learning. In Proceedings of the 2019 15th International Conference on Distributed Computing in Sensor Systems (DCOSS), Santorini Island, Greece, 29–31 May 2019; IEEE: Piscataway, NJ, USA, 2019; pp. 362–369. [Google Scholar] [CrossRef]
  6. Li, Z.; Mao, J.; Cao, P. Digital transformation: An inevitable choice for innovation and development of tobacco science and technology in China. Tob. Sci. Technol. 2022, 55, 1–8. [Google Scholar] [CrossRef]
  7. Shao, X.; Jiang, S.; Yan, S.; Mei, Y.; Li, X.; Pu, E.; Hou, Q.; Wang, X.; Shan, S.; Guo, J.; et al. Exploration of the Construction of Smart Tobacco Agriculture. Tob. Regul. Sci. (TRS) 2022, 1, 1652–1662. [Google Scholar]
  8. Tian, Y.; Yang, G.; Wang, Z.; Wang, H.; Li, E.; Liang, Z. Apple detection during different growth stages in orchards using the improved YOLO-V3 model. Comput. Electron. Agric. 2019, 157, 417–426. [Google Scholar] [CrossRef]
  9. Huang, S.; Wu, S.; Sun, C.; Ma, X.; Jiang, Y.; Qi, L. Deep localization model for intra-row crop detection in paddy field. Comput. Electron. Agric. 2020, 169, 105203. [Google Scholar] [CrossRef]
  10. Zhao, J.; Zhang, X.; Yan, J.; Qiu, X.; Yao, X.; Tian, Y.; Zhu, Y.; Cao, W. A Wheat Spike Detection Method in UAV Images Based on Improved YOLOv5. Remote Sens. 2021, 13, 3095. [Google Scholar] [CrossRef]
  11. Lu, S.; Liu, X.; He, Z.; Zhang, X.; Liu, W.; Karkee, M. Swin-Transformer-YOLOv5 for Real-Time Wine Grape Bunch Detection. Remote Sens. 2022, 14, 5853. [Google Scholar] [CrossRef]
  12. Jin, X.; Sun, Y.; Che, J.; Bagavathiannan, M.; Yu, J.; Chen, Y. A novel deep learning-based method for detection of weeds in vegetables. Pest Manag. Sci. 2022, 78, 1861–1869. [Google Scholar] [CrossRef] [PubMed]
  13. Zhu, X.; Xiao, G.; Wen, P.; Zhang, J.; Hou, C. Mapping Tobacco Fields Using UAV RGB Images. Sensors 2019, 19, 1791. [Google Scholar] [CrossRef] [PubMed]
  14. Fang, H. Rice crop area estimation of an administrative division in China using remote sensing data. Int. J. Remote Sens. 1998, 19, 3411–3419. [Google Scholar] [CrossRef]
  15. Wu, B.; Li, Q. Crop planting and type proportion method for crop acreage estimation of complex agricultural landscapes. Int. J. Appl. Earth Obs. Geoinf. 2012, 16, 101–112. [Google Scholar] [CrossRef]
  16. Du, Z.; Yang, J.; Ou, C.; Zhang, T. Smallholder Crop Area Mapped with a Semantic Segmentation Deep Learning Method. Remote Sens. 2019, 11, 888. [Google Scholar] [CrossRef]
  17. De Macedo, M.M.G.; Mattos, A.B.; Oliveira, D.A.B. Generalization of Convolutional LSTM Models for Crop Area Estimation. IEEE J. Sel. Top. Appl. Earth Obs. Remote Sens. 2020, 13, 1134–1142. [Google Scholar] [CrossRef]
  18. Huang, L.; Wu, X.; Peng, Q.; Yu, X. Depth Semantic Segmentation of Tobacco Planting Areas from Unmanned Aerial Vehicle Remote Sensing Images in Plateau Mountains. J. Spectrosc. 2021, 2021, 6687799. [Google Scholar] [CrossRef]
  19. Wang, W.; Yang, N.; Zhang, Y.; Wang, F.; Cao, T.; Eklund, P. A review of road extraction from remote sensing images. J. Traffic Transp. Eng. (Engl. Ed.) 2016, 3, 271–282. [Google Scholar] [CrossRef]
  20. Ayala, C.; Sesma, R.; Aranda, C.; Galar, M. A Deep Learning Approach to an Enhanced Building Footprint and Road Detection in High-Resolution Satellite Imagery. Remote Sens. 2021, 13, 3135. [Google Scholar] [CrossRef]
  21. Ghandorh, H.; Boulila, W.; Masood, S.; Koubaa, A.; Ahmed, F.; Ahmad, J. Semantic Segmentation and Edge Detection—Approach to Road Detection in Very High Resolution Satellite Images. Remote Sens. 2022, 14, 613. [Google Scholar] [CrossRef]
  22. Hoque, M.A.-A.; Phinn, S.; Roelfsema, C.; Childs, I. Tropical cyclone disaster management using remote sensing and spatial analysis: A review. Int. J. Disaster Risk Reduct. 2017, 22, 345–354. [Google Scholar] [CrossRef]
  23. Liu, Y.; Wu, L. Geological Disaster Recognition on Optical Remote Sensing Images Using Deep Learning. Procedia Comput. Sci. 2016, 91, 566–575. [Google Scholar] [CrossRef]
  24. Mallupattu, P.K.; Sreenivasula Reddy, J.R. Analysis of Land Use/Land Cover Changes Using Remote Sensing Data and GIS at an Urban Area, Tirupati, India. Sci. World J. 2013, 2013, 268623. [Google Scholar] [CrossRef] [PubMed]
  25. Wiatkowska, B.; Słodczyk, J.; Stokowska, A. Spatial-Temporal Land Use and Land Cover Changes in Urban Areas Using Remote Sensing Images and GIS Analysis: The Case Study of Opole, Poland. Geosciences 2021, 11, 312. [Google Scholar] [CrossRef]
  26. Gupta, P.; Christopher, S.A.; Wang, J.; Gehrig, R.; Lee, Y.; Kumar, N. Satellite remote sensing of particulate matter and air quality assessment over global cities. Atmos. Environ. 2006, 40, 5880–5892. [Google Scholar] [CrossRef]
  27. Scheibenreif, L.; Mommert, M.; Borth, D. Estimation of Air Pollution with Remote Sensing Data: Revealing Greenhouse Gas Emissions from Space. arXiv 2021, arXiv:2108.13902. [Google Scholar]
  28. Hu, J.; Shen, L.; Sun, G. Squeeze-and-Excitation Networks. In Proceedings of the 2018 IEEE/CVF Conference on Computer Vision and Pattern Recognition, Salt Lake City, UT, USA, 18–23 June 2018. [Google Scholar]
  29. Liu, S.; Huang, D.; Wang, Y. Learning Spatial Fusion for Single-Shot Object Detection. arXiv 2019, arXiv:1911.09516. [Google Scholar]
  30. Glenn, J. YOLOv8. Ultralytics. Available online: https://githubcom/ultralytics/ultralytics (accessed on 15 April 2023).
  31. Ester, M.; Kriegel, H.-P.; Sander, J.; Xu, X. A Density-Based Algorithm for Discovering Clusters in Large Spatial Databases with Noise. In Proceedings of the Second International Conference on Knowledge Discovery and Data Mining, Portland, OR, USA, 2–4 August 1996; Volume 76, pp. 226–231. [Google Scholar]
  32. Lin, T.-Y.; Dollar, P.; Girshick, R.; He, K.; Hariharan, B.; Belongie, S. Feature Pyramid Networks for Object Detection. In Proceedings of the 2017 IEEE Conference on Computer Vision and Pattern Recognition (CVPR), Honolulu, HI, USA, 21–26 July 2017; IEEE: Piscataway, NJ, USA, 2017; pp. 936–944. [Google Scholar]
  33. Liu, S.; Qi, L.; Qin, H.; Shi, J.; Jia, J. Path Aggregation Network for Instance Segmentation. In Proceedings of the IEEE Conference on Computer Vision and Pattern Recognition, Salt Lake City, UT, USA, 18–23 June 2018; pp. 8759–8768. [Google Scholar]
  34. Delaunay, B. Sur la sphere vide. Izv. Akad. Nauk SssrOtd. Mat. I Estestv. Nauk 1934, 7, 1–2. [Google Scholar]
  35. Lee, D.T.; Schachter, B.J. Two algorithms for constructing a Delaunay triangulation. Int. J. Comput. Inf. Sci. 1980, 9, 219–242. [Google Scholar] [CrossRef]
  36. Glenn, J. YOLOv5. Available online: https://githubcom/ultralytics/yolov5 (accessed on 15 April 2023).
  37. Lin, T.-Y.; Goyal, P.; Girshick, R.; He, K.; Dollar, P. Focal Loss for Dense Object Detection. In Proceedings of the IEEE International Conference on Computer Vision, Venice, Italy, 22–29 October 2017; pp. 2980–2988. [Google Scholar]
  38. Ren, S.; He, K.; Girshick, R.; Sun, J. Faster R-CNN: Towards Real-Time Object Detection with Region Proposal Networks. IEEE Trans. Pattern Anal. Mach. Intell. 2017, 39, 1137–1149. [Google Scholar] [CrossRef]
  39. Lin, T.-Y.; Maire, M.; Belongie, S.; Bourdev, L.; Girshick, R.; Hays, J.; Perona, P.; Ramanan, D.; Zitnick, C.L.; Dollár, P. Microsoft COCO: Common Objects in Context. arXiv 2015, arXiv:1405.0312v3. [Google Scholar]
Figure 1. Location of the experimental area and UAV images.
Remotesensing 16 00359 g001
Figure 2. Schematic of annotation and image enhancement. (ad) all include the four types of image augmentation mentioned above. Note: Images with subtle enhancement may be less noticeable. For instance, in (a), we can easily observe the presence of flipping and brightness transformation; however, it also includes subtle scaling and rotation.
Remotesensing 16 00359 g002
Figure 3. Flowchart for extracting tobacco planting information.
Remotesensing 16 00359 g003
Figure 4. Network Architecture for YOLOv8s-EFF.
Remotesensing 16 00359 g004
Figure 5. Illustration of the cropping process for large-scale tobacco images in testing.
Remotesensing 16 00359 g005
Figure 6. Schematic spatial distribution of tobacco coordinates (consistent when P0 is below P).
Remotesensing 16 00359 g006
Figure 7. Schematic diagram of row spacing calculation. In the left image, the dashed box represents the region for traversing and computing vertical distances. In the right image, all tobacco coordinates P i other than P and P 0 are involved in calculating vertical distances. d ¯ is the calculated plant spacing.
Remotesensing 16 00359 g007
Figure 8. Schematic of tobacco field contour expansion. The solid line segment is the initial outline of the tobacco field connected counterclockwise, and the dashed line is the expanded contour of the tobacco field.
Remotesensing 16 00359 g008
Figure 9. Small size tobacco detection results. Detection errors of the model are marked with white arrows.
Remotesensing 16 00359 g009
Figure 10. Detection results of densely distributed tobacco. Detection errors of the model are marked with white arrows.
Remotesensing 16 00359 g010aRemotesensing 16 00359 g010b
Figure 11. Detection results for scenes with uniformly distributed and large tobacco. Detection errors of the model are marked with white arrows.
Remotesensing 16 00359 g011
Figure 12. Tobacco detection results before and after overlapping cropping. (a) The detection results are without overlapping cropping. (b) The results after applying 20% overlapping cropping, followed by NMS. (c,d) display the scatter plots of tobacco center coordinates.
Remotesensing 16 00359 g012
Figure 13. Boxplot before filtering data.
Remotesensing 16 00359 g013
Figure 14. Boxplot after filtering data.
Remotesensing 16 00359 g014
Figure 15. Tobacco field contour extraction. (a) Original image of a single tobacco field. (b) Tobacco detection results. (c) Tobacco field contour extraction results.
Remotesensing 16 00359 g015
Figure 16. Tobacco field region division and contour extraction. (a) Jiange experimental area. (b) Dazhai experimental area.
Remotesensing 16 00359 g016aRemotesensing 16 00359 g016b
Figure 17. Calculation results of Jiange experimental area.
Remotesensing 16 00359 g017
Figure 18. Calculation results of Dazhai experimental area.
Remotesensing 16 00359 g018
Figure 19. Accuracy statistics of planting information calculation in Jiange tobacco fields.
Remotesensing 16 00359 g019
Figure 20. Accuracy statistics of planting information calculation in Dazhai tobacco fields.
Remotesensing 16 00359 g020
Table 1. Tobacco dataset quantity.
Experimental AreasOriginal DataAugmented Data (1×)Training SetTest Set
Chongzhou27227254468
Dazhai29029058073
Jiange27827855670
Shifang26326352666
Total110311032206277
Table 2. Model evaluation metrics.
MethodsAP0.5:0.95AP0.5AP0.75APSAPMAPL
YOLOv8s [30]0.6280.8310.7710.4830.6270.767
YOLOv8s + SEBlock0.6330.8310.7830.4810.6360.776
YOLOv8s + ASFF0.6420.8310.7870.4920.6380.789
YOLOv8s-EFF (ours)0.6440.8310.7890.4980.6420.785
YOLOv5s [36]0.5340.8270.6110.3540.6280.635
RetinaNet-R101 [37]0.5370.8250.6040.3400.6250.684
Faster R-CNN-R101 [38]0.5080.8220.5140.2960.5860.650
Table 3. Tobacco field information statistics.
Tobacco Field AreaRow SpacingPlant Spacing
CZMV528.12 m2107.3 cm68.9 cm
CV533.20 m2107.02 cm67.55 cm
ACC99.04%99.74%98.04%
DZMV3330.44 m2109.5 cm55.2 cm
CV3414.06 m2114.72 cm55.67 cm
ACC97.49%95.23%99.15%
JGMV487.53 m286.9 cm37.7 cm
CV497.18 m295.52 cm39.70 cm
ACC98.02%90.08%94.69%
SFMV1618.21 m2101.6 cm37.9 cm
CV1674.62 m2100.09 cm38.47 cm
ACC96.51%98.51%98.5%
Disclaimer/Publisher’s Note: The statements, opinions and data contained in all publications are solely those of the individual author(s) and contributor(s) and not of MDPI and/or the editor(s). MDPI and/or the editor(s) disclaim responsibility for any injury to people or property resulting from any ideas, methods, instructions or products referred to in the content.

