Article

CD-MQANet: Enhancing Multi-Objective Semantic Segmentation of Remote Sensing Images through Channel Creation and Dual-Path Encoding

1
School of Automation Engineering, University of Electronic Science and Technology of China, Chengdu 611731, China
2
Southwest Institute of Technical Physics, Chengdu 610041, China
3
School of Software Engineering, Chengdu University of Information Technology, Chengdu 610225, China
4
Sichuan Province Engineering Technology Research Center of Support Software of Informatization Application, Chengdu 610225, China
*
Author to whom correspondence should be addressed.
Remote Sens. 2023, 15(18), 4520; https://doi.org/10.3390/rs15184520
Submission received: 14 August 2023 / Revised: 12 September 2023 / Accepted: 13 September 2023 / Published: 14 September 2023

Abstract

:
As a crucial computer vision task, multi-objective semantic segmentation has attracted widespread attention and research in the field of remote sensing image analysis. This technology has important application value in fields such as land resource surveys, global change monitoring, urban planning, and environmental monitoring. However, multi-target semantic segmentation of remote sensing images faces challenges such as complex surface features, complex spectral features, and a wide spatial range, resulting in differences in spatial and spectral dimensions among target features. To fully exploit and utilize spectral feature information, focusing on the information contained in spatial and spectral dimensions of multi-spectral images, and integrating external information, this paper constructs the CD-MQANet network structure, where C represents the Channel Creator module and D represents the Dual-Path Encoder. The Channel Creator module (CCM) mainly includes two parts: a generator block and a spectral attention module. The generator block aims to generate spectral channels that can expand different ground target types, while the spectral attention module can enhance useful spectral information. Dual-Path Encoders include channel encoders and spatial encoders, intended to fully utilize spectrally enhanced images while maintaining the spatial information of the original feature map. The decoder of CD-MQANet is a multitasking decoder composed of four types of attention, enhancing decoding capabilities. The loss function used in the CD-MQANet consists of three parts, which are generated by the intermediate results of the CCM, the intermediate results of the decoder, and the final segmentation results and label calculation. We performed experiments on the Potsdam dataset and the Vaihingen dataset. Compared to the baseline MQANet model, the CD-MQANet network improved mean F1 and OA by 2.03% and 2.49%, respectively, on the Potsdam dataset, and improved mean F1 and OA by 1.42% and 1.25%, respectively, on the Vaihingen dataset. The effectiveness of CD-MQANet was also proven by comparative experiments with other studies. We also conducted a thermographic analysis of the attention mechanism used in CD-MQANet and analyzed the intermediate results generated by CCM and LAM. Both modules generated intermediate results that had a significant positive impact on segmentation.

Graphical Abstract

1. Introduction

The semantic segmentation of multiple objects in remote sensing images is of great significance in the field of remote sensing, which provides help for such work as urban planning, agricultural monitoring, and satellite navigation [1]. Remote sensing images can provide information on segmented objects in different aspects, such as spectral latitude and spatial latitude. Therefore, remote sensing images often contain rich material, geometry, and spectral reflection information of target objects [2]. On the one hand, these characteristics make it more difficult for semantic segmentation scholars to deal with remote sensing image information. On the other hand, they make the semantic segmentation of multi-place objects based on remote sensing images from multiple perspectives.
In the realm of remote sensing image semantic segmentation, numerous advanced techniques rooted in deep learning have been developed [3]. Among these, U-Net, initially proposed by Olaf Ranneberger et al. [4], stands out for its distinctive U-shaped structure and encoder–decoder concept. U-Net is renowned for its efficiency and high performance, serving as a foundational model upon which subsequent methods have been built. One such method is SegNet [5], which employs a specialized decoder architecture incorporating maximum index information from the encoder. This innovation has yielded exceptional segmentation results, particularly on cost-effective hardware. Deeplab [6], on the other hand, focuses on an encoder–decoder architecture that substantially expands the model’s receptive field. It enhances segmentation precision by introducing advanced components such as void convolution and spatial feature pyramids. Semantic segmentation often necessitates the extraction of global features. To address this need, researchers have proposed various methods. Zhou et al. [7] introduced D-Linknet, which aggregates contextual information using multi-scale expansion rates. Eff-Unet++ [8] adopted the EfficientNet-B4 architecture to replace U-Net’s encoder, along with redesigning the decoder’s jumping connections and residual components. This adaptation has improved feature extraction capabilities. For very-high-resolution (VHR) remote sensing images, Qiu et al. [9] devised a refined U-Net with a specialized thinning jump connection scheme that incorporates an atrous spatial convolution pyramid pool (ASPP) module and several improved depth separable convolution (IDSC) modules. Jiao et al. [10] developed Unet-V4, an end-to-end edge-accurate segmentation network tailored for capturing regions of interest with tight edges and potential shadow regions with blurred boundaries. References [11,12,13] introduce the transformer into U-Net, showcasing the universality of the U-Net structure.
Attention mechanisms have played a pivotal role in effectively distinguishing and utilizing information, akin to the human visual attention system. SENet [14] represents a notable application of attention mechanisms in computer vision. SENet introduces an SE module that predicts weight coefficients for each input channel, establishing a channel-wise attention module. This approach has delivered promising results, inspiring subsequent advancements. The integration of attention mechanisms in image segmentation has witnessed significant progress. Models like PSAnet [15] incorporate spatial location-based attention modules, enabling better utilization of location-based information. The evolution of attention mechanisms continues, with DANet [16] introducing dual self-attention, combining spatial and channel self-attention for enhanced global information acquisition. CBAM [17] presents a lightweight, adaptable attention mechanism, while DA-Roadnet [18] tailors attention mechanisms to the unique characteristics of road-related imagery. In the context of multispectral remote sensing images, particularly hyperspectral data, attention mechanisms have been leveraged to address the challenge of distinguishing between useful and irrelevant information. In hyperspectral imagery with high spectral but low spatial resolution, researchers have proposed spectral attention methods based on global convolution and spectral threshold weights [19]. Multi-scale spectral attention (MSA) modules have been designed to reduce spectral redundancy and enhance discrimination capabilities [20]. Furthermore, in multispectral image semantic segmentation, both spatial and spectral resolutions are frequently leveraged. Researchers have innovated by designing attention mechanisms tailored to spectral and spatial characteristics, effectively suppressing unnecessary information and focusing on critical details [21,22,23,24,25]. Additionally, building spatial–spectral bidirectional networks using attention mechanisms has gained prominence [26,27]. In conclusion, this research underscores the critical role of attention mechanisms in advancing the accuracy of multiple object semantic segmentation in remote sensing imagery. These mechanisms have enabled the efficient extraction and utilization of information, thereby contributing to the development of sophisticated and high-performing models for a range of applications in this domain.
However, the construction of both the U-Net structure and self-attention mechanism depends on the extraction and processing of the internal information of the feature map, and the combination of input features to obtain the output features. This brings about the following two problems: Firstly, the output feature completely depends on the quality of the input feature extraction. If the input feature extraction is poor, the output feature cannot make up for it. Secondly, the self-attention mechanism is a characteristic dimension of attention, which cannot be visualized intuitively and has poor interpretability.
In order to improve the accuracy of semantic segmentation, another idea is to introduce external information. In a convolutional neural network, there are two main ways to introduce external information. One is to increase the input channel and directly input the external information into the model. The second is to add the loss function and introduce the additional loss function during the training of the model to calculate the distance between the intermediate quantity of the model and the external information. Y Zhang et al. [28] segmented remote sensing images from the perspective of knowledge transfer and introduced semantic word vectors to help different styles of data achieve domain adaptation. The introduction of external information brings additional information to the model, which helps the model learn more general features. However, the external information is usually difficult to express and fully integrate into the existing deep learning model. In order to solve the above problems, Li et al. [29] introduced label information by building LAM, transformed semantic labels into multi-channel binary semantic labels through one-hot code transformation, and calculated loss with the feature map. LAM is different from the self-attention mechanism in that it introduces external label information to optimize the generation of an attention probability map.
In addition to the improvement of network structure, many scholars have studied and discussed the remote sensing image data enhancement methods used in semantic segmentation. In common methods, remote sensing images are generally enhanced in spatial information, such as image rotation, cropping, scaling, adding noise, or HSV transformation. References [30,31,32] introduced transpose, rotation, and other enhancement operations. In addition to the conventional enhancement operations, reference [33] also uses enhancement methods such as mixup and cutup to further enhance the data diversity. However, the above image enhancement methods have such problems: Firstly, the general remote sensing image data enhancement is often only for the spatial dimension of the remote sensing image, ignoring the enhancement in the spectral dimension; Secondly, the parameters of remote sensing image rotation, HSV change, and other enhancement methods are often preset or randomly generated by random number function, which is independent of the deep learning network. Based on these problems, the idea is to build an adaptive and learnable spectral dimension data enhancement method to improve the robustness and accuracy of the network. This paper uses convolution to construct an adaptive spectral enhancement method. The original image of four channels is enhanced to 196 channel images, and the generated spectral enhancement results are constrained by LAM.
Reducing human–computer interaction is a critical research direction in various aspects, including image enhancement and the integration of additional information. However, there is still room for improvement in the accuracy of current deep learning multi-object segmentation methods. This limitation is primarily attributed to the insufficient utilization of spectral dimension information and external data. To enhance the accuracy of multi-objective semantic segmentation, fully exploit the spectral and spatial information present in remote sensing images, and integrate external information, we aim to develop an adaptive spectral enhancement method that enhances the network’s ability to explore diverse spectral information. Additionally, we adopt a comprehensive strategy of incorporating attention mechanisms into all aspects of the network to enhance its segmentation capabilities for different objects.
The main contributions of this paper are as follows:
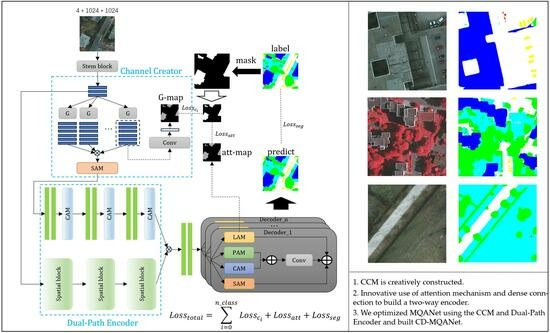
  • The Channel Creator module (CCM) is creatively constructed. By imitating the means of image enhancement, an adaptive spectral enhancement method is introduced. CCM can expand the number of channels in the feature map and build spectral attention to give weight to the feature map, stimulate the channels containing useful information, suppress the channels with useless information, and enhance the ability of the network to extract and use the channel features.
  • Innovative use of attention mechanism and dense connection to build a two-way encoder. The Dual-Path Encoder is divided into two parts: channel encoder and spatial encoder. The channel encoder uses the channel attention mechanism to focus on the channel information of the feature map. The spatial encoder uses dense connection and spatial attention mechanism to extract multi-scale features. The two-way encoder improves the ability of the network to extract features of different scales and channels.
  • We optimized MQANet using the CCM and Dual-Path Encoder and built CD-MQANet. We also tested CD-MQANet on two public datasets. The experiment shows that the evaluation metrics of CD-MQANet are greatly improved compared with the baseline model MQANet, especially for low vegetation and tree types. The attention mechanism of CD-MQANet and some intermediate results are also visualized and interpretable.

2. Methods

Li et al. [29] introduced MQANet, a network architecture that primarily focused on optimizing the decoder part of U-Net. They achieved this by replacing the original decoder with a multitasking decoder, which incorporated label attention, channel attention, spatial attention, and edge attention mechanisms. Compared to the traditional U-Net, MQANet demonstrated a significant improvement in segmentation accuracy. However, MQANet also exhibited certain shortcomings:
  • MQANet did not address optimization in the encoder part of the network, leading to a mismatch in the scales of the encoder and decoder components. As a result, the encoder failed to fully extract information from the original image, indicating a pressing need to enhance the network’s ability to extract valuable information from the input image.
  • The contribution of the edge attention mechanism in MQANet towards improving network accuracy was found to be relatively insignificant, and its implementation introduced complexity, requiring additional label preprocessing. Consequently, there is an urgent requirement for more effective attention mechanisms.
Based on the strengths and weaknesses of MQANet, this paper introduces the Channel Creator module (CCM) and the Dual-Path Encoder module, with a primary focus on optimizing the encoder part of the network to enhance segmentation accuracy.

2.1. Architecture of CD-MQANet

To fully exploit and utilize spectral feature information and focus on the information contained in multispectral images from both spatial and spectral dimensions, we constructed CD-MQANet, where “C” represents the Channel Creator module, and “D” represents the Dual-Path Encoder.
The network structure of CD-MQANet is shown in Figure 1. First of all, in order to save the information of the feature map as much as possible and reduce the size of the feature map, we first send the original image to the stem block. The structure of the stem block is one layer of 3 × 3 convolution (stride size is 2), two layers of 3 × 3 convolution (stride size is 1), and one layer of average pooling. The main purpose of stem block is to perform a preliminary feature extraction on the original image and reduce the size of the feature map to 1/4 of the original size, saving the calculation cost. After passing through stem block, the original image will become a 16-channel feature map, which will enter two different branches. One of the branches will enter the Channel Creator module (CCM). The CCM mainly includes two parts: spectral generator and spectral attention module. The spectral generator aims to generate spectral channels that can expand the spectral characteristics of different types of ground objects. Each type will generate 32-channel feature maps according to the original category, and then the generated feature maps will calculate loss with the labels of this type of ground objects to constrain the generation of feature maps. The main task of the spectral attention module is to generate a spectral threshold, enhance useful spectral channels, and suppress useless spectral channels. The spectral-enhanced feature map will enter the Dual-Path Encoder together with the original feature map extracted by stem block. The spectral-enhanced feature map will enter the channel feature extraction branch of the Dual-Path Encoder, and the original feature map will enter the spatial feature extraction branch of the Dual-Path Encoder. The features extracted by the two-way encoder will be sent to the multi-head attention decoder for decoding after fusion. Finally, the overall loss of the network will consist of three parts: the L o s s c i generated by G-map and label, L o s s a t t generated by LAM in decoder part, and L o s s s e g generated by prediction results and label calculation.

2.2. Channel Creator Module

Figure 2 shows the structure of the Channel Creator module (CCM). The CCM mainly consists of two parts. The first part is composed of N generator blocks (n is the type of objects in the remote sensing image), and the second part is spectral attention. The CCM hopes to generate the corresponding enhanced spectral channels according to different types of objects through the generator block and suppress the generated useless information and enhance the useful information through spectral attention.
Generator block has such an idea. In fact, multispectral images are superimposed by gray images of multiple bands in the channel direction. The main difference between gray images of different bands is that the gray values of different pixels are different. Therefore, we consider generating different bands through the change in gray values. The generate operation can be defined as the equation:
F x = α x + β γ
where x   represents the original feature map and α, β, γ are three parameters. It should be noted that, the three parameters in F x   can be optimized by back propagation. The generator block first generates a new layer for each layer of the input feature map according to the F x transform, and then performs two times of double convolution to obtain the feature map after spectral enhancement for this kind of ground object. In order to constrain the bands generated by the generator, we also convolute the generated bands to 1 channel and calculate the cross-entropy loss with the label of this category object. Generator block is constructed to enhance the channel information of different types of objects by using the above methods and make the enhanced information relatively reliable by calculating loss.
The generator block of the n classes feature map will generate 2 × n times the number of channels of the original feature map. Although we have used the loss function to constrain the spectral enhancement, we still cannot guarantee that such a large number of spectral channels all contain useful information. In order to solve this problem, we constructed spectral attention. Spectral attention hopes to generate a spectral threshold weight from the global information of the feature map to screen the spectral channels, gain the channels with effective information, and suppress the channels with invalid or even interfering information. Spectral attention consists of a max pooling, a global 2-D convolution layer, and two 1-D convolution layers. In order to reduce the amount of calculation, spectral attention first pools the maximum value of the feature map, and then performs 2-D global convolution, that is, the size of the convolution kernel is consistent with the H and W of the feature map. After global convolution, the feature map will become one-dimensional, which corresponds to the thresholds of different spectral channels. After two one-dimensional convolutions, the spectral threshold is multiplied by the feature map of input spectral attention to obtain the constrained feature map.

2.3. Dual-Path Encoder

The Dual-Path Encoder is mainly composed of two parts. The first part is the channel encoder including the channel attention and double conv, and the second part is the spatial encoder including the spatial attention mechanism and dense block. The Dual-Path Encoder hopes to explore the channel dimension feature information to a greater extent on the basis of the feature map after spectral expansion and retain the spatial dimension feature information of the original feature map. Based on this idea, the input of each branch of the Dual-Path Encoder is also different: the input of the channel encoder is the output result of the CCM. The input of the spatial encoder is the original feature map output by stem block.
The channel encoder receives the spectral-enhanced feature map output by the CCM, so we use the structure of superimposed three-layer double convolution and channel attention module on this branch to further extract and enhance the channel information. The structure of the channel attention module is shown in Figure 3. In CAM, the input feature map passes through two branches, one of which will be used as Q and K to generate C× C attention probability map. In the other branch, it is used as V. Among them, V, Q, and K represent value features, query features, and key features, respectively; C, H, and W, respectively, represent the channel, height, and width of the feature map. The overall structure of cam can be expressed by the following Equations (2) and (3):
A t t = s o f t m a x Q C × H W · K H W × C
F o u t = A t t · V C × H W . r e s h a p e C × H × W + I n p u t C × H × W
where subscript represents the shape of corresponding graph, F o u t represents the weight chart of the last output, I n p u t C × H × W represents the original feature map of input channel self-attention, r e s h a p e C × H × W represents changes to the characteristic diagram shape of C × H × W .
The main function of the spatial encoder is to retain the original feature map information and extract more spatial information at the same time. Therefore, the structure of the channel encoder is three-layer spatial block that contains dense block and spatial attention mechanism. The structure of the spatial block is shown in Figure 4. In the dense block, the structure of the first n layers is set to BN-relu-conv (1 × 1) -bn-relu-conv (3 × 3, stride = 1). After that, an additional three-layer dilated convolution is added, and the structure of the three-layer dilated convolution is set as: BN-relu-conv (1 × 1) -bn-relu-Dconv (3 × 3, stride = 2, or 4, or 8). After passing through a dense block, the number of channels in the characteristic graph will increase by n + 3 × K layers. Among them, K is called growth rate. Dense block encourages feature reuse, sends the feature map extracted from the previous convolution layer to the subsequent convolution layer for operation, and introduces three-layer dilated convolution to enhance the receptive field of the network. The spatial encoder hopes to use the combination of ordinary convolution and dilated convolution to improve the ability of the network to obtain local and global spatial information and use the mechanism of feature reuse to improve the ability of the network to obtain and use spatial information at different scales.
In PAM, the input characteristic graph passes through two branches, one of which will be generated as Q and K (H × W) × (H × W) Attention probability map. In the other branch, it is used as v. Among them, V, Q, and K represent value features, query features, and key features, respectively; C. H and W, respectively, represent the channel, height, and width of the feature map. The spatial encoder combines the dense block and spatial attention to fully extract the spatial feature information of different scales in the feature map while maintaining the original feature information, so as to improve the ability of the network to extract local and global spatial features.

2.4. Multi-Task Decoder and Label Attention

Self-attention mechanism helps to improve the accuracy of large-scale goals. However, there are some similarities in color features and texture features between some ground object types. For example, some leafless trees are very similar to low vegetation, which is easy to cause misjudgment of the network. In order to reduce the miscarriage of justice between similar objects, it is necessary to find the causes of miscarriage of justice. After analyzing the structure of the network model, it is found that in the traditional encoder–decoder structure, a decoder generates multiple outputs through the softmax function. However, the characteristics of different categories differ greatly, and each category will contribute to the parameter update during training, but the parameter optimization directions of different categories may be different, resulting in competition and mutual restriction between categories. In order to solve this problem, this paper introduces multitask learning, which transforms a multi-classification semantic segmentation problem into a multi-binary classification semantic segmentation problem, so as to avoid the competition between different categories of parameters.
Aiming at the problem of multi-classification feature extraction in this paper, the decoder part of the multitask learning model is modified, and a multi-decoder quadruple attention model based on multitasking is constructed, which transforms a multi-classification semantic segmentation problem into a multi-binary classification semantic segmentation problem. Each category constructs a decoder separately. The decoder is composed of multiple attention modules, and each decoder only focuses on the corresponding category, there is no need to consider the characteristics of other categories, thus reducing the competitive relationship between categories. We construct the decoder to echo the attention mechanism used by the encoder: in the encoder, the spatial, channel, and spectral dimensions are weighted with attention, and we hope to build a similar weighting mechanism in the decoder. In order to introduce the external label information, it is necessary to construct additional attention mechanism, so as to form a quadruple attention decoder together with the first three attention.
In addition, another important way to solve the problem of misjudgment is to introduce external information. This paper chooses to use the method of introducing label attention to build the external information acquisition module of the network. In the common attention mechanism, the attention probability map can be expressed as a two-dimensional matrix, while in the label attention mechanism, in order to introduce additional semantic information, the attention probability map is expressed as a multi-channel two-dimensional matrix, and the number of channels is consistent with the number of semantic categories. Because the final task is to complete the semantic segmentation of the image, each semantic channel pays attention to different information, and the information that each channel pays most attention to is the area covered by the channel’s feature types. Therefore, when the attention probability map is more similar to the semantic labels, the final semantic classification results can also be more similar to the labels. The semantic label is transformed into a multi-channel binary semantic label from a single-channel gray-scale semantic label through one-hot code transformation. The number of channels is the same as the number of categories. The two-dimensional matrix and the attention map are kept the same size through down-sampling, and the loss function of the generated attention probability map and the real down-sampling label can be calculated.
Based on the above ideas, combined with the attention mechanism, the following modules can be constructed, as shown in Figure 5 structure of LAM. As the number of channels in the attention probability map increases, the attention probability map is no longer obtained by the multiplication of Q and K points, but by the direct convolution of input features. Similarly, the calculation method of the output result is also changed. The final output result is obtained by convolution of the attention output and the original input.

2.5. Loss Function

General deep learning segmentation methods often only calculate the loss for the segmentation results and labels and use this loss to update the parameters of the deep learning network. Unlike general deep learning multi-object segmentation models, the final loss of this article consists of three parts: the G-map generated by the CCM and the loss 1 calculated by the single class object label, the loss 2 calculated by the LAM and label unique heat code, and the final segmentation result and the loss 3 calculated by the label. The calculation method is as Equations (4)–(7):
L o s s c i = C r o s s E n t r o p y L o s s G M A P i ,   L a b e l i
L o s s s e g = C r o s s E n t r o p y L o s s p r e d i c t , L a b e l
L o s s t o t a l = i = 0 n L o s s c i + L o s s a t t + L o s s s e g
It can be seen from the above formula that the cross-entropy loss is used in the loss function constructed by each part. Among them, G M A P i stands for GMap, label generated by class i figure CCM, L a b e l i stands for the label of class i figure. Att-map is the attention map generated by LAM. L a b e l o n e h o t is the one-hot form of the label.

3. Experiments

In order to verify the reliability and effectiveness of the method proposed in this paper, this paper focuses on two publicly available ISPRS remote sensing image semantic segmentation datasets. The hardware and software conditions used in this paper are shown in Table 1.

3.1. Datasets

The dataset is from the International Society for Photogrammetry and Remote Sensing (ISPRS). The dataset is widely used in the field of remote sensing image feature extraction. The dataset contains remote sensing images of two regions, Potsdam, a large city in Germany, and Vaihingen, a small village. The original image and annotation examples are shown in Figure 6.
The Potsdam dataset [34] contains 38 high-resolution orthophoto images with a spatial resolution of 0.05 m, and each image size is 6000 × 6000 pixels. The dataset provides four bands of data (r-g-b-ir). All four bands are used in this paper. In order to facilitate the training of the deep learning model, the original large image is segmented into a 1024 × 1024 small image. The dataset label contains six types of features: buildings, impervious ground, low vegetation, trees, vehicles, and background. In Potsdam dataset, the size of the training set and the test set are 864 and 504, respectively.
The Vaihingen dataset [35] contains 33 high-resolution orthophoto images with a spatial resolution of 0.09 m, and each image is about 2500 in size × 2500 pixels. The dataset provides three bands (r-g-ir). This paper uses the data of all three bands, and the data processing method is consistent with the Potsdam dataset. Similarly, the dataset label includes six types of ground objects: buildings, impervious ground, low vegetation, trees, vehicles, and background. In Vaihingen dataset, the size of the training set and the test set are 234 and 63, respectively.

3.2. Metrics

In order to verify the effectiveness of the model, a general evaluation index is needed to quantify the accuracy performance of the model. In the task of remote sensing image multi-class feature extraction and recognition, the prediction result is the pixel-by-pixel classification of the original image, which belongs to the semantic segmentation task in computer vision. Therefore, this paper selects two common semantic segmentation evaluation indicators, F1 score and OA (overall accuracy), to measure the quality of the prediction result. In the binary classification problem, the prediction results can be divided into four categories according to whether the prediction is correct or not and the corresponding real value. All classification results are divided into four categories: true case (TP), false positive case (FP), true negative case (TN), and false negative case (FN). Thus, two concepts of precision and recall are introduced, as shown in the following Equations (8) and (9):
precision = T P T P + F P
r e c a l l = T P T P + F N
The precision ratio represents the proportion of all predicted results that are correct in the positive example, and the recall ratio represents the proportion of all real results that are correct in the collation. The two are a pair of contradictory measures, and F1 score is the harmonic index of precision ratio and recall ratio:
F 1 = 2 × p r e c i s i o n × r e c a l l p r e c i s i o n + r e c a l l
For the multi-category semantic segmentation problem, the F1 between each category and its background can be calculated, respectively, and then the final multi-category F1 score can be obtained by averaging the F1 scores of each single category. Generally, the F1 score only calculates all foreground categories, ignoring the background. Therefore, this paper only calculates F1 scores for each foreground category.
F 1 m e a n = i N 1 F 1 i / N
Compared with F1, the calculation method of OA is simpler. OA means the ratio of all correctly predicted pixels to the total pixels. The specific formula is as Equation (12):
O A = T P + T N T P + T N + F P + F N

4. Results

In order to verify the reliability and effectiveness of the method proposed in this paper, ablation experiments will be carried out on the Potsdam dataset and Vaihingen dataset, and comparative experiments will be carried out with the methods proposed in other articles. The ablation experiment will take MQANet as the baseline model and explore the effect of different modules.

4.1. Ablation Study

4.1.1. Experiments Results on Potsdam Datasets

This section will show the effects of different methods on the Potsdam dataset, in which MQANet is the benchmark model, C-MQANet is the model with CCM, D-MQANet is the model with the Dual-Path Encoder, and CD-MQANet is the model with both modules. Table 2 shows the experimental results.
As shown in Table 2, compared with the baseline, the indicators of CD-MQANet have achieved the best results. Among them, the F1-Score of Low Veg and Tree has improved significantly, and the F1-Score of other types has improved to some extent. Finally, the mean F1 and OA increased by 2.03% and 2.49%, respectively, compared with the baseline model. When we focus on the effect of the CCM, we find that the CCM has significantly improved the segmentation accuracy of Low Veg and Tree objects, but it has made little contribution to the segmentation accuracy of other objects and may even provide negative contributions. This may be because the spectral features of Low Veg and Tree in multispectral images, especially in the near-infrared band, are quite different from those of other ground objects. The spectral enhancement mechanism amplifies this difference and enhances the ability of the network to use spectral information. However, due to the lack of spatial information mining, the segmentation ability of features with small spectral differences (such as impervious surfaces and buildings) is poor. However, thanks to the high extraction accuracy of Low Veg and Tree features, C-MQANet has made some improvement compared with the baseline model in terms of mean F1 and OA. The Dual-Path Encoder has improved the extraction accuracy of each category. Thanks to the equal attention to channel and spatial information, as well as the acquisition and utilization of multi-scale information, D-MQANet has improved to a certain extent in each category. The improvement of impervious surfaces and Low Veg is more obvious, while the improvement of the car category is lower. Finally, D-MQANet has improved to a certain extent compared with the mean F1 and OA of the baseline model. CD-MQANet combines the advantages of the two improved modules to maintain the extraction accuracy of plant-like features (Low Veg and Tree) and improve the extraction ability of other types of features to a certain extent. Compared with MQANet, the extraction accuracy of all types of features in CD-MQANet has been improved, and the categories with the greatest improvement are Low Veg and Tree. However, it is worth mentioning that the three improved models have no obvious improvement in vehicle extraction compared with the baseline model. This may be because the pixels of vehicle-type features in remote sensing images are relatively small. Figure 7 can more intuitively illustrate these situations.
In general, the introduction of CCM can significantly reduce the missed detection and false detection of Low Veg and Tree objects’ features, which is mainly because CCM enhances the network’s ability to mine and utilize channel information. The network model with a Dual-Path Encoder has a relatively balanced ability to extract features of different scales. Especially, as shown in the third line of images, D-MQANet and CD-MQANet have fewer holes when extracting large-scale features. CD-MQANet has the advantages of both improvements. It improves the detection accuracy of Low Veg and Tree features while maintaining the abbreviation ability of other features. There are fewer false detections and missing detections.

4.1.2. Experiment Results on Vaihingen Datasets

This section will show the effects of different methods on the Vaihingen dataset, of which MQANet is the benchmark model, C-MQANet is the model of introducing CCM, D-MQANet is the model of introducing Dual-Path Encoder, and CD-MQANet is the model of introducing CCM at the same time. Table 3 shows the experimental results.
The test results on the Vaihingen dataset are similar to those on the Potsdam dataset. The improvements of the CCM and Dual-Path Encoder have improved in the mean F1 and OA. Among them, the CCM has significantly improved the segmentation accuracy of Low Veg and Tree features, for C-MQANet has the highest segmentation accuracy in the Tree category. Similar to previous experiments, the C-MQANet model has a certain decline in the segmentation accuracy of Imp. Surf and building. Compared with the baseline model, D-MQANet has improved the segmentation accuracy of all types of features, and D-MQANet has the highest segmentation accuracy of building-type features. Finally, CD-MQANet integrated the advantages of the two improvements and achieved the highest mean F1 and OA, which increased by 1.25% and 1.42%, respectively, compared with the benchmark model. In order to more intuitively show the accuracy changes in the network model, Figure 8 shows the feature segmentation of the Vaihingen dataset.
Figure 8 shows the extraction results of different methods on the Vaihingen dataset. Unlike the Potsdam dataset, the Vaihingen dataset contains only three bands of G, B, and NiR, so the original image is displayed as a false color image. Compared with other networks, CD-MQANet maintains the segmentation ability of small-scale objects (such as vehicles) at first and has a strong segmentation ability for large-scale objects at the same time: specifically, there are fewer internal holes in the extraction results. In addition, the most significant improvement of CD-MQANet is that CD-MQANet has a strong ability to exclude some backgrounds that are prone to misclassification.

4.2. Comparative Experiment with Other Methods

Additionally, to validate the effectiveness of our proposed optimal model, MQANet, on existing datasets, we conducted comparative experiments with other methods. In the comparison process, we still used two commonly used evaluation metrics, namely the average F1 value and overall accuracy (OA). In comparative studies, we examined various recent methods, including but not limited to the following:
  • The latest CRMS [36] network adopts a multi-scale residual module for optimal feature extraction, and its performance in the field of image segmentation deserves attention.
  • These methods include CBAMNet [17] and SENet [14], which introduce a self-attention mechanism to facilitate weighted fusion of information between different spatial locations and channels in the network, thereby enhancing feature expression capabilities.
  • Deeplabv3 + [37], as a new network with a spatial feature pyramid structure, can better capture features at different scales and semantic levels in images to improve segmentation performance.
By comparing with these existing methods, we can more comprehensively evaluate the superiority of MQANet in the task of multi-target semantic segmentation of remote sensing images. We conducted experiments on two publicly available datasets, and through comparative results, MQANet achieved significant improvements in both average F1 value and OA. These comparative experiments further verify the effectiveness and practicality of the proposed method.
In order to verify the effectiveness of the method proposed in this paper, this paper also conducted comparative experiments with some classic or cutting-edge research results, and the experimental results are shown in Table 4. Experiments show that on the basis of MQANet, the CD-MQANet network introduces a spectral enhancement mechanism and a two-way encoder mechanism, which improves the overall segmentation accuracy of the network.
In addition, we calculated the number of parameters constituted by each network. In order to show the results more intuitively, we draw Figure 9 and Figure 10.
In both Figure 9 and Figure 10, the vertical axis represents the model parameter size and the inference time of the model, while the horizontal axis represents the ACC results obtained by the model on the Potsdam dataset. In addition to the networks mentioned in Table 4, both Figure 9 and Figure 10 also include C-MQANet and D-MQANet in the analysis. The results indicate that the introduction of CCM slightly increases the number of parameters, but significantly improves the accuracy of the model, mainly due to the smaller number of convolutions used by CCM and the smaller number of parameters that need to be updated by the introduced generate operation.
The number of parameters introduced by the Dual-Path module and the increase in computation time are both significant, mainly due to the large number of parameters introduced by the CAM and PAM attention modules. However, the introduction of the Dual-Path module and the CCM module significantly improved the accuracy of the model.

5. Discussion

5.1. Analysis of Training Set Size and Image Scale

In order to test the dependence of the method on the data volume of the training set, we fixed the test set and gradually reduced the number of images contained in the training set. Based on this, we conducted training and testing, and the results are shown in Figure 11. In addition, we conducted quantitative experiments and analysis on the impact of the size of the images used on accuracy and divided the size of the images used into 128 × 128, 256 × 256, 512 × 512, and 1024 × 1024 in four sizes.
Since the network is not designed for small sample datasets, the testing accuracy gradually decreases as expected after reducing the number of images in the training set. However, it is worth noting that our method still maintains an accuracy of more than 85% when the training set is reduced to half, and the testing accuracy does not differ significantly when the training set is reduced to 40%. In addition, for different image sizes, when using all the training set data, the impact of changes in image size on accuracy is not significant, but larger images (such as 1024 × 1024) still achieved the highest testing accuracy. This is mainly because the continuity of features in large-scale images is strong, resulting in richer features. Therefore, when GPU resources are relatively abundant, using large-scale images to train and test networks can achieve high accuracy. However, due to the small impact of image scale on the model proposed in this article, when GPU resources are scarce, downsampling or slicing of images can be used to reduce graphics memory overhead. We also conducted a similar experiment on the Vaihingen dataset, and the results are shown in Figure 12.
The experimental results on the Vaihingen dataset are basically consistent with those on the Potsdam dataset, but the difference is that when the training set is reduced by 30% −50%, the test accuracy increases with the reduction of the training set. The main reason may be that when the original large image is clipped to a 1024 × 1024 image, part of the image in the edge region contains a part of black edges. In the process of reducing the training set, this part of the image is exactly eliminated, and some interference is eliminated to some extent, which improves the data quality of the training data and slightly improves the accuracy.
In addition, in order to study the impact of batch size on accuracy, we also changed the batch size when the image size was 128 × 128 , as shown in Figure 13. In Figure 13, 128 n represents the batch size set to n. What is more, we also introduced 1024 × 1024 images for comparison. The experimental results show that increasing the size of the batch size can increase the accuracy, especially when the proportion of the training set is 5–20%. However, it is worth noting that although the batch size is increased to 16, its accuracy cannot exceed 1024 × 1024 images when the training set is 100%. This is mainly because the continuity of features in 1024 × 1024 images is better.

5.2. Class Activation Mapping

In order to further improve the reliability of the method proposed in this paper, this paper also analyzes the interpretability of the proposed network and the prediction results of the network, as shown in Figure 14.
In Figure 14, there are mainly three areas that need to be focused on. These three areas show how the attention mechanism can correct the classification errors of different types of objects.
Area 1: In U-Net and MQANet, some buildings are wrongly classified as background, but in CD-MQANet, the attention mechanism gives this part a greater weight. Thanks to the role of attention mechanism, CD-MQANet classifies this part as buildings.
Area 2: In this part in U-Net and MQANet, the impervious surface and background are wrongly divided into buildings, but the attention mechanism correctly gives a higher weight to the impervious surface class to a certain extent, making CD-MQANet divide the background and impervious surface.
Area 3: Due to the similarity between low vegetation and trees, the U-Net network mistakenly identified low vegetation as trees, but attention to the attention mechanism of trees and low vegetation can be found that in the tree category, attention does not give a weight here, but in the Low Veg category, attention gives a higher weight, so this part is correctly corrected as low vegetation.
To sum up, the quadruple attention mechanism introduced in this paper can better distinguish similar features and correct the misclassified features to a certain extent.

5.3. Analysis of CCM and LAM

In the CCM and LAM modules, some intermediate results are generated, and loss is calculated with the label to constrain the network. In this section, these results will be analyzed. Figure 15 shows the result of the convolution and binarization of the feature map generated by CCM and LAM. Of them, the G-map is generated from the CCM, and the Att-map is generated from the LAM.
It can be seen from the G-map in Figure 15 that the feature map generated by the CCM module conforms to our design expectation, that is, it generates a series of channels. The feature map composed of these channels should highlight some features of the ground object. Therefore, when transformed into a binary image, it should be similar to the label image and the last prediction result image. The feature map generated by the CCM helps the network model segment all kinds of features to a certain extent. The main performance is that the generated binary map initially has the contours of all kinds of features, especially the low vegetation and tree categories. Due to the large gap between its spectral characteristics and other features, its approximate contours are roughly divided. However, because the CCM only extracts shallow and simple features, it is easy to cause the problem that similar features will be divided into the same category. However, LAM is applied to the decoder part of the network. Because the network has carried out deep convolution on the characteristic graph, these problems are less, as shown in the Att-Map in Figure 15.
LAM is a part of the CD-MQANet decoder. When the feature map is transmitted here, the information in it has been deeply extracted. Therefore, the results generated by LAM are also more compatible with the label than the CCM. At the same time, this can be seen in Figure 15, which shows the intermediate result maps of different types of features generated by CCM and LAM. It also more intuitionistically shows that the LAM module uses an additional loss function to introduce label information to constrain the feature map and assist the network model in extracting features.

6. Conclusions

To enhance the accuracy of multi-objective semantic segmentation in remote sensing images, we proposed CD-MQANet. To fully exploit the distinctions in channel information among different features, we introduced the CCM module. CCM aims to establish an adaptive channel dimension augmentation method that combines traditional digital image processing techniques and convolutions. This enhancement enhances the network’s capacity to discover channel dimension features and information. Additionally, we constructed a spectral attention mechanism within CCM, employing global convolution to generate spectral threshold weights. This mechanism enhances valuable spectral information while suppressing irrelevant spectral data.
Furthermore, we designed a Dual-Path Encoder to balance the extraction of channel and spatial information. The Dual-Path Encoder comprises a channel encoder and a spatial encoder. The channel encoder utilizes the channel attention mechanism to further extract channel information from feature maps. The spatial encoder employs dense connections and spatial attention to enhance the network’s ability to utilize multi-scale spatial features, improving the network’s capability to capture spatial information at various scales. This Dual-Path Encoder enhances the network’s ability to extract and utilize information from the different scales and dimensions of feature maps.
Based on these two modules, we constructed CD-MQANet, and experimental results demonstrated its superiority. We used two datasets to verify the model’s accuracy. In the Vaihingen dataset, CD-MQANet outperformed the baseline MQANet by increasing mean F1 and OA by 2.03% and 2.49%, respectively. In the Potsdam dataset, CD-MQANet improved mean F1 and OA by 1.25% and 1.42%, respectively, compared to the baseline MQANet. Extensive experiments showed that CD-MQANet surpassed other methods in terms of evaluation metrics on the Vaihingen and Potsdam datasets. These results highlight the substantial accuracy improvements of the proposed model (CD-MQANet) in both F1 and OA metrics. The CCM and Dual-Path Encoder contribute significantly to the semantic segmentation of remote sensing images. We also generated an attention heatmap and analyzed the role of the attention mechanism in the network. The results demonstrated that the introduced attention mechanism correctly focuses on different terrain objects and to some extent corrects misclassified terrain objects. Finally, we analyzed the intermediate results generated by CCM and LAM, showcasing their interpretability by calculating loss with labels.
However, it should be noted that CD-MQANet, as proposed in this article, is designed for classifying remote sensing images of six types of land objects and may lack universality across datasets. Additionally, the loss function used by CCM is simply determined as cross-entropy. In future research, we plan to explore more effective loss functions.

Author Contributions

Conceptualization, J.Z.; methodology, J.Z. and Y.S.; validation, Z.T. and K.L.; resources, Y.L. and W.D.; writing—original draft preparation, J.Z.; writing—review and editing, Y.L.; supervision, Y.L.; investigation Y.G. and B.Z.; project administration, L.H. and Y.H.; funding acquisition, L.H. All authors have read and agreed to the published version of the manuscript.

Funding

This work was supported by the Key Projects from the Ministry of Science and Technology of China under Grant 2020YFA0608203 and supported by the Sichuan Science and Technology Program under Grant 2023YFS0366, 2021YFS0335, and Grant 2023YFG0020, and supported in part by the Fengyun Satellite Application Advance Plan under Grant FY-APP-2021.0304, and supported by Sichuan Natural Science Foundation Project: 2022NSFSC0207.

Data Availability Statement

The authors would like to thank the team of Potsdam 2-D semantic labeling data and the Vaihingen dataset for the data and experiments.

Acknowledgments

The authors appreciate the reviewers for their constructive comments and kind help to improve the manuscript.

Conflicts of Interest

The authors declare no conflict of interest.

References

  1. Elhag, M.; Psilovikos, A.; Sakellariou-Makrantonaki, M. Land Use Land Cover Changes and its Impacts on Water Resources in Nile Delta Region Using Remote Sensing Techniques. Environ. Dev. Sustain. 2013, 15, 1189–1204. [Google Scholar] [CrossRef]
  2. Zamari, M. A Proposal for a Wildfire Digital Twin Framework through Automatic Extraction of Remotely Sensed Data: The Italian Case Study of the Susa Valley. Master’s Thesis, Politecnico di Torino, Turin, Italy, 2023; 213p. [Google Scholar]
  3. Karamoutsou, L.; Psilovikos, A. Deep Learning in Water Resources Management: The Case Study of Kastoria Lake in Greece. Water 2021, 13, 3364. [Google Scholar] [CrossRef]
  4. Ronneberger, O.; Fischer, P.; Brox, T. U-Net: Convolutional networks for biomedical image segmentation. In International Conference on Medical Image Computing and Computer-Assisted Intervention; Springer: Berlin/Heidelberg, Germany, 2015; pp. 234–241. [Google Scholar]
  5. Badrinarayanan, V.; Handa, A.; Cipolla, R. SegNet: A deep convolutional encoder-decoder architecture for image segmentation. IEEE Trans. Pattern Anal. Mach. Intell. 2015, 39, 2481–2495. [Google Scholar] [CrossRef]
  6. Chen, L.-C.; Papandreou, G.; Kokkinos, I.; Murphy, K.; Yuille, A.L. DeepLab: Semantic image segmentation with deep convolutional nets, atrous convolution, and fully connected CRFs. IEEE Trans. Pattern Anal. Mach. Intell. 2018, 40, 834–848. [Google Scholar] [CrossRef]
  7. Zhou, L.; Zhang, C.; Wu, M. D-LinkNet: LinkNet with Pretrained Encoder and Dilated Convolution for High Resolution Satellite Imagery Road Extraction. In Proceedings of the IEEE Conference on Computer Vision and Pattern Recognition (CVPR) Workshops, Salt Lake City, UT, USA, 18–22 June 2018; pp. 182–186. [Google Scholar]
  8. Liu, F.; Wang, L. UNet-based model for crack detection integrating visual explanations. Constr. Build. Mater. 2022, 322, 126265. [Google Scholar] [CrossRef]
  9. Qiu, W.; Gu, L.; Gao, F.; Jiang, T. Building Extraction from Very High-Resolution Remote Sensing Images Using Refine-UNet. IEEE Geosci. Remote Sens. Lett. 2023, 20, 6002905. [Google Scholar] [CrossRef]
  10. Jiao, L.; Huo, L.; Hu, C.; Tang, P.; Zhang, Z. Refined UNet V4: End-to-End Patch-Wise Network for Cloud and Shadow Segmentation with Bilateral Grid. Remote Sens. 2022, 14, 358. [Google Scholar] [CrossRef]
  11. Zhang, R.; Zhang, Q.; Zhang, G. SDSC-UNet: Dual Skip Connection ViT-Based U-Shaped Model for Building Extraction. IEEE Geosci. Remote Sens. Lett. 2023, 20, 6005005. [Google Scholar] [CrossRef]
  12. Yan, X.; Tang, H.; Sun, S.; Ma, H.; Kong, D.; Xie, X. AFTer-UNet: Axial Fusion Transformer UNet for Medical Image Segmentation. In Proceedings of the 2022 IEEE/CVF Winter Conference on Applications of Computer Vision (WACV), Waikoloa, HI, USA, 3–8 January 2022; pp. 3270–3280. [Google Scholar] [CrossRef]
  13. Fan, C.-M.; Liu, T.-J.; Liu, K.-H. SUNet: Swin Transformer UNet for Image Denoising. In Proceedings of the 2022 IEEE International Symposium on Circuits and Systems (ISCAS), Austin, TX, USA, 28 May–1 June 2022; pp. 2333–2337. [Google Scholar] [CrossRef]
  14. Hu, J.; Shen, L.; Sun, G. Squeeze-and-excitation networks. In Proceedings of the IEEE Conference on Computer Vision and Pattern Recognition, Salt Lake City, UT, USA, 18–22 June 2018; pp. 7132–7141. [Google Scholar]
  15. Zhao, H.; Zhang, Y.; Liu, S.; Shi, J.; Loy, C.C.; Lin, D.; Jia, J. Psanet: Point-wise spatial attention network for scene parsing. In Proceedings of the European Conference on Computer Vision (ECCV), Munich, Germany, 8–14 September 2018; pp. 267–283. [Google Scholar]
  16. Fu, J.; Liu, J.; Tian, H.; Li, Y.; Bao, Y.; Fang, Z.; Lu, H. Dual attention network for scene segmentation. In Proceedings of the IEEE/CVF Conference on Computer Vision and Pattern Recognition, Long Beach, CA, USA, 16–17 June 2019; pp. 3146–3154. [Google Scholar]
  17. Woo, S.; Park, J.; Lee, J.Y.; Kweon, I.S. CBAM: Convolutional Block Attention Module. In Computer Vision—ECCV 2018; Ferrari, V., Hebert, M., Sminchisescu, C., Weiss, Y., Eds.; Lecture Notes in Computer Science; Springer: Cham, Switzerland, 2018; Volume 11211. [Google Scholar]
  18. Wan, J.; Xie, Z.; Xu, Y.; Chen, S.; Qiu, Q. DA-RoadNet: A Dual-Attention Network for Road Extraction from High Resolution Satellite Imagery. IEEE J. Sel. Top. Appl. Earth Obs. Remote Sens. 2021, 14, 6302–6315. [Google Scholar] [CrossRef]
  19. Mou, L.; Zhu, X.X. Learning to Pay Attention on Spectral Domain: A Spectral Attention Module-Based Convolutional Network for Hyperspectral Image Classification. IEEE Trans. Geosci. Remote Sens. 2020, 58, 110–122. [Google Scholar] [CrossRef]
  20. Shi, Y.; Li, J.; Zheng, Y.; Xi, B.; Li, Y. Hyperspectral Target Detection with RoI Feature Transformation and Multiscale Spectral Attention. IEEE Trans. Geosci. Remote Sens. 2021, 59, 5071–5084. [Google Scholar] [CrossRef]
  21. Hang, R.; Li, Z.; Liu, Q.; Ghamisi, P.; Bhattacharyya, S.S. Hyperspectral Image Classification with Attention-Aided CNNs. IEEE Trans. Geosci. Remote Sens. 2021, 59, 2281–2293. [Google Scholar] [CrossRef]
  22. Zhang, X.; Sun, G.; Jia, X.; Wu, L.; Zhang, A.; Ren, J.; Fu, H.; Yao, Y. Spectral–Spatial Self-Attention Networks for Hyperspectral Image Classification. IEEE Trans. Geosci. Remote Sens. 2022, 60, 5512115. [Google Scholar] [CrossRef]
  23. Huang, W.; Zhao, Z.; Sun, L.; Ju, M. Dual-Branch Attention-Assisted CNN for Hyperspectral Image Classification. Remote Sens. 2022, 14, 6158. [Google Scholar] [CrossRef]
  24. Huang, X.; Zhou, Y.; Yang, X.; Zhu, X.; Wang, K. SS-TMNet: Spatial–Spectral Transformer Network with Multi-Scale Convolution for Hyperspectral Image Classification. Remote Sens. 2023, 15, 1206. [Google Scholar] [CrossRef]
  25. Shi, W.; Meng, Q.; Zhang, L.; Zhao, M.; Su, C.; Jancsó, T. DSANet: A Deep Supervision-Based Simple Attention Network for Efficient Semantic Segmentation in Remote Sensing Imagery. Remote Sens. 2022, 14, 5399. [Google Scholar] [CrossRef]
  26. Abadal, S.; Salgueiro, L.; Marcello, J.; Vilaplana, V. A Dual Network for Super-Resolution and Semantic Segmentation of Sentinel-2 Imagery. Remote Sens. 2021, 13, 4547. [Google Scholar] [CrossRef]
  27. Li, Z.; Cui, X.; Wang, L.; Zhang, H.; Zhu, X.; Zhang, Y. Spectral and Spatial Global Context Attention for Hyperspectral Image Classification. Remote Sens. 2021, 13, 771. [Google Scholar] [CrossRef]
  28. Zhang, Y.; Ye, M.; Gan, Y.; Zhang, W. Knowledge based domain adaptation for semantic segmentation. Knowl. Based Syst. 2020, 193, 105444. [Google Scholar] [CrossRef]
  29. Li, Y.; Si, Y.; Tong, Z.; He, L.; Zhang, J.; Luo, S.; Gong, Y. MQANet: Multi-Task Quadruple Attention Network of Multi-Object Semantic Segmentation from Remote Sensing Images. Remote Sens. 2022, 14, 6256. [Google Scholar] [CrossRef]
  30. Wang, D.; Liu, Z.; Gu, X.; Wu, W.; Chen, Y.; Wang, L. Automatic Detection of Pothole Distress in Asphalt Pavement Using Improved Convolutional Neural Networks. Remote Sens. 2022, 14, 3892. [Google Scholar] [CrossRef]
  31. Scott, G.J.; England, M.R.; Starms, W.A.; Marcum, R.A.; Davis, C.H. Training Deep Convolutional Neural Networks for Land–Cover Classification of High-Resolution Imagery. IEEE Geosci. Remote Sens. Lett. 2017, 14, 549–553. [Google Scholar] [CrossRef]
  32. Zhang, H.; Li, Y.; Zhang, Y.; Shen, Q. Spectral-spatial classification of hyperspectral imagery using a dual-channel convolutional neural network. Remote Sens. Lett. 2017, 8, 438–447. [Google Scholar] [CrossRef]
  33. Bazi, Y.; Bashmal, L.; Rahhal, M.M.A.; Dayil, R.A.; Ajlan, N.A. Vision Transformers for Remote Sensing Image Classification. Remote Sens. 2021, 13, 516. [Google Scholar] [CrossRef]
  34. ISPRS. 2D Semantic Labeling Contest—Potsdam. Available online: https://www.isprs.org/education/benchmarks/UrbanSemLab/2d-sem-label-potsdam.aspx (accessed on 4 September 2018).
  35. ISPRS. 2D Semantic Labeling Contest—Vaihingen. Available online: https://www.isprs.org/education/benchmarks/UrbanSemLab/2d-sem-label-vaihingen.aspx (accessed on 4 September 2018).
  36. Liu, Z. Semantic Segmentation of Remote sensing images via combining residuals and multi-scale modules. In Proceedings of the ICMLCA 2021: 2nd International Conference on Machine Learning and Computer Application, Shenyang, China, 17–19 December 2021; pp. 1–4. [Google Scholar]
  37. Chen, L.-C.; Zhu, Y.; Papandreou, G.; Schroff, F.; Adam, H. Encoder-decoder with atrous separable convolution for semantic image segmentation. In Proceedings of the European Conference on Computer Vision (ECCV), Munich, Germany, 8–14 September 2018; pp. 801–818. [Google Scholar]
  38. Chen, L.; Dou, X.; Peng, J.; Li, W.; Sun, B.; Li, H. EFCNet: Ensemble Full Convolutional Network for Semantic Segmentation of High-Resolution Remote Sensing Images. IEEE Geosci. Remote Sens. Lett. 2021, 19, 8011705. [Google Scholar] [CrossRef]
  39. Li, Y.C.; Li, H.C.; Hu, W.S.; Yu, H.L. DSPCANet: Dual-Channel Scale-Aware Segmentation Network with Position and Channel Attentions for High-Resolution Aerial Images. IEEE J. Sel. Top. Appl. Earth Obs. Remote Sens. 2021, 14, 8552–8565. [Google Scholar] [CrossRef]
Figure 1. Architecture of CD-MQANet.
Remotesensing 15 04520 g001
Figure 2. Channel Creator module.
Remotesensing 15 04520 g002
Figure 3. Channel attention module [29].
Remotesensing 15 04520 g003
Figure 4. Spatial block.
Remotesensing 15 04520 g004
Figure 5. Structure of LAM [29].
Remotesensing 15 04520 g005
Figure 6. ISPRS dataset annotation example (upper) Potsdam region (lower) Vaihingen region.
Remotesensing 15 04520 g006
Figure 7. Some examples of the predicted results on Potsdam dataset of different models.
Remotesensing 15 04520 g007
Figure 8. Some examples of the predicted results on Vaihingen dataset of different models.
Remotesensing 15 04520 g008
Figure 9. The parameters and ACC of each network.
Remotesensing 15 04520 g009
Figure 10. The inference time and ACC of each network.
Remotesensing 15 04520 g010
Figure 11. Overall classification accuracies influenced by different training ratios and image scales on Potsdam dataset.
Remotesensing 15 04520 g011
Figure 12. Overall classification accuracies influenced by different training ratios and image scales on Vaihingen dataset.
Remotesensing 15 04520 g012
Figure 13. Overall classification accuracies influenced by different training ratios and batch sizes on Potsdam dataset.
Remotesensing 15 04520 g013
Figure 14. Visualization of attention map.
Remotesensing 15 04520 g014
Figure 15. Intermediate result maps of different types of features generated by CCM and LAM.
Remotesensing 15 04520 g015
Table 1. Hardware and software conditions.
SystemWindows 10
GPUNVIDIA GeForce RTX 3090 Ti
CPUIntel(R) Core (TM) i7-10700 CPU @ 2.90 GHz 2.90 GHz
DL FrameworkPytorch V1.11.0
CompilerPython V3.9.12
OptimizerAdamW
Learning Rate0.002
Batch Size2
Table 2. Experimental results of Potsdam dataset.
MethodPer-Class F1-Scores (%)Mean F1 (%)OA (%)
Imp. Surf.BuildingLow Veg.TreeCar
U-Net87.9191.3181.7682.7288.9186.5285.48
MQANet (baseline) [29]91.3495.4084.8085.6790.7889.3589.05
C-MQANet90.0395.3487.0187.2590.8390.0589.82
D-MQANet92.1195.8785.8184.1290.9790.5790.70
CD-MQANet92.3096.5687.6987.3991.0891.3891.54
Table 3. Experimental results of Vaihingen dataset.
MethodPer-Class F1-Scores (%)Mean F1 (%)OA (%)
Imp. Surf.BuildingLow Veg.TreeCar
U-Net84.4587.3269.7783.1663.1277.5681.27
MQANet (baseline) [29]88.7891.9977.3085.5173.1784.6187.60
C-MQANet88.5291.6381.4286.6373.3385.0187.97
D-MQANet90.1593.4479.8886.1472.6885.3688.14
CD-MQANet90.4592.6881.6786.5973.8685.8689.02
Table 4. Experimental results of different methods.
MethodPotsdam DatasetVaihingen Dataset
Mean F1 (%)OA (%)Mean F1 (%)OA (%)
CBAMNet [17]86.0485.1483.7786.47
Deeplabv3+ [37]88.0187.0683.7785.71
SENet [14]87.9787.6382.8585.26
CRMS [36]89.0288.9283.2586.40
EFCNet [38]80.1781.7781.8785.46
DSPCANet [39]87.1990.1384.4687.32
MQANet89.3589.0584.6187.60
CD-MQANet91.3891.5485.8689.02
Disclaimer/Publisher’s Note: The statements, opinions and data contained in all publications are solely those of the individual author(s) and contributor(s) and not of MDPI and/or the editor(s). MDPI and/or the editor(s) disclaim responsibility for any injury to people or property resulting from any ideas, methods, instructions or products referred to in the content.

