Article

Assessing the Current and Future Potential Distribution of Solanum rostratum Dunal in China Using Multisource Remote Sensing Data and Principal Component Analysis

1
Yinshanbeilu Grassland Eco-Hydrology National Observation and Research Station, China Institute of Water Resources and Hydropower Research, Beijing 100038, China
2
Key Laboratory of Digital Earth Science, Aerospace Information Research Institute, Chinese Academy of Sciences, Beijing 100094, China
3
International Research Center of Big Data for Sustainable Development Goals, Beijing 100094, China
4
Inner Mongolia Eco-Environment Big Data Limited Company, Hohhot 010020, China
5
University of Chinese Academy of Sciences, Beijing 100049, China
*
Author to whom correspondence should be addressed.
These authors contributed equally to this work.
Remote Sens. 2024, 16(2), 271; https://doi.org/10.3390/rs16020271
Submission received: 1 November 2023 / Revised: 7 January 2024 / Accepted: 8 January 2024 / Published: 10 January 2024

Abstract

:
Accurate information concerning the spatial distribution of invasive alien species’ habitats is essential for invasive species prevention and management, and ecological sustainability. Currently, nationwide identification of suitable habitats for the highly destructive and potentially invasive weed, Solanum rostratum Dunal (S. rostratum), poses a series of challenges. Simultaneously, research on potential future invasion areas and likely directions of spread has not received adequate attention. This study, based on species occurrence data and multi-dimensional environmental variables constructed from multi-source remote sensing data, utilized Principal Component Analysis (PCA) in combination with the Maxent model to effectively model the current and future potential habitat distribution of S. rostratum in China, while quantitatively assessing the various factors influencing its distribution. Research findings indicate that the current suitable habitat area of S. rostratum covers 1.3952 million km2, all of which is located in northern China. As the trend of climate warming persists, the potential habitat suitability range of S. rostratum is projected to shift southward and expand in the future; while still predominantly located in northern China, it will have varying degrees of expansion at different time frames. Notably, during the period from 2040 to 2061, under the SSP1-2.6 scenario, the habitat area exhibits the most significant increase, surpassing the current scenario by 19.23%. Furthermore, attribution analysis based on PCA inverse transformation reveals that a combination of soil, climate, spatial, humanistic, and topographic variables collectively influence the suitability of S. rostratum habitats, with soil factors, in particular, playing a dominant role and contributing up to 75.85%. This study identifies target areas for the management and control of S. rostratum, providing valuable insights into factor selection and variable screening methods in species distribution modeling (SDM).

Graphical Abstract

1. Introduction

Species invasion, often referred to as the process by which non-native and non-indigenous organisms proliferate, expand, and establish populations in novel ecological systems [1], represents a phenomenon that can lead to a decline in biodiversity, modifications in ecological niches, disease transmission, and, in extreme instances, disruptions within ecological systems, perturbations in the ecological equilibrium, and significant socioeconomic losses [2,3]. Consequently, it has emerged as a pivotal and pressing challenge within the domains of global ecology, environmental conservation, and resource management [4,5]. One study reveals that 58% of species extinctions are attributable to the incursion of alien species [6]. The escalating trends in international trade and human mobility have notably facilitated the ingress of invasive species into new habitats [7]. Furthermore, climate change has improved the suitability of these novel habitats, significantly expediting the establishment of invasive species populations [8]. With sustained global warming anticipated in the foreseeable future [9], it is projected that by 2050, the number of invasive species on every continent will increase by 36% compared to 2005 levels. While not all of these species exhibit invasive characteristics or cause ecological and economic losses, a proportion still encompasses invasive species, posing substantial potential risks [10]. Consequently, the urgency and necessity of identifying and managing existing invasive species cannot be overstated. Generally, the cost of preventing the entry of alien invasive species is lower than that of managing the aftermath. However, in the event of preventive measures failing, timely detection and accurate evaluation become of paramount importance to minimize adverse impacts on ecosystems.
The identification of invasive species can be broadly categorized into four modalities, with ground surveys representing the most traditional approach [11]. The other three identification methods encompass approaches based on multivariate regression [12] and remote sensing interpretation and recognition [13], as well as the utilization of Species Distribution Models (SDMs) for simulation and prediction [5]. Remote sensing technology, characterized by its remote, non-contact, and non-destructive features, provides an effective means for the large-scale monitoring of invasive species. Particularly noteworthy are the commendable achievements in invasive plant mapping through the utilization of unmanned aerial vehicle (UAV) remote sensing imagery. Anderson et al. [14], employing object-based image analysis and machine learning algorithms, successfully identified Phragmites australis in various wetlands in Minnesota. Dmitriev et al. [15] achieved high-precision identification of invasive species and weeds in agricultural ecosystems using hyperspectral imagery. Jochems et al. [16], leveraging UAV remote sensing imagery and employing the random forest algorithm in machine learning classifiers, produced highly accurate distribution maps for three invasive vegetation types in wetlands. However, invasive species identification based on remote sensing imagery encounters two main challenges: first, it is constrained by the reliance on high spatial resolution remote sensing images, making it difficult to implement applications on a large scale (such as at the national or global level); second, the accurate identification of low-stature invasive plants is hindered by occlusion from forests or other vegetation, resulting in lower precision in remote sensing mapping.
The utilization of species distribution [13] models (SDMs) to simulate and forecast species’ geographical distribution, extent, and dispersal trends, has become a primary approach for studying the mechanisms of species-environment interactions and investigating species conservation and management [17]. The introduction and application of the BIOCLIM model marked the inception of species distribution model development [18]. Subsequently, researchers have explored and applied numerous statistical and rule-based methods, including Generalized Linear Models (GLMs), Mixture Discriminant Analysis (MDA), Generalized Boosting Models (GBMs), Classification and Regression Trees (CARTs), Random Forest (RF), and the Maxent model, among others [19]. Huang et al. [20] conducted a distribution survey of the invasive plant Ageratina adenophora in Guangxi based on GLM. Marmion et al. [21] explored the geographic distribution of 100 butterfly species in Europe using eight modeling techniques. They observed that the predictive accuracy of GLM and MDA is significantly influenced by the geographical attributes of the species. Dittrich et al. [22] employed GLM, GBM, and RF models to predict the probability of the presence of three different beetle species. The results indicated that the Area Under the Curve (AUC) values were consistently higher than 0.7. Dong et al. [23] successfully predicted the potential changes in seagrass habitat under current and future conditions using GBM, RF, and Maxent models. Keyghobadi et al. [24] applied GAM and CART models to estimate the plant species in the Khezri rangelands of the Bayaz plain in southern Khorasan, achieving favorable outcomes. The use of SDMs has become the predominant method in recent years for identifying invasive species. Examples include applications to Asteraceae plants [4], Trioza erytreae [25], Cabomba caroliniana [26], Amaranthus palmeri [27], Cassia tora, and Lantana camara [28], as well as S. rostratum [29]. Based on the application of SDMs in the distribution of the above-mentioned invasive species, researchers have achieved dual objectives: on the one hand, obtaining the potential spatial distribution of species habitats, and on the other hand, understanding the factors influencing the distribution or spread of these species and the extent of their impact. The utilization of these models and methods to understand potentially suitable areas and dispersal pathways of invasive alien species is of paramount significance for maintaining ecosystem security, preventing and managing invasive alien species, and reducing the economic losses resulting from species invasions. The Maximum Entropy model (Maxent) is widely utilized by researchers because it requires only a small quantity of species presence point data to function effectively, has a user-friendly interface, and exhibits high predictive accuracy. Satisfactory achievements have been made in the fields of fauna and flora conservation, particularly concerning endangered species [30,31,32], pest control [33,34,35], and the management of invasive alien species [36,37]. However, issues such as the single type of environmental variables (with most studies solely utilizing bioclimatic and topographic variables), severe collinearity among environmental variables, and overfitting in modeling due to a scarcity of sample points in comparison to the number of variables have had a detrimental impact on modeling outcomes [38]. Species distribution models implicitly assume that geographic data points of species records are independent [39], which clearly violates the fundamental principle of spatial autocorrelation in spatial geography. This, in turn, affects the precision of the model’s predictions. Researchers have recognized that information redundancy caused by variable collinearity and the spatial autocorrelation of sample points can impact the accuracy of predictions. While methods such as Pearson correlation coefficients and Spearman rank correlation coefficients are commonly used to mitigate highly correlated factors from a statistical perspective, this approach does not guarantee the biological interpretability of the selected variables [40]. Furthermore, the determination of correlation thresholds in the actual implementation often varies among individuals and is influenced by a notable degree of randomness. Decisions regarding whether to exclude highly correlated factors entirely or partially involve substantial subjectivity, which may introduce additional uncertainties into SDM results.
Principal Component Analysis (PCA) is a dimension-reduction (DR) technique primarily employed to reduce vast variable sets to a more concise collection, still retaining many details from the original data [41]. In the field of remote sensing, PCA is widely utilized for feature extraction and selection to achieve data dimensionality reduction and removal of information redundancy, representing a classical method [42]. As a non-supervised dimensionality reduction approach, PCA is commonly regarded as an effective preprocessing step in the processing and analysis of hyperspectral remote sensing images [43]. For instance, Uddin et al. [44] employed an enhanced PCA method, extracting top features from hyperspectral remote sensing images, successfully accomplishing high-precision mapping of urban shopping centers in Washington, D.C. In the context of species distribution studies, the challenge of data dimensionality reduction aligns with the application domain of PCA. However, the application of PCA-generated principal components encounters certain difficulties in identifying factors influencing species distribution. Consequently, attempts to employ this method in this field have been relatively limited.
S. rostratum is an annual herbaceous prickly plant in the Solanum genus of the Solanum family and is an invasive alien noxious weed [45]. Typically, its plant height ranges from 30 to 70 cm, and the entire plant is covered with conical, spiny structures, carrying toxic properties. The flowers are yellow, and upon fruit maturation, they automatically split open, causing the seeds to be expelled and scattered in the vicinity. Each fruit contains between 55 and 90 seeds, and a single plant can yield an astounding number of seeds, often exceeding 10,000 [46]. This plant exhibits an astonishing reproductive capacity, characterized by dormant seeds capable of long-distance dispersal. Originally native to North America, it is a highly prolific, invasive, and harmful weed species. It first invaded Liaoning Province in China during the 1980s [47] and has since spread to numerous provinces and municipalities, including Inner Mongolia [48], Xinjiang [29,49], Shanxi [50], Jilin [51], Hebei [52], Tianjin [53], and Beijing [54,55]. S. rostratum typically inhabits environments like riverbanks, roadsides, grasslands, and agricultural fields [46]. Its secretions often exhibit inhibitory effects on the growth of native plants. This species boasts a high reproductive capacity and rapid growth characteristics, displaying predatory behavior as it competes for the essential nutrients required by crops, thereby adversely affecting crop growth. Moreover, S. rostratum serves as an ideal host for certain agricultural pests, such as the Colorado potato beetle (Leptinotarsa decemlineata Say), intensifying the risk of crop damage and resulting in noticeable yield losses. Additionally, the plants and fruit of S. rostratum are thorny and contain toxic substances, making them prone to adhering to livestock and diminishing the quality of their fur [56]. In the cases of livestock ingestion, S. rostratum can cause mild gastrointestinal issues or even lead to severe, fatal consequences. It also poses a certain level of harm to humans, primarily manifesting as skin redness or allergic reactions upon contact. Therefore, S. rostratum has caused significant harm to China’s ecological environment, agriculture, and livestock production, resulting in substantial economic losses [57]. On 1 January 2023, the “List of Key Management of Foreign Invasive Species” officially classified S. rostratum as a major invasive species in agriculture and forestry under Chinese management [56]. Currently, scholars’ focus on S. rostratum is primarily centered around the fields of invasion biology [58,59], reproductive strategies [60], metabolites [61], and control techniques [47,62]. With the continuous advancement of remote sensing technology, the use of unmanned aerial vehicle (UAV) remote sensing data for identifying S. rostratum communities and providing guidance for manual control has become a reality [52,63]. However, due to the relatively small stature of S. rostratum plants, their scattered distribution, and their tendency to coexist with other plant species, combined with the high cost of data collection, achieving large-scale, high-precision remote sensing monitoring remains challenging. While preliminary work has been initiated for predicting the potential distribution of S. rostratum based on species distribution models [51,64,65,66], several issues remain to be addressed. First, the environmental variables used in these studies tend to be relatively simplistic and do not fully account for diversity and complexity, potentially limiting the accuracy of model predictions. Furthermore, the existing methods for addressing collinearity between environmental variables often exhibit significant randomness and even subjectivity, leading to conflicting simulation results across different studies and raising doubts about the reliability of research findings. It is noteworthy that research concerning the future invasion trends of S. rostratum is relatively lacking, making it an area of urgent need of further investigation. Gaining deeper insights into its future spread and ecological impacts will facilitate a better understanding and management of this invasive species.
In summary, to address the challenges in applying species distribution models and simulating the distribution of S. rostratum, there is an urgent need to integrate multiple sources of remote sensing data and data dimensionality reduction techniques. This integration is crucial for accurately predicting the potential suitable habitat of S. rostratum and guiding efforts to control and eradicate this invasive noxious weed. Principal Component Analysis (PCA) excels in eliminating high collinearity among variables to reduce information redundancy [40]. Additionally, the Maxent model is highly regarded for its ability to perform species distribution predictions with only species occurrence data, displaying superior predictive accuracy compared to other models. Due to the challenges posed by attribution difficulties, the application of SDM, combining PCA methods, has not yet been widely adopted. Hence, this study aims to predict the potential habitat of S. rostratum in China using a combination of multiple environmental variables constructed from multi-source remote sensing data, including climate, topography, soil, spatial, and human activities, alongside PCA and the Maxent model. The aims of this study are: (1) to map the current and future potential habitat distribution of S. rostratum in China, (2) to analyze the factors influencing the species distribution of S. rostratum, and (3) to validate the feasibility of PCA in eliminating high collinearity among environmental factors related to species distribution. Our study provides a methodological reference for addressing the issue of high collinearity among environmental variables in species distribution models and offers a scientific foundation for the selection of control and management target areas for this pernicious invasive species within China.

2. Materials and Methods
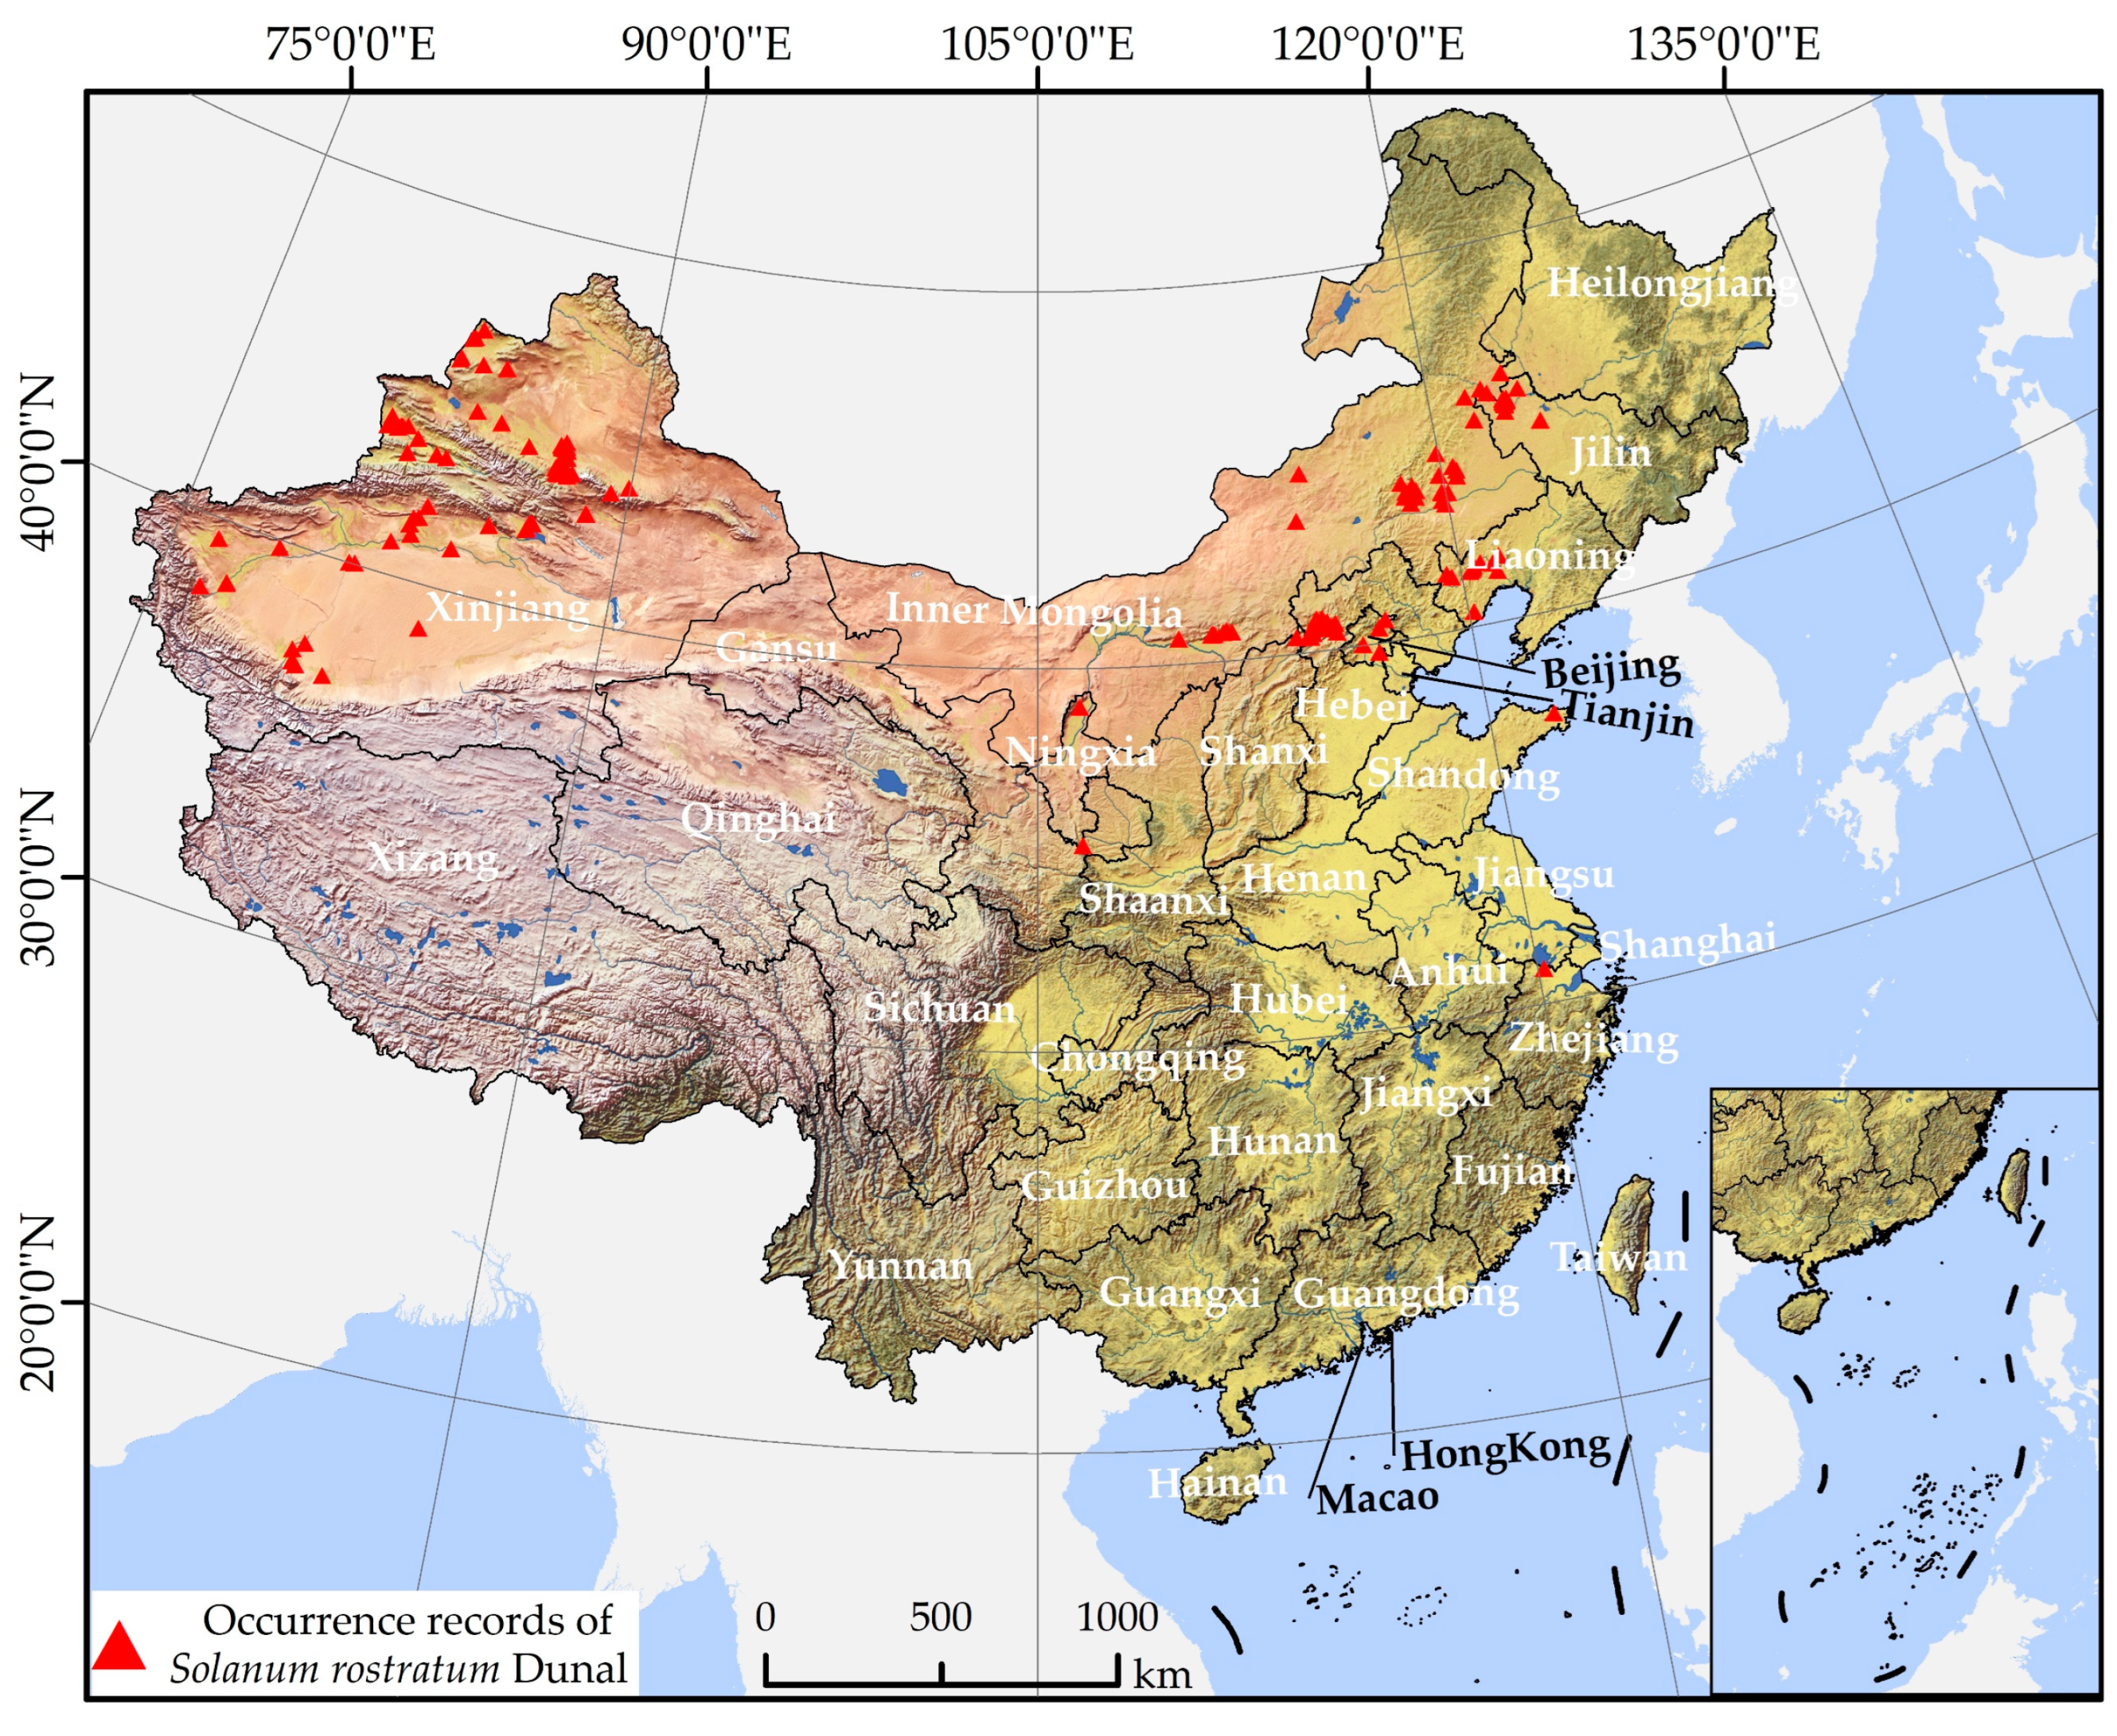
2.1. Presence Data

The presence data of S. rostratum was collated through three distinct methods. First, we aggregated data published in currently available research articles [46,50,51,52,55,58,59,61,67,68,69,70,71,72,73,74,75]. Second, we gathered information from the National Plant Specimen Resource Center [76] and the Global Biodiversity Information Platform (GBIF) [77]. Thirdly, we obtained distribution information about S. rostratum from news reports [78]. For certain locations that provided only place names without latitude and longitude values, we employed the Baidu Coordinate Retrieval System [79] to determine the coordinates. Through these means, we collected a total of 223 occurrence points for S. rostratum. Subsequently, we excluded duplicate sampling sites and records with incomplete information. To mitigate potential estimation bias caused by the clustering of densely sampled points, we utilized ArcGIS 10.5 software to generate a 1 km × 1 km grid that matched the spatial resolution of the environmental dataset. This grid was used to filter the occurrence points, ensuring that the minimum distance between any two points was not less than 1 km. Ultimately, we retained 178 occurrence points for S. rostratum (Figure 1 and Supplementary Table S1) and stored them in a.csv format, compatible with the Maxent 3.4.4 software.

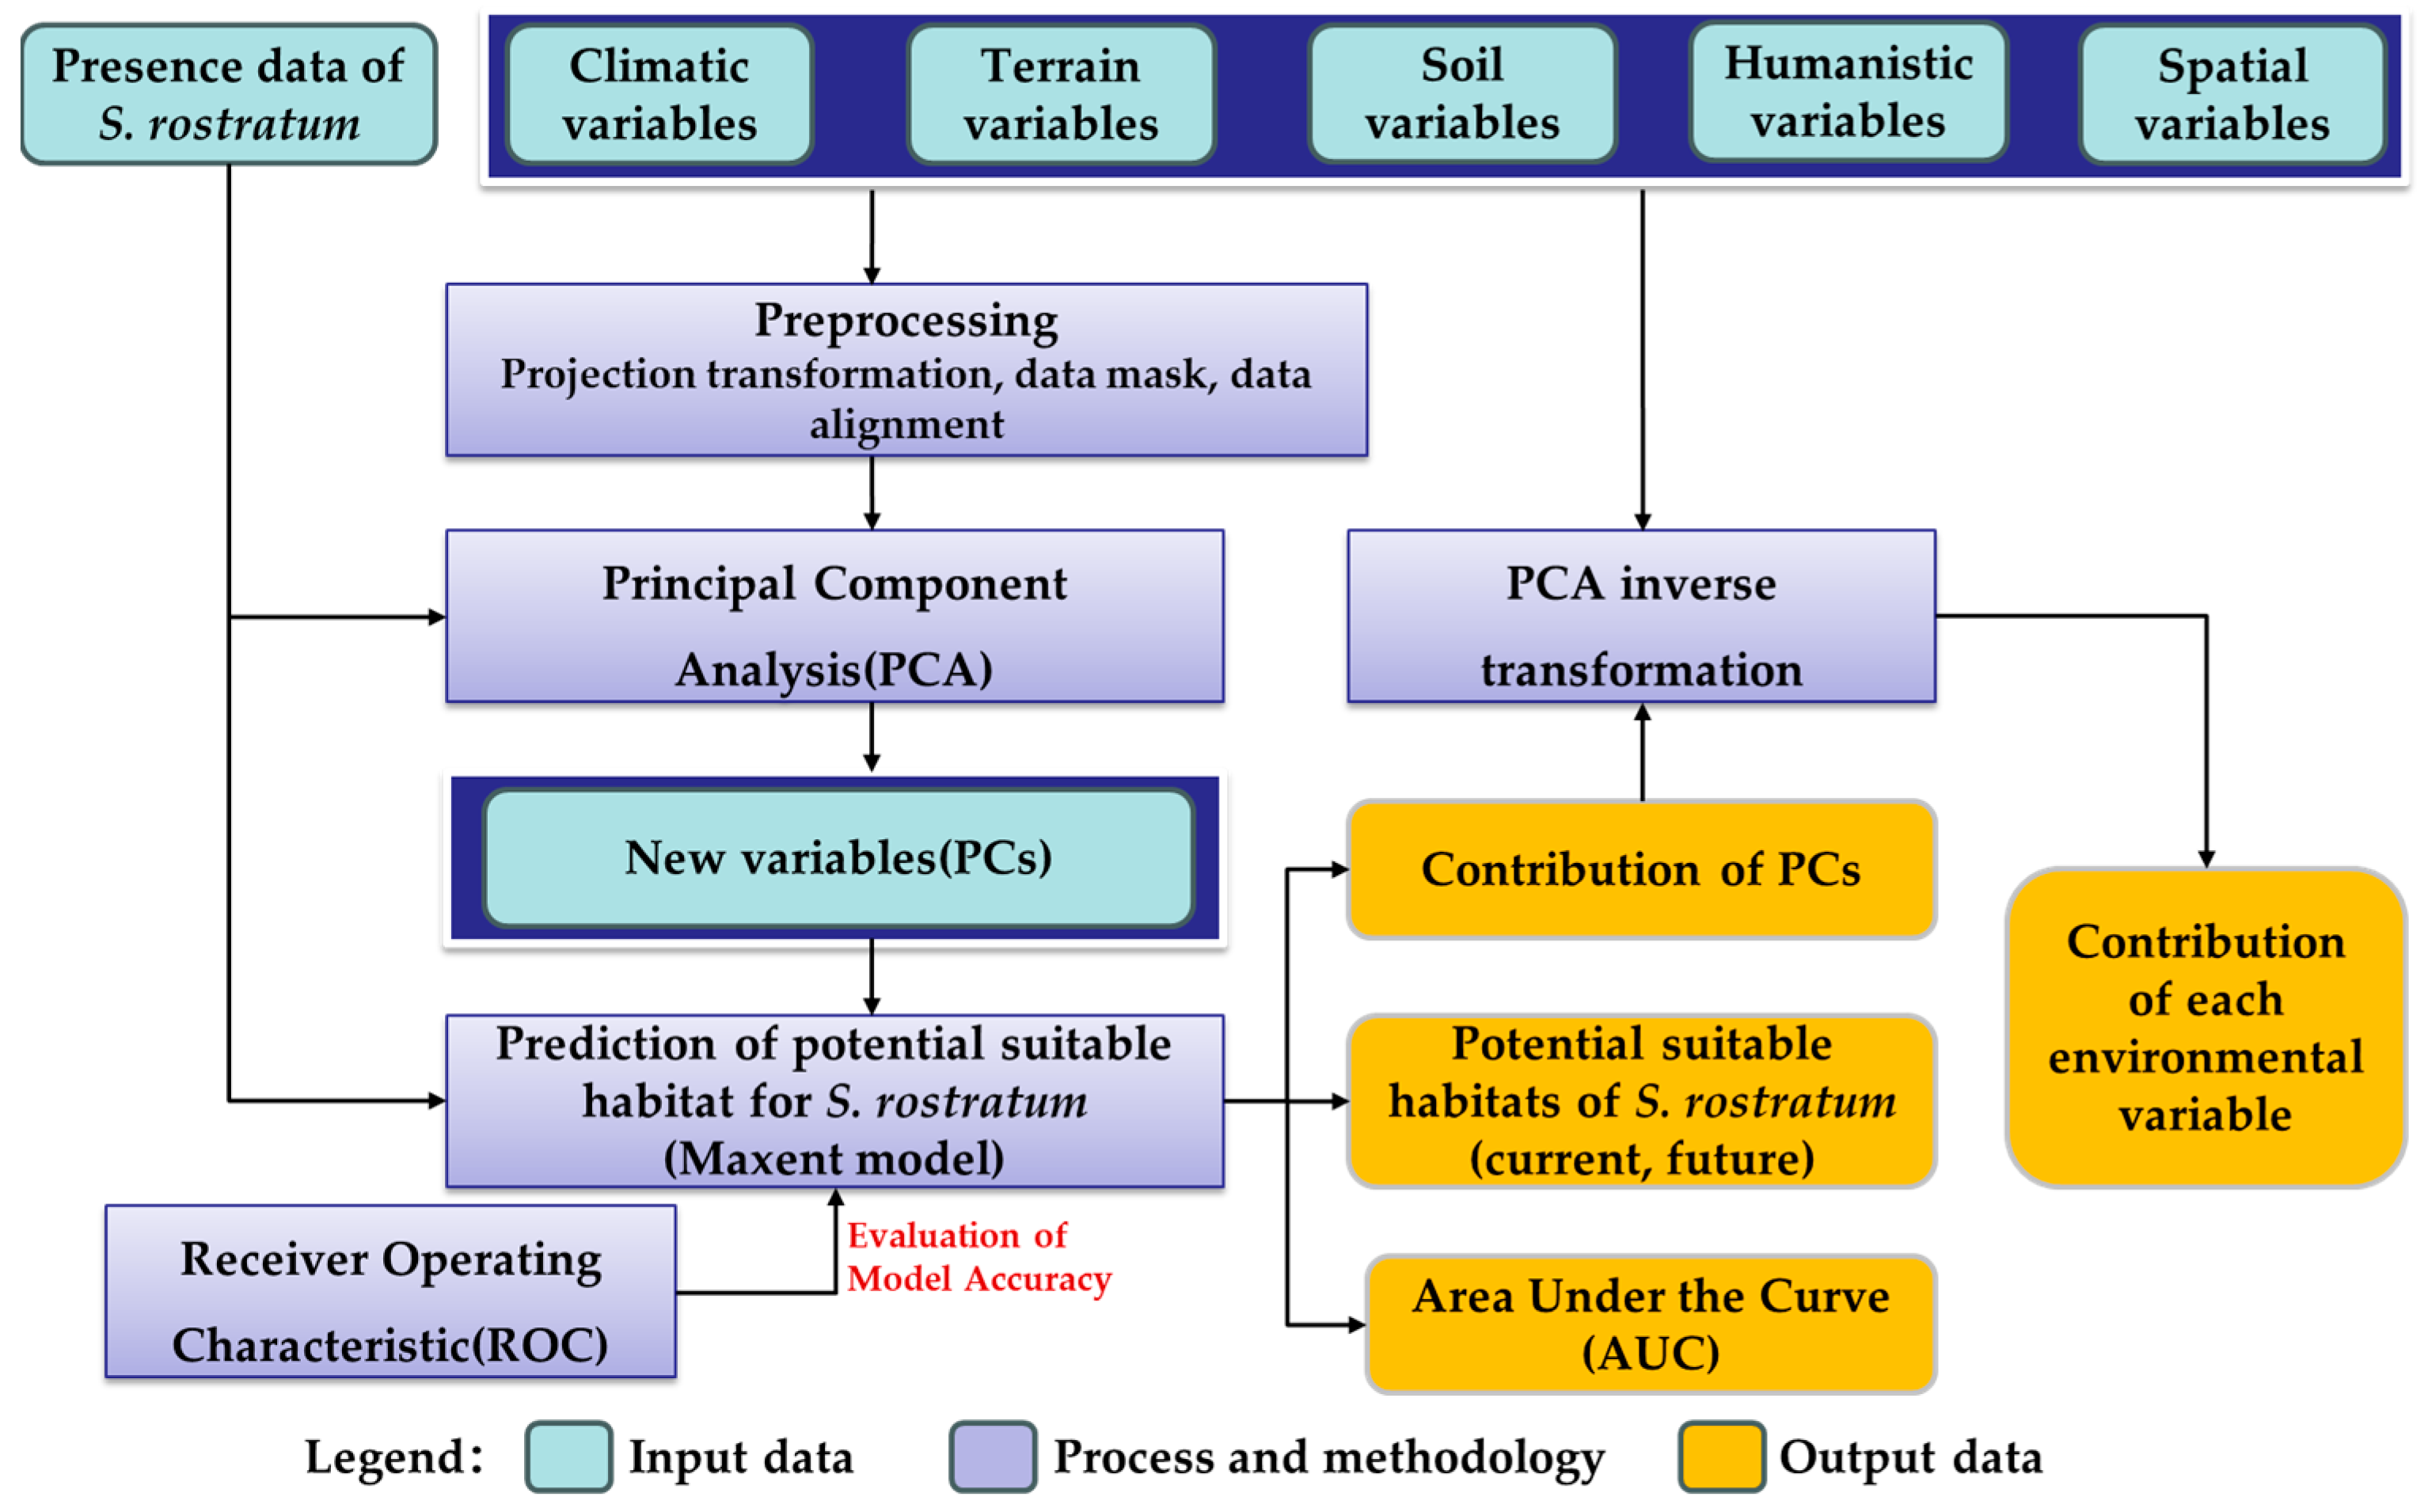
2.2. Environmental Variables
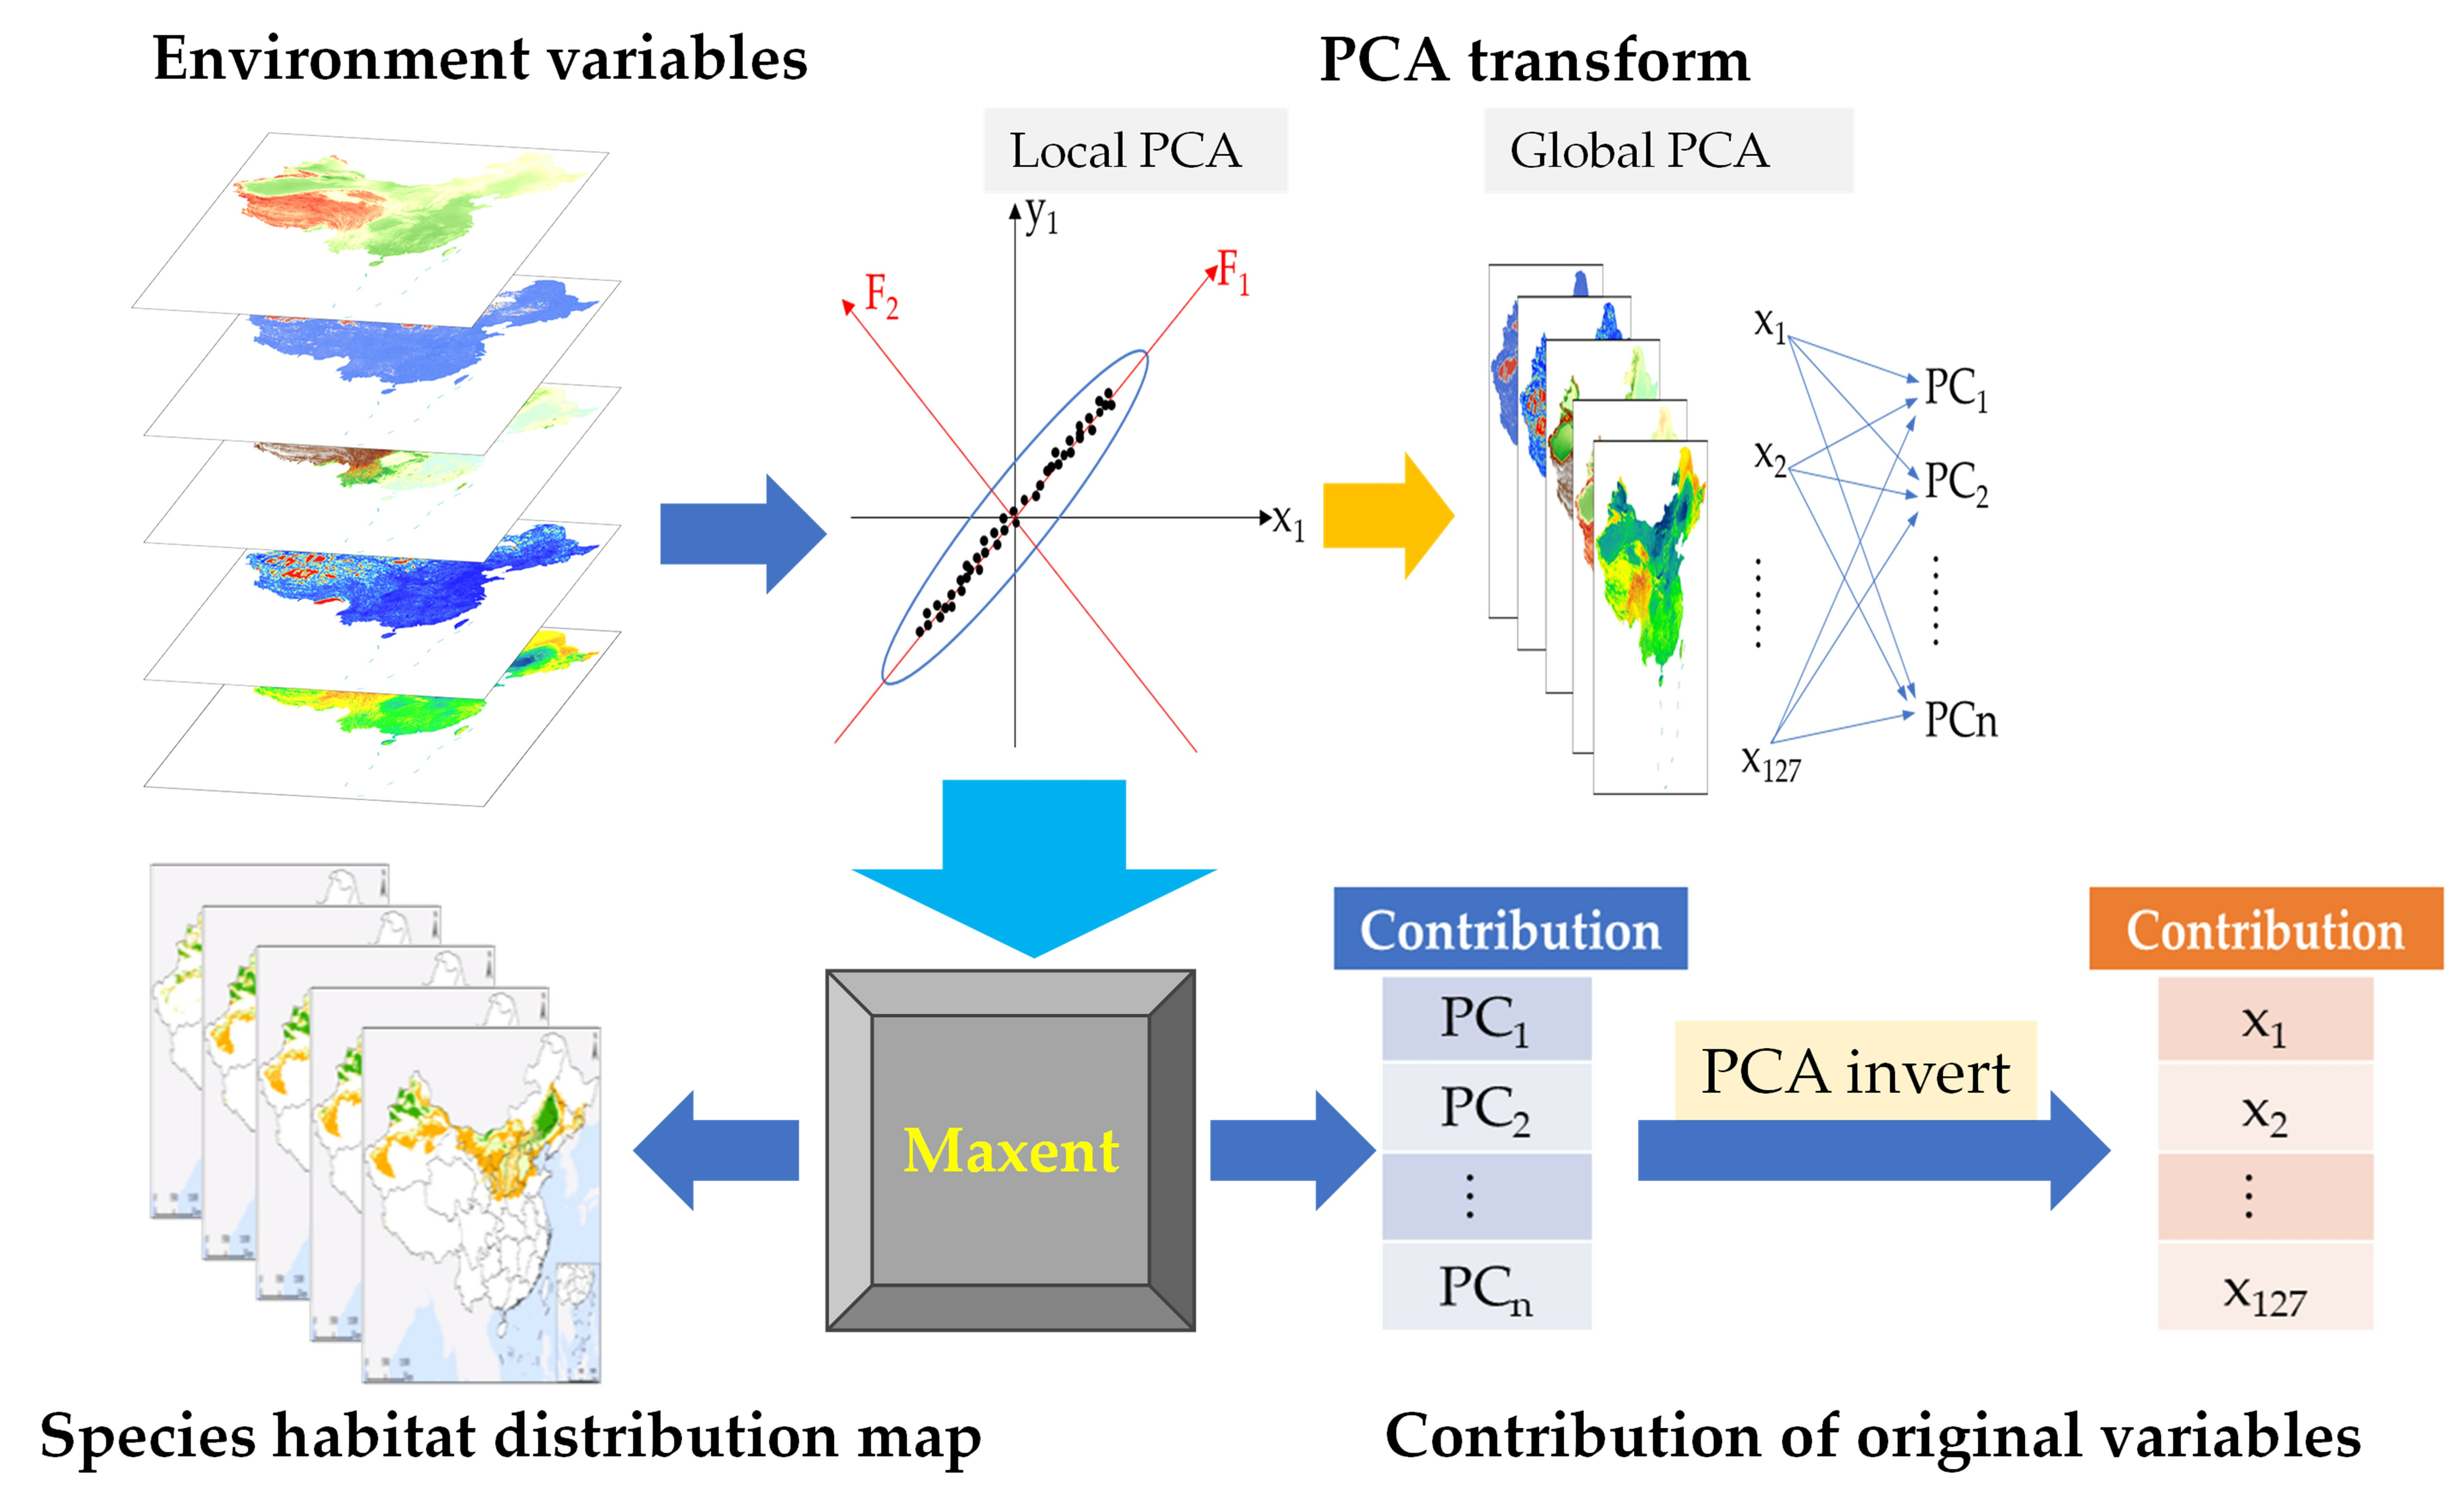
We selected a total of 127 environmental factors (Table 1) classified into five categories for predicting the potential habitat of S. rostratum. The first category encompassed climatic variables consisting of 19 bioclimatic factors, and the data were sourced from the WorldClim database. We conducted SDM for both current and future conditions using modern climate data with a spatial resolution of 30 s. The future climate data were derived from the Shared Socioeconomic Pathways (SSP) provided by the Intergovernmental Panel on Climate Change’s (IPCC) Sixth Assessment Report (AR6) [9]. Specifically, SSP1-2.6 represents a low forcing scenario corresponding to a sustainable development pathway, where radiative forcing stabilizes at 2.6 W/m2 by 2100, and global temperature rise remains stable at approximately 1.8 °C. In contrast, SSP5-8.5 represents a high forcing scenario characterized by the dominance of traditional fossil fuel usage, leading to a global temperature increase of 4.4 °C by 2100, with radiative forcing at 8.5 W/m2. Additionally, we employed the GISS-E2-1-G climate model, the latest iteration of the National Aeronautics and Space Administration (NASA) Goddard Institute for Space Studies (GISS) climate model, specifically designed for integration into the CMIP6 project. We selected two time periods (2021–2040 and 2041–2060) and considered two scenarios, a low forcing scenario (SSP1-2.6) and a high forcing scenario (SSP5-8.5).
The second category of environmental factors comprised terrain variables, including elevation, slope, and aspect, with data sourced from the WorldClim database. Slope and aspect data were generated using ArcGIS 10.5 software based on digital elevation models (DEMs).
The third category consisted of soil variables, comprising a total of 98 factors, such as soil organic carbon at different depths, pH, total nitrogen, total phosphorus, total potassium, cation exchange capacity, coarse fragment content (>2 mm), sand content, silt content, clay content, and bulk density. These datasets were obtained from the Basic Soil Property Dataset of High-Resolution China Soil Information Grids (2010–2018) provided by the National Tibetan Plateau Data Center.
The fourth category of environmental factors encompasses humanistic variables, including Gross Domestic Product (GDP) grid data, population distribution grid data, distances to roads and water bodies, and a building density map, totaling five factors. The GDP and population grid represents the GDP and population within 1 km2. Data on distances to roads and water bodies were based on vector data from OpenStreetMap which includes rivers and lakes. We used the Euclidean Distance tool in ArcGIS 10.5 software to generate 1 km spatial resolution distance grid data. Building density data are based on a 10 m spatial resolution World Settlement Footprint (WSF) dataset and were processed using a Gaussian kernel density function to produce a residential area density map.
The fifth category of environmental factors comprises spatial variables, which include two factors: the values of longitude and latitude. These factors are used to describe the distribution characteristics of the species in the longitudinal and latitudinal directions.
All the aforementioned environmental variables were resampled to a spatial resolution of 1 km, standardized to the GCS_WGS1984 projection, and converted to the ASCII format compatible with Maxent. The names and descriptions of all the environment variables can be found in Supplementary Table S2.

2.3. Methodology

This study commenced by utilizing presence data for S. rostratum and integrating diverse remote sensing data sources, including meteorological, topographical, and soil data, to construct a multidimensional environmental variable dataset. Employing Principal Component Analysis (PCA) in conjunction with the Maxent model, we simulated the current and future potential distribution of S. rostratum in China. Subsequently, model accuracy was assessed through Receiver Operating Characteristic (ROC) curves. Finally, the contribution of each environmental variable to the species’ habitat distribution was evaluated using the contribution rates of Principal Components (PCs) derived from the PCA inverse transformation method combined with the output of the Maxent model. The specific process is illustrated in Figure 2.

2.3.1. Principal Component Analysis

Principal Component Analysis (PCA) is a technique employed for the analysis and simplification of datasets, commonly used for dimensionality reduction. Given the limited number of sample records for species presence and the potential high correlation, information overlap, and data redundancy among input environmental factors, this could lead to model overfitting [80], raising concerns about the credibility of the simulation results.
(1) Environmental Factors Selection Based on PCA
In this study, we applied the PCA method to integrate all environmental variables, creating a set of as few as possible and mutually independent new variables known as Principal Components (PCs). These new variables efficiently retain the information from the original data and were used for modeling the potential distribution of S. rostratum. The PCA-based environmental factors selection process consisted of three primary steps:
1) Normalize the sample matrix: We constructed a matrix, denoted as X , comprising species occurrence records of 177 (represented as n) and environmental variables (represented as m), resulting in an n × m matrix (Equation (1)). We normalized the matrix X and generated a new sample matrix X N , using Equation (2).
2) To obtain the feature vector V and eigenvalues λ , we first calculated the covariance (Equation (3)) of the sample matrix X N , and subsequently performed eigenvalue decomposition based on this (Equation (4)).
3) Dimensionality reduction in the global sample data: First, each environmental variable data (denoted as m) is unfolded pixel by pixel (denoted as p), forming a matrix S g l o b l a with p × m. This matrix is then subjected to normalization (Equation (5)) to generate a new sample matrix N g l o b l a . Subsequently, by performing the inverse operation on the feature vectors V and multiplying them by the globally normalized sample matrix, we obtain the projection of the global samples on the feature vectors (Equation (5)). Finally, based on the threshold of cumulative variance explained (Equation (6)), we select the Principal Components (PCs) to retain, achieving the dimensionality reduction in global samples. To ensure that the rotation axis and new coordinate origin during the dimensionality reduction in global samples remain consistent with local sample data, we continue to employ the mean and standard deviation of the local sample data when normalizing the entire sample set.
This study used a threshold of cumulative variance explanation rate ≥90% to determine the number of PCs to be retained. The number of new variables obtained under different simulation scenarios is summarized in Table 2. All new variables were converted into ASCII format, compatible with Maxent 3.4.4 software.
X = x 11 x 1 m x n 1 x n m
X N = S X m e a n X s t d X
R = k = 1 n x k i x ¯ i x k j x ¯ j k = 1 n x k i x ¯ i 2 k = 1 n x k j x ¯ j 2
λ , V = E i g R
N g l o b l a = S g l o b l a m e a n X s t d X
P C s = V 1 × N g l o b l a
V c = k = 1 n λ k k = 1 m λ k  
where X is the sample matrix n is the row of the matrix, the number of samples; m is the column of the matrix, the number of environmental variables; X N is the new matrix generated by normalizing the sample matrix X ; R is the covariance matrix of X N ; E i g R represents the eigenvalue decomposition operation; λ represents the eigenvalues obtained through eigenvalue decomposition; V signifies the eigenvectors obtained through eigenvalue decomposition; V c denotes the cumulative variance explained; N g l o b l a is the new matrix generated by normalizing the global sample matrix, where each element represents a sample point of all environmental variable grids; P C s refer to the global principal components selected based on the threshold of cumulative variance explained; V 1 corresponds to the inverse operation on eigenvectors.
Due to the absence of data on soil and human activity factors in future scenarios, to ensure the comparability of predictions for the potential habitat suitability of S. rostratum under current and future climate scenarios, we employed environmental variables of the same type as those in future climate models to simulate the potential habitat of S. rostratum under current climate conditions. Specifically, we conducted two types of distribution predictions: one based on comprehensive environmental variables (referred to as “current 1”) and the other based on environmental variables of the same type as those in the future climate models (referred to as “current 2”). In the end, for the climate model “current 1,” following PCA screening, we obtained 11 PCs for environmental variable input into the model, while for “current 2” and the future climate models, we consistently selected 4 PCs.
(2) Calculation of Factor Contributions Based on PCA Inverse Transformation
The application of PCA aids in data dimensionality reduction and the removal of inter-factor correlations, but it also diminishes the interpretability of the original variables concerning the outcomes [81]. However, in species distribution prediction studies, it is crucial to understand which environmental factors influence species distribution to take relevant actions for species conservation or control. To address this issue, the current study employed PCA inverse transformation to calculate the mapping of each principal component onto the original environmental variables, thereby revealing the weight impacts of each original environmental factor on species distribution.
The Maxent model has the capability to calculate the contribution of each Principal Component (PC) to species distribution. Subsequently, based on the contributions of each PC generated by the Maxent model, we employed the PCA inverse transformation method (Equation (8)) to obtain the weights (i.e., projections) of each original environmental variable on the various PCs. Since each PC has a distinct direction, the weights of environmental variables on these PCs may be either positive or negative, representing their directional influence. However, by taking the absolute values of these weights, we were able to compare their relative magnitudes, thus determining the contribution of each environmental variable.
C i = V × W
where C i is the contribution of each environmental variable; W is the contribution matrix of each PC to species distribution calculated by the Maxent model.
(3) K-means clustering
Due to multicollinearity among environmental factors, it is challenging to accurately reflect their actual impacts on species distribution solely based on the individual contributions of each factor. This situation may lead to incorrect attributions. Therefore, we also need to conduct cluster analysis based on the weights (including directional information), contributions, and category characteristics of each factor obtained through PCA inverse transformation. This analysis allows us to identify clusters of variables, where the factors within each cluster share similar characteristics, have consistent weight directions, and exhibit similar contributions.
K-means clustering stands as an iterative algorithm widely employed in cluster analysis. Its foundational principle involves partitioning a dataset into a pre-specified number, K, of distinct groups, iteratively refining the similarity of data within each group while concurrently minimizing dissimilarity between different groups [82]. Essentially, this method utilizes the mean values of clustered objects to generate clusters [83]. In this study, we selected K contribution ratio data as the initial cluster centers. Subsequently, we computed the distance between each contribution ratio and these cluster centers, assigning each contribution ratio to the group represented by its nearest cluster center. Following this, we recalculated the average value for each group, utilizing it as the new cluster center. This iterative process continues until the specified termination condition is met. Through this methodology, we can comprehensively, holistically, and effectively identify factors influencing species distribution in our research.
We conducted PCA analysis and data processing using Python (version 3.7.4). For factor attribution cluster analysis of environmental variables, we employed the K-Means method available in the Scientific Platform Serving for Statistics Professional (SPSSPRO) software (version 1.0).

2.3.2. Maxent Model

Maxent is a machine learning model based on the maximum entropy principle. What sets it apart is its unique ability to predict species habitat suitability above a certain threshold using only species presence data and a set of environmental variables as input [84,85], thereby enabling the forecasting of species distribution [86]. One of the model’s significant characteristics is its independence from the need for actual absence records, meaning it does not rely on data when a species is known not to exist. Instead, it achieves highly accurate simulation results using a minimal amount of known species presence records as samples [87]. In this study, we employed the Maxent 3.4.4 model to simulate the potential distribution of S. rostratum in China under current and future scenarios. The training data consisted of 75% of presence points, with the remaining 25% designated for testing. We conducted 10 repetitions of predictions using cross-validation, averaging the results for the final outcome, which was then saved in ASCII format. The representation of probabilities in the output grids followed the logistic model, presenting values on a scale from 0 to 1, with values closer to 1 indicating higher habitat suitability. The potential suitable habitats of S. rostratum were classified into four suitability categories: Unsuitable habitat (0–0.2), low suitable habitat (0.2–0.4), high suitable habitat (0.4–0.6), and optimal suitable habitat (0.6–1.0) [80]. Finally, the reclassification of model predictions and data analysis were performed using ArcGIS 10.5 software.

2.3.3. Evaluation of Model Accuracy

We employed Receiver Operating Characteristic (ROC) curves and Area Under the Curve (AUC) values to assess the accuracy of the Maxent model’s predictions. The AUC value represents the area under the ROC curve, ranging from 0 to 1. The magnitude of the AUC value reflects the model’s accuracy and predictive performance. A larger AUC value indicates more precise model simulations, with values closer to 1 signifying better predictive performance. Model performance is categorized based on AUC values into the following levels: random prediction (AUC = 0.5), poor (0.5 < AUC ≤ 0.6), fair (0.6 < AUC ≤ 0.7), moderate (0.7 < AUC ≤ 0.8), good (0.8 < AUC ≤ 0.9), and excellent (0.9 < AUC ≤ 1.0) [85]. These metrics are used to evaluate the predictive accuracy of the Maxent model.

2.3.4. Spatial Geometric Center Analysis

The centroid, representing the geometric center in geographical features, provides insight into spatial migration characteristics through the analysis of its spatial variations [88]. The centroid is determined by creating an approximate geometric ellipse for a geographical feature, and the computation of this ellipse’s center (i.e., the intersection of the major and minor axes) defines the centroid or spatial geometric center of the geographical feature. We employed this methodology to investigate the potential spatial migration patterns of S. rostratum habitats in the future, offering valuable insights for controlling its spread. In this study, the spatial geometric centers of potential suitable habitats for S. rostratum were computed using the regional geographic statistical tools in ArcGIS 10.5 software under various simulated scenarios.

3. Results

3.1. Model Accuracy

We employed the Maxent model to simulate the potential suitable habitats of S. rostratum using a total of six datasets, comprising two sets of current climatic conditions and four sets of future climate scenarios. Accuracy assessment based on the ROC method revealed that all six simulated datasets achieved AUC values exceeding 0.900, reaching an excellent level of performance. Notably, under the current 1 climate scenario (incorporating 127 environmental variables), the simulation accuracy was outstanding, with a mean AUC of 0.941 (Figure 3). The training AUC reached 0.950, and the test AUC reached 0.980. These results underscore the high reliability of using this set of environmental variables for predicting the geographical distribution of S. rostratum in China. Furthermore, the simulation outcomes for current 2 and future climate scenarios also exhibited satisfactory accuracy, with AUC values ranging from 0.915 to 0.925. In particular, the AUC value for the current 2 scenario was notably high at 0.925, and the AUC values for the four future climate scenarios were relatively similar.

3.2. The Spatial and Temporal Dynamics of Potential Habitats of S. rostratum

3.2.1. Current Climate Scenarios

To ensure comparability between the potential distribution of S. rostratum under current and future climate scenarios, given the absence of data on soil factors and humanistic factors in future scenarios, we employed environmental variables of the same type as the future climate models to predict the habitat distribution of S. rostratum under the current climate scenario (current 2). Additionally, we conducted a distribution prediction using comprehensive environmental variables, referred to as current 1. This approach yielded two sets of simulated results for the potential suitable habitat of S. rostratum under current conditions.
The simulation results of the Maxent model indicate that under the current climatic scenarios, the total potential habitat area for S. rostratum in China is 1.3952 million km2 for current 1 and 2.9920 million km2 for current 2. These areas represent 14.53% and 30.44% of the total land area in China, respectively. The difference in the extent of these two suitable habitat areas is substantial, with current 2 being 2.1 times larger, and the reasons for this difference will be discussed in detail in the discussion sections. Notably, both suitable habitat areas are situated in northern China. current 1 is specifically designed for static analysis of the current distribution of S. rostratum in China, while current 2 is employed to examine the spatiotemporal dynamics of S. rostratum and compare it with future climatic scenarios.
As shown in Figure 4 and Figure 5a, under the current 1 scenario, the optimal suitable habitat for S. rostratum constitutes 15.01% of the total suitable area. This habitat is most extensive and concentrated in Xinjiang, covering an area of 98,774 km2, which accounts for 47.17% of the national total. The suitable habitat is primarily located on the northern slopes of the Tianshan Mountains, in the Ili River Valley, and along the northwestern edge of the Tarim Basin. In comparison to other provinces, there is also relatively concentrated distribution in the border regions of three provinces: Shaanxi, Hebei, and Inner Mongolia, as well as the northwestern areas of Liaoning bordering Inner Mongolia and the northwestern regions of Jilin. The high suitable habitat constitutes 26.06% of the total suitable area, predominantly surrounding the optimal suitable habitat, with a relatively dispersed distribution. Inner Mongolia and Xinjiang encompass the largest areas of high suitable habitat, with 126,041 km2 and 112,057 km2, respectively. The low suitable habitat represents pioneer areas for species dispersion, and it exhibits the most extensive distribution, encompassing 58.93% of the total suitable area. It is primarily found in Xinjiang and in the border regions of provinces adjacent to Inner Mongolia, including Shaanxi, Shanxi, Hebei, Liaoning, Jilin, and Heilongjiang. In Inner Mongolia and Xinjiang, the total area covered by low suitable habitat reaches 452,141 km2, accounting for 54.87% of the total suitable habitat area nationwide.
Under the current 2 scenario, the potential suitable habitat for S. rostratum is notably more extensive, covering 18.07% of the total suitable area. Xinjiang and Inner Mongolia are the provinces with the most widespread optimal suitable habitat, together accounting for 73.83% of the national area within this category. Liaoning, Jilin, and Hebei provinces each have distribution areas exceeding 10,000 km2, measuring 67,497 km2, 36,206 km2, and 22,993 km2, respectively. The region at the junction of Inner Mongolia, Jilin, and Liaoning provinces forms the largest concentration of “optimal suitable habitat,” while the second-largest concentration is located in Xinjiang’s Ili River Valley and the narrow strip on the northern slope of the Tianshan Mountains, extending northwards to the Tacheng Region in the west. Several other smaller concentrated areas can be observed in detail in Figure 5b. The total area of high suitable habitat is 0.7883 million km2, accounting for 26.98% of the overall suitable area. It is predominantly distributed in Inner Mongolia (0.1998 million km2) and Xinjiang (0.3565 million km2), collectively covering 70.61% of similar areas nationwide. Xinjiang’s Gurbantünggüt Desert stands as the largest concentration area, followed by the nearly continuous oasis region surrounding the Taklamakan Desert. In other provinces, the distribution is relatively scattered. The low suitable habitat boasts the largest area and a widespread distribution, covering 54.95% of the total suitable area. In the northeast, it has already spread to Heilongjiang Province, covering almost all oasis regions in the northwest. In Inner Mongolia, nearly every city except for the colder climate of Hulunbuir City has areas of this habitat. Consequently, under current environmental conditions, S. rostratum demonstrates exceptional adaptability, warranting our attention. We need to closely monitor the potential expansion of the areas where this invasive species might cause unforeseen harm and take preventive measures in advance.
As a result of utilizing different sets of environmental variables in the construction of the models for current 1 and current 2, noticeable disparities exist in the simulation outcomes. As demonstrated in Figure 6, a significant distinction in the suitable habitat of S. rostratum under the current climate scenarios (current 1 and current 2) is apparent, with an area difference of 1.9809 million km2. Current 2 incorporates environmental variables mainly related to climate, topography, and spatial factors. In comparison to current 1, it provides more relaxed constraints, resulting in broader coverage of suitable habitat (depicted as “increased areas” in Figure 6), with a total area of 1.7507 million km2. It is worth noting that the majority of these expanded areas are distributed within desert regions, including the Taklamakan Desert in southern Xinjiang, the Gurbantünggüt Desert in northern Xinjiang, the Kumtag Desert in eastern Xinjiang, the Badain Jaran Desert, the Ulan Buh Desert, and the Kubuqi Desert in northern Inner Mongolia. Although these regions might possess potential conditions conducive to the growth of S. rostratum in terms of climate and topography, suitability for S. rostratum also depends on soil and moisture conditions. Consequently, not all these areas are necessarily suitable for this species. Conversely, regions identified as suitable for habitat by current 1 but deemed unsuitable by current 2 (referred to as “reduced areas” in Figure 6) are relatively limited in number, primarily located in Gansu and Inner Mongolia, covering smaller areas in other provinces. it is notable that Xilinhot City and Hulun Buir City in Inner Mongolia, Gansu Province, and Shandong Province are not included in the suitable habitat prediction range of current 2. These areas are highly likely to have already experienced S. rostratum invasion or present a significant risk of invasion. Particular attention should be directed toward Shandong Province, which boasts abundant port resources and has records of S. rostratum presence in the port city of Weihai. Furthermore, the prediction results of our current 1 model also indicate extensive potential suitable habitat in Shandong Province, emphasizing the elevated risk in this region. Hence, we strongly recommend that relevant authorities proactively conduct on-site investigations and enhance quarantine measures against alien invasive species in ports to eradicate S. rostratum before it spreads extensively, thus averting more extensive harm and economic losses.

3.2.2. Future Climate Scenarios

The potential suitable habitat area of S. rostratum is projected to increase in the future. However, the extent of this expansion varies across different time periods, as illustrated in Figure 4 and Figure 5. In the future 1 scenarios under SSP1-2.6 and SSP5-8.5, the suitable habitat areas for S. rostratum cover 3.1971 million km2 and 3.3138 million km2, respectively. This represents a 9.41% and 13.41% increase compared to current 2. In the future 2 scenarios under SSP1-2.6 and SSP5-8.5, the habitat areas extend to 3.4839 million km2 and 3.3424 million km2, respectively, indicating an additional 19.23% and 14.39% compared to current 2. Notably, the future 2 scenario under SSP1-2.6 is most conducive to the growth of S. rostratum, featuring the largest total suitable habitat area and the widest distribution range. For example, in Gansu province, the low suitable habitat area reaches its maximum in the future 2 scenario under SSP1-2.6, with a 3.35-fold increase compared to current 2. In Inner Mongolia, the area of high suitable habitat reaches its peak during this period, exhibiting a 1.88-fold increase compared to current 2 and covering an area of 0.3756 million km2.

3.2.3. Temporal and Spatial Dissemination Trends

Spatial geometric center analysis (Figure 7) indicates a distinct trend of southward extension and northward expansion in the potential habitat of S. rostratum from the current period to 2060. Specifically, both low suitable habitat and high suitable habitat exhibit a southward migration, with the former shifting southwestward and the latter moving southeastward. In contrast, the optimal suitable habitat demonstrates an expansion toward the northeast. For instance, as depicted in Figure 5b,f, during the current periods (current 1 and current 2), the uninvaded province of Henan, under the SSP5-8.5 scenario for future 2, witnesses a significant southward expansion of the concentrated area of low suitable habitat, extending approximately 300 km southward to the northern vicinity of Xuchang city. Additionally, in Gansu and Inner Mongolia, a notable northeast-to-southwest migration pattern is observed in low suitable habitat. Furthermore, the concentrated distribution area of high suitable habitat in Hebei province has shifted more than 350 km to the south.
The migratory trend observed in the distribution of S. rostratum within its suitable habitat range indicates an expansion of its growth range. It is no longer confined solely to northern regions of China but exhibits a significantly enhanced potential for dispersal into southern regions, particularly those with more favorable climatic conditions. Simultaneously, the northward shift of its optimal suitable habitat reflects the successful adaptation and consolidation of its presence in the existing northern distribution areas, especially in regions characterized by lower temperatures and relatively impoverished soils. Taken together, these observations raise concerns about the future development of S. rostratum. In environments characterized by limited moisture, suboptimal temperature conditions, and nutrient-poor soils, S. rostratum demonstrates rapid and extensive reproductive capabilities. Therefore, in relatively favorable habitats in southern China, its adaptability and rate of expansion may be more pronounced and rapid. This underscores the need for stricter risk mitigation measures to alleviate potential risks.

3.3. Factors Influencing the Suitable Habitat of S. rostratum

Based on the simulation results from current 1, we assessed the contribution of each environmental variable to the potential habitat suitability of S. rostratum. Employing the K-Means clustering method, we identified 11 variable clusters (designated as C1–C11 in Table 3), which collectively encompassed 91 distinct environmental factors. The combined contribution of these variable clusters amounted to 91.21%. Specifically, soil variables exhibited the most substantial contribution to habitat suitability, contributing a noteworthy 75.85%. Following closely were climatic variables, accumulating a total contribution of 10.98%. The remaining variable categories, in descending order of contribution, included spatial variables (2.05%), human-related variables (1.27%), and topographical variables (1.06%). It is essential to emphasize that the ranking of these variable clusters takes into account not only the overall contribution rate of the cluster but also the integrated contribution rates of individual variables within each cluster. Consequently, certain clusters with lower contribution rates may be assigned higher rankings due to the significant contributions made by specific variables within those clusters. For instance, specific variables within clusters such as C3, C4, and C7 exhibited notably high contribution rates. The top three variable clusters collectively contributed 60.77%, with soil variables dominating these rankings. Climatic variables occupied the fourth and fifth positions, while spatial, humanistic variables and topographic variables were situated in the lower three positions within the variable clusters, respectively.
The essential nutrients required by plants, such as nitrogen, phosphorus, and potassium, were amalgamated into variable cluster C1, which exhibited the most pronounced impact on the habitat suitability of S. rostratum, with a substantial contribution rate of 40.99%. Among these factors, the influence of potassium was particularly noteworthy, especially evident in variables such as total potassium and total potassium density at various depths (please refer to Table S1 for variable names). These variables were exclusively clustered within C1, collectively contributing 19.66% of the total cumulative contribution, representing a substantial 47.96% of C1’s overall influence. This outcome underscores the significant effect of potassium elements in the soil on the habitat suitability of S. rostratum. On the other hand, representing the soil texture conditions, cluster C2 contributed 12.70% to the explanatory power of S. rostratum’s habitat suitability. Notably, the factor of coarse fragment content alone contributed significantly, at a rate of 9.06%. This result further corroborates the plant’s ability to thrive in challenging environments, commonly observed in areas with a high content of gravel, such as riverbanks and roadsides [52]. Furthermore, C3 primarily encompassed pH variables (comprising six factors at varying depths), contributing 7.08% to the overall explanatory power. The relatively high individual contributions of these variables emphasize the significant impact of pH levels on the distribution of S. rostratum.

3.4. Impact Analysis on Model Prediction Accuracy

3.4.1. Impact of Different Combinations of Environmental Variables

In this study, we conducted an analysis under the current climate scenario aimed at evaluating the influence of different environmental variables on the accuracy of simulating the habitat suitability of S. rostratum. As shown in Table 4, various types of environmental variables significantly impacted the model’s predictive accuracy for habitat suitability. The highest predictive accuracy was achieved when all five environmental variables were used (ID1), whereas the lowest performance was observed when soil and humanistic variables were omitted (ID3). In the absence of soil variables (ID2), despite maintaining a relatively high mean AUC value, there were noticeable differences between training AUC and test AUC, particularly a decline in test AUC. This highlights the instability in the model’s predictive accuracy when soil variables are not considered, underscoring the substantial contribution of soil factors to the habitat suitability of S. rostratum. Emulating the approach of other researchers, when considering only climate, topographic, and spatial variables (ID3), the results exhibited notably inferior simulation accuracy, ranking at the lowest level among all simulated outcomes.
It is worth noting that the terms current 1 and current 2 in the remark represent the results of habitat distribution predictions for S. rostratum obtained through modeling based on different sets of environmental variables under the current climatic conditions (i.e., current 1 and current 2).
The simulation of the potential habitat for S. rostratum based on the current 1 scenario not only demonstrated a high precision with AUC values but also exhibited exceptional and detailed spatial mapping accuracy. Specifically, as illustrated in Figure 8, the simulated distribution map of S. rostratum clearly revealed its distribution pattern in oasis areas, including residential areas, roads, and water channels. The map distinctly identified the correlation between the suitable habitat of YST and the oases, such as the Hetian River traversing the Taklamakan Desert, the Keriya River oasis disappearing in the deep desert, and other annotated oasis distributions.
In contrast, the simulation map under the current 2 scenario, which did not consider humanistic and soil factors (see Figure 5b), not only failed to depict the distribution pattern of S. rostratum habitat but also indicated extensive suitability in the harsh desert conditions (Figure 6). This contradicts the viewpoint of Song et al. [72], who suggested that S. rostratum remains highly dependent on water resources even in adverse environments and is frequently found near water bodies. The oases distributed along the edges of the deserts in Xinjiang are sustained by water, providing relatively favorable living conditions, including abundant water resources, to support various vegetation types, including S. rostratum. Therefore, the validity of the results from the current 1 scenario simulation has been verified and supported by existing research.
In conclusion, when conducting predictions for potential species habitat suitability, it is advisable to integrate as many environmen014tal variables as possible, rather than restricting the analysis to one or two types of variables, to ensure credible predictions of habitat distribution.

3.4.2. Impact of Decorrelation Methods

To assess the impact of environmental variable decorrelation methods on the accuracy of species distribution models, we employed the widely utilized Spearman correlation analysis to decorrelate environmental factors [29]. Subsequently, the refined set of environmental variables was input into the Maxent model for simulating the potential habitat of the S. rostratum. Following this, we compared the predictive accuracy of the model obtained through this approach with that of the PCA method employed in this study to evaluate the feasibility of our method. The results (refer to Table 5) reveal a significantly lower number of variables (11 PCs) after applying the PCA decorrelation method compared to the results of Spearman correlation analysis (70 and 62 original environmental variables, respectively), especially when the correlation coefficient threshold is low, yielding fewer variables in the Spearman method. In terms of model simulation accuracy, the PCA method demonstrated a precision of 0.941, markedly surpassing the Spearman correlation analysis. Comparative analysis indicates that a reduced number of variables after decorrelation corresponds to higher model accuracy. In summary, our utilization of the PCA-based environmental variable decorrelation approach substantially enhances the predictive accuracy of potential habitats for the S. rostratum, presenting a distinct advantage over methods based on correlation coefficients.

4. Discussion

In the process of model construction, particularly when dealing with a large number of independent variables, limited sample data, and high intercorrelation among those variables, the risk of encountering a severe overfitting issue is pronounced. This can substantially distort the predictive outcomes of the model. To address this challenge, our study adopted the PCA method in conjunction with the Maxent model to project the current and future potential habitat suitability for S. rostratum. This was achieved despite the constraints of limited sample data and a diverse array of environmental variables, focusing on the incorporation of robust modeling techniques. This approach not only effectively mitigated overfitting concerns but also enhanced the model’s predictive accuracy. Furthermore, it underscored the combined impact of multiple factors on species distribution. The study comprehensively considered the intertwined influence of natural and human-related factors on habitats. Various factors, including climate, topography, soil composition, spatial structure, and human activities, were integrated into the predictive model as environmental variables to produce precise distribution maps for both the current and future habitat suitability zones of S. rostratum. The results yielded highly satisfactory levels of simulation accuracy.

4.1. The Distribution of Potential Suitable Habitats under Contemporary Climate Scenarios

Zhong et al. [64,65,66], based on global occurrence records, climate, and topographic factors, employed species distribution models to predict the global distribution of S. rostratum, ultimately mapping it onto the Chinese region. They contended that excluding Tibet, Qinghai, and Hainan, as well as the southern parts of Guangdong and Guangxi, all other regions in China are highly suitable areas for S. rostratum, particularly in North, Central, and East China. This conclusion differs somewhat from our study’s findings, which project that the primary potential suitability zones for S. rostratum in the current and future 40 years remain concentrated in northern China. We posit that this discrepancy primarily arises because their study only considered climate and topographic factors as predictive variables, likely resulting in an overestimation of S. rostratum’s suitability in China. Plant reproduction and growth depend not only on climatic conditions but also on soil, which provides essential nutrients and substrate. Ignoring this crucial limiting factor inevitably leads to unreasonable judgments about its potential habitat. We particularly emphasize the importance of comprehensively considering multiple environmental factors for the suitability of S. rostratum habitat, extending beyond climate and topographic factors alone. To further validate the reliability of our study results, we conducted a comparative analysis between the simulated potential habitat of S. rostratum and global distribution points.
Despite the broad adaptability of this invasive species, it appears that the southern regions of China are less susceptible to its invasion. This might be partly attributed to the hot and humid climate and acidic soils prevalent in the southern regions, conditions that may be less conducive to the growth of S. rostratum. As depicted in Figure 9, based on the latest data from the GBIF [77], distribution records for S. rostratum are widespread across North America and Europe, with relatively more records in southern Oceania, and sporadic records in southern Africa and Asia. In the Northern Hemisphere, the northernmost recorded distribution point is at approximately 67.87° North latitude (central Norway), while the densest distribution area extends to about 60° North latitude (southeastern Norway). The southernmost sporadic distribution point is located at approximately 14.1° North latitude (southwestern Honduras), with the southernmost concentrated distribution area at about 17° North latitude (southern Mexico). The native range of S. rostratum encompasses the United States and Mexico, with a total of 10,996 known distribution points, representing 89.8% of global distribution records. This region’s north–south span is comparable to that of China, and its climate and topography in the east-west direction are also relatively similar. Theoretically, from a climate suitability perspective, the distribution span of S. rostratum in southern China should be similar to its range in the United States and Mexico, which aligns with the conclusions of Zhong et al.’s research [64,65,66]. However, as of now, the region between 32°N and 25°S (excluding North America) appears to manifest as a void in the distribution of S. rostratum, with much of southern China precisely falling within this range (Figure 9). It is noteworthy that 99% of the observed S. rostratum occurrences and our predictions for both current and future scenarios do not extend beyond the north–south demarcation line of China, represented by the Qinling-Huaihe line. The only exception is an individual specimen independently discovered in the southern part of Zhejiang [78].
From the perspective of the spread of invasive species, similar to many other alien invasive species, it is primarily believed to have entered China through the importation of cereals and seeds [11], with coastal ports being the most likely entry points [4]. Statistically, China’s grain imports have increased elevenfold since 2000, reaching 170 million tons in 2021 [89], with a significant portion passing through coastal ports for domestic distribution. However, to date, there have been no records of S. rostratum invasion in southern Chinese port cities. The interpretation of this unique phenomenon may stem from two aspects. First, it could indicate an enhanced awareness within the Chinese government regarding the potential threat posed by the invasion of S. rostratum, leading to a reinforcement of quarantine measures for imported goods. Second, it may further substantiate the perspective that the southern regions of China are indeed unsuitable for the habitat of the S. rostratum.

4.2. The Spatial Distribution of S. rostratum Is Influenced by Multiple Factors

Plant habitats constitute ecological systems formed by a combination of various elements, including but not limited to moisture, climate, topography, soil characteristics, and biodiversity. With the increasing intensity of human activities, human influence has gradually become one of the pivotal factors affecting habitat suitability for plants [90]. The Global Climate Project offers standardized environmental variables related to global climate and topography. Recently, an increasing number of studies have utilized all or a subset of the 19 “bioclimatic variables” for species distribution predictions [40]. However, relying solely on single-factor prediction methods may exhibit certain limitations because, in complex and diverse ecosystems, the interactions among various factors have a more pronounced impact on habitat suitability.
Our assessment of environmental variable contributions (Table 3) reveals that soil is the most significant determinant of the factors influencing the distribution of S. rostratum, followed by climatic factors. Spatial, human, and topographical factors also have some influence on its habitat suitability. These findings account for the primary reasons behind the disparities in our study results compared to previous potential habitat suitability predictions for S. rostratum. According to Lin [46], S. rostratum thrives in various soil types, showing particular adaptability in sandy and alkaline soils. Our research results validate this perspective. Within our environmental variable clusters (see Section 3.3 for details), C1 contains information on all soil nutrients, C2 emphasizes the characteristics of sandy soils, and C3 pertains to soil pH. These three top-ranking factors collectively contribute 60.77% of the total contribution rate. Hamit et al. [29] also recognized the importance of soil in the habitat suitability of S. rostratum, being the only study among current research on this invasive weed that considers soil elements. Our research results show that environmental variables such as C1, C2, and C7 make a certain contribution to S. rostratum’s distribution, which is consistent with our consensus. However, it is worth noting that Hamit places more emphasis on the impact of human disturbance on the distribution and spread of S. rostratum, with her research indicating that the intensity of human activities has the highest contribution rate to the plant’s suitable area. Surprisingly, her study excludes the potassium factor within soil nutrient variables. In contrast, our research results indicate that potassium has the most significant influence among soil factors, with cumulative contribution rates reaching 19.66% for total potassium and total potassium density. Additionally, we believe that soil bulk density (C6), soil thickness (C6), and cation exchange capacity (C8) also influence the habitat suitability of S. rostratum.
Climate has a crucial impact on the habitat suitability of S. rostratum, a conclusion consistent with prior research findings. In our study, climatic factors contributed 10.98% to the habitat suitability of S. rostratum. Specifically, temperature annual range (bio7), temperature seasonality (bio4), and precipitation seasonality (bio15) each exhibited significant effects on suitability, contributing 1.31%, 1.19%, and 1.07%, respectively. Among all climatic variables, these three were the most pronounced factors. Sharim [74] noted that S. rostratum seeds enter a dormant state in low-temperature, arid conditions and awaken with rising temperatures and sufficient moisture in spring, a pattern conducive to its reproduction. The optimal germination temperature for S. rostratum seeds falls between 25 and 35 °C [91], and during the summer growing season, high temperatures and ample moisture favor its growth and competitiveness. Therefore, bio7, bio4, and bio15 provide ideal conditions for the reproduction and growth of S. rostratum. Given that climatic factors contribute differently to various PCs, we categorized their contributions into two clusters, namely C4 and C5, encompassing distinct climatic variables.
Spatial, humanistic, and topographical variables collectively contributed 4.38% to the habitat suitability of S. rostratum. Although this value may appear relatively small, it should not be disregarded. Typically, latitude and longitude substantially encompass the variations in multiple environmental factors. As latitude increases, the mean temperature and rainfall in January tend to decrease, while the frost-free period (a major factor influencing the distribution of alien species) gradually extends [12]. In China, the east-west direction (longitude) primarily reflects variations in precipitation, which equally impacts species’ habitats. Topography, including elevation, slope, and aspect, plays a pivotal role in redistributing light, temperature, and precipitation. It transforms the effects of longitude and latitude on habitats from a two-dimensional plane into a three-dimensional scenario, thus integrating the influence of these factors comprehensively.
The exchange of personnel and trade is recognized as one of the primary pathways for the spread of invasive species [7]. For instance, a flour processing factory in Chaoyang City, Liaoning Province, China, was the initial site where the invasion of S. rostratum was first observed. Importation of wheat from the United States has been identified as a likely medium for its propagation [11]. Similarly, instances of S. rostratum discovered in Urumqi County and Changji City in Xinjiang are likely due to the introduction of sheep from Australia. This scenario can be attributed to the fruit adhering to the wool of these animals, inadvertently introducing the species [46]. Intensive transportation networks, waterway systems, thriving economies, and high population densities are recognized as key drivers for the rapid expansion of invasive species in new habitats [12]. The interconnectedness of water systems and road networks links various ecosystems, including human communities. These conduits also serve as pathways for the dispersal of S. rostratum, enabling the seeds to be transported by water currents, thus facilitating population expansion. Road systems, in particular, play a significant role as primary transportation routes for goods. Invasive species are often inadvertently transported as they hitch rides on grain and livestock hides during the transportation process, increasing the likelihood of seed scattering and escape, thereby creating opportunities for further spread. The intensity of human activities, considering these factors holistically, is deemed a pivotal determinant in the propagation and diffusion of S. rostratum in Xinjiang [47], a conclusion with which we concur. Furthermore, our investigation posits that human activities exert a crucial influence on the spatial distribution of potential habitats for S. rostratum.

4.3. The Future Development of Potential Suitable Habitats for S. rostratum

Climate change is expected to accelerate the invasion of alien species and expand their current territories [10]. Our research findings align with this viewpoint. Over the next 40 years, the potential suitable habitat for S. rostratum in China is projected to exhibit an expanding trend, displaying characteristics of southward migration (as illustrated in Figure 10). Specifically, during the period 2041–2060 under the SSP1-2.6 shared pathway scenario, the maximum expansion of the suitable habitat area is projected to reach 0.7218 million km2 (as shown in Figure 10e). In contrast, under the SSP5-8.5 shared pathway scenario for the same period, the suitable habitat is expected to extend to the southernmost region (as depicted in Figure 10d). Between 2021 and 2040, the expansion of the suitable habitat will predominantly concentrate in western Inner Mongolia, central Shaanxi, southern Hebei, northern Henan, and northern Shandong, while the reduction in suitable habitat will mainly occur in the northeastern three provinces and Xinjiang. Under the SSP5-8.5 shared pathway scenario for this period, the widest reduction in suitable habitat is anticipated, covering an area of 0.2088 million km2.
Lv [65] suggests that under future environmental conditions, with the continuous increase in greenhouse gas emissions leading to elevated CO2 concentrations and temperatures, the high and mid-suitability zones for S. rostratum will disappear, leaving only the low-suitability zone. Moreover, the more greenhouse gases are emitted, the less suitable the conditions become for the survival of S. rostratum. We hold a different perspective on this point. We contend that excluding artificial control and other potential mutational factors, it is challenging for this species to naturally diminish due to its broad adaptive capacity. Furthermore, in future environments, it may further adjust its survival strategies through self-evolution to cope with progressively deteriorating conditions, and it might even expand its ecological niche. Therefore, we should not be overly optimistic about this matter and must remain vigilant to prevent the widening invasion range of S. rostratum. Particularly in regions such as Shaanxi, Henan, and Shandong, preparations should be made to prevent its southward spread.

4.4. The Advantages of Using the PCA Method in Species Distribution Modeling

Collinearity refers to the situation in a model where two or more predictor variables are linearly correlated. Typically, SDM based on large datasets of correlated environmental variables may lead to multicollinearity. This issue can magnify the variance of predicted values for the response variable and the variance of estimated parameters, resulting in the misidentification of predictor variables in the model [38]. Spatial proximity of species occurrence records often results in unavoidable spatial autocorrelation, causing biases in variables or model coefficients during SDM [39]. Due to the limited number of species records available for comprehensive research, coupled with a lack of a priori knowledge regarding which predictive environmental variables should be included in the model, researchers are compelled to provide a plethora of environmental variables for model selection. This not only activates the aforementioned issues but also introduces new challenges, such as model overfitting, subsequently leading to severe prediction errors [92]. The Maxent model exhibits relative sensitivity to collinearity in response variables, and consensus on how spatial autocorrelation affects model predictive performance is yet to be reached [93]. Therefore, addressing these issues revolves around three key aspects: (1) increasing the number of species occurrence points, (2) incorporating ecological knowledge to selectively optimize and reduce the number of environmental variables, and (3) utilizing decorrelation and redundancy elimination algorithms to mitigate variable collinearity and reduce information redundancy. However, the former two methods are often challenging to implement [94], while the third method is gaining increasing attention among researchers and continues to be explored [93].
Methods commonly used to address collinearity include correlation coefficient analysis, variable inflation factor (VIF), and PCA [38]. In our study, we employed both correlation coefficient analysis and PCA to decorrelate and reduce the dimensionality of the environmental variable set. Subsequently, these processed variables were input into the model for predicting the suitable habitat of the S. rostratum. The results indicated a significant improvement in both dimensionality reduction (number of variables post-reduction) and model accuracy when utilizing PCA compared to correlation coefficient analysis (refer to Table 5). We attribute this improvement primarily to:
(1) The method based on correlation coefficients addresses collinearity by solely considering the numerical information of correlation coefficients, neglecting ecological a priori knowledge and spatial correlations. This oversight may result in the removal of variables containing crucial information about species distribution, subsequently affecting the precision and predictive outcomes of the model.
(2) PCA stands out as a valuable tool for eliminating inter-variable correlations and reducing collinearity within variable sets. Specifically, the collinearity among environmental variables containing biogeographic information exhibits spatial scale characteristics [95]. In our improved PCA method, local PCA transformations consider the ecological characteristics of species distribution points, while global PCA transformations adequately account for the spatial information in the multidimensional and extensive environmental variable dataset. This ensures that the PCs generated by PCA encompass rich content containing information about ecological mechanisms. Additionally, the new variables (PCs) produced by PCA transformations represent loads of environmental variables on orthogonal axes, ensuring the effective removal of collinearity and information redundancy.
Additionally, previous research has commonly held the view that conducting an attribution analysis of influencing factors is challenging when utilizing PCA for dimensionality reduction in SDM. For instance, Cruz-Cárdenas et al. [96] explored the feasibility of using PCA-derived PCs as predictor variables in SDM. They demonstrated superior species distribution prediction accuracy compared to other methods by inputting PCs obtained through PCA transformation into the model. However, they fell short of achieving attribution analysis based on original variables. Our study addresses this limitation with the proposed PCA inverse transformation method, enabling species distribution models to utilize PCs generated by PCA for prediction and subsequent attribution analysis. This bridges the gap in the comprehensive application of PCA dimensionality reduction techniques in the entire process of SDM.
Therefore, our proposed PCA dimensionality reduction technique, along with the PCA inverse transformation attribution analysis method, not only enhances and innovates upon classical algorithms but also, as a remote sensing data processing algorithm, demonstrates significant advantages and high applicability in the field of SDM.

4.5. Limitations and Suggestions

4.5.1. Limitations

First, due to the absence of soil and human variables data for future scenarios, our predictions of S. rostratum’s suitable habitat under future climate scenarios considered only climate, topography, and spatial variables. This limitation may have reduced the reliability of our predictions for future climate scenarios, even though the evaluation accuracy (AUC) for our future scenario results all reached an excellent level. Second, the current population density of S. rostratum is crucial for its spread and expansion. However, the lack of such data in our study on biotic variables, using only abiotic variables, might have had some influence on the accuracy of our predictions.

4.5.2. Suggestions

(1) Priority should be given to quarantine measures for food, live animals, or animal products imported from abroad, especially from countries where S. rostratum is known to be present. This is a crucial pathway for the invasion of S. rostratum. During the trade of these goods between provinces and regions within the country, special attention should be paid to the presence of S. rostratum fruit or seeds. Additionally, the collection and distribution centers of these goods, such as food processing facilities, livestock pens, and fur processing factories, should also receive thorough scrutiny, with regular inspections in the surrounding areas. If fruit, seeds, or plants of S. rostratum are detected, immediate removal should be undertaken to prevent further spread and propagation at the new location. These locations may include the suitable habitats predicted by the models for both the future scenarios (future 1 and future 2) as well as areas in southern China where S. rostratum has not been observed.
(2) The predictions from current 1 can be used to identify priority regions for the current control of S. rostratum. Meanwhile, the predictions from future 1 and future 2 models can guide preventive and control measures for the species’ future spread and help identify key areas for defense.

5. Conclusions

To address the challenge of remote sensing target recognition and image interpretation methods that are difficult to identify the suitable areas of S. rostratum, which is short stature, scattered distribution, and coexistence with other plants, on a large scale, and with high accuracy. In our study, we utilized species occurrence data and multi-dimensional environmental variables constructed from various remote sensing sources, applying PCA in combination with the Maxent model to effectively model the current and future potential habitat distribution of S. rostratum in China. Our models demonstrated excellent accuracy, as indicated by AUC values exceeding 0.9. In the present period, the suitable habitat area for S. rostratum is estimated at 139.52 × 10⁴ km2. Projections indicate an expanding trend in habitat area in future scenarios, with the period 2041–2060 under SSP1-2.6 presenting the most significant change, showing a 19.23% increase in the suitable habitat area compared to the current scenario. While the suitable habitat for S. rostratum is generally shifting southward in the upcoming period (in contrast to the optimal zone), it predominantly remains distributed in northern China. The potential suitable habitat for S. rostratum results from the combined influence of various environmental factors, with soil factors emerging as the predominant driver, contributing at a rate of 75.85%. Our proposed PCA-based dimensionality reduction method, which aims to eliminate the multicollinearity among multidimensional environmental factors and obtain the contribution of original variables through PCA inverse transformation, provides new ideas for future research on species distribution prediction, especially for solving the problem of redundant information from highly autocorrelated variables. Our study holds the promise of providing reliable support for the current control and future prevention efforts concerning S. rostratum. Furthermore, it offers valuable scientific insights for the early warning, management, and biodiversity conservation of invasive species spread.

Supplementary Materials

The following supporting information can be downloaded at: https://www.mdpi.com/article/10.3390/rs16020271/s1, Table S1: Coordinates of species occurrence records of S. rostratum. used for modeling in this study. Table S2: List of environment variables used in this study.

Author Contributions

Conceptualization, T.H., T.Y., K.W. and W.H.; methodology, T.H., T.Y., K.W. and W.H.; formal analysis, T.H., T.Y., K.W. and W.H.; investigation, T.H. and T.Y.; resources, T.Y.; writing—original draft preparation, T.H. and T.Y.; writing—review and editing, T.H. and T.Y.; visualization, T.H. and T.Y.; supervision, K.W. and W.H.; project administration, T.H., T.Y. and K.W.; funding acquisition, T.H., T.Y. and K.W. All authors have read and agreed to the published version of the manuscript.

Funding

This research was funded by Key Technology Research and Development Program of Zhejiang Province, grant number 2023C03138; Open Research Fund of the Yinshanbeilu Grassland Eco-hydrology National Observation and Research Station, China Institute of Water Resources and Hydropower Research, grant number YSS202115 and The Project of Northern Agriculture and Livestock Husbandry Technical Innovation Center, Chinese Academy of Agricultural Sciences, grant number BFGJ2022002.

Data Availability Statement

Data will be made available on request.

Acknowledgments

We greatly appreciate the editors and anonymous reviewers for their valuable time, constructive suggestions, and insightful comments.

Conflicts of Interest

Author Tong Yang was employed by the company Inner Mongolia Eco-Environment Big Data Limited Company. The remaining authors declare that the research was conducted in the absence of any commercial or financial relationships that could be construed as a potential conflict of interest.

References

  1. Pysek, P.; Hulme, P.E.; Simberloff, D.; Bacher, S.; Blackburn, T.M.; Carlton, J.T.; Dawson, W.; Essl, F.; Foxcroft, L.C.; Genovesi, P.; et al. Scientists’ warning on invasive alien species. Biol. Rev. 2020, 95, 1511–1534. [Google Scholar] [CrossRef] [PubMed]
  2. Gallardo, B.; Aldridge, D.C.; González Moreno, P.; Pergl, J.; Pizarro, M.; Pyšek, P.; Thuiller, W.; Yesson, C.; Vilà, M. Protected areas offer refuge from invasive species spreading under climate change. Glob. Change Biol. 2017, 23, 5331–5343. [Google Scholar] [CrossRef]
  3. Kumar Rai, P.; Singh, J.S. Invasive alien plant species: Their impact on environment, ecosystem services and human health. Ecol. Indic. 2020, 111, 106020. [Google Scholar] [CrossRef] [PubMed]
  4. Yang, W.; Sun, S.; Wang, N.; Fan, P.; You, C.; Wang, R.; Zheng, P.; Wang, H. Dynamics of the distribution of invasive alien plants (Asteraceae) in China under climate change. Sci. Total Environ. 2023, 903, 166260. [Google Scholar] [CrossRef]
  5. Sittaro, F.; Hutengs, C.; Vohland, M. Which factors determine the invasion of plant species? Machine learning based habitat modelling integrating environmental factors and climate scenarios. Int. J. Appl. Earth Obs. Geoinf. 2023, 116, 103158. [Google Scholar] [CrossRef]
  6. Bellard, C.; Cassey, P.; Blackburn, T.M. Alien species as a driver of recent extinctions. Biol. Lett. 2016, 12, 20150623. [Google Scholar] [CrossRef]
  7. Hulme, P.E. Trade, transport and trouble: Managing invasive species pathways in an era of globalization. J. Appl. Ecol. 2009, 46, 10–18. [Google Scholar] [CrossRef]
  8. Ziska, L.; Dukes, J.S. Invasive Species and Global Climate Change; CABI: Oxfordshire, UK, 2022. [Google Scholar] [CrossRef]
  9. IPCC. Climate change 2021: The physical science basis. In Contribution of Working Group I to the Sixth Assessment Report of the Intergovernmental Panel on Climate Change; IPCC: Geneva, Switzerland, 2021; Volume 2, Available online: https://www.ipcc.ch/report/ar6/wg1/downloads/report/IPCC_AR6_WGI_FrontMatter.pdf (accessed on 3 August 2023).
  10. Seebens, H.; Bacher, S.; Blackburn, T.M.; Capinha, C.; Dawson, W.; Dullinger, S.; Genovesi, P.; Hulme, P.E.; van Kleunen, M.; Kühn, I.; et al. Projecting the continental accumulation of alien species through to 2050. Glob. Change Biol. 2021, 27, 970–982. [Google Scholar] [CrossRef]
  11. Guan, G.; Gao, D.; Li, W.; Ye, J.; Xin, X.; Li, S. Solanum rostratum: A quarantine weed. Plant Quar. 1984, 25–28. [Google Scholar] [CrossRef]
  12. Wu, X.-W.; Luo, J.; Chen, J.-K.; Li, B. Spatial patterns of invasive alien plants in china and its relationship with environmental and anthropological factors. J. Plant Ecol. 2006, 30, 576–584. [Google Scholar] [CrossRef]
  13. Wang, R.; Gamon, J.A. Remote sensing of terrestrial plant biodiversity. Remote Sens. Environ. 2019, 231, 111218. [Google Scholar] [CrossRef]
  14. Anderson, C.J.; Heins, D.; Pelletier, K.C.; Knight, J.F. Improving Machine Learning Classifications of Phragmites australis Using Object-Based Image Analysis. Remote Sens. 2023, 15, 989. [Google Scholar] [CrossRef]
  15. Dmitriev, P.A.; Kozlovsky, B.L.; Kupriushkin, D.P.; Dmitrieva, A.A.; Rajput, V.D.; Chokheli, V.A.; Tarik, E.P.; Kapralova, O.A.; Tokhtar, V.K.; Minkina, T.M.; et al. Assessment of Invasive and Weed Species by Hyperspectral Imagery in Agrocenoses Ecosystem. Remote Sens. 2022, 14, 2442. [Google Scholar] [CrossRef]
  16. Jochems, L.W.; Brandt, J.; Monks, A.; Cattau, M.; Kolarik, N.; Tallant, J.; Lishawa, S. Comparison of Different Analytical Strategies for Classifying Invasive Wetland Vegetation in Imagery from Unpiloted Aerial Systems (UAS). Remote Sens. 2021, 13, 4733. [Google Scholar] [CrossRef]
  17. Zhao, Z.; Xiao, N.; Shen, M.; Li, J. Comparison between optimized MaxEnt and random forest modeling in predicting potential distribution: A case study with Quasipaa boulengeri in China. Sci. Total Environ. 2022, 842, 156867. [Google Scholar] [CrossRef] [PubMed]
  18. Booth, T.H.; Nix, H.A.; Busby, J.R.; Hutchinson, M.F. BIOCLIM: The first species distribution modelling package, its early applications and relevance to most current MAXENT studies. Divers. Distrib. 2014, 20, 1–9. [Google Scholar] [CrossRef]
  19. Guo, Y.; Zhao, Z.; Qiao, H.; Wang, R.; Wei, H.; Wang, L.; Gu, W.; Li, X. Challenges and Development Trend of Species Distribution Model. Adv. Earth Sci. 2020, 35, 1292–1305. [Google Scholar] [CrossRef]
  20. Huang, X.; He, F.; Peng, Y.; Chen, S. Distribution of Alien Invasive Species Ambrosia artemisiifolia in Guangxi Area. Weed Sci. 2023, 41, 29–34. [Google Scholar] [CrossRef]
  21. Marmion, M.; Luoto, M.; Heikkinen, R.K.; Thuiller, W. The performance of state-of-the-art modelling techniques depends on geographical distribution of species. Ecol. Model. 2009, 220, 3512–3520. [Google Scholar] [CrossRef]
  22. Dittrich, A.; Roilo, S.; Sonnenschein, R.; Cerrato, C.; Ewald, M.; Viterbi, R.; Cord, A.F. Modelling Distributions of Rove Beetles in Mountainous Areas Using Remote Sensing Data. Remote Sens. 2020, 12, 80. [Google Scholar] [CrossRef]
  23. Dong, J.; Guo, M.; Wang, X.; Yang, X.; Zhang, Y.; Zhang, P. Dramatic loss of seagrass Zostera marina L. suitable habitat under projected climate change in coastal areas of the Bohai Sea and Shandong peninsula, China. J. Exp. Mar. Biol. Ecol. 2023, 565, 151915. [Google Scholar] [CrossRef]
  24. Keyghobadi, M.; Piri Sahragard, H.; Pahlavan Rad, M.R.; Karami, P.; Yari, R. Application of Generalized Additive Model and Classification and Regression Tree to Estimate Potential Habitat Distribution of Range plant species (Case Study: Khazri Rangelands of Beyaz Plain, Southern Khorasan). Iran. J. Range Desert Res. 2020, 27, 561–576. [Google Scholar] [CrossRef]
  25. Aidoo, O.F.; Souza, P.G.C.; Da Silva, R.S.; Júnior, P.A.S.; Picanço, M.C.; Osei-Owusu, J.; Sétamou, M.; Ekesi, S.; Borgemeister, C. A machine learning algorithm-based approach (MaxEnt) for predicting invasive potential of Trioza erytreae on a global scale. Ecol. Inform. 2022, 71, 101792. [Google Scholar] [CrossRef]
  26. Fan, J.; Li, H.; Yang, Z.; Zhu, G. Selecting the best native individual model to predict potential distribution of Cabomba caroliniana in China. Biodivers. Sci. 2019, 27, 140–148. [Google Scholar] [CrossRef]
  27. Briscoe Runquist, R.D.; Lake, T.; Tiffin, P.; Moeller, D.A. Species distribution models throughout the invasion history of Palmer amaranth predict regions at risk of future invasion and reveal challenges with modeling rapidly shifting geographic ranges. Sci. Rep. 2019, 9, 2426. [Google Scholar] [CrossRef] [PubMed]
  28. Panda, R.M.; Behera, M.D.; Roy, P.S. Assessing distributions of two invasive species of contrasting habits in future climate. J. Environ. Manag. 2018, 213, 478–488. [Google Scholar] [CrossRef] [PubMed]
  29. Hamit, S.; Abdushalih, N.; Jiesisi, A.; Hua, S.; Yilihar, V. Impact of human activities on potential distribution of Solanum rostratum Dunal in Xinjiang. Acta Ecol. Sin. 2019, 39, 629–636. [Google Scholar] [CrossRef]
  30. Teng, M.; Liu, J.; Lu, Y.; Cheng, X.; Wang, Y. Simulation of the distribution of wild Alligator sinensis (Crocodylia: Alligatoridae) in China under climate change. Acta Ecol. Sin. 2023, 43, 1–11. [Google Scholar] [CrossRef]
  31. Shi, X.; Wang, J.; Zhang, L.; Chen, S.; Zhao, A.; Ning, X.; Fan, G.; Wu, N.; Zhang, L.; Wang, Z. Prediction of the potentially suitable areas of Litsea cubeba in China based on future climate change using the optimized MaxEnt model. Ecol. Indic. 2023, 148, 110093. [Google Scholar] [CrossRef]
  32. Feng, L.; Sun, J.; El-Kassaby, Y.A.; Luo, D.; Guo, J.; He, X.; Zhao, G.; Tian, X.; Qiu, J.; Feng, Z.; et al. Planning Ginkgo biloba future fruit production areas under climate change: Application of a combinatorial modeling approach. For. Ecol. Manag. 2023, 533, 120861. [Google Scholar] [CrossRef]
  33. Yao, Z.; Han, Q.; Lin, B. Prediction of distribution area of main noxious and miscellaneous weeds in Xinjiang based on MaxEnt model. Acta Ecol. Sin. 2023, 43, 1–14. [Google Scholar] [CrossRef]
  34. Ju, X.; Lin, J.; Wu, J.; Chen, J.; Guan, J.; Li, M.; Zheng, J. Prediction of potential living area of typical locusts in Xinjiang based on species distribution model. Acta Ecol. Sin. 2022, 42, 8605–8617. [Google Scholar] [CrossRef]
  35. Zhang, X.; Huang, W.; Ye, H.; Lu, L. Study on the Identification of Habitat Suitability Areas for the Dominant Locust Species Dasyhippus Barbipes in Inner Mongolia. Remote Sens. 2023, 15, 1718. [Google Scholar] [CrossRef]
  36. Zhang, X.; Zhao, J.; Wang, M.; Li, Z.; Lin, S.; Chen, H. Potential distribution prediction of Amaranthus palmeri S. Watson in China under current and future climate scenarios. Ecol. Evol. 2022, 12, e9505. [Google Scholar] [CrossRef] [PubMed]
  37. Tu, W.; Xiong, Q.; Qiu, X.; Zhang, Y. Dynamics of invasive alien plant species in China under climate change scenarios. Ecol. Indic. 2021, 129, 107919. [Google Scholar] [CrossRef]
  38. Dormann, C.F.; Elith, J.; Bacher, S.; Buchmann, C.; Carl, G.; Carré, G.; Marquéz, J.R.G.; Gruber, B.; Lafourcade, B.; Leitão, P.J.; et al. Collinearity: A review of methods to deal with it and a simulation study evaluating their performance. Ecography 2013, 36, 27–46. [Google Scholar] [CrossRef]
  39. Franklin, J. Mapping Species Distributions: Spatial Inference and Prediction; Cambridge University Press: Cambridge, UK, 2010. [Google Scholar]
  40. Fourcade, Y.; Besnard, A.G.; Secondi, J. Paintings predict the distribution of species, or the challenge of selecting environmental predictors and evaluation statistics. Glob. Ecol. Biogeogr. 2018, 27, 245–256. [Google Scholar] [CrossRef]
  41. Wold, S.; Esbensen, K.; Geladi, P. Principal component analysis. Chemom. Intell. Lab. Syst. 1987, 2, 37–52. [Google Scholar] [CrossRef]
  42. Uddin, M.P.; Mamun, M.A.; Hossain, M.A. PCA-based Feature Reduction for Hyperspectral Remote Sensing Image Classification. Tech. Rev. IETE 2021, 38, 377–396. [Google Scholar] [CrossRef]
  43. Jiang, J.; Ma, J.; Chen, C.; Wang, Z.; Cai, Z.; Wang, L. SuperPCA: A Superpixelwise PCA Approach for Unsupervised Feature Extraction of Hyperspectral Imagery. IEEE Trans. Geosci. Remote Sens. 2018, 56, 4581–4593. [Google Scholar] [CrossRef]
  44. Uddin, M.P.; Mamun, M.A.; Afjal, M.I.; Hossain, M.A. Information-theoretic feature selection with segmentation-based folded principal component analysis (PCA) for hyperspectral image classification. Int. J. Remote Sens. 2021, 42, 286–321. [Google Scholar] [CrossRef]
  45. Zhang, Y.; Guo, W.; Yuan, Z.; Song, Z.; Wang, Z.; Gao, J.; Fu, W.; Zhang, G. Chromosome-level genome assembly and annotation of the prickly nightshade Solanum rostratum Dunal. Sci. Data 2023, 10, 341. [Google Scholar] [CrossRef]
  46. Lin, Y.; Tan, D.Y. The potential and exotic invasive plant: Solanum rostratum. Acta Phytotaxon. Sin. 2007, 45, 675–685. [Google Scholar] [CrossRef]
  47. Yan, W.; Wang, J.; Zheng, Y. Advances in Hazard status and Control technology of Solanum rostratum. Terr. Ecosyst. Conserv. 2022, 2, 73–79. [Google Scholar] [CrossRef]
  48. Bao, H.; Fu, J.; Wang, Y.; Luo, J.; Liu, D.; Shao, R.; Zhang, L. Distribution pattern and spread impact factors of invasive plant buffalobur in Inner Mongolia. Inn. Mong. Environ. Sci. 2022, 34, 104–108. [Google Scholar] [CrossRef]
  49. Zhao, X.-Y.; Ma, X.-D.; Xu, Z.-W. Non-native Solanum rostratum and Its Ecological Significance Appeared in Urumqi, Xinjiang. Adv. Earth Sci. 2007, 22, 167–170. [Google Scholar] [CrossRef]
  50. Chen, T.; Liu, Z.; Lou, A. Phenotypic variation in populations of Solanum rostratum in different distribution areas in China. Chin. J. Plant Ecol. 2013, 37, 344–353. [Google Scholar] [CrossRef]
  51. Guo, J.; Cao, W.; Zhang, Y.; Gao, Y.; Wang, Y. Prediction of the potential distribution area of Solanum rostratum in northeast China. Pratacultural Sci. 2019, 36, 2476–2484. [Google Scholar] [CrossRef]
  52. Wang, Q.; Cheng, M.; Xiao, X.; Yuan, H.; Zhu, J.; Fan, C.; Zhang, J. An image segmentation method based on deep learning for damage assessment of the invasive weed Solanum rostratum Dunal. Comput. Electron. Agric. 2021, 188, 106320. [Google Scholar] [CrossRef]
  53. Li, Y.; Liu, H. Survey on major alien invasive plants and their prevention and control in Jizhou District, Tianjin, China. Sci. Technol. Tianjin Agric. For. 2017, 27–29. [Google Scholar] [CrossRef]
  54. Che, J.; Liu, Q.; Hu, B. Alien invasive weed Solanum rostratum Dunal. Weed Sci. 2006, 58–60. [Google Scholar] [CrossRef]
  55. Xiang, J.; Li, C.-N.; Liu, Q.-R.; Zhou, Y.-L.; Sun, L.; Mao, C.-M.; Liang, Q.-J. Ecological state of invasive alien plant Solanum rostratum in Beijing. Chin. J. Ecol. 2011, 30, 453–458. [Google Scholar] [CrossRef]
  56. Technical Guidance for Prevention and Control of Solanum rostratum Dunal. Available online: http://www.reea.agri.cn/stzybh/202307/t20230707_8004181.htm (accessed on 13 September 2023).
  57. Wu, Z.-G.; Fang, Y.; Qin, M.; Qin, Y.-J.; Wang, C.; Zhao, T.; Li, Z.-H. Potential economic loss assessment on maize industry of China caused by buffalobur (Solanum rostratum). J. China Agric. Univ. 2015, 20, 138–145. [Google Scholar] [CrossRef]
  58. Wang, H. Study on the Invasion Characteristics of Solanum rostratum Dunal. Master’s Thesis, Inner Mongolia Normal University, Hohhot, China, 2017. [Google Scholar]
  59. Zhang, L.; Lou, A. Phenotypic variation in floral traits of an invasive plant (Solanum rostratum) and its impact on reproductive fitness. Sci. Sin. Vitae 2022, 52, 1281–1291. [Google Scholar] [CrossRef]
  60. Qiu, J.; Shalimu, D.; Tan, D. Reproductive characteristics of the invasive species Solanum rostratum indifferent habitats of Xinjiang, China. Biodivers. Sci. 2013, 21, 590–600. [Google Scholar] [CrossRef]
  61. Shi, K.; Shao, H.; Han, C.; Zokir, T. Diversity of the Rhizosphere Soil Fungi of the Invasive Plant (Solanum rostratum Dunal) and the Allelopathic Potential of Their Secondary Metabolites. Chin. J. Soil Sci. 2022, 53, 548–557. [Google Scholar] [CrossRef]
  62. Abu-Nassar, J.; Matzrafi, M. Effect of Herbicides on the Management of the Invasive Weed Solanum rostratum Dunal (Solanaceae). Plants 2021, 10, 284. [Google Scholar] [CrossRef]
  63. Wang, Q.; Cheng, M.; Huang, S.; Cai, Z.; Zhang, J.; Yuan, H. A deep learning approach incorporating YOLO v5 and attention mechanisms for field real-time detection of the invasive weed Solanum rostratum Dunal seedlings. Comput. Electron. Agric. 2022, 199, 107194. [Google Scholar] [CrossRef]
  64. Zhong, G.; Shen, W.; Wan, F.; Wang, J. Potential distribution areas of Solanum rostratum in China: A prediction with GARP niche model. Chin. J. Ecol. 2009, 28, 162–166. [Google Scholar] [CrossRef]
  65. Lv, F. Studies on the Potential Suitable Distribution Areas and Chemical Constituents of the Invasive Plant Solanum rostratum. Master’s Thesis, Shenyang Agriculture University, Shenyang, China, 2020. [Google Scholar]
  66. Wang, R.; Tang, Y.; Zhang, Z.; Wan, F. The distribution pattern and early monitoring for preventing further expansion of Solanum rostratum in China. J. Biosaf. 2018, 27, 284–289. [Google Scholar] [CrossRef]
  67. Su, H.; Sihake, N.; Bazhabaike, M. Study on the invasion status of the alien invasive plant Solanum rostratum Dunal in Xinjiang. Xinjiang Agric. Sci. Technol. 2022, 262, 21–22. [Google Scholar] [CrossRef]
  68. Tian, Z.; Zeng, J.; Wang, Y.; Zhu, Q. Distribution and Risk Assessment of Invasive Plant Solanum rostratum Dunal in Ningxia. Ningxia J. Agric. For. Sci. Technol. 2021, 62, 61–64. [Google Scholar] [CrossRef]
  69. Qu, Z. Occurrence and Control Status of Exotic Invasive Plant Solanum rostratum in Liaoning Province. Agric. Sci. Technol. Equip. 2021, 14–15. [Google Scholar] [CrossRef]
  70. Chen, J.; Ma, F.-Z.; Zhang, Y.-J.; Wang, C.-B.; Xu, H.-G. Spatial point pattern analysis of Solanum rostratum Dunal in different habitats. J. South. Agric. 2020, 51, 342–349. [Google Scholar] [CrossRef]
  71. Yimingniyazi, A. Effect of Solanum rostratum Invasion on Distribution, Life History and Habits of Leptinotarsa decemlineata. Ph.D. Thesis, Xinjiang Agricultural University, Urumqi, China, 2015. [Google Scholar]
  72. Song, Z.; Tan, D.; Zhou, G. Distribution and Community Characteristics of Invasive Solanum rostratum Dunal. in Xinjiang. Arid. Res. 2013, 30, 129–134. [Google Scholar] [CrossRef]
  73. He, J.; Khasbag, A.; Mong, E.; Hu, M. Solanum rostratum Dunal: A Newly Invaded Alien Plant of Inner Mongolia. J. Inn. Mong. Norm. Univ. Nat. Sci. Ed. 2011, 40, 288–290. [Google Scholar] [CrossRef]
  74. Shalim, D. Pollination Biology and Germination Characteristics of Solanum rostratum. Master’s Thesis, Xinjiang Agricultural University, Urumqi, China, 2011. [Google Scholar]
  75. Wang, C.; Hong, Y.; Sun, L. Analysis on the biological characteristics and control methods of the Solanum rostratum Dunal occurring in Baicheng City. Jilin Agric. 2010, 83. [Google Scholar]
  76. National Plant Specimen Resource Center. Available online: https://www.cvh.ac.cn (accessed on 3 August 2023).
  77. Global Biodiversity Information Facility. Available online: https://www.gbif.org (accessed on 3 August 2023).
  78. For the First Time in East China, the Invasive Species Solanum rostratum Dunal Has Been Documented in Our Region. Available online: http://www.wuxing.gov.cn/art/2022/8/26/art_1229518306_3888984.html (accessed on 3 August 2023).
  79. Baidu Coordinate Retrieval System. Available online: http://api.map.baidu.com/lbsapi/getpoint/index.html (accessed on 3 August 2023).
  80. Yan, H.; Feng, L.; Zhao, Y.; Feng, L.; Zhu, C.; Qu, Y.; Wang, H. Predicting the potential distribution of an invasive species, Erigeron canadensis L., in China with a maximum entropy model. Glob. Ecol. Conserv. 2020, 21, e00822. [Google Scholar] [CrossRef]
  81. Zeng, Y.; Low, B.W.; Yeo, D.C.J. Novel methods to select environmental variables in MaxEnt: A case study using invasive crayfish. Ecol. Model. 2016, 341, 5–13. [Google Scholar] [CrossRef]
  82. Ikotun, A.M.; Ezugwu, A.E.; Abualigah, L.; Abuhaija, B.; Heming, J. K-means clustering algorithms: A comprehensive review, variants analysis, and advances in the era of big data. Inf. Sci. 2023, 622, 178–210. [Google Scholar] [CrossRef]
  83. Cap, O.M.; Rez, A.P.E.; Lozano, J.A. An efficient K-means clustering algorithm for tall data. Data Min. Knowl. Discov. 2020, 34, 776–811. [Google Scholar] [CrossRef]
  84. Merow, C.; Smith, M.J.; Silander, J.A. A practical guide to MaxEnt for modeling species’ distributions: What it does, and why inputs and settings matter. Ecography 2013, 36, 1058–1069. [Google Scholar] [CrossRef]
  85. Phillips, S.J.; Anderson, R.P.; Schapire, R.E. Maximum entropy modeling of species geographic distributions. Ecol. Model. 2006, 190, 231–259. [Google Scholar] [CrossRef]
  86. Elith, J.; Phillips, S.J.; Hastie, T.; Dudík, M.; Chee, Y.E.; Yates, C.J. A statistical explanation of MaxEnt for ecologists. Divers. Distrib. 2011, 17, 43–57. [Google Scholar] [CrossRef]
  87. Phillips, S.J.; Anderson, R.P.; Dudík, M.; Schapire, R.E.; Blair, M.E. Opening the black box: An open-source release of Maxent. Ecography 2017, 40, 887–893. [Google Scholar] [CrossRef]
  88. Harris, R.; Jarvis, C. Statistics for Geography and Environmental Science; Routledge: London, UK, 2014. [Google Scholar] [CrossRef]
  89. National Statistical Yearbook 2022. Available online: https://data.stats.gov.cn/easyquery.htm?cn=C01 (accessed on 3 August 2023).
  90. Liu, D.; Zhang, X. Occurrence Prediction of Pine Wilt Disease Based on CA–Markov Model. Forests 2022, 13, 1736. [Google Scholar] [CrossRef]
  91. Zhang, S.; Wei, S.; Zhang, C.; Huang, H.; Cui, H.; Li, X.; Wang, J. Research Advances on Seed Dormancy and Germination of Buffalobur (Solanum rostratum). Weed Sci. 2011, 29, 5–9. [Google Scholar] [CrossRef]
  92. Halvorsen, R.; Mazzoni, S.; Bryn, A.; Bakkestuen, V. Opportunities for improved distribution modelling practice via a strict maximum likelihood interpretation of MaxEnt. Ecography 2015, 38, 172–183. [Google Scholar] [CrossRef]
  93. Halvorsen, R.; Mazzoni, S.; Dirksen, J.W.; Næsset, E.; Gobakken, T.; Ohlson, M. How important are choice of model selection method and spatial autocorrelation of presence data for distribution modelling by MaxEnt? Ecol. Model. 2016, 328, 108–118. [Google Scholar] [CrossRef]
  94. Wisz, M.S.; Hijmans, R.J.; Li, J.; Peterson, A.T.; Graham, C.H.; Guisan, A. Effects of sample size on the performance of species distribution models. Divers. Distrib. 2008, 14, 763–773. [Google Scholar] [CrossRef]
  95. Wheeler, D.C. Diagnostic tools and a remedial method for collinearity in geographically weighted regression. Environ. Plan. A 2007, 39, 2464–2481. [Google Scholar] [CrossRef]
  96. Cruz-Cárdenas, G.; López-Mata, L.; Villaseñor, J.L.; Ortiz, E. Potential species distribution modeling and the use of principal component analysis as predictor variables. Rev. Mex. Biodivers. 2014, 85, 189–199. [Google Scholar] [CrossRef]
Figure 1. Spatial distribution of occurrence records of S. rostratum in China.
Remotesensing 16 00271 g001
Figure 2. The technical flow chart of this study.
Remotesensing 16 00271 g002
Figure 3. ROC curves of the Maxent model under various simulation scenarios. (a,b) represent the prediction of current 1 and current 2, respectively; (c,d) depict projections for future 1 from 2021 to 2040 under SSP1-2.6 and SSP5-8.5 scenarios, respectively; (e,f) illustrate future 2 projections for the years 2041–2060 under the SSP1-2.6 and SSP5-8.5 scenarios, respectively.
Remotesensing 16 00271 g003
Figure 4. Areas of the potential habitat suitability of S. rostratum under various simulation scenarios in China.
Remotesensing 16 00271 g004
Figure 5. Map of the potential habitat suitability of S. rostratum under various simulation scenarios in China. (a,b) represent the prediction of current 1 and current 2, respectively; (c,d) depict projections for future 1 from 2021 to 2040 under SSP1-2.6 and SSP5-8.5 scenarios, respectively; (e,f) illustrate future 2 projections for the years 2041–2060 under the SSP1-2.6 and SSP5-8.5 scenarios, respectively.
Remotesensing 16 00271 g005
Figure 6. The contrast map of S. rostratum’s suitable habitat in the present climate scenario (current 1 and current 2). “Increased areas” indicate regions where current 2 identifies suitability for habitation, while current 1 does not. Conversely, “reduced areas” indicate regions that current 1 deems suitable, but are considered unsuitable by current 2.
Remotesensing 16 00271 g006
Figure 7. Alterations in the geometric center’s position within the potential habitat suitability of S. rostratum across multiple simulation scenarios in China. In this figure, various point shapes represent distinct scenarios, and point colors indicate different levels of habitat suitability. The red arrows highlight the directional shift in the geometric center of the S. rostratum habitat suitability.
Remotesensing 16 00271 g007
Figure 8. Impact of humanistic variables on the suitable habitat of S. rostratum. (a) High overlap of current 1 scenario suitable habitat with oases and riverine areas; (b) Distribution map of suitable habitat for S. rostratum under the current 1 scenario in China.
Remotesensing 16 00271 g008
Figure 9. The global distribution of the occurrence records of S. rostratum.
Remotesensing 16 00271 g009
Figure 10. The Discrepancy in S. rostratum’s suitable habitat between current (current 2) and future climate scenarios. (a) 2021–2040, SSP1-2.6; (b) 2021–2040, SSP5-8.5; (c) 2041–2060, SSP1-2.6; (d) 2041–2060, SSP5-8.5; (e) The area different from current 2. “Increased areas” indicate regions where the future predicts suitability, while current 2 does not. Conversely, “reduced areas” represent regions suitable according to current 2 but not in the future scenarios.
Remotesensing 16 00271 g010
Table 1. Data source of environmental variables.
Type Number of FeaturesYearRemarkSource
Climatic variables19Current:1970–2020;
Future:2021–2040,
2041–2060.
19 bioclimatic factorsWorldClim database
(https://www.worldclim.org/ (accessed on 3 August 2023))
Terrain variables3/Elevation, slope, and aspectWorldClim database
(https://www.worldclim.org/ (accessed on 3 August 2023))
Soil variables982010–2018Grid data for various soil properties at different depthsNational Tibetan Plateau Data Center (http://data.tpdc.ac.cn (accessed on 3 August 2023))
Humanistic variables52020GDP, population, distances to roads and water bodies, building densityGDP, population:
Resource and Environmental Science and Data Center (https://www.resdc.cn/Default.aspx (accessed on 3 August 2023))
Roads and water bodies:
OpenStreetMap (https://www.openstreetmap.org (accessed on 3 August 2023)) Building:
Geoservice of the Earth Observation Center (EOC) of the German Aerospace Center (DLR) (https://download.geoservice.dlr.de/WSF2019 (accessed on 3 August 2023))
Spatial variables2/Longitude and latitudeExtracted from Elevation
Table 2. The quantity of new variables derived via PCA across different simulation scenarios.
Simulation ScenarioNumber of Input VariablesNumber of New VariablesPCs Name
current 1 (1970–2020)127 a11pc1, pc2, pc3……, pc11
current 2 (1970–2020)24 b4pc1, pc2, pc3, pc4
future 1
(2021–2040: SSP1-2.6, SSP5-8.5)
24 b4pc1, pc2, pc3, pc4
future 2
(2041–2060: SSP1-2.6, SSP5-8.5)
24 b4pc1, pc2, pc3, pc4
a This means that it contains 19 climate factors + 3 terrain factors + 98 soil factors +5 humanistic factors, + 2 spatial factors and b This means that it contains 19 climate factors + 3 terrain factors + 2 spatial factors.
Table 3. Contribution rates and composition of variable clusters.
Cluster NamesContribution Rate (%)VariablesCluster NamesContribution Rate (%)Variables
C140.99total potassium density, total potassium, total
nitrogen, total nitrogen density, total phosphorus, total phosphorus density
C78.80soil organic carbon, soil organic carbon density
C212.70coarse fragment content, sand (0.05–2 mm)C82.15cation exchange capacity
C37.08pHC92.05geographical longitude, geographical latitude
C47.14bio3, bio6, bio11, bio12, bio13, bio15, bio16, bio18C101.27distance from building ups, gross domestic
product (GDP) within grid, population count within each grid cell (1 square kilometer)
C54.53bio4, bio5, bio7, bio10C111.06elevation, aspect, slope
C64.12bulk density, thickness
Bio refers to bioclimatic variables; Soil variables encompass C1, C2, C3, C6, C7, and C8; Climate variables comprise C4 and C5; Spatial variables are represented by C9; Humanistic variables are included in C10.
Table 4. Influence of various environmental variables on model prediction accuracy.
IDThe Types of Input Environmental VariablesTraining AUCTest AUCMean AUCRemark
1A+B+C+D+E0.9500.9800.941current 1
2A+B+D+E0.9430.8950.934
3A+B+E0.9340.9290.925current 2
4A+B+C+E0.9440.9560.935
5B+C+D+E0.9480.9710.933
6A+B+C+D0.9450.9390.934
A: Climatic variables; B: Terrain variables; C: Soil variables; D: Humanistic variables; E: Spatial variables. Training AUC and Test AUC represent the AUC values acquired in the tenth model run. Mean AUC signifies the average AUC value obtained after conducting ten consecutive model runs.
Table 5. Impact of environmental variable decorrelation methods on model accuracy.
IDMethodNumber of input VariablesNumber of Variables
after Decorrelation
Training AUCTest AUCMean AUCRemark
1PCA127110.9500.9800.941/
2Spearman Correlation127730.8110.8740.7630.75 [29]
3700.8970.9110.8610.6
4620.8890.9470.8660.4
The values 0.6 and 0.4 in the footnote respectively denote the correlation coefficient thresholds employed in the decorrelation of environmental variables; Training AUC and Test AUC are the AUC values obtained during the tenth run of the model; mean AUC is the average AUC value obtained after the model has been run consecutively ten times.
Disclaimer/Publisher’s Note: The statements, opinions and data contained in all publications are solely those of the individual author(s) and contributor(s) and not of MDPI and/or the editor(s). MDPI and/or the editor(s) disclaim responsibility for any injury to people or property resulting from any ideas, methods, instructions or products referred to in the content.

