Article

Water Quality and Flooding Impact of the Record-Breaking Storm Gloria in the Ebro Delta (Western Mediterranean)

Institute of Marine Sciences of Andalusia (ICMAN), Spanish National Research Council (CSIC), Campus Universitario Río San Pedro s/n, 11519 Puerto Real, Spain
*
Author to whom correspondence should be addressed.
Remote Sens. 2024, 16(1), 41; https://doi.org/10.3390/rs16010041
Submission received: 13 November 2023 / Revised: 14 December 2023 / Accepted: 19 December 2023 / Published: 21 December 2023
(This article belongs to the Special Issue Advances in Remote Sensing Applications in Natural Hazards Research)

Abstract

:
Extreme events are increasing in frequency and severity due to climate change, making the littoral zone even more vulnerable and requiring continuous monitoring for its optimized management. The low-lying Ebro Delta ecosystem, located in the NW Mediterranean, was subject to Storm Gloria in the winter of 2020, the most severe coastal storm registered in the area in decades and one of the most intense ever recorded in the Mediterranean. This event caused intense rainfall, severe flooding, the erosion of beaches, and the destruction of coastal infrastructures. In this study, the Landsat-8 and Sentinel-2 satellites were used to monitor the flooding impact and water quality status, including chlorophyll-a, suspended particulate matter, and turbidity, to evaluate the pre-, syn-, and post-storm scenarios. Image processing was carried out using the ACOLITE software and the on-the-cloud Google Earth Engine platform for the water quality and flood mapping, respectively, showing a consistent performance for both satellites. This cost-effective methodology allowed us to characterize the main water quality variation in the coastal environment during the storm and detect a higher flooding impact compared to the one registered three days later by the Copernicus Emergency Service for the same area. Moreover, the time series revealed how the detrimental impact on the water quality and turbidity conditions was restored two weeks after the extreme weather event. While transitional plumes of sediment discharge were formed, no phytoplankton blooms appeared during the study period in the delta. These results demonstrate that the workflow implemented is suitable for monitoring extreme coastal events using open satellite imagery at 10–30 m spatial resolution, thus providing valuable information for early warning to facilitate timely assistance and hazard impact evaluation. The integration of these tools into ecological disaster management can significantly improve current monitoring strategies, supporting decision-makers from the local to the national level in prevention, adaptation measures, and damage compensation.

Graphical Abstract

1. Introduction

Human activities and development have had a significant impact on global climate change, which poses a significant risk to vulnerable regions like coastal marine systems. These areas are home to a large portion of the population [1], and hold great socioeconomic and ecological value [2]. The success of activities such as aquaculture and fisheries, which rely on the quality of the surrounding waters, is heavily influenced by changes in inherent oceanic variables, such as water temperature, hydrodynamics, pollution, and the presence of non-native species [3,4]. For instance, events like marine heat waves (MHWs), characterized by prolonged periods of anomalously warm water temperatures, can cause substantial harm to marine ecosystems. These events are becoming more frequent and intense due to climate change [5,6,7]. Consequently, MHWs and storms can result in the mass mortality of marine life and lead to coastal erosion and flooding.
In January 2020, Storm Gloria, which started in the North Atlantic as a small disturbance, had a significant impact on the Balearic Islands and the entire Spanish Mediterranean coast, mainly in Ebro Delta (Figure 1). Between January 19 and 24, the entire eastern part of the Iberian Peninsula experienced heavy rainfall, and along the entire Mediterranean coast there was a succession of strong winds, a notable sea level rise, strong currents, and extreme waves [8]. Figure 1f,g show the historical precipitation data of the Tortosa meteorological station (Baix Ebre, Tarragona, Spain), highlighting the maximum rainfall during Storm Gloria. All this had a severe impact on the coast, with a significant retreat of the beaches, particularly those open to the sea. There was also notable flooding [9] that affected coastal infrastructures and natural formations (Figure 1b–e), particularly those open to the east and northeast [10]. Storm Gloria caused severe damage to marine aquaculture activities along the Mediterranean coast, resulting in a high loss of production. Furthermore, all fishing activity was halted during the week of the storm, followed by another week of difficulties in carrying out fishing activities [8].
The Copernicus Emergency Management Service (CEMS) Rapid Mapping was activated (EMSR422) on 23 January 2020, following the request of the Spanish General Directorate for Civil Protection and Emergencies (CENEM), to support the emergency response during the flooding (EMSR422). Storm Gloria caused extensive damage in Catalonia, due to flooding and strong winds, affecting people and infrastructure. Copernicus EMS Rapid Mapping was requested to map the extent of the floods on the 23 and 24 January 2020. The analysis made use of both radar and optical satellite data, depending on the availability of suitable imagery. This disaster has underscored the vital role of satellite-based research in ensuring our overall welfare. Nonetheless, it is worth noting that the environmental consequences of flooding on marine ecosystems often receive considerably less focus compared to the socio-economic or terrestrial impacts.
Various methods and platforms are employed to monitor the oceans. The use of in situ data collected from oceanographic instruments permits the observation of the ocean’s conditions, the analysis of its circulation patterns, and the creation of early warning systems [11,12,13]. Oceanic numerical models enable the parameterization of the present and future states of ocean variables [14,15]. Remote sensing techniques, including satellite observations and unmanned aerial vehicles (UAVs), provide the means to observe and measure a wide range of ocean variables, such as ocean currents (sea surface height), Sea Surface Temperature (SST), and phytoplankton abundance (ocean color). Integrating data from these diverse ocean observation technologies allows for the creation of improved global ocean datasets and deepens our understanding of the ocean environment and extreme marine events.
In particular, the low-lying Ebro Delta ecosystem was subject to Storm Gloria. Patterns in the delta showed scales of hundreds of meters that are limited to being detected with standard ocean color sensors at a moderate spatial resolution of 300 m, such as that of Sentinel-3 (Figure 2a), rather than the high-resolution data of Sentinel-2 at 10 m (Figure 2b). The impact on the chlorophyll-a (Chl-a) concentration during these short-term periods, such as wind episodes, remains unexplored, most likely due to the lack of spatiotemporal data resolution [16]. Over the past few years, multiple research efforts have underscored the importance of utilizing enhanced spatial and temporal resolutions, particularly with Landsat-8 (L8) and/or Sentinel-2 (S2) satellites, for a more thorough assessment of ecological conditions in diverse coastal regions and the influence of land-based water inputs using remote sensing technologies [17,18,19,20]. Prior research has already pointed out the necessity for finer spatial resolution to effectively analyze intricate characteristics at the interface between land and ocean [21]. Certainly, L8 and S2 missions, despite their original design not being centered on ocean monitoring, have emerged as vital instruments for the intricate mapping of highly dynamic settings, like coastal and inland water regions. Furthermore, sunglint and atmospheric correction models are essential to empower the user community in leveraging coastal products and conducting a comprehensive analysis of ecological conditions through remote sensing technologies.
Therefore, the aim of this study was to develop an accurate multi-sensor strategy for Landsat-8 and Sentinel-2 imagery in the Ebro Delta to detect in detail the spatiotemporal fluctuations of the biogeochemical parameters of relevance, turbidity, suspended particulate matter, and Chl-a, using the multi-sensor approach during the study period January–February 2020. In addition, we also mapped the flooding impact in the delta during and after the catastrophic storm using the on-the-cloud Google Earth Engine platform. This combined information is expected to support the enhanced monitoring, identification of critical zones using satellite products in the context of the latest flooding event, and predictability of the water masses. These tools can be applied in parallel to regular in situ sampling campaigns to evaluate the detrimental effects of extreme events over the vulnerable delta system.

2. Methods

2.1. Satellite Imagery: Landsat-8 and Sentinel-2

The comprehensive mapping of the delta made use of the Sentinel-2 (S2) twin mission due to its open data access policy and high spatial resolution (ranging from 10 to 60 m). This optical constellation was developed by the European Commission and the European Space Agency (ESA) as part of the European Union’s Copernicus program to meet operational requirements. Sentinel-2 is a multi-spectral imaging platform with wide swath coverage, primarily used for monitoring land surfaces, vegetation, and soil. It also plays a crucial role in Copernicus’ water monitoring efforts, focusing on coastal regions and inland waterways. This mission consists of two identical satellites with a global revisit frequency of five days. The ESA User Handbook details the temporal, spectral, spatial, and radiometric characteristics of the visible and near-infrared (NIR) bands for both the S2A and S2B satellites [22], with two-pixel accuracy at 20 m for the absolute geolocation [23]. Images covering the Ebro Delta (zone 31N and tile TCF) in January and February 2020 were acquired from the ONDA DIAS platform. These products were top-of-atmosphere (TOA) datasets at Level-1C (L1C), following geometric and radiometric corrections.
Moreover, Landsat-8 (L8) visible and NIR spectral imagery, freely available from the U.S. Department of the Interior Geological Survey (USGS) and the National Aeronautics and Space Administration (NASA), were used for mapping. Level 1 data were downloaded from Earth Explorer, orthorectified and terrain-corrected at a 30 m spatial resolution, during January–February 2020. The revisit frequency for L8 is 16 days [24,25]. Specifically, the region of interest was covered by tiles located in paths 198 and row 32 (acquisition time approximately 10:30 UTC), with a focus on selecting data acquired under clear-sky conditions to mitigate cloud-related effects. A filtering process was applied to ensure low cloud coverage (<40%) over the Ebro Delta for subsequent scene analysis. Table 1 provides information on the acquisition dates, with a total of 15 scenes processed during the study period, including 12 from S2 and 3 from L8.

2.2. Water Quality Monitoring

To retrieve water quality variables, Level-2 products at the bottom of the atmosphere (BOA) were generated with one of the most common atmospheric correction software used (ACOLITE 20220222.0), an image-based model which supports L8 and S2 satellite pre-processing. This free toolbox was developed by the Royal Belgian Institute of Natural Sciences (RBINS) to correct Level-1 to Level-2 data products over inland, coastal, and marine waters [26]. The Dark Spectrum Fitting (DSF) atmospheric correction algorithm was applied [27,28]. To address the issue of sunglint interference in surface reflectance, an image-based sunglint correction method was applied, as acute sunglint disturbances were observed at these latitudes during the study period. Remote sensing reflectance (Rrs) products across the visible and near-infrared (NIR) spectrum were then calculated after resampling to 10 m and 30 m pixel size for S2 and L8, respectively.
The standard products used for monitoring the biogeochemical conditions in the Ebro Delta with S2 and L8 satellites consisted of seawater turbidity (Formazin Nephelometric Unit, FNU), suspended particulate matter (SPM in g/m3), and chlorophyll-a (chl-a in mg/m3). We selected these parameters in accordance with the requirements of the EU Water Framework Directive (WFD) and the EU Marine Strategy Framework Directive (MSFD) to assess the ecological health of coastal waters. To estimate turbidity and SPM, we applied Nechad’s semi-analytical algorithm, which utilizes the red band (Rrs 665 nm), with both satellite systems [29]. This model has already been validated in different environments [30,31,32,33]. One of the advantages of the semi-analytical algorithms is that they allow for a more global performance since they are based on the inherent optical properties of the seawater. In addition, the commonly used Normalized Difference Chlorophyll Index (NDCI; see details in Mishra & Mishra, 2012) [34] algorithm was applied to calculate the concentration of seawater chl-a for S2. We proposed this model since the latest research in the Ebro Delta already indicated its accurate performance after a chl-a validation exercise in the Ebro bays [35]. The NDCI model was implemented to predict chl-a concentration from remote sensing data in estuarine and coastal turbid productive (case 2) waters, as this corresponds to the Ebro Delta after Storm Gloria (Figure 2). Turbidity, SPM, and chl-a maps were at 30 m and 10 m spatial resolution for L8 and S2, respectively, with the production of the final water quality maps 4–5 h following image acquisition (see Figure 3 for the image processing workflow). Error assessment of Rrs is reported for S2 and L8 images captured on 22 February 2020 with different metrics such as the mean absolute error (MAE), median absolute error (MedAE), and bias:
M A E = 1 N i = 1 , N Σ | S i O i |
B i a s = 1 N i = 1 , N Σ ( S i O i )
MedAE = median (|Si − Oi|,…,|SN − ON|)
where N is the number of total number of observations, i denotes the ith observation, S and O are the satellite and observed values, respectively.

2.3. Flooding Mapping

The Google Earth Engine (GEE) platform was used to process S2 imagery between January and February 2020 (Table 1) due to its on-the-cloud computational capacity to obtain flood maps. The dataset used corresponds to the atmospherically corrected S2 Level-2A (L2A) data, available in GEE as “COPERNICUS/S2_SR”. Using the JavaScript Code Editor interface in GEE, the Normalized Difference Water Index (NDWI) was applied to all the images using a 0.1 threshold to obtain the historical flood map series in the Ebro Delta before and after the extreme event, which was exported to Google Drive (script available here: https://code.earthengine.google.com/f0dc47c78c5b37d3022eabea4da1454a, accessed on 5 February 2022). After downloading the processed scenes, an image visualization design was performed in ArcGIS Pro 3.0 (Figure 3).
To quantify the flooded areas as a result of the storm, further GIS processing was performed for the two S2 images right before and after the event (16 and 23 January 2020). Firstly, both raster were converted to polygon features, and the ocean extension was clipped to exclude it. The resulting geometries were edited, deleting irrigation ponds and other permanent flooded areas, following the Copernicus Emergency criteria, to be able to compare these maps with their results. Secondly, the quantification of geometric areas was performed for those polygons, being referenced to Datum ETRS89 UTM31N (EPSG: 25831), and obtaining the flooded areas before and after Storm Gloria in hectares (ha).

3. Results

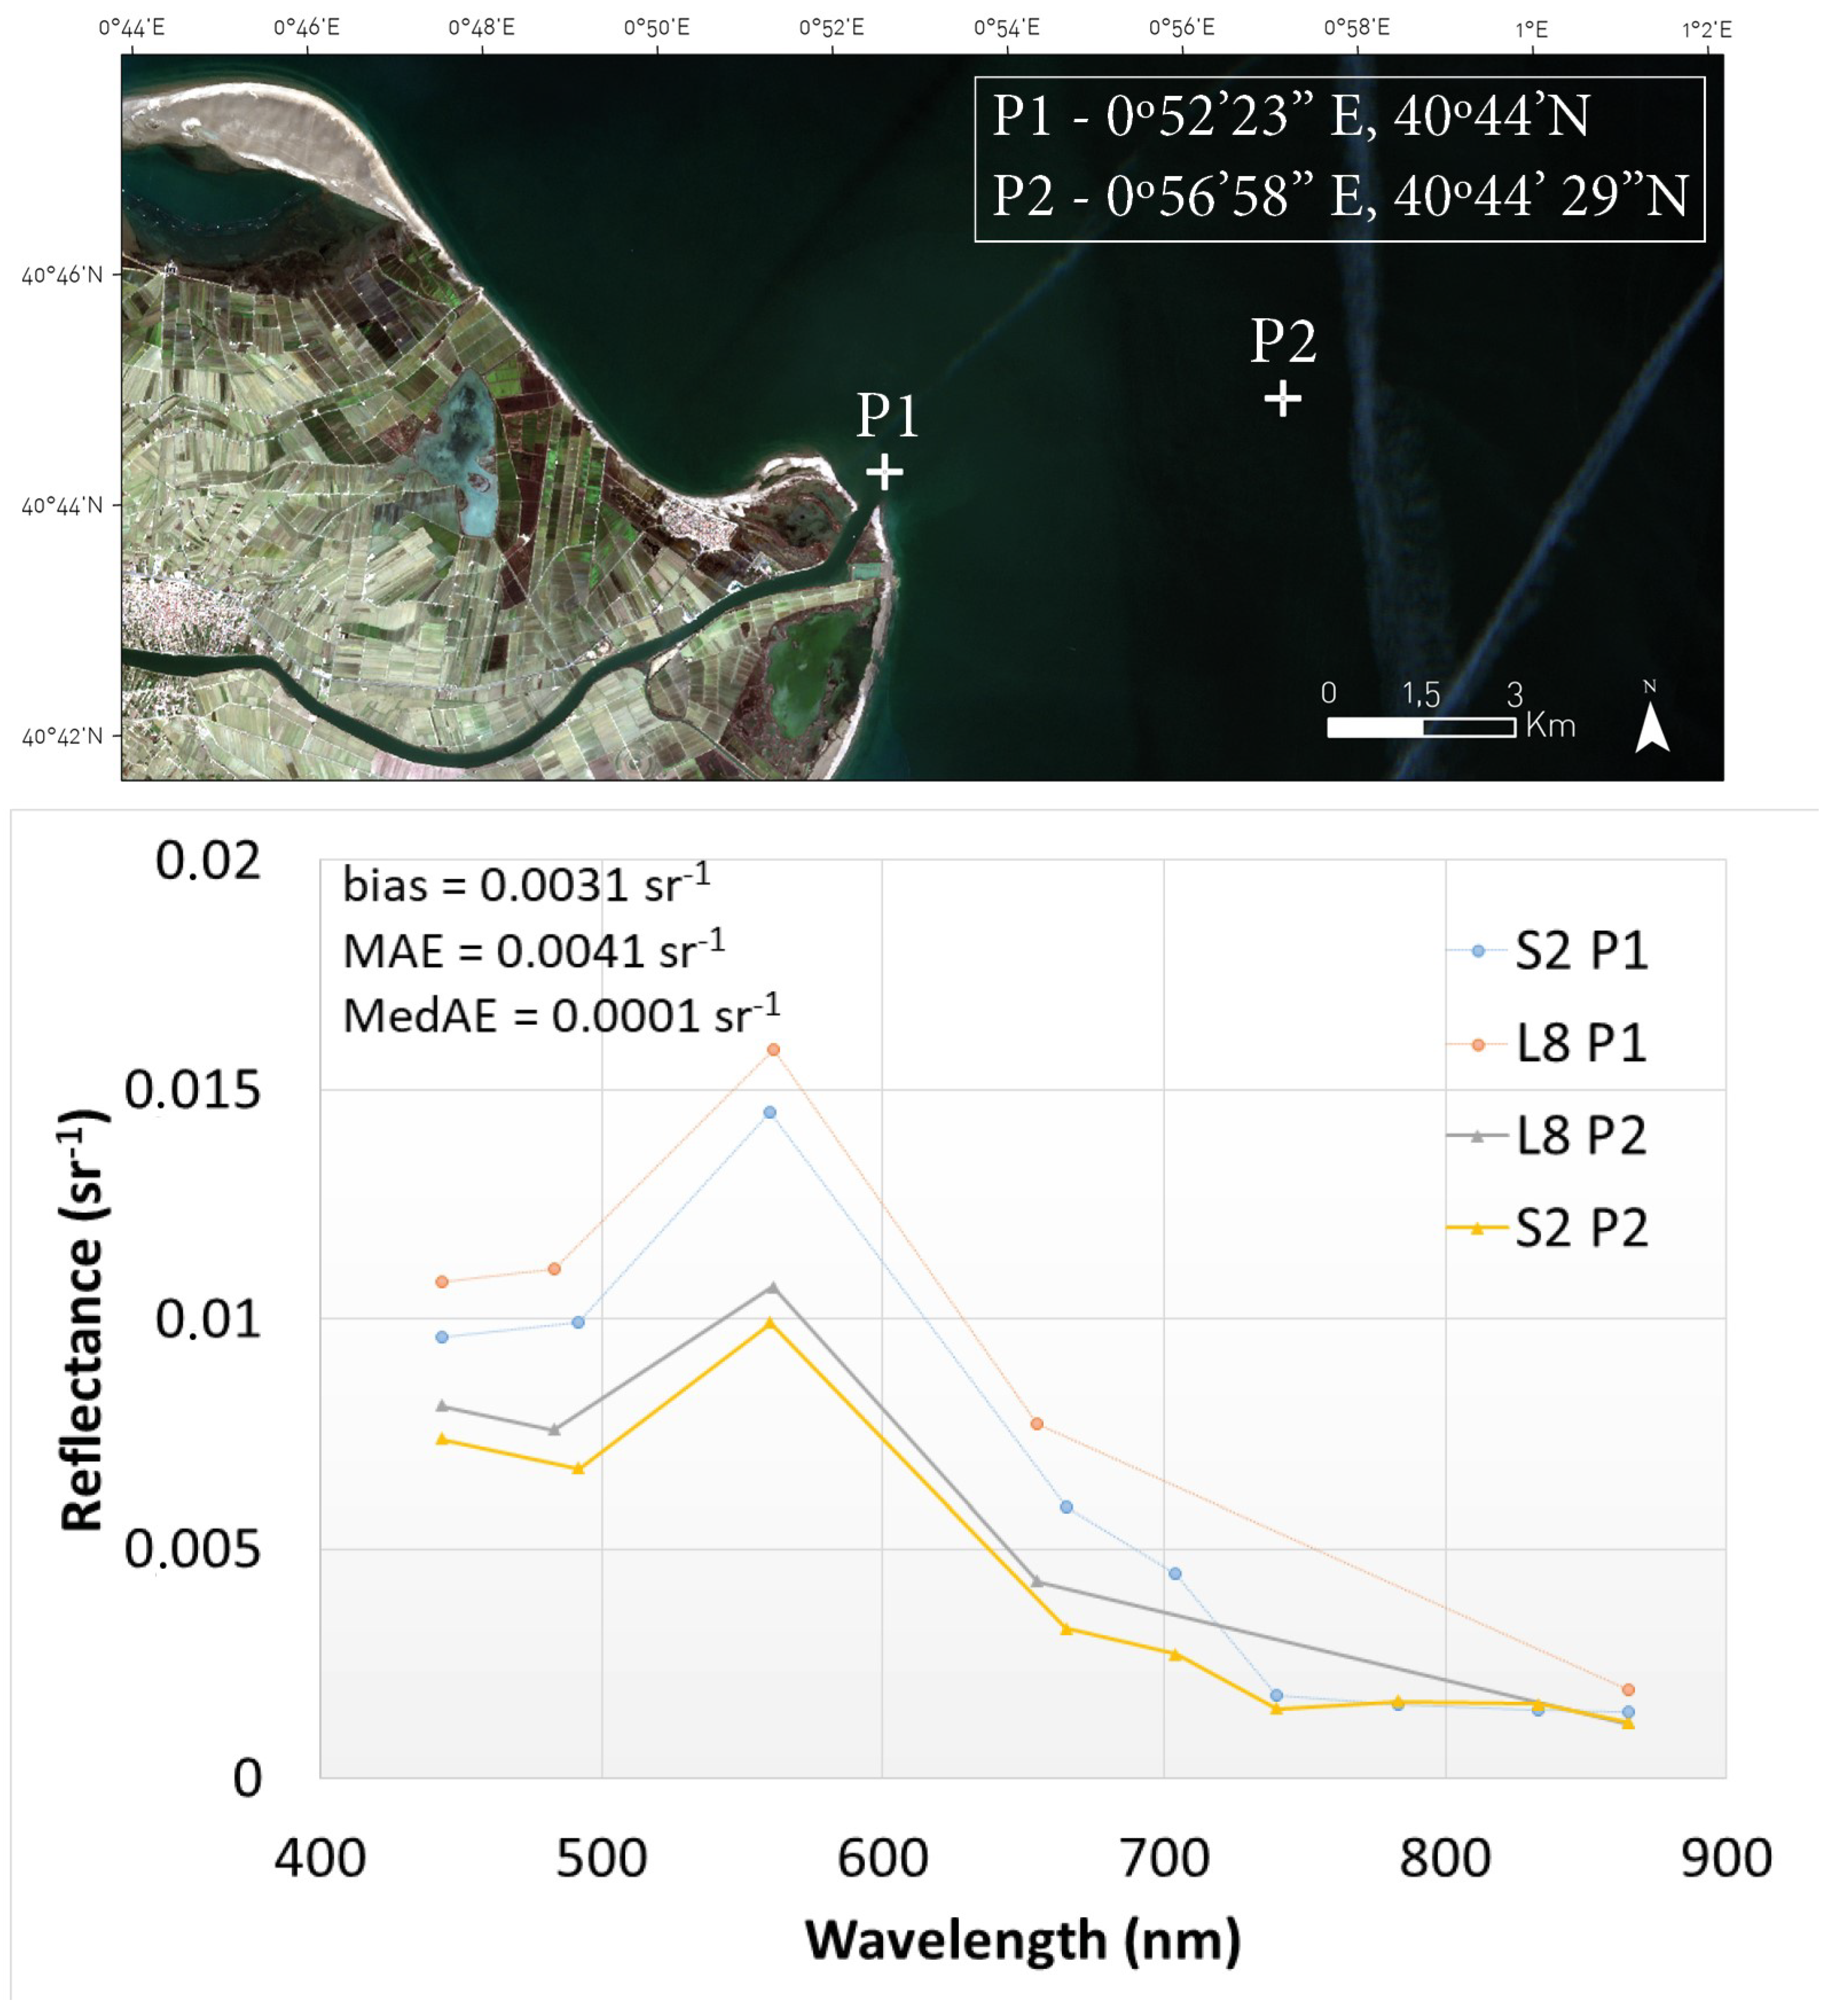
3.1. Multi-Sensor Approach: Landsat-8 and Sentinel-2 Satellites

During the study period from January to February 2020, 15 cloud-free images were downloaded and processed to characterize the spatiotemporal distribution of the water masses (Table 1). When the S2 and L8 products are combined, the average revisit time in the Ebro Delta is four days. The availability of the pre-, syn-, and post-storm satellite products allowed us to map and detect variations in the coastal and marine environment. On 22 February, L8 and S2 acquired a scene at 10:37 a.m. and 10:49 a.m. GMT, respectively. Figure 4 shows the spectral signal of both satellites with only ~12 min time difference over two control points adjacent to the Delta River mouth. The spectrum signature is similar for both satellites, whereas L8 retrieved slightly higher Rrs compared to S2. The error assessment of the S2 and L8 Rrs over the visible and NIR bands on that day yielded a bias of 0.0031 sr−1, MAE of 0.0041 sr−1, and MedAE of 0.0001 sr−1. This example exhibits the consistent performance of ACOLITE for both satellite missions over low to moderate sunglint conditions, retrieving the spectrum with similar Rrs, further corroborating the remarkable value of combined products. Lahet et al. [36,37] collected experimental data and evaluated a coastal waters color classification method of the Ebro River plume from spectral reflectance during two periods of non-bloom conditions and low suspended load, retrieving spectra values similar to this study (Figure 4). However, over inland waters, the deterioration of the data quality of the meter-scale spatial resolution optical satellite images such as Sentinel-2 due to mixed pixels and adjacency effects can be more pronounced.
Recent studies have already illustrated ACOLITE’s capability to offer reliable data for applications in aquatic and marine environments, notably in the Ebro Delta [35]. Pahlevan et al. [17,38,39] emphasized the urgent need for improved data to map the water quality in inland and coastal regions, particularly to assess variations in spatial and spectral characteristics under different atmospheric and aquatic conditions, as demonstrated in their research. It is imperative to establish an additional data archive to ensure the thorough monitoring of the Ebro Delta and the neighboring coastal areas, with both satellite platforms working in tandem.

3.2. Water Quality Monitoring

3.2.1. Turbidity and Suspended Particulate Matter

Figure 5 shows the S2 image-derived maps for turbidity before (16 January 2020) and after (23 January 2020) the passage of Storm Gloria, respectively, on the Ebro Delta. Heavy rainfall occurred during the storm’s landfall, as can be observed in Figure 1 and Figure 2. Generally, the mean turbidity was lower than 3 FNU in the delta and adjacent waters before the storm compared to the levels on 23 January, indicating a higher mean turbidity of ~30 FNU and reaching maximum values of ~100 FNU along the northern coastal strip of the delta. The extreme turbidity can be observed in the RBG scene on 23rd January (Figure 2b), with a turbid plume appearing close to the land just where the Delta River watercourse flows into the Mediterranean Sea. The seasonal cycle was occasionally disrupted by the intense winter storm, resulting in strong inputs of terrestrial discharges into the entire delta, as highlighted in the temporal series of turbidity (FNU) imagery during January and February 2020 (Figure 6). The high resuspension of materials can also be observed in the SPM maps (Figure 6), with mean values of ~5 g/m3 and 50 g/m3 on the days prior to and after the storm, respectively, with peaked SPM generally along the coastal region in the northern part, as shown in the S2 and L8 time series maps. After this event, the ecosystem equilibrium slightly recovered during February 2020 as can be observed in the decay of the turbidity and SPM retrievals. However, the Ebro River continued to discharge to the eastern section of the delta indicating increased surface runoff and rising turbidity levels, where a plume was visible close to the mouth. The maps corresponding to 17th and 22nd February 2020 presented minimum turbidity levels (<3 FNU), with lower suspended materials ~5 g/m3 in front of the delta. This indicates that the water quality was restored to pre-Storm Gloria conditions. Interestingly, the maximum turbidity levels across the control site were associated with the drainage of the Ebro River, indicating the impact of the discharge and the hydrological inputs.
The semi-analytical turbidity and SPM models used in this study were already validated in different regions worldwide with accurate performance [30,31,32,40]. These methodologies represent reliable and accepted approaches for evaluating suspended materials or turbidity, making a meaningful contribution to enhanced worldwide accuracy and performance [29,41]. It is interesting to remark that on 23 January 2020, SPM pixels close to the delta were masked out due to the saturation of Nechad’s semi-analytical algorithm, corrected for atmospheric effects (Figure 6b), which utilizes the red band (Rrs 665 nm), whereas the turbidity map displayed data over that area with peaked turbidity levels (Figure 6a). Further investigation will be focused on evaluating the SPM model with longer bands such as the red-edge bands (Rrs 704 nm and Rrs 740 nm) and its validation with in situ data. Lahet et al. [37] collected experimental data in the coastal waters of the Ebro River plume during two periods of low suspended load retrieving SPM levels, usually <5 g/m3, similar to our results before the winter storm (Figure 6b). In contrast, other researchers evaluated the water sediment fluxes on the Ebro Delta shoreface during typical high-energy conditions and high river discharges [42], demonstrating that for periods following storm impacts, mean turbidity values can reach ~40 FNU, as exhibited in this study (Figure 5 and Figure 6a). Though punctuated by years of enhanced precipitation and discharge, during the last century, the Ebro has shown a net decline in the volume of water released to the Mediterranean Sea [43,44], probably related to the intense damming [45]. Since high flow rates are very rare in the delta, situations favorable to suspended sediment fluxes across the Ebro shelf are quite scarce [46]. Turbidity typically diminishes as one moves towards the seaward area of the delta. However, extreme occurrences like storms have the potential to raise turbidity levels by ten to twenty times, significantly modifying the water quality distribution within the system, as noted in this study. Specifically, during storm events, turbidity levels can experience a surge, exceeding a factor of several-fold, thereby affecting the ecological conditions of deltas or coastal lagoons, as already demonstrated in a coastal lagoon located south of the Ebro Delta [47]. The recovery of the typical conditions after these events can generally take longer than in this case [42].
A zoom over the delta on 23 February 2020 corresponding to the river mouth showed the spatial distribution of the turbidity features (Figure 2), thus requiring detailed spatial resolution to resolve those patterns. The complex variability of the turbid plume can be noted in all the satellite-derived products located on the Ebro mouth. These patterns are small; thus, monitoring them can be challenging through traditional ocean color sensors at a lower spatial resolution. Prior research has already highlighted the necessity for higher satellite spatial resolution to thoroughly analyze the intricate spatial and temporal characteristics of turbidity patterns in the Ebro Delta and adjacent waters [43,48,49,50]. Seasonal plume variations by the near-coastal features originating from the Ebro delta have been characterized accordingly with moderate-resolution satellite imagery, with main plumes appearing to be larger in winter and smaller in summer [49]. Using Moderate Resolution Imaging Spectroradiometer (MODIS) data, researchers have demonstrated that Ebro River discharge is the main driver of the Ebro plume [51]. That study found that the Ebro plume usually presented a well-developed plume under both low and high discharges, with extension increasing with discharge and where the plume showed a negligible dependence on the tide (micro-tidal regime). Modeling approaches combined with remote sensing were also applied to evaluate the spreading of the plume induced by the freshwater discharge from the Ebro River into northwestern Mediterranean coastal waters [52,53], highlighting that the spreading of the river plume is highly dependent on the driving river discharge. Typically, the Ebro plumes tend to stay near the coastline and do not extend to the continental slope [45], as observed in this study, thanks to the high-resolution information derived from S2 and L8 (Figure 5 and Figure 6).

3.2.2. Chlorophyll-a

The impact of Storm Gloria on the coastal patterns of chl-a was also examined with satellite imagery during different time slots before and after the event in order to identify for coastal and offshore blooms (Figure 7). We used the standard NDCI algorithm to calculate the chl-a concentration, a model already validated in the Ebro Delta with accurate retrievals [16,35] and a feasible solution for chl-a monitoring during high turbidity events [34], as the one evaluated in this study. Before the extreme storm in early January 2020, the chl-a concentration was below 3 mg/m3 in the adjacent waters offshore and over the two bays, indicating good water quality conditions. After the storm, the mean chl-a concentration increased on 23 January to 5–10 mg/m3, with slightly peaked levels located along the coastal fringe and within the bays. The storm brought heavy rainfall, resulting in strong runoff (Figure 1 and Figure 2). During the consecutive days, the inundation of the watersheds and delta washed nutrients and carried sediments from the delta to the bays and coastal area. The chl-a bloom was evaluated in the short term after Storm Gloria in the delta bays, indicating that heavy nutrient loads from storm-water runoff and storm-surge inundation stimulated the chl-a patterns [9]. The chl-a gradually reached normal values during the subsequent days; the lower concentration was evident in the scenes captured in February, indicating that good water quality conditions lasted for several days after the storm surge, similar to the turbidity distribution. No severe phytoplankton blooms appeared during the study period in the adjacent areas. Similar results were recorded with satellite imagery after extreme weather events in other regions [54,55].
Soriano-González et al. [35] evaluated a one-year time series (2017) of chl-a derived by S2, with generally higher chl-a in the delta bays compared to the open sea. They validated the NDCI model in the delta with an accurate performance and an MAE of 0.41 mg/m3. The differences among the seasonal patterns of the phytoplankton variability in the delta could be attributed to the residence times and the hydrological control of phytoplankton abundance and composition [56]. The analysis of the in situ measurements to characterize the nutrient patterns indicated that the waters of the Ebro River arrive with high concentrations of nutrients [57]. The phytoplankton biomass is enhanced by local nutrient inputs of continental origin, especially those related to the Ebro River [58]. Medium Resolution Imaging Spectrometer (MERIS) satellite images at 300 m spatial resolution combined with the in situ measurements of water were used in the Ebro Delta to assess phytoplankton dynamics [53]. The impact from a short-term response of the chl-a concentration due to intense wind and freshwater peak episodes in the Ebro Delta remains unexplored due to the lack of a detailed data resolution [16]. From an operational point of view, these findings have important implications, as future sampling designs need to take the spatiotemporal variability of the water quality parameters into account [59].

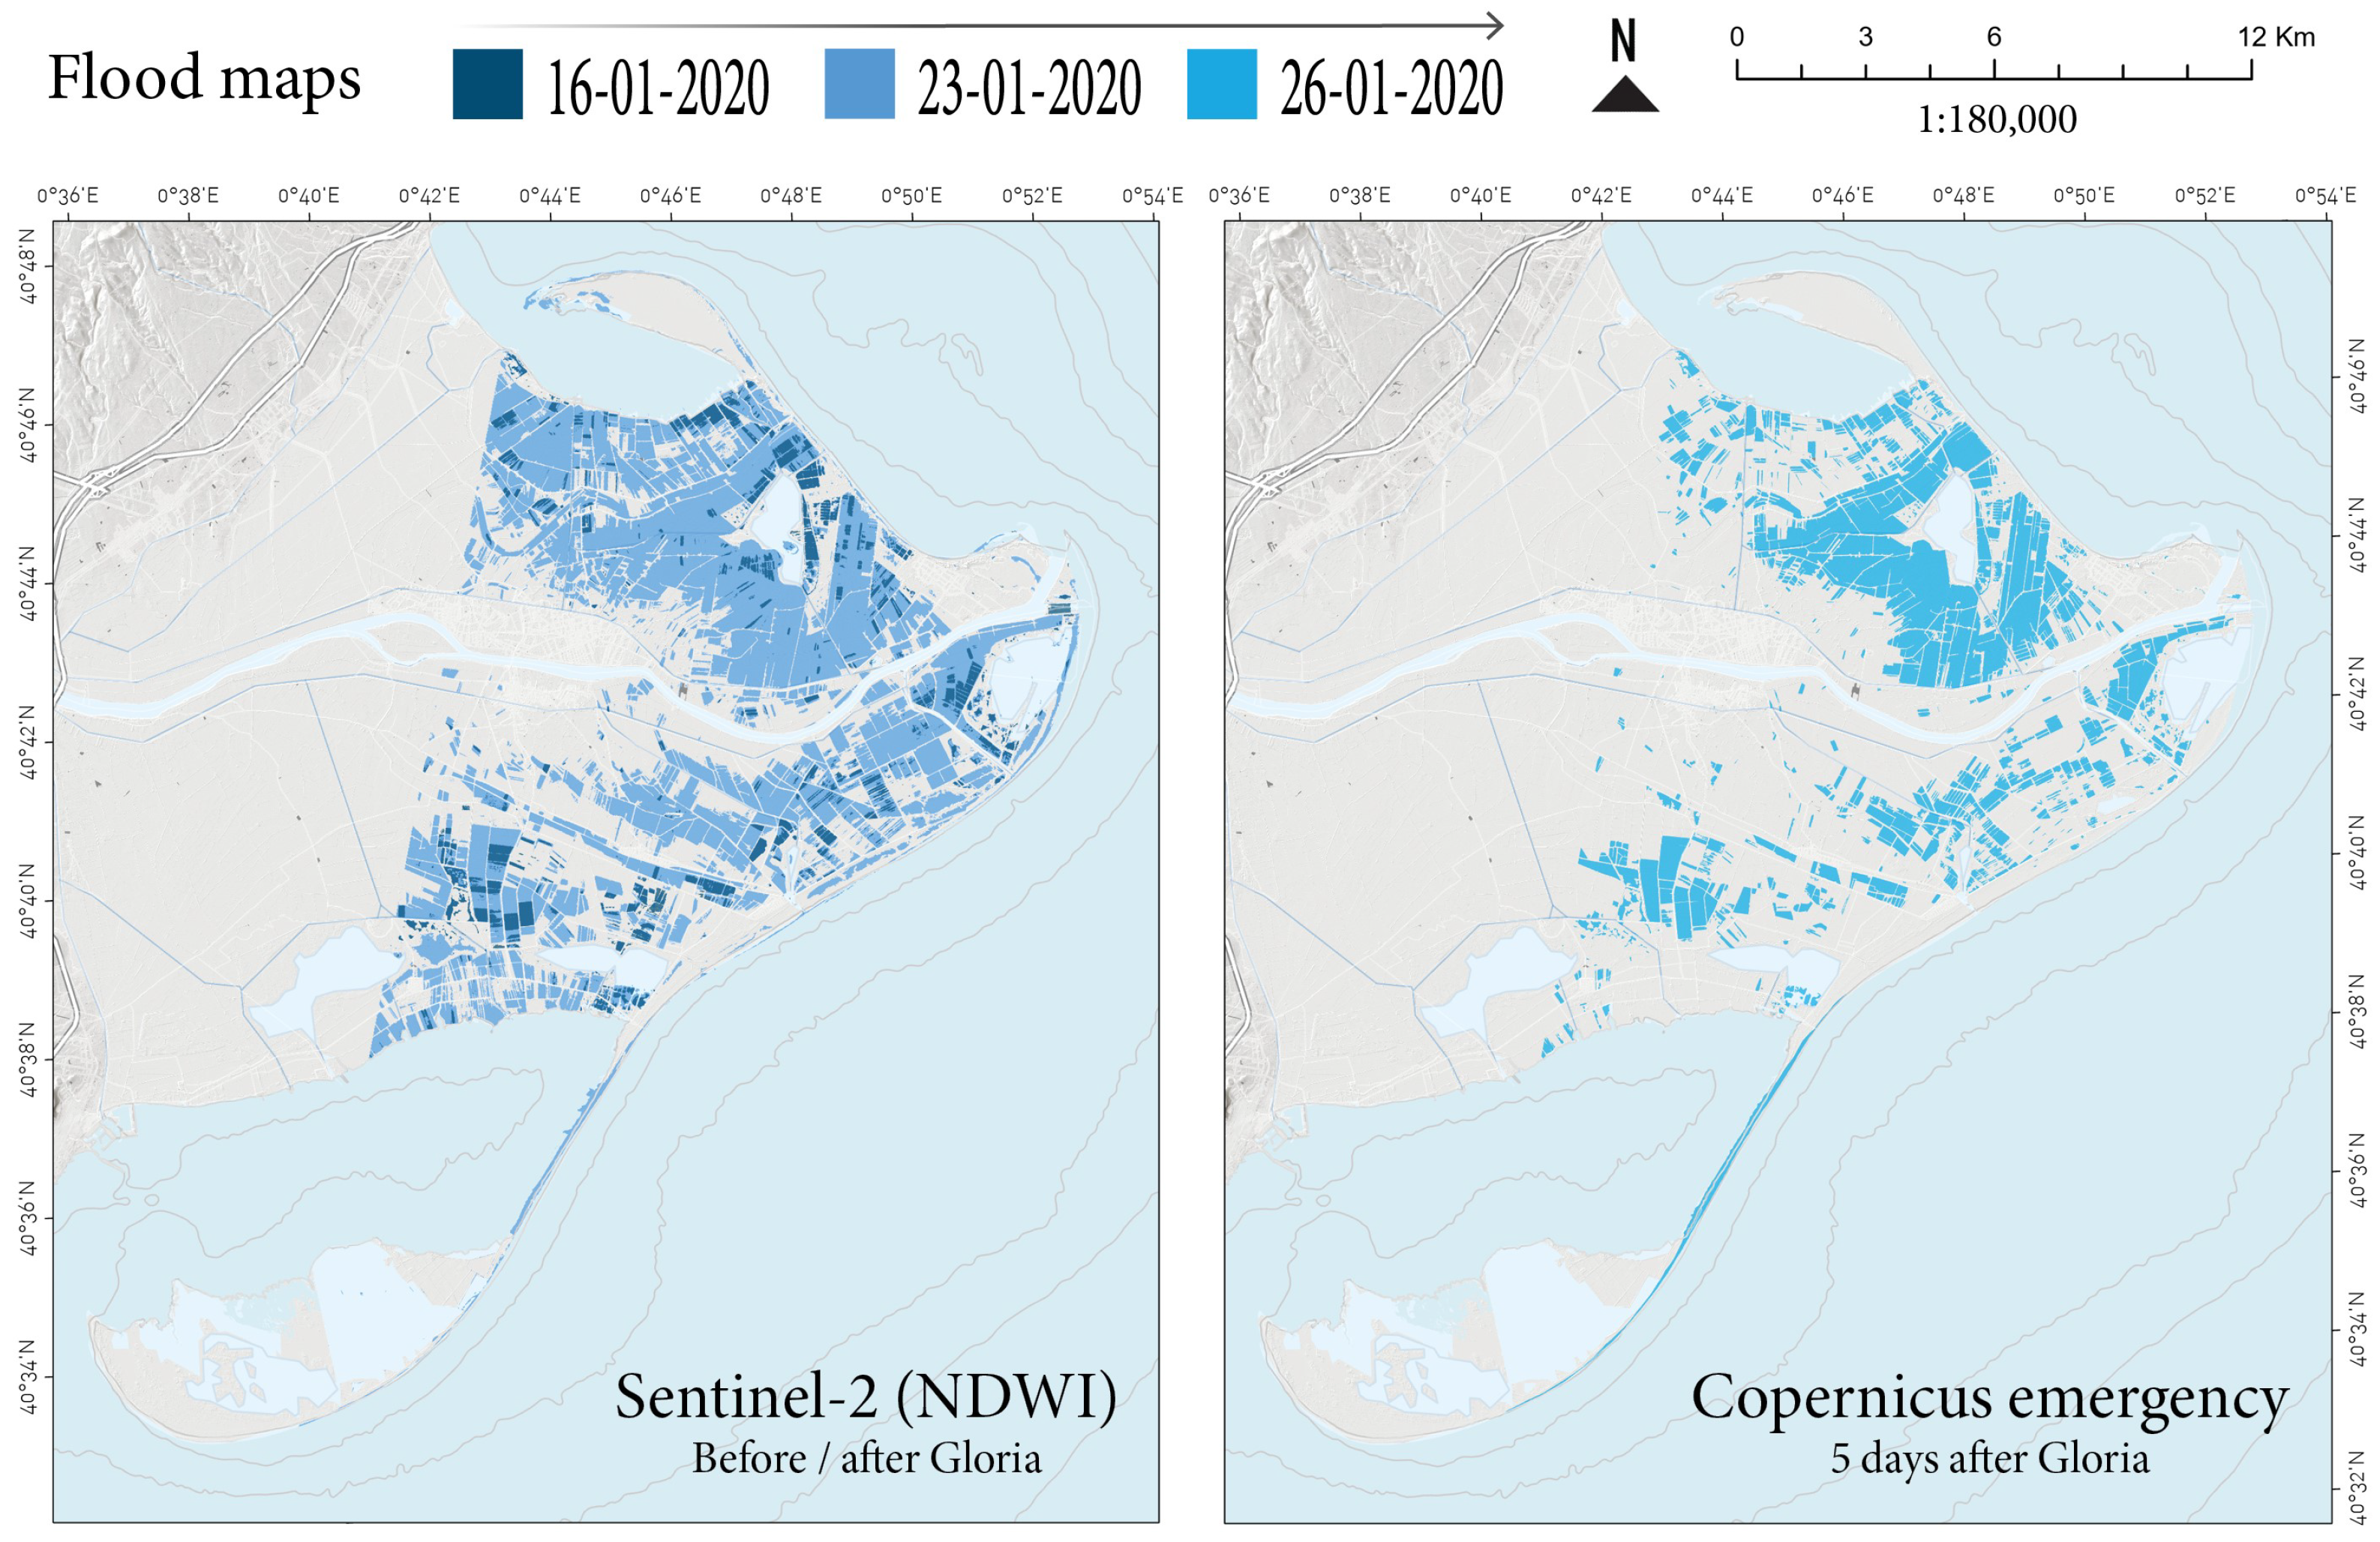
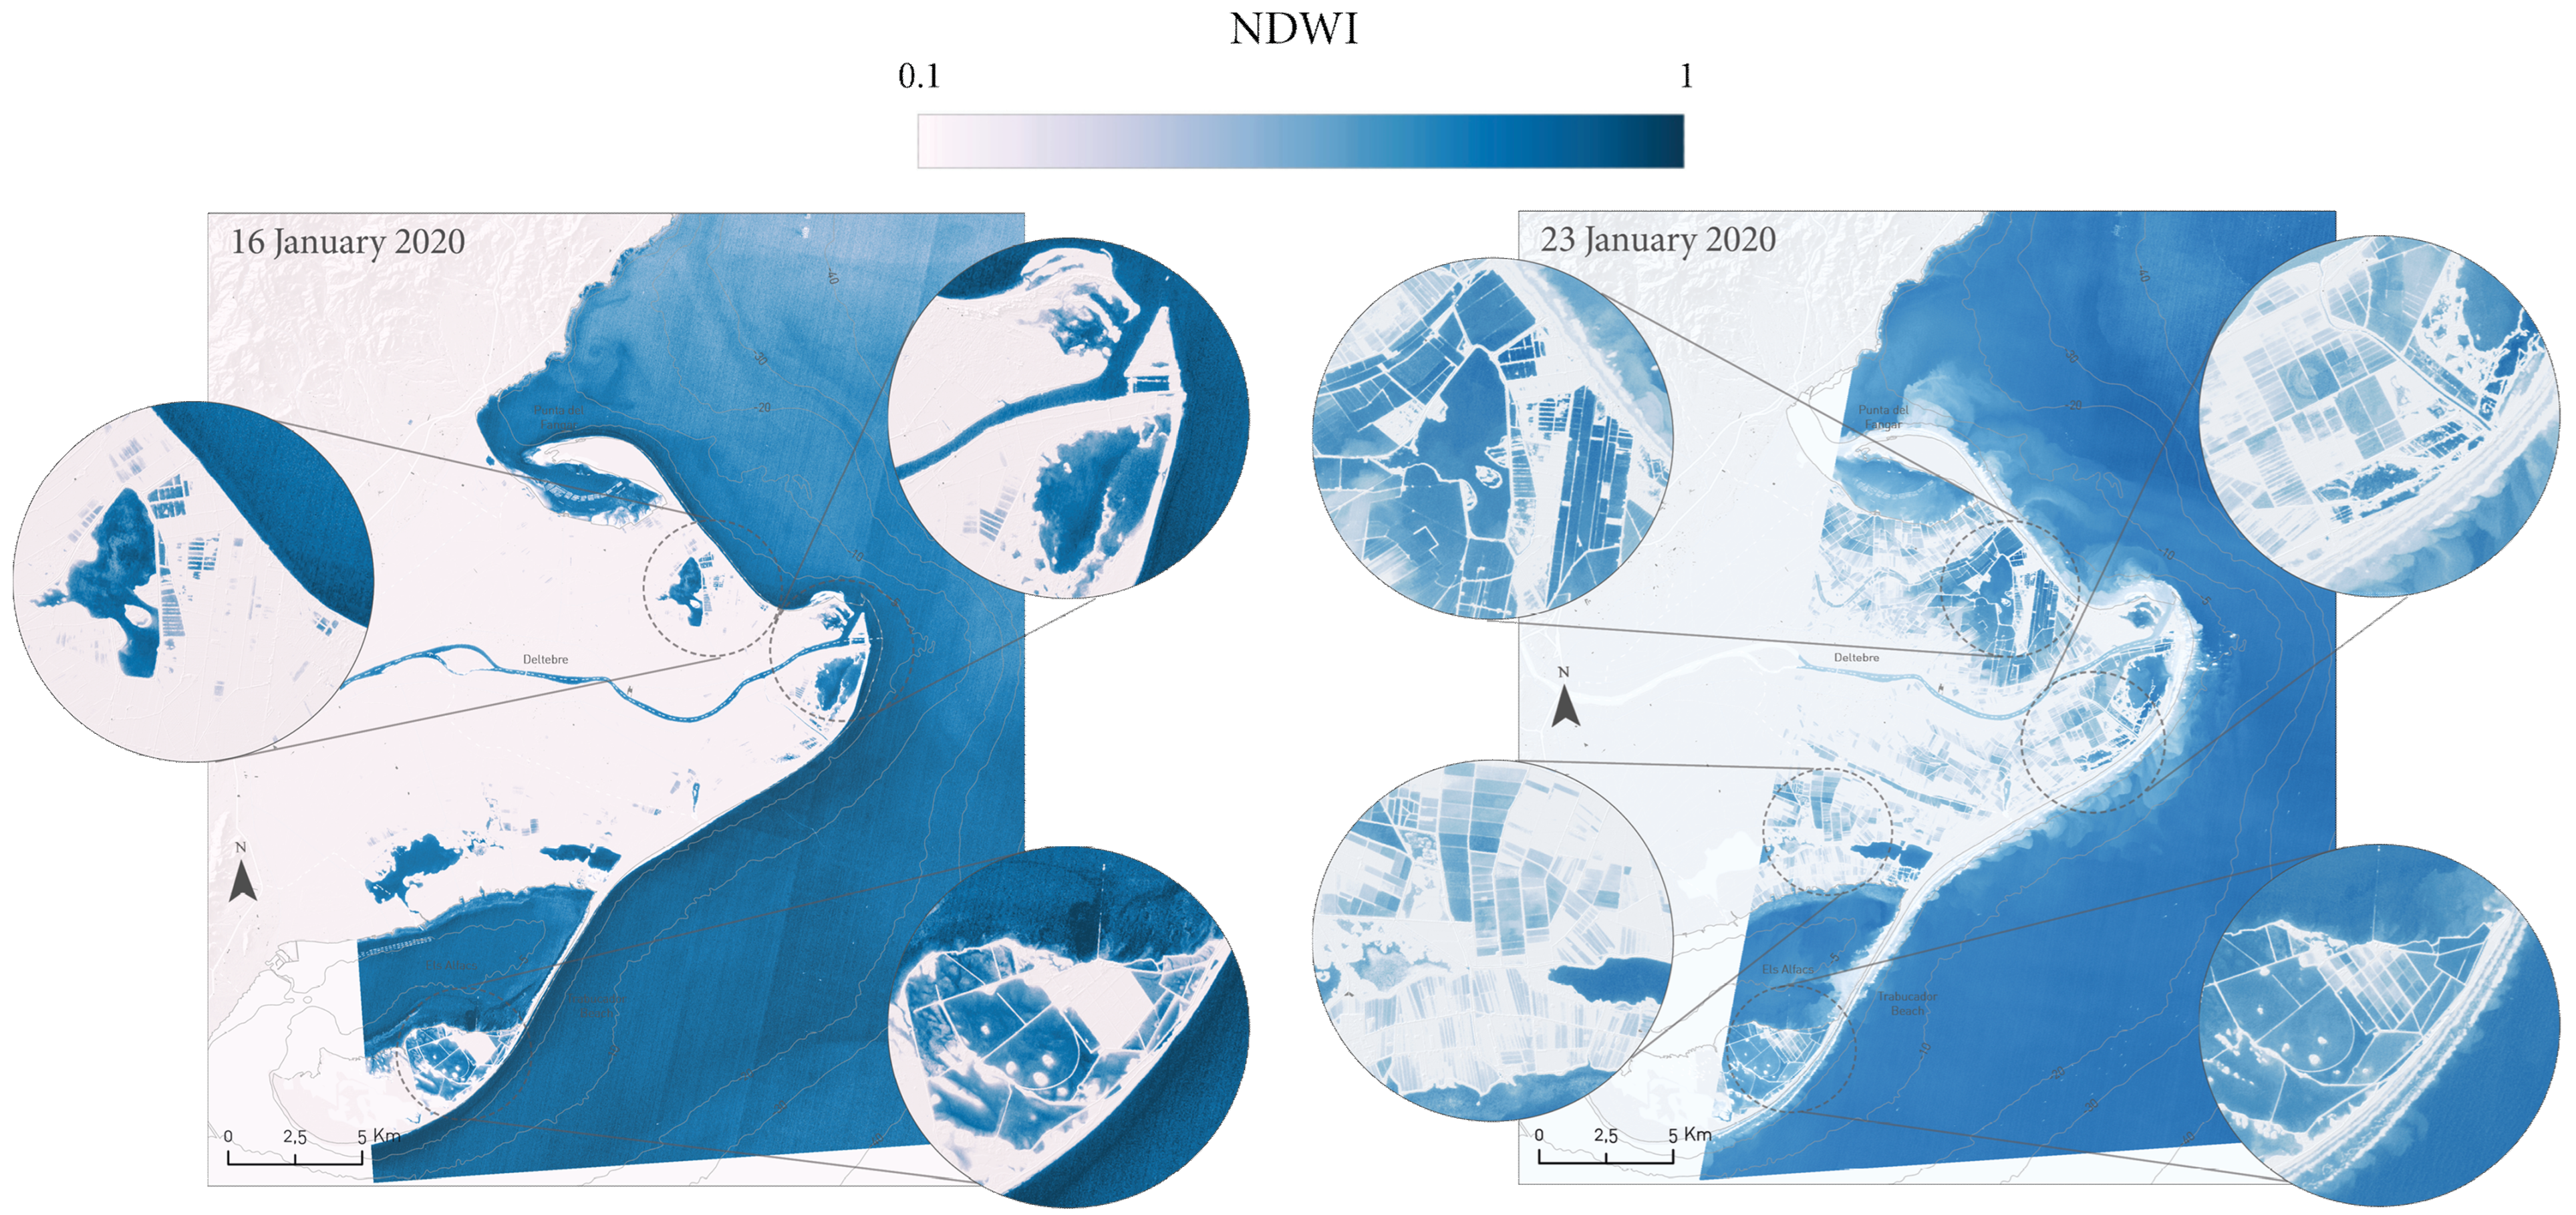
3.3. Flooding Monitoring

As a result of the severe Storm Gloria, the Catalonian community suffered extended damages from flooding, heavy rain, and strong winds, affecting people and infrastructure [60]. These episodes produced an overflow from sewage systems that directly impacted beaches and the Ebro Delta with acute flooding and erosion processes. The Copernicus Emergency Service Rapid Mapping was requested to map the extent of floods in January 2020 (EMSR422_AOI07_DEL_PRODUCT_r1_RTP01/2). Figure 8 presents the maps of the flood delineation in the low-lying Ebro delta. The Copernicus Emergency Service derived a flood map using a semi-automatic approach with a pre-event image acquired on 6 July 2016 (ESRI World Imagery) and a post-event image acquired on 26 January 2020 (SPOT7). The affected area was 4640 ha on 26 January 2020, not including the river and the permanently flooded regions over the delta, highlighting the extensive devastation over most of the delta section. Our flood mapping strategy was implemented using the S2 on-the-cloud GEE platform with a pre-event image acquired just before the storm on 16 January 2020 and a post-event image acquired on 23 January 2020, eliminating the permanently flooded areas and river since the Copernicus Emergency Mapping did not include those in the estimate and thus could be intercomparable. This cost-effective methodology allowed us to detect a higher flooding impact (7311 ha) compared to the one registered three days later by the Copernicus Emergency Service (4640 ha) regarding the same area, meaning that the flooded area was clearly more minor on 26 January than on 23 January due to the three days’ difference. There was no S2 image acquired on 26 January for a proper comparison with the Copernicus Emergency Service flooded mapping. Figure 9 shows the detailed flood areas in the Ebro Delta before (2934 ha, 16 January 2020) and after (9247 ha, 23 January 2020) Storm Gloria was extracted with the Sentinel-2 imagery. In this case, the flooded sections included the river and the permanently flooded parts over the delta.
We also evaluated the temporal series of flood maps in the Ebro Delta during January and February 2020 in the acquisition area to evaluate the recovery of the damaged areas (Figure 10). It can be observed that the maximum flood coverage on 23 January decreased on 26 January from 9247 ha to 6139 ha, whereas in the images from early February, the flood impact is restored to the pre-storm situation (2606 ha on 5 February). These outcomes are in accordance with the results modeled by Amores et al. [10], showing the maximum modeled flooding during Storm Gloria from 17 to 26 January that reached up to 4 km inland. Previous research has been carried out to monitor the winter flooding of rice fields on the coastal wetland of the Ebro Delta with a multi-temporal set of Landsat images [61].

4. Discussion

The control of biochemical parameters in surface coastal waters using satellite data is required to measure the ecological status of these vulnerable environments. The routine sampling of water quality carried out by the regional or local administration is generally scheduled once or twice a month, and is not sufficient to capture these specific transitional episodes. We suggest that both L8 and S2 joint missions improve the monitoring and control of the Ebro Delta turbid plume. The multi-sensor methodology proposed can enhance the previous work that intended to map its water quality using coarser spatial resolution imagery >500 m [48,51,53]. Frequently, time-consuming and expensive in situ measurements are conducted to assess the water quality in coastal areas. Nevertheless, these observations fall short in capturing the intricate temporal and spatial fluctuations. Presently, in situ data collection may be limited due to the presence of isolated sampling sites and their sparse distribution. Consequently, monitoring these gradients, their variability, and the influence of land–water interactions on nearshore dynamics under varying environmental conditions from space necessitates higher spatial resolution imagery. The imagery from both satellites provided snapshots of the water quality patterns (see Figure 5, Figure 6 and Figure 7) that are challenging to replicate with traditional technologies in such a complex environment. The combined datasets from the S2 and L8 satellites offered a distinctive characterization of the dynamic nearshore patterns and fine-scale bio-optical variations along this coastal interface. These satellite maps presented a comprehensive view of the entire delta’s evolution over time. Both missions proved essential in tracking the characterization of the water masses and in measuring the storm impacts, such as the turbidity or chl-a concentration, which were not regularly monitored by the Copernicus Emergency Management Service (CEMS) Rapid Mapping.
With an enhanced frequency supported by combined L8 and S2 products, end-users, managers, and scientists can benefit from these reliable and high-quality products. This information might be key for operational purposes in the frame of the EU Marine and Water Framework Directives [62] from which early-warning and post-event monitoring systems can be implemented. Even though there is work left to be completed towards the improvement and development of advanced sunglint and atmospheric correction as well as bio-optical algorithms for an S2 and L8 virtual constellation, it is a prime moment to explore, utilize, and fully leverage these merged datasets. Particularly, during extreme weather events, such as the one explored in this study, this information is key to assessing suitable assistance over coastal and vulnerable water ecosystems. With the current operation of these satellites, the presence of Landsat-9 in orbit, upcoming missions set to launch soon, such as Sentinel-2C/D, and the continual advancement of atmospheric and sunglint correction techniques, the available archive of high to moderate spatial resolution imagery will greatly enhance water quality monitoring in complex inland and coastal environments. Future work will address the modeling of the seasonal water quality patterns over the delta by using this information and strengthening these preliminary results by adding in situ measurements, cal/val procedures, and statistical tools.
In addition, flood mapping is vital to risk management and reduction, preparedness, evacuation, and emergency planning, helping us to minimize the loss and damage caused by flooding. These issues will increase as climate change makes extreme weather events more intense, common, and unpredictable. Recent studies suggested an increasing trend in storm wave intensity in the western Mediterranean [63]. Comprehending the effects of marine storms on Mediterranean coastal wetlands, marshes, and lagoons is vital to developing precise adaptation procedures [64,65]. The use of space research and optical satellite imagery can assist in developing operational coastal flood awareness systems at the local, regional, and national scales, complementing the current framework for large transnational river systems after extreme events or natural hazards. In this study, S2 8 satellites were able to provide useful and timely information by monitoring not only the water quality but also coastal flood delineation for response and recovery purposes, as already demonstrated in other Mediterranean coastal regions [33,47].

5. Conclusions

In January 2020, Storm Gloria, an extreme winter event, hit the low-lying Ebro Delta causing intense rainfall and a record-breaking flooding. The freely available S2 and L8 observational products were jointly used as a constellation during this catastrophic storm to examine its consequences on the coastal region; their information was merged to estimate the indicators of the water quality and flooding. While neither of the missions was originally intended for assessing the seawater quality, our method showcased their ability to offer suitable imagery at a spatial resolution of 10–30 m consistently and cost-effectively. The preprocessing methodology, as well as sunglint and atmospheric correction using ACOLITE software, displayed consistent results for both satellites. Consequently, employing these satellites in combination can enhance mapping approaches. The results highlight the suitability of the methodology to reliably capture the spatiotemporal distribution of turbidity, suspended particulate matter, and chl-a concentration. Multi-temporal maps were produced and the analysis of all the images showed that the highest turbidity (>30 NFU) was reached after the passage of Storm Gloria, with the strongest gradients typically occurring within the first nearshore meters (~100 NFU). Recovering pre-storm levels and normal water quality conditions (~3 NFU) occurred approximately two weeks after Storm Gloria’s passage. No phytoplankton blooms appeared during the study period in the delta or in adjacent regions. In addition, the on-the-cloud Google Earth Engine platform was used for flood mapping, detecting severe damage and higher flooding impact (7311 ha) compared to the one registered three days later by the Copernicus Emergency Service (4640 ha). These cutting-edge instruments have the potential to aid decision-makers and administrators in establishing a near-real-time monitoring approach, improving the understanding of water quality distribution, and offering timely support to the community during such crises, ultimately preventing adverse situations in the delta. Furthermore, the developed remote sensing strategy can be used as an effective tool in the Copernicus Marine Service (CMEMS) and Copernicus Emergency Management Service (EMS) after extreme events, providing basic information for the management and recovery of the littoral zone. Characterizing the effects of storms on deltas, wetlands, and coastal areas that support many economic activities, such as aquaculture and tourism, is key to developing precise adaptation strategies under scenarios of climate change. In combination with near-real-time in situ monitoring tools, such as the data buoys deployed during the marine observatory part of the EuroSea project in collaboration with aquaculture co-developers, using a combination of in situ data and remote observational products to forecast certain extreme marine events can help prevent economic losses for the industry. This proposed study represents the monitoring of the Ebro Delta making use of comparable L8 and S2 data products and insights for the significance of a pre-processing scheme, addressing the opportunities for mapping heterogeneous nearshore waters along the vulnerable coasts of the Mediterranean Sea.

Author Contributions

I.C. conceived and designed the research, collected the satellite data, processed the imagery for water quality, conducted the analysis, and prepared the figures. M.R. processed the imagery and data for flooding, conducted the analysis, and prepared figures. I.C. led the writing of the manuscript, with revision from M.R., M.B.D. and G.N. All authors have read and agreed to the published version of the manuscript.

Funding

This research was funded by Grant CNS2023-143630 funded by MICIU/AEI/10.13039/501100011033 and by European Union NextGenerationEU/PRTR, by PIE-CSIC (grant number 202030E277), and by the European Union’s Horizon 2020 research and innovation programme, EuroSea project (gran number 862626). The study was supported by the Spanish Ministry of Science, Innovation, and Universities through Programa Estatal Juan de la Cierva Incorporación-2019 (grant number IJC2019-039382-I) and FPU Programme (grant number FPU20/01294). This research has been financially supported by the agreement between the Spanish Ministry for Ecological Transition and Demographic Challenge and CSIC, funded by the European Union-Next Generation Program to contribute to the MSFD.

Data Availability Statement

Data available on request.

Acknowledgments

We would like to thank the European Union’s Copernicus programme, the United States Department of the Interior’s Geological Survey (USGS), and the United States National Aeronautics and Space Administration (NASA) for distributing the Sentinel-2 and Landsat-8 imagery. This work represents a contribution to the CSIC Thematic Interdisciplinary Platforms (PTI) TELEDETECT and OCEANS+.

Conflicts of Interest

The authors declare that they have no known competing financial interests or personal relationships that could have appeared to influence the work reported in this paper.

References

  1. Abram, N.; Gattuso, J.-P.; Prakash, A.; Cheng, L.; Chidichimo, M.P.; Crate, S.; Enomoto, H.; Garschagen, M.; Gruber, N.; Harper, S.; et al. Framing and Context of the Report. In IPCC Special Report on the Ocean and Cryosphere in a Changing Climate; Pörtner, H.-O., Roberts, D.C., Masson-Delmotte, V., Zhai, P., Tignor, M., Poloczanska, E., Mintenbeck, K., Alegría, A., Nicolai, M., Okem, A., et al., Eds.; Cambridge University Press: Cambridge, UK; New York, NY, USA, 2019; pp. 73–129. [Google Scholar]
  2. Martínez, M.L.; Intralawan, A.; Vázquez, G.; Pérez-Maqueo, O.; Sutton, P.; Landgrave, R. The coasts of our world: Ecological, economic and social importance. Ecol. Econ. 2007, 63, 254–272. [Google Scholar] [CrossRef]
  3. Hobday, A.J.; Alexander, L.V.; Perkins, S.E.; Smale, D.A.; Straub, S.C.; Oliver, E.C.J.; Benthuysen, J.A.; Burrows, M.T.; Donat, M.G.; Feng, M.; et al. A hierarchical approach to defining marine heatwaves. Prog. Oceanogr. 2016, 141, 227–238. [Google Scholar] [CrossRef]
  4. Brown, A.R.; Lilley, M.; Shutler, J.; Lowe, C.; Artioli, Y.; Torres, R.; Berdalet, E.; Tyler, C.R. Assessing risks and mitigating impacts of harmful algal blooms on mariculture and marine fisheries. Rev. Aquac. 2019, raq.12403. [Google Scholar] [CrossRef]
  5. Frölicher, T.L.; Laufkötter, C. Emerging risks from marine heat waves. Nat. Commun. 2018, 9, 650. [Google Scholar] [CrossRef]
  6. Oliver, E.C.J.; Perkins-Kirkpatrick, S.E.; Holbrook, N.J.; Bindoff, N.L. Anthropogenic and Natural Influences on Record 2016 Marine Heat waves. Bull. Am. Meteorol. Soc. 2018, 99, S44–S48. [Google Scholar] [CrossRef]
  7. Sen Gupta, A.; Thomsen, M.; Benthuysen, J.A.; Hobday, A.J.; Oliver, E.; Alexander, L.V.; Smale, D.A. Drivers and impacts of the most extreme marine heatwave events. Sci. Rep. 2020, 10, 19359. [Google Scholar] [CrossRef]
  8. Berdalet, E.; Marrasé, C.; Pelegrí, J.L. Resumen Sobre la Formación y Consecuencias de la Borrasca Gloria (19–24 Enero 2020); Institut de Ciències del Mar, CSIC: Barcelona, Spain, 2020; 38p. [Google Scholar] [CrossRef]
  9. Angelats, E.; Soriano-González, J.; Fernández-Tejedor, M.; Alcaraz, C. Combined Flooding and Water Quality Monitoring during Short Extreme Events Using Sentinel 2: The Case Study of Gloria Storm in Ebro Delta. ISPRS Annals of the Photogrammetry. Remote Sens. Spat. Inf. Sci. 2022, 3, 361–368. [Google Scholar] [CrossRef]
  10. Amores, A.; Marcos, M.; Carrió, D.S.; Gómez-Pujol, L. Coastal impacts of Storm Gloria (January 2020) over the north-western Mediterranean. Nat. Hazards Earth Syst. Sci. 2020, 20, 1955–1968. [Google Scholar] [CrossRef]
  11. Soreide, N.N.; Woody, C.E.; Holt, S.M. Overview of ocean based buoys and drifters: Present applications and future needs. In Proceedings of the MTS/IEEE Oceans 2001. An Ocean Odyssey. Conference Proceedings (IEEE Cat. No.01CH37295), Honolulu, HI, USA, 5–8 November 2001; pp. 2470–2472. [Google Scholar]
  12. Sendra, S.; Parra, L.; Lloret, J.; Jiménez, J.M. Oceanographic Multisensor Buoy Based on Low Cost Sensors for Posidonia Meadows Monitoring in Mediterranean Sea. J. Sens. 2015, 2015, 920168. [Google Scholar] [CrossRef]
  13. Martínez-Osuna, J.F.; Ocampo-Torres, F.J.; Gutiérrez-Loza, L.; Valenzuela, E.; Castro, A.; Alcaraz, R.; Ulloa, L.R. Coastal buoy data acquisition and telemetry system for monitoring oceanographic and meteorological variables in the Gulf of Mexico. Measurement 2021, 183, 109841. [Google Scholar] [CrossRef]
  14. European Union-Copernicus Marine Service. Global Ocean 1/12° Physics Analysis and Forecast Updated Dail; Mercator Ocean International: Toulouse, France, 2016. [Google Scholar]
  15. Copernicus Marine Service. Global Ocean Biogeochemistry Analysis and Forecast; Mercator Ocean International: Toulouse, France, 2019. [Google Scholar]
  16. F-Pedrera Balsells, M.; Grifoll, M.; Fernandez-Tejedor, M.; Espino, M. Short-Term Response of Chlorophyll a Concentration Due to Intense Wind and Freshwater Peak Episodes in Estuaries: The Case of Fangar Bay (Ebro Delta). Water 2021, 13, 701. [Google Scholar] [CrossRef]
  17. Pahlevan, N.; Chittimalli, S.K.; Balasubramanian, S.V.; Vellucci, V. Sentinel-2/Landsat-8 product consistency and implications for monitoring aquatic systems. Remote Sens. Environ. 2019, 220, 19–29. [Google Scholar] [CrossRef]
  18. Caballero, I.; Fernández, R.; Escalante, O.M.; Mamán, L.; Navarro, G. New capabilities of Sentinel-2A/B satellites combined with in situ data for monitoring small harmful algal blooms in complex coastal waters. Sci. Rep. 2020, 10, 8743. [Google Scholar] [CrossRef] [PubMed]
  19. Chen, J.; Zhu, W.; Tian, Y.Q.; Yu, Q. Monitoring dissolved organic carbon by combining Landsat-8 and Sentinel-2 satellites: Case study in Saginaw River estuary. Lake Huron. Sci. Total Environ. 2020, 718, 137374. [Google Scholar] [CrossRef] [PubMed]
  20. Rodríguez-Benito, C.V.; Navarro, G.; Caballero, I. Using Copernicus Sentinel-2 and Sentinel-3 data to monitor harmful algal blooms in Southern Chile during the COVID-19 lockdown. Mar. Pollut. Bull. 2020, 161, 111722. [Google Scholar] [CrossRef] [PubMed]
  21. Faridatul, M.I.; Wu, B.; Zhu, X. Assessing long-term urban surface water changes using multi-year satellite images: A tale of two cities. Dhaka and Hong Kong. J. Environ. Manag. 2019, 243, 287–298. [Google Scholar] [CrossRef] [PubMed]
  22. European Space Agency (ESA). E. Sentinel-2 User Handbook. ESA Stand. Doc. Date 2015, Volume 1, pp. 1–64. Available online: https://sentinel.esa.int/documents/247904/685211/Sentinel-2_User_Handbook (accessed on 1 January 2023).
  23. European Space Agency (ESA). Sentinel-2 MSI Technical Guide 2017. Available online: https://earth.esa.int/web/sentinel/technicalguides/sentinel-2-msi (accessed on 1 January 2023).
  24. Woodcock, C.E.; Allen, R.; Anderson, M.; Belward, A.; Bindschadler, R.; Cohen, W.; Wynne, R. Free access to Landsat imagery. Science 2008, 320, 1011. [Google Scholar] [CrossRef] [PubMed]
  25. Knight, E.J.; Kvaran, G. Landsat-8 operational land imager design. characterization and performance. Remote Sens. 2014, 6, 10286–10305. [Google Scholar] [CrossRef]
  26. Vanhellemont, Q.; Ruddick, K.G. ACOLITE Processing for Sentinel-2 and Landsat-8: Atmospheric Correction and Aquatic Applications. In Proceedings of the Living Planet Symposium, Prague, Czech Republic, 9–13 May 2016. [Google Scholar]
  27. Vanhellemont, Q.; Ruddick, K. Atmospheric correction of metre-scale optical satellite data for inland and coastal water applications. Remote Sens. Environ. 2018, 216, 586–597. [Google Scholar] [CrossRef]
  28. Vanhellemont, Q. Adaptation of the dark spectrum fitting atmospheric correction for aquatic applications of the Landsat and Sentinel-2 archives. Remote Sens. Environ. 2019, 225, 175–192. [Google Scholar] [CrossRef]
  29. Nechad, B.; Ruddick, K.; Neukermans, G. Calibration and validation of a generic multisensor algorithm for mapping of turbidity in coastal waters. In Proceedings of the SPIE-The International Society for Optical Engineering, Berlin, Germany, 9 September 2010; p. 74730H. [Google Scholar]
  30. Katlane, R.; Nechad, B.; Ruddick, K.; Zargouni, F. Optical remote sensing of turbidity and total suspended matter in the Gulf of Gabes. Arab. J. Geosci. 2013, 6, 1527–1535. [Google Scholar] [CrossRef]
  31. Nazirova, K.; Alferyeva, Y.; Lavrova, O.; Shur, Y.; Soloviev, D.; Bocharova, T.; Strochkov, A. Comparison of in situ and remote-sensing methods to determine turbidity and concentration of suspended matter in the estuary zone of the mzymta river. black sea. Remote Sens. 2021, 13, 143. [Google Scholar] [CrossRef]
  32. Vanhellemont, Q.; Ruddick, K. Atmospheric correction of Sentinel-3/OLCI data for mapping of suspended particulate matter and chlorophyll-a concentration in Belgian turbid coastal waters. Remote Sens. Environ. 2021, 256, 112284. [Google Scholar] [CrossRef]
  33. Caballero, I.; Roca, M.; Santos-Echeandía, J.; Bernárdez, P.; Navarro, G. Use of the Sentinel-2 and Landsat-8 Satellites for Water Quality Monitoring: An Early Warning Tool in the Mar Menor Coastal Lagoon. Remote Sens. 2022, 14, 2744. [Google Scholar] [CrossRef]
  34. Mishra, S.; Mishra, D.R. Normalized difference chlorophyll index: A novel model for remote estimation of chlorophyll-a concentration in turbid productive waters. Remote Sens. Environ. 2012, 117, 394–406. [Google Scholar] [CrossRef]
  35. Soriano-González, J.; Angelats, E.; Fernández-Tejedor, M.; Diogene, J.; Alcaraz, C. First results of phytoplankton spatial dynamics in two NW-Mediterranean bays from chlorophyll-a estimates using Sentinel 2: Potential implications for aquaculture. Remote Sens. 2019, 11, 1756. [Google Scholar] [CrossRef]
  36. Lahet, F.; Ouillon, S.; Forget, P. A three-component model of ocean color and its application in the Ebro River mouth area. Remote Sens. Environ. 2000, 72, 181–190. [Google Scholar] [CrossRef]
  37. Lahet, F.; Ouillon, S.; Forget, P. Colour classification of coastal waters of the Ebro river plume from spectral reflectances. Int. J. Remote Sens. 2001, 22, 1639–1664. [Google Scholar] [CrossRef]
  38. Pahlevan, N.; Mangin, A.; Balasubramanian, S.V.; Smith, B.; Alikas, K.; Arai, K.; Warren, M. ACIX-Aqua: A global assessment of atmospheric correction methods for Landsat-8 and Sentinel-2 over lakes, rivers, and coastal waters. Remote Sens. Environ. 2021, 258, 112366. [Google Scholar] [CrossRef]
  39. Pahlevan, N.; Smith, B.; Alikas, K.; Anstee, J.; Barbosa, C.; Binding, C.; Ruiz-Verdù, A. Simultaneous retrieval of selected optical water quality indicators from Landsat-8, Sentinel-2, and Sentinel-3. Remote Sens. Environ. 2022, 270, 112860. [Google Scholar] [CrossRef]
  40. Caballero, I.; Steinmetz, F.; Navarro, G. Evaluation of the first year of operational Sentinel-2A data for retrieval of suspended solids in medium-to-high-turbidity waters. Remote Sens. 2018, 10, 982. [Google Scholar] [CrossRef]
  41. Wang, M.; Nim, C.J.; Son, S.; Shi, W. Characterization of turbidity in Florida’s Lake Okeechobee and Caloosahatchee and St. Lucie estuaries using MODIS-Aqua measurements. Water Res. 2012, 46, 5410–5422. [Google Scholar] [CrossRef] [PubMed]
  42. Jiménez, J.A.; Guillén, J.; Gracia, V.; Palanques, A.; Garcıa, M.A.; Sánchez-Arcilla, A.; Rodríguez, G. Water and sediment fluxes on the Ebro Delta shoreface: On the role of low-frequency currents. Mar. Geol. 1999, 157, 219–239. [Google Scholar] [CrossRef]
  43. Friend, P.L.; Amos, C.L. Location Maps of Major River Plumes and Their Relationship to Prodelta Distribution; European Co-Ordination on Mediterranean and Black Sea Prodeltas (EURODELTA), Deliverable 2c WK2, School of Ocean and Earth Science, University of Southampton: Southampton, UK, 2003. [Google Scholar]
  44. Canals, M.; Arnau, P.; Liquete, C.; Colas, S.; Casamor, J.L. Catalogue and Data Set on River Systems from Mediterranean Watersheds of the Iberian Peninsula; Technical Report; Universitat de Barcelona: Barcelona, Spain, 2004; p. 220. [Google Scholar]
  45. Arnau, P.; Liquete, C.; Canals, M. River mouth plume events and their dispersal in the Northwestern Mediterranean Sea. Oceanogr.-Wash. DC-Oceanogr. Soc. 2004, 17, 22–31. [Google Scholar] [CrossRef]
  46. Durand, N.; Fiandrino, A.; Fraunie, P.; Ouillon, S.; Forget, P.; Naudin, J.J. Suspended matter dispersion in the Ebro ROFI: An integrated approach. Cont. Shelf Res. 2002, 22, 267–284. [Google Scholar] [CrossRef]
  47. Caballero, I.; Ruiz, J.; Navarro, G. Sentinel-2 satellites provide near-real-time evaluation of catastrophic floods in the western Mediterranean. Water 2019, 11, 2499. [Google Scholar] [CrossRef]
  48. Gade, M.; Barale, V.; Snaith, H.M. Multisensor monitoring of plume dynamics in the northwestern Mediterranean Sea. J. Coast. Conserv. 2003, 9, 91–96. [Google Scholar] [CrossRef]
  49. Gade, M.; Barale, V. Multi-sensor remote sensing of coastal discharge plumes: A Mediterranean test site. In Remote Sensing of the European Seas; Springer: Dordrecht, The Netherlands, 2008; pp. 475–486. [Google Scholar]
  50. Fernández-Nóvoa, D.; deCastro, M.; Des, M.; Costoya, X.; Mendes, R.; Gómez-Gesteira, M. Characterization of Iberian turbid plumes employing synoptic patterns obtained through MODIS imagery. J. Sea Res. 2017, 126, 12–25. [Google Scholar] [CrossRef]
  51. Fernández-Nóvoa, D.; Mendes, R.D.; Decastro, M.; Dias, J.M.; Sánchez-Arcilla, A.; Gómez-Gesteira, M. Analysis of the influence of river discharge and wind on the Ebro turbid plume using MODIS-Aqua and MODIS-Terra data. J. Mar. Syst. 2015, 142, 40–46. [Google Scholar] [CrossRef]
  52. Mestres, M.; Sierra, J.P.; Sánchez-Arcilla, A.; Del Río, J.G.; Wolf, T.; Rodríguez, A.; Ouillon, S. Modelling of the Ebro River plume. Validation with field observations. Sci. Mar. 2003, 67, 379–391. [Google Scholar] [CrossRef]
  53. Busch, J.A.; Price, I.; Jeansou, E.; Zielinski, O.; van der Woerd, H.J. Citizens and satellites: Assessment of phytoplankton dynamics in an NW Mediterranean aquaculture zone. Int. J. Appl. Earth Obs. Geoinf. 2016, 47, 40–49. [Google Scholar] [CrossRef]
  54. Mallin, M.A.; Corbett, C.A. How hurricane attributes determine the extent of environmental effects: Multiple hurricanes and different coastal systems. Estuaries Coasts 2006, 29, 1046–1061. [Google Scholar] [CrossRef]
  55. Huang, W.; Mukherjee, D.; Chen, S. Assessment of Hurricane Ivan impact on chlorophyll-a in Pensacola Bay by MODIS 250 m remote sensing. Mar. Pollut. Bull. 2011, 62, 490–498. [Google Scholar] [CrossRef] [PubMed]
  56. Llebot, C.; Solé, J.; Delgado, M.; Fernández-Tejedor, M.; Camp, J.; Estrada, M. Hydrographical forcing and phytoplankton variability in two semi-enclosed estuarine bays. J. Mar. Syst. 2011, 86, 69–86. [Google Scholar] [CrossRef]
  57. Romero, I.; Falco, S.; Rodilla, M.; Sierra, J.P.; Río, J.D.; Mosso, C. Salinity, nutrient and chlorophyll a vertical variations in the Ebro River Plume. J. Coast. Res. 2006, III, 1828–1832. [Google Scholar]
  58. Jordi, A.; Basterretxea, G.; Anglès, S. Influence of ocean circulation on phytoplankton biomass distribution in the Balearic Sea: Study based on sea-viewing wide field-of-view sensor and altimetry satellite data. J. Geophys. Res. Ocean. 2009, 114, C11005. [Google Scholar] [CrossRef]
  59. Artigas, M.L.; Llebot, C.; Ross, O.N.; Neszi, N.Z.; Rodellas, V.; Garcia-Orellana, J.; Masqué, P.; Piera, J.; Estrada, M.; Berdalet, E. Understanding the Spatio-Temporal Variability of Phytoplankton Biomass Distribution in a Microtidal Mediterranean Estuary. Deep. Sea Res. Part II Top. Stud. Oceanogr. 2012, 101, 180–192. [Google Scholar] [CrossRef]
  60. De Alfonso, M.; Lin-Ye, J.; García-Valdecasas, J.M.; Pérez-Rubio, S.; Luna, M.Y.; Santos-Muñoz, D.; Álvarez-Fanjul, E. Storm Gloria: Sea state evolution based on in situ measurements and modeled data and its impact on extreme values. Front. Mar. Sci. 2021, 8, 646873. [Google Scholar] [CrossRef]
  61. Serra, P.; Moré, G.; Pons, X. Monitoring winter flooding of rice fields on the coastal wetland of Ebre delta with multitemporal remote sensing images. In Proceedings of the 2007 IEEE International Geoscience and Remote Sensing Symposium, Barcelona, Spain, 23–28 July 2007; pp. 2495–2498. [Google Scholar]
  62. Cao, F.; Tzortziou, M. Capturing dissolved organic carbon dynamics with Landsat-8 and Sentinel-2 in tidally influenced wetland–estuarine systems. Sci. Total Environ. 2021, 777, 145910. [Google Scholar] [CrossRef]
  63. Amarouche, K.; Akpınar, A. Increasing trend on storm wave intensity in the Western Mediterranean. Climate 2021, 9, 11. [Google Scholar] [CrossRef]
  64. Ibáñez, C.; Caiola, N. Sea-level rise. marine storms and the resilience of Mediterranean coastal wetlands: Lessons learned from the Ebro Delta. Mar. Freshw. Res. 2021, 73, 1246–1254. [Google Scholar] [CrossRef]
  65. Rodríguez-Santalla, I.; Díez-Martínez, A.; Navarro, N. Vulnerability Analysis of the Riumar Dune Field in El Garxal Coastal Wetland (Ebro Delta. Spain). J. Mar. Sci. Eng. 2021, 9, 601. [Google Scholar] [CrossRef]
Figure 1. (a) Location of the study area: the Ebro Delta (Tarragona, Spain); (be) photographs of Storm Gloria (January 2020) in the Ebro Delta (photography courtesy by Atresmedia, Cadena Ser, ABC and La Sexta, respectively); precipitation data of the Tortosa meteorological station (Baix Ebre, Tarragona, Spain) with (f) historical series of precipitation (l/m2) (2014–2022); (g) precipitation data for January (2014–2022), where the cold drop of January 2020 is clearly highlighted with maximum rainfall.
Remotesensing 16 00041 g001
Figure 2. RGB (red–green–blue) composited image on 23 January 2020 over the mouth of the Ebro River corresponding to (a) Sentinel-3 satellite (300 m spatial resolution), and (b) Sentinel-2 satellite (10 m spatial resolution).
Remotesensing 16 00041 g002
Figure 3. Image processing workflow through ACOLITE, Google Earth Engine (GEE), and Geographic Information System (GIS) [28,29,34].
Remotesensing 16 00041 g003
Figure 4. Spectral signatures for the Sentinel-2 (S2) and Landsat-8 (L8) satellites in two control points (P1: Ebro River mouth; P2: open waters). RGB base image on 22 February 2020.
Remotesensing 16 00041 g004
Figure 5. Turbidity (FNU) maps in the Ebro Delta before (16 January 2020) and after (23 January 2020) Storm Gloria.
Remotesensing 16 00041 g005
Figure 6. (a) Temporal series of turbidity (FNU) and (b) suspended particulate matter (SPM, g/m3) imagery in the Ebro Delta during January and February 2020.
Remotesensing 16 00041 g006
Figure 7. Temporal series of chlorophyll-a (chl-a, mg/m3) from the NDCI index in the Ebro Delta during January and February 2020.
Remotesensing 16 00041 g007
Figure 8. Flooded areas extracted with the Sentinel-2 satellite (23 January 2020) and from the Copernicus Emergency Service with the SPOT satellite (26 January 2020). In this figure, the flooded areas do not include the river and the permanently flooded regions over the Ebro Delta.
Remotesensing 16 00041 g008
Figure 9. Flood maps of the Sentinel-2 imagery in the Ebro Delta before (16 January 2020: 2934 ha) and after (23 January 2020: 9247 ha) Storm Gloria. The flooded areas include the river and the permanently flooded regions over the Ebro delta.
Remotesensing 16 00041 g009
Figure 10. Temporal series of the Normalized Difference Water Index (NDWI) flood maps in the Ebro Delta during January and February 2020 in the acquisition area. The flooded areas include the river and the permanently flooded regions over the Ebro delta.
Remotesensing 16 00041 g010
Table 1. List of cloud-free imagery used in this study corresponding to the Sentinel-2A/B and Landsat-8 satellites before, during, and after the record-breaking Storm Gloria.
ImageMonthDateSatellite
1January5L8
2January6S2B
3January8S2A
4January11S2A
5January16S2B
6January18S2A
7January23S2B
8January26S2B
9January31S2A
10February5S2B
11February6L8
12February10S2A
13February17S2A
14February22S2B
15February22L8
Disclaimer/Publisher’s Note: The statements, opinions and data contained in all publications are solely those of the individual author(s) and contributor(s) and not of MDPI and/or the editor(s). MDPI and/or the editor(s) disclaim responsibility for any injury to people or property resulting from any ideas, methods, instructions or products referred to in the content.

