1. Introduction
Precise determination of a cloud-to-ground (CG) lightning strike location is essential for various applications utilizing lightning locating system (LLS) data. Moreover, a reliable LLS system can function as an efficient means to monitor lightning discharges in real-time. The capacity to promptly detect flashes can help facilitate early warning systems for severe weather events and enable timely and effective disaster response. Lightning is a naturally occurring phenomenon that often takes place during thunderclouds and rainfall. The electromagnetic radiation emitted by a lightning discharge spans a broad spectrum, from very low frequency (VLF) to very high frequency (VHF). Furthermore, lightning discharges can deliver a substantial amount of current, typically in the tens of kiloampere range, to objects or the ground [
1,
2]. Hence, this charge transfer is a serious worry for humans and the industry. Cloud to cloud, cloud to air, inter-cloud, and cloud to ground (CG) are different types of lightning discharges. The CG discharges are comprised of fast/very fast impulse current discharges to the ground with return stokes [
3,
4,
5].
Governments establish meteorological stations to track the frequency of lightning events annually. The majority of lightning strike-related damage and disruption stems from the rapid discharge of electrical energy in the form of flashes between clouds and the ground. In addition to the damage to properties, many people are killed by the cloud-to-ground discharges in the world each year [
6,
7,
8]. These severe negative impacts of CG discharges to people and devices led to the designing of protective systems such as lightning protection systems [
1]. Power system outages, forest fires, and livestock deaths are a few examples of lightning-related incidents. Nowadays, the behavior of lightning activities is monitored by various sensors and systems, which are satellite-based or ground-based networks [
9,
10,
11]. A lightning locating system (LLS) is designed to accurately locate lightning strikes and provide valuable information for both private and governmental sectors. Moreover, LLSs assist researchers in extracting essential characteristics and parameters of lightning strikes. Precise estimation of CG strike location is critical for applications that utilize LLS information. It should be emphasized that various characteristics of lightning discharges can be extracted from the captured data depending on the type of LLS employed [
12]. Lightning locating systems (LLSs) accumulate extensive data on lightning activities, which can be applied in various practical contexts, including weather monitoring and prediction, geophysical research, and national power grid protection.
Single station lightning detection sensors, such as lightning discharge counters, are only capable of detecting and tallying the instances of lightning discharges, without accurately locating the source of the radiation. However, the advent of multi-sensor lightning detection systems, which have been in use since the 1920s, has reduced the issues associated with single station LLSs. Russian physicist Popoff conducted the first measurements in 1895 to study the electromagnetic fields created by lightning at a distance. Other scientists such as Appleton, Watson-Watt, and Herd also conducted research on radiation fields [
13]. In subsequent years, more sensors were utilized to capture the entirety of the lightning channel and provide a more precise LLS. Rakov noted in 2013 that two commonly used lightning locating techniques for long-baseline systems operating in the LF/VLF ranges are the time difference of arrival (TDOA) and magnetic direction finding (MDF) methods [
14]. Most ground-based LLSs require more than one station (sensor) to accurately locate the lightning discharges [
15]. The accurate lightning locating system based on different technologies inevitably includes several sensors.
1.1. Lightning Detection Techniques
Lightning tracking and mapping system has many applications in both academic and industrial sectors. The detected weather changes by the LLSs are used for understanding the physics of lightning discharges and global electric movements. Magnetosphere, ionosphere, and NOx generation studies also use the captured data by the LLSs [
16,
17,
18,
19].
Lightning mapping systems are closely monitored by weather forecasters and researchers to study storm patterns. The aviation industry is a major user of LLSs, with air traffic controllers redirecting flights as soon as weather hazards are detected. LLS alarms are also equipped in fire detectors in forestry areas, outdoor activities, and sports facilities to warn the public [
20,
21]. Many outdoor activities such as recreation centers and outdoor facilities such as transmission lines can be influenced by lightning [
22,
23,
24,
25].
Various lightning detection sensors and systems possess their own advantages and drawbacks. For instance, some are capable of detecting cloud-to-ground lightning (CG) and other cloud activities, while others have limitations on their coverage areas and require an optimal number and location of measuring stations. Nevertheless, the advancements in lightning detection techniques have helped researchers locate lightning discharges with minimal detection errors. In the past three decades, lightning locating systems have undergone significant improvements, resulting in more accurate systems [
26]. Modern ground-based LLSs are capable of not only locating lightning, but also determining its peak current and tracking cloud movements. Different working frequencies of LLSs reveal different flash characteristics, which is why they are installed in various frequency ranges to provide complementary information about thunderstorms. To establish a correlation between annual lightning discharges and landform distribution, such as topography and latitude, extensive research is necessary. It has been observed that in certain regions, the number of return strokes and lightning current amplitude increase with altitude.
Two widely used lightning detection methods are magnetic direction finding (MDF) and time difference of arrival (TDOA) methods, which have specific baselines based on the distances and locations of the stations relative to each other. It is known that VLF sensors have a longer wavelength compared to VHF sensors, resulting in VLF radiations being able to travel farther distances than VHF radiations. VHF emissions are commonly emitted from clouds due to electrical breakdown, whereas VLF emissions are propagated by return strokes or k-changes and localize the CG activities [
27]. The magnetic crossed-loop antenna is used to obtain the direction of the horizontal component of the captured magnetic field that is generated by a lightning discharge. Based on the construction of this antenna, two vertical and orthogonal loops while the planes are oriented NS (North-South) and EW (East-West) are designed to measure the magnetic fields and, therefore, find the direction of the discharge [
28,
29].
Loop antennas are widely used in various applications, such as survival communications, oil exploration, and geophysical research, as low-frequency sensors. These antennas can detect sensing magnetic fields, which induce a voltage in the loops of the crossed-loop antennas. Due to their sensitivity to magnetic fields and not electric fields, these antennas are particularly useful for measuring magnetic field variations. The induced voltages in the two loops are proportional to the derivative of the induced magnetic field components perpendicular to the areas of the loops, multiplied by the area of the antenna (A).
The induced voltages in the loop are measured to obtain the magnetic field components. The magnetic field in parallel to the ground plane is generated by the vertical lightning discharge channel [
30].
According to the method based on Faraday’s law, the direction of the magnetic field source can be determined by measuring the ratio of the induced voltages in two loops. The line connecting the point of the lightning channel is at a right angle to this magnetic field. The output voltage of each loop is proportional to the cosine of the angle between the magnetic field vector and normal vector to the plane of the loop [
31,
32]. The first few microseconds of the induced magnetic fields by the return strokes are employed to estimate the location for three reasons. First, the few microseconds of the return strokes are generated by the last few hundred meters of the lightning channels. Second, it is known that one of the strongest events in lightning discharge is the return stroke, and it can be detected at large distances. Moreover, it is the return stroke that is of interest in connection with lightning protection. The third reason for using the first few microseconds of a return stroke is to avoid the errors caused by ionosphere reflections [
33].
According to López et al. [
34] in 1991, Ortéga [
35] in 2007, and Chen et al. [
36] in 2013, errors are included in calculating the azimuth of arrival waveform to the crossed-loop antenna. Position and topography of the surrounding terrain, such as close metallic objects and tall structures are several possible site errors [
37]. The time difference of arrival (TDOA) is a commonly used method to detect lightning strikes. This method involves installing synchronized measuring stations to capture lightning flashes in different frequency bands, including VLF, LF, HF, and VHF ranges. However, as these systems capture various types of cloud activities, a separate algorithm is needed to differentiate cloud-to-ground discharges from other types of cloud activities. By using the TDOA-based LLS in the VLF range, which is typically around 10 kHz, cloud-to-ground discharges can be detected exclusively [
38,
39,
40].
The precise global positioning system (GPS) records the time of the detected lightning strikes when receiving the signals. The time differences of the detected waveforms are used to create hyperbolas around the measurement stations, and the points of intersection of these hyperbolas determine the location of the lightning. Mathematical calculations require a minimum of four measurement stations to obtain an unambiguous point for each calculation. Another lightning detection technique is interferometry, which uses phase measurement in a small bandwidth to determine the direction of lightning discharge [
41]. At least two detecting antennas with distance are needed in such a system. Identical narrowband filters are connected to the receivers. The outputs of the receivers are processed by the phase detector, which generates a voltage. This voltage level is proportional to the phase differences of the signals that define a plane to locate the radiation source. A minimum of three measuring antennas and two orthogonal baselines is required to calculate the azimuth and elevation of the source. Recent lightning locating systems combine more than one detection technique to provide surplus information that localizes the CGs with lower distance error [
41].
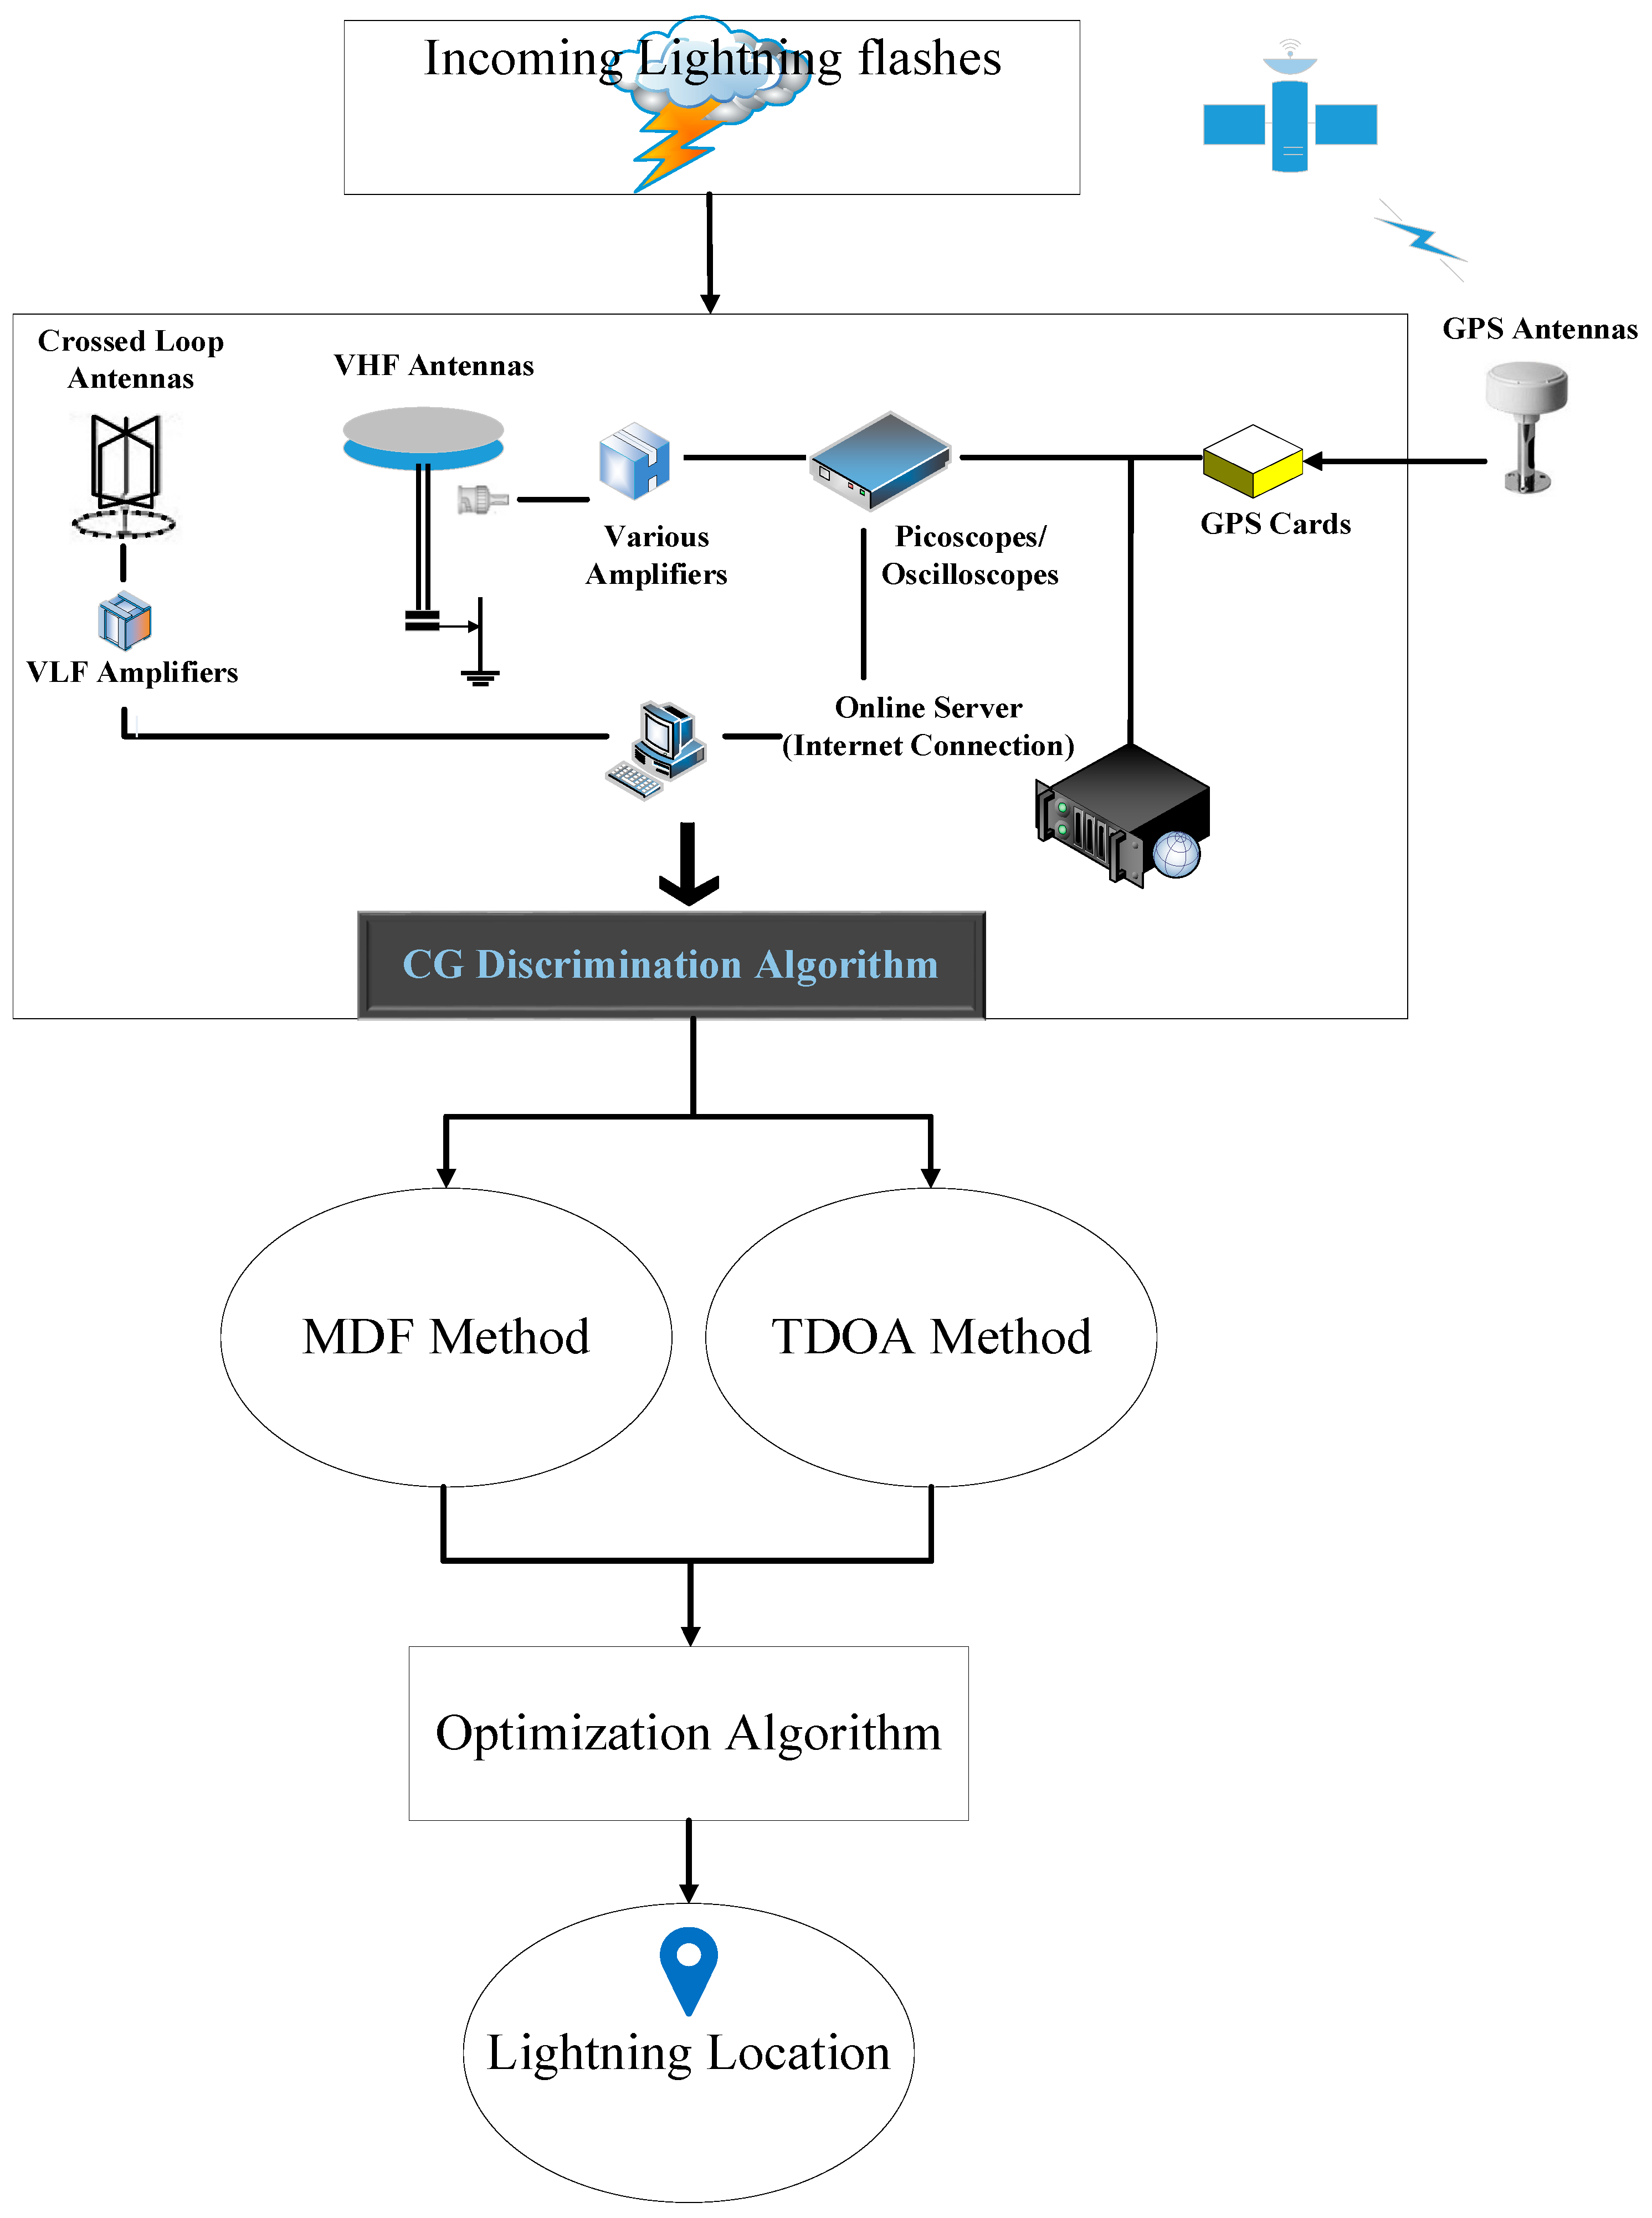
As MDF computes the triangulation area of the radiation direction and TDOA determines the intersection of hyperbolas, a combination of MDF and TDOA is one of the best choices for a combined LLS. Each technique can provide independent results and, finally, it is possible to find more accurate output by employing optimization techniques such as particle swarm optimization (PSO) [
42]. The localization of lightning protection systems usually relies on analyzing the CG lightning flashes captured by the lightning locating system. However, the accuracy of the MDF method for determining the direction of field incidence can be affected by factors such as site errors and local sensor conditions, including nearby objects, metal fences, or other conducting materials [
34,
36,
43].
1.2. Main Lightning Detection Networks in Malaysia
In Malaysia, lightning is a significant cause of power outages. To address this issue, automatic lightning detection networks have been established, which enable the analysis of lightning strikes at both regional and local levels. The PSO-based LLS in this study utilizes a designed map that is automatically accessed by the LLS program from online maps as needed. One advantage of the designed LLS in this research is the use of a dynamic and online map, unlike many other lightning locating systems like BOLTEK that rely on a static photo as the screen map. To obtain a suitable map, companies must be contacted and given the exact installation location of the antenna [
44]. Static map photos are unreliable for locating lightning strikes, as the points on them may not be accurate. A dynamic map, which allows zooming in and out to real places, is preferred. Lightning detection networks are typically owned by weather forecasting companies or well-equipped private research institutes due to their size and cost. Public individuals seldom own such networks. It is crucial to warn the public of lightning strikes detected by LDNs, particularly those engaged in outdoor activities. The aim of this work is to address the aforementioned gaps. The Lightning Detection System implemented by the Malaysian Meteorological Department (MMD) comprises two sub-systems, namely the wide area lightning localization sub-system (SAFIR) and the precision lightning methodology warning sub-system (PLWS). The detection stations of these sub-systems report lightning data, detection station status, and auto-test data at intervals of every second and every 5 min, respectively [
39].
This research utilizes data from the lightning detection system (LDS) of the Malaysian Meteorological Department (MMD) to determine lightning occurrences in Peninsular Malaysia. The LDS comprises eight sensors located at Bt. Tangga (Kedah), Bertam (Penang), Parit (Perak), Kuala Krai (Kelantan), Jengka (Pahang), Klang (Selangor), Jasin (Melaka), and Mersing (Johor). However, certain sites that are noisy and have obstructions, as well as uneven sensor spacing, are identified as weaknesses of the lightning detection system.
The accuracy of a lightning detection system is influenced by various factors, including the types and number of sensors used, their placement in relation to each other, the topography of the sites, and the presence of obstructions and structures in the environment. At least three sensors are required to compute lightning data, and they should be placed no farther apart than their nominal range (200 km for VHF sensors). Placing the sensors in a straight line is not recommended. In 1994, TNB Research (TNB-R) installed a lightning detection network (LDN) in Peninsular Malaysia to mitigate the negative impacts of lightning on TNB equipment. TNB-R has installed IMPACT ESP sensors at eight different locations in Malaysia for lightning detection and fault location estimation. Continuous monitoring of sensor performance is carried out by the lightning detection system laboratory operated by TNB-R. Lightning events and their locations are recorded by the Lightning Processor 2000 (LP 2000) system, developed by Vaisala. However, these lightning locating systems do not provide public access to the captured lightning data. The objective of this research is to tackle the issues associated with lightning locating systems utilizing TDOA and MDF techniques. To achieve this, a hybrid TDOA and MDF method employing a particle swarm optimization algorithm is proposed as a PSO-based LLS, which aims to reduce errors associated with both TDOA and MDF techniques.
2. The Study Area and Dataset
Malaysia is situated close to the Equator and is divided into two main regions, namely Peninsular Malaysia or West Malaysia, and East Malaysia or Malaysia Timur, which are not connected to each other. The largest states in East Malaysia are Sarawak and Sabah [
45]. Malaysia’s eastern region is geographically separated from Peninsular Malaysia by the South China Sea. Both regions lie within the tropical latitudes, characterized by consistently high temperatures and humidity levels throughout the year. In addition to experiencing heavy rainfall, Malaysia also has distinct monsoon seasons in the western part of the country from May to October. The annual temperature ranges from 25 °C to 35 °C [
46]. The monsoon regime results in frequent rainfall throughout the year across the entire country. Peninsular Malaysia has a mean annual rainfall of around 2540 mm, but each region has its own unique characteristics.
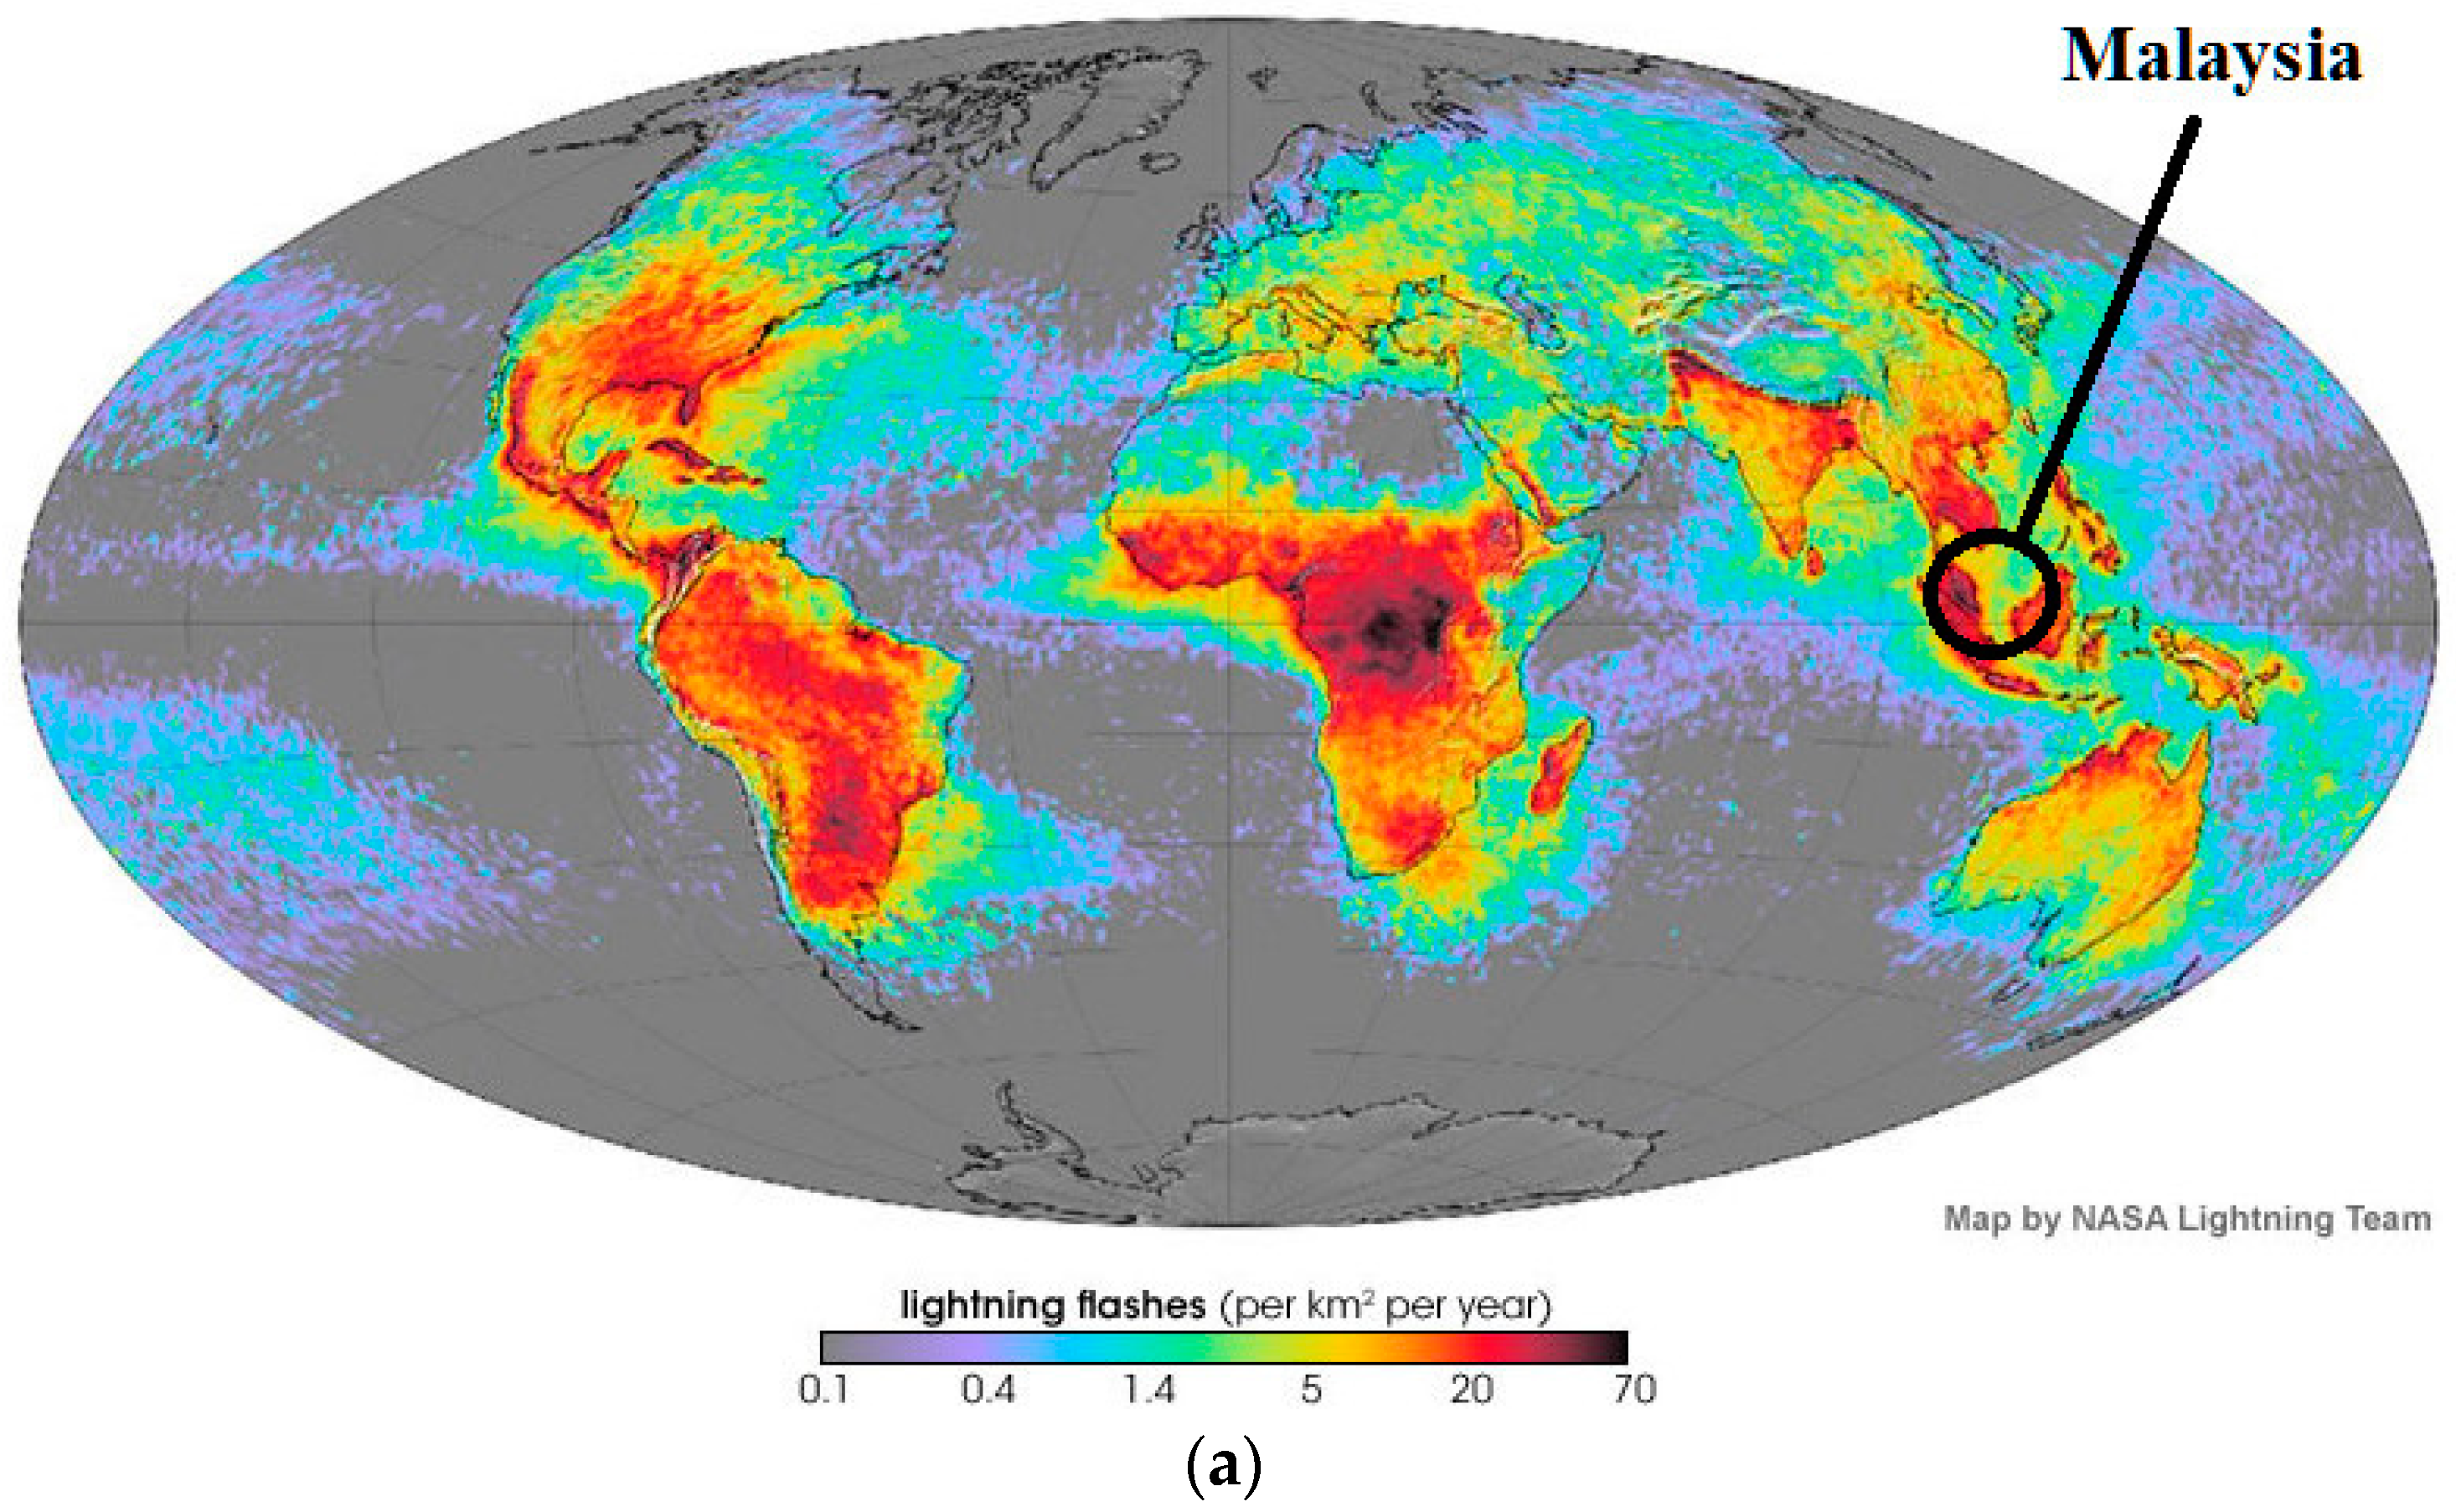
Figure 1 displays the average yearly distribution of lightning discharges per square kilometer using NASA’s lightning imaging sensor [
47]. Malaysia is among the countries with the highest number of lightning strikes in the world.
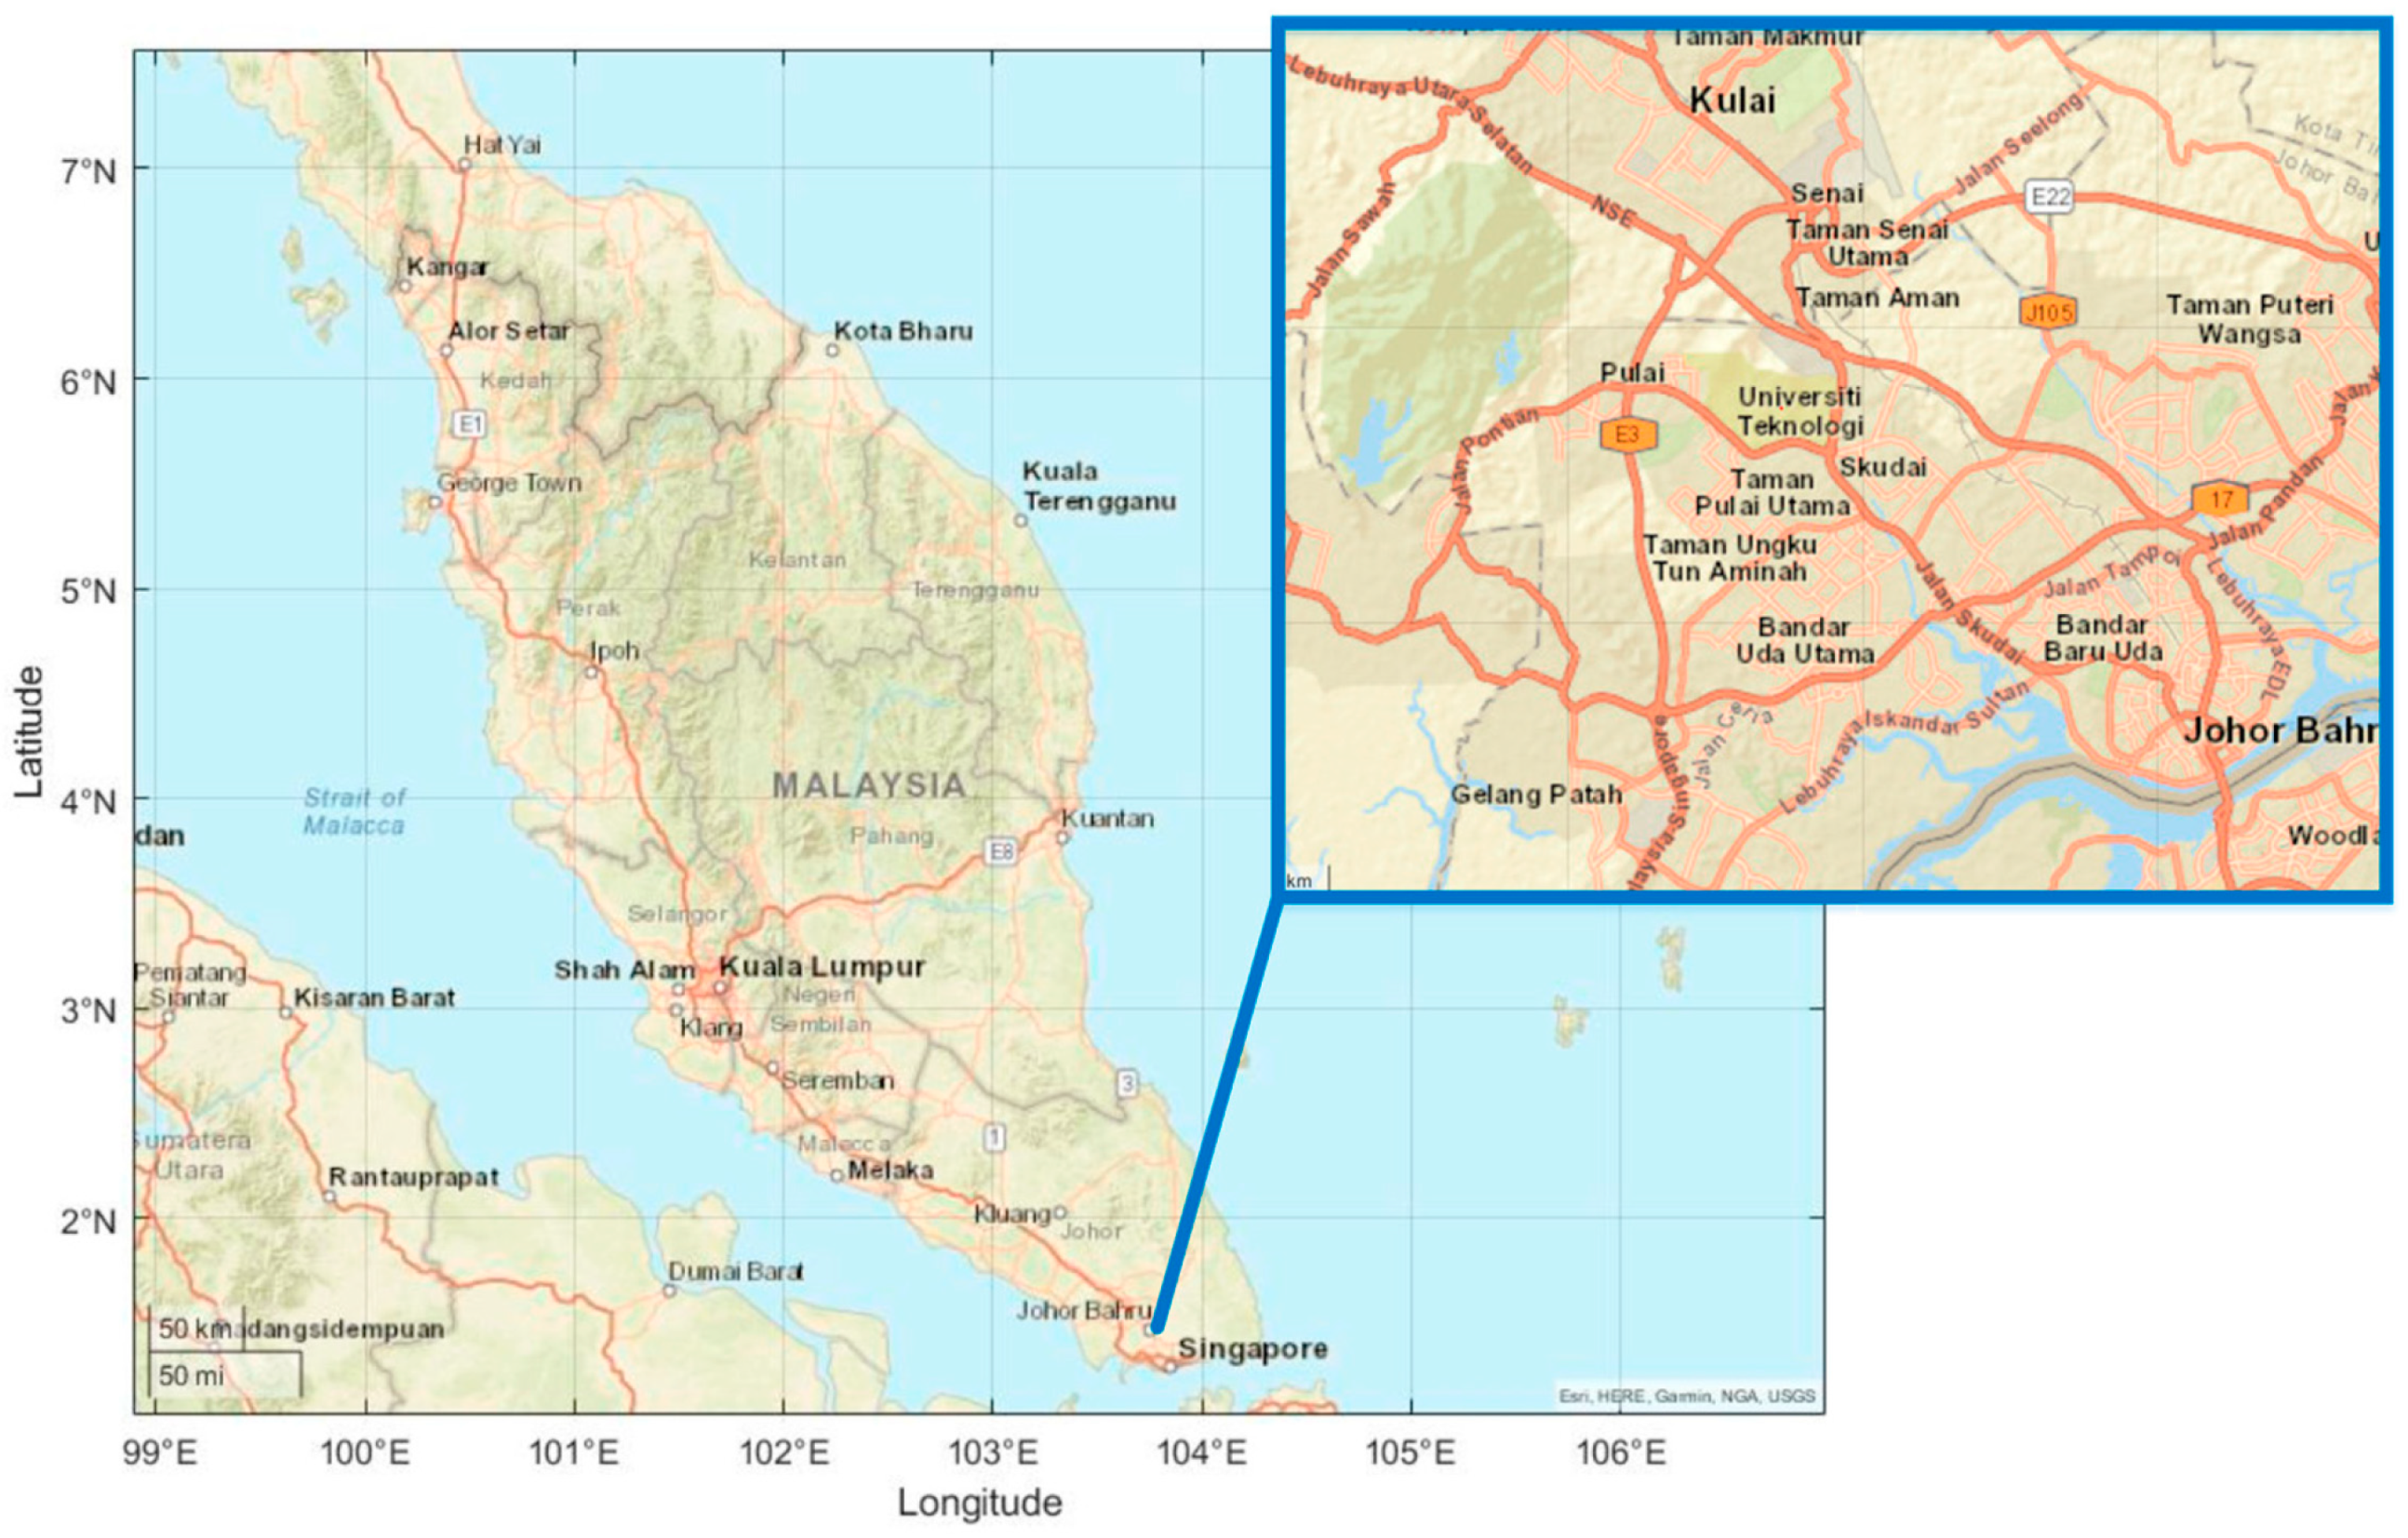
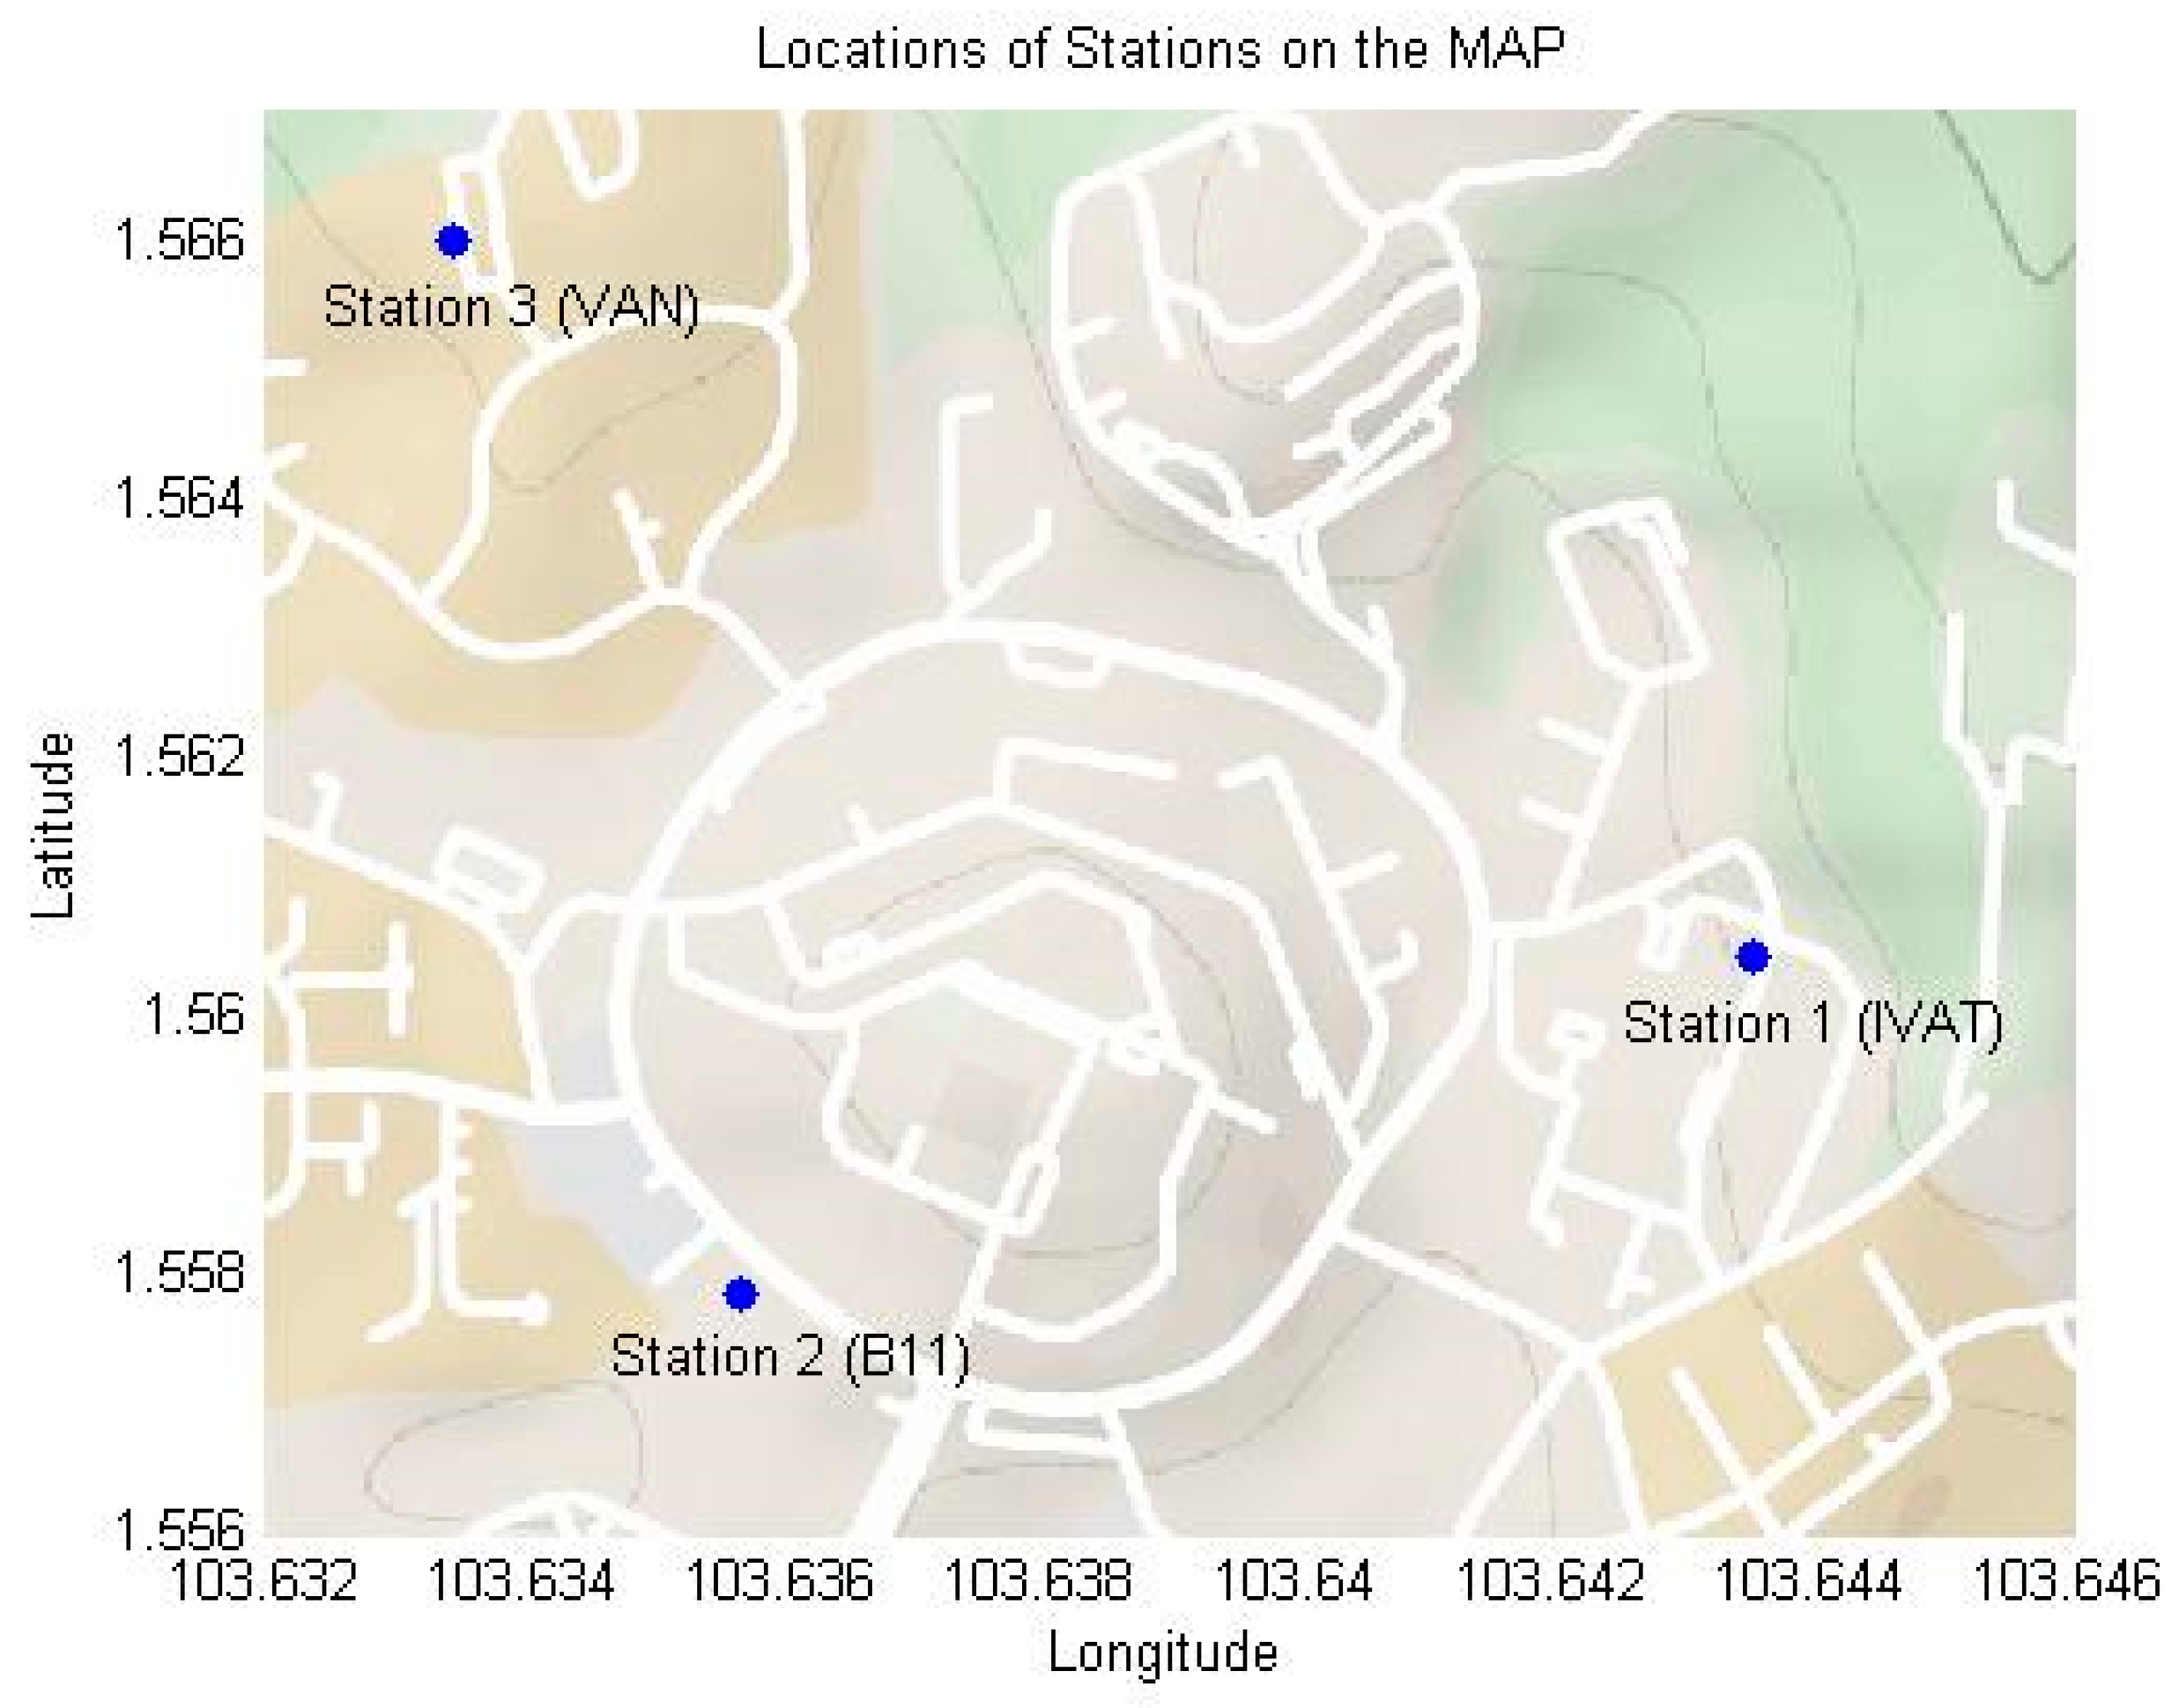
Figure 2 shows Peninsular Malaysia and the geographical location of the case study located in Skudai, Johor province, the southern part of Peninsular Malaysia [
48,
49]. The objective of this research is to analyze the waveforms obtained from measuring stations to determine the occurrence of CG discharges using an implemented LLS. The state of Johor, where the study was conducted, has a climate similar to other states in Malaysia, characterized by frequent rainfall throughout the year. The wettest months in this area are April, October, November, and December. The measurement stations include IVAT station (1.560447, 103.643542), B11 station (1.557839, 103.635694), and VAN station (1.565997, 103.633469).
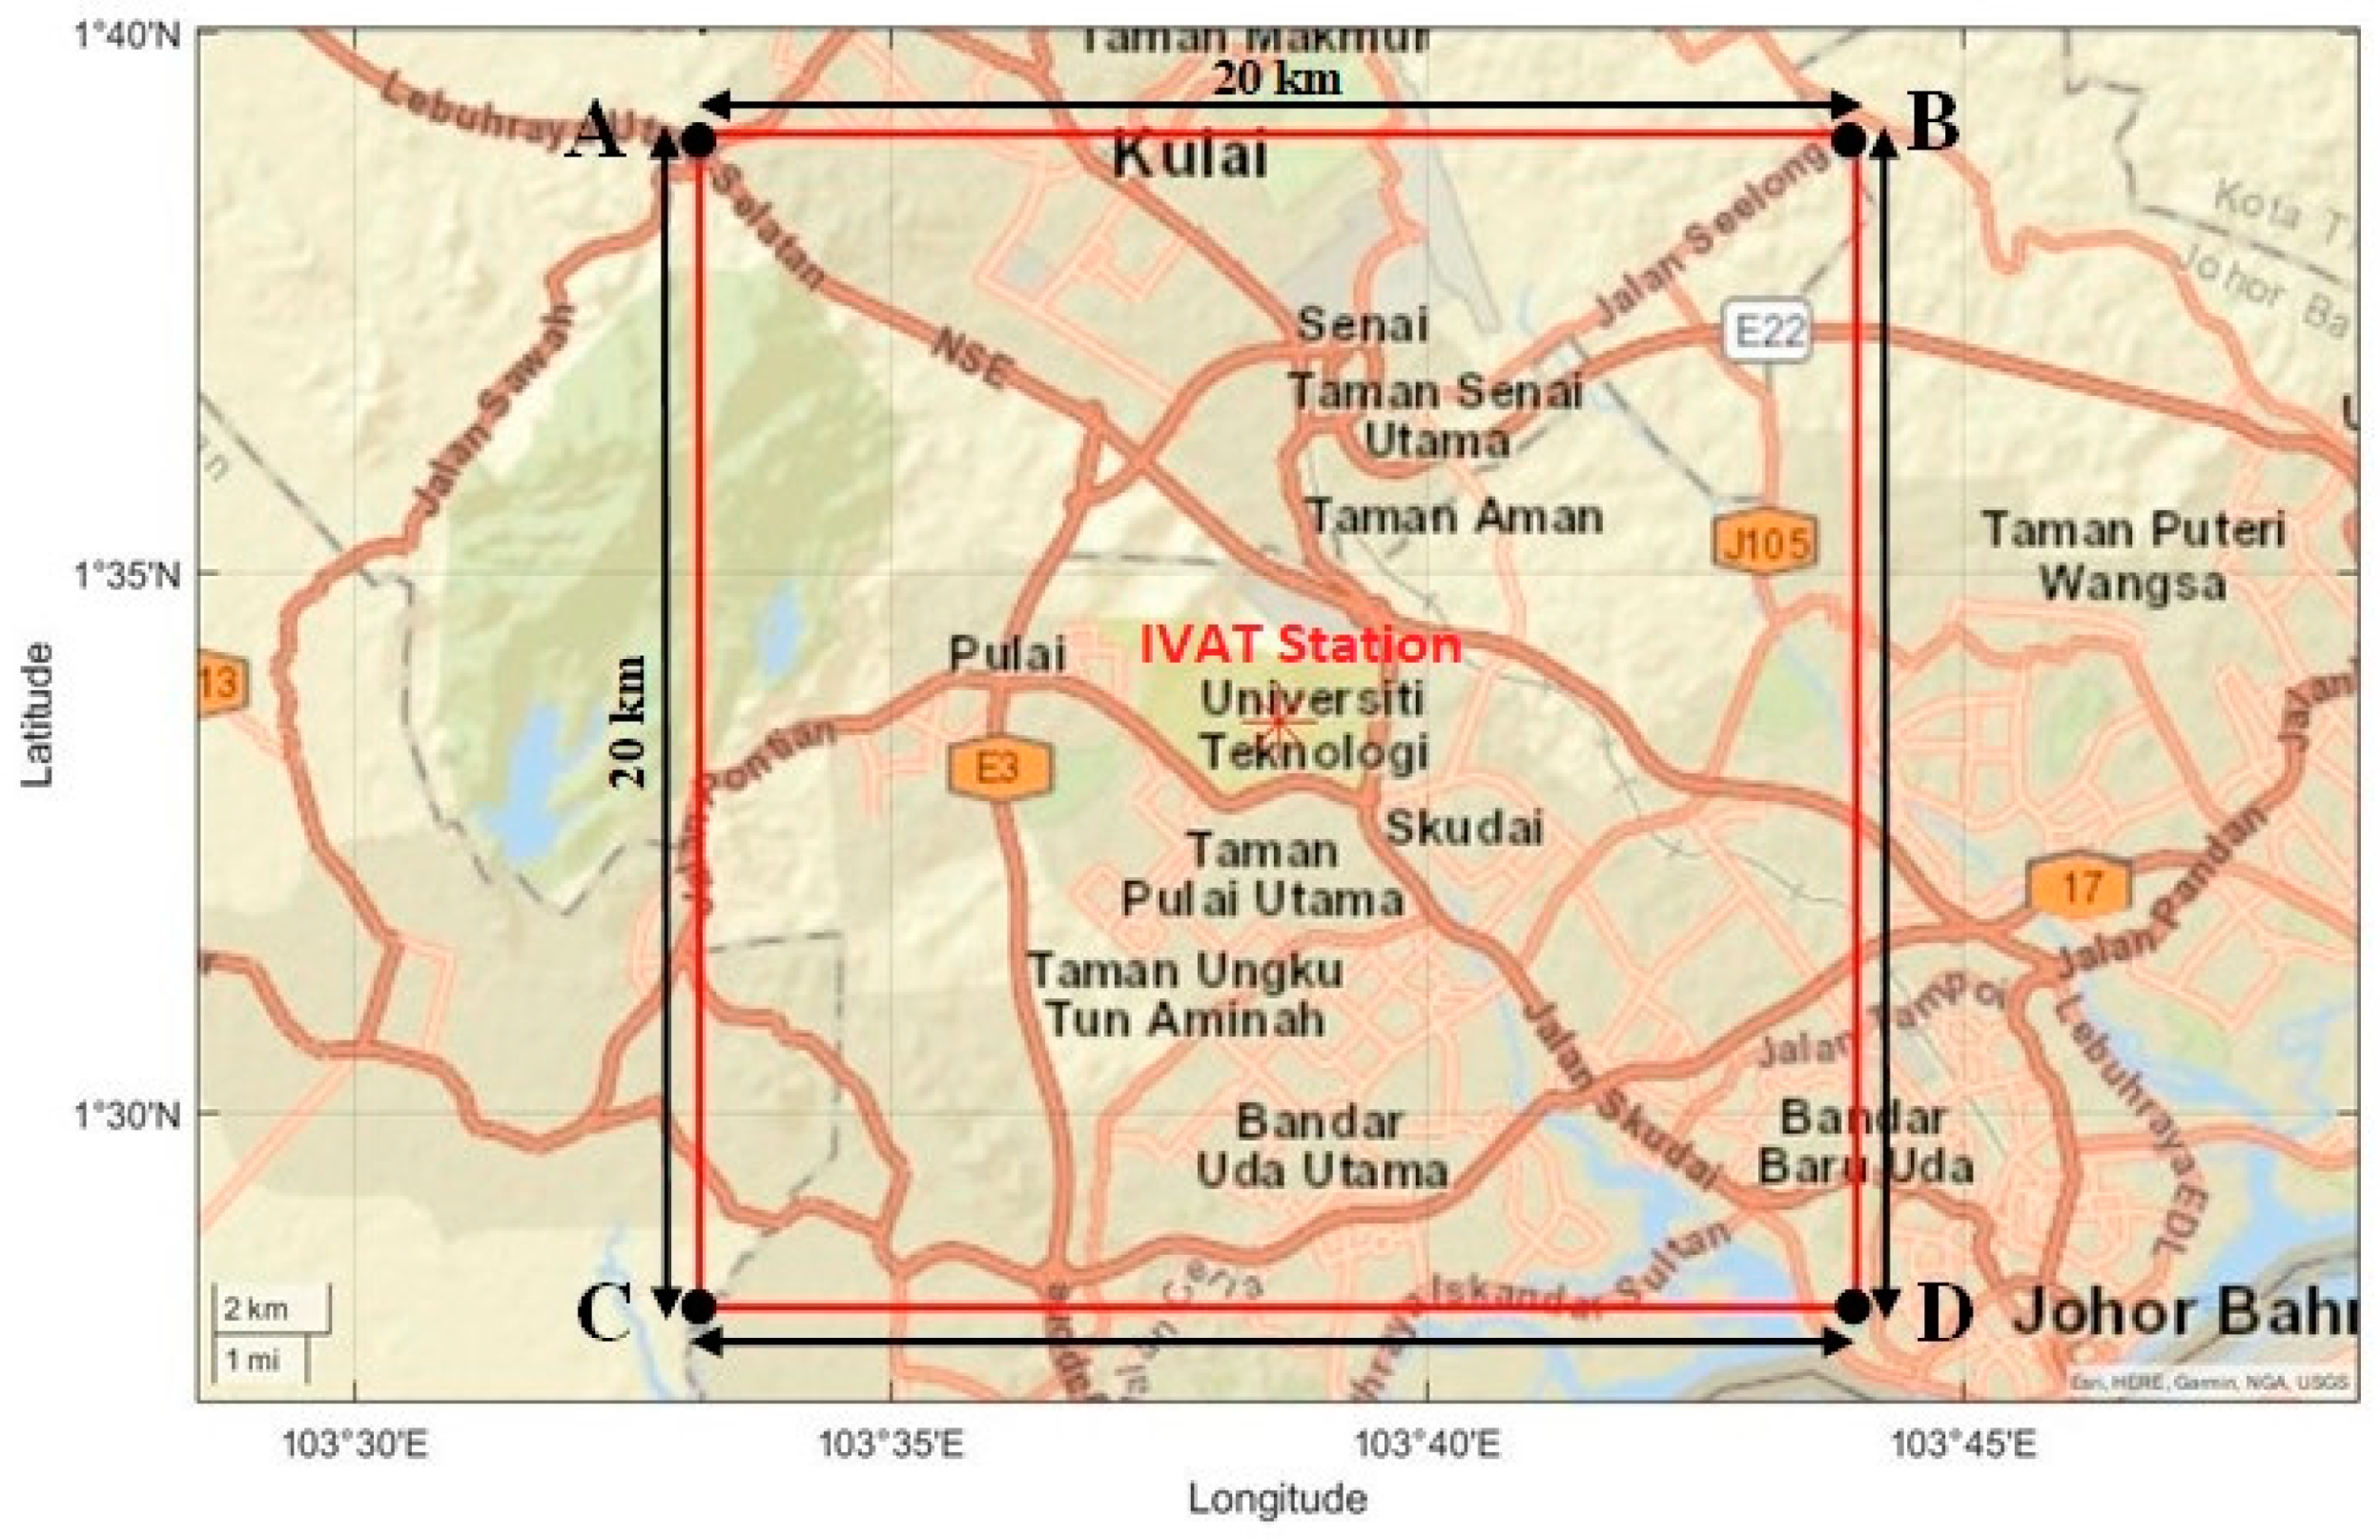
Lightning locating systems have been used by many countries to collect data on lightning for the purpose of mapping CG flashes. The coverage area of an LLS depends on the number of stations and frequency ranges used. For this research, a 400 km
2 area centered on the IVAT station (1.560447, 103.643542) was chosen as the study area, as shown in
Figure 3. The latitude and longitude coordinates of the vertices of the study area are listed below:
A = 1.650912, 103.553678,
B = 1.650912, 103.733406,
C = 1.469982, 103.553678,
D = 1.469982, 103.733406.
Kulai Toll Plaza in the Kulai region is where Position A is located. Position B is situated in the Tebrau area, which is on the east side of Senai International Airport and 10 km away from it. Jeram Batu area is where Point C is located, adjacent to the Sungai Pulai river and near Kampung Jelutong Tengah. Johor City is where Location D is situated. IVAT station at the University Technology Malaysia (UTM) is considered the central location.
Calibration of Lightning Locating Sensors
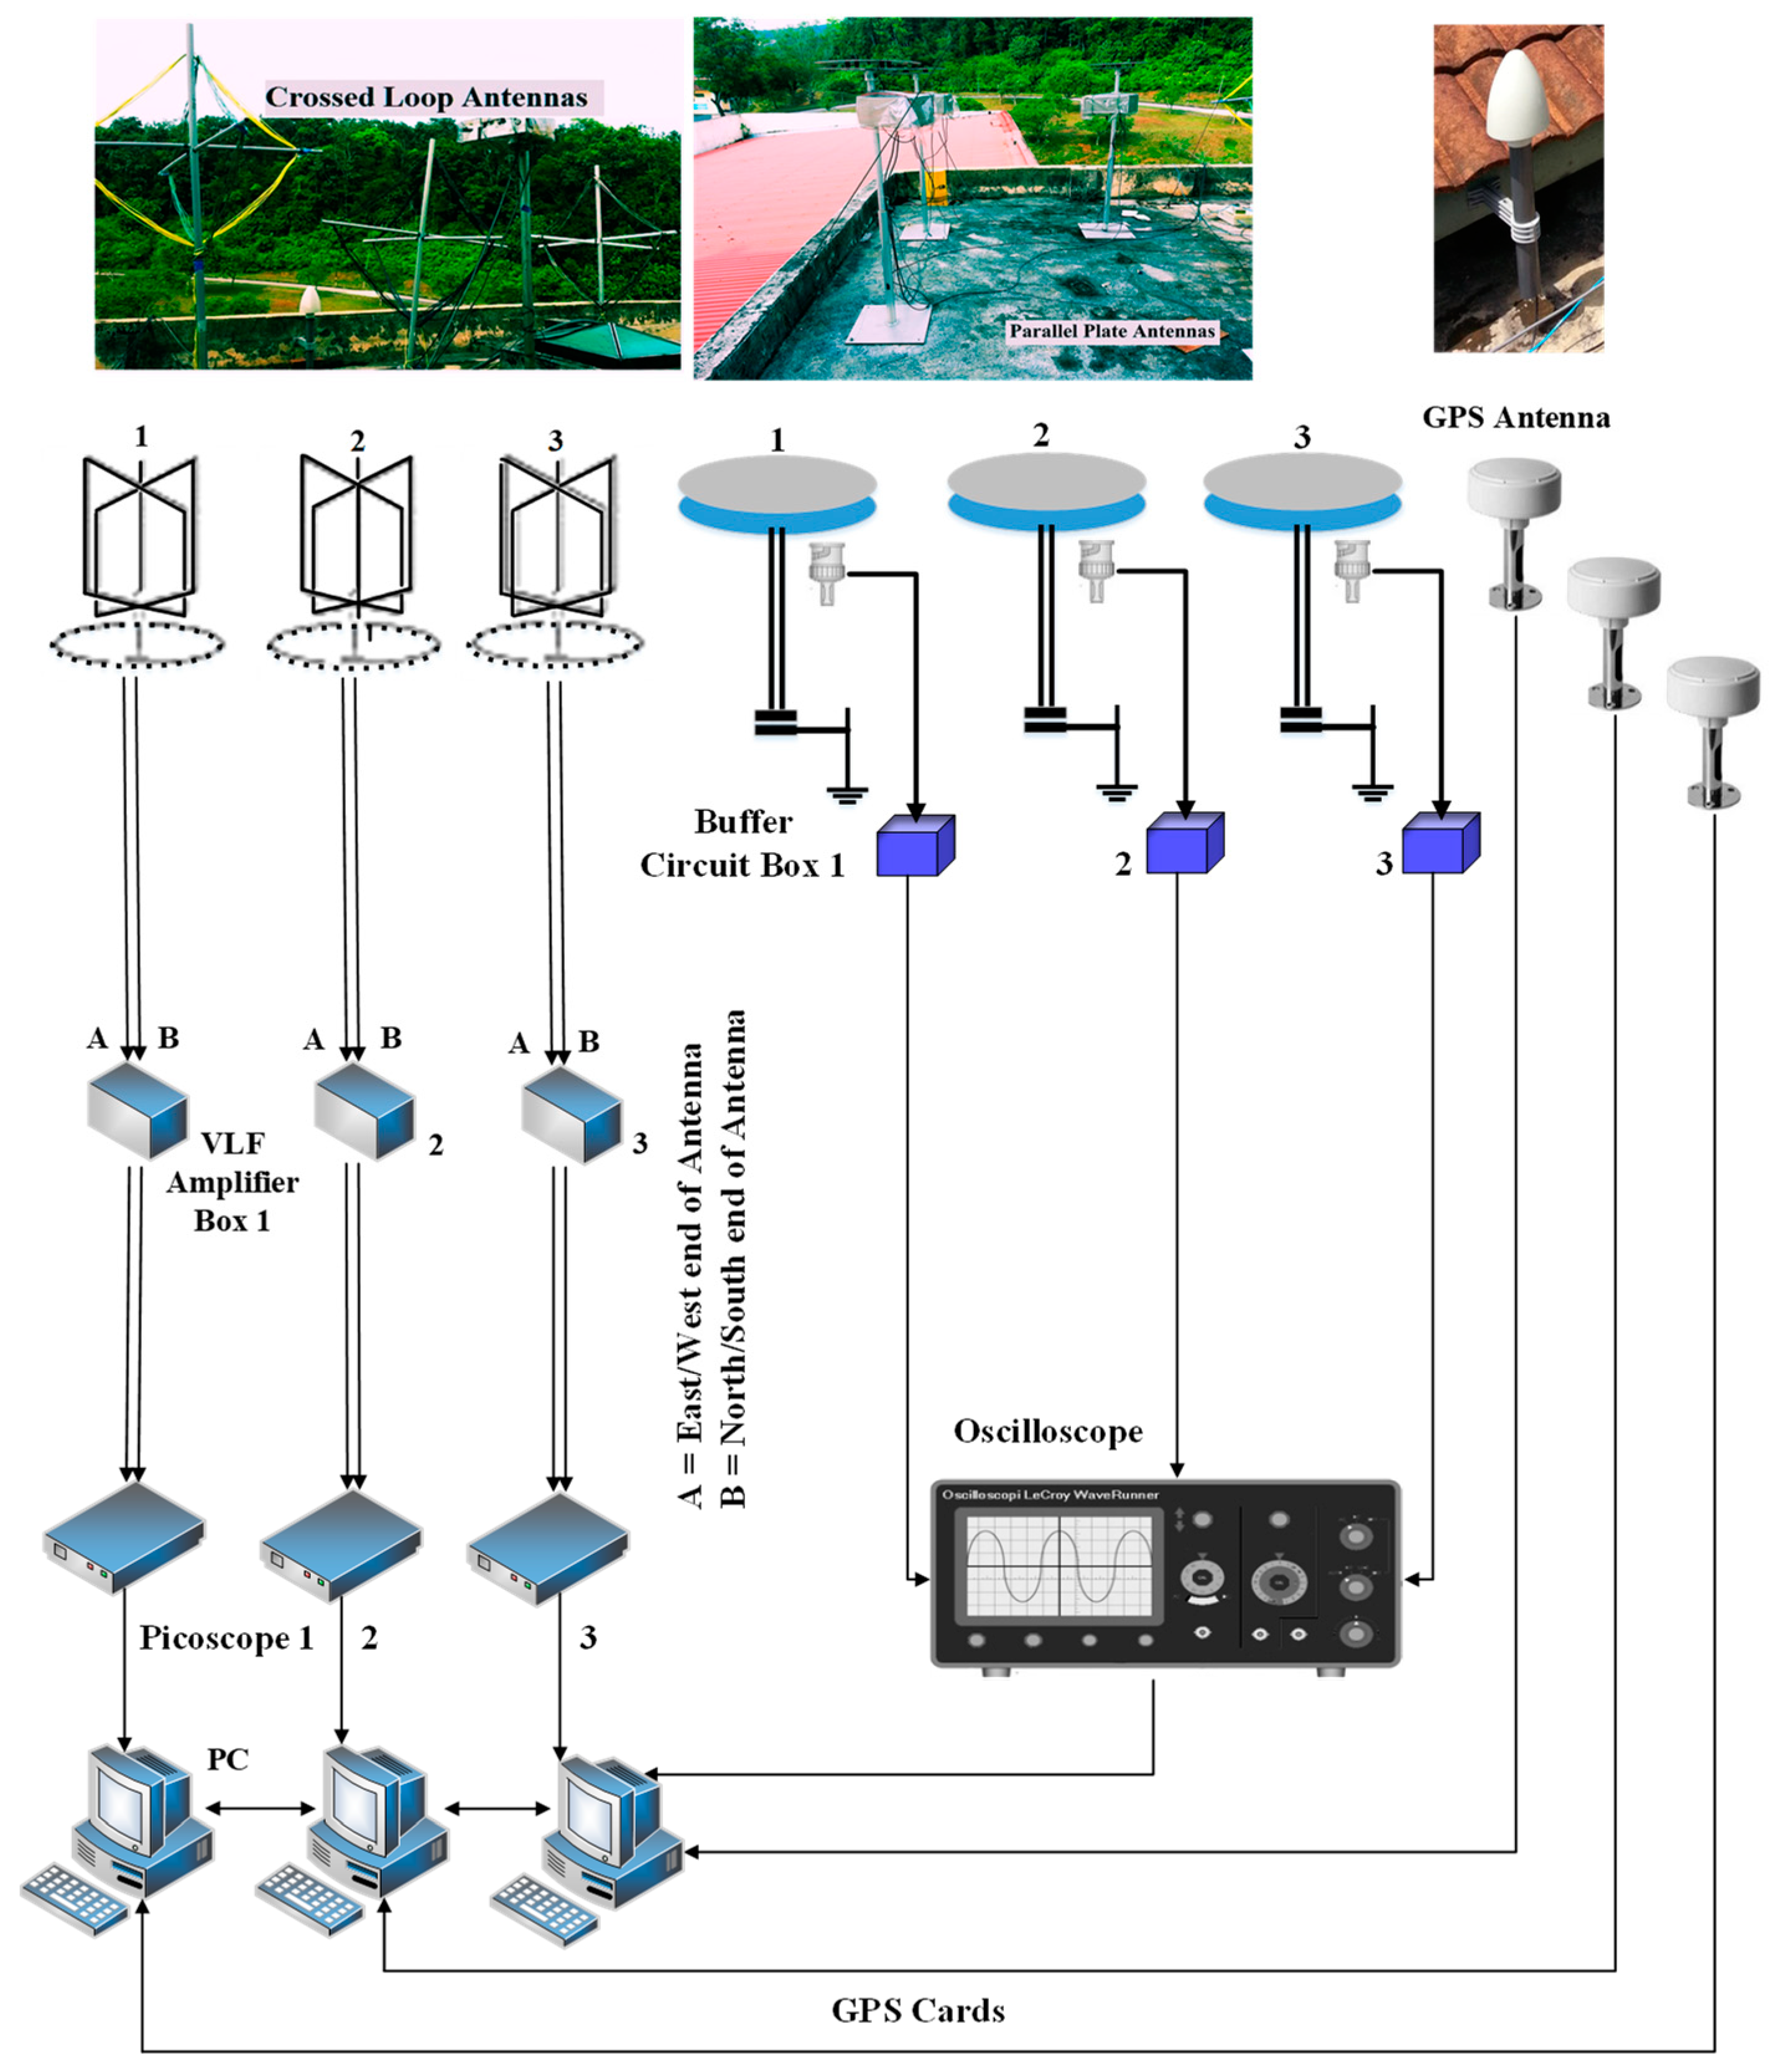
To ensure that the lightning detection equipment was uniform, all three lightning locating sensor systems were placed at the IVAT station for calibration purposes. The goal of this calibration test was to confirm that all the hardware equipment used for lightning detection was identical. To achieve this, three sets of crossed-loop antennas with their amplifiers and three sets of parallel plate antennas with buffer circuits were installed at the IVAT station. The timestamps were saved and synchronized using GPS cards (model: GPS180PEX) to ensure accurate time and location data for the TDOA method. The GPS cards were chosen for their ability to provide more precise time and location information.
The system used GPS cards with a resolution of 100 ns, which provided high-precision time synchronization. The three crossed-loop antennas had the same size, shape, and materials, and the VLF amplifiers were designed with identical components to ensure consistency. It is important to mention that in a lightning locating system, the length of cables and wires from the antennas to data loggers should be the same at all stations.
Figure 4 illustrates the diagram of the calibration system installed for this study. The primary objective of the calibration process was to ensure that all the VLF and VHF sensors could detect the CG lightning activities at the same time with minimal delay. The installed system at the IVAT station was tested using incoming lightning strikes.
In this study, the VLF system captured six waveforms using three crossed-loop antennas, while the VHF system captured electric fields using three parallel plate antennas. These waveforms were then analyzed in MATLAB software to determine the signal delays.
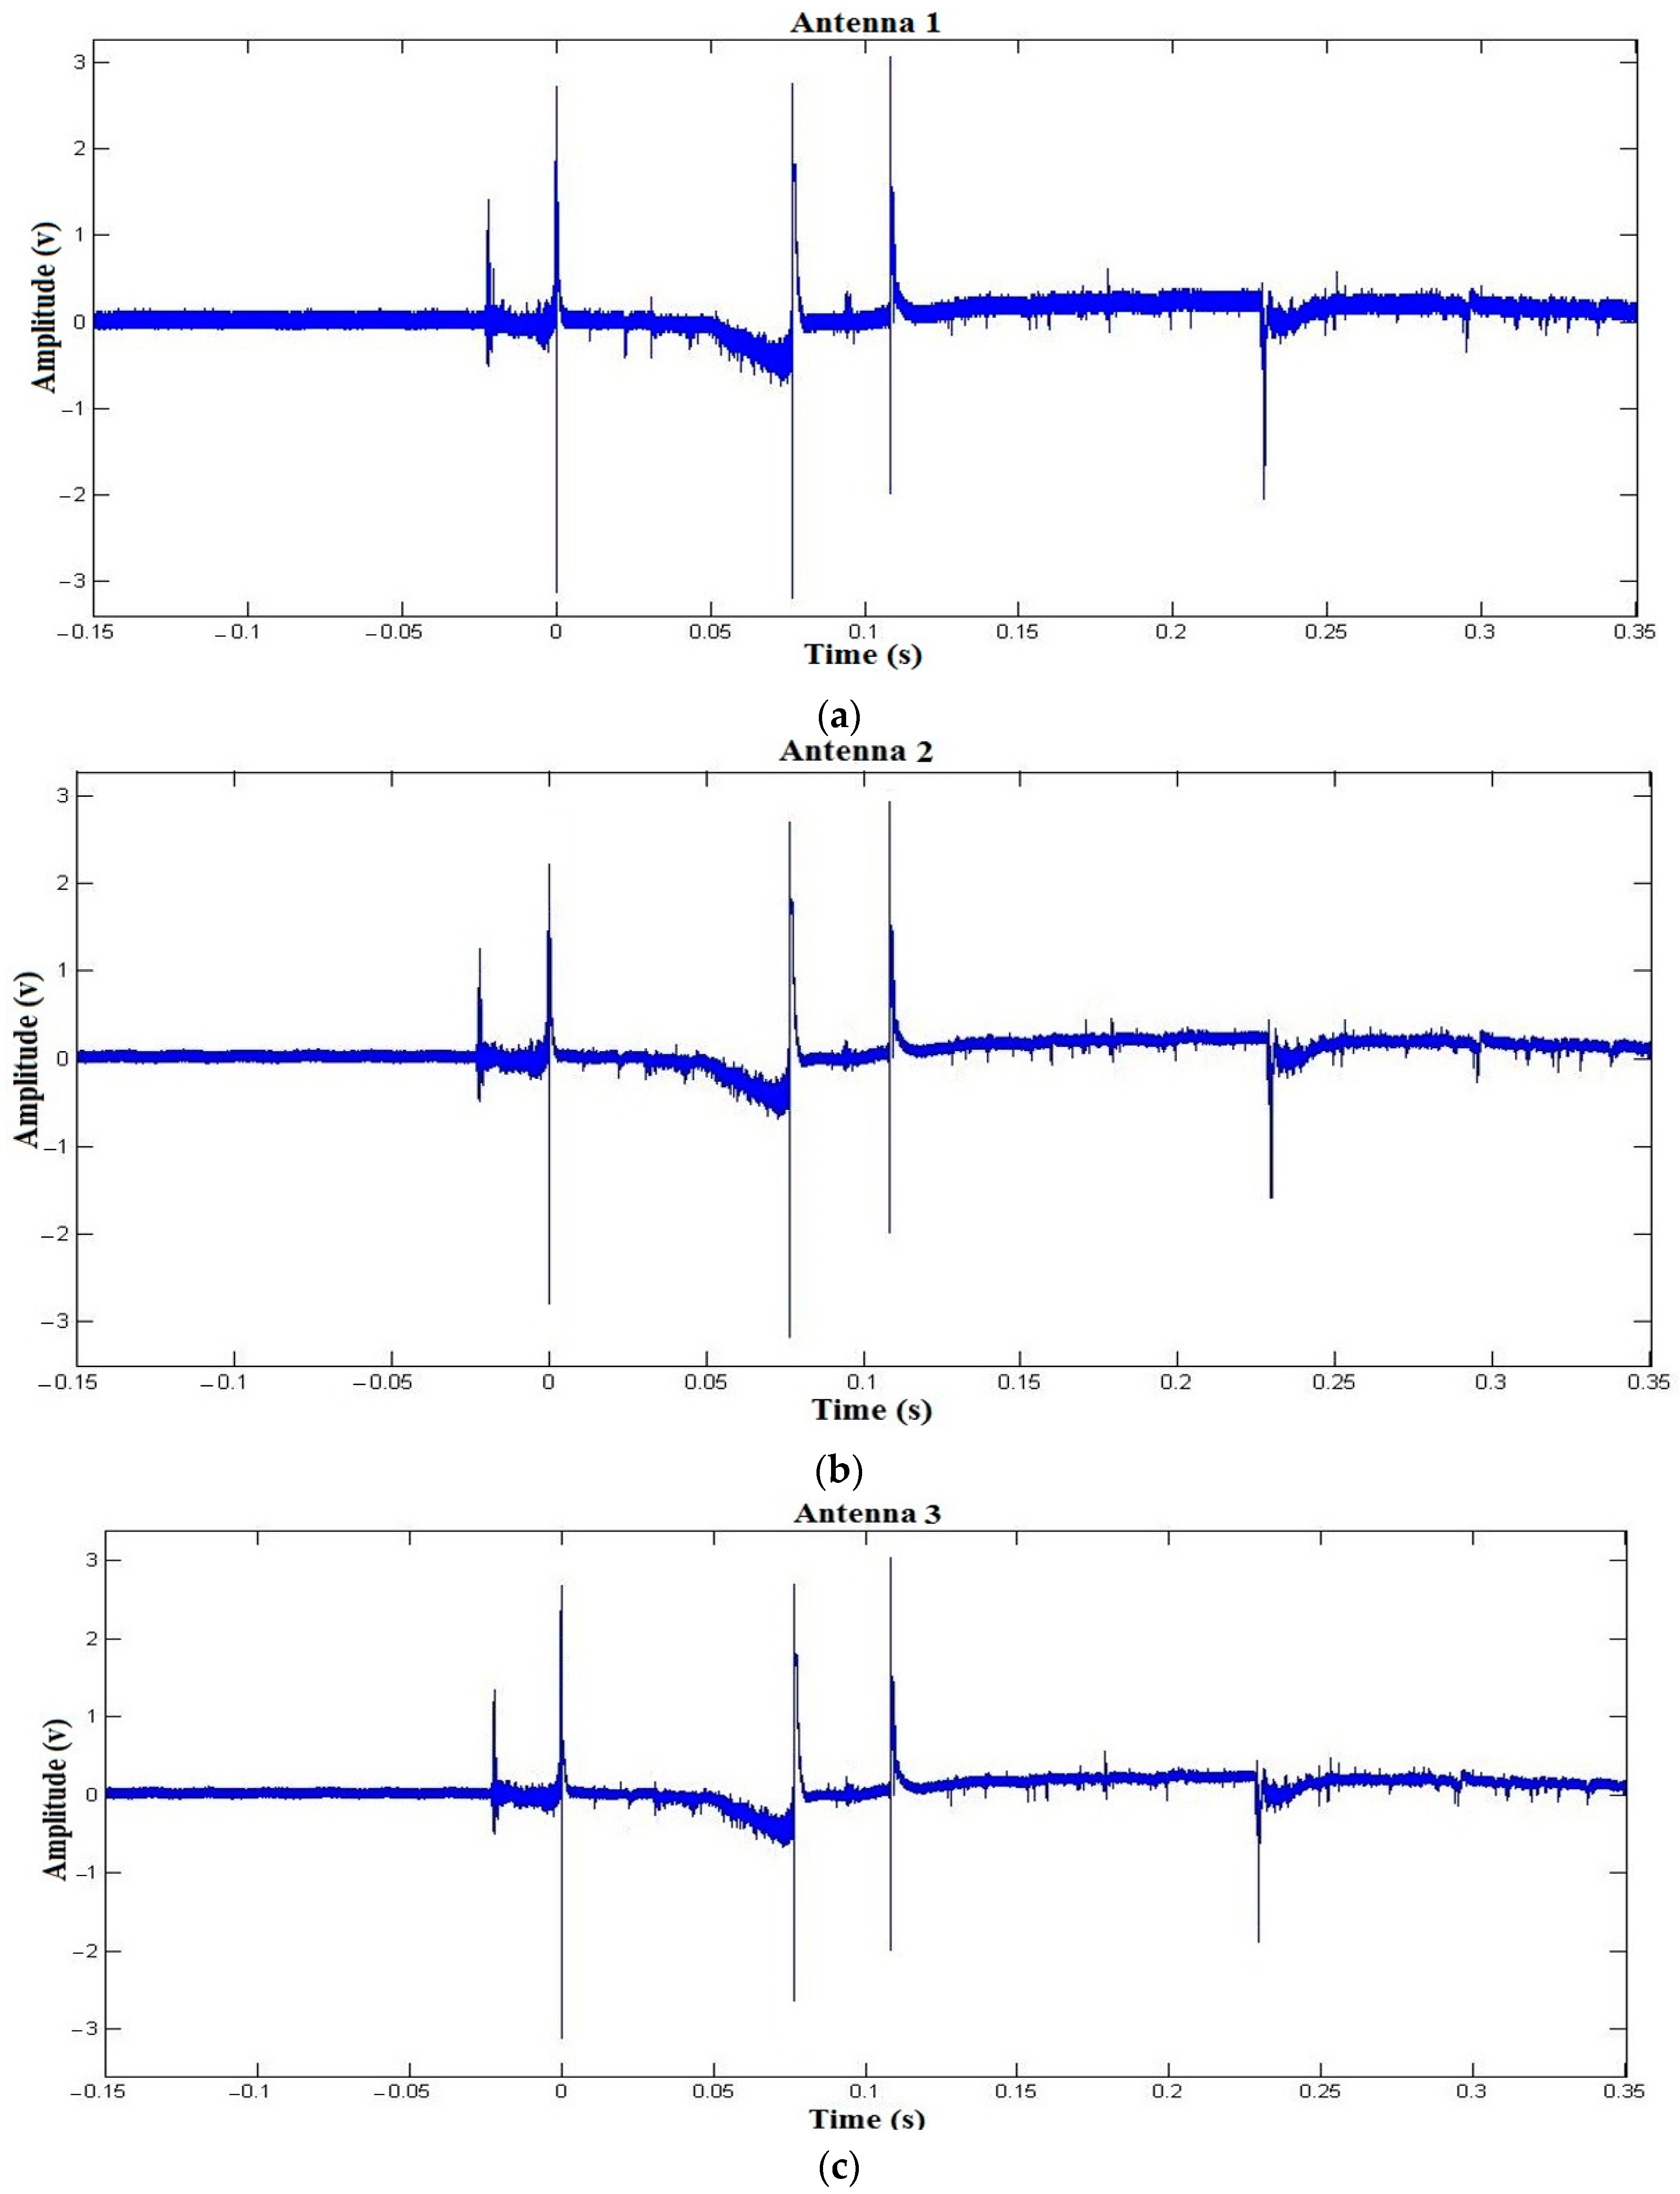
Figure 5 presents three electric field records of a cloud-to-ground lightning flash with 500 ms of time frame detected by antennas 1, 2, and 3 at 15:47:11.2534810 (hour:minute:second 100 ns of time precision). All three GPS cards saved the same timestamps, which means the possible delay time is below 100 ns (GPS resolution). The delay time of 1 ns indicates that the signal has traveled 0.3 m in distance. Hence, if the delay time is 100 ns, it means there is a distance error of 30 m. Therefore, MATLAB software was utilized to analyze the signals and determine the precise time delay.
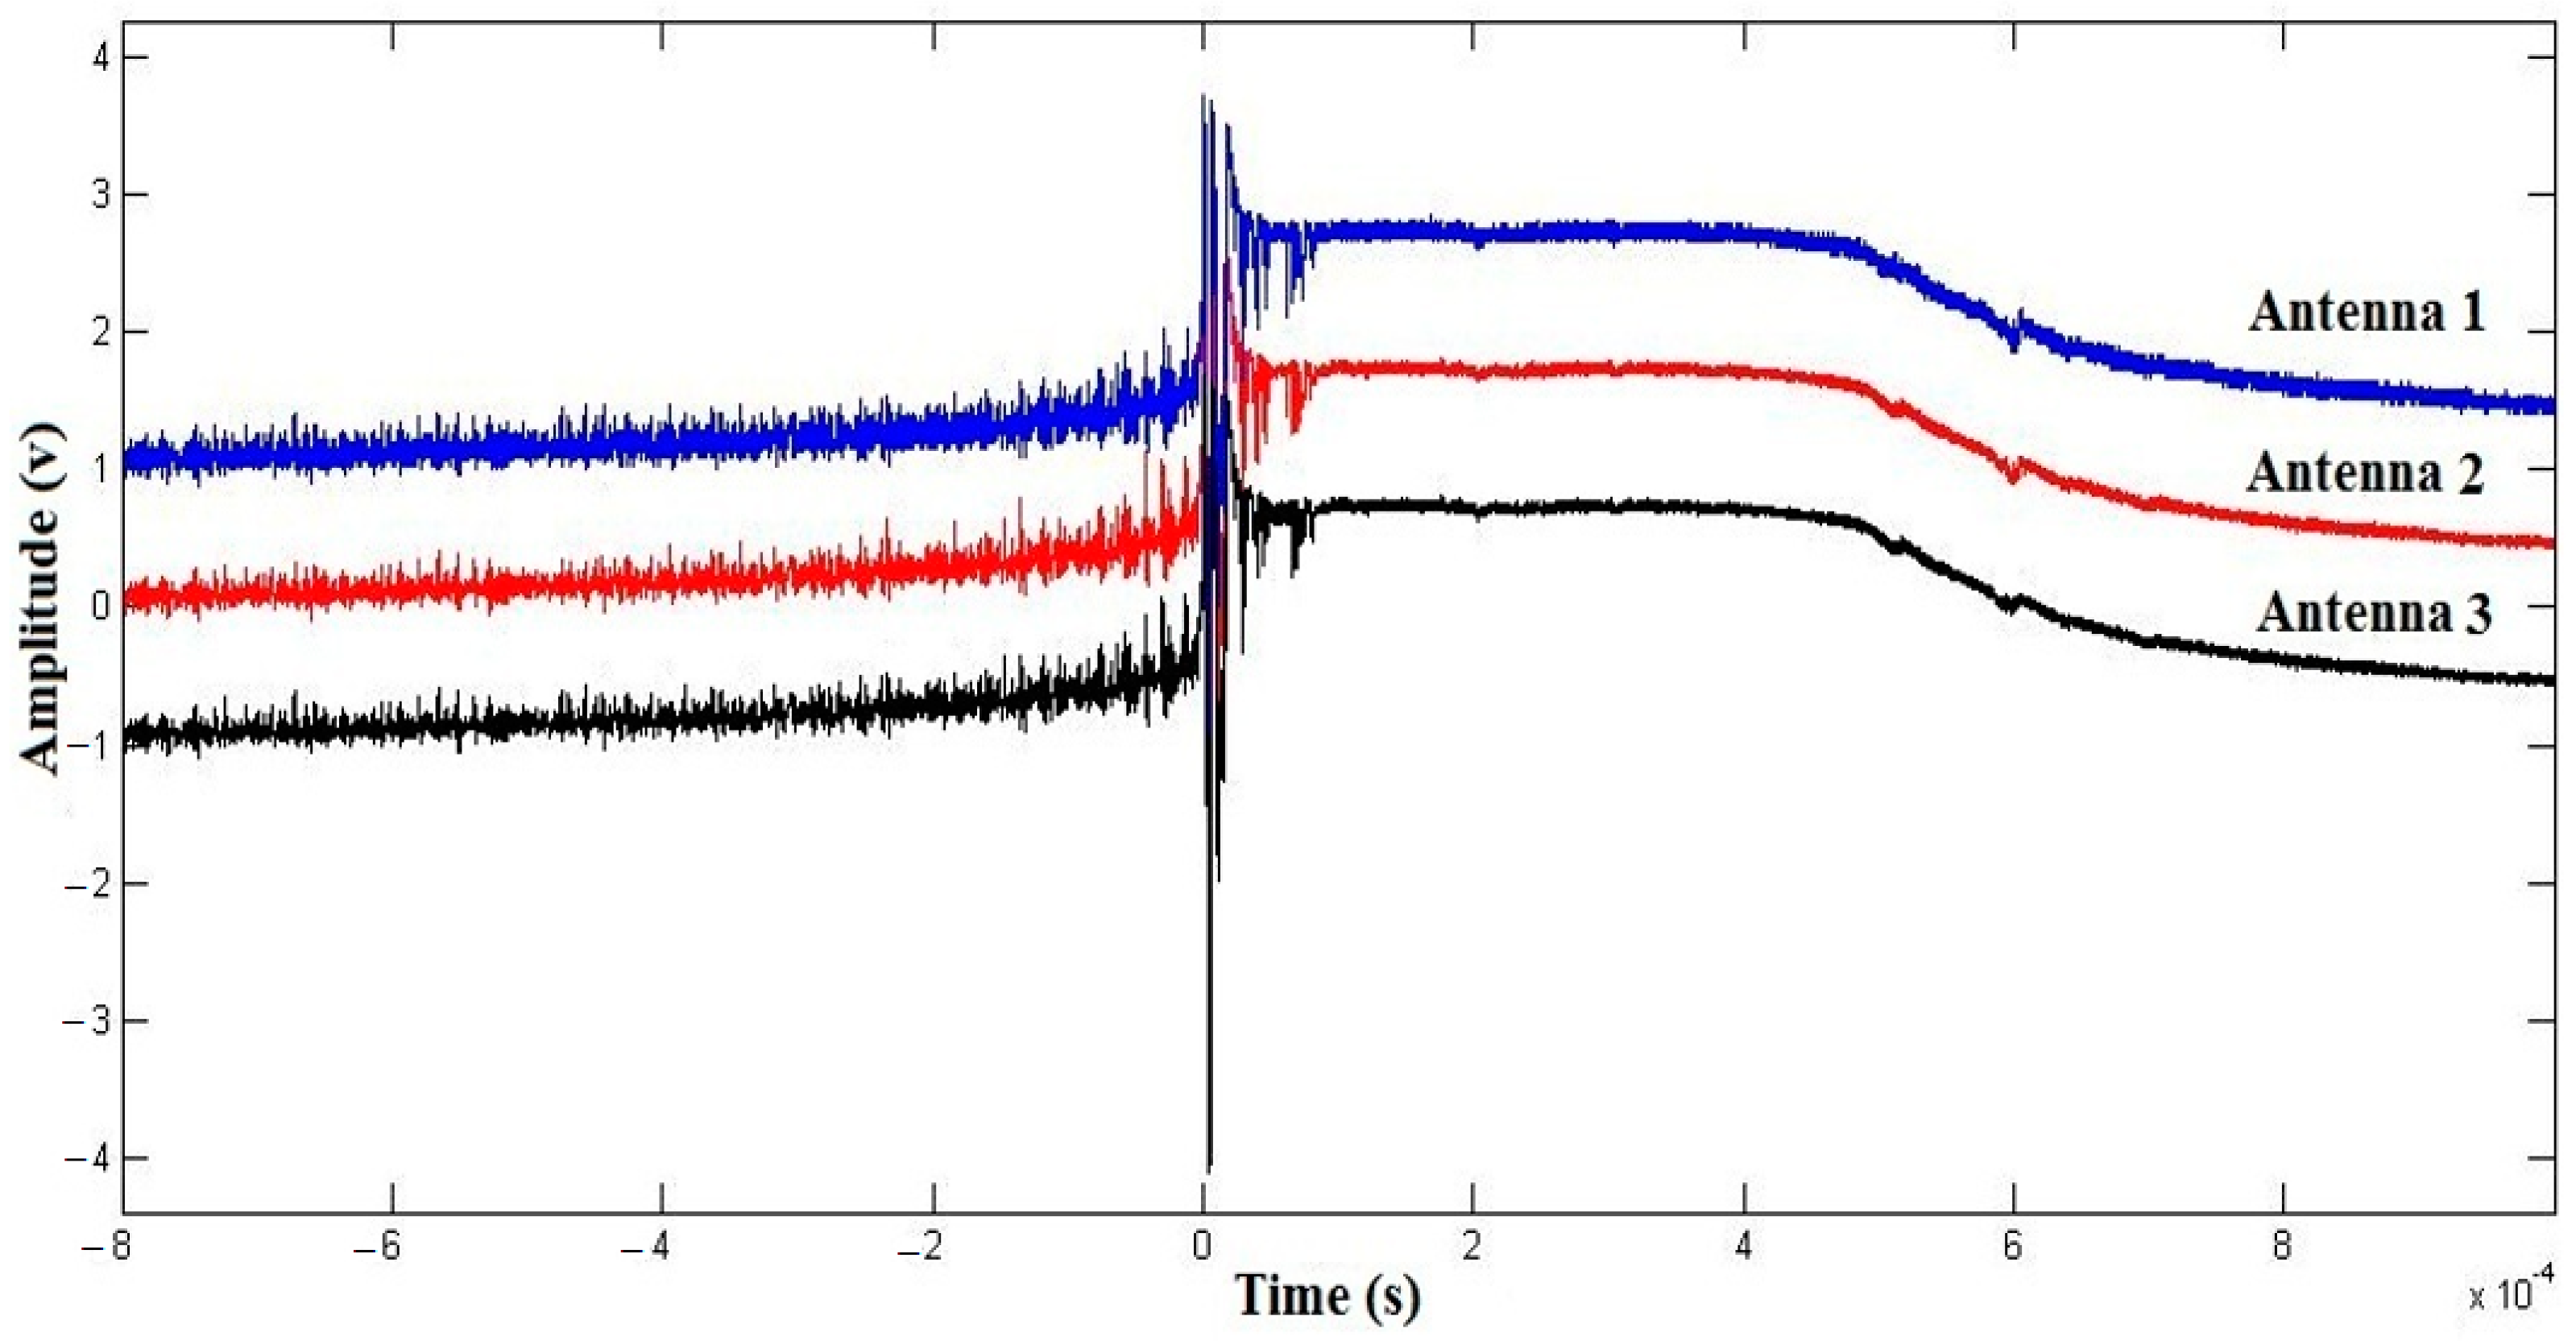
The zoom in of the first return stroke (time zero) of three captured electric fields in
Figure 5 is presented in
Figure 6 to check the possible delay between the waveforms. In
Figure 5, the delay between the captured waveforms by antennas 1–2, 1–3, and 2–3 were 50 ns, 55 ns, and 50 ns, respectively. Corresponding magnetic fields to all electric fields in
Figure 5 at a similar time were captured by crossed-loop antennas. The delay time between each pair of six magnetic field signals was calculated and analyzed using MATLAB software. Mathematical calculations were used to find the exact delay time between the signals, as the waveforms had a remarkable resemblance to each other.
The calibration test has been repeated for 20 CG lightning events and an average delay time of 50 ns was reported. Therefore, it can be said that the additional delay time was due to different system characteristics of the stations, electronic component’s characteristics, and other inconsistencies such as differences in the cable length between the employed equipment at the stations. The delay time observed was very low, and it was less than the resolution of the GPS cards used, which was 100 ns. Hence, this delay time was ignored in this research.
3. Methodology
3.1. Combined Techniques
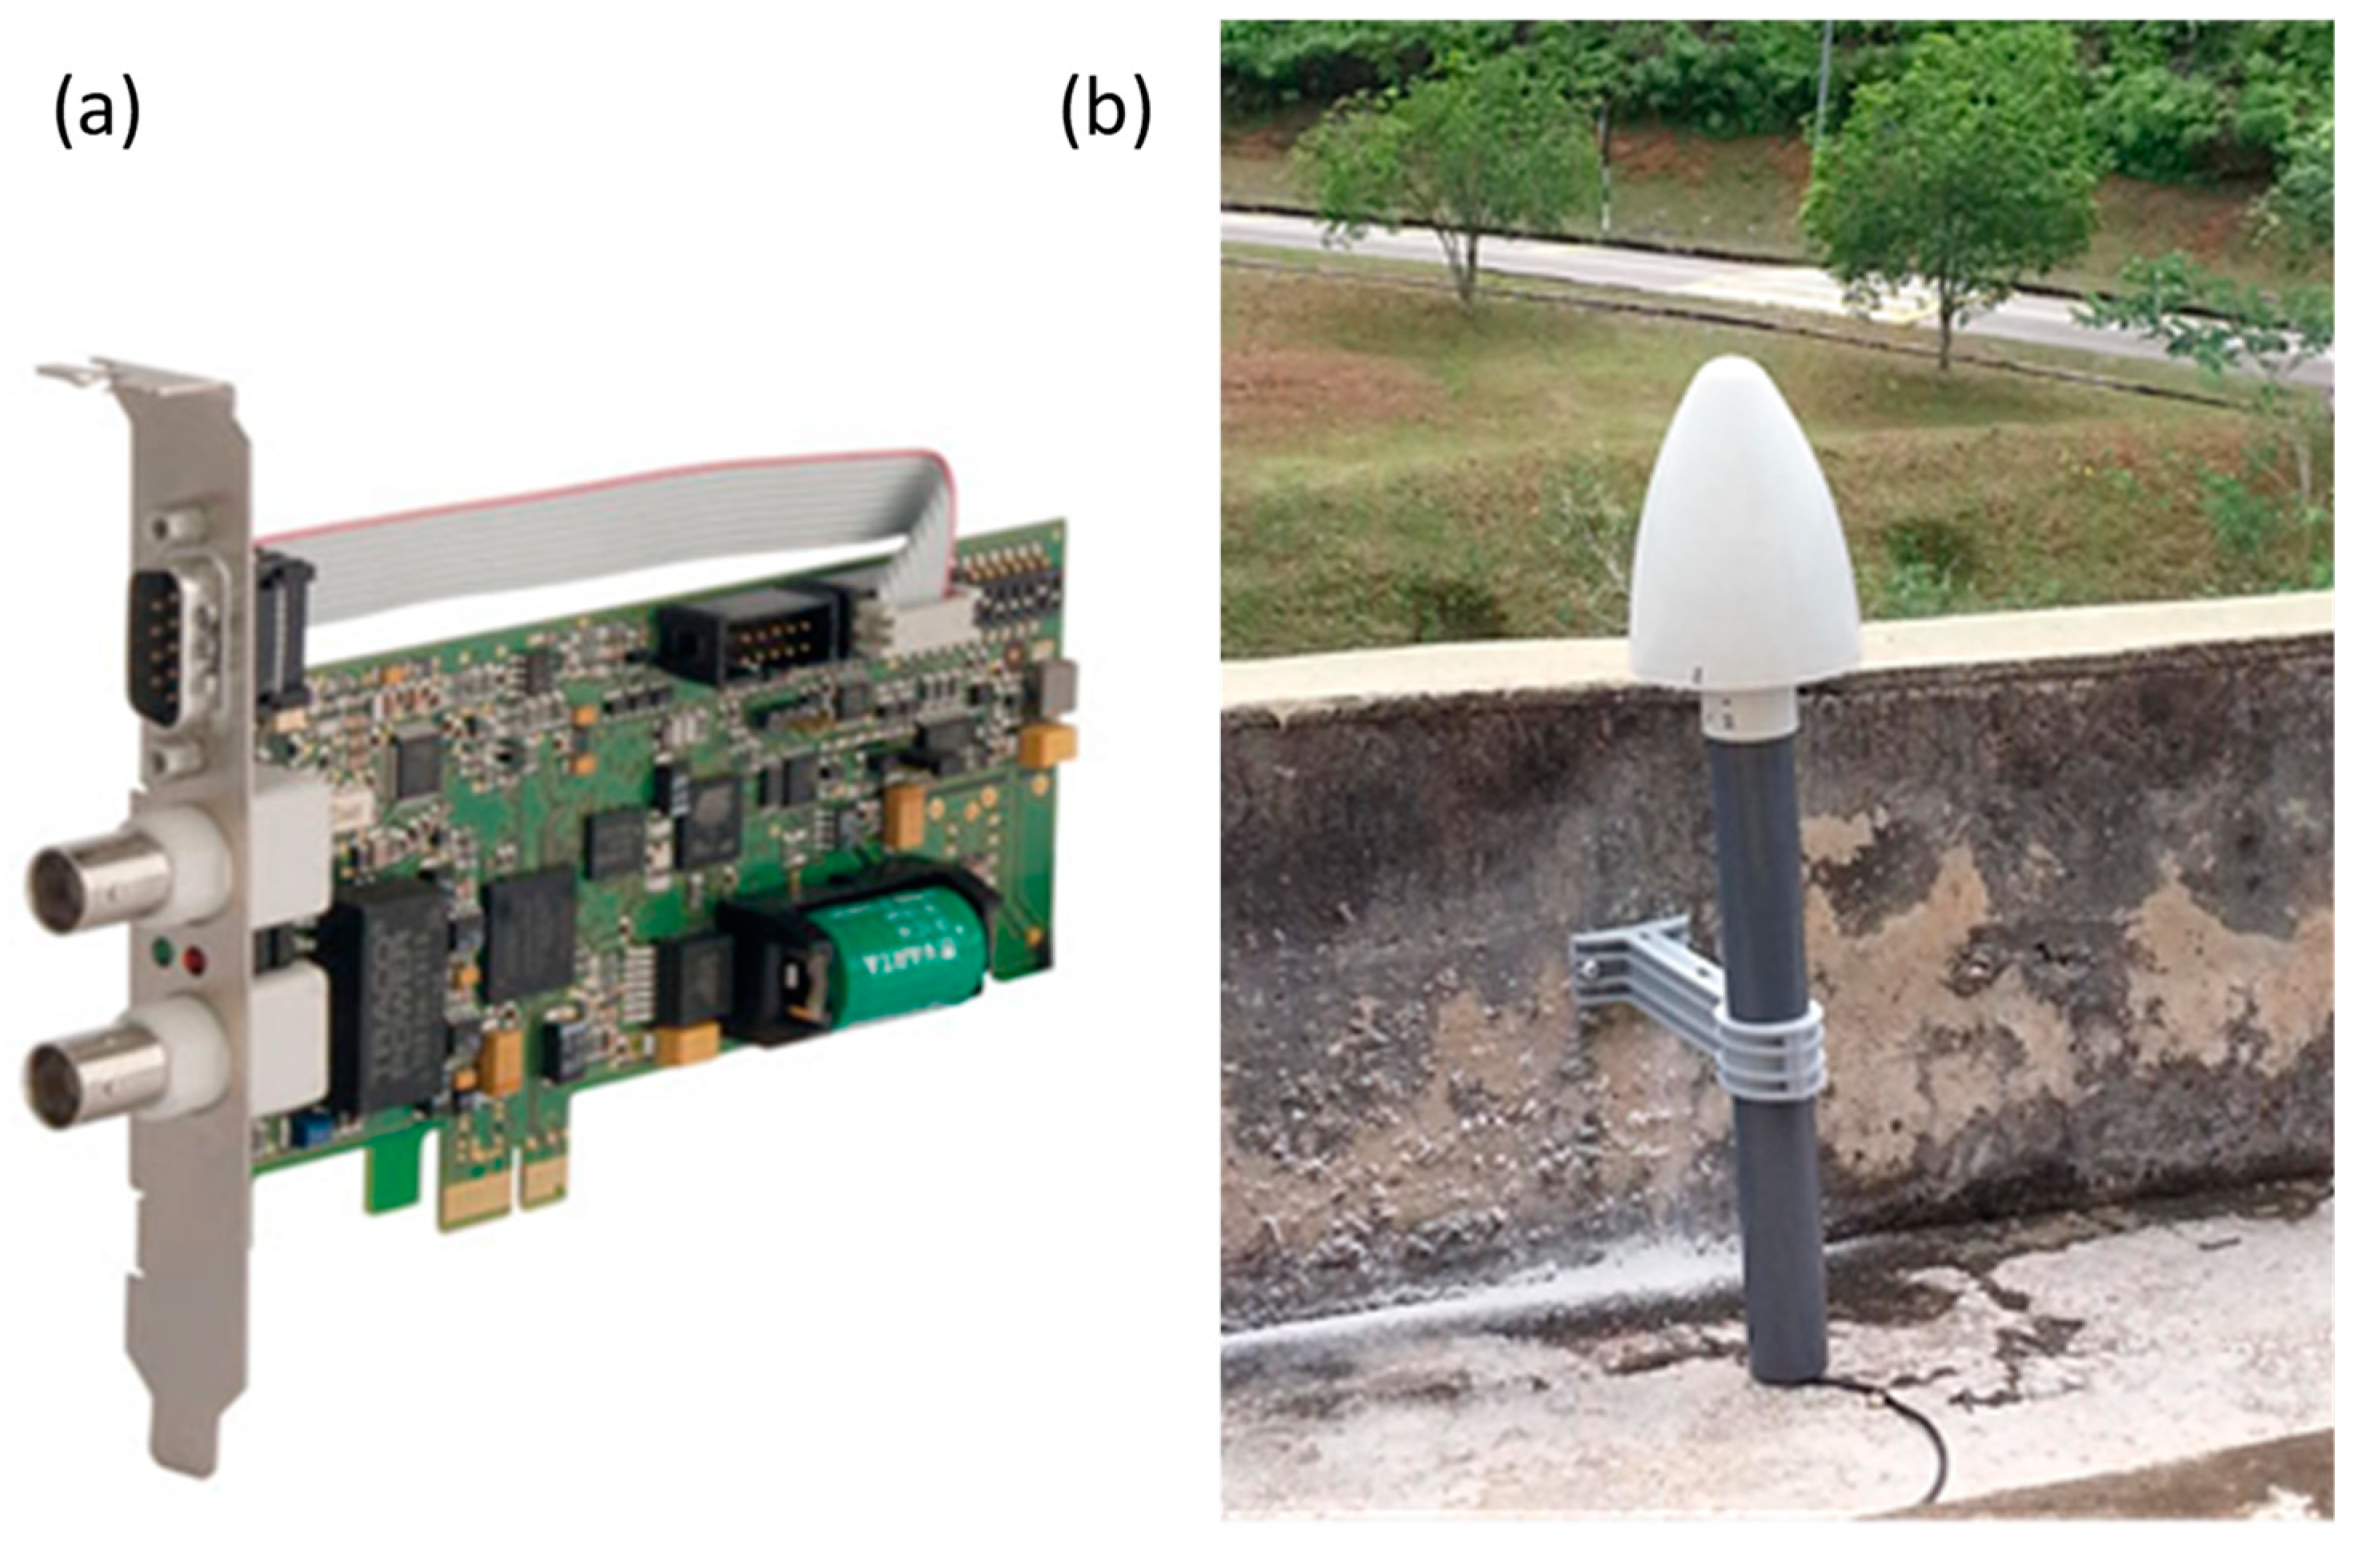
The time of occurrence of the first return stroke is extracted by high-resolution GPS antennas. The GPS cards are responsible for capturing accurate time and these timestamps are used in the TDOA method. The photos of the GPS card and its antenna are presented in
Figure 7. This PCI Express slot card was the best choice for adding a highly accurate time base to the server and workstations. GPS180PEX is a low-profile board for computers with a PCI express interface. The rear slot cover integrates the antenna connector, a BNC connector for modulated time codes, a 9-pin D_SUB male connector, and two status LEDs. The resolution of pulse outputs is 100 ns.
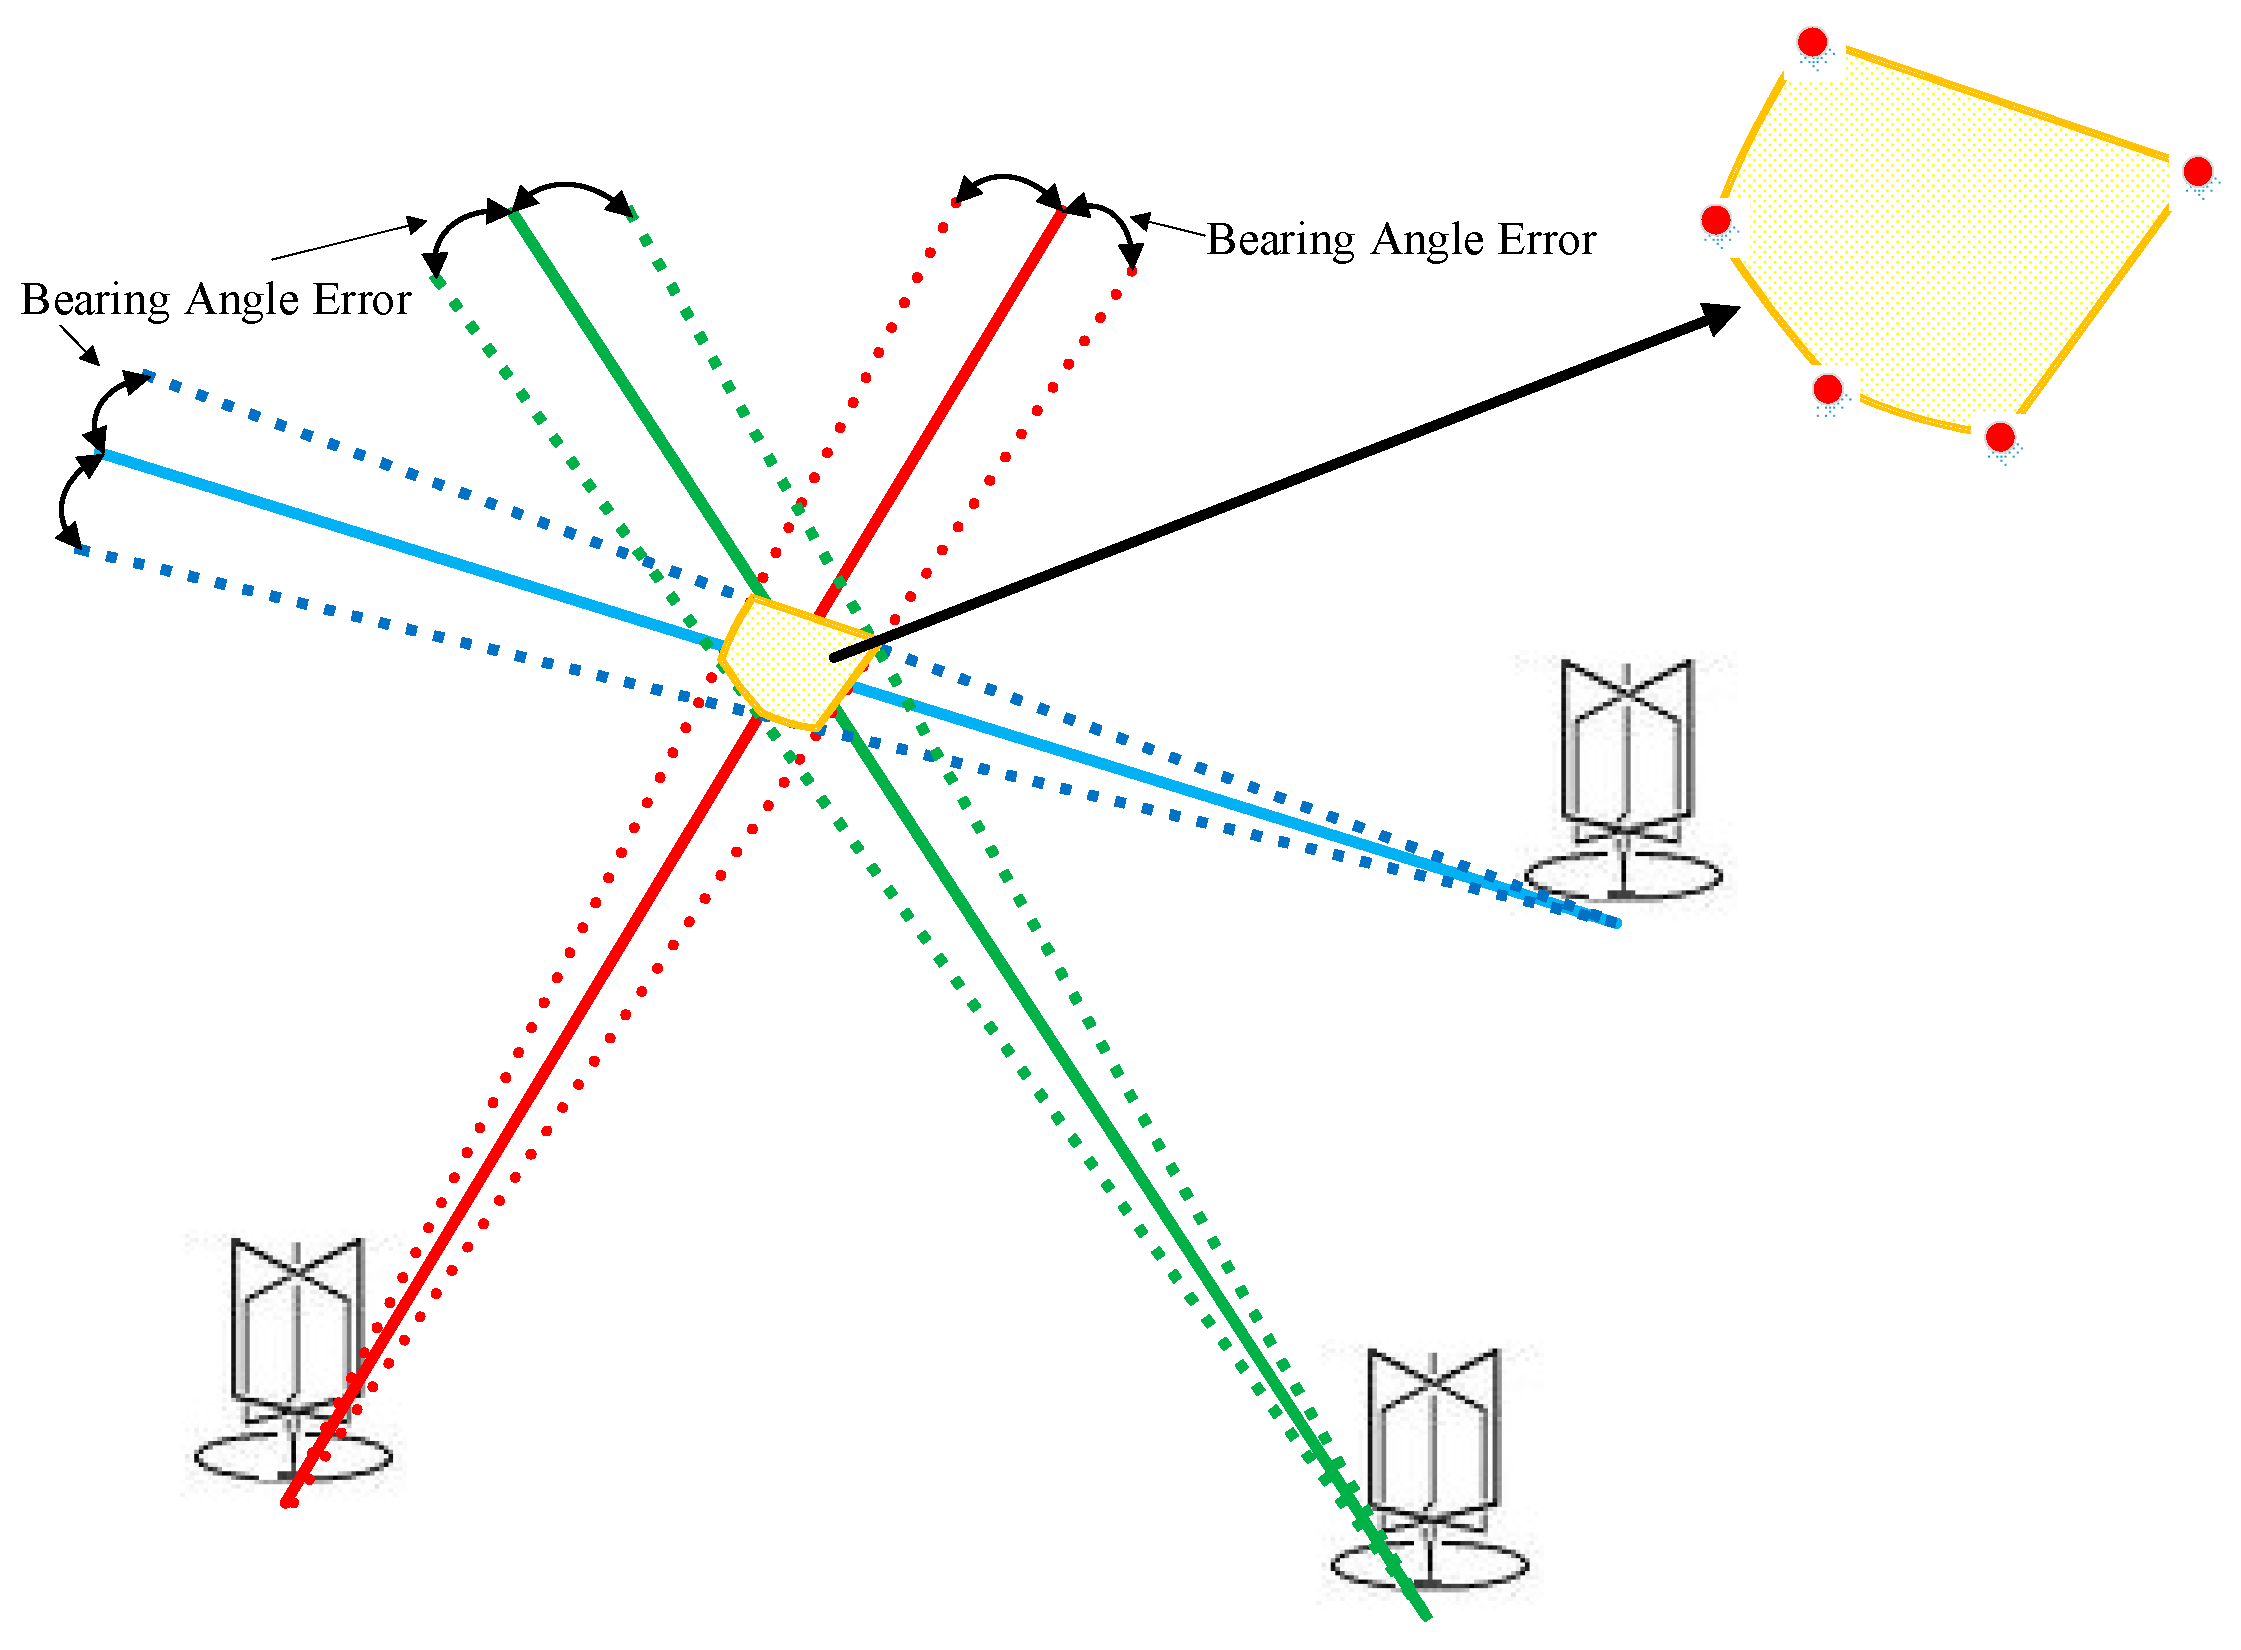
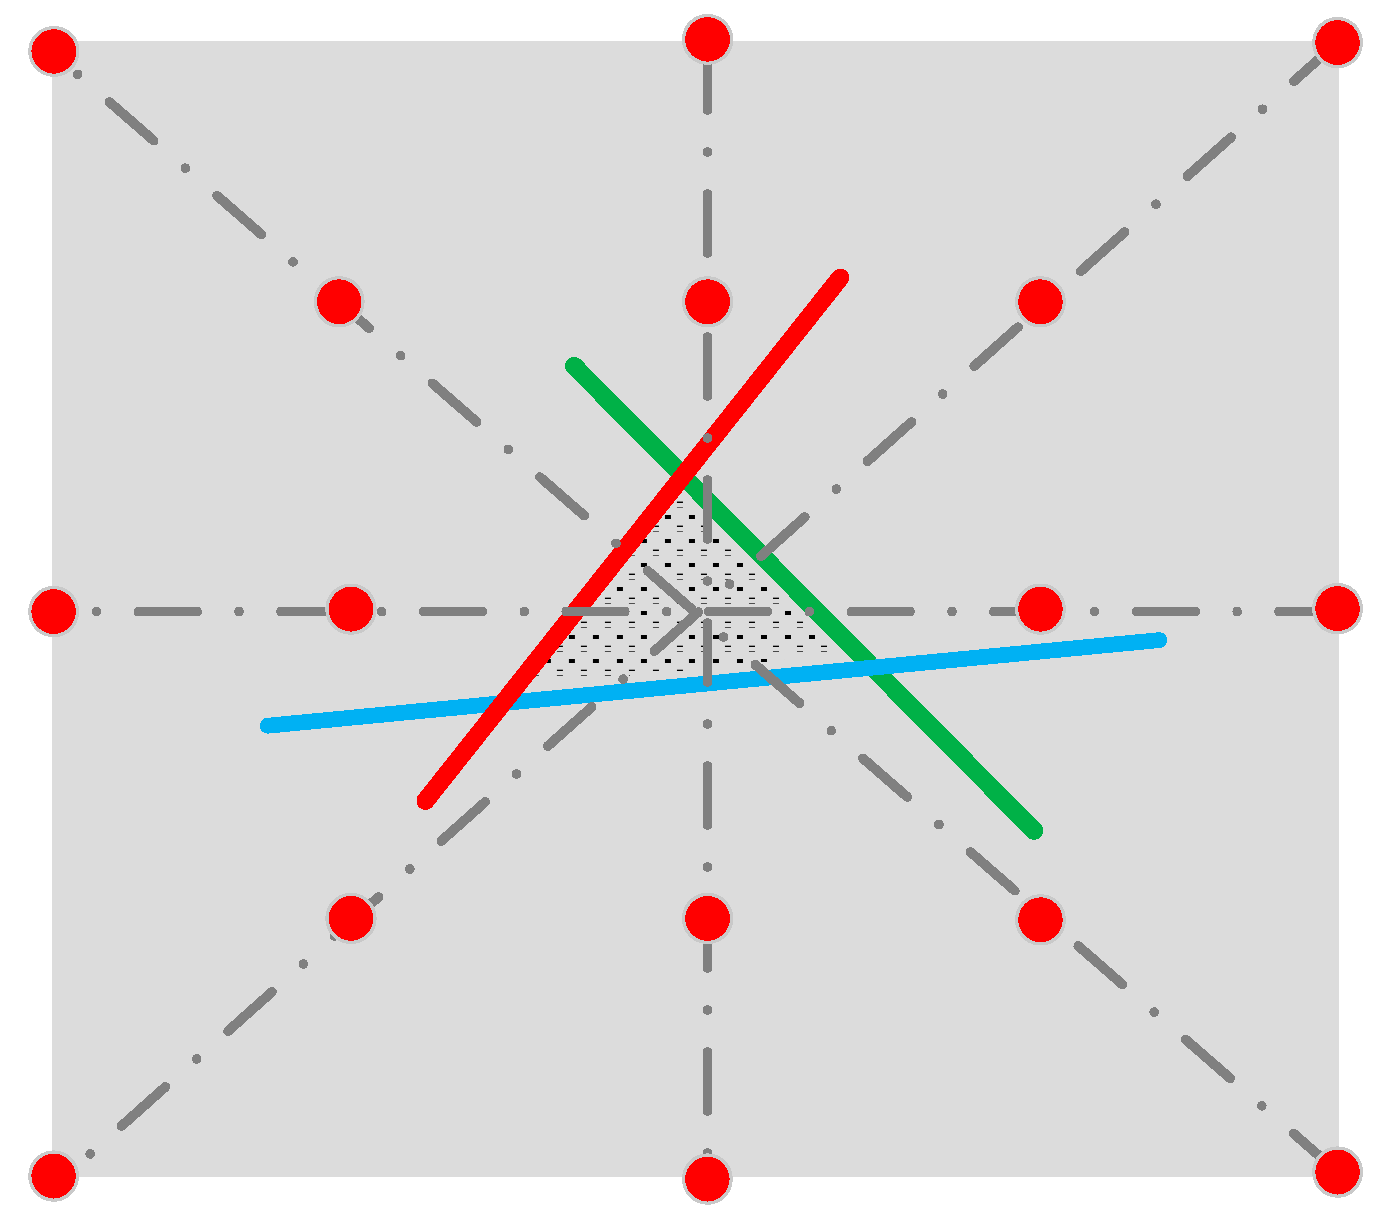
The MDF method can provide the location of the discharge with a minimum of two sensors but the location error is expected to be dependent on the distance growth. Hence, it is necessary to decrease the site error by adding extra measuring stations. MDF triangulation and TDOA have been implemented in the current study. Due to the limitations and distance errors associated with each method based on the topology of the stations, it is proposed in this study to combine the implemented algorithms to optimize the results and achieve the localization of the lightning point with the lowest possible error. The azimuth error of each crossed-loop antenna should be taken into consideration. If a three-station MDF system is used, each antenna provides a lightning direction with bearing errors, resulting in intersecting lines at each station that determine a location area, as shown in
Figure 8. The site error is caused by the nearby structures, such as buildings, power lines, and cables. On the contrary, the total random error arisen from non-vertical channels, the noise of background, and MDF electronics is usually 1–2°.
The TDOA based on three stations may produce more than one result (one real point and one or more ambiguous points). Regarding the localization methods, to make use of the intersection of hyperbolas in the TDOA method, it is required to install at least four stations to measure lightning flash to provide one unambiguous solution. These results provide other candidates for the PSO algorithm.
3.2. Particle Swarm Optimization (PSO)
According to the references [
51,
52,
53], PSO as an artificial intelligence (AI) technique is employed to find the approximate point of the lightning strike using available particles. The PSO algorithm employs a population of individuals to explore promising regions of the search space in a synchronous manner. In this algorithm, the population is referred to as a swarm, and the individuals or search points are called particles. Each particle in the swarm represents a candidate solution in the optimization problem. The PSO algorithm enables particles to explore the search space by adjusting their position through an adaptable velocity. During this process, particles take into account their own experience as well as that of their neighboring particles. They also retain the memory of the best position they have encountered. This way, each particle utilizes its own and its neighbors’ best positions to position itself towards the global minimum. The effect is that particles “fly” towards the global minimum, while still searching a wide area around the best solution [
51,
52,
53]. The performance of each particle (closeness of a particle to the global minimum) is measured according to a predefined fitness function, which is related to the problem being solved.
Eberhart and Kennedy in 1995 developed PSO as a global optimization technique [
54,
55,
56]. PSO exhibited good performance in finding solutions to static optimization problems. A particle swarm optimization algorithm was applied in this study as the combination mediator to find the optimum point of the lightning strike. PSO is a search engine whose working principle is based on the social information sharing of a swarm [
57,
58,
59].
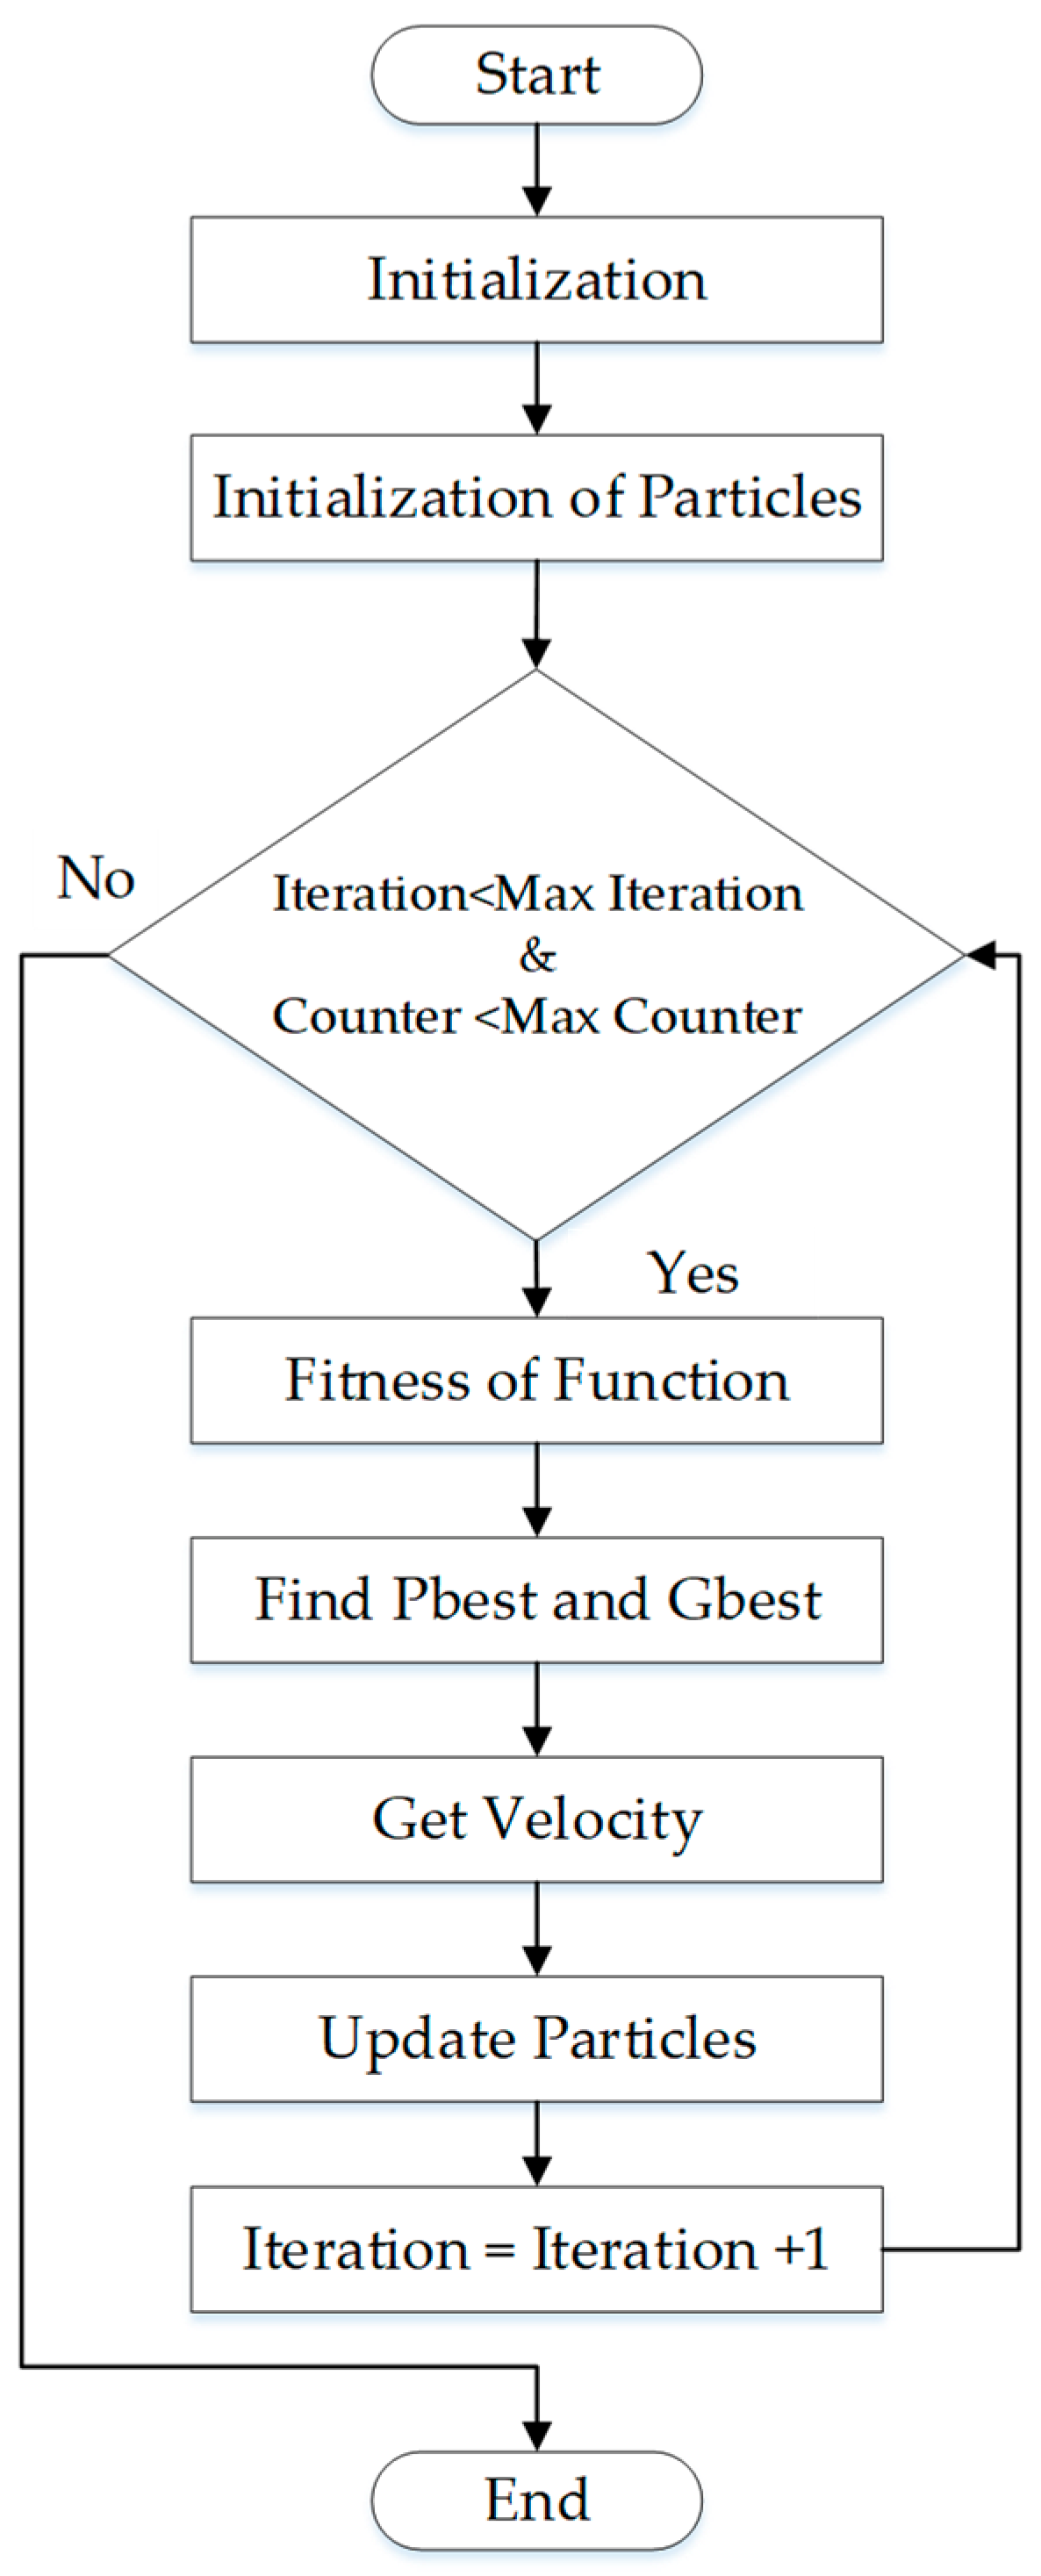
PSO models the swarm as particles existing in multi-dimensional space. These particles maintain a record of their personal best position and have knowledge of the global best position. Communication among particles in the swarm occurs by modifying their position and velocity [
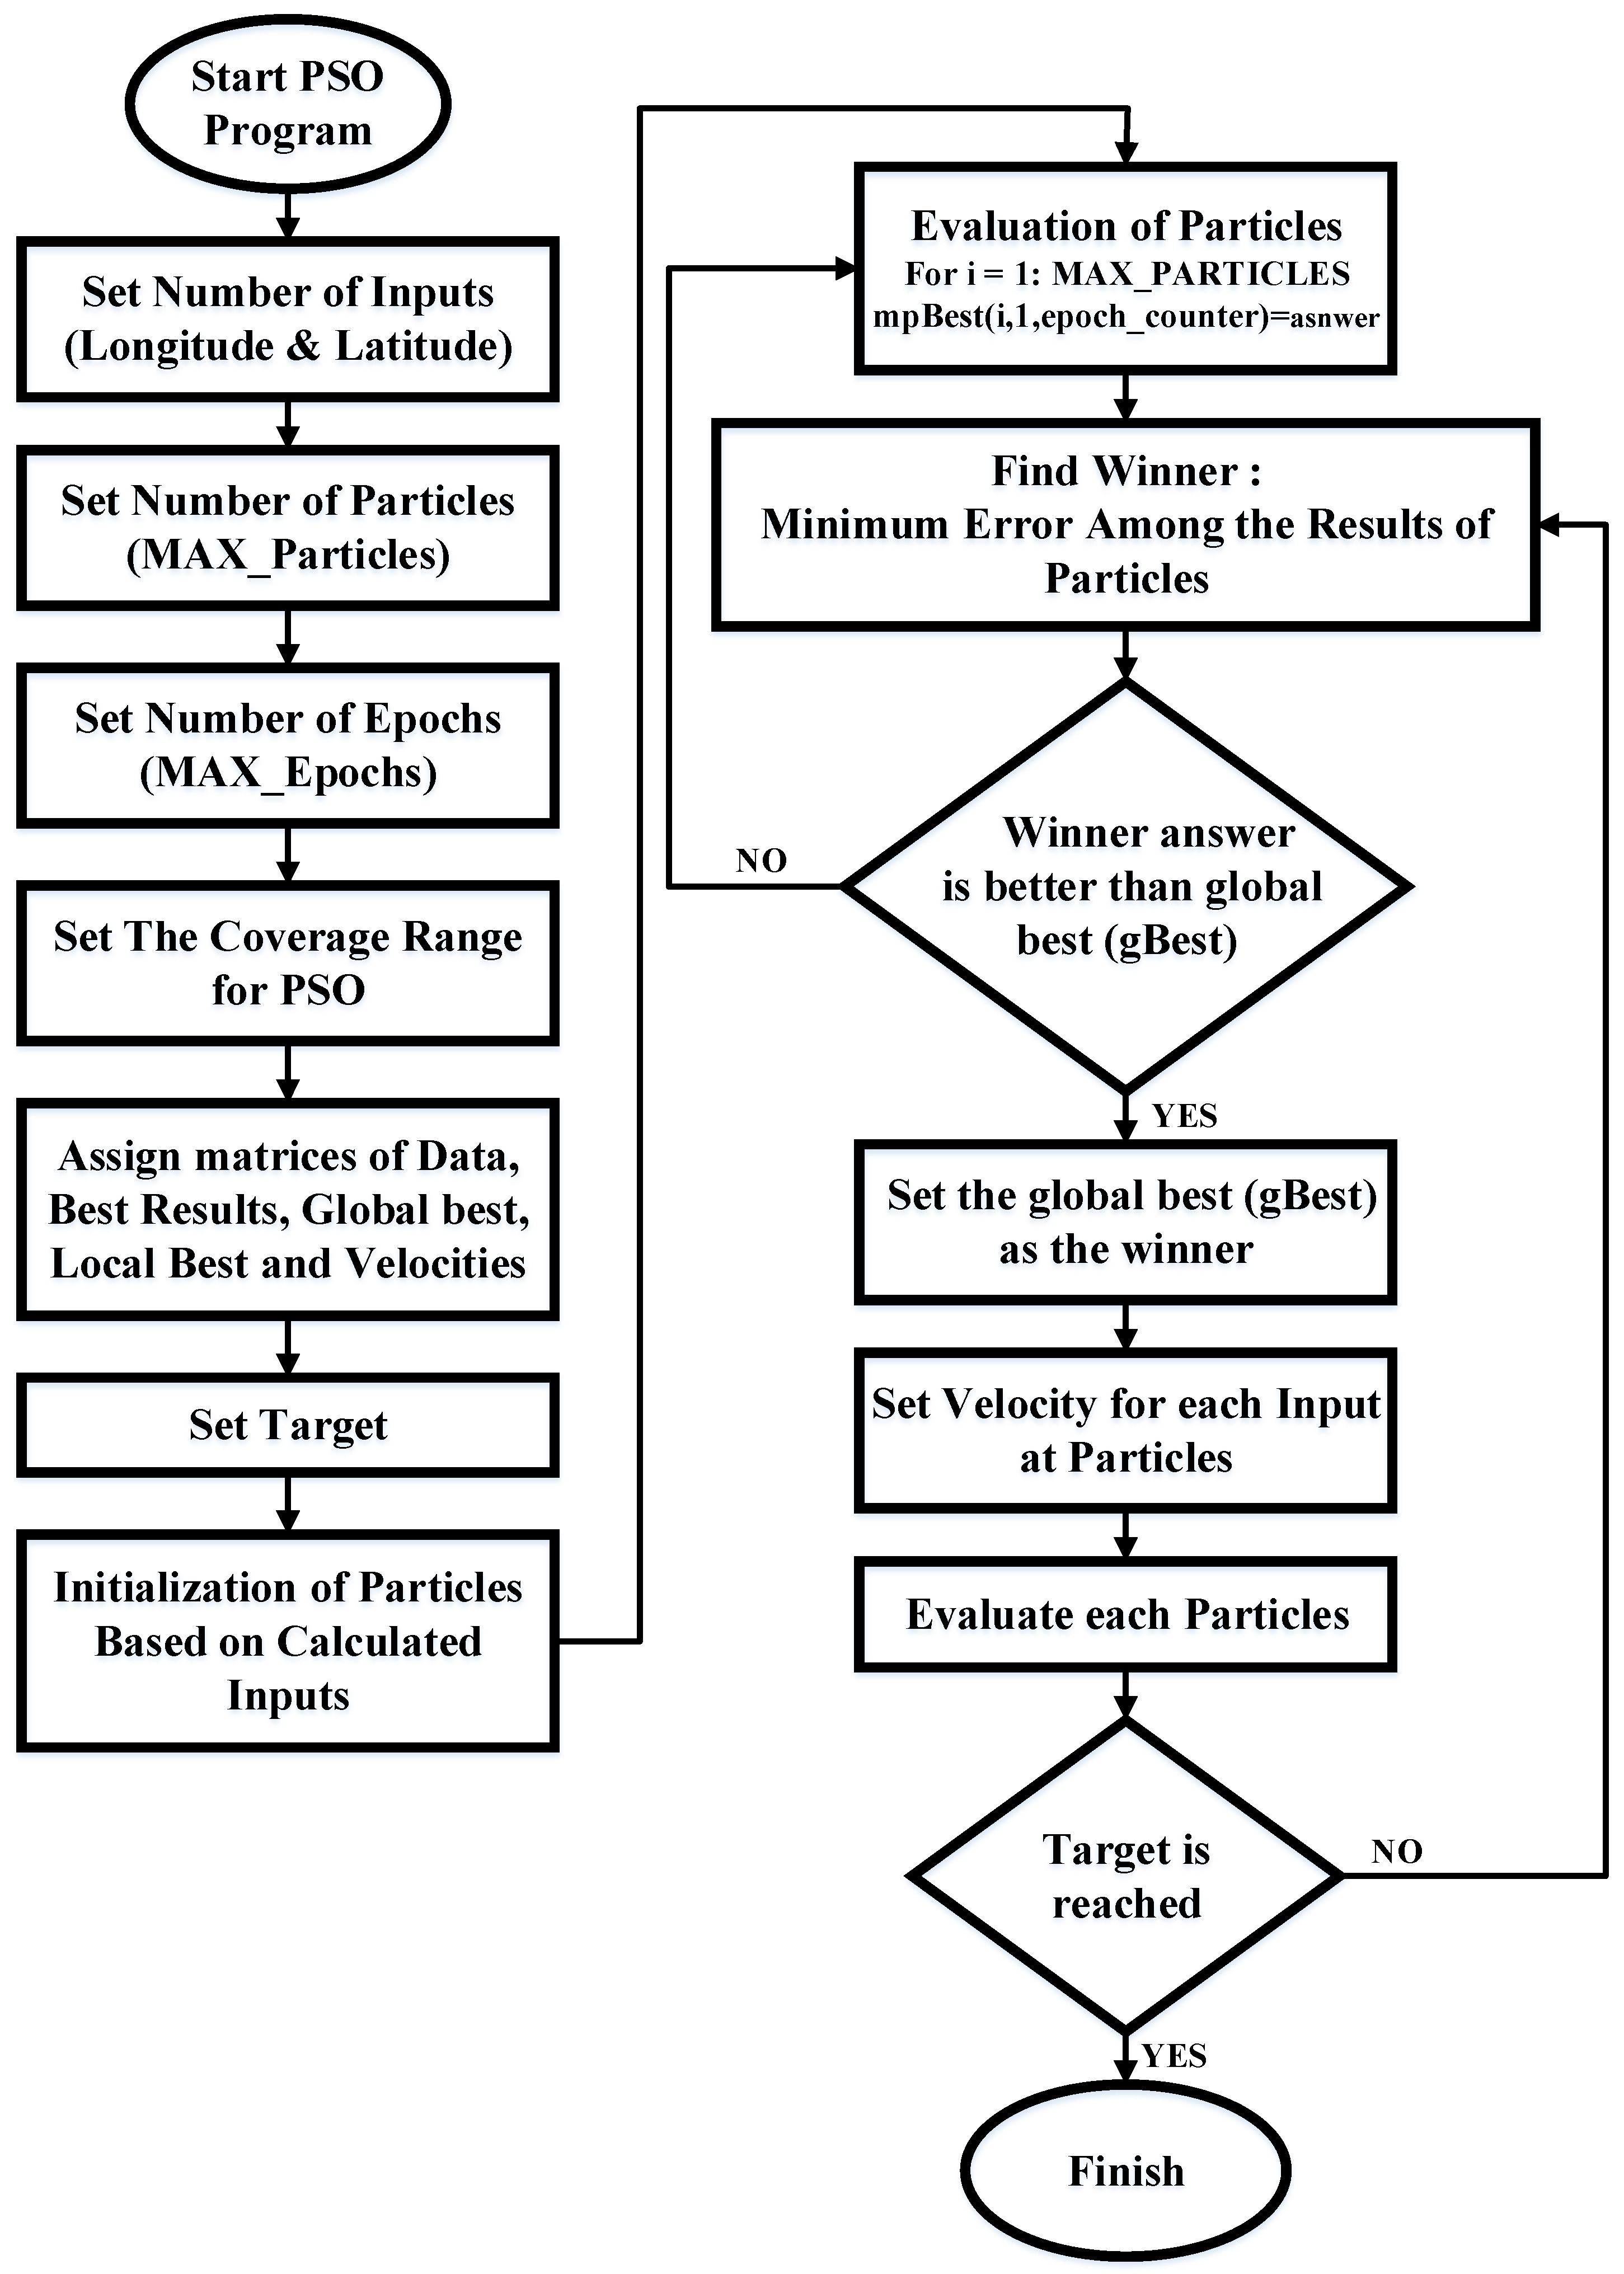
60]. In order to give a better understanding of developing the PSO algorithm, a flowchart is presented in
Figure 9 as the basic or standard PSO.
First, the algorithm starts by initializing all the related parameters that will be used in the algorithm. Depending on the number of tuning parameters, a set of particles will be initialized. The initialization will be based on the calculated numbers and random values. The random values are obtained using the defined range of search, which is set in the earlier stage (see Equation (1)). During particle initialization, the fitness of each parameter will also be evaluated.
After the initializations, the PSO will start its search for finding the parameter that gives optimum performance.
3.3. Distance and Azimuth
Azimuth in the context of a navigation system refers to the horizontal angle measured in a clockwise direction from a north reference line. The azimuth of a point can be more generally defined as an angle from a fixed reference point due to north. The geographical distance is the distance measured along the surface of the earth. Knowing the distance and azimuth to a reference point, it is possible to calculate the location (longitude and latitude) of a new point relative to that reference point. We suggest the application of the available azimuth and distance formulas be used in this research to provide auxiliary points for the PSO algorithm (see
Figure 10).
3.3.1. Distance and Azimuth Calculations between Two Coordinates on Map
Determining the distance and azimuth between two locations is a crucial aspect of spatial analysis in various fields such as industry and research. This section outlines the basic concepts and methods involved in calculating the geographic distance and azimuth. The mathematical calculations in this study were according to coordinates (longitude and latitude), which were used in GPS devices and maps. There were two essential formulas for finding the distance and azimuth between two points.
3.3.2. Azimuth Calculation
The reference plane for an azimuth is typically through the north, measured as a 0° azimuth, though other angular units (grad, mil) can be used. Moving clockwise on a 360-degree circle, the east has an azimuth of 90°, the south 180°, and the west 270°. There is a command in MATLAB that calculates the azimuth between two coordinates as presented in Equation (2) [
61]. Consider two points, X and Y. Point (X) includes (X_lat,X_lon) and Point (Y) contains (Y_lat,Y_lon). X_lat is the latitude of point X (for example 1.560973°) and X_lon is the longitude of point X (for example 103.643110°). Y_lat is the latitude of point Y and Y_lon is the longitude of point Y,
Angle is the calculated angle θ with reference to the North at point (X).
3.3.3. Distance Calculation
The formulas in this section calculate the distance between two points, which are defined by the geographical coordinates in terms of latitude and longitude.
Consider two points X and Y:
, . is the latitude of point X (for example 1.560973°) and is the longitude of point X (for example 103.643110°). While is the latitude of point Y and is the longitude of point Y, and “Π” is 3.1415.
Convert those to radians,
abs is the absolute value of the number inside the parenthesis.
acos stands for Arccosine of the value inside the parenthesis.
A distance meter is a unit of measurement used to quantify the distance between two points in meters. By utilizing the equations presented in Equations (3) to (10) for distance and Equation (2) for azimuth, the distance and azimuth between two coordinates on a map can be calculated.
3.3.4. Creating New Points from a Reference Point (Center of MDF Triangle) Based on Known Distance and Azimuth
It is possible to find the longitude and latitude of a new point referring to a reference point if the distance and azimuth to that reference point are known. The reference point in this study is the center point of the MDF triangle. Equations (11) to (16) show the mathematical calculations for finding the second point with an imagined distance and azimuth with regards to point X (considered as the reference point) [
61].
Consider two points X and Y. It is required to find the longitude and latitude of a new point (Y), which has a distance of
in meter and Angle (
θ) in degree with reference to point X. Sind and cosd are Sine and Cosine of the values inside the parenthesis.
is the latitude of point Y and is the longitude of point Y. The new calculated point is .
3.4. PSO-Based Lightning Locating System
Optimization of the findings and results from the MDF method, TDOA method, and auxiliary points requires a mathematical technique. The LLS utilizes a combination of two or three detection methods to solve optimization problems. Many optimization problems have used the particle swarm optimization algorithm as a relatively new, modern, and powerful method for optimization issues. It is widely used to find the global optimum solution in a complex search space. The PSO algorithm was employed to optimize and suggest the accurate location of the lightning strikes based on the available results. The performance of the PSO-based algorithm is known to be affected by the arrangement of the searching process [
62,
63].
Figure 11 illustrates the flowchart of a combined LLS, which is employed in the current study. Much efforts have been made to design a suitable algorithm to filter the cloud activities and find the CG discharges. The detected waveforms are classified using discrimination methods and techniques as in Ref. [
38].
Table 1 shows the results of the MDF and TDOA methods, which were used to form the input particles for the PSO initialization. The position of each particle is represented by a vector of parameters to be optimized. These parameters could represent values for variables in a mathematical function or parameters in a machine learning model. The particles are usually randomly generated within the search space, and their initial velocities can also be set randomly or uniformly. It is important to ensure that the initial particles are diverse enough to explore different regions of the search space, while also being sufficiently close to promising regions to converge quickly. Additionally, the number of particles is another parameter that needs to be carefully chosen to balance between exploration and exploitation. A minimum of 30 particles were determined based on the selected study area of the LLS. The possible input particles were added to the PSO algorithm to improve accuracy and reduce computation time.
The PSO algorithm starts with a set of particles or solutions and iteratively searches for the optimal solution by updating the generations. In each iteration, the particles are updated by considering two “best” values. The first one is the best solution (fitness). It has been achieved so far (the fitness value is also stored). This value is called pbest. Another “best” value that is tracked by the particle swarm optimizer is the best value, obtained so far by any particle in the population. This best value is a global best and called gbest. The particles are updated at each iteration and move to the result as presented in
Figure 12. The calculated point would then be selected as the winner of PSO, if the answer point was better than the best answer of the last loop. The loop would continue until reaching the target or passes the maximum epoch. Max epoch refers to the maximum number of iterations or generations that the algorithm will run. It is a parameter that is set before running the PSO algorithm and controls how long the particles will search for the optimal solution. The number of epochs is typically set based on the complexity of the problem being solved and desired level of accuracy.
In the current research, the max epoch of 100 was selected based on several experiments. Setting the coverage range for a PSO algorithm depends on the specific problem being solved and objectives of the optimization. Generally, the coverage range refers to the range of values that the particles are allowed to explore during the optimization process. This range can be defined by setting appropriate boundaries for the particle positions, velocities, and acceleration coefficients. As mentioned in
Figure 3, the case study is the coverage range for the PSO algorithm in this research. The next step in the flowchart of PSO in
Figure 12 is assigning matrices of data. The positions and velocities of particles are represented as vectors of numerical values, which can be thought of as matrices. These vectors are updated in each iteration of the algorithm, based on the particle’s own best position and the global best position in the swarm. The particle’s position and velocity vectors are used to evaluate the objective function of the optimization problem, and to determine the new position and velocity in the next iteration. Therefore, the use of vectors is essential to the implementation of PSO. Then, the targets are set in the flowchart in
Figure 12. The target is to optimize a given objective function. The particles in the swarm adjust their position and velocity based on their personal best and global best values in order to converge towards the optimal solution. The target of PSO is to find the global optimum solution by iteratively updating the positions and velocities of particles in the swarm. Evaluating the particles is the next step in
Figure 12. Each candidate solution in PSO is represented by a particle that undergoes an iterative evaluation process based on a fitness function tailored to the optimization problem. The fitness function is used to assess the quality of the solution proposed by each particle. The iteration continues until a stopping criterion is met, such as the convergence of the fitness function or reaching the maximum number of iterations. Subsequently, the particles adjust their position and velocity based on their personal and global best to seek a more optimal solution. The winner is the optimal solution to the given problem in this algorithm. In PSO, each particle represents a potential solution to the problem and is evaluated using a fitness function that measures its quality. The “gbest” refers to the global best position or solution found by the swarm of particles. This represents the best solution found by any of the particles in the swarm so far. The particles use the gbest as a guide to adjust their position and velocity towards a better solution. The gbest is updated as new, better solutions are found by the particles in the swarm. The particles adjust their position and velocity based on their individual experience (personal best) and collective experience of the swarm (global best) to move towards the target solution as shown in
Figure 13.
4. Results
In the preceding section, the approach for the lightning locating system was outlined. This section, however, focuses on the outcomes obtained from the proposed method. The experimental results are based on the measurements made using the proposed methods. If the waveform were recognized as a CG signal, then the signal would be packed with its corresponding timestamp and sent to the server station; otherwise, the signal would be rejected, and the system would be ready to sense another lightning flash.
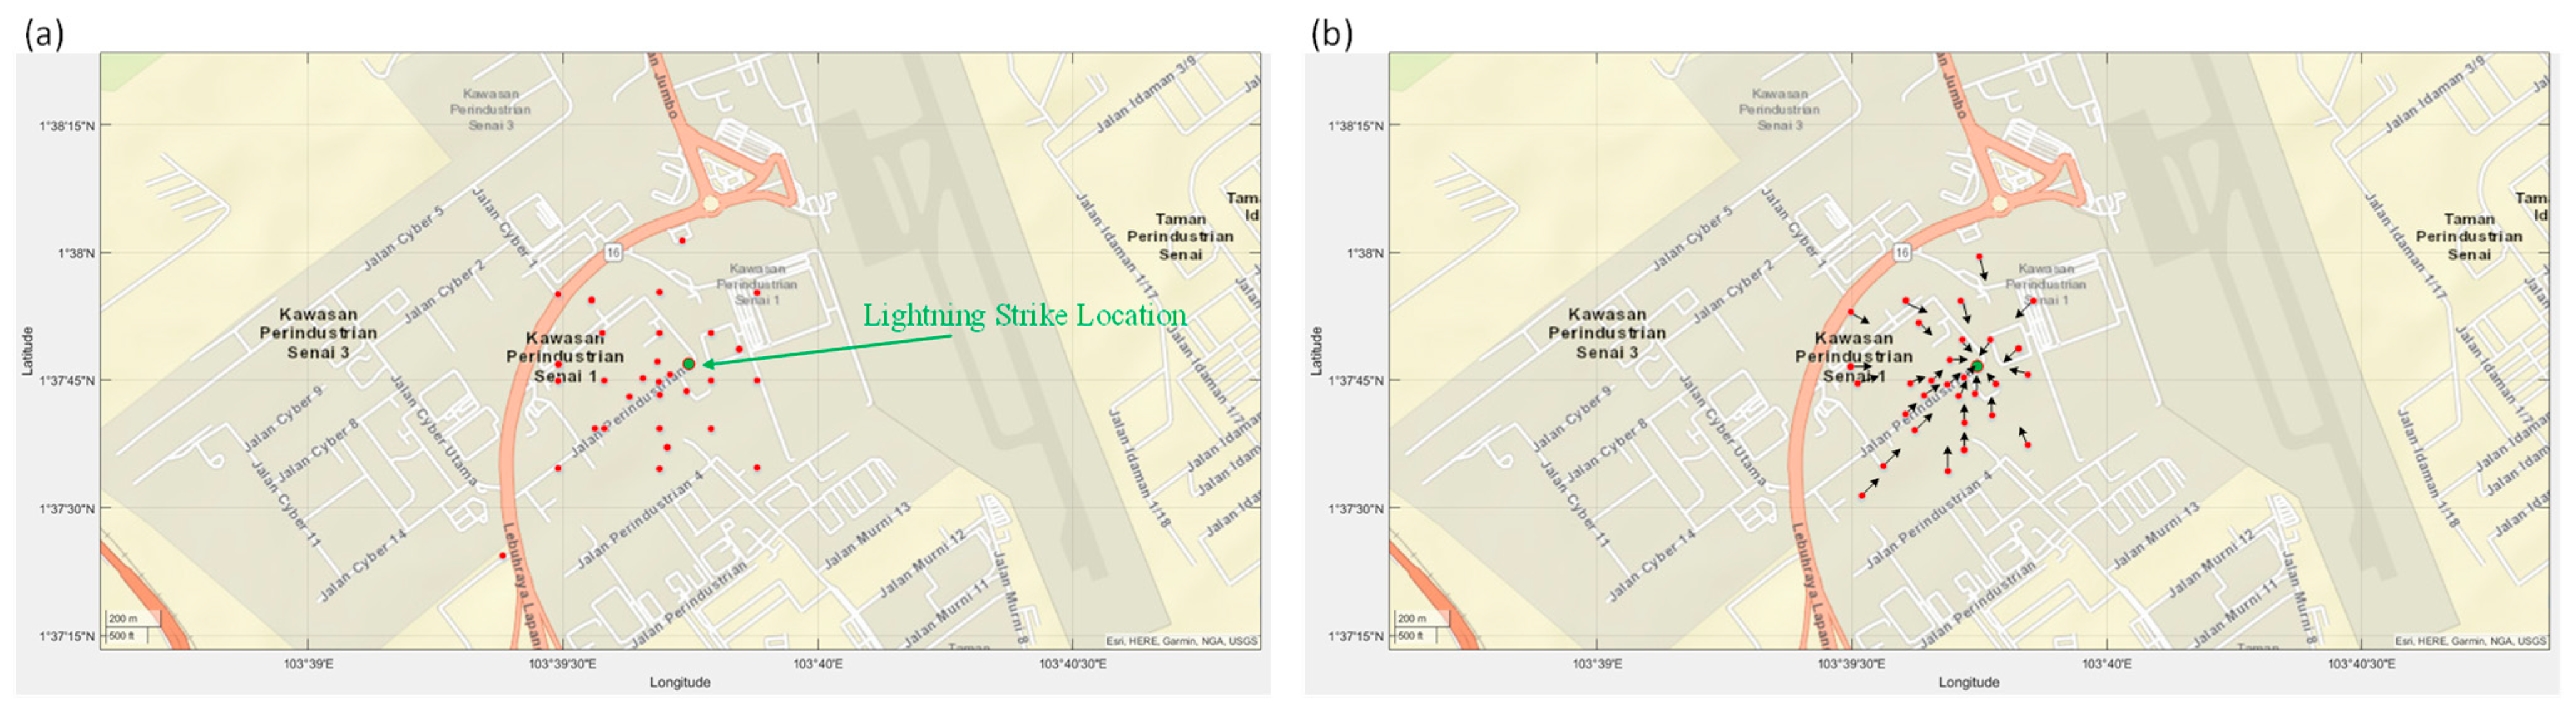
Figure 13 presents a sample of moving particles in the PSO algorithm. Note that only several steps of the algorithm are illustrated in
Figure 13. All 30 input points for initializing the PSO algorithm were extracted based on MDF triangle, TDOA methods, and Azimuth and Distance. These points are initial points for the PSO algorithm. The PSO controlling parameters are tabulated in
Table 2.
PSO algorithm’s loop starts by checking the number of counters and iterations. Then, the fitness function will be evaluated to find the best particle (
) in that iteration. The process involves evaluating the fitness function of each particle during iterations and selecting the one with the best performance index as P best. Then, the P best is compared with the previous global best (g best) to find the new g best. It will set as a new g best if it is better, if not, the previous g best will remain. After that, a new velocity and position will be calculated. The new velocity is obtained using Equations (17) and (18) with an inertia weight (W). The new particle position is obtained by summing the current position with the new velocity value as expressed in Equation (19) (particle update rule). These steps are repeated until the stopping criteria are achieved.
where,
Vi,k = Velocity of the individual at iteration k.
Wk = Inertia weight at iteration k.
r1 and r2 = uniform random numbers of [0, 1].
C1 and C2 = acceleration factor between 0 and 2.
Xi,k = Position of the ith individual at iteration k.
PPbest, i,k = Best position of the ith individual at iteration k.
Pgbest, i,k = Best position of the group until iteration k.
The PSO is initialized and then searches for optima by updating generations, as shown in
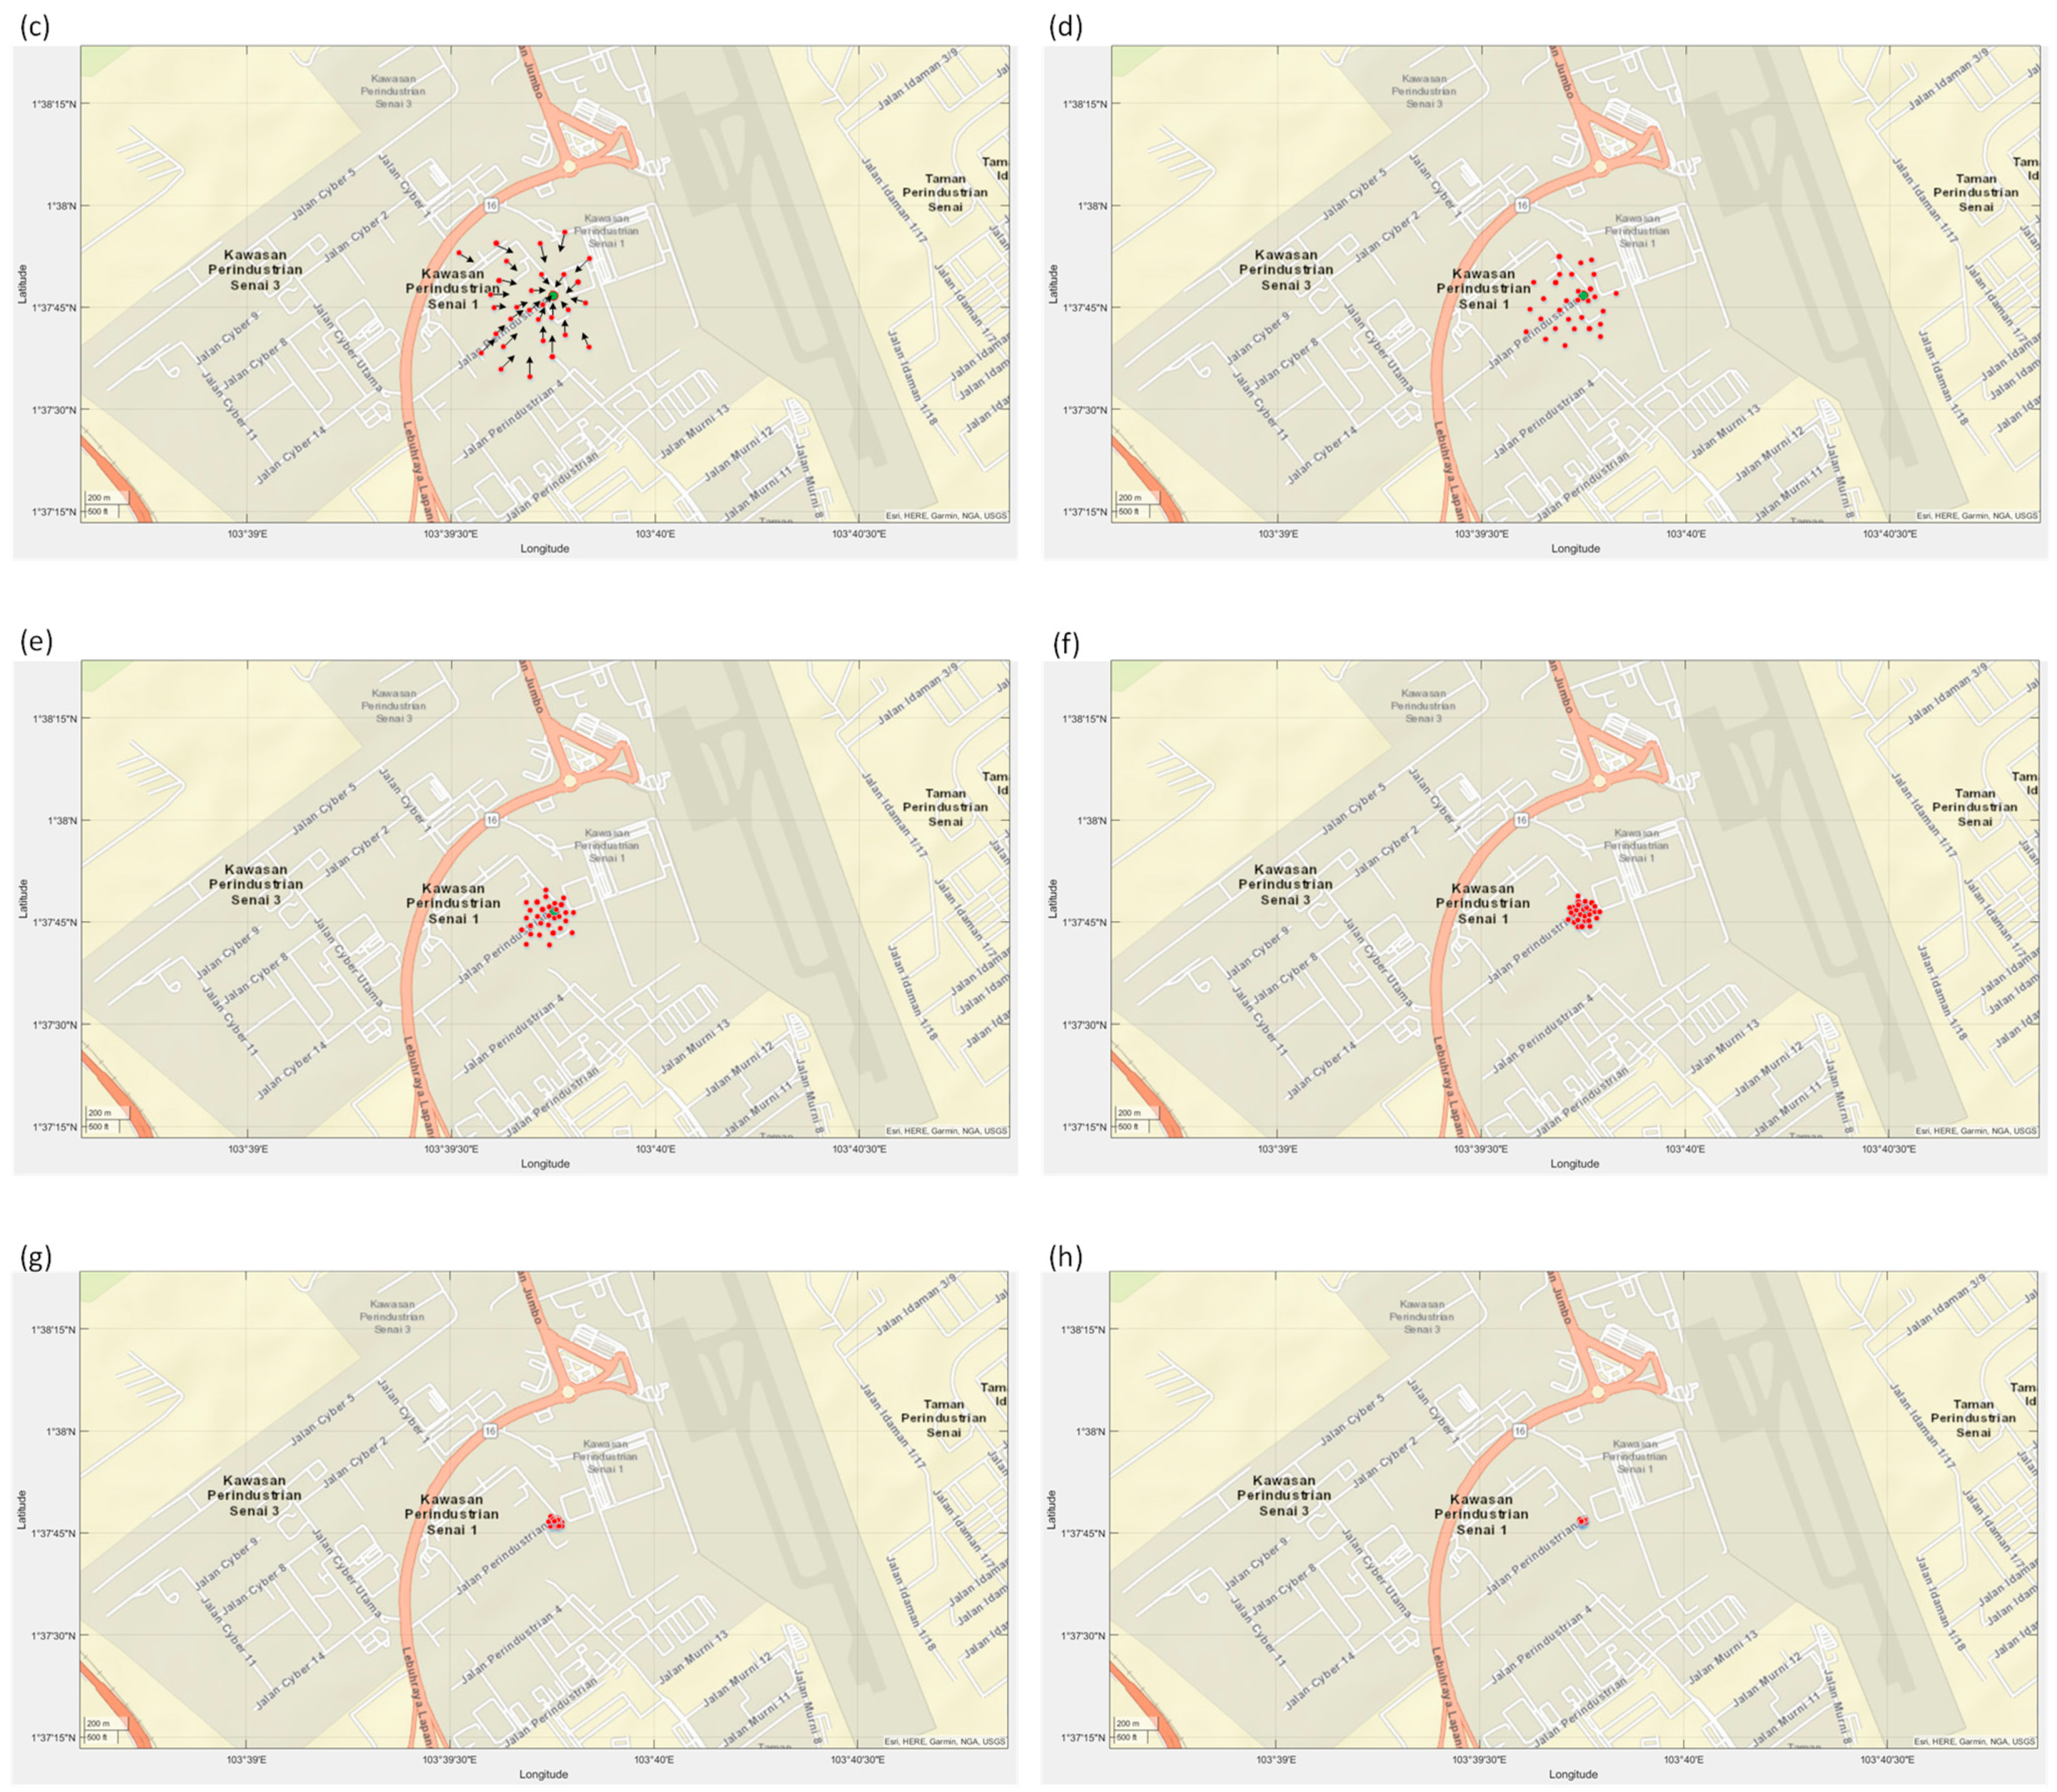
Figure 13a. Updated candidate points in the PSO algorithm are presented in
Figure 13b–h. The green circle is the real answer of the system.
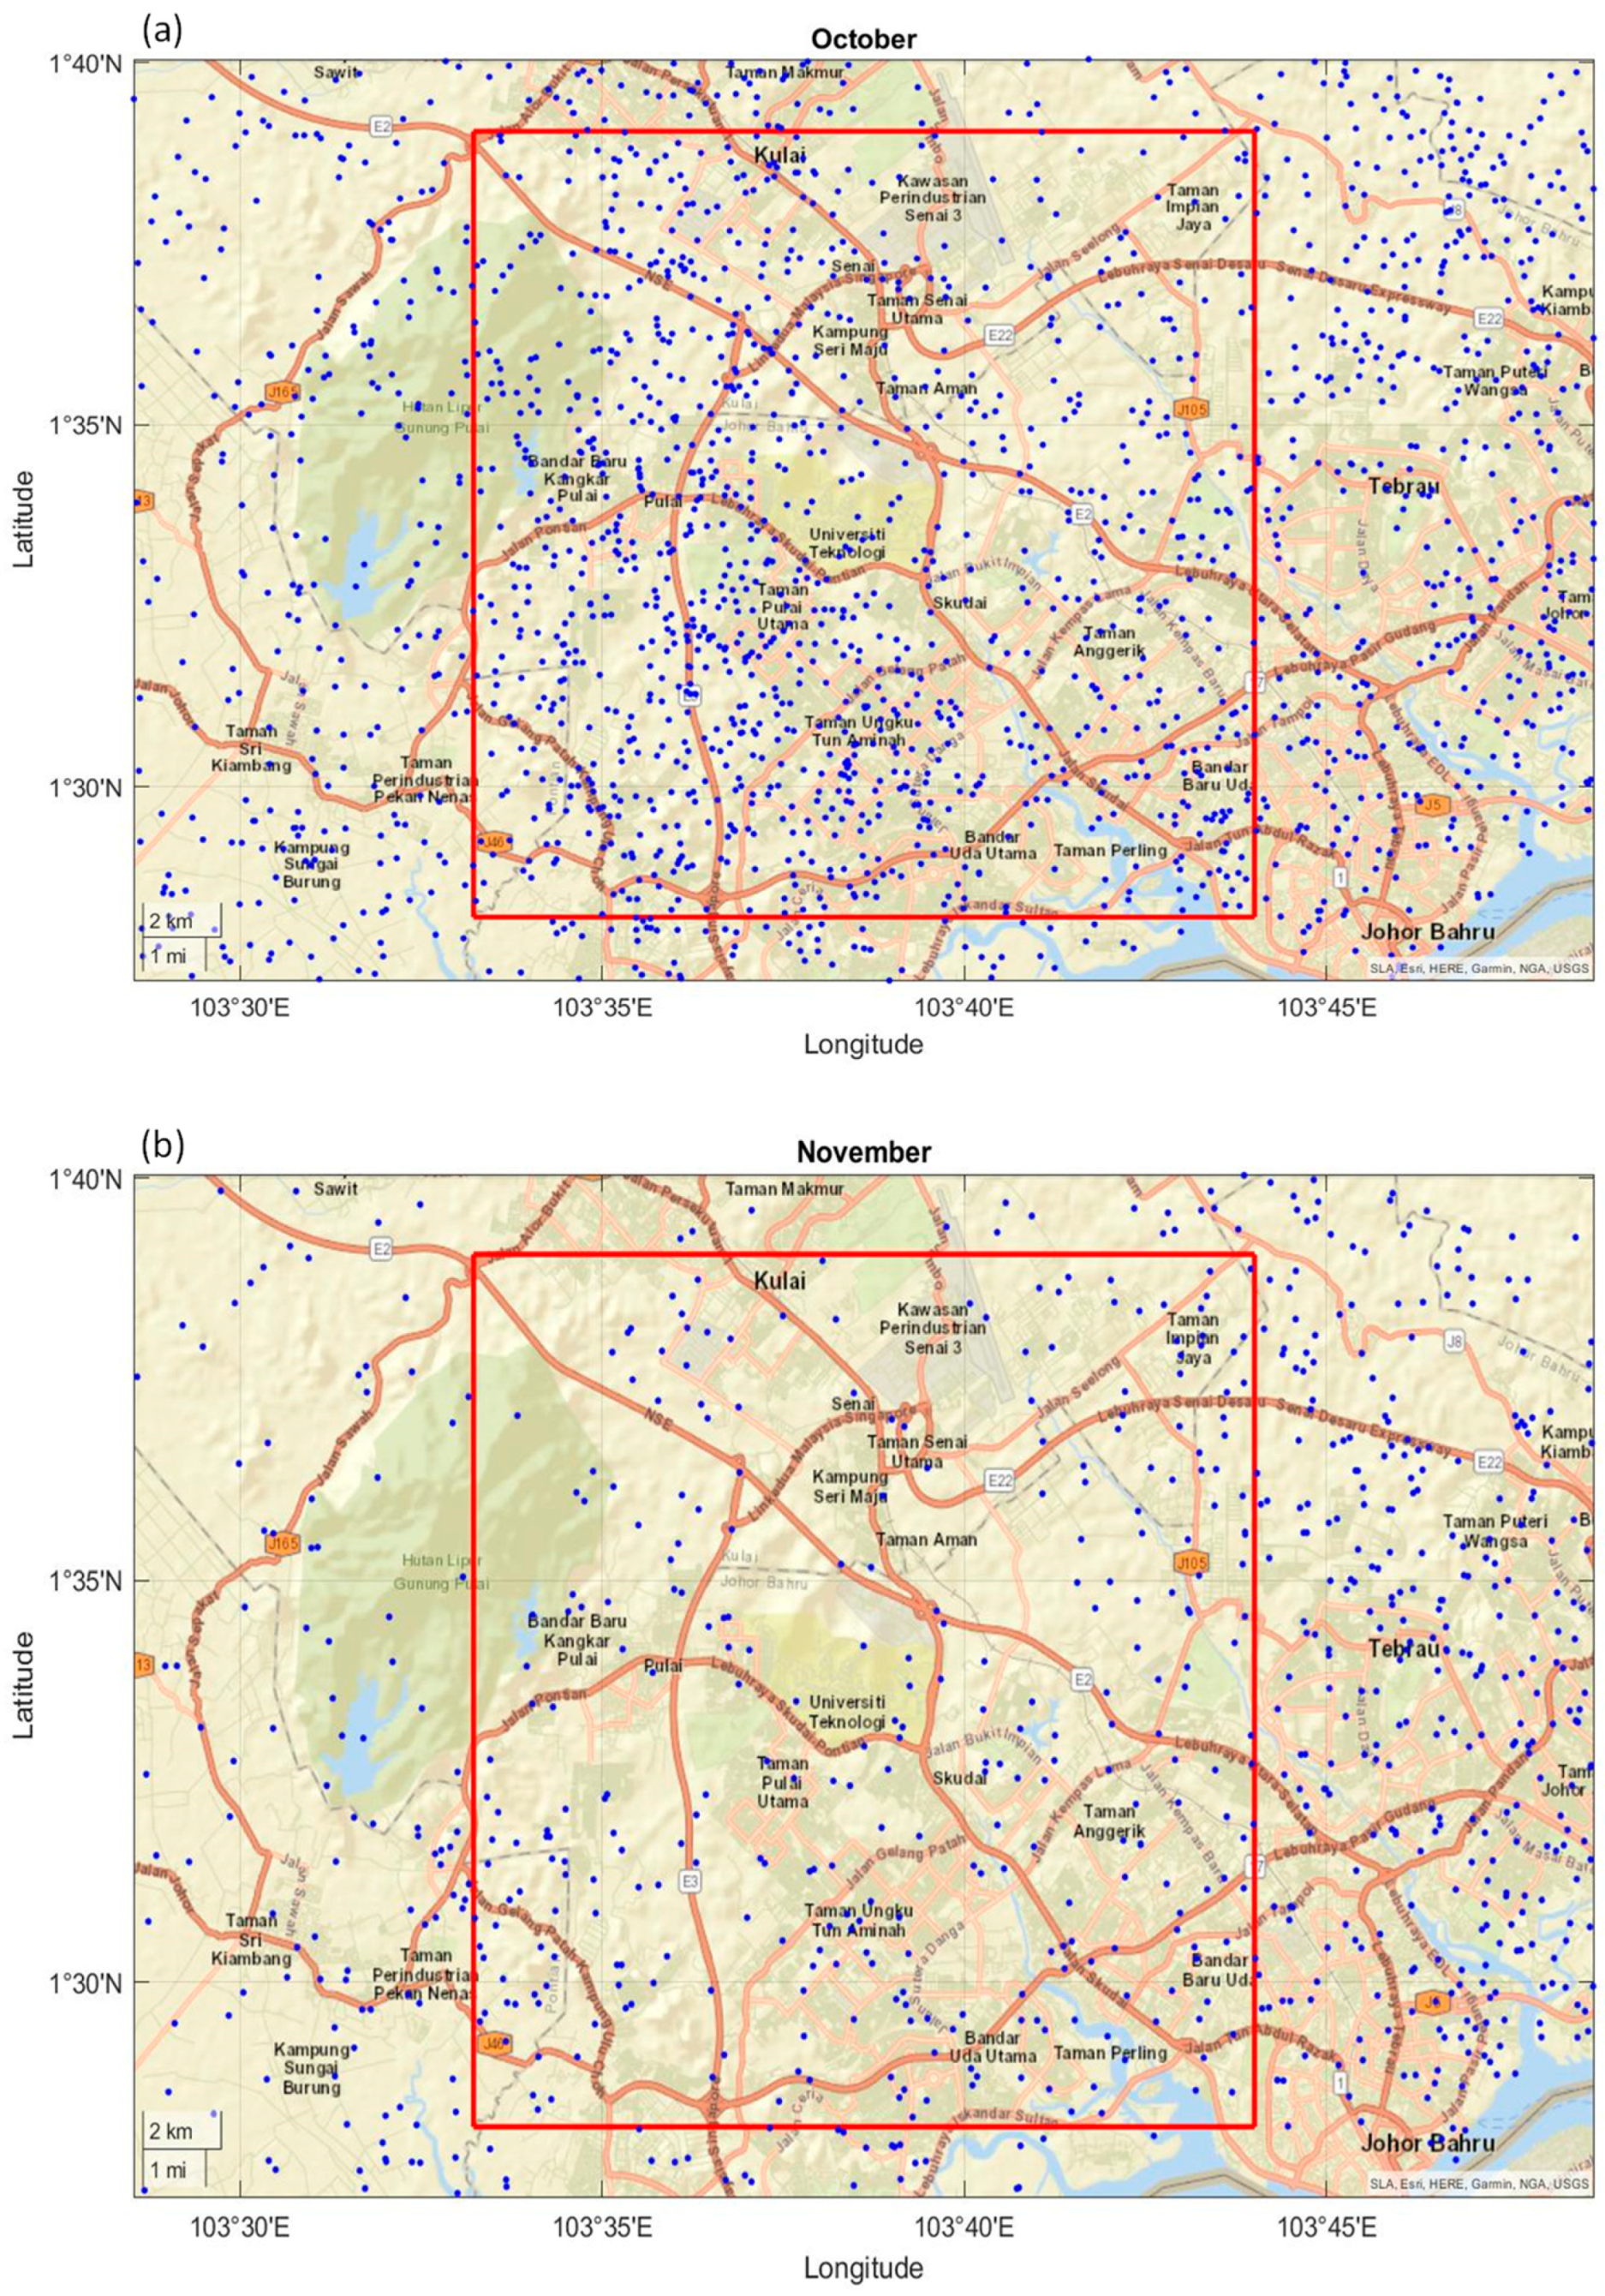
4.1. Lightning Data
Lightning flash activities were monitored continuously in the study area, and the lightning locating systems recorded information such as location and time of discharge. This study focuses only on the cloud-to-ground discharges using the discriminating algorithm, which finds the CG discharges among all the cloud activities. The monthly CG lightning flashes for two months (November and December) are illustrated in
Figure 14. All-day and night CG lightning discharges were collected to map the trend of the waveforms.
During the two months under study, a high number of lightning discharges were detected. In order to implement the MDF-based LLS for a local area, three MDF sensors were installed at Universiti Teknologi Malaysia in Johor. The lightning discharges were sensed by crossed-loop antennas at the stations. The installed crossed-loop antennas in three stations provided three available known parameters for the LLS system at each incoming waveform. The detected waveforms were then saved continuously at each station. The MDF method was employed to find the direction of incoming waveforms. Three lines were then drawn based on calculated angles in the MDF method, which are a line with angle , a line with angle ), and a line with angle (θ_VAN or θ_VAN + 180). The intersections of the lines formed a triangle where the lightning strike would be inside or around this triangle.
The MDF method can have bearing errors that can cause angle deviations in lightning locating systems. This can result in situations where the lines drawn at each station do not intersect, especially when the distance between the stations is relatively short. To solve this problem, in this research, up to ±5° of error was automatically added to the MDF calculation for getting the intersections of three drawn lines at the stations. The installed high-resolution GPS antennas provided three known parameters for the LLS system at each incoming waveform. These available parameters are and . The TDOA method used the time difference of arrivals in three stations , and ) to form the hyperbola equations to find the lightning strike point. In some conditions, hyperbola equations produced by only three sensors will result in two or more solutions or points, thus leading to ambiguous locations. The longitudes and latitudes of the points in MDF and TDOA methods had been extracted for the PSO algorithm. To calculate the average distance error of this system, only the captured lightning discharges inside the study area were considered.
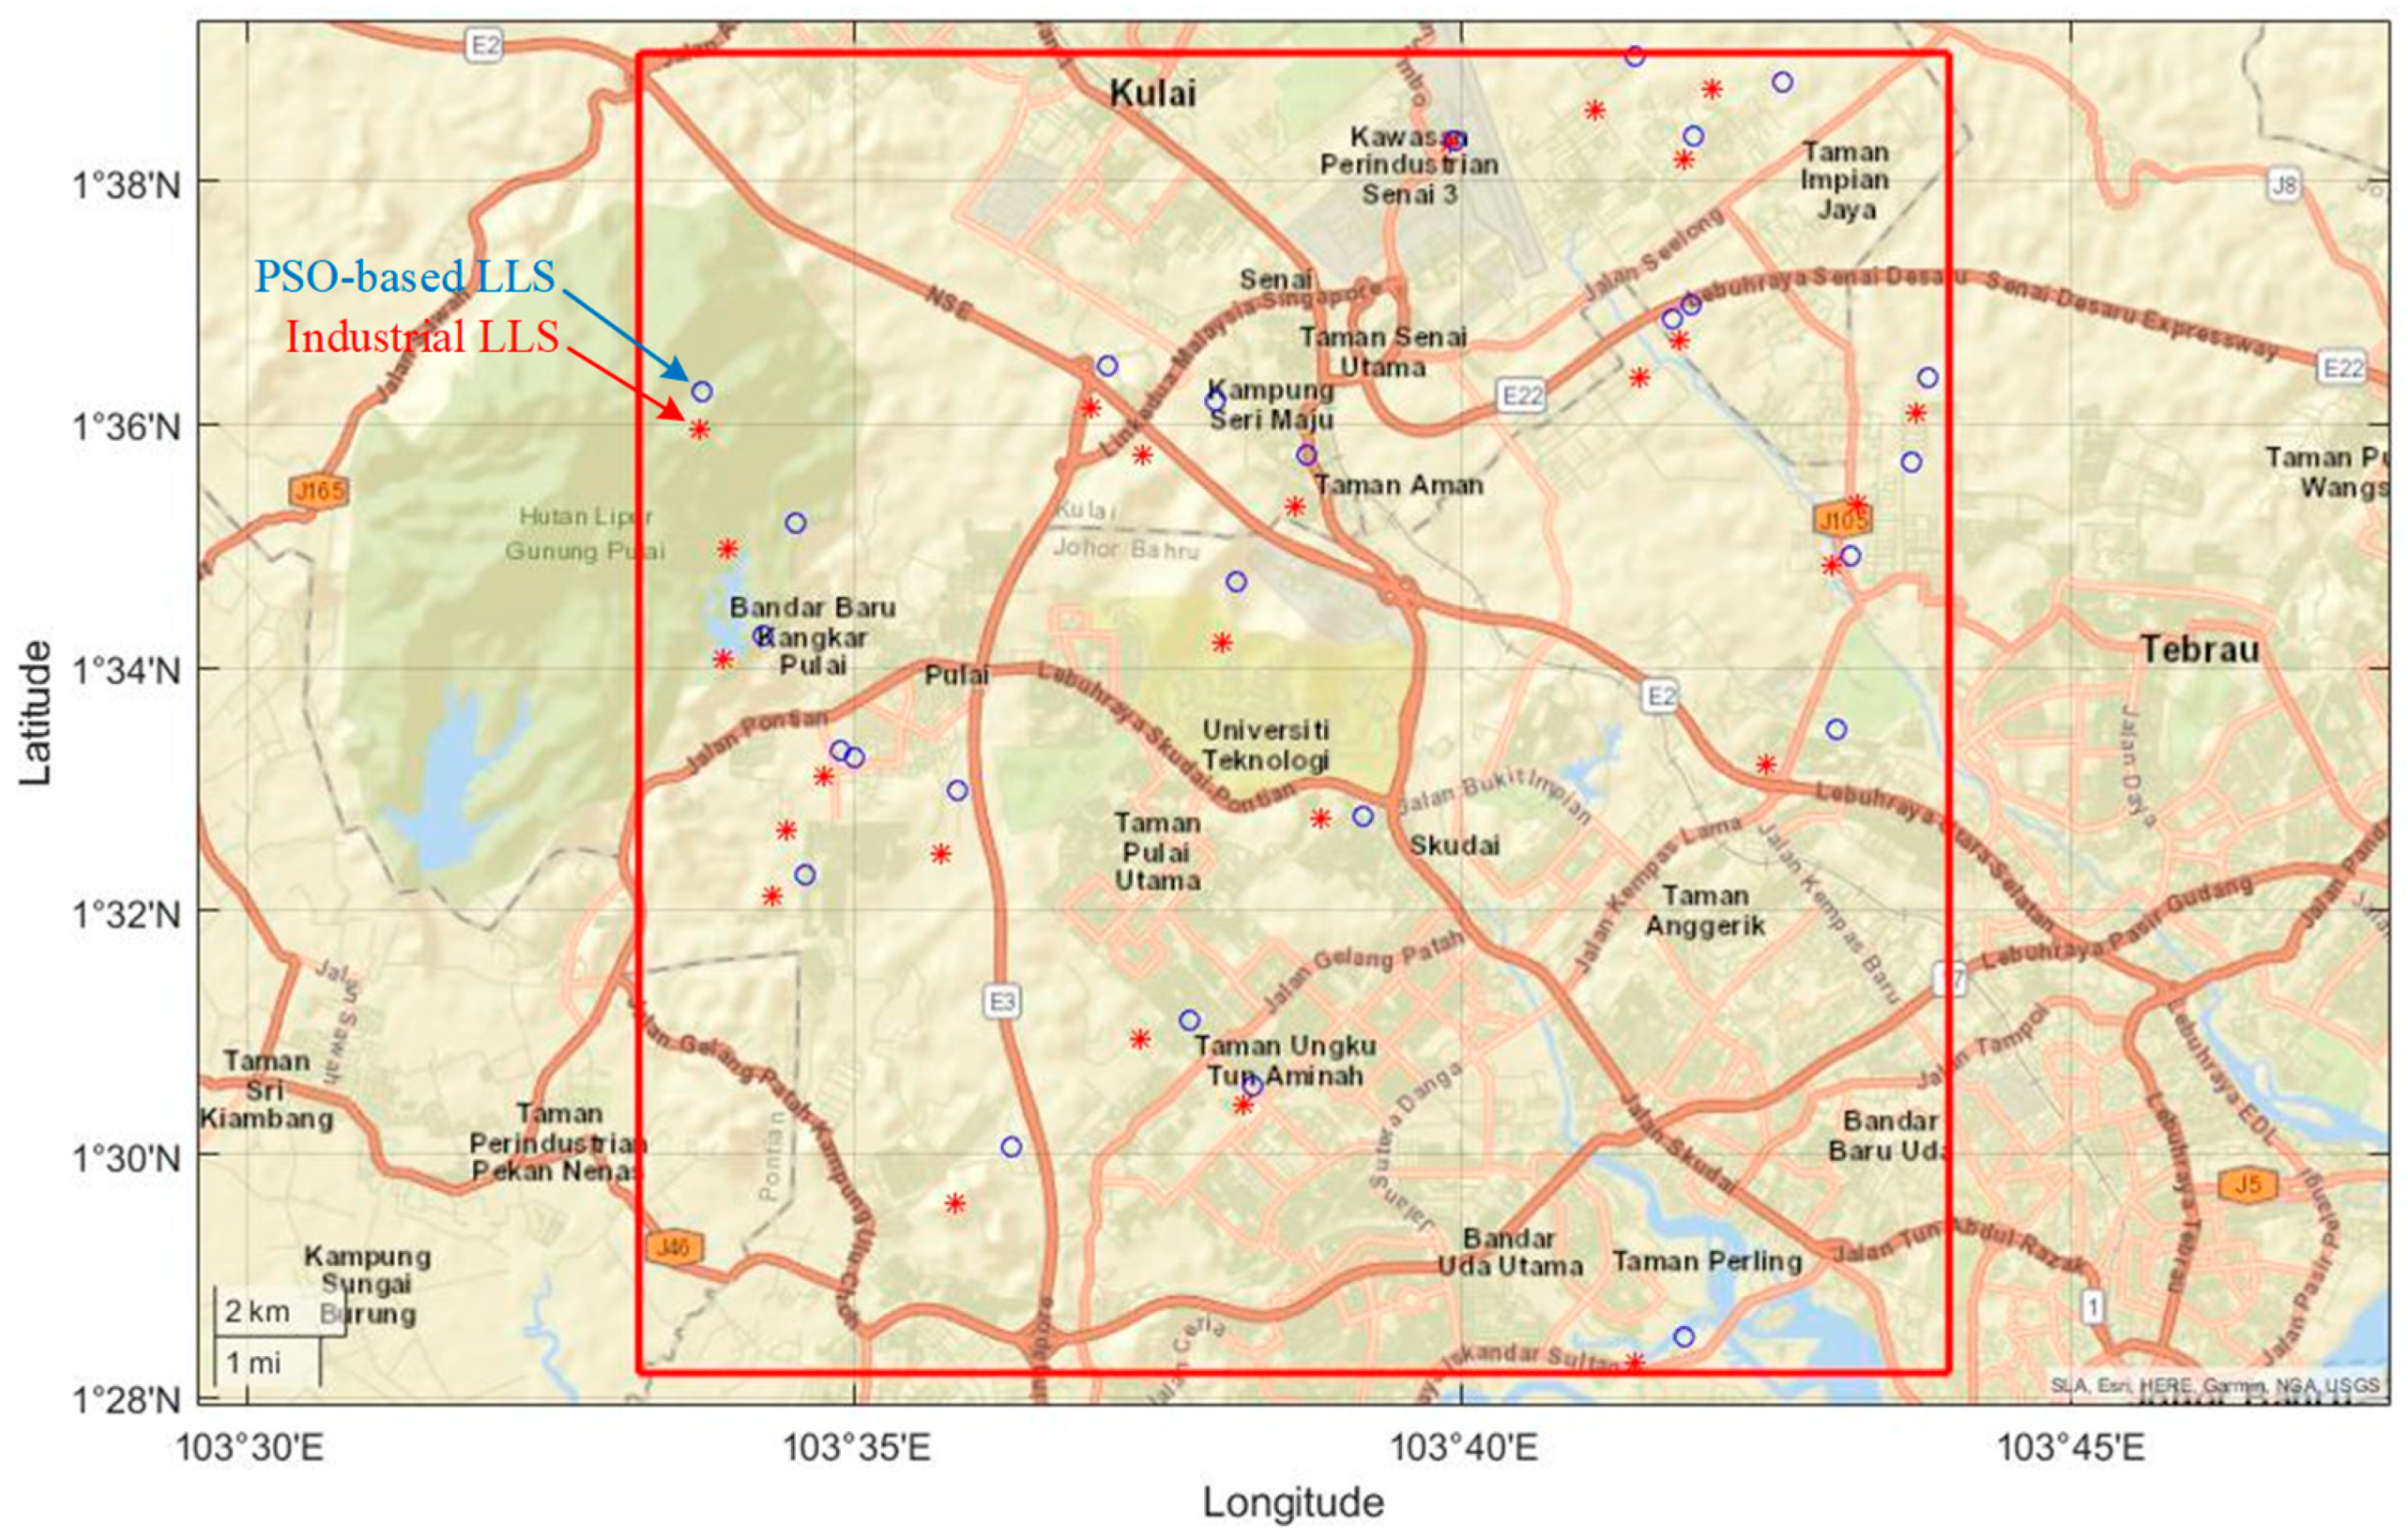
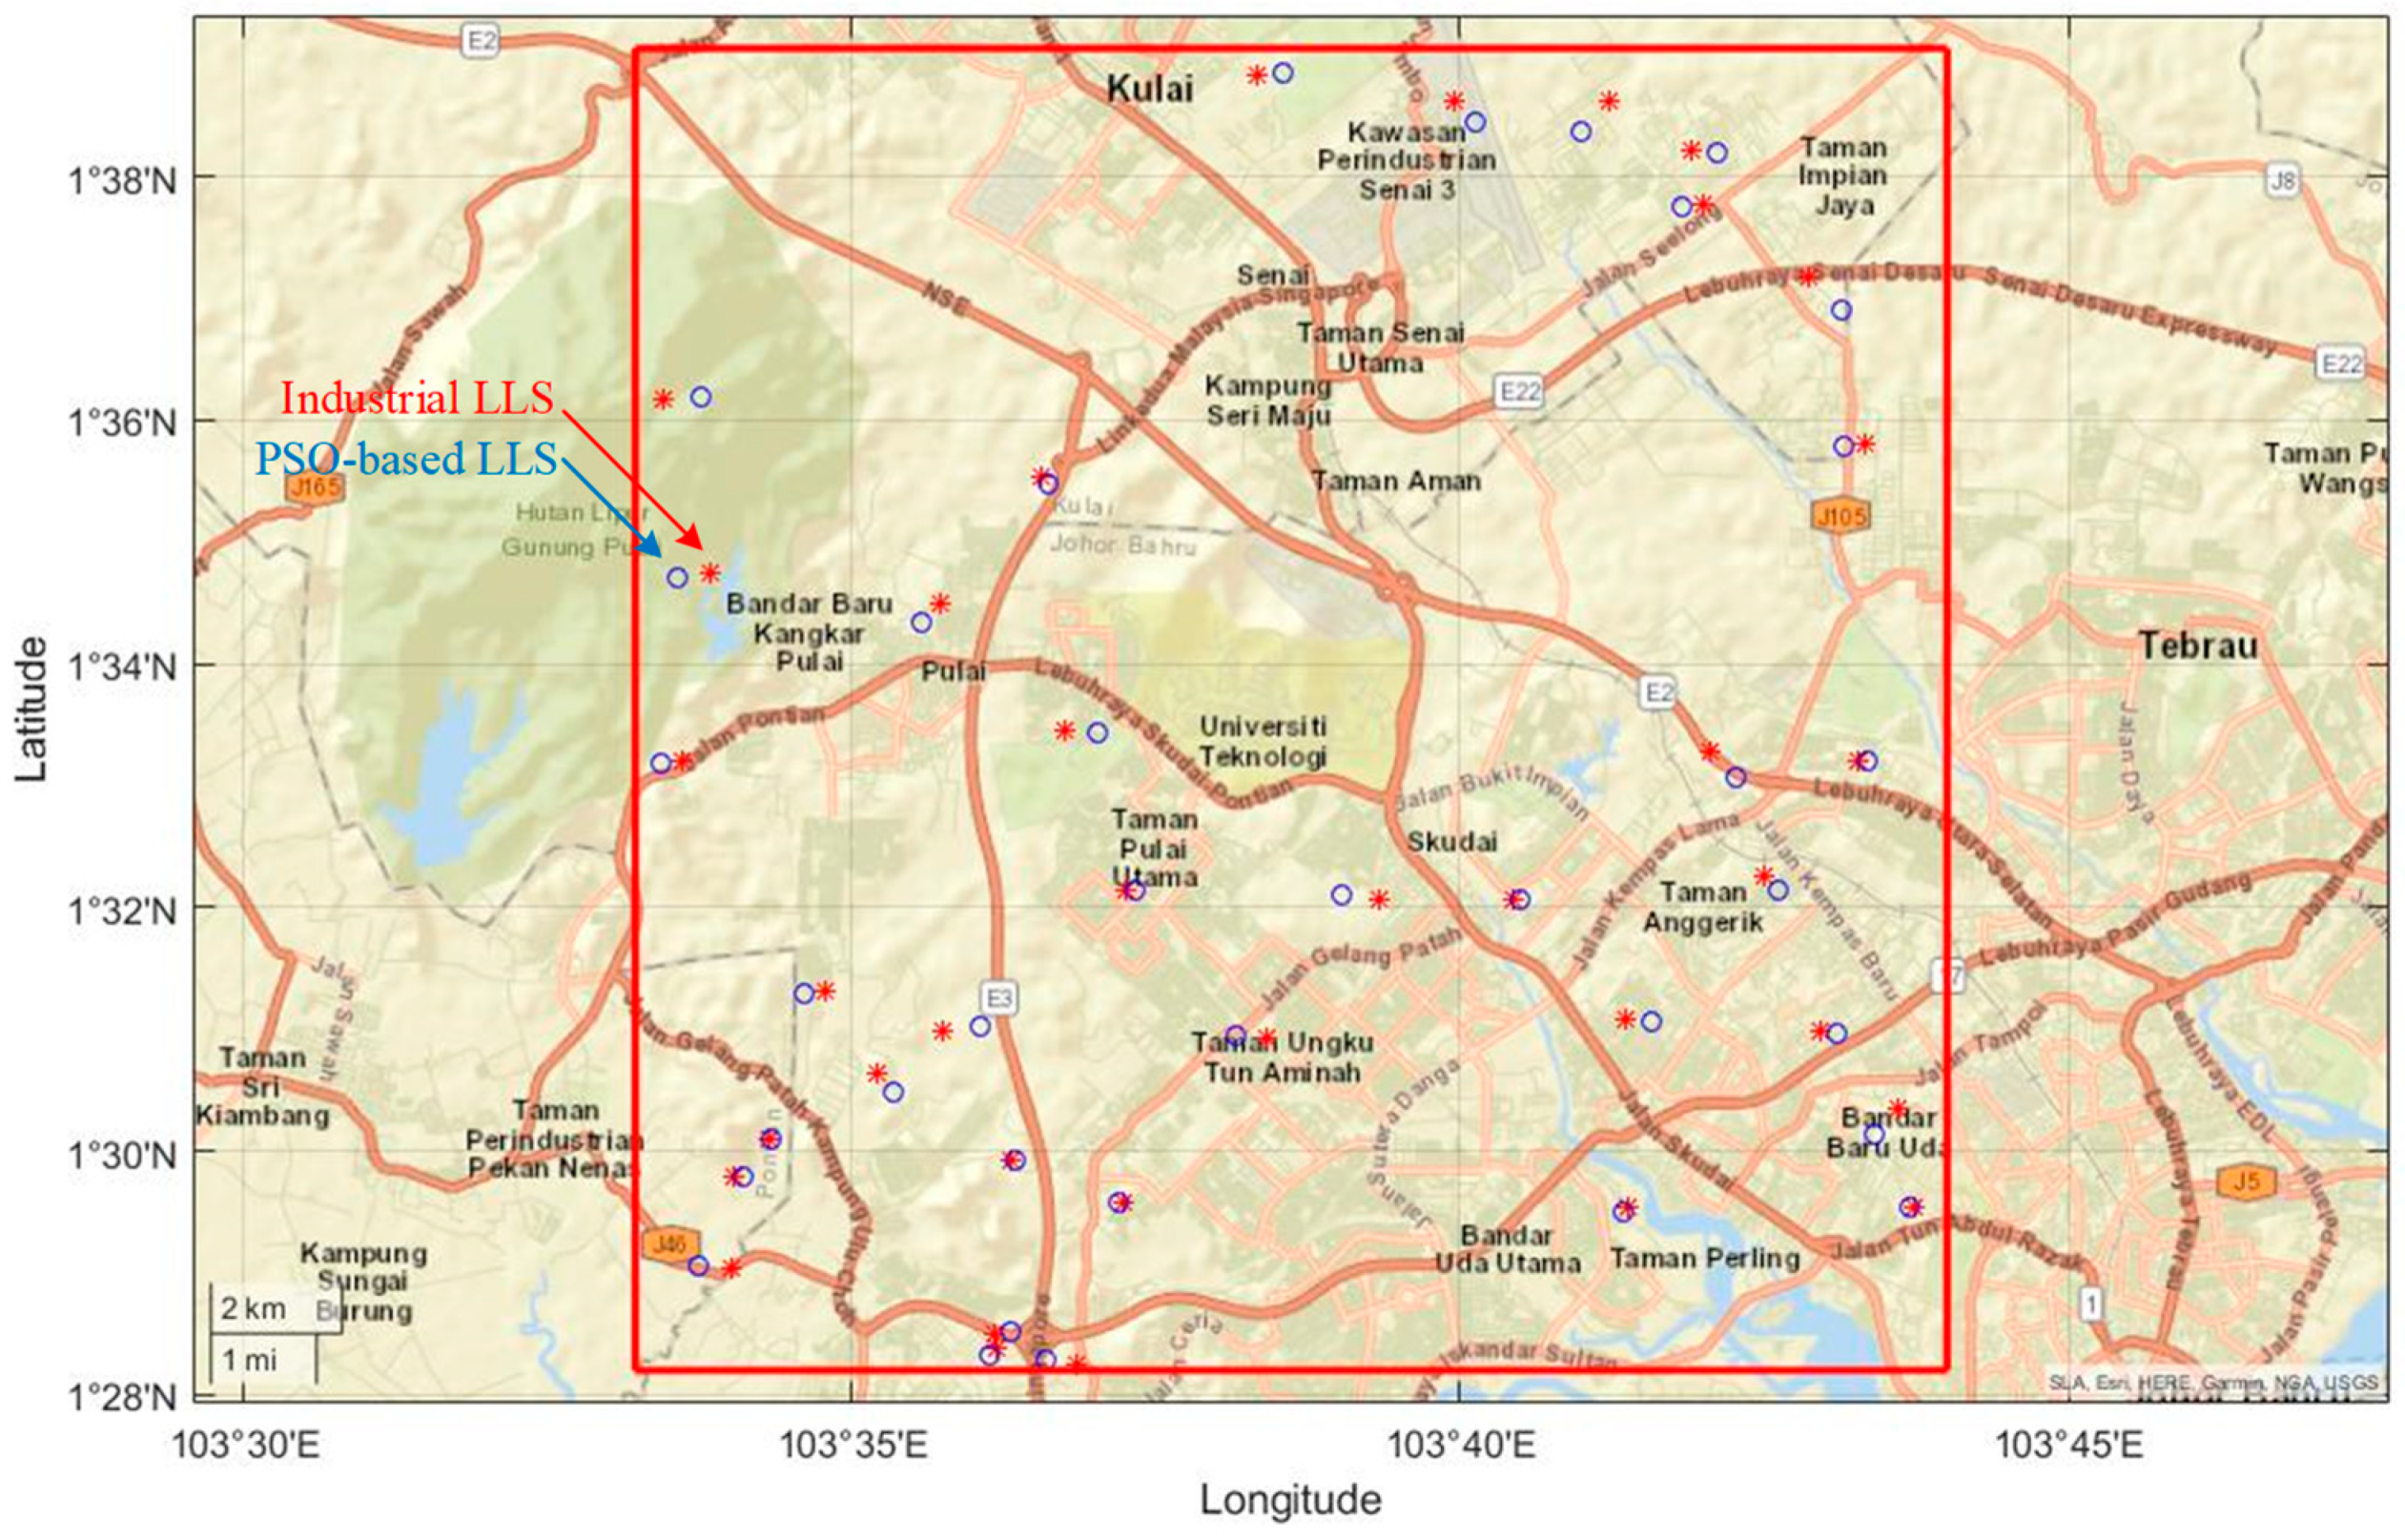
4.2. Inter-Comparison Analysis of the PSO-Based LLS with an Industrial LLS in Malaysia
Comparing different lightning locating systems (LLSs) can be challenging since these systems operate at different frequency ranges, and therefore, may detect different aspects of lightning processes or flashes [
64]. Different LLSs employ various technologies and detection methods such as optical methods or radiofrequency signals. Hence, careful consideration is required to compare the performance of the lightning locating systems. The lightning strikes that were detected by the PSO-based LLS during the months of December and March were selected for comparison with another industrial lightning detection system during the same time periods. The results of the comparison were presented in
Table 3, which provides statistical analysis of the lightning strikes detected by both the industrial LLS and the PSO-based LLS proposed in this study. This section focuses on the number and abundance of detected lightning flashes by both systems. The last column contains the distances between two points (PSO-based LLS and Industrial LLS). The tabulated lightning strikes in
Table 3 and
Table 4 are illustrated in
Figure 15 and
Figure 16. The accuracy of a lightning detection system depends on several factors. Among them, the type and number of installed sensors, location of the sensors in relation to each other, sites’ topography, surrounding obstructions, structures, and environment. Three stations are the minimum requirement for an LLS to compute data. Therefore, the sensors should not be placed apart more than their nominal range (200 km for Very High Frequency (VHF) sensors), and it would be a bad strategy to place them all in a straight line.
Based on the analysis, the average distance differences between PSO-based LLS in this research and an industrial LLS is around 573 m, which is acceptable in a region with an area of 400 km2. This average is not a fixed number throughout the year and locations as the PSO-based LLS decides according to the circumstances. The national lightning detection systems cover nearly the whole of the county but cannot be totally relied on due to the large coverage area. On the other hand, the unexpected suspension of sensors operation in these systems may lead to loss of lightning data in a large area.
5. Discussion
The lightning discharges propagate electromagnetic fields in all directions. The installed measuring sensors are triggered by a radiated lightning flash, which immediately record the time and the waveforms. An integrated lightning locating system using three measurement stations was designed and installed at Universiti Teknologi Malaysia for detecting lightning strikes covering 400
. The parallel plate and crossed loop antennas have been installed at each station to detect electric and magnetic fields of the lightning discharges respectively. In order to ensure high precision and accuracy, the clock of the stations in this study were synchronized with the UTC time reference to record the timestamp of the incoming waveforms. The timestamp was saved with a resolution of at least 100 ns to achieve high precision in the detection of lightning events. The detected waveforms were classified using the proposed algorithm based on wavelet analysis in Ref. [
38] to extract and discriminate the ground flashes (CGs). The employed MDF method based on the magnetic field in this study capture, measure, and locate the lightning emissions.
The azimuth angle between the north and the direction of the detected return stroke in CG discharges was determined using a crossed loop antenna. To locate the lightning strike with some error, at least two sensors were needed. In contrast, the TDOA method required a minimum of three synchronized measuring stations. This approach determined the position of a CG discharge based on the time differences of a detected signal at different stations. The hyperbolics which are drawn between every two stations are the host of the lightning discharges as the time differences between the captured times are constant. Hence, at least two pairs of these hyperbolics are needed to find the possible locations of the CG discharge. The measuring stations in this study were calibrated and the time clocks were synchronized since this method depends on the accurate captured timestamps.
In this study, both the MDF and TDOA methods were utilized, and the main contribution was the optimization of the combined LLS. The first step in achieving this was to establish an appropriate solution space while considering the constraints of the system. After conducting investigations, the particle swarm optimization algorithm was chosen as the search algorithm for the optimization process. Several parameters in the PSO algorithm affect the performance of the algorithm. These values have significant impacts on the accuracy and efficiency of the PSO method. Several particles or swarm size and number of iterations are the fundamental parameters. The number of particles is the population size, and a big swarm generates larger search space in each iteration that help to obtain better optimization result. On the other hand, huge amounts of particles increase the complexity of the system and consumed time. The stopping criteria in this study were set to terminate the iterative search process.
In this study, a maximum of 100 iterations were chosen for the PSO-based LLS algorithm. However, it should be noted that setting a small maximum number of iterations could result in an inaccurate solution. This research has practical implications for various applications, including lightning tracking and mapping, which have numerous benefits for both academic and industrial purposes. The implemented PSO-based lightning locating system can provide the characteristics of lightning strikes that can be valuable to the governmental agencies as well as private sectors to design their protection systems. There are two main lightning detecting networks in Malaysia, which belong to Tenaga Nasional Berhad (TNB) and the Malaysian Meteorological Department (MMD). These systems cover the whole country, with detection efficiency and mean distance error of 90% and 500 m. TNB and MMD cover nearly the whole country but cannot be relied on due to the large coverage area. Therefore, a local lightning locating system will be helpful as a backup system of national LLSs for small regions. An automatic detecting and saving program was written in MATLAB software and installed at each station. The GPS timestamp was recorded when the incoming signal hit the threshold.
High-speed cameras can autonomously gather data regarding the location and characteristics of lightning strikes, making them an essential tool for validating the results produced by lightning locating systems [
65]. These cameras possess the capability to capture and record lightning discharges at a rate of thousands of frames per second, which can identify the location of lightning strikes. Lightning locating systems rely on radiofrequency signals to detect and locate lightning strikes; however, various factors such as atmospheric conditions, the distance and geometry of the lightning channel, and the sensitivity of the system can influence the precision of the data produced [
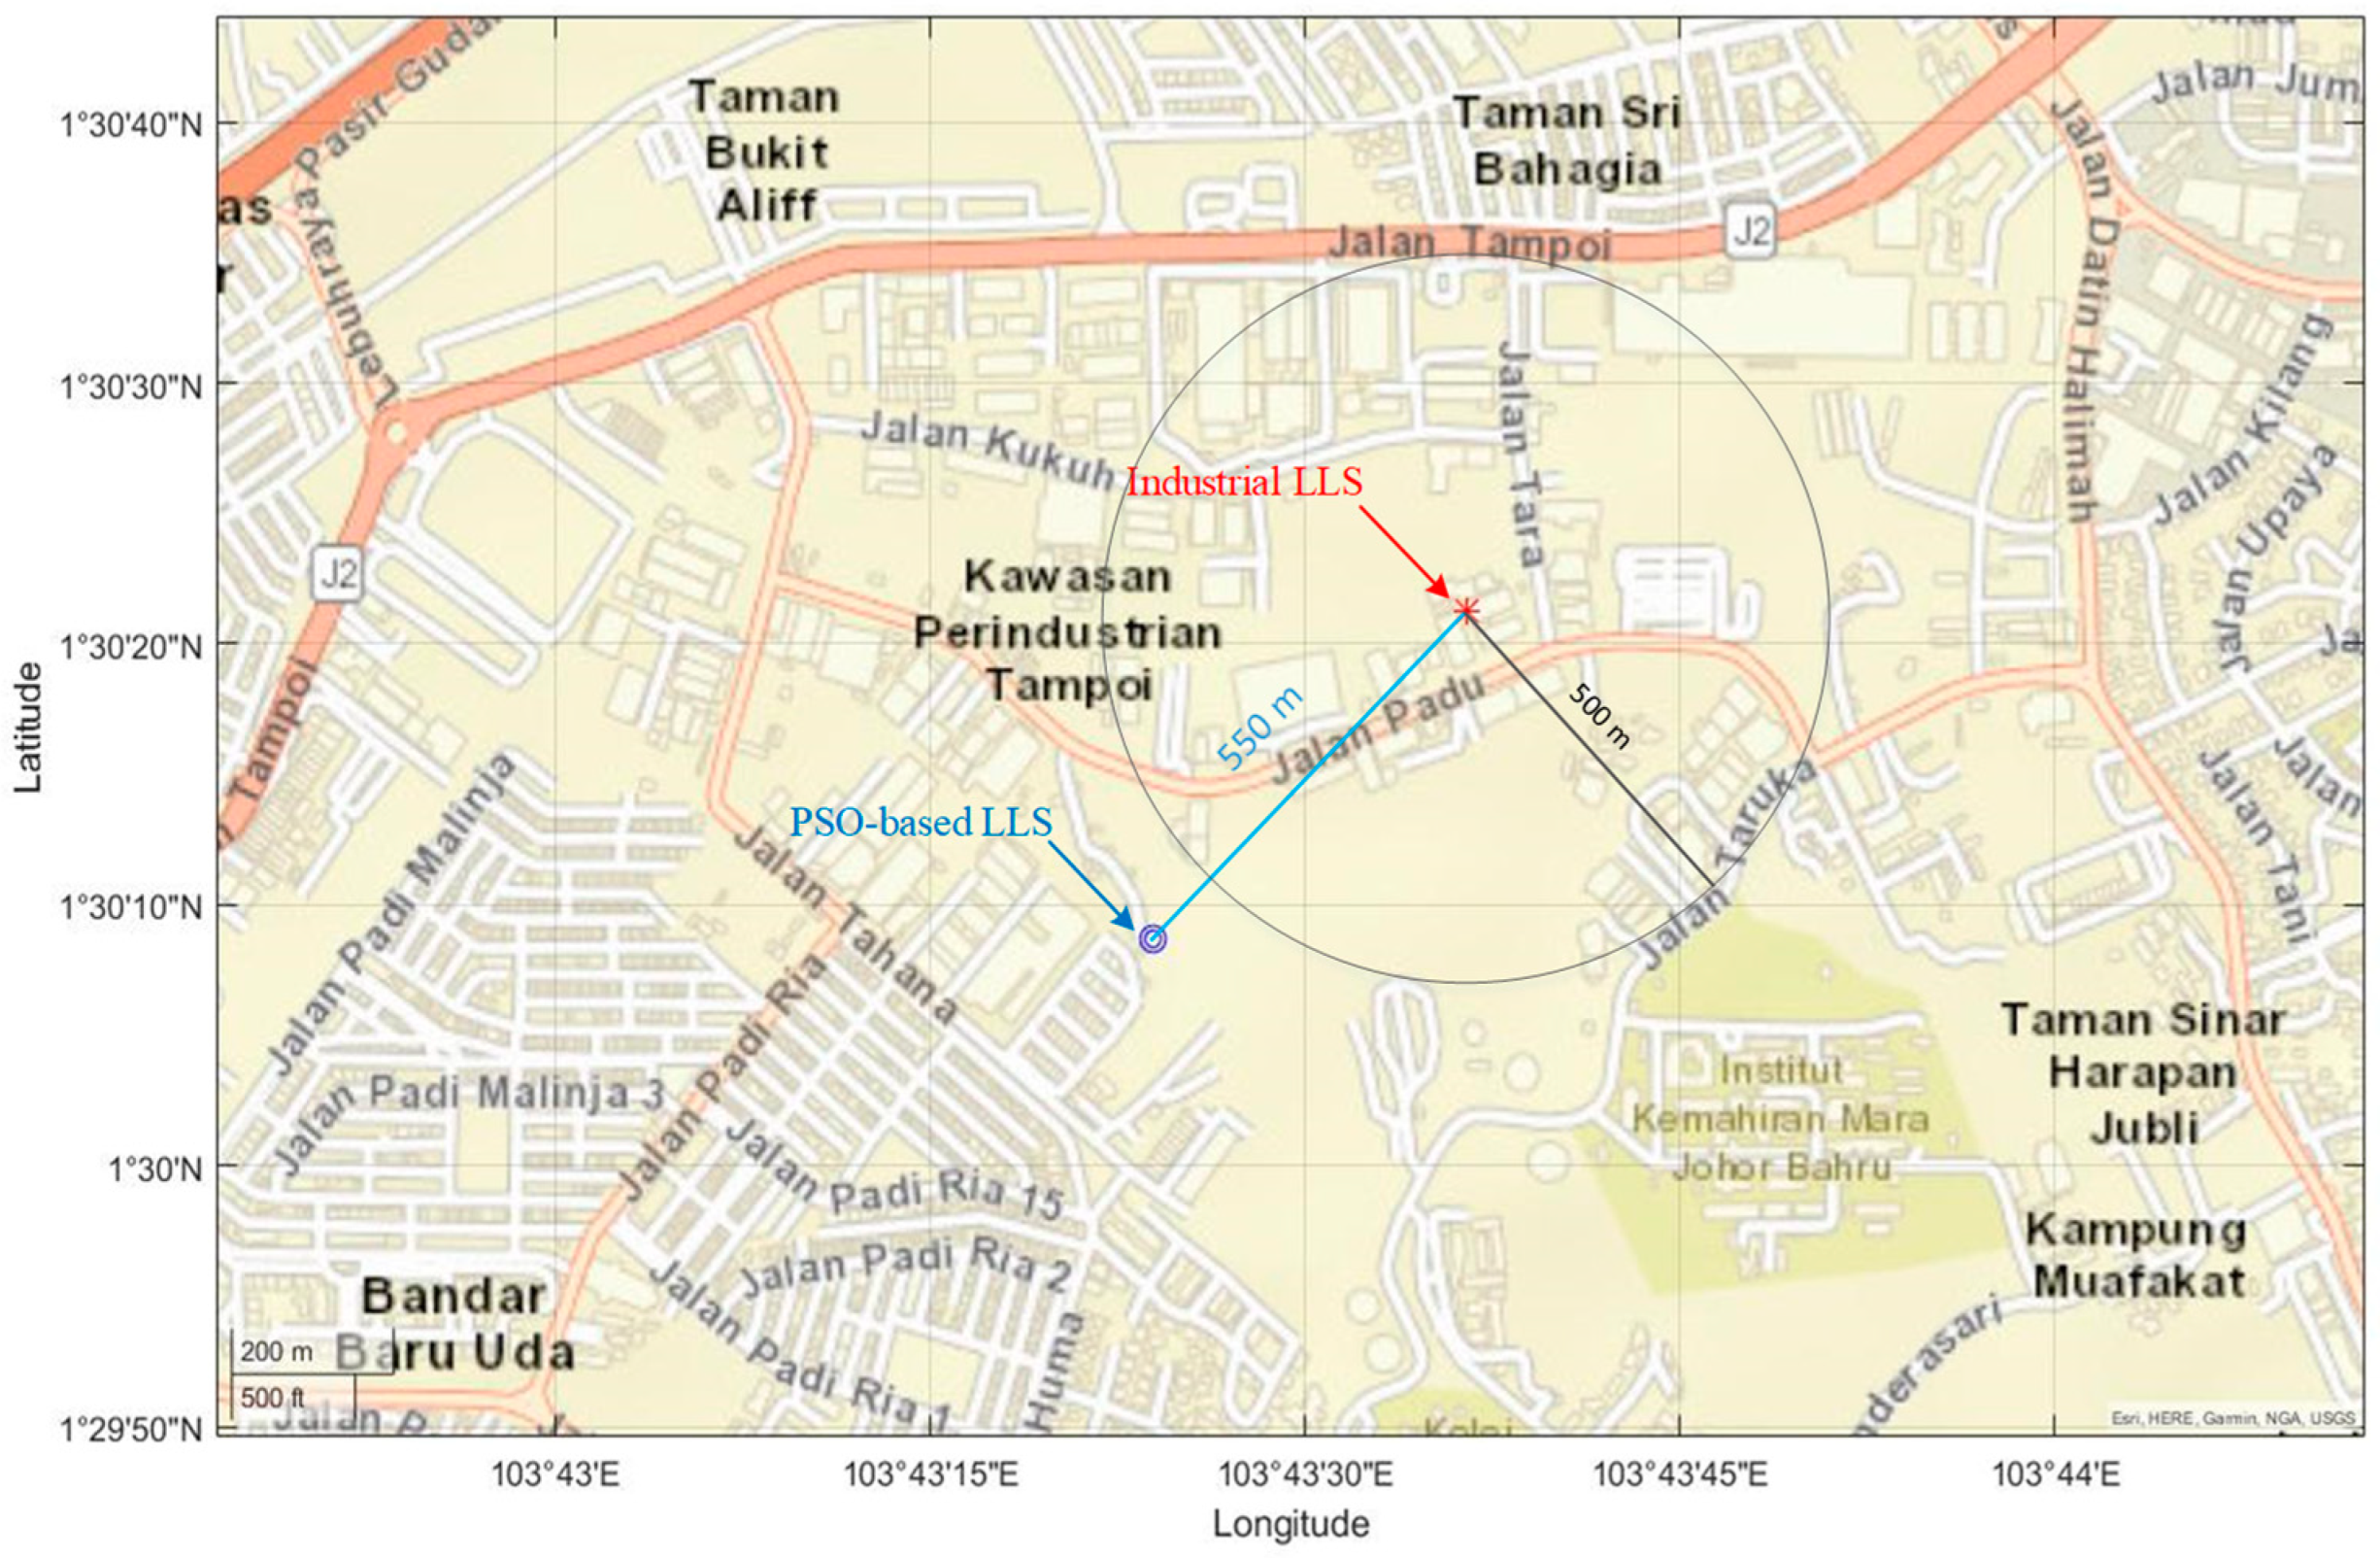
66]. In this study, the camera recordings were not accessible during the designated measurement period. Therefore, inter-comparison analysis was employed. It was conducted between the proposed particle swarm optimization (PSO)-based lightning location system (LLS) and an industrial LLS in Malaysia. To this end, a circular region with a 500-m radius was delineated around the lightning discharge captured by the industrial LLS and depicted in
Figure 17. Given that industrial LLSs typically exhibit a location error of approximately 500 m, it is logical to postulate that the lightning strike may have occurred anywhere within this circular boundary. Consequently, the discrepancy in the estimated lightning location between the PSO-based LLS and industrial LLS could range from 50 m to approximately 1050 m.
In order to promote public awareness, it is important to educate children and the public about safety measures such as lightning protection systems for buildings, as these can significantly reduce the number of injuries caused by lightning strikes. It should be noted, however, that accurately locating the exact location of lightning strikes and predicting their behavior prior to occurrence is currently not possible. The PSO-based lightning locating system is a safety and warning system for detecting and alarming the public as soon as lightning discharge occurs. The results can be broadcasted to the local users in real time for lightning disaster early warning. In addition, a statistical data analysis is a tool for power engineers to protect their equipment and power stations from lightning strikes by improving the protection systems.
6. Conclusions
Malaysia is known to be one of the countries with a high frequency of lightning strikes in the world. According to the Malaysian Meteorological Services, the country experiences an average of 200 thunder days per year, indicating the high frequency of lightning and thunderstorm activity in the region. Knowing the total number of lightning flashes occurring worldwide is crucial in weather and meteorological research. The stations installed in this study are capable of detecting and recording lightning discharges in both VHF and VLF frequency ranges. The collected data can be used to enhance lightning characterization studies in Malaysia, which is a tropical region known for its high lightning and thunderstorm activity.
Cloud-to-ground lightning is the most significant cause of faults and outages in power systems compared to other types of cloud discharges such as inter-cloud and cloud-to-cloud activities. Therefore, it is essential to monitor cloud activities worldwide, especially in tropical regions, which are the main hotspots of lightning strikes. The primary objective of designing lightning protection systems is to safeguard human lives and properties from lightning strikes. Moreover, national regulations in the field of lightning protection are issued to ensure compliance with safety standards.
A ground-based lightning locating system (LLS) comprises a minimum of three sensors and a central server, which work together to detect and locate electromagnetic waveforms generated by a lightning discharge. The sensors capture the signals and transmit them to the server for analysis. Once all sensors detect a cloud-to-ground (CG) lightning event, the central server uses both MDF and TDOA techniques to pinpoint the location of the CG discharge. However, in the MDF method, certain scenarios may arise where the discharge hits a point between two stations, posing a significant challenge for the LLS to accurately locate the discharge.
To address the issue of difficult cases where the hitting point is on the line between stations in the MDF method, at least three stations are required. The azimuth angle of a return stroke can be determined by analyzing the magnetic fields captured by crossed-loop antennas. The implemented PSO-based lightning locating system can provide information on lightning strikes. This study will be significant for public users to be aware of detected storms and estimation of imminent rainfalls.
The integration of MDF and TDOA techniques in the PSO-based LLS has resulted in an accurate lightning detection system with a mean location error of 573 m (up to 573 m) for a specific local region. This development has enhanced the location accuracy of lightning strikes in the region.
The study involved a comparative analysis between a system under investigation and an industrial network located in the southern region of Malaysia, which spanned a predetermined timeframe. Based on the results of the comparison, it was found that the particle swarm optimization (PSO) algorithm-based lightning location system (LLS) exhibited an average distance of 802 m and 344 m in December and March, respectively, when contrasted against the industrial network for detecting multiple lightning flashes. Based on the results obtained, it can be inferred that the LLS using PSO is proficient in precisely identifying and charting lightning discharges in the designated coverage region, thereby qualifying as an effective lightning detection system. The configuration and quantity of stations directly impacted the precision and accuracy of the LLS. The majority of distance deviations and errors were observed along lines passing through two stations. The efficacy of LLS is measured by its capability to accurately geolocate lightning events with high detection efficiency and low false detection rates, as well as correctly report various lightning features.


 ,
, 


 or more
