Communication

Photosynthetically Active Radiation and Foliage Clumping Improve Satellite-Based NIRv Estimates of Gross Primary Production

1
CREAF, Cerdanyola del Vallès, 08193 Barcelona, Spain
2
CSIC, Global Ecology Unit CREAF-CSIC-UAB, Bellaterra, 08193 Barcelona, Spain
3
PLECO, Department of Biology, University of Antwerp, 2610 Wilrijk, Belgium
4
Faculty of Geosciences and Environmental Engineering, Southwest Jiaotong University, Chengdu 610031, China
5
CIDE, CSIC-UV-GV, 46113 València, Spain
6
LREIS, Institute of Geographic Sciences and Natural Resources Research, Chinese Academy of Sciences, Beijing 100101, China
7
College of Resources and Environment, University of Chinese Academy of Sciences, Beijing 100049, China
*
Author to whom correspondence should be addressed.
Remote Sens. 2023, 15(8), 2207; https://doi.org/10.3390/rs15082207
Submission received: 26 February 2023 / Revised: 7 April 2023 / Accepted: 18 April 2023 / Published: 21 April 2023
(This article belongs to the Special Issue Remote Sensing Applications for the Biosphere)

Abstract

:
Monitoring gross primary production (GPP) is necessary for quantifying the terrestrial carbon balance. The near-infrared reflectance of vegetation (NIRv) has been proven to be a good predictor of GPP. Given that radiation powers photosynthesis, we hypothesized that (i) the addition of photosynthetic photon flux density (PPFD) information to NIRv would improve estimates of GPP and that (ii) a further improvement would be obtained by incorporating the estimates of radiation distribution in the canopy provided by the foliar clumping index (CI). Thus, we used GPP data from FLUXNET sites to test these possible improvements by comparing the performance of a model based solely on NIRv with two other models, one combining NIRv and PPFD and the other combining NIRv, PPFD and the CI of each vegetation cover type. We tested the performance of these models for different types of vegetation cover, at various latitudes and over the different seasons. Our results demonstrate that the addition of daily radiation information and the clumping index for each vegetation cover type to the NIRv improves its ability to estimate GPP. The improvement was related to foliage organization, given that the foliar distribution in the canopy (CI) affects radiation distribution and use and that radiation drives productivity. Evergreen needleleaf forests are the vegetation cover type with the greatest improvement in GPP estimation after the addition of CI information, likely as a result of their greater radiation constraints. Vegetation type was more determinant of the sensitivity to PPFD changes than latitude or seasonality. We advocate for the incorporation of PPFD and CI into NIRv algorithms and GPP models to improve GPP estimates.

1. Introduction

As one of the principal processes controlling land–atmosphere interaction, gross primary productivity (GPP) is a key component of the terrestrial carbon balance [1,2]. Continuous and accurate monitoring of GPP is necessary for quantifying how the dynamics of carbon cycles at regional to global scales respond to climate variability, and for addressing related issues including the terrestrial carbon sink, vegetation dynamics and ecosystem vulnerability [3,4,5], above all in the context of climate change. Forecasted changes in temperature, precipitation and atmospheric CO2 are likely to lead to changes in terrestrial productivity [6].
The near-infrared reflectance of vegetation (NIRv) has been proposed as a new approach for estimating GPP [7,8]. NIRv captures the fraction of NIR reflectance attributable to vegetation and addresses the confounding effects of leaf area, background brightness and the distribution of the photosynthetic capacity with depth in canopies. It has been shown to correlate well with GPP throughout the world’s biomes [7,8,9].
The NIRv approach does not take into account radiation and light-use efficiency, since it assumes that plants allocate resources efficiently, so this measure of plants’ investment in capturing light should correlate with their capacity to fix CO2 [7,8]. However, radiation plays an important role in linking vegetation greenness to photosynthesis [10] and, despite not usually being the most important limiting factor, radiation does, in fact, constrain vegetation growth over 27% of the Earth’s vegetated surface area [11]. In the light-use efficiency (LUE) concept developed by Monteith [12], GPP acts as a function of the photosynthetically active radiation (PAR), the fraction of absorbed PAR (fPAR) by plants and the conversion efficiency of absorbed light energy (ε). Recently, NIRVP [13,14], defined as the product of the near-infrared reflectance of vegetation and incoming PAR, has been shown to be closely correlated with GPP on different spatial and temporal scales [13,15,16]. The benefits of adding incoming PAR to NIRv are also evident in the work of Jiang et al. [17].
The effect of radiation on GPP varies with latitude and the time of year. In boreal and temperate European forests, radiation and temperature are the main drivers of the latitudinal gradient and interannual patterns in GPP [18,19]. Carbon assimilation in many boreal coniferous forest ecosystems has been shown to be light-limited in autumn [20,21]. Regarding seasonality, radiation can also affect GPP due to its effect on the phenology of carbon uptake caused by the radiation constraints on photosynthesis, since radiation is a major factor limiting photosynthetic activity during the end of the season [11,22]. The carbon uptake period is also sensitive to changes in radiation in evergreen forests [23].
Radiation use is related to canopy structures and levels of foliage organization, which vary between vegetation cover types [24]. The clumping index (CI) is a measure of the level of foliage grouping within canopy structures relative to a random distribution [24,25]. Leaf organizational structures exist for various ecological reasons, and affect radiation interception and distribution within canopies and, consequently, carbon uptake [26]. Neglecting the CI increases the uncertainty of GPP estimates [26,27]. In fact, the estimation of GPP from sun-induced fluorescence (SIF) improved after accounting for the canopy structure effects [28].
We aimed to explore how radiation as a modulator of NIRv could improve GPP estimates, especially at high latitudes and in the latter part of the year, given that photosynthetic photon flux density (PPFD) drives the GPP of the green biomass. We also hypothesized that the incorporation of information on foliar clumping would provide more accurate estimates of radiation distribution and, therefore, of its use in the canopy. Using eddy covariance flux measurements to test these hypotheses, we compared the ability of a model based solely on NIRv with the ability of two other models—a combination of NIRv and PPFD, and a combination of NIRv, PPFD and CI—to better estimate GPP in situ and, thus, analyse the need to include the structural information of foliage organization in GPP models.

2. Materials and Methods
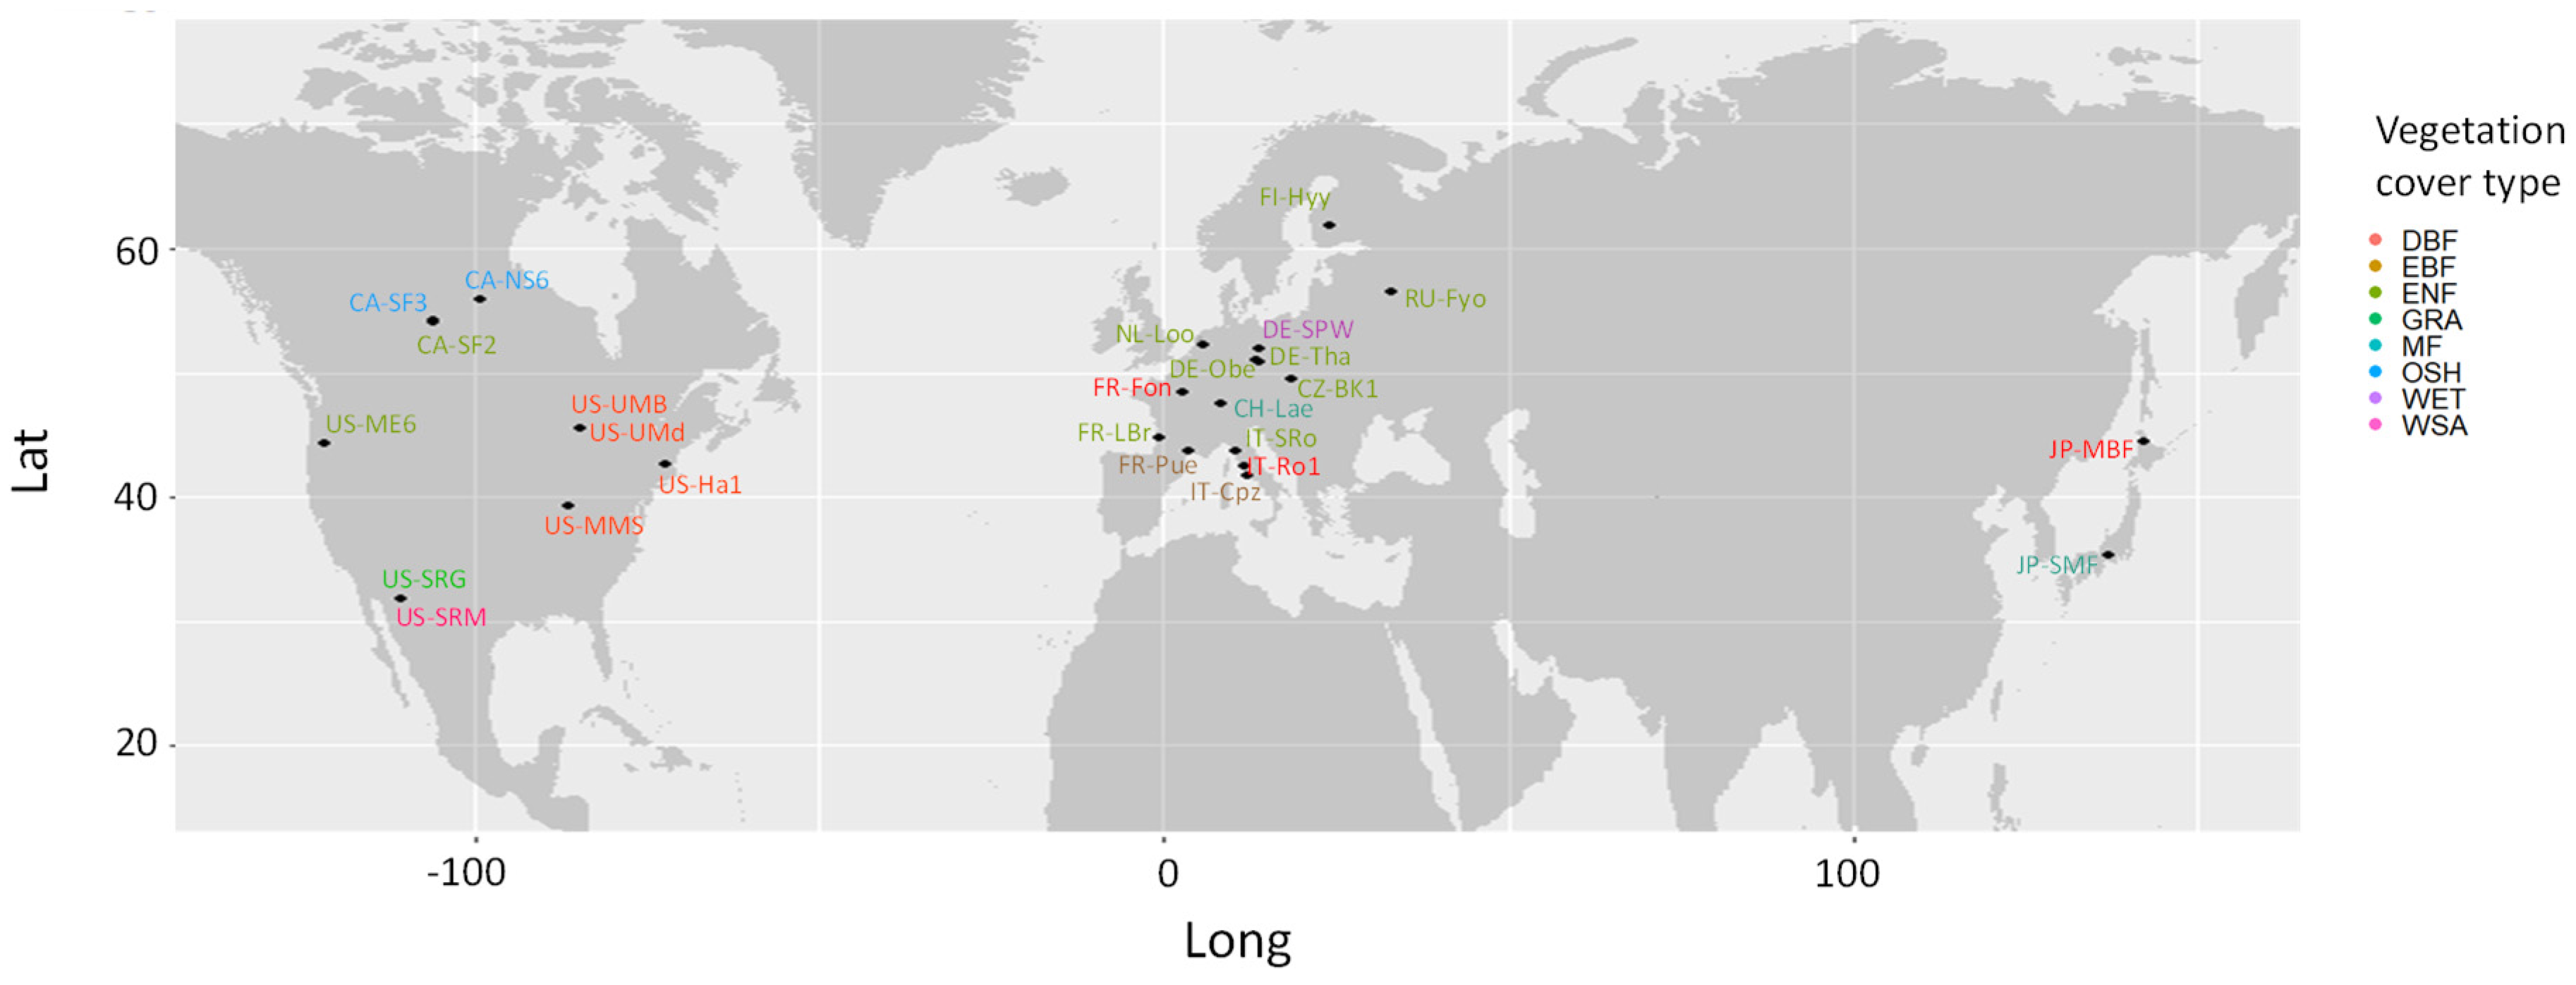
2.1. Carbon Flux

We downloaded meteorological and CO2 flux data collected by eddy covariance towers from the FLUXNET2015 Dataset Tier 1 (https://fluxnet.org/data/fluxnet2015-dataset/, accessed on 25 February 2023) available from 2000 to 2014. We used the daily mean radiation data estimated from average half-hourly records (SW_IN) and daily values of GPP based on methods of daytime partitioning (GPP_DT_VUT_USTAR50) [29].
We selected 26 sites that fulfilled the criteria of (i) high-quality continuous data and (ii) homogeneous vegetation types in pixel areas to match satellite data (Figure 1, Table 1). Site homogeneity in an area of 1 × 1 km2 was visually evaluated using high-resolution satellite images in Google Earth. Sites with homogeneous land cover were selected at high (53–70°N, 5 sites), middle (45–53°N, 9 sites) and low (30–45°N, 12 sites) latitudes, with eight vegetation cover types: evergreen needleleaf forest (ENF, 10 sites), evergreen broadleaf forest (EBF, 2), deciduous broadleaf forest (DBF, 7), mixed forest (MF, 2), open shrubland (OSH, 2), grassland (GRA, 1), woody savanna (WSA, 1) and wetland (WET, 1). Vegetation cover types were provided by FLUXNET using the International Geosphere–Biosphere Programme (IGBP) land classification (https://fluxnet.org/data/badm-data-templates/igbp-classification/, accessed on 25 February 2023).

2.2. Remotely Sensed Data

We used the MCD43A4 Version 6 dataset obtained from the MODIS instrumentation aboard the Terra and Aqua satellites available from 2000 to 2014 in the different sites. This data set contains daily reflectance at a 500 m spatial resolution for the MODIS bands 1 to 7. The reflectance was corrected for atmospheric effects and was nadir bidirectional reflectance distribution function (BRDF)-adjusted to simulate the observations collected from a nadir view. Data were provided by NASA’s LP DAAC portal (https://doi.org/10.5067/MODIS/MCD43A4.006).
The near-infrared reflectance of the vegetation (NIRv) was calculated as the product of the NIR nadir normalized top-of-the-canopy reflectance (ρNIR) and the normalized difference vegetation index (NDVI) [7]:
NIRv = ρNIR × NDVI
where
NDVI = (ρNIR − ρred)/(ρNIR + ρred)
and ρred and ρNIR are the reflectance values for MODIS band 1 (620–670 nm) and band 2 (841–871 nm), respectively.

2.3. Clumping Index (CI)

The canopy CI is defined as a ratio of the effective leaf area index (LAIe) to the leaf area index (LAI) [30], with LAIe being the LAI value that would produce the same indirect gap measurement as observed assuming a simple random distribution of the foliage [31]. The values of the CI for each vegetation type were obtained from He et al. [24] and are as follows: ENF = 0.53, DBF = 0.7, EBF = 0.66, GRA = 0.75, OSH = 0.71, WET = 0.67, WSA = 0.76 and MF = 0.69. In addition, we also used the 8 days 500 m clumping index product (LIS-CI-A1) [32,33], interpolated at daily steps to match with the remote sensing and carbon flux data. The method for interpolation was cubic interpolation. Cubic interpolation estimates values between known data points by fitting a third-degree polynomial using the four closest points to the interpolation date.

2.4. GPP Models

We trained three linear models using the whole dataset:
GPPnirv = f(NIRv)
GPPnirvppfd = f(NIRv + PPFD)
GPPnirvppfdci = f(NIRv + PPFD + CI)
We then checked the performance of each model after grouping the different sites into three latitudinal ranges—low (30–45°), middle (45–53°) and high (53–62°) latitudes°—given how much the irradiance depends on latitude.
Since radiation seems to mostly affect vegetation productivity in autumn [28], we also compared the performance of the models after adding radiation to NIRv both before and after the summer solstice (21 June).

2.5. Statistical Analyses
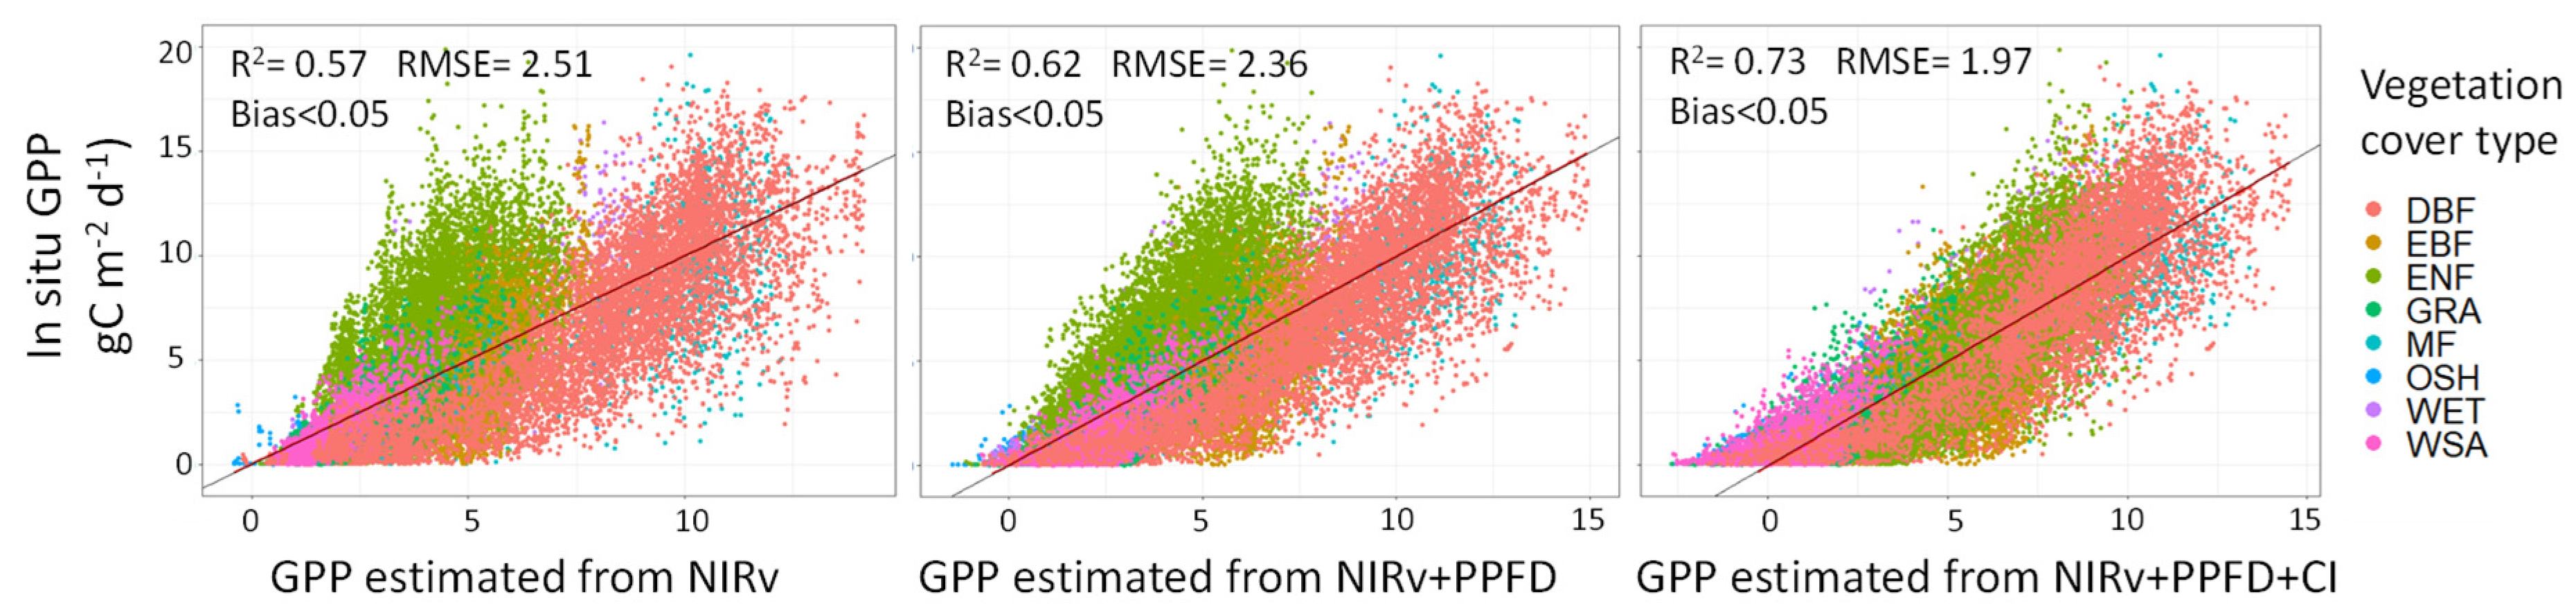
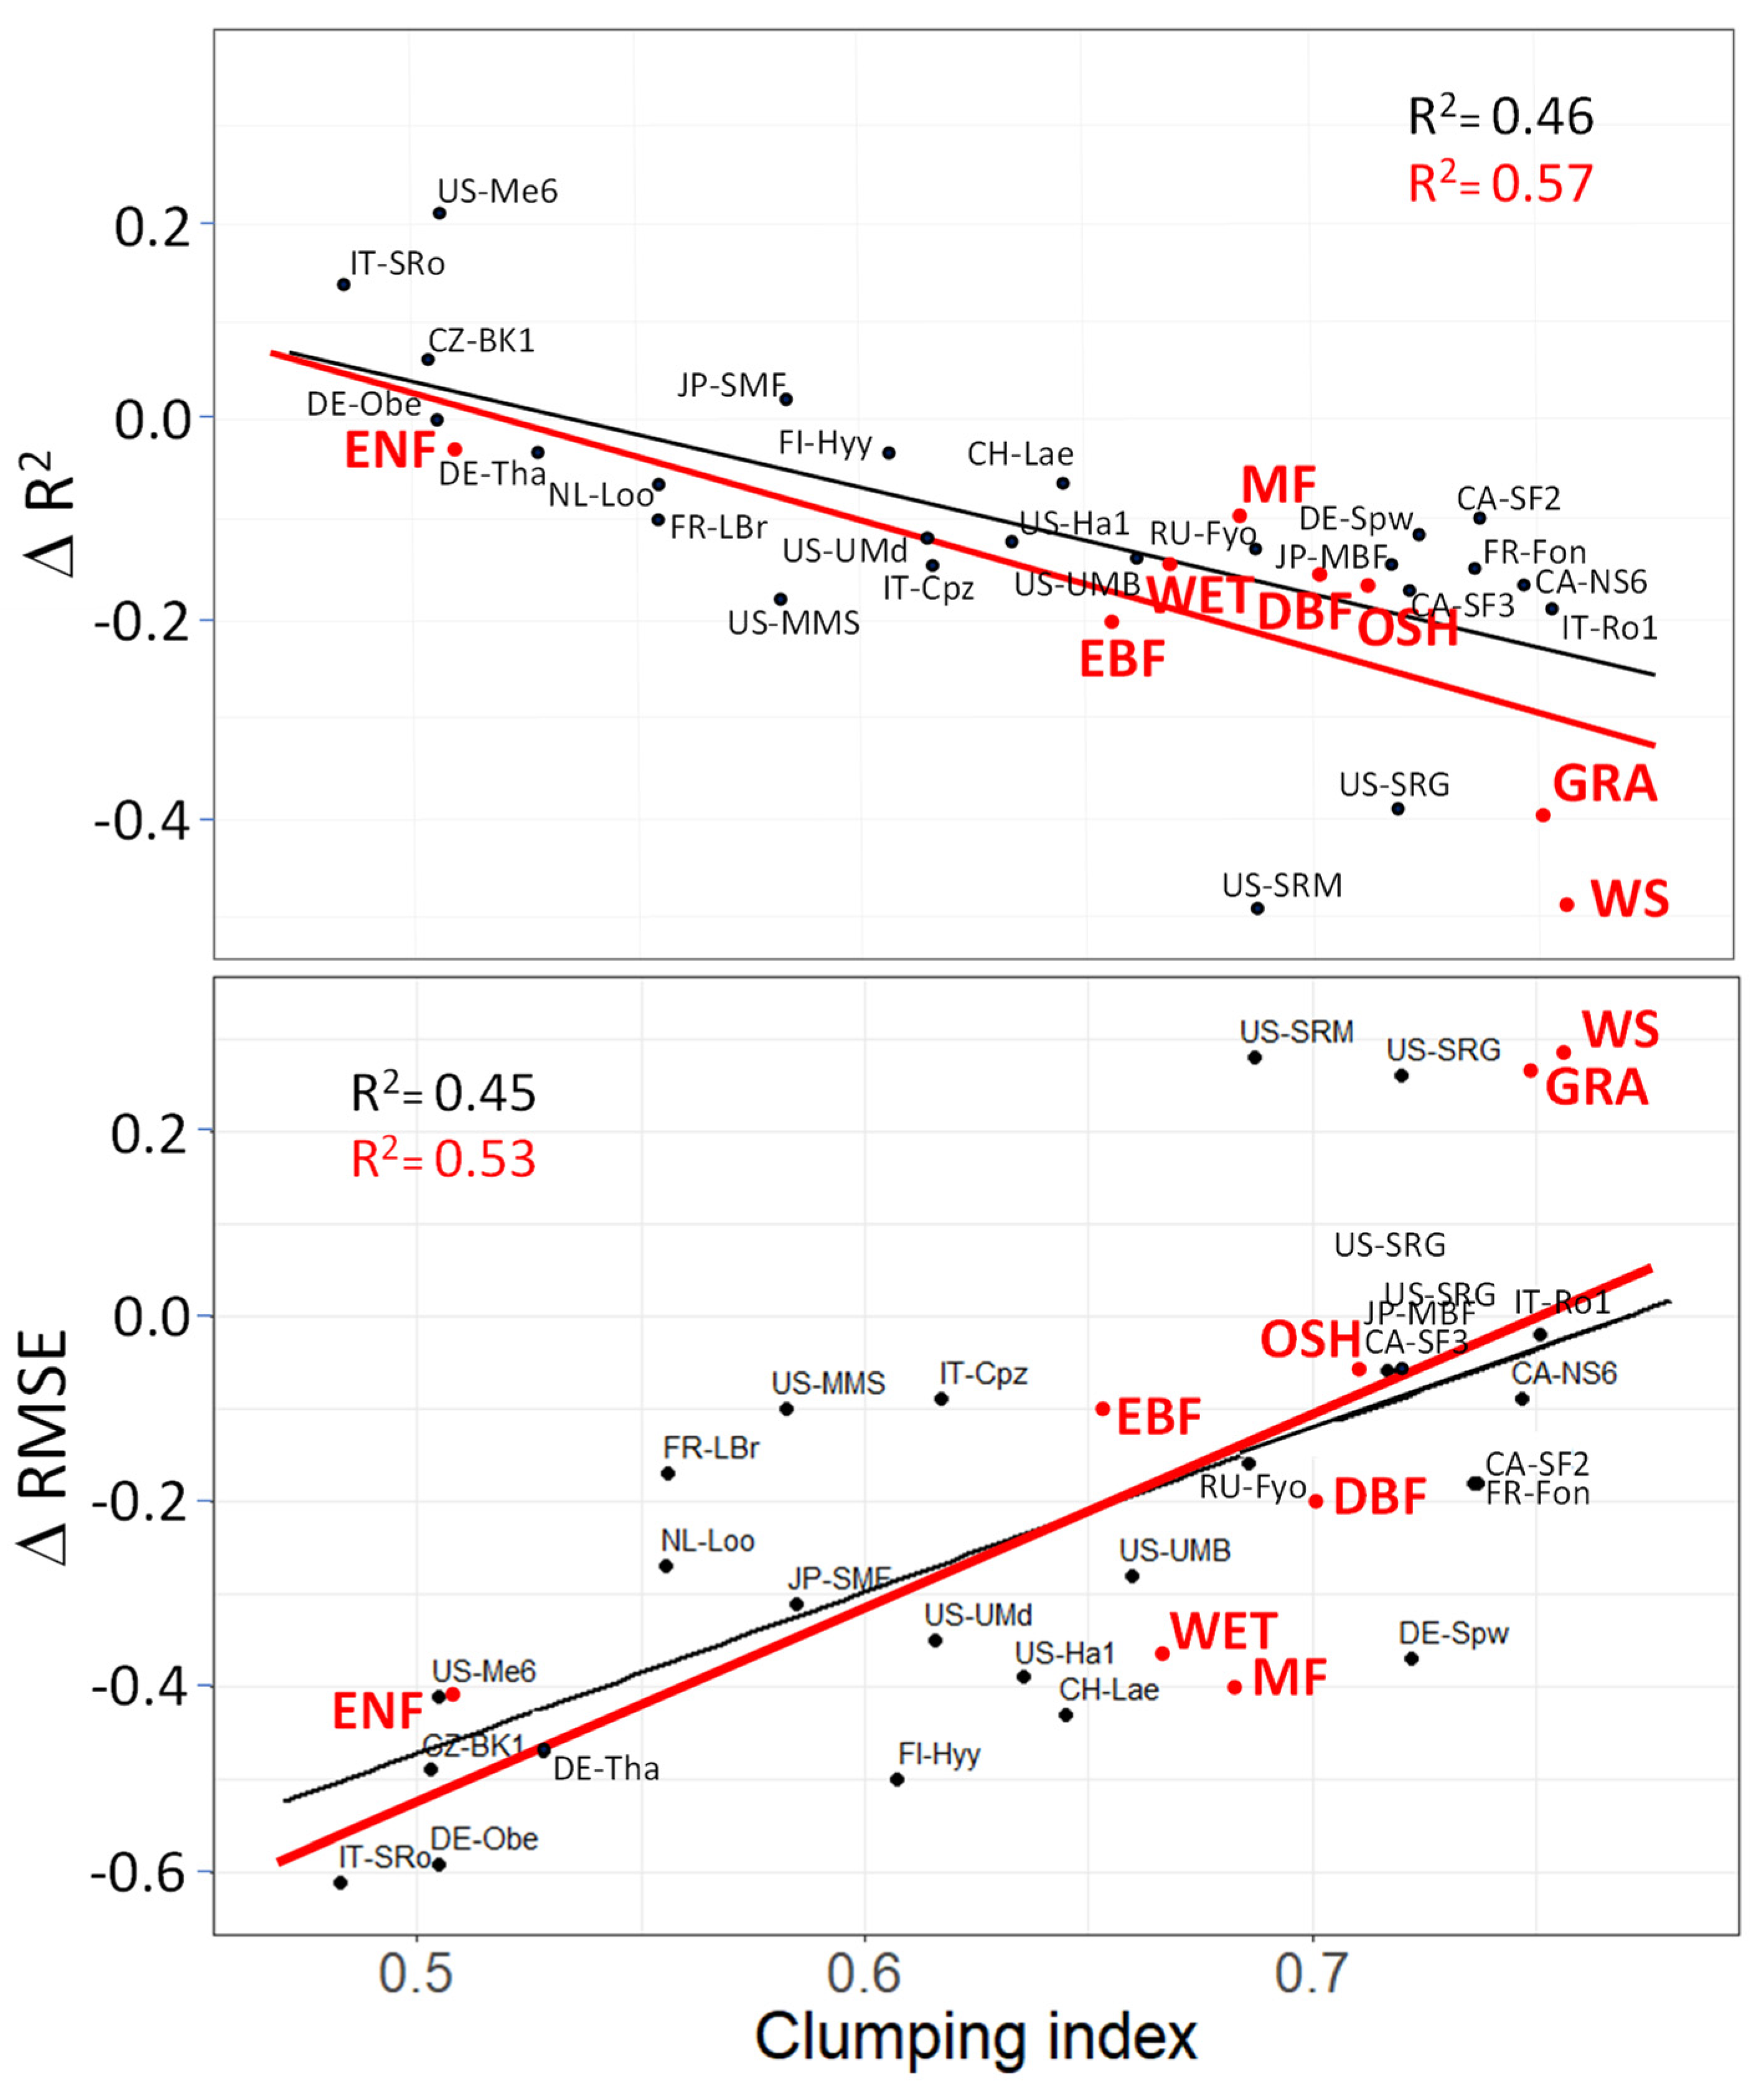
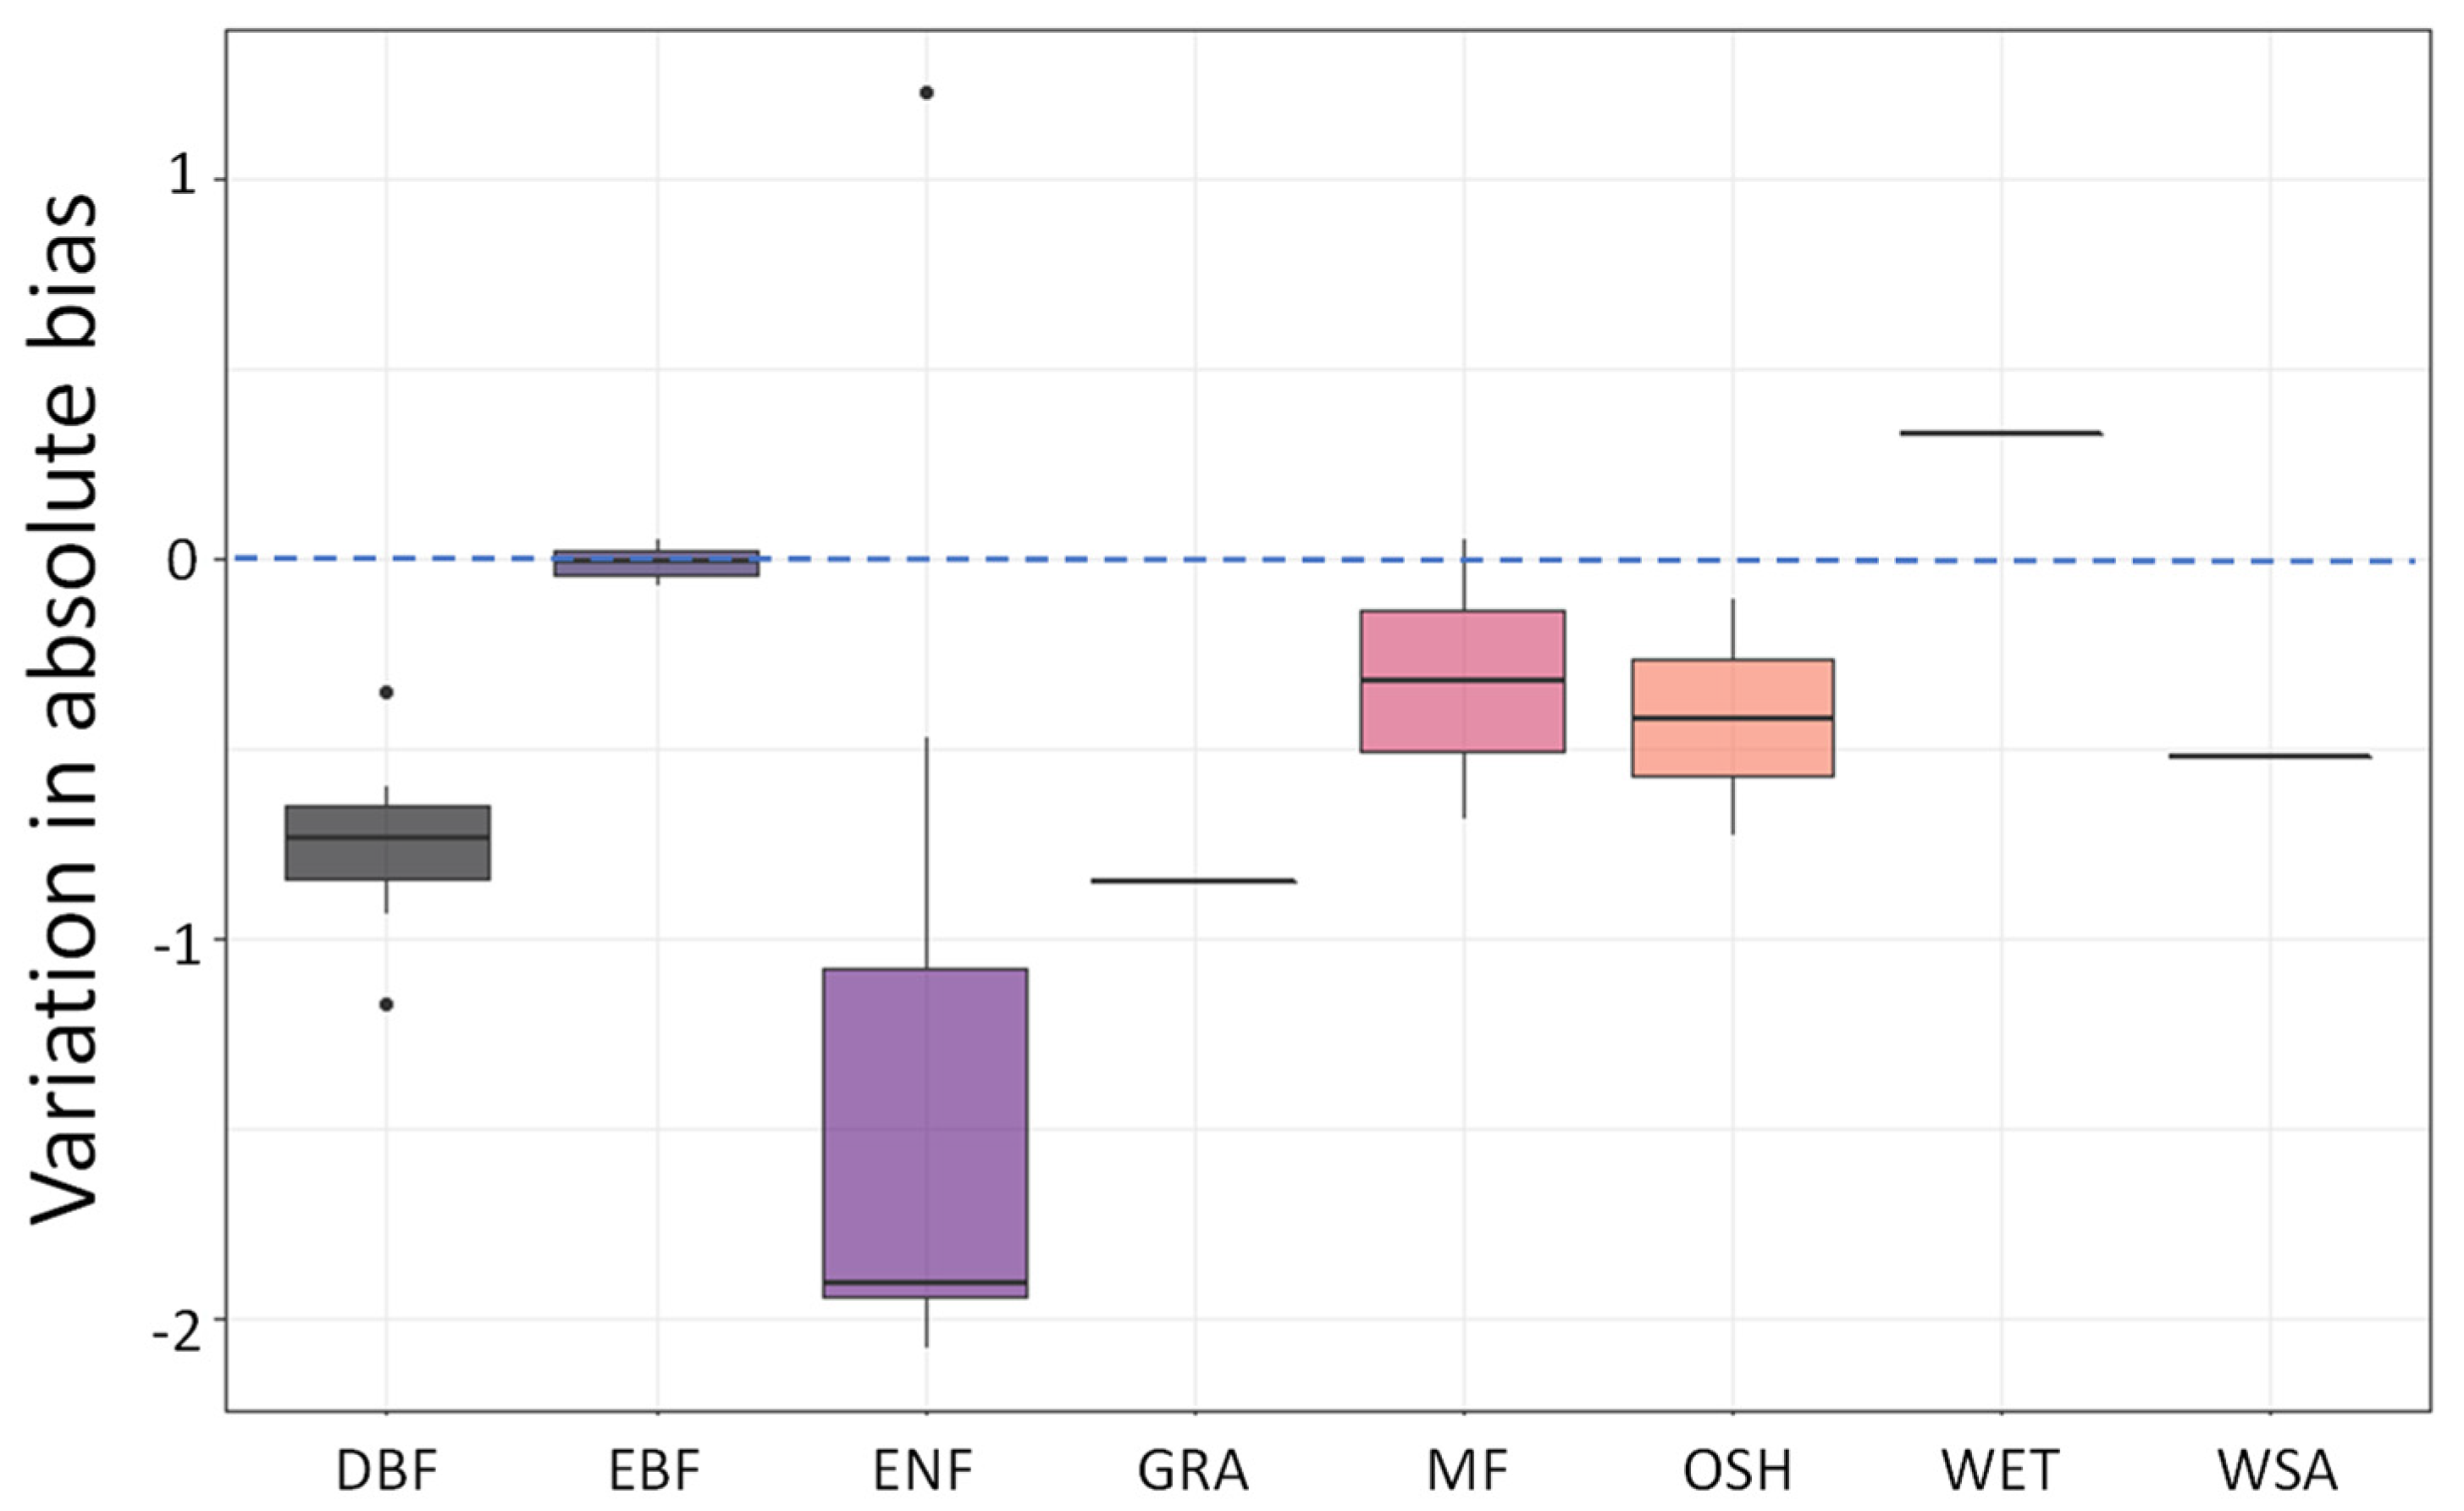
All data treatment and analyses were conducted using R statistical software (version 3.2.5) [34]. The modelling and assessment of the predictive performance of the models was conducted using the k-fold cross-validation approach [35] (k = 10; 10% of the data was left for validation purposes at each validation run) with “lmStepAIC” from the R package caret [36]. We used the coefficient of determination (R2), the root mean square error (RMSE), a measure of uncertainty, and the mean error (bias; mean differences between predicted GPP and measured GPP) to measure the accuracy of the estimates of the linear regression models.

3. Results

The comparison between ground-measured and satellite-estimated GPP using the different models shows that the GPP estimates improved after adding radiation information to the NIRv–GPP model (from R2 = 0.57, RMSE = 2.51, Akaike information criterion (AIC) = 49,522 to R2 = 0.62, RMSE = 2.36, AIC = 46,212), and even more so after adding the CI for each biome (R2 = 0.73, RMSE = 1.97, AIC = 36,622) (Figure 2). The improvement was lower (R2 = 0.69, RMSE = 2.23, AIC = 37,756) (Figure S1) when using the 8 days 500 m LIS-CI-A1 product in the model instead of using a fixed CI value per biome type from He et al. [24].
The addition of PPFD information to NIRv improved the GPP estimates for all except two sites and for all vegetation cover types except grasslands and woody savanna (Figure 3). This improvement in the estimates after adding PPFD information was significantly correlated with the CI (Figure 3); the higher the foliage organization (lower CI), the greater the improvement in terms of correlation and certainty (higher increase in R2 and greater decrease in RMSE, respectively). ENF, the vegetation cover type with the lowest CI (i.e., the highest foliage organization), was the cover type that improved the most after adding the PPFD information (Figure 3).
When adding the CI information for each biome to the NIRv + PPFD model, the bias decreased, above all in ENF, for all vegetation cover types except WET (the improvement ranged from −1.97 in ENF to −0.06 in EBF; see Figure 4 and Figure S2).
The GPP estimates improved at all latitudes after adding the radiation information, although bias increased, and no differences were detected between latitudes (Figure S2). After adding CI information, both uncertainty and bias decreased in all latitudinal groups. Of the vegetation cover types, ENF contributed most to the decrease in dispersion in all latitudinal ranges after adding the CI information (Figure S2).
Finally, we checked the performance of each model when the data of evergreen needleleaf forests—the most sensitive vegetation cover type to PPFD and CI—were separated in the three latitudinal ranges. The improvement in the GPP estimates was similar at all latitudinal ranges when PPFD was added to the model. Similarly, the improvements in the evergreen needleleaf GPP estimates when the CI information was added were not latitudinally dependent, and the bias decreased from 2.05 to 0.09 as evaluated over the whole dataset (Figure S3). The predictive ability of the three models fell as the latitude decreased. We found no differences in the improvements to the GPP estimates after adding radiation before and after the summer solstice (Table S1).

4. Discussion

4.1. Adding PPFD and CI to NIRv to Remotely Assess GPP

The addition of information on radiation to NIRv improved the GPP estimates for different vegetation cover types. Only in grasslands did radiation not improve the estimates, although this was expected given that canopy development in grasslands occurs in parallel to photosynthetic activity [37]. In addition, changes in GPP are often linked to water availability rather than to radiation, since grasslands are often water-constrained [38,39].
The improvement in GPP after adding radiation to NIRv was related to foliage organization. When PPFD was included in the model, the improvement increased with decreasing CI (higher leaf organization). This is due to the light distribution and its use inside the canopy. If leaves are more clumped on shoots, branches and crowns, more light can penetrate the canopy, making it less light-saturated and more sensitive to light changes. The incorporation of a variable of vegetation structure, such as CI, into the NIRv + PPFD algorithm improved the global GPP estimate in terms of uncertainty and bias. NIRv addresses the distribution of the photochemical capacity of the complete canopy since plants allocate their photosynthetic capacity to be able to fully exploit captured sunlight, and so the photochemical capacity of the complete canopy is directly related to the performance of the topmost leaves in the canopy [40]. However, the effects of the changes in PPFD differ depending on how the radiation is distributed throughout the canopy as a result of differences in structure and leaf distribution. Leaf structure and distribution also affect the reabsorption intensity and the scattering directions of PPFD within the canopy [41,42] and, therefore, its reflectance and NIRv. Thus, the addition of CI information for each vegetation type corrected for the effects of the PPFD distribution in the canopy on GPP and improved the global GPP estimates. The incorporation of vegetation structure and foliage organization into GPP models should be advantageous given their key role in light use efficiency.

4.2. Vegetation Cover Types

The vegetation cover type with the greatest improvement in GPP estimation after the addition of CI information was evergreen needleleaf forests. In this biome, radiation limitation was found to have the greatest effect on productivity (16%) [19]. Evergreen ecosystems tend to have greater radiation constraints [11] and, after temperature, radiation is the most limiting climatic variable in this type of forest [43]. The greater sensitivity of ENF to PPFD variations could be related to the facts that conifer canopies are particularly effective in distributing light throughout the canopy due to the clumping of needles around stems [44] and that the leaf area index (LAI) in needleleaf canopies is higher than in other vegetation cover types [45,46]. The total leaf area supported by a given crown is the most basic structural property affecting the amount of absorbed solar radiation and plant gas exchange [47,48,49], although it is also important to take into account how leaves are distributed. Of all vegetation types, evergreen needleleaf forests have the lowest CI [24]. They are highly organized, with structures composed of shoots of needles, branches, whorls, tree crowns and tree stands [50]. This organization allows more radiation to penetrate into the canopy and, thus, permits a greater use of light. The structure of these forests increases both canopy photosynthesis—since more light can reach the lower levels of the canopy—and the contribution of non-light-saturated shaded leaves to whole canopy rates, thereby resulting in a higher GPP than the GPP estimated considering only the green biomass. Thus, including CI in the model corrected for this effect, and values for ENF fitted the general model better.
Our study area was limited to northern latitudes, and no tropical areas were included. Radiation also plays an important role in tropical forests since it is the main factor limiting CO2 uptake during the rainy season. Seasonal and interannual variation in light availability may also limit CO2 uptake [51]. Light may significantly regulate net ecosystem exchange and carbon storage in this biome, and possible changes in the distribution of cloud cover associated with climate change could cause significant future changes in carbon storage [52]. Tropical forests account for 32–36% of global terrestrial net primary production [53]. Unfortunately, given the frequent cloud cover in tropical areas, it is often difficult to obtain high-quality remote sensing data from tropical biomes in the spectral domain involved in NIRv computation and in the optical spectra in general.
We did not analyse water stress effects on GPP, so caution should be taken when using the corrected NIRv in drought-prone areas.

4.3. Latitudinal Ranges

The improvement in the GPP estimates in ENF after the addition of PPFD was independent of latitude (Figures S2 and S3). This suggests that the vegetation type is more determinant in the sensitivity to PPFD changes than latitude, and that PPFD already intrinsically takes into account latitudinal variation. The importance of PPFD in driving GPP changes at middle and high latitudes [19] may, in part, be related to the dominance of ENF at these latitudes. However, the effect of greater radiation limitation with latitude on GPP [11] should also be considered. At high latitudes, radiation limits vegetation productivity, since incoming solar radiation is restricted to the summer season and high cloud cover may greatly reduce the radiation received by the vegetation and, thus, limit vegetation productivity. At middle and low latitudes, a combination of either temperature and radiation or temperature and water availability limits the net primary productivity [43]. The addition of radiation information also improved the GPP estimates at low and middle latitudes, where temperature and water can be limiting factors. The fact that the models perform worse with decreasing latitude in the ENF sites (Figures S2 and S3) could be related to the interference of drought or temperature stresses.

4.4. Seasonality

The dynamics of carbon uptake can also be sensitive to the seasonality of incoming radiation. Light is a key factor exerting control on photosynthesis in autumn [11,22]. Radiation can play an important role in regulating the end of the growing season in temperate and boreal ecosystems [23]. Greater autumn radiation in evergreen forests results in a later end date for net carbon uptake and is associated with higher autumn and annual net ecosystem productivity [23]. Some studies have shown that carbon assimilation in many boreal coniferous forest ecosystems is light-constrained in autumn [20,21]. Greater radiation may enable more net carbon gain in autumn as the days become shorter and radiation is often limited [54]. Therefore, we would expect more improvement in the GPP estimates after the addition of radiation in autumn since it is in this season that radiation seems to play a more important role [22]. However, we found no differences in the improvements in the GPP estimates after considering radiation before and after the summer solstice (Table S1). In fact, radiation has been found to be limiting both at the start of the season and end of the season in temperate Europe. This result reinforces the value of our model, which uses NIRv, PPFD and CI to remotely assess daily GPP throughout the whole year.

5. Conclusions

Our results demonstrate that the addition of daily radiation information (photosynthetic photon flux density, PPFD) and the clumping index (CI) for each vegetation cover type to the NIRv algorithm improves its ability to estimate GPP. The improvement is related to foliage organization, given that the foliar distribution in the canopy (CI) affects radiation distribution and use, and radiation drives productivity. Evergreen needleleaf forest is the vegetation cover type with the greatest improvement in GPP estimation after the addition of CI information. Vegetation type is more determinant in the sensitivity to PPFD changes than latitude or seasonality. Our results highlight that foliar organization and tree structure play an important role in productivity. We advocate for the incorporation of PPFD and CI into NIRv algorithms to improve GPP estimates and GPP models.

Supplementary Materials

The following supporting information can be downloaded at: https://www.mdpi.com/article/10.3390/rs15082207/s1, Table S1. Coefficient of determination (R2) and RMSE of the relationship between GPP and the different models according to whether data from before (DOY < 182) or after (DOY > 182) the summer solstice were used. Figure S1. Relationship between the measured GPP and the GPP estimated from NIRv + PPFD + CI, for the whole dataset using the 8 days clumping index product (LIS-CI-A1) [32,33]. Different colours identify the vegetation cover types. Figure S2. Measured GPP vs. the GPP estimated by the different models after grouping the sites according to latitude. Different colours identify the vegetation cover types. Figure S3. Measured GPP vs. GPP estimated with NIRv, NIRv + PPFD and NIRv + PPFD + CI, fitting the model with the whole dataset and after grouping ENF data according to latitude: low (30–45°, 3 sites), middle (45–53°, 4 sites) and high (53–62°, 3 sites) latitudes. The root mean square error (RMSE), the coefficient of determination (R2) and the bias are indicated (statistics of the general model are shown in red). The red line corresponds to the linear regression and the black line to the 1:1 line. Different colours identify the vegetation cover types.

Author Contributions

I.F.: Conceptualization, data gathering, methodology, writing—original draft, writing—review and editing. A.D.: Data gathering, methodology, writing—review and editing. M.B.: Data gathering, methodology, writing—review and editing. G.Y.: Methodology, writing—review and editing. A.V.: Methodology, writing—review and editing. H.F.: Data, writing—review and editing. J.P.: Conceptualization, methodology, writing—original draft, writing—review and editing. All authors have read and agreed to the published version of the manuscript.

Funding

This research was financially supported by TED2021-132627B-I00 funded by MCIN, AEI/10.13039/501100011033 and the European NextGenerationEU/PRTR, the Catalan government project SGR 2021-01333 and the Fundación Ramón Areces project CIVP20A6621. M.B. thanks the financial support provided by the Belgian Science Policy Office (BELSPO) within the framework of the STEREO III program (ECOPROPHET project, contract number: SR/00/334).

Acknowledgments

This work represents a contribution to the CSIC Thematic Interdisciplinary Platform TELEDETECT.

Conflicts of Interest

The authors declare no conflict of interest. The funders had no role in the design of the study; in the collection, analyses, or interpretation of data; in the writing of the manuscript; or in the decision to publish the results.

References

  1. Chen, J.; Zhang, H.; Liu, Z.; Che, M.; Chen, B. Evaluating Parameter Adjustment in the MODIS Gross Primary Production Algorithm Based on Eddy Covariance Tower Measurements. Remote Sens. 2014, 6, 3321–3348. [Google Scholar] [CrossRef]
  2. Beer, C.; Reichstein, M.; Tonelleri, E.; Ciais, P.; Jung, M.; Carvalhais, N.; Rödenbeck, C.; Arain, M.A.; Baldocchi, D. Terrestrial Gross Carbon Dioxide Uptake: Global Distribution and Covariation with Climate. Science 2010, 329, 834–839. [Google Scholar] [CrossRef] [PubMed]
  3. Zhao, M.; Running, S.W. Drought-Induced Reduction in Global. Science 2010, 329, 940–943. [Google Scholar] [CrossRef] [PubMed]
  4. Pan, S.; Tian, H.; Dangal, S.R.S.; Ouyang, Z.; Tao, B.; Ren, W.; Lu, C.; Running, S. Modeling and Monitoring Terrestrial Primary Production in a Changing Global Environment: Toward a Multiscale Synthesis of Observation and Simulation. Adv. Meteorol. 2014, 2014, 965936. [Google Scholar] [CrossRef]
  5. Ciais, P.; Reichstein, M.; Viovy, N.; Granier, A.; Ogée, J.; Allard, V.; Aubinet, M.; Buchmann, N.; Bernhofer, C.; Carrara, A.; et al. Europe-Wide Reduction in Primary Productivity Caused by the Heat and Drought in 2003. Nature 2005, 437, 529–533. [Google Scholar] [CrossRef]
  6. Shukla, P.R.; Skea, J.; Calvo Buendia, E.; Masson-Delmotte, V.; Pörtner, H.-O.; Roberts, D.C.; Zhai, P.; Slade, R.; Connors, S.; van Diemen, R.; et al. (Eds.) IPCC Climate Change and Land: An IPCC Special Report on Climate Change, Desertification, Land Degradation, Sustainable Land Management, Food Security, and Greenhouse Gas Fluxes in Terrestrial Ecosystems; 2019. Available online: https://www.ipcc.ch/srccl/ (accessed on 25 February 2023).
  7. Badgley, G.; Field, C.B.; Berry, J.A. Canopy Near-Infrared Reflectance and Terrestrial Photosynthesis. Sci. Adv. 2017, 3, e1602244. [Google Scholar] [CrossRef]
  8. Badgley, G.; Anderegg, L.D.L.; Berry, J.A.; Field, C.B. Terrestrial Gross Primary Production: Using NIRV to Scale from Site to Globe. Glob. Chang. Biol. 2019, 25, 3731–3740. [Google Scholar] [CrossRef]
  9. Baldocchi, D.D.; Ryu, Y.; Dechant, B.; Eichelmann, E.; Hemes, K.; Ma, S.; Sanchez, C.R.; Shortt, R.; Szutu, D.; Valach, A.; et al. Outgoing Near-Infrared Radiation From Vegetation Scales With Canopy Photosynthesis Across a Spectrum of Function, Structure, Physiological Capacity, and Weather. J. Geophys. Res. Biogeosci. 2020, 125, e2019JG005534. [Google Scholar] [CrossRef]
  10. Zhang, Y.; Commane, R.; Zhou, S.; Williams, A.P.; Gentine, P. Light Limitation Regulates the Response of Autumn Terrestrial Carbon Uptake to Warming. Nat. Clim. Chang. 2020, 10, 739–743. [Google Scholar] [CrossRef]
  11. Nemani, R.R.; Keeling, C.D.; Hashimoto, H.; Jolly, W.M.; Piper, S.C.; Tucker, C.J.; Myneni, R.B.; Running, S.W. Climate-Driven Increases in Global Terrestrial Net Primary Production from 1982 to 1999. Science 2003, 300, 1560–1563. [Google Scholar] [CrossRef]
  12. Monteith, J.L. Solar Radiation and Productivity in Tropical Ecosystems. J. Appl. Ecol. 1972, 9, 747. [Google Scholar] [CrossRef]
  13. Dechant, B.; Ryu, Y.; Badgley, G.; Köhler, P.; Rascher, U.; Migliavacca, M.; Zhang, Y.; Tagliabue, G.; Guan, K.; Rossini, M.; et al. NIRVP: A Robust Structural Proxy for Sun-Induced Chlorophyll Fluorescence and Photosynthesis across Scales. Remote Sens. Environ. 2022, 268, 112763. [Google Scholar] [CrossRef]
  14. Zeng, Y.; Badgley, G.; Dechant, B.; Ryu, Y.; Chen, M.; Berry, J.A. A Practical Approach for Estimating the Escape Ratio of Near-Infrared Solar-Induced Chlorophyll Fluorescence. Remote Sens. Environ. 2019, 232, 111209. [Google Scholar] [CrossRef]
  15. Khan, A.M.; Stoy, P.C.; Joiner, J.; Baldocchi, D.; Verfaillie, J.; Chen, M.; Otkin, J.A. The Diurnal Dynamics of Gross Primary Productivity Using Observations From the Advanced Baseline Imager on the Geostationary Operational Environmental Satellite-R Series at an Oak Savanna Ecosystem. J. Geophys. Res. Biogeosci. 2022, 127, e2021JG006701. [Google Scholar] [CrossRef]
  16. Kong, J.; Ryu, Y.; Liu, J.; Dechant, B.; Rey-Sanchez, C.; Shortt, R.; Szutu, D.; Verfaillie, J.; Houborg, R.; Baldocchi, D.D. Matching High Resolution Satellite Data and Flux Tower Footprints Improves Their Agreement in Photosynthesis Estimates. Agric. For. Meteorol. 2022, 316, 108878. [Google Scholar] [CrossRef]
  17. Jiang, C.; Guan, K.; Wu, G.; Peng, B.; Wang, S. A Daily, 250 m and Real-Time Gross Primary Productivity Product (2000–Present) Covering the Contiguous United States. Earth Syst. Sci. Data 2021, 13, 281–298. [Google Scholar] [CrossRef]
  18. van Dijk, A.I.J.M.; Dolman, A.J.; Schulze, E.D. Radiation, Temperature, and Leaf Area Explain Ecosystem Carbon Fluxes in Boreal and Temperate European Forests. Glob. Biogeochem. Cycles 2005, 19, 1–15. [Google Scholar] [CrossRef]
  19. Sun, Z.; Wang, X.; Yamamoto, H.; Tani, H.; Zhong, G.; Yin, S.; Guo, E. Spatial Pattern of GPP Variations in Terrestrial Ecosystems and Its Drivers: Climatic Factors, CO2 Concentration and Land-Cover Change, 1982–2015. Ecol. Inform. 2018, 46, 156–165. [Google Scholar] [CrossRef]
  20. Mäkelä, A.; Kolari, P.; Karimäki, J.; Nikinmaa, E.; Perämäki, M.; Hari, P. Modelling Five Years of Weather-Driven Variation of GPP in a Boreal Forest. Agric. For. Meteorol. 2006, 139, 382–398. [Google Scholar] [CrossRef]
  21. Vesala, T.; Launiainen, S.; Kolari, P.; Pumpanen, J.; Sevanto, S.; Hari, P.; Nikinmaa, E.; Kaski, P.; Mannila, H.; Ukkonen, E.; et al. Autumn Temperature and Carbon Balance of a Boreal Scots Pine Forest in Southern Finland. Biogeosciences 2010, 7, 163–176. [Google Scholar] [CrossRef]
  22. Descals, A.; Verger, A.; Yin, G.; Filella, I.; Fu, Y.H.; Piao, S.; Janssens, I.A.; Peñuelas, J. Radiation-constrained Boundaries Cause Nonuniform Responses of the Carbon Uptake Phenology to Climatic Warming in the Northern Hemisphere. Glob. Chang. Biol. 2022, 29, 719–730. [Google Scholar] [CrossRef] [PubMed]
  23. Fu, Z.; Stoy, P.C.; Luo, Y.; Chen, J.; Sun, J.; Montagnani, L.; Wohlfahrt, G.; Rahman, A.F.; Rambal, S.; Bernhofer, C.; et al. Climate Controls over the Net Carbon Uptake Period and Amplitude of Net Ecosystem Production in Temperate and Boreal Ecosystems. Agric. For. Meteorol. 2017, 243, 9–18. [Google Scholar] [CrossRef]
  24. He, L.; Chen, J.M.; Pisek, J.; Schaaf, C.B.; Strahler, A.H. Global Clumping Index Map Derived from the MODIS BRDF Product. Remote Sens. Environ. 2012, 119, 118–130. [Google Scholar] [CrossRef]
  25. Chen, J.M.; Black, T.A. Defining Leaf Area Index for Non-Flat Leaves. Plant Cell Environ. 1992, 15, 421–429. [Google Scholar] [CrossRef]
  26. Chen, J.M.; Mo, G.; Pisek, J.; Liu, J.; Deng, F.; Ishizawa, M.; Chan, D. Effects of Foliage Clumping on the Estimation of Global Terrestrial Gross Primary Productivity. Glob. Biogeochem. Cycles 2012, 26, 1019. [Google Scholar] [CrossRef]
  27. Lacaze, R.; Chen, J.M.; Roujean, J.-L.; Leblanc, S.G. Retrieval of Vegetation Clumping Index Using Hot Spot Signatures Measured by POLDER Instrument. Remote Sens. Environ. 2002, 79, 84–95. [Google Scholar] [CrossRef]
  28. Zhang, Z.; Zhang, Y.; Porcar-Castell, A.; Joiner, J.; Guanter, L.; Yang, X.; Migliavacca, M.; Ju, W.; Sun, Z.; Chen, S.; et al. Reduction of Structural Impacts and Distinction of Photosynthetic Pathways in a Global Estimation of GPP from Space-Borne Solar-Induced Chlorophyll Fluorescence. Remote Sens. Environ. 2020, 240, 111722. [Google Scholar] [CrossRef]
  29. Pastorello, G.; Trotta, C.; Canfora, E.; Chu, H.; Christianson, D.; Cheah, Y.W.; Poindexter, C.; Chen, J.; Elbashandy, A.; Humphrey, M.; et al. The FLUXNET2015 Dataset and the ONEFlux Processing Pipeline for Eddy Covariance Data. Sci. Data 2020, 7, 225. [Google Scholar] [CrossRef]
  30. Fang, H. Canopy Clumping Index (CI): A Review of Methods, Characteristics, and Applications. Agric. For. Meteorol. 2021, 303, 108374. [Google Scholar] [CrossRef]
  31. Chen, J.M.; Menges, C.H.; Leblanc, S.G. Global Mapping of Foliage Clumping Index Using Multi-Angular Satellite Data. Remote Sens. Environ. 2005, 97, 447–457. [Google Scholar] [CrossRef]
  32. Wei, S.; Fang, H. Estimation of Canopy Clumping Index from MISR and MODIS Sensors Using the Normalized Difference Hotspot and Darkspot (NDHD) Method: The Influence of BRDF Models and Solar Zenith Angle. Remote Sens. Environ. 2016, 187, 476–491. [Google Scholar] [CrossRef]
  33. Fang, H.; Wei, S. Global Vegetation Clumping Index Products (8-Days,500 m) (LIS-CI-A1) from 2001–2016; PANGAEA Data Publisher for Earth & Environmental Science: Bremen/Bremerhaven, Germany, 2018. [Google Scholar] [CrossRef]
  34. R Core Team. R: A Language and Environment for Statistical Computing. R Found. Stat. Comput. 2015, 1, 1651. [Google Scholar]
  35. Boyce, M.S.; Vernier, P.R.; Nielsen, S.E.; Schmiegelow, F.K.A. Evaluating Resource Selection Functions. Ecol. Modell. 2002, 157, 281–300. [Google Scholar] [CrossRef]
  36. Kuhn, M. Building Predictive Models in R Using the Caret Package. J. Stat. Softw. 2008, 28, 1–26. [Google Scholar] [CrossRef]
  37. Paruelo, J.M.; Epstein, H.E.; Lauenroth, W.K.; Burke, I.C. ANPP Estimates from NDVI for the Central Grassland Region of the United States. Ecology 1997, 78, 953–958. [Google Scholar] [CrossRef]
  38. Knapp, A.K.; Briggs, J.M.; Koelliker, J.K. Frequency and Extent of Water Limitation to Primary Production in a Mesic Temperate Grassland. Ecosystems 2001, 4, 19–28. [Google Scholar] [CrossRef]
  39. Sala, O.E.; Parton, W.J.; Joyce, L.A.; Lauenroth, W.K. Primary Production of the Central Grassland Region of the United States. Ecology 1988, 69, 40–45. [Google Scholar] [CrossRef]
  40. Sellers, P.J.; Berry, J.A.; Collatz, G.J.; Field, C.B.; Hall, E.G. Canopy Reflectance, Photosynthesis, and Transpiration. III. A Reanalysis Using Improved Leaf Models and a New Canopy Integration Scheme. Remote Sens. Environ. 1992, 42, 187–216. [Google Scholar] [CrossRef]
  41. Liu, X.; Liu, L. Influence of the Canopy BRDF Characteristics and Illumination Conditions on the Retrieval of Solar-Induced Chlorophyll Fluorescence. Int. J. Remote Sens. 2018, 39, 1782–1799. [Google Scholar] [CrossRef]
  42. Romero, J.M.; Cordon, G.B.; Lagorio, M.G. Re-Absorption and Scattering of Chlorophyll Fluorescence in Canopies: A Revised Approach. Remote Sens. Environ. 2020, 246, 111860. [Google Scholar] [CrossRef]
  43. Churkina, G.; Running, S.W. Contrasting Climatic Controls on the Estimated Productivity of Global Terrestrial Biomes. Ecosystems 1998, 1, 206–215. [Google Scholar] [CrossRef]
  44. Chapin, F.S.; Matson, P.A.; Vitousek, P.M. Principles of Terrestrial Ecosystem Ecology; Springer: Berlin/Heidelberg, Germany, 2002. [Google Scholar]
  45. Asner, G.P.; Scurlock, J.M.O.; Hicke, J.A. Global Synthesis of Leaf Area Index Observations. Glob. Chang. Biol. 2003, 12, 191–205. [Google Scholar] [CrossRef]
  46. Liu, Z.; Jin, G.; Qi, Y. Estimate of Leaf Area Index in an Old-Growth Mixed Broadleaved-Korean Pine Forest in Northeastern China. PLoS ONE 2012, 7, e32155. [Google Scholar] [CrossRef]
  47. Behera, S.K.; Srivastava, P.; Pathre, U.V.; Tuli, R. An Indirect Method of Estimating Leaf Area Index in Jatropha Curcas L. Using LAI-2000 Plant Canopy Analyzer. Agric. For. Meteorol. 2010, 150, 307–311. [Google Scholar] [CrossRef]
  48. Sonnentag, O.; Chen, J.M.; Roberts, D.A.; Talbot, J.; Halligan, K.Q.; Govind, A. Mapping Tree and Shrub Leaf Area Indices in an Ombrotrophic Peatland through Multiple Endmember Spectral Unmixing. Remote Sens. Environ. 2007, 109, 342–360. [Google Scholar] [CrossRef]
  49. Sprintsin, M.; Karnieli, A.; Berliner, P.; Rotenberg, E.; Yakir, D.; Cohen, S. The Effect of Spatial Resolution on the Accuracy of Leaf Area Index Estimation for a Forest Planted in the Desert Transition Zone. Remote Sens. Environ. 2007, 109, 416–428. [Google Scholar] [CrossRef]
  50. Chen, J.M.; Leblanc, S.G. Four-Scale Bidirectional Reflectance Model Based on Canopy Architecture. IEEE Trans. Geosci. Remote Sens. 1997, 35, 1316–1337. [Google Scholar] [CrossRef]
  51. Graham, E.A.; Mulkey, S.S.; Kitajima, K.; Phillips, N.G.; Wright, S.J. Cloud Cover Limits Net CO2 Uptake and Growth of a Rainforest Tree during Tropical Rainy Seasons. Proc. Natl. Acad. Sci. USA 2003, 100, 572–576. [Google Scholar] [CrossRef]
  52. Fan, S.-M.; Wofsy, S.C.; Bakwin, P.S.; Jacob, D.J.; Fitzjarrald, D.R. Atmosphere-Biosphere Exchange of CO2 and O3 in the Central Amazon Forest. J. Geophys. Res. 1990, 95, 16851–16864. [Google Scholar] [CrossRef]
  53. Field, C.B.; Behrenfeld, M.J.; Randerson, J.T.; Falkowski, P. Primary Production of the Biosphere: Integrating Terrestrial and Oceanic Components. Science 1998, 281, 237–240. [Google Scholar] [CrossRef]
  54. Niu, S.; Luo, Y.; Fei, S.; Montagnani, L.; Bohrer, G.; Janssens, I.A.; Gielen, B.; Rambal, S.; Moors, E.; Matteucci, G. Seasonal Hysteresis of Net Ecosystem Exchange in Response to Temperature Change: Patterns and Causes. Glob. Chang. Biol. 2011, 17, 3102–3114. [Google Scholar] [CrossRef]
Figure 1. Sites used in this study.
Remotesensing 15 02207 g001
Figure 2. Relationship between the measured GPP and the GPP estimated from (i) NIRv, (ii) NIRv + PPFD and (iii) NIRv + PPFD + CI, for the whole dataset. CI used in the model was the CI per vegetation cover type from He et al. [24]. Data correspond to daily mean data from 26 sites from 2000 to 2014. The red line corresponds to the linear regression and the black line to the 1:1 line. Different colours identify the vegetation cover types.
Remotesensing 15 02207 g002
Figure 3. Relationship between the clumping index and the variation in R2 (∆R2) and RMSE (∆RMSE) between the ground-measured GPP and the satellite-estimated GPP after adding PPFD information to the NIRv model (GPPnirppfd vs. GPPnirv) in black for the different studied sites (Table 1) (CI calculated as the average annual value per site from the CI product LIS-CI-A1), and in red for the different vegetation cover types (CI for vegetation cover type as in He et al. [24]): evergreen needleleaf forest (ENF), evergreen broadleaf forest (EBF), deciduous broadleaf forest (DBF), mixed forest (MF), open shrubland (OSH), grassland (GRA), woody savanna (WSA) and wetland (WET).
Remotesensing 15 02207 g003
Figure 4. Variation in absolute bias between the ground-measured GPP and the satellite-estimated GPP after adding biome CI information to the NIR and PPFD model (GPPnirppfdci vs. GPPnirppfd) for the different vegetation cover types.
Remotesensing 15 02207 g004
Table 1. Coordinates, vegetation cover type and time period of data used in the studied sites. OSH (open shrubland), ENF (evergreen needleleaf forest), MF (mixed forest), WET (wetland), DBF (deciduous broadleaf forest), EBF (evergreen broadleaf forest), GRA (grassland) and WSA (woody savanna).
Site IDLatitude (°)Longitude (°)Vegetation Cover TypeTime Period
CA-NS655.9−99.0OSH2001–2005
CA-SF254.3−105.9ENF2001–2005
CA-SF354.1−106.0OSH2001–2006
CH-Lae47.58.4MF2004–2014
CZ-BK149.518.5ENF2004–2014
DE-Obe50.813.7ENF2009–2014
DE-Spw51.914.0WET2010–2014
DE-Tha51.013.6ENF2000–2014
FI-Hyy61.824.3ENF2000–2014
FR-Fon48.52.8DBF2005–2014
FR-LBr44.7−0.8ENF2000–2008
FR-Pue43.73.6EBF2000–2014
IT-Cpz41.712.4EBF2000–2008
IT-Ro142.411.9DBF2000–2008
IT-SRo43.710.3ENF2000–2012
JP-MBF44.4142.3DBF2004–2005
JP-SMF35.3137.1MF2005–2006
NL-Loo52.25.7ENF2005–2014
RU-Fyo56.532.9ENF2000–2014
US-Ha142.5−72.2DBF2007–2009
US-Me644.3−121.6ENF2000–2012
US-MMS39.3−86.4DBF2011–2014
US-SRG31.8−110.8GRA2000–2014
US-SRM31.8−110.9WSA2008–2014
US-UMB45.6−84.7DBF2004–2014
US-UMd45.6−84.7DBF2000–2014
Disclaimer/Publisher’s Note: The statements, opinions and data contained in all publications are solely those of the individual author(s) and contributor(s) and not of MDPI and/or the editor(s). MDPI and/or the editor(s) disclaim responsibility for any injury to people or property resulting from any ideas, methods, instructions or products referred to in the content.

