Article

An Earth Observation Task Representation Model Supporting Dynamic Demand for Flood Disaster Monitoring and Management

1
National Engineering Research Center of Geographic Information System, China University of Geosciences (Wuhan), Wuhan 430074, China
2
School of Geography and Information Engineering, China University of Geosciences (Wuhan), Wuhan 430074, China
3
School of Remote Sensing and Information Engineering, Wuhan University, Wuhan 430079, China
4
Hubei Luojia Laboratory, Wuhan 430079, China
*
Author to whom correspondence should be addressed.
Remote Sens. 2023, 15(8), 2193; https://doi.org/10.3390/rs15082193
Submission received: 6 March 2023 / Revised: 14 April 2023 / Accepted: 17 April 2023 / Published: 21 April 2023

Abstract

:
A comprehensive, accurate, and timely expression of earth observation (EO) tasks is the primary prerequisite for the response to and the emergency monitoring of disasters, especially floods. However, the existing information model does not fully satisfy the demand for a fine-grain observation expression of EO task, which results in the absence of task process management. The current study proposed an EO task representation model based on meta-object facility to address this problem. The model not only describes the static information of a task, but it also defines the dynamics of an observation task by introducing a functional metamodel. This metamodel describes the full life cycle of a task; it comprises five process methods: birth, separation, combination, updating, and extinction. An earth observation task modeling and management prototype system (EO-TMMS) for conducting a remote sensing satellite sensor observation task representation experiment on flooding was developed. In accordance with the results, the proposed model can describe various EO tasks demands and the full life cycle process of an EO task. Compared with other typical observation task information models, the proposed model satisfies the dynamic and fine-grain process representation of EO tasks, which can improve the efficiency of EO sensor utilization.

1. Introduction

Losses from disasters are increasing worldwide due to the frequent occurrence of extreme weather events, especially floods [1,2,3]; floods can result in high human casualties and severe property damage [4]. Fine-grain disaster information management plays an essential role in mitigating flood disasters [5,6]. Flood disaster management comprises the following components: flood event information management [7], earth observation (EO) task information management [8], and sensor planning information management [9,10,11]. Among the three, EO task information management assists in finely delineating the EO task demands for flood disaster management. An EO task is a set of semantic information that describes observation demands, such as time, space, and observation element constraints. To gain an accurate understanding of flood disaster observation demands and reduce the risks of human and property losses, the semantic information of flood observation tasks must be represented [8,12].
The development of EO technology has contributed to a paradigm shift in disaster management from static to dynamic process monitoring [13]. Flood disaster management is an important task that requires the use of various technologies and resources to improve early warning and response capabilities. GeoSensor is a sensor web prototype developed by Wuhan University since 2013 [14] that uses standardized protocols and interfaces to enable seamless access to sensors and their data for flood monitoring [15]. Copernicus EMS [16], Sentinel Asia [17], and the International Charter Space and Major Disasters [18] offer an effective solution for cross-regional disaster emergency management. Dynamic, fine-grain, and full process characterization observation tasks are crucial for flood disaster management, enabling disaster managers to obtain timely data about disasters and collect information about disaster areas [19,20,21]. The spatiotemporal characteristics of floods are changing constantly, and observation elements vary. The flood evolution cycle has four stages: diagnosis, preparedness, response, and recovery [7,22]. Several flood warning systems, such as the Global Flood Awareness System (GloFAS) [23], Global Flood Monitoring System (GFMS) [24], the European Flood Awareness System (EFAS) [25], and Dartmouth Flood observatory at the University of Colorado [26], provide assistance for flood management. Differences exist in observation elements, resources, scale, and frequency at various stages, such as real-time water level and precipitation monitoring tasks based on in situ stations throughout the entire process of flood disaster management [27]. Some typical near-real-time rainfall information has been provided. Examples include the JAXA Global Rainfall Watch (GSMaP) [28] and ECMWF [29], which provide an effective and long-term source of precipitation data for studying extreme events and flood disasters. Remote sensing satellites are used as the foundation for monitoring large-scale flood ranges during the response phase [30]. In the recovery phase, multiple observation resources are employed to support the multielement disaster damage assessment [31]. Meanwhile, the spatial distribution of the same observation element also differs due to the spatial heterogeneity of floods. That is, EO task information presented at the same stage also varies. For example, evident differences are exhibited by rainfall runoff in various regions [32], and monitoring should focus on short-term heavy rainfall regions because secondary disasters, such as landslides and debris flows, may occur in these regions [33,34]. In such cases, EO task information, such as observation time, space, and elements, should be dynamically updated to achieve fine-grain and full process flood monitoring. In summary, EO task representation must be dynamic and fine-grain to enable disaster managers to accomplish reliable observation planning and obtain accurate full process disaster information.
Disaster information management models have developed rapidly in the past two decades. However, currently available disaster information models do not support the dynamic process representation of EO tasks. Information exchange carriers represent one type of disaster information model; they are used to describe, organize, and manage disaster information. Examples include the Common Alert Protocol [35], the Emergency Data Exchange Language–Distribution Element [36], and the Emergency Data Exchange Language–Resource Messaging [37]. The aforementioned information exchange carriers provide a comprehensive set of message formats to disaster emergency management departments. Meanwhile, examples of specific disaster information modeling carriers include the Tsunami Warning Markup Language [38], Earthquake Markup Language [39], and Flood Markup Language (FloodML) [40]. With different disaster data communication specifications, these carriers supply disaster information descriptions and disseminate early warning information. Nevertheless, these standards do not provide observation information. An event model that describes a disaster is another typical type of disaster information model. Scherp et al. [41] proposed Event Model-F, a formal model of events based on the foundational ontology DOLCE+Dns Ultrlite; it supports the representation of spatial, temporal, person, and event relationships during disasters. An event metamodel that aids knowledge sharing and disaster management was introduced by Othman and Beydoun [15]; however, it disregarded the importance of disaster observation information. In contrast, Chen et al. [42] noted the importance of disaster observation information; they proposed a disaster event metamodel that considers the full cycle evolution of disaster events. This model can offer observation support for disasters and include information on all phases of a disaster; however, it cannot consider the dynamic process expression of an EO task. The aforementioned disaster information models provide different dimensions of disaster management information. Nevertheless, their support for the dynamic demands of EO tasks remains limited at present.
Currently available EO task representation models for disaster information management lack a mechanism for supporting dynamic representation. Nonfunctional metamodels generally help characterize static attribute information related to objects. Meanwhile, functional metamodels are used to describe process operations related to objects. An observation task chain representation model for supporting flood information management through descriptive, structural, and administrative metadata in a nonfunctional metamodel was proposed by Yang et al. [8]. This model was used to express EO task information, such as observation task name, task classification, sensor name, and user. However, it does not support the description of EO task dynamic information during spatial and temporal changes. Some studies have suggested using functional metamodels to characterize dynamic processes primarily through the process operations of associated objects and data via process models in functional metamodels [43]. Accordingly, the features of a functional metamodel contribute to the dynamic representation for solving disaster observation tasks. In addition, a task ontology model [44] that includes task types, priorities, constraints, models, and processes provides us with a valuable reference, although it was originally designed to deal with geographic data rather than setting the observation task as a starting point.
In summary, existing EO task representation models do not describe the dynamics of the observed tasks. Consequently, representing the dynamic demands of EO tasks and portraying the disaster event process are difficult. This condition will hinder the accurate planning of EO tasks by sensor planners and the acquisition of disaster information by emergency management departments. Therefore, an earth observation task representation model (EObTask) must not only describe the nonfunctional metamodel but also the functional one.
This study aims to propose an EObTask representation model composed of functional and nonfunctional modules that can represent the dynamic and fine-grain observation demand of EO tasks with a full life cycle. A functional metamodel has five task dynamic description processes: birth, separation, combination, updating, and extinction. Meanwhile, a nonfunctional metamodel comprises four pieces of static information that describe the EO task. The contribution of this paper is to provide an observation task representation model for cross-regional and cross-sector Earth observation cooperation. By eliminating any potential bias that may exist among different agencies involved in the planning process, this model can help to enhance the overall efficiency and effectiveness of Earth observation resource planning.
The remaining sections are organized as follows. The methodology and description framework of the EObTask representation model is introduced in Section 2. Experiments on the EO task representation model during flooding scenarios and their results are provided in Section 3. The discussion of the EO task representation model is presented in Section 4. The conclusions and outlook of the study are summarized in Section 5.

2. Earth Observation Task Representation Model

2.1. Principles and Requirements

The primary purpose of EO task information representation is to achieve a fine-grain, full life cycle task expression for the dynamic demands of monitoring tasks, such that different EO tasks can be described uniformly, enabling sensor planners to plan EO tasks further. In the current study, the proposed EO task representation model considers the following aspects.
  • Comprehensive: The need for a comprehensive fine-grain representation of EO task information. How a sensor planner understands and configures task planning constraints are determined by the description of the EO task.
  • Dynamic: The need for a process description of an EO task. The life cycle of an EO task is described to satisfy the dynamics of flood monitoring and improve the efficiency of EO sensor resource utilization.
  • Formality and extensibility: The need for formality and flexible extensibility. Concise descriptions of EO demands that can be tracked and documented with task information can be provided by models, while allowing extension to satisfy different use purposes.

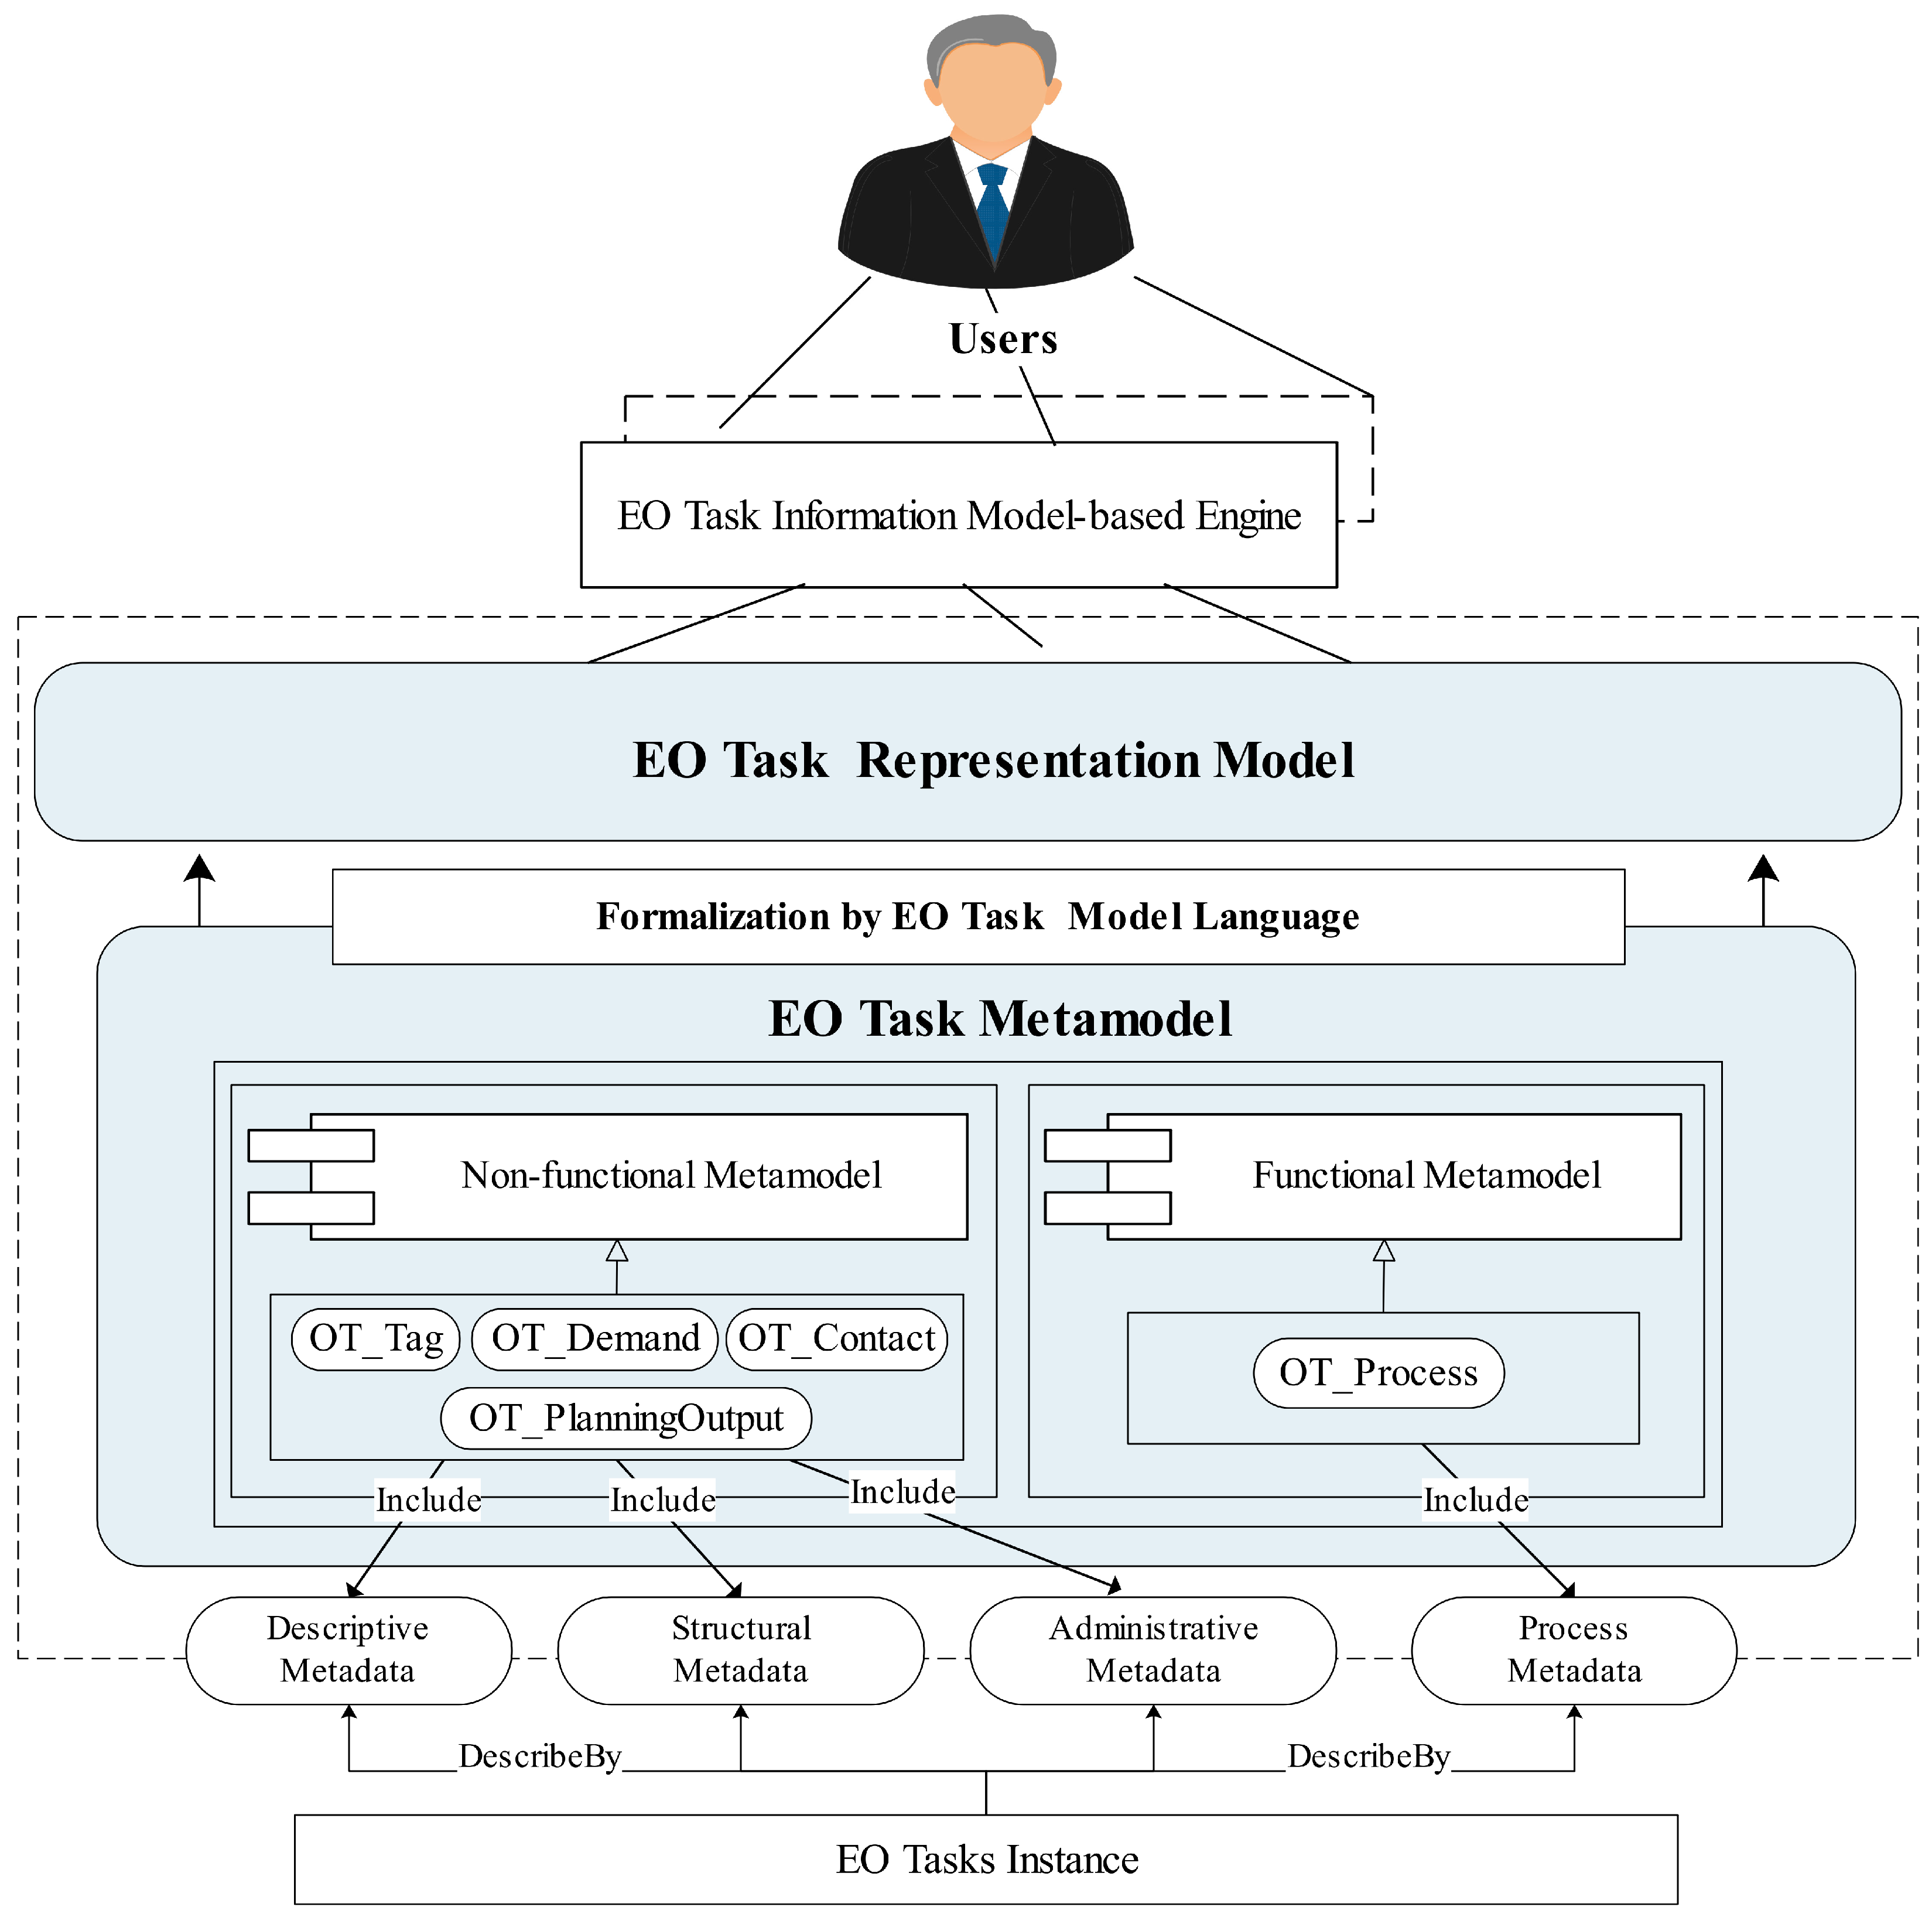
2.2. Information Organization of an Earth Observation Task

EO task information can be described using a variety of metadata (Figure 1), such as descriptive, structural, administrative, and process metadata [43], by considering the aforementioned principles. A metamodel is composed of functional and nonfunctional modules. The description of static attribute information for an EO task is facilitated by the nonfunctional metamodel. The dynamic description of the full life cycle process of an EO task is supported by the functional metamodel. The nonfunctional metamodel has four components: tag, observation task demands, planning solutions, and contact information. The functional metamodel consists of process components. Therefore, an EO task can be expressed as five components as follows:
{OT_Tag, OT_Demand, OT_PlannngOutput, OT_Contact, OT_Process}
OT_Tag: Describes the identification information and description information of an EO task. It aids the planner in querying and understanding the specific information of an EO task.
OT_Demand: Describes observation constraint and object information to assist sensor planners in configuring the demand constraint for an EO task, such as time constraints, space constraints, observation frequency, and observation elements.
OT_PlanningOutput: Documents different potential observation solutions and provides sensor planners with EO sensor planning information.
OT_Contact: Consists of basic information about the user, such that the user can be contacted when the EO task is completed.
OT_Process: Documents the process approach to the EO task. This component is significant for the dynamic needs of EO tasks of flooding.

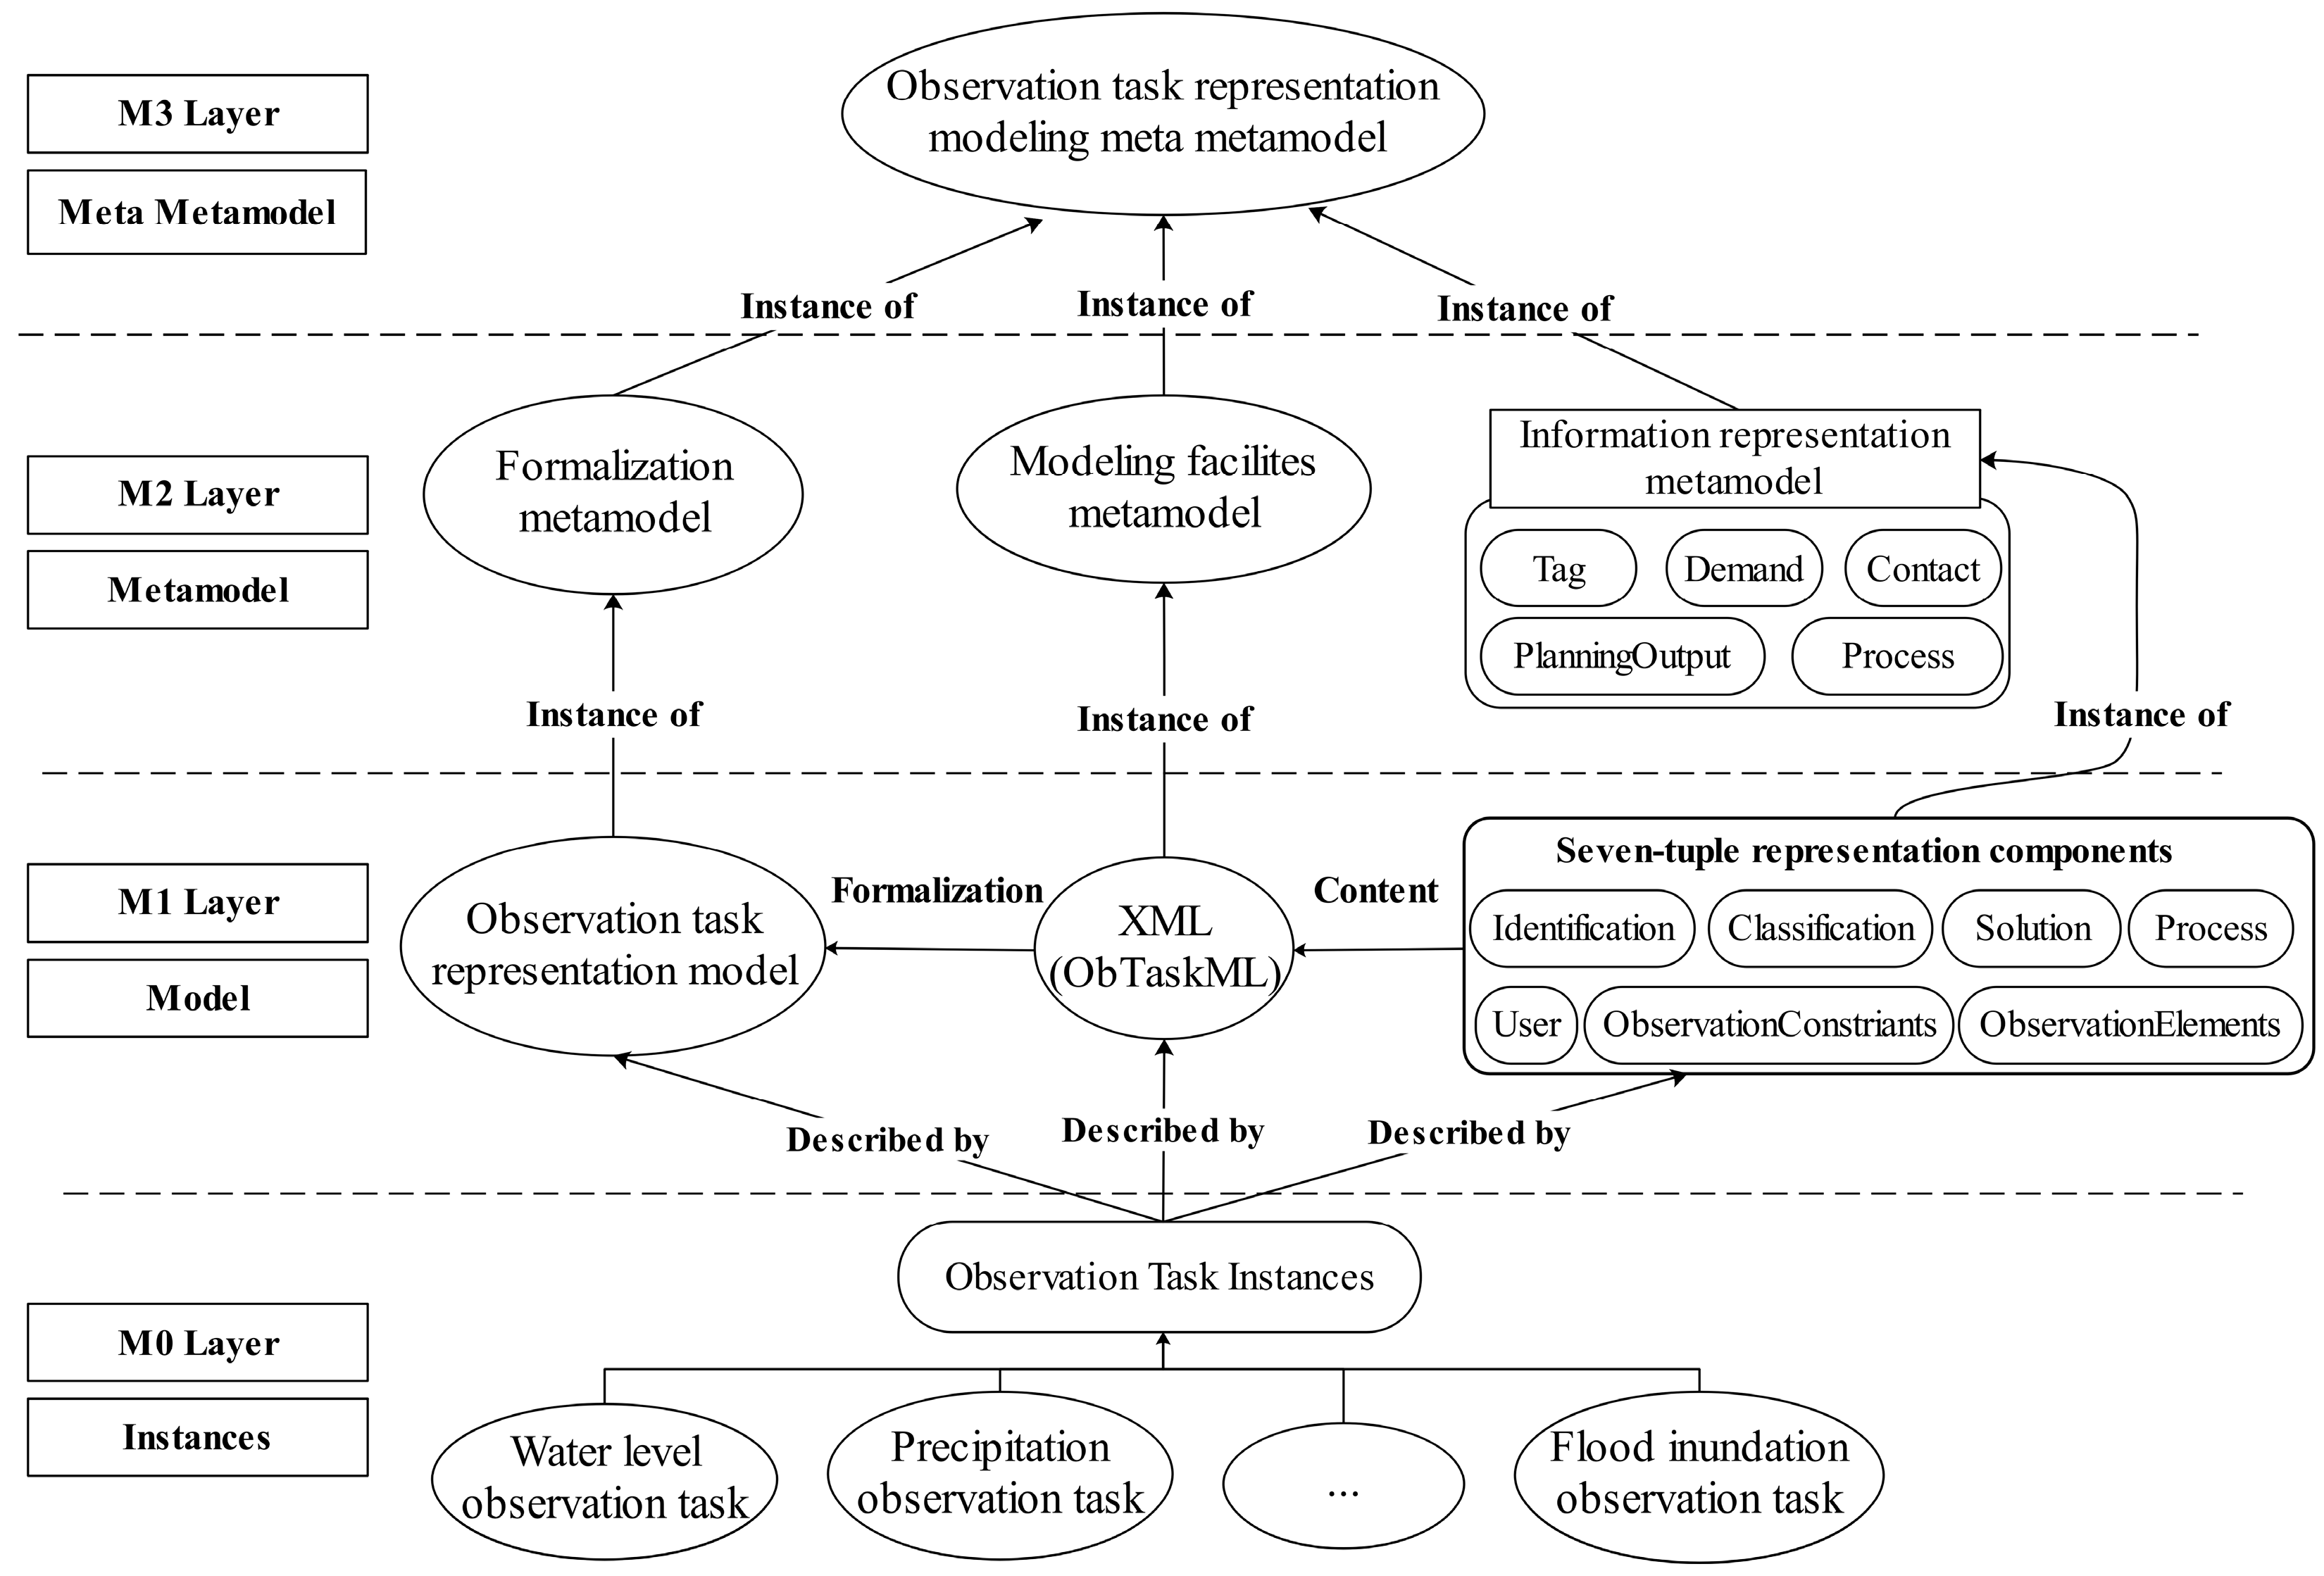
2.3. Metamodeling Architecture of Earth Observation Task Representation

A four-layer hierarchical infrastructure called the meta-object facility (MOF) was proposed by the Object Management Group; it determines metamodel concepts and relationships [45]. One of the features of MOF is describing each level as an instance of the previous level. The M0 layer is generally composed of data instances of the M1 layer. Meanwhile, the metamodel layer is the M2 layer. It is an abstraction of the M1 layer and an instance of the M3 layer.
Figure 2 depicts the EO task representation of the metamodeling architecture. This representation has four levels. The M0 layer comprises EO task instances, such as water level, precipitation, soil moisture, and flood inundation area observation tasks. The M1 layer, which is composed of a model, is an instance of the M2 layer. It includes five EO task demand description components, an EO task model language (EObTaskML) and the observed task representation model. The M2 layer consists of the following metamodels: formulation, modeling facility, and information representation metamodels. These metamodels are the abstract representations of the EO task representation model, EObTaskML, and the task information description components, respectively. Finally, the concepts and relationships of the EO task are defined by the M3 layer. This layer is embodied by the M2 layer.

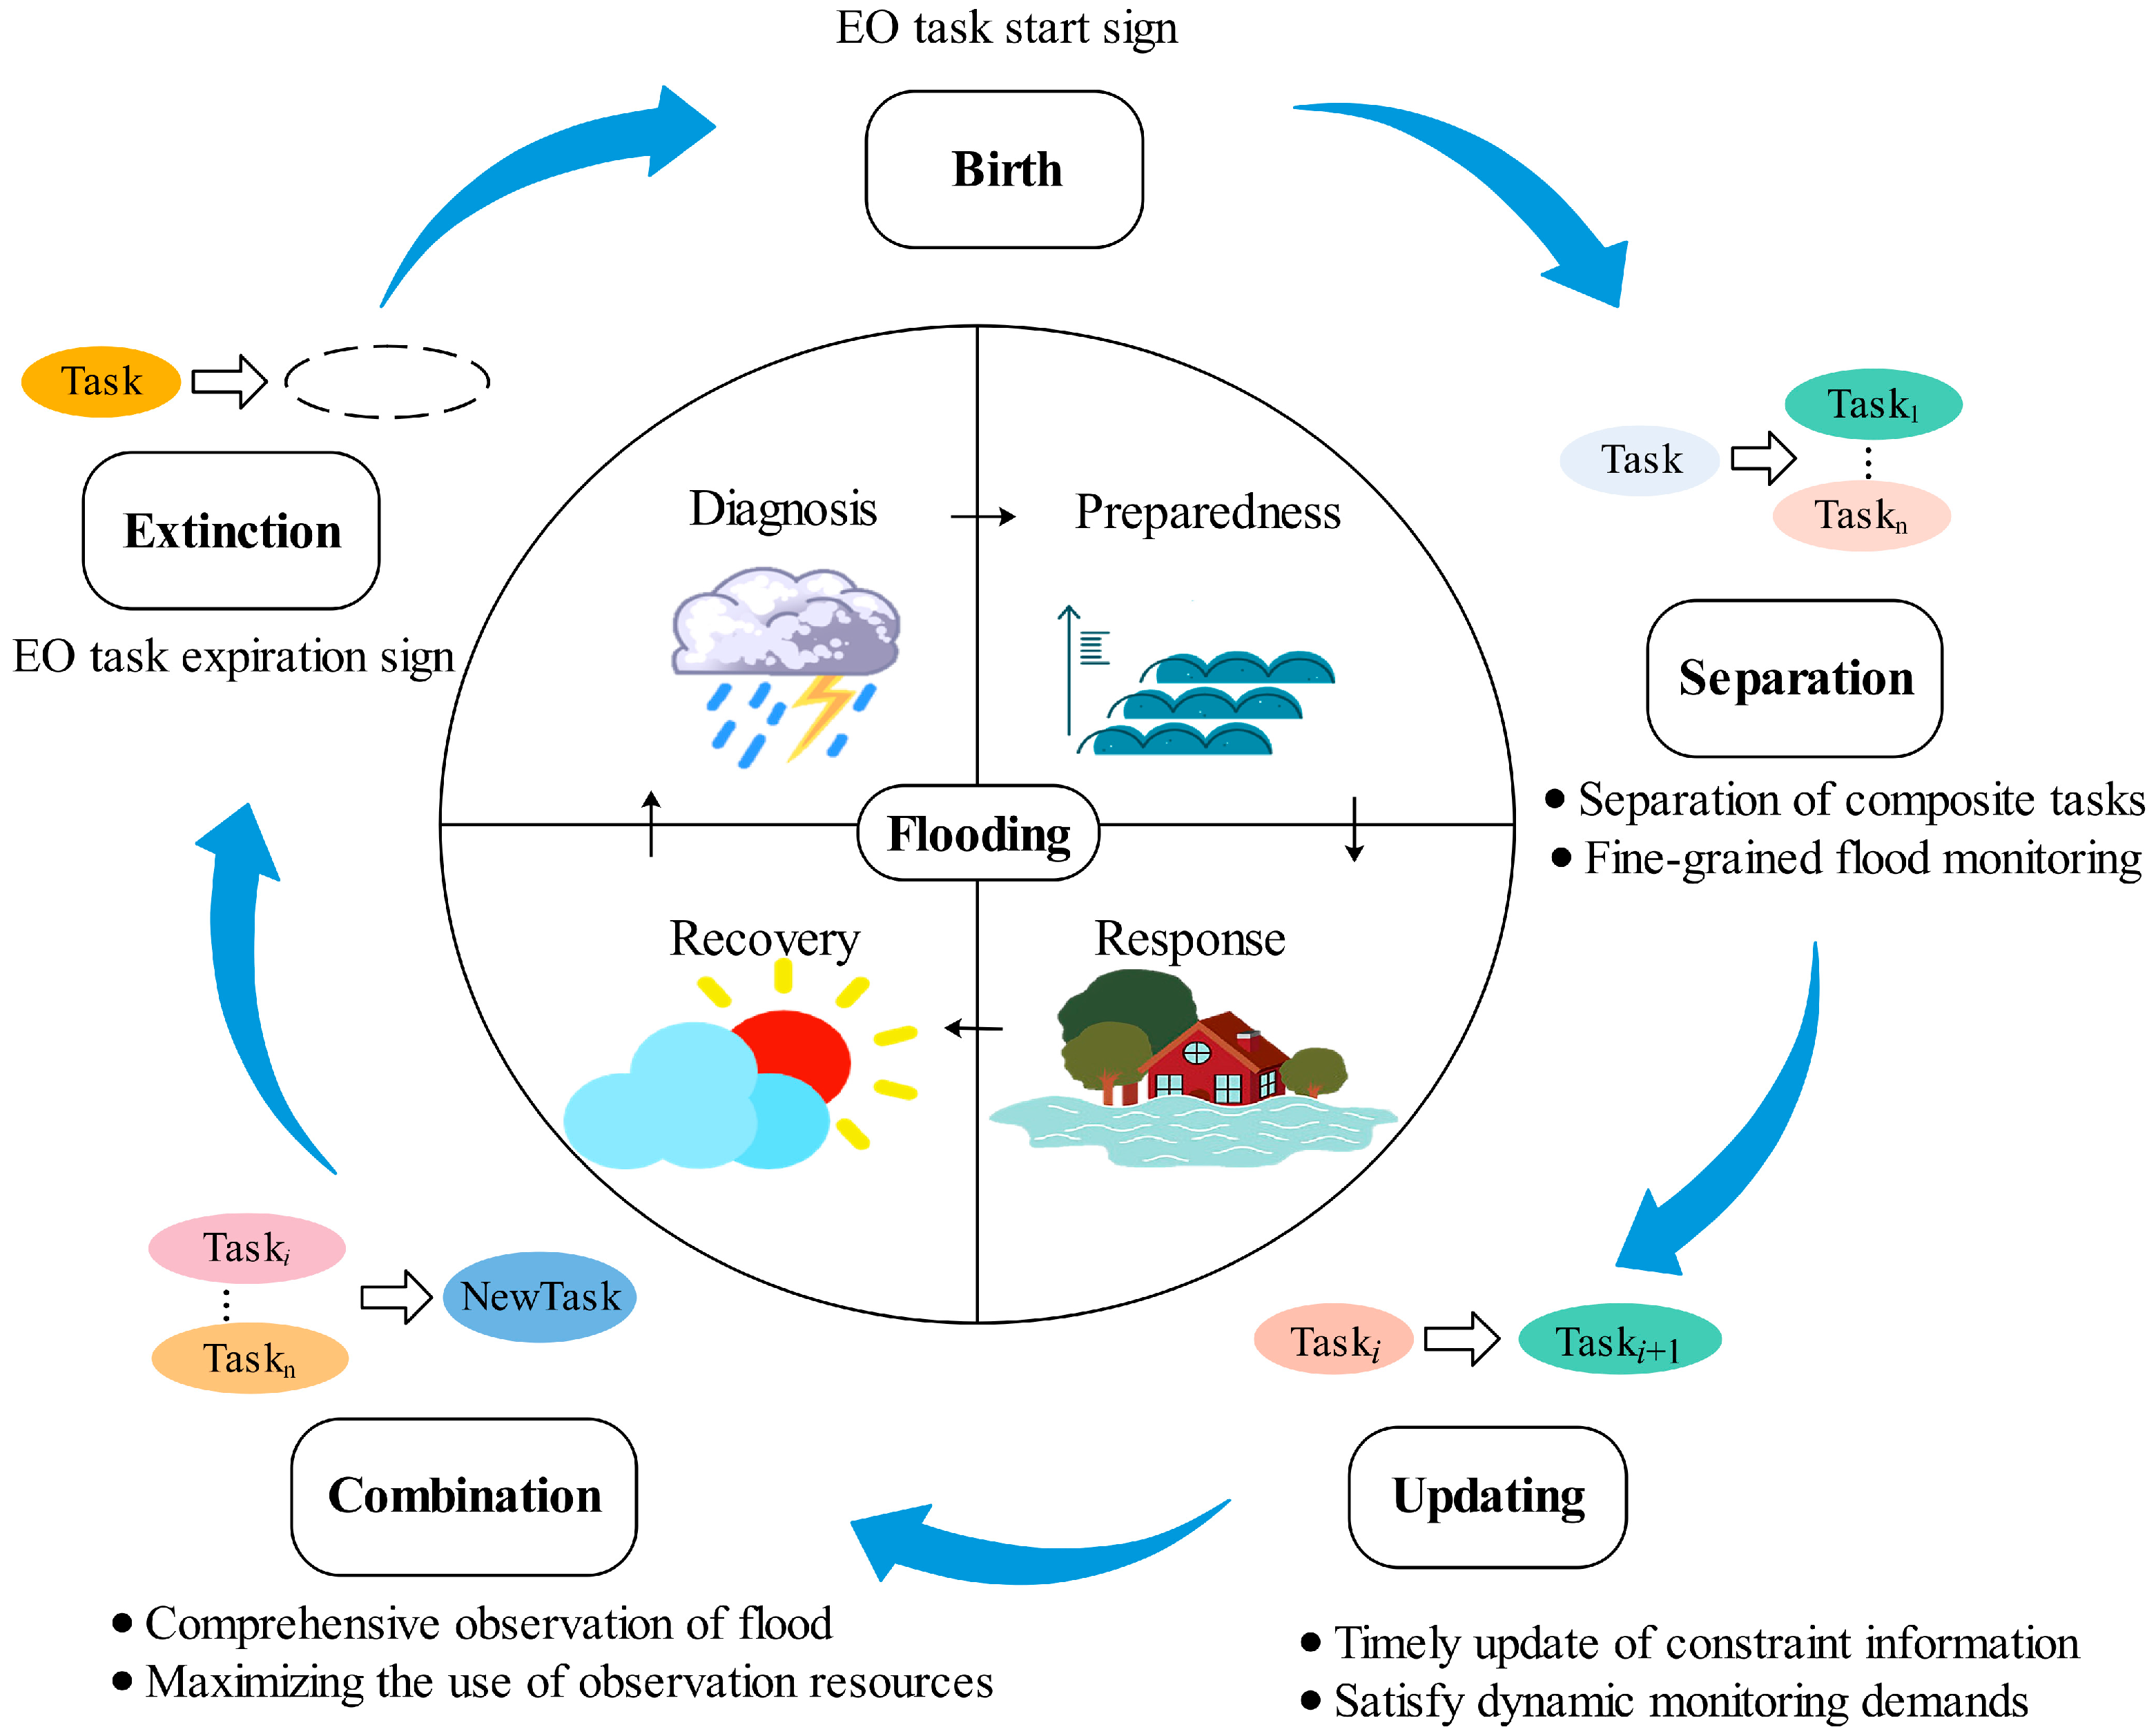
2.4. Dynamics of an Earth Observation Task with Full Life Cycle

The flood evolution process is changing constantly and, thus, information about an EO task, such as observation resource, constraints, and frequency, is also adjusted dynamically, because these key variables depend on the life cycle of an EO task (Figure 3). In the flood evolution process, the full life cycle of an EO task can be described in five processes: birth, separation, combination, updating, and extinction (refer to Appendix A for the pseudocode). The details of these processes are described as follows.
(1) Birth: This process signifies the start of the EO task. Different flood stages have varying monitoring tasks. For example, the diagnosis phase focuses on monitoring water conditions and recognizing the distribution of roads, residential areas, and other facilities. Meanwhile, the preparedness phase predicts the spatiotemporal information of a flood.
(2) Separation: An EO task is typically a composite task, not an atomic task, hence the need to separate composite tasks to achieve fine-grain and comprehensive monitoring.
(3) Combination: Observation resources during emergency scenarios must be considered for maximum observation range and elements with limited EO sensor resources. Therefore, there is a need to combine these EO tasks with the same observation time, space and sensor resources.
(4) Updating: A flood emergency observation task exhibits high observation frequency and rapid changes in observation demand. Thus, it requires the timely updating of spatiotemporal constraints and other information to realize the dynamic adjustment of an EO task demand.
(5) Extinction: An EO task, particularly an aperiodic or a time-series observation task, should be marked once it is completed or has expired to stop it from continuously occupying EO sensor resources.

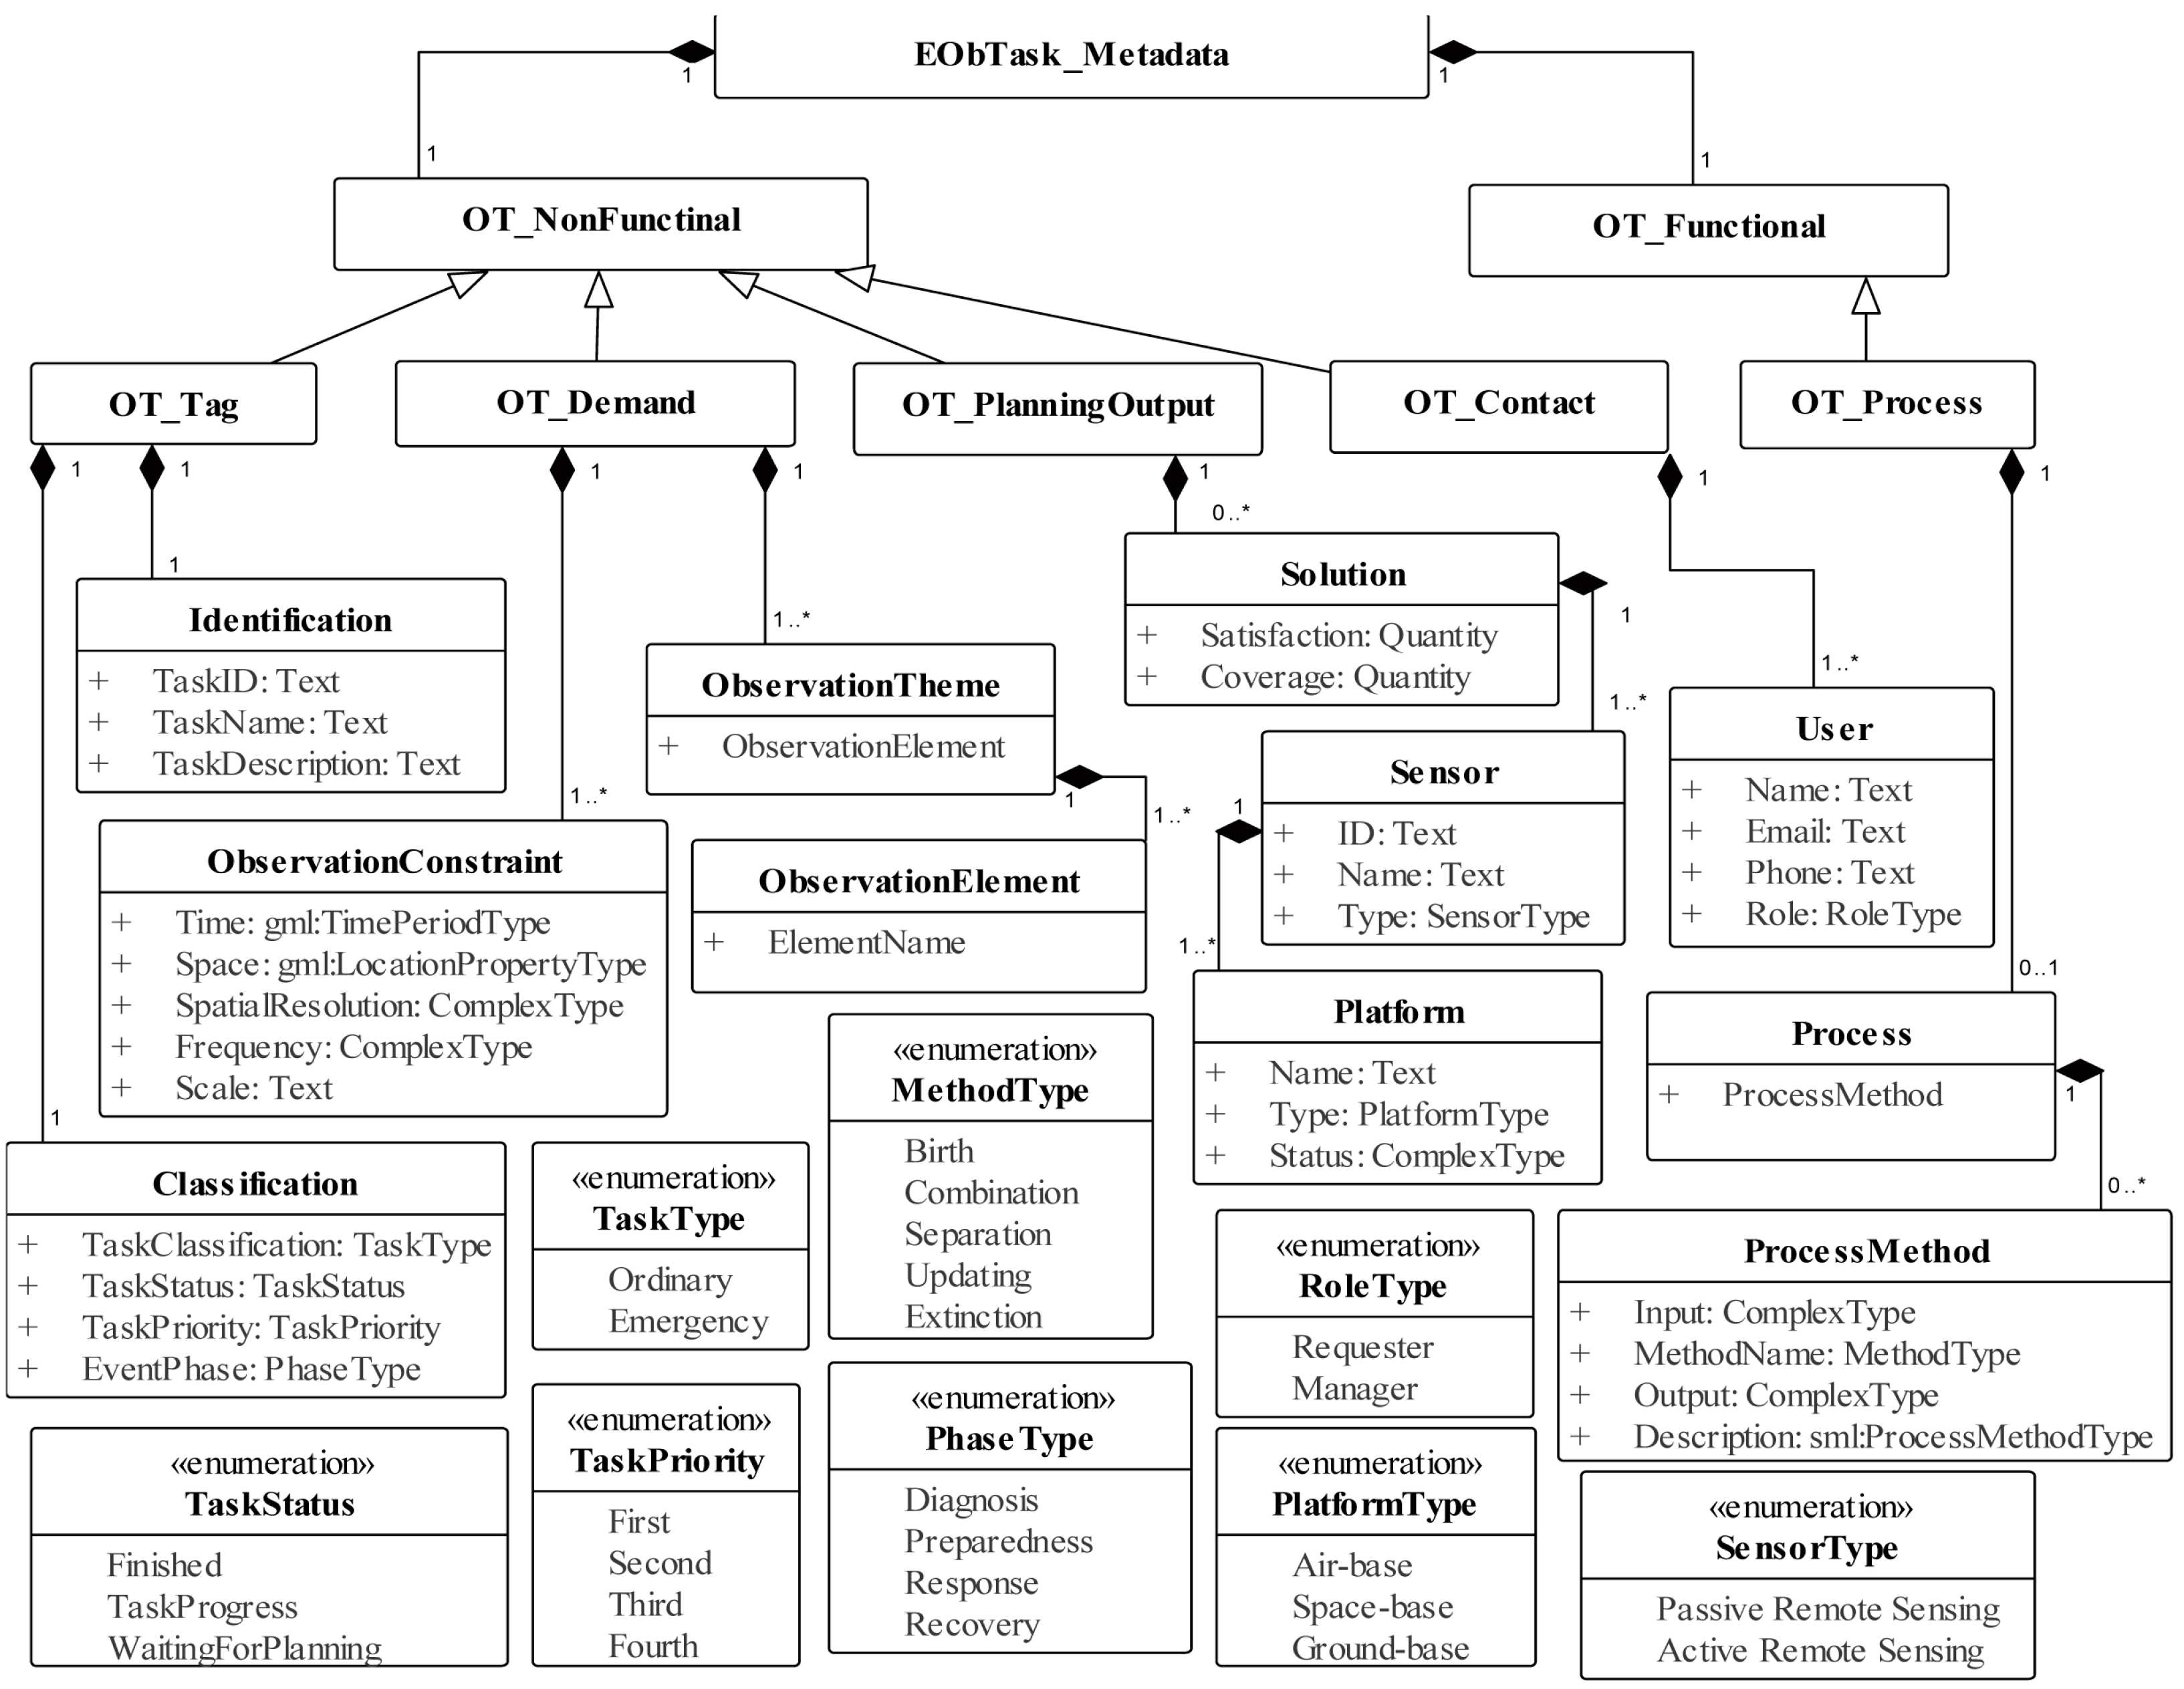
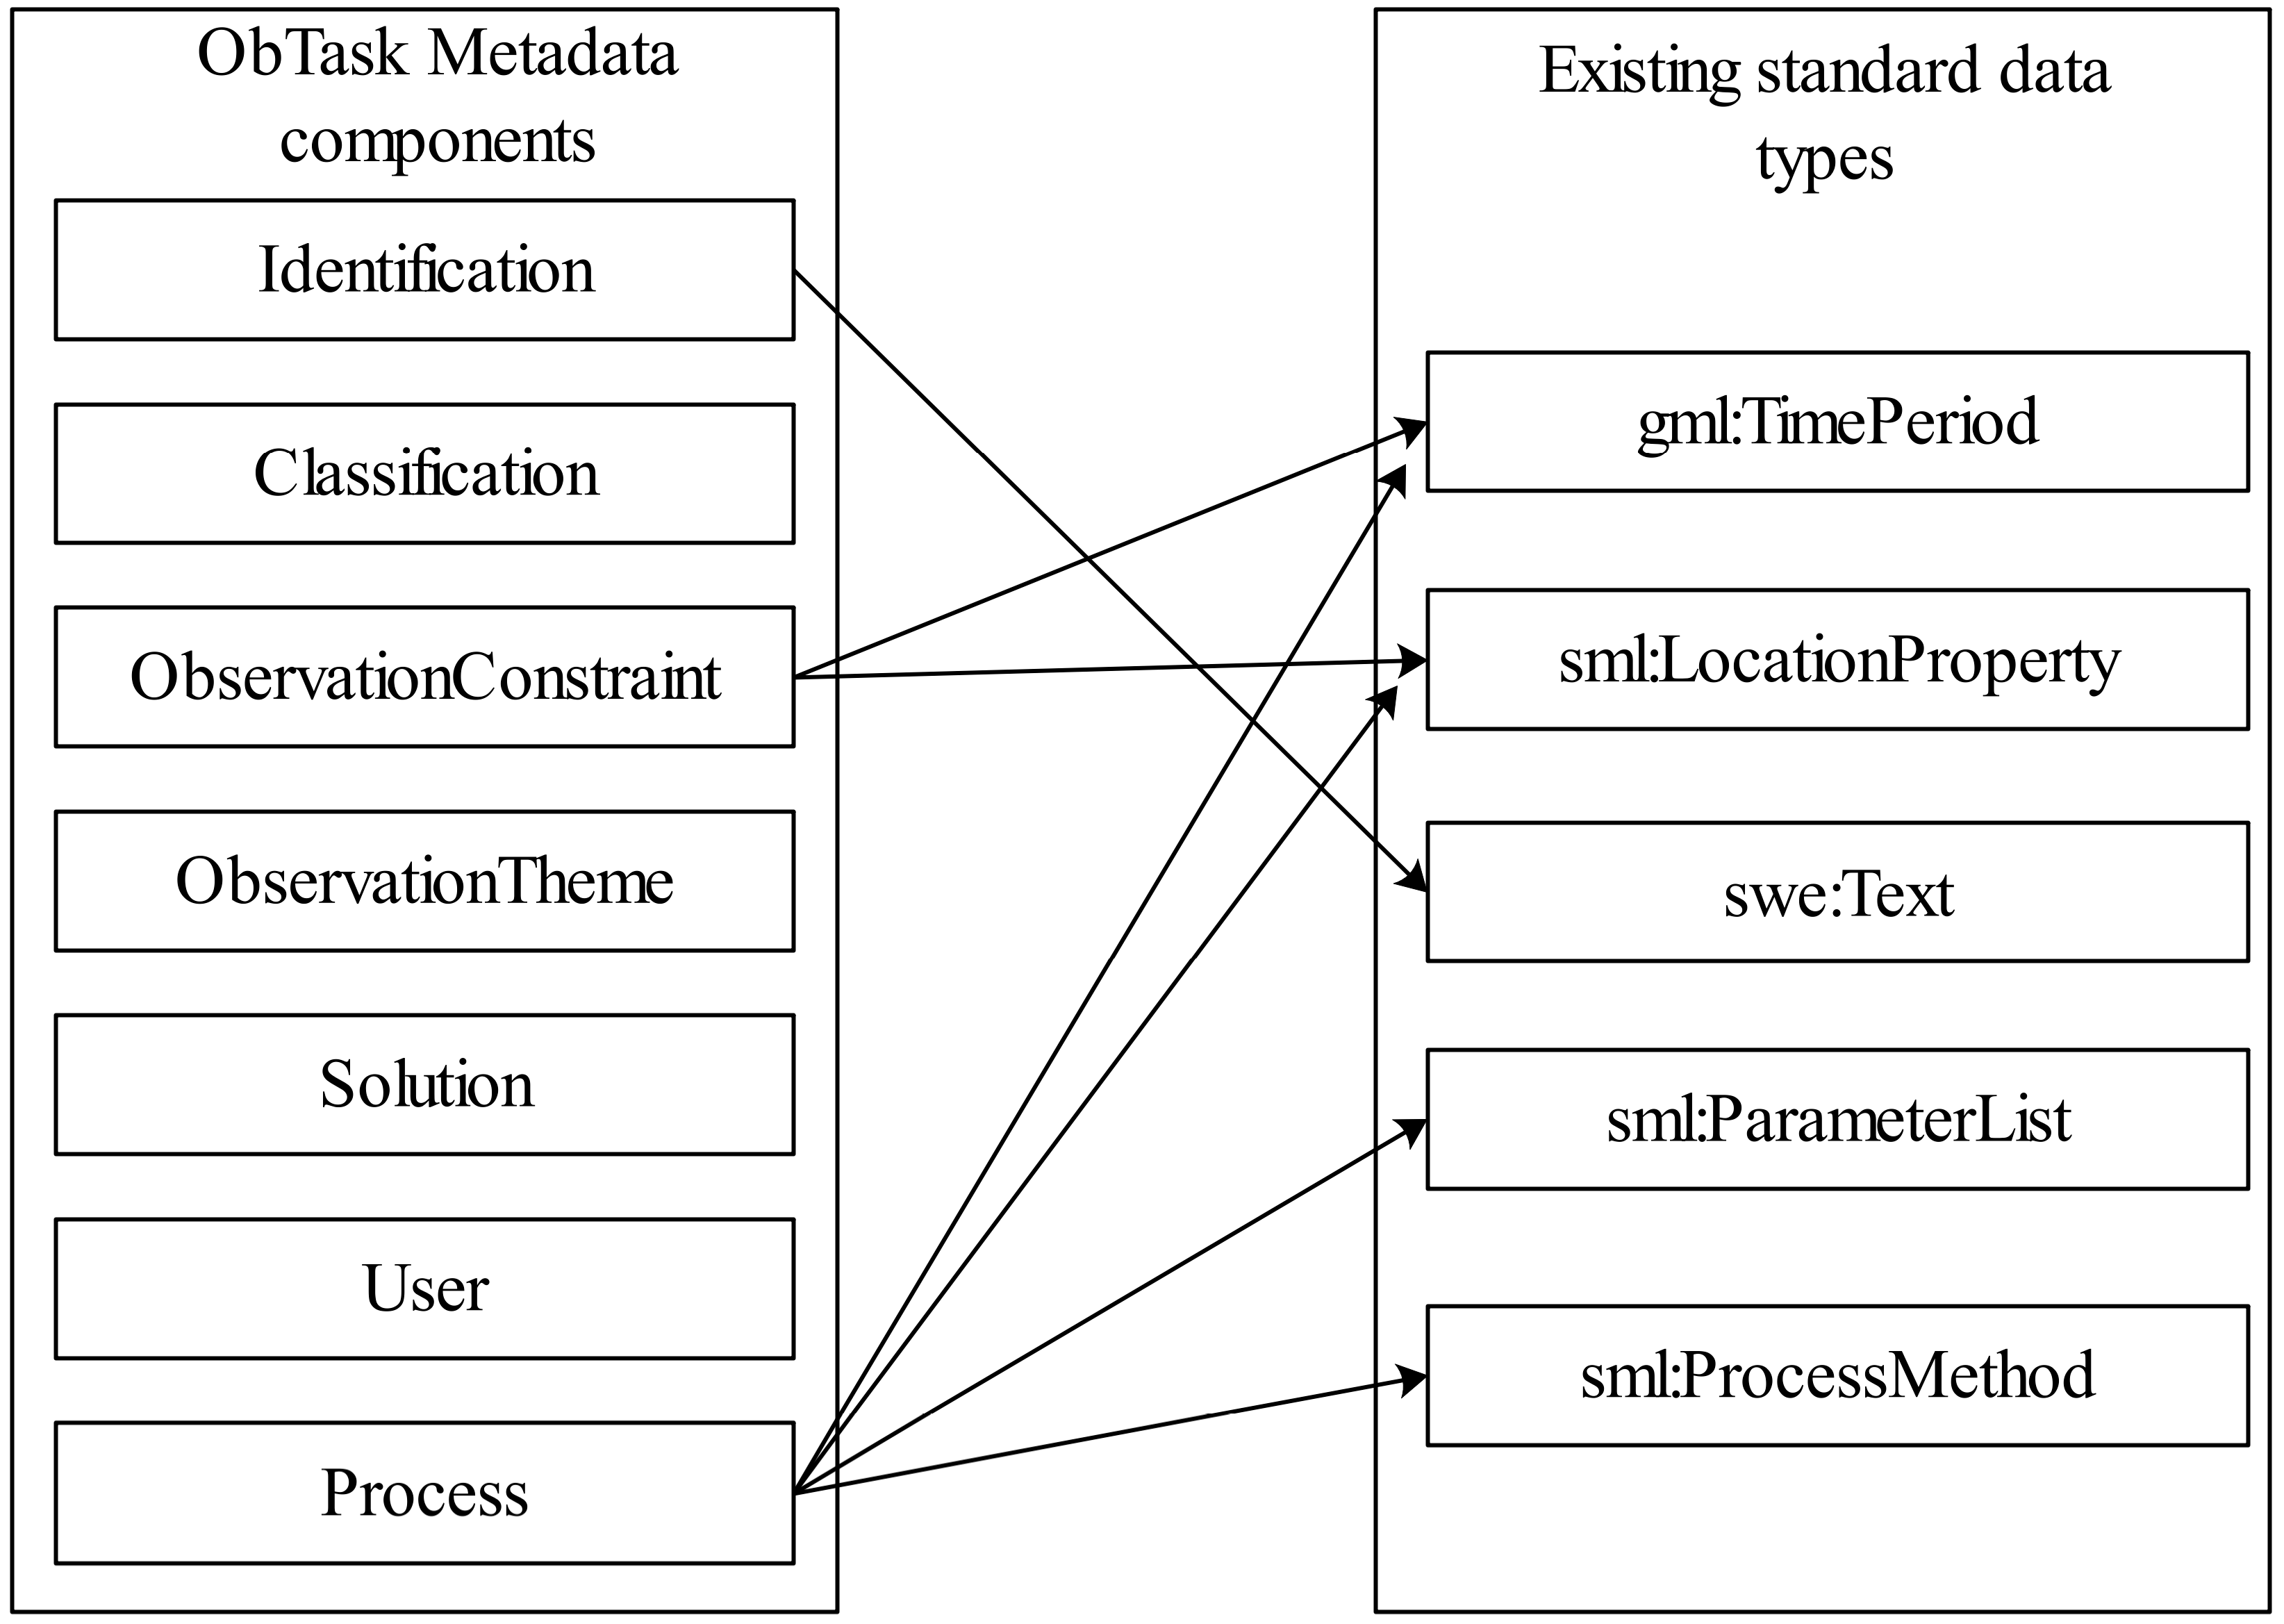
2.5. Contents of Earth Observation Task Representation

Various scholars have proposed different task representation models from different perspectives [8,44]. Considering the requirements and principles of contextual analysis, this paper defines EO task information as consisting of seven-tuple metadata components, as follows:
{ I d e n t i f i c a t i o n , C l a s s i f i c a t i o n , O b s e r v a t i o n C o n s t r a int , O b s e r v a t i o n T h e m e , S o l u t i o n , U s e r , Pr o c e s s }
The seven-tuple metadata components are briefly described below.
(1)
Identification includes the ID, name, and description of an EO task.
(2)
Classification includes task classification, status, priority, and event phase.
(3)
ObservationConstraint includes time, space, spatial resolution, observation frequency, and observation scale.
(4)
ObservationTheme includes information about observation elements.
(5)
Solution includes information about observation resources, such as sensor ID, name, and type.
(6)
User includes the contact information of the user, such his/her name, email address, phone number, and role.
(7)
Process includes the description of process methods, such as their input, name, and output.
Finally, the EO task based on the seven-tuple information description components is defined in the UML diagram shown in Figure 4.

2.6. Formalization of Earth Observation Task Representation Models

To enhance the compatibility and efficiency of EO observation task representation, several existing standards are reused to convert the EO task metamodel (EOTM) into a formal representation. They include the Geographic Markup Language (gml) [46], SensorML (sml) [47], and the SWE common data model (swe) [48]. The corresponding mapping relationships are as follows (Figure 5).

3. System Implementation and Experiment

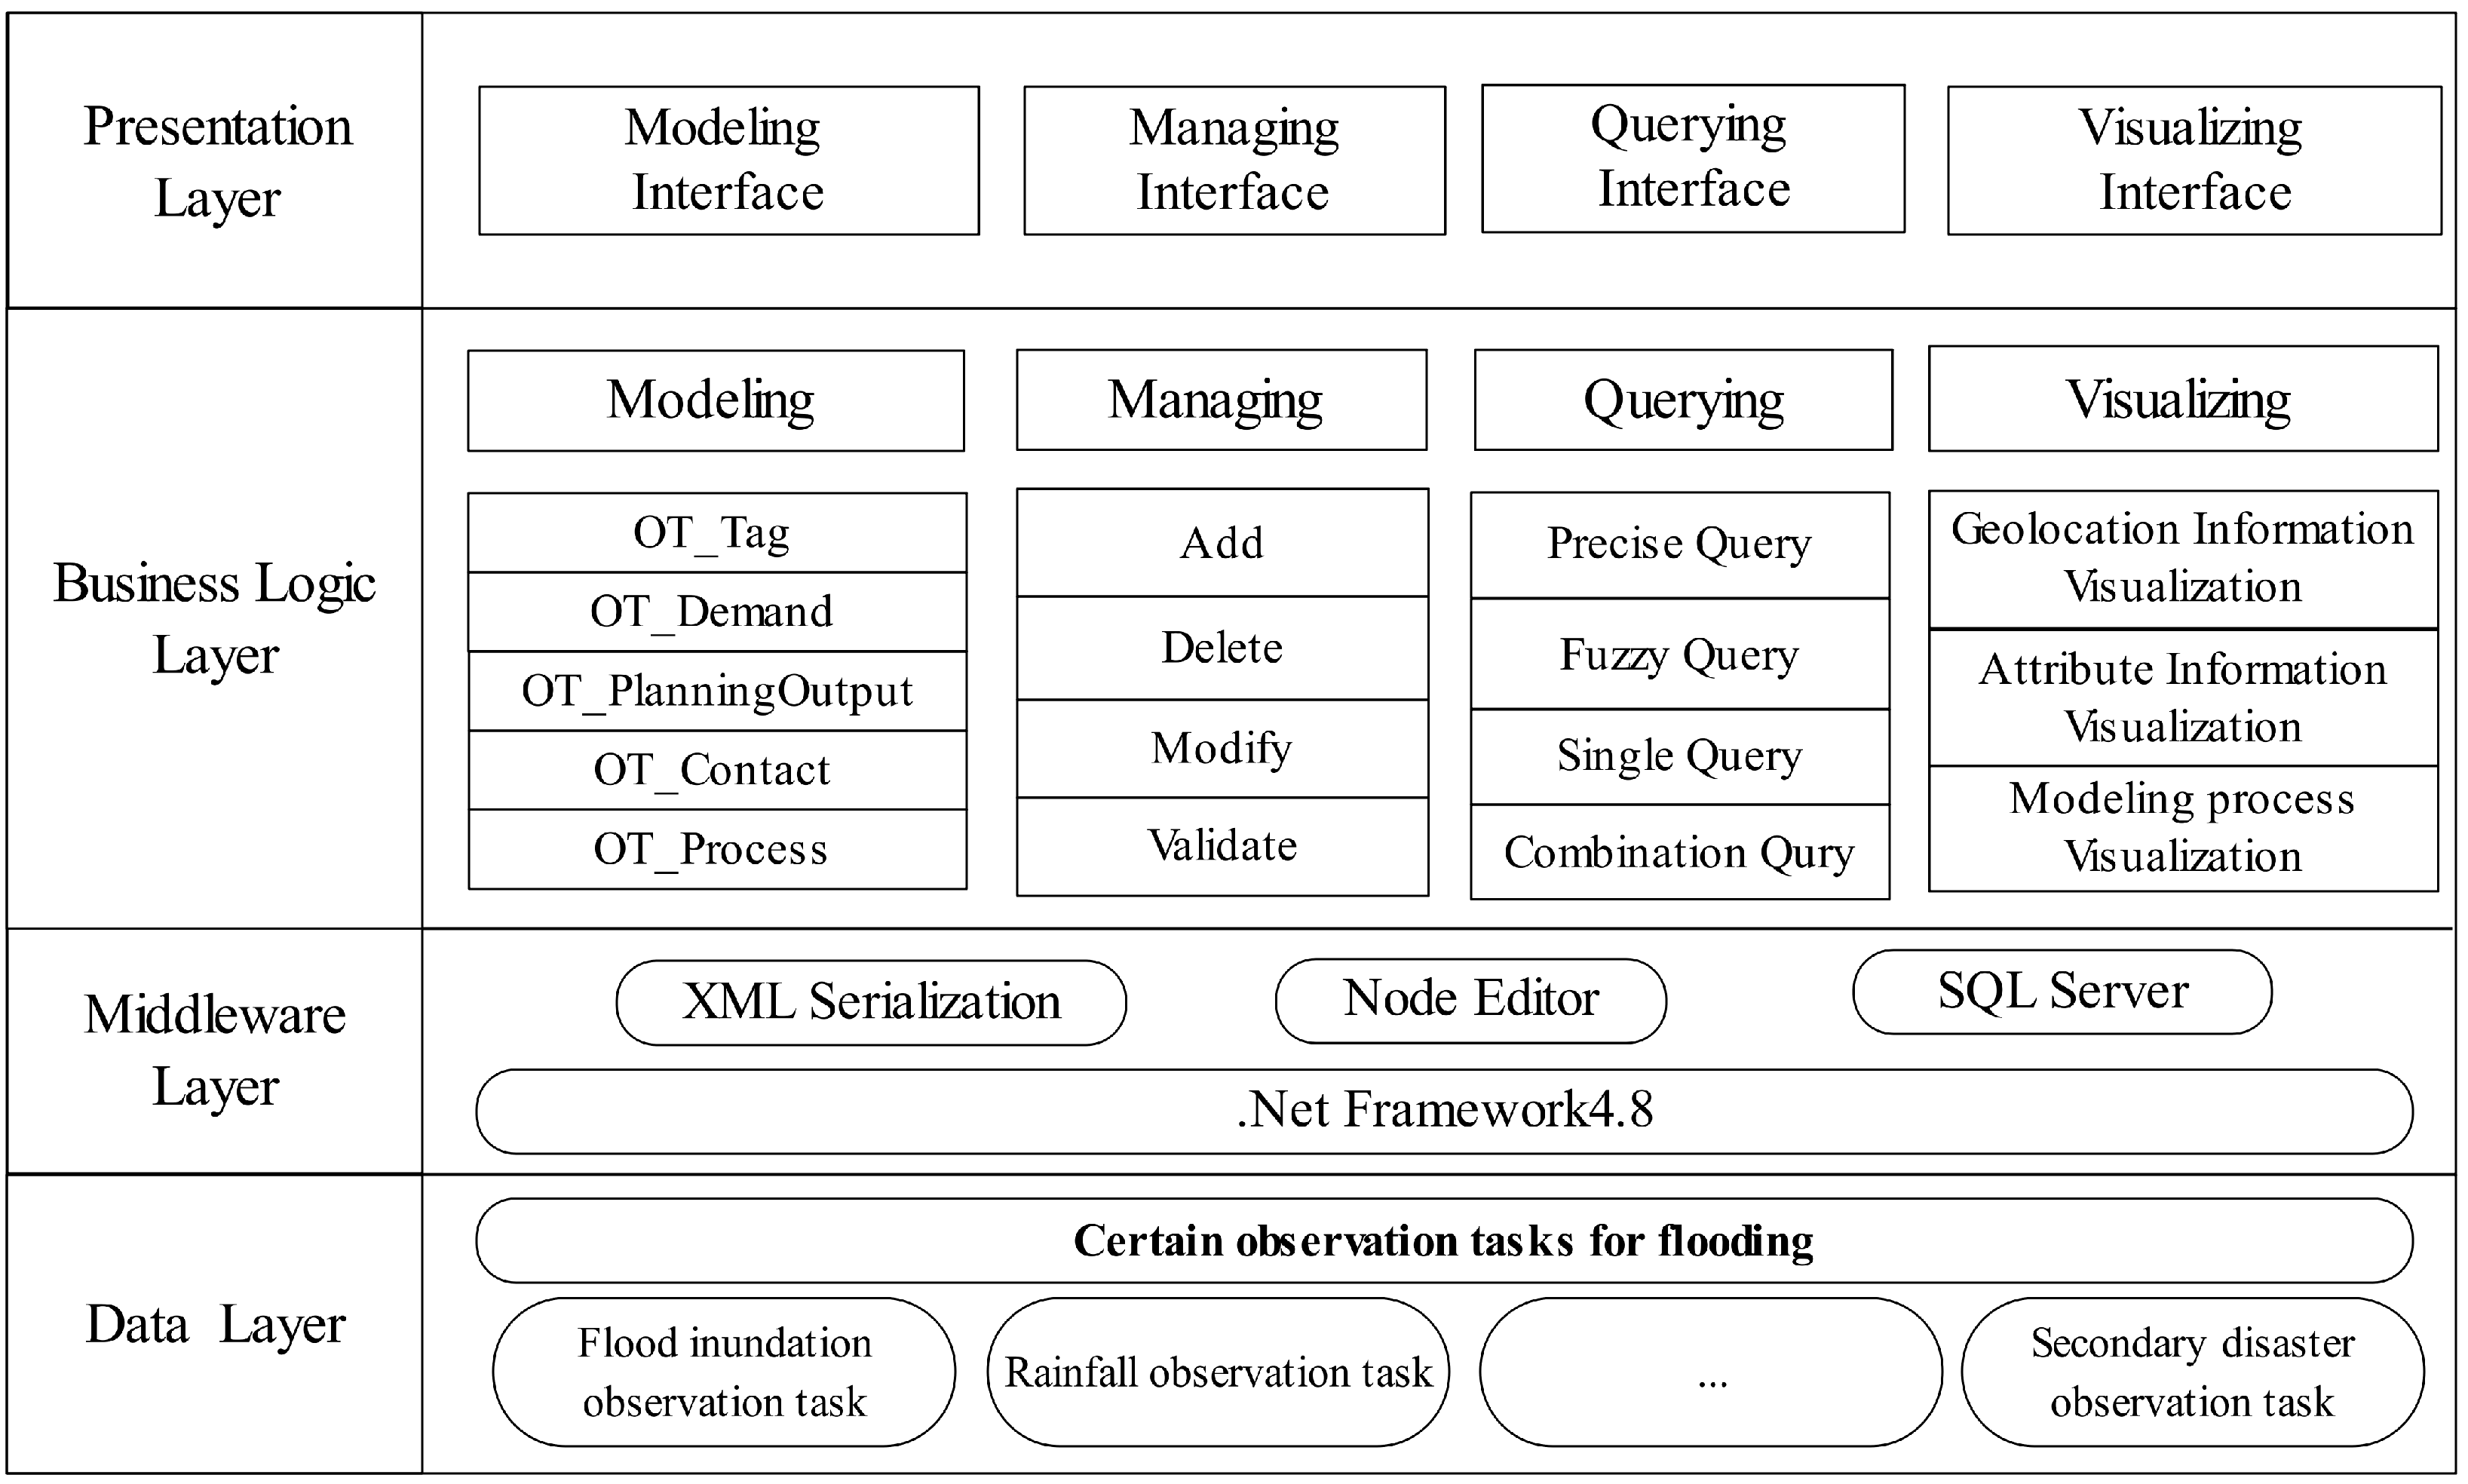
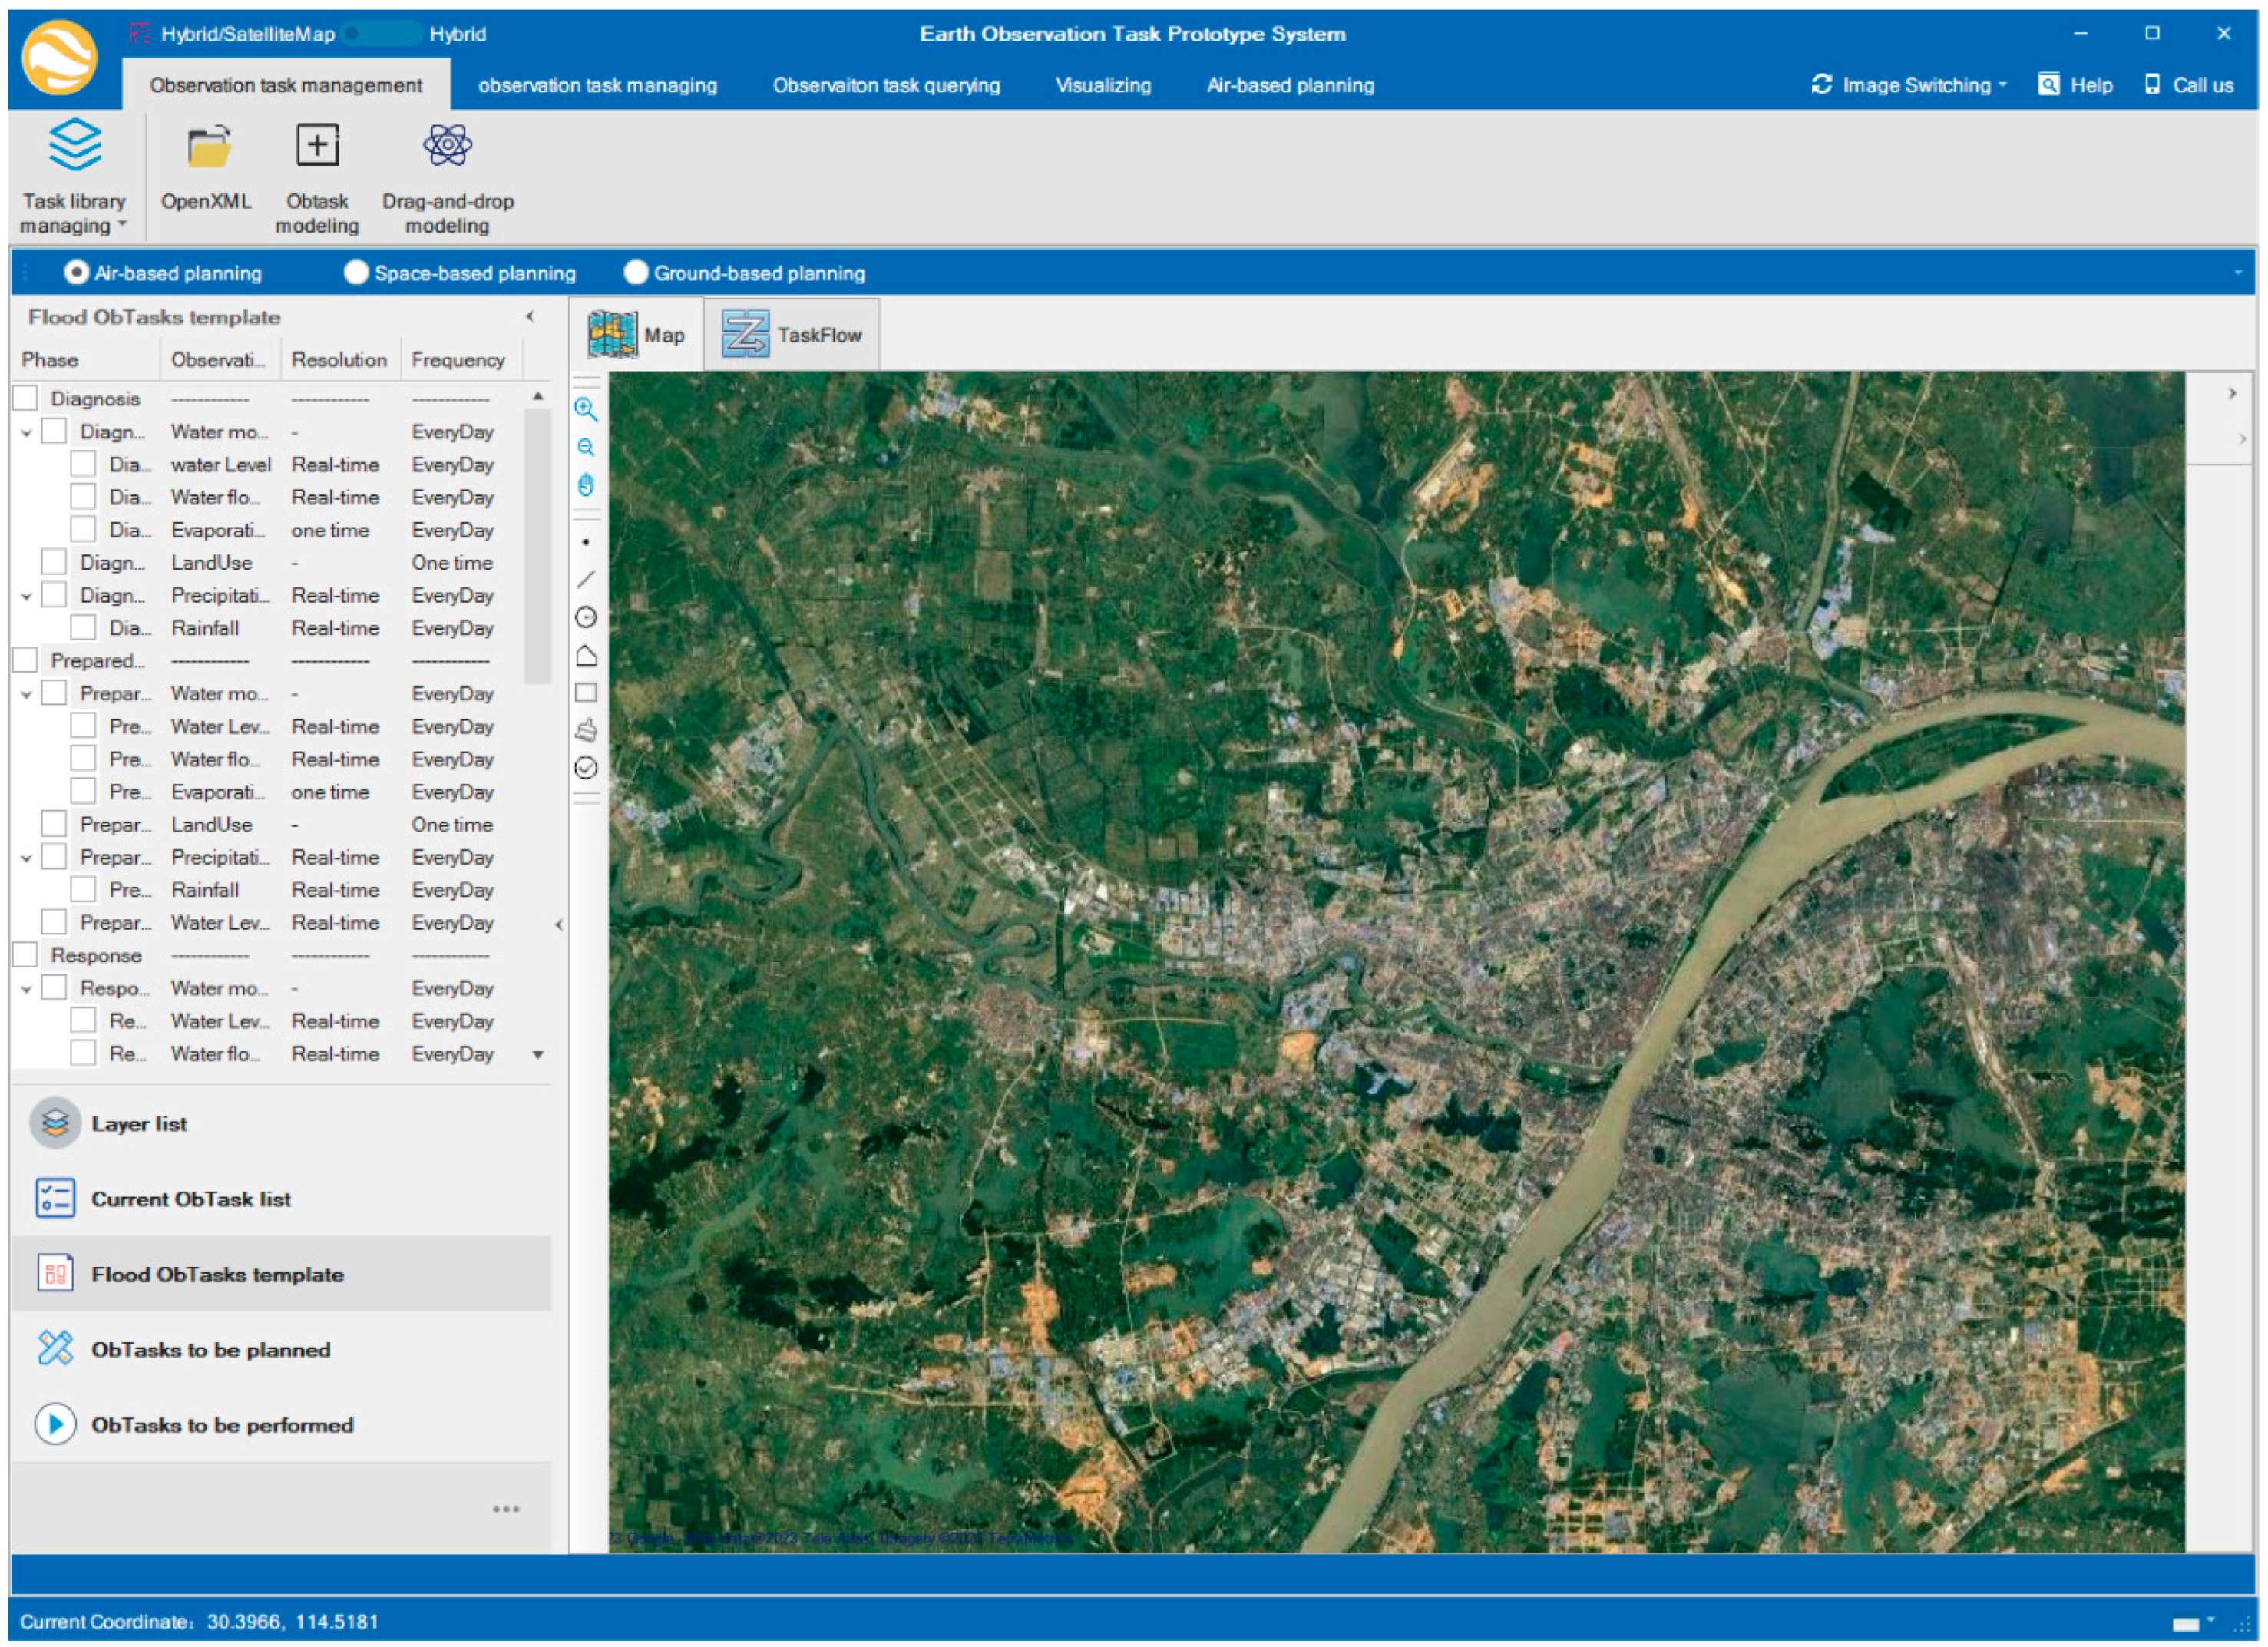
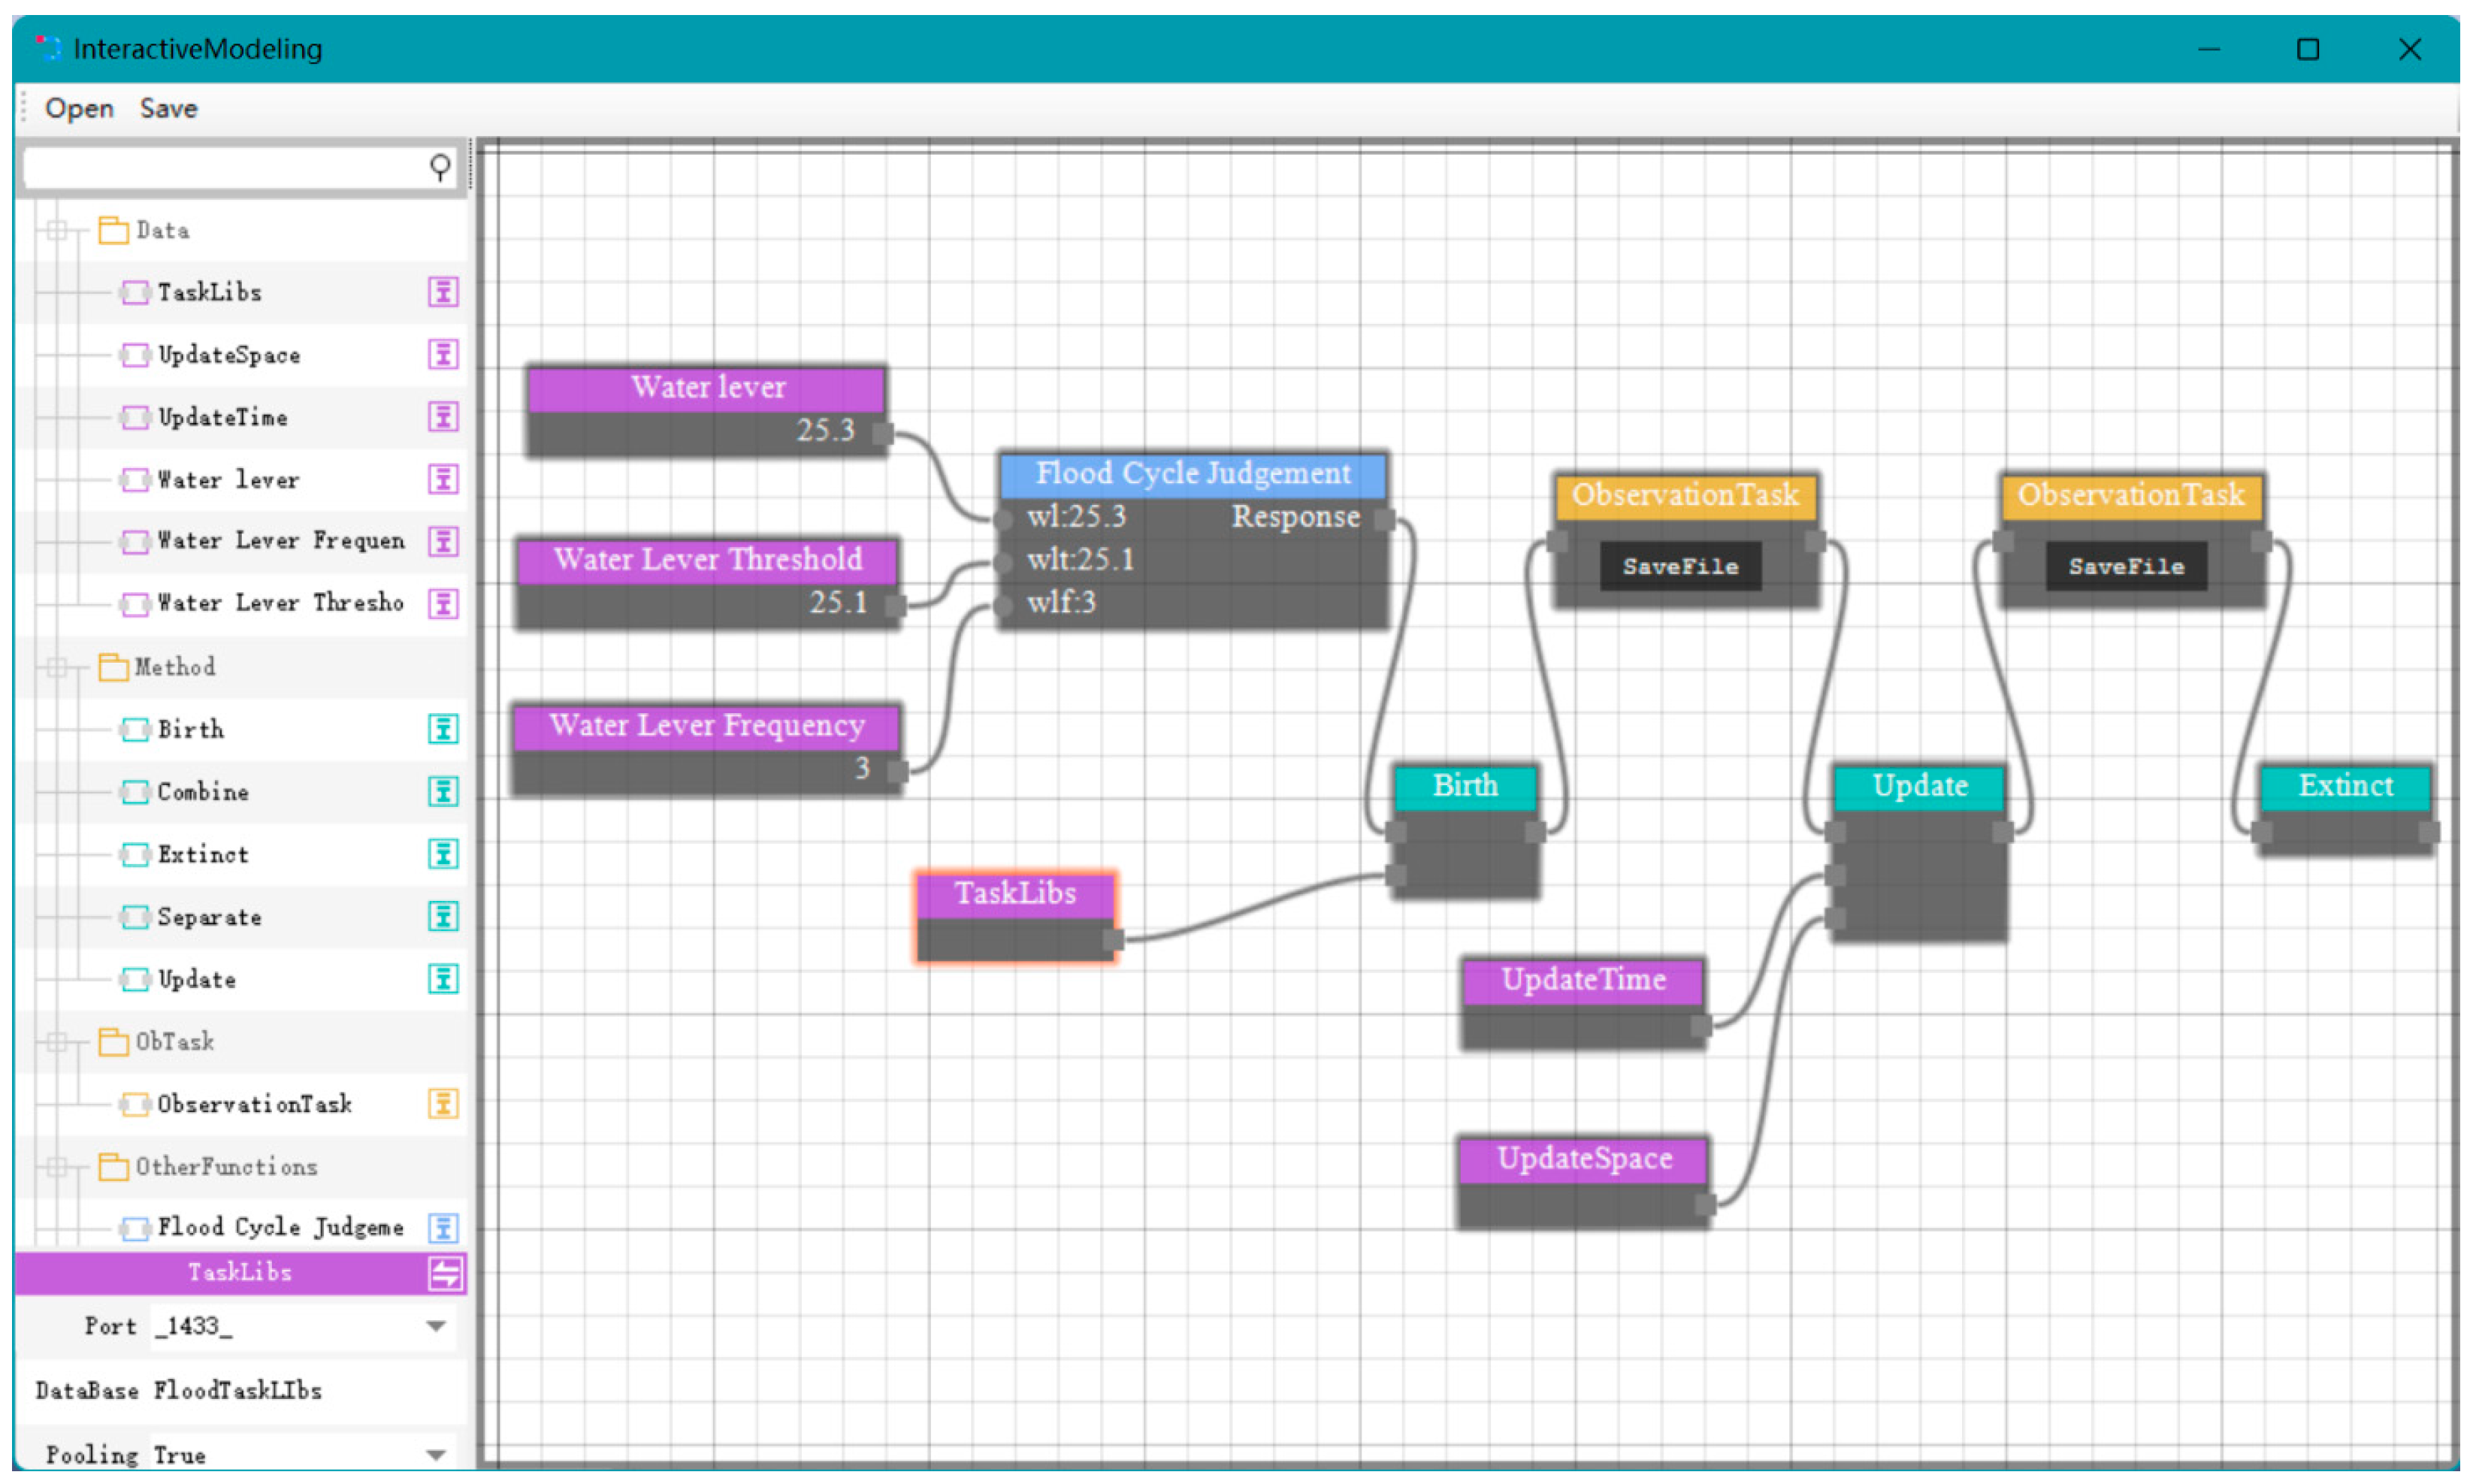
3.1. System Development

A prototype system, namely, the earth observation task modeling and management system (EO-TMMS), is designed and implemented for flood scenarios in this section. EO-TMMS realizes a unified organization of different EO tasks at various stages of flooding observation task demands on the basis of the EO task representation model.
The EO-TMMS architecture has four layers: data, business logic, middleware, and presentation layer (Figure 6). Information about EO tasks for flooding (e.g., flood inundation and rainfall observation tasks) is contained in the data layer. The middleware layer is in charge of promoting the serialization, storage, search, and visualization of EO task representation models. The core of the system is the business logic layer, which defines EO task modeling, management, querying, and visualization. Lastly, a series of user interfaces through which users can interact with the system is provided by the presentation layer. This layer also completes the business logic and operations defined in the business layer.
Figure 7 shows the interface of the prototype system, which includes the EO task modeling, management, query, and visualization modules. The modeling module provides a template interface to the observation task demand information. It allows users to set EO task information immediately (Figure 8). Users fill in the EO task information, which is organized as the metadata structure of an EO task. The management module manages the established EO tasks, supports the modification of the content of the model file, and verifies whether the model follows the metamodel pattern of an EO task. A variety of EO task queries are supported by the query module to satisfy a specific EO task query requirement. Lastly, the visualization module displays the geographical location and related attributes of selected EO tasks. The results are displayed in the main interface. This module also supports intuitive, drag-and-drop process modeling for facilitating subsequent EO task planning.

3.2. Flood-Oriented Earth Observation Task Experiments

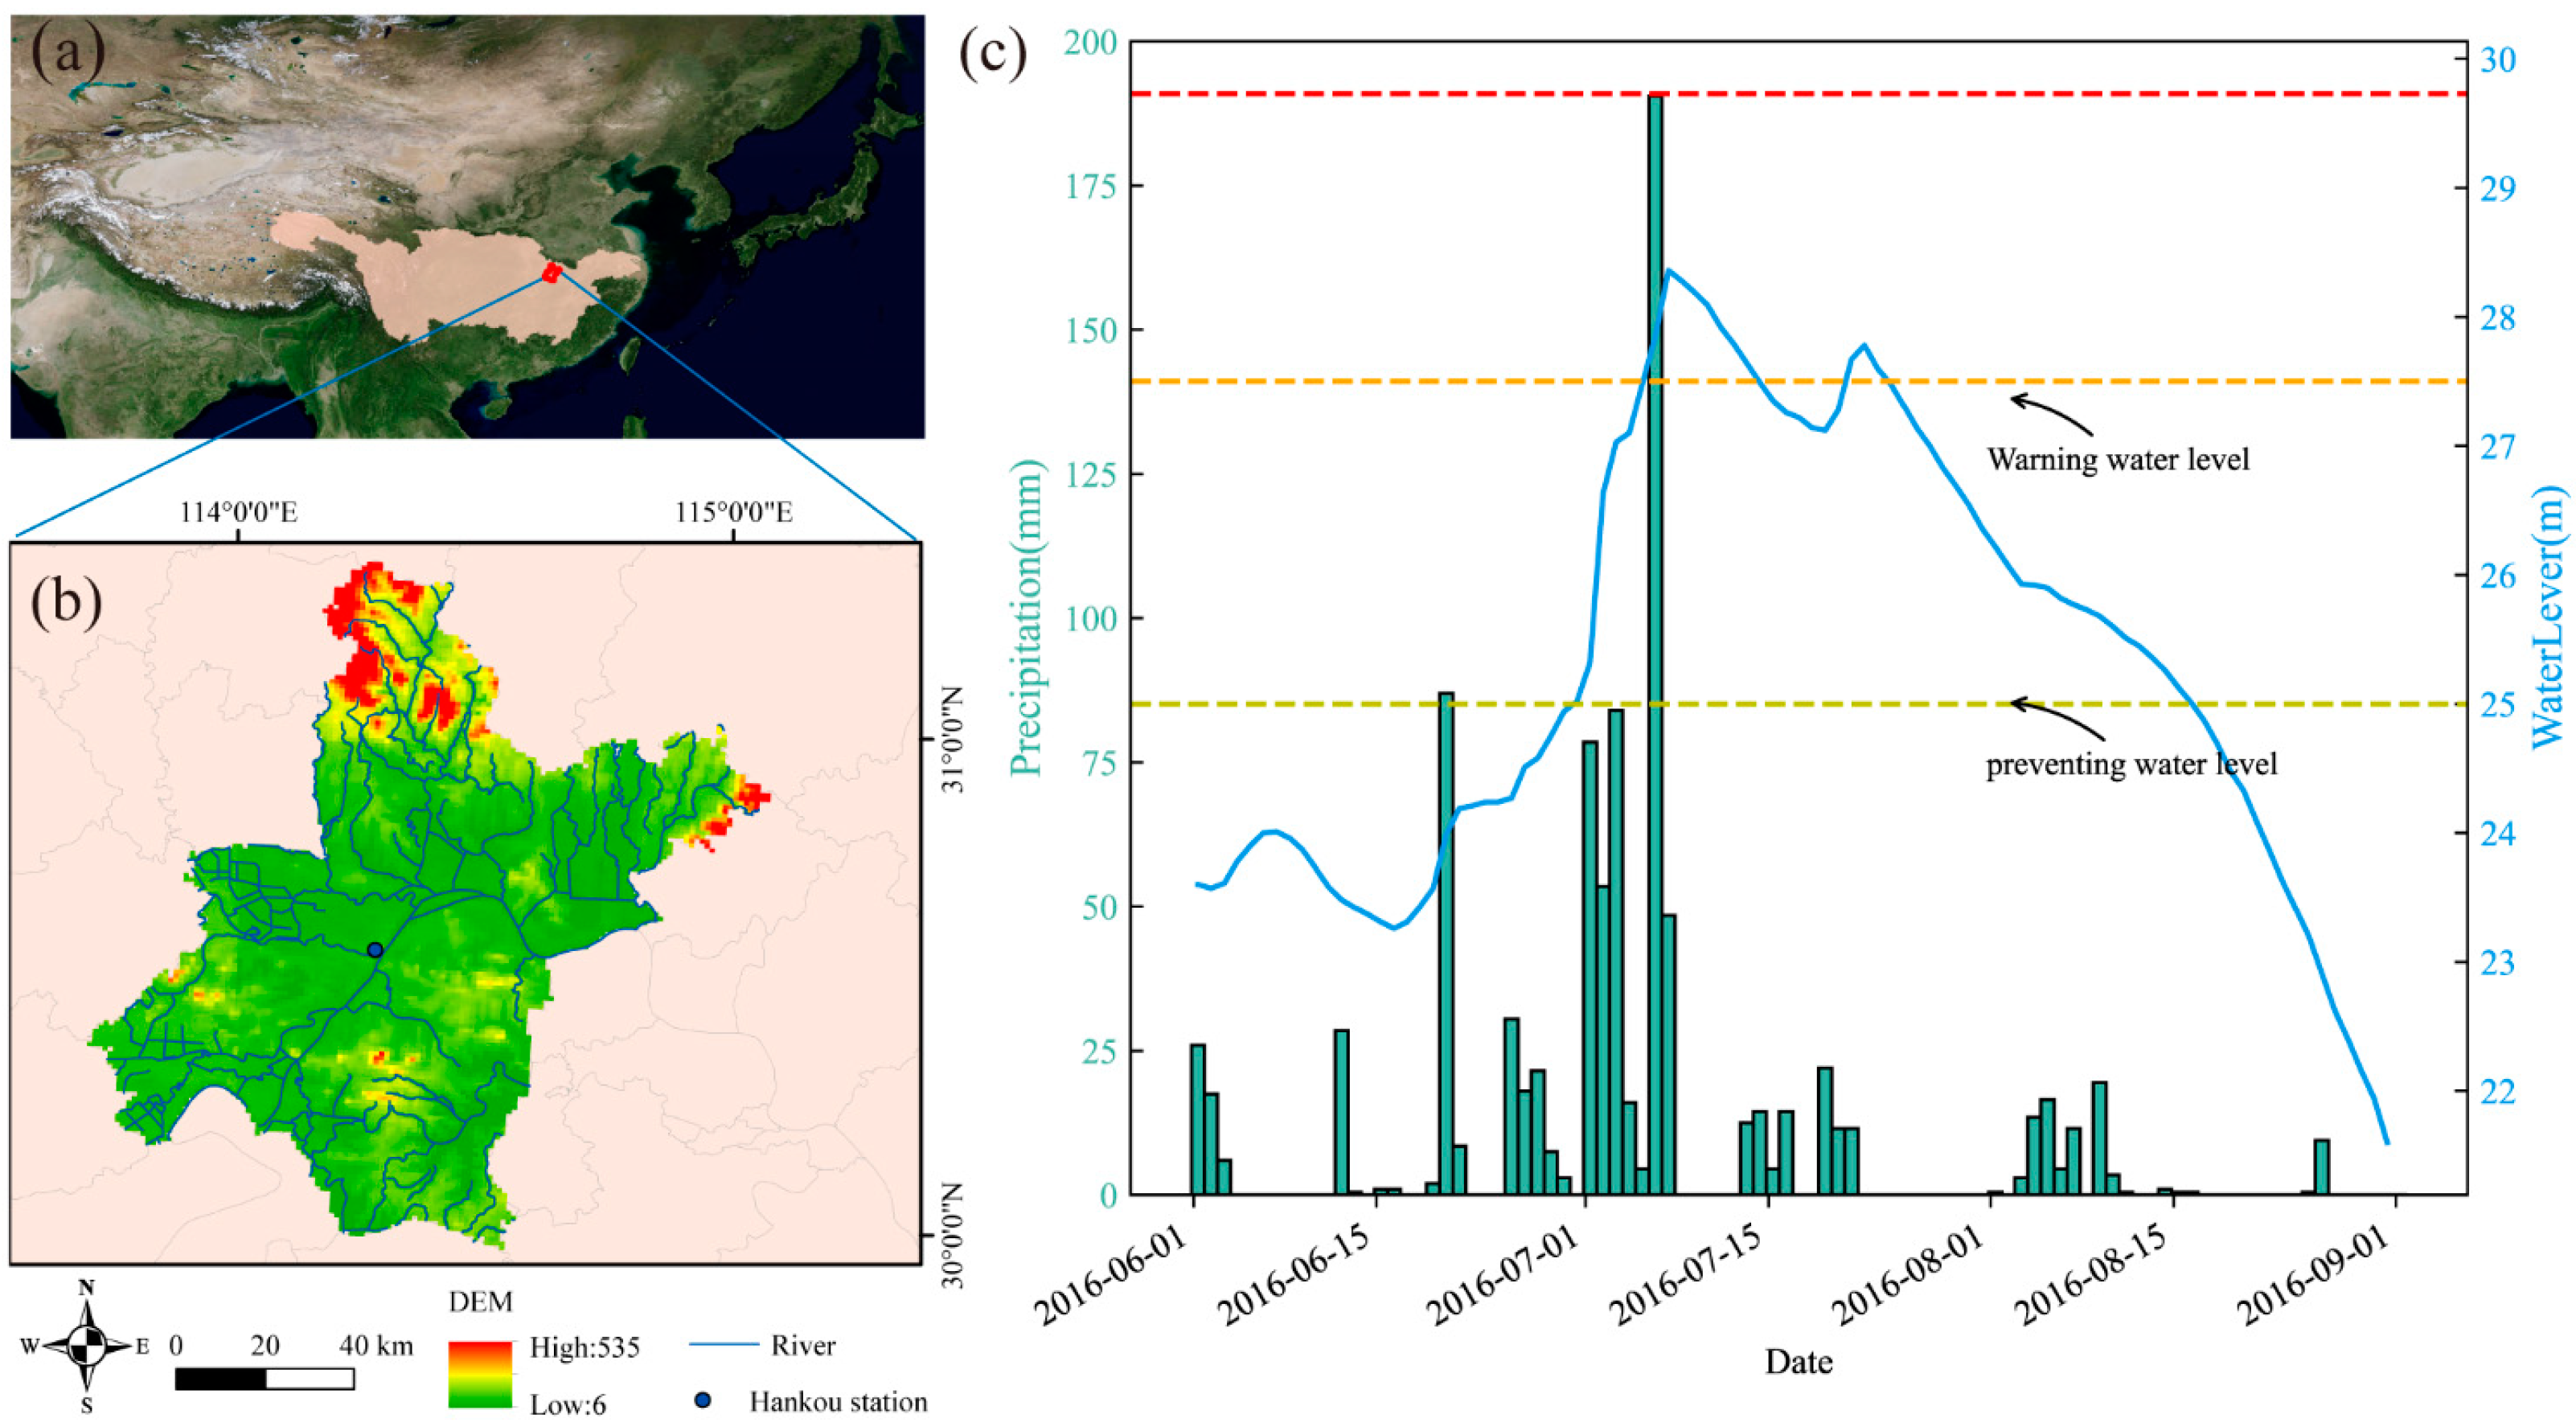
3.2.1. Experiment Background

Wuhan (113°41′–115°05′E, 29°58′–31°22′N), the capital city of Hubei Province, is located in the eastern section of the Jiang-Han Plain (Figure 9a,b). It is threatened by the highest flood risk in the Yangtze River basin, receiving an average annual rainfall of 1260.9 mm. The rainy season in Wuhan in 2016 was from 18 June to 21 July, with particularly strong rains from 30 June to 6 July, causing significant floods and economic damage.
Figure 9c shows the variation in rainfall and water level at the Hankou Hydrological Station from 1 June to 1 September 2016. The maximum 6 h rainfall was 132 mm (5 July 3:00 to 6 July 8:00). Meanwhile, the maximum 7-day rainfall was 475.5 mm (30 June 8:00 to 7 July 8:00). The maximum water level was 28.37 m (7 July 04:00), and the minimum water level was 21.25 m (1 September 08:00). The preventive water level (25 m) was exceeded at 23:00 on 29 June. The warning water level (27.3 m) was reached at 08:00 on 4 July. The peak water level was attained on 6 July.

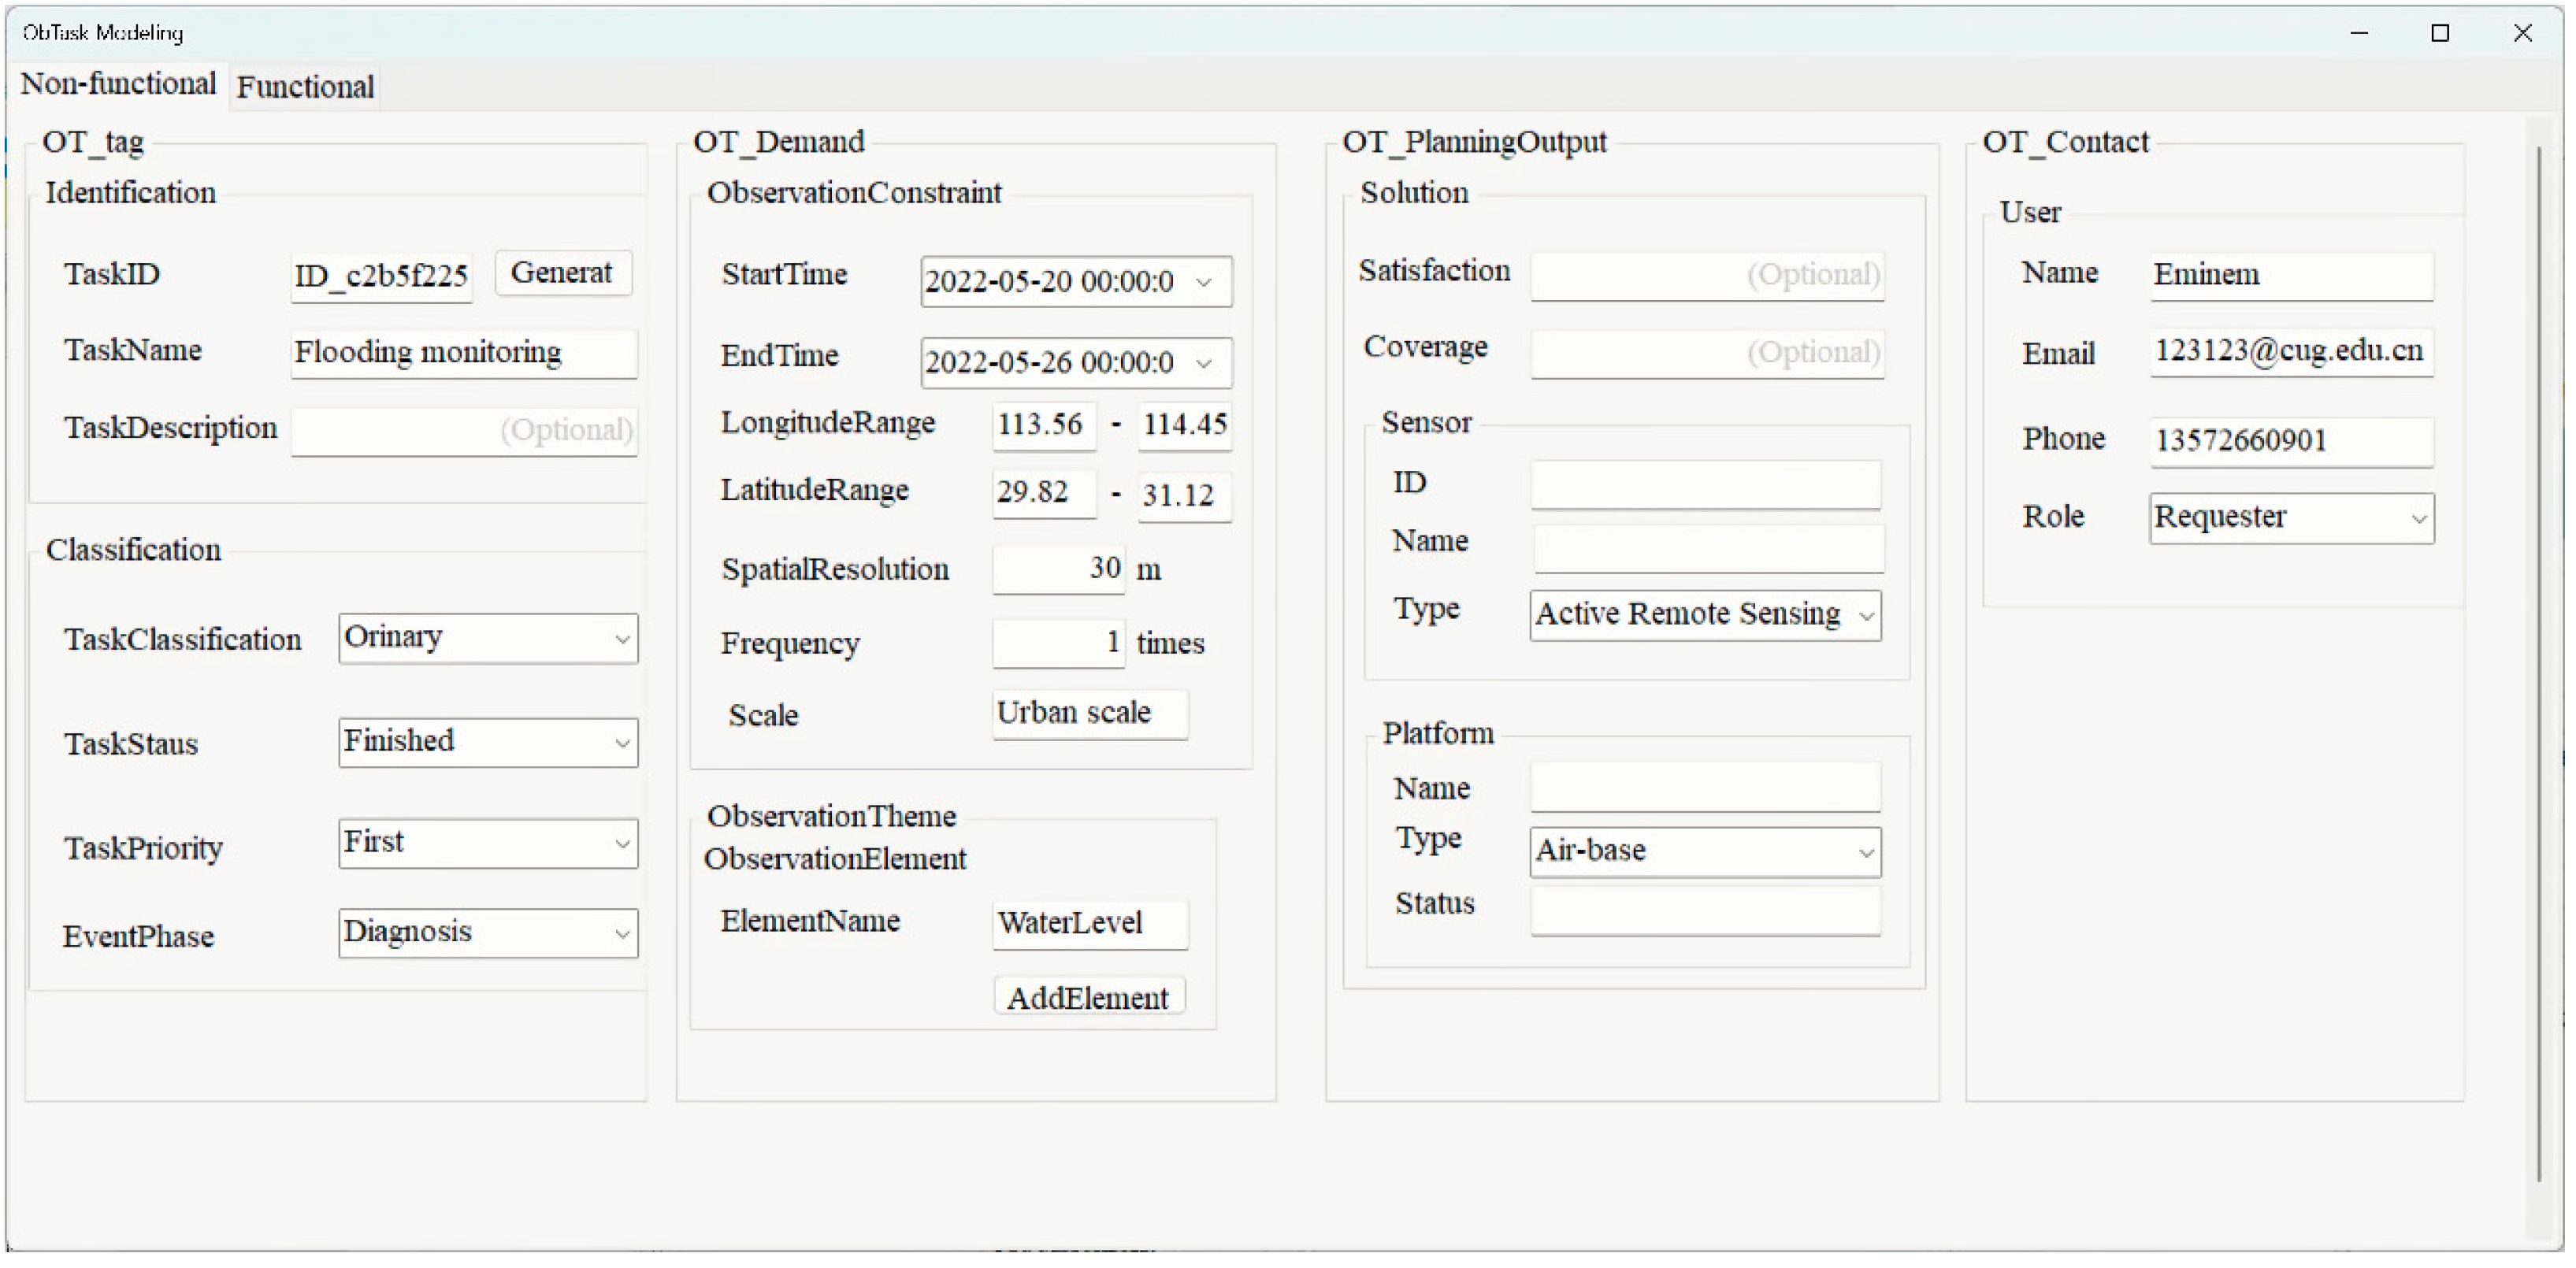
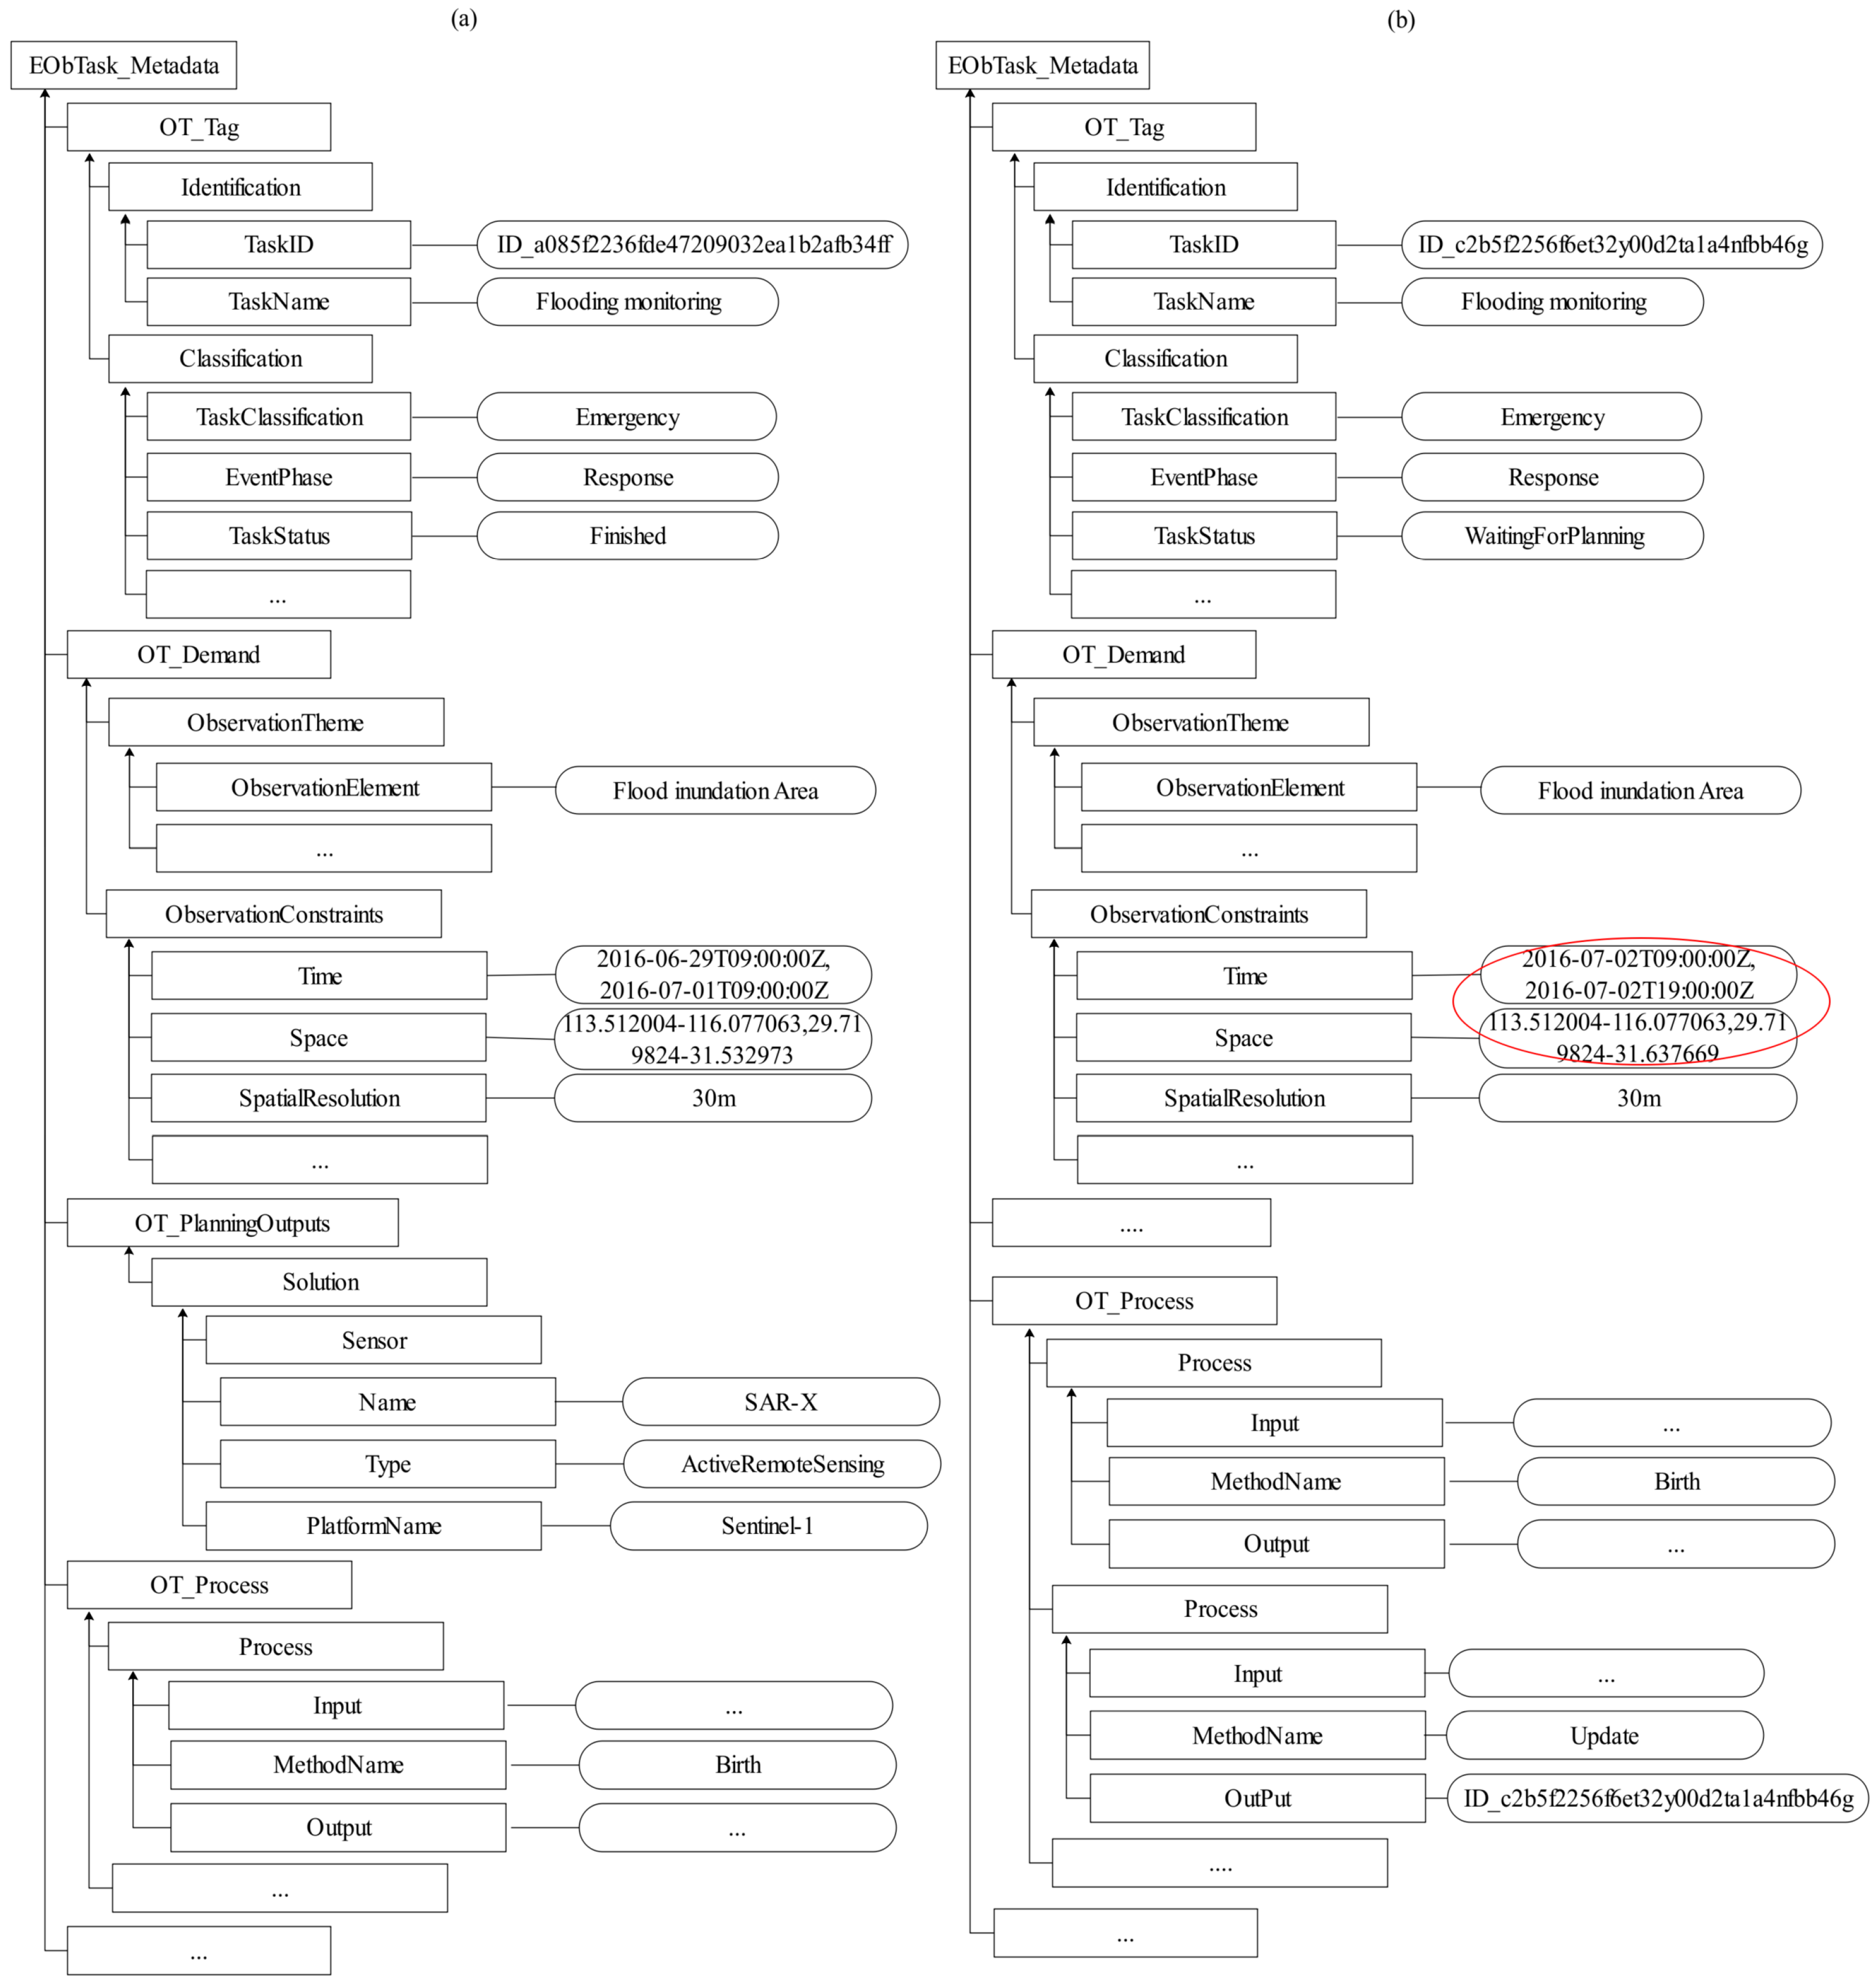
3.2.2. Representation Modeling of Flood Observation Task

The 2016 Wuhan flood observation event is presented as an example in Section 3.2.2, and some typical EO tasks are selected for modeling in accordance with the proposed EO task representation model. The EO task model of flooding is built using the modeling module. Figure 10 shows the xml fragment of the flood inundation EO task and the updated task instances. Information about the flood inundation EO task, including observation time, space, frequency, type, and elements, is recorded in the instance. Recording such information facilitates the rapid matching of EO tasks with observation platforms or sensors and querying by sensor planners to enhance the sharing and reuse of information.
The drag-and-drop modeling of the EO task process is illustrated in Figure 11. The modeling process can be achieved by dragging the components on the upper left side on the basis of the node editor (https://github.com/DebugST/STNodeEditor (accessed on 22 March 2023)). Some related objects are encapsulated into the components (e.g., data and methods). The user can avoid tedious operations by dragging these components to the right canvas to realize the simple and fast observation of task process settings.

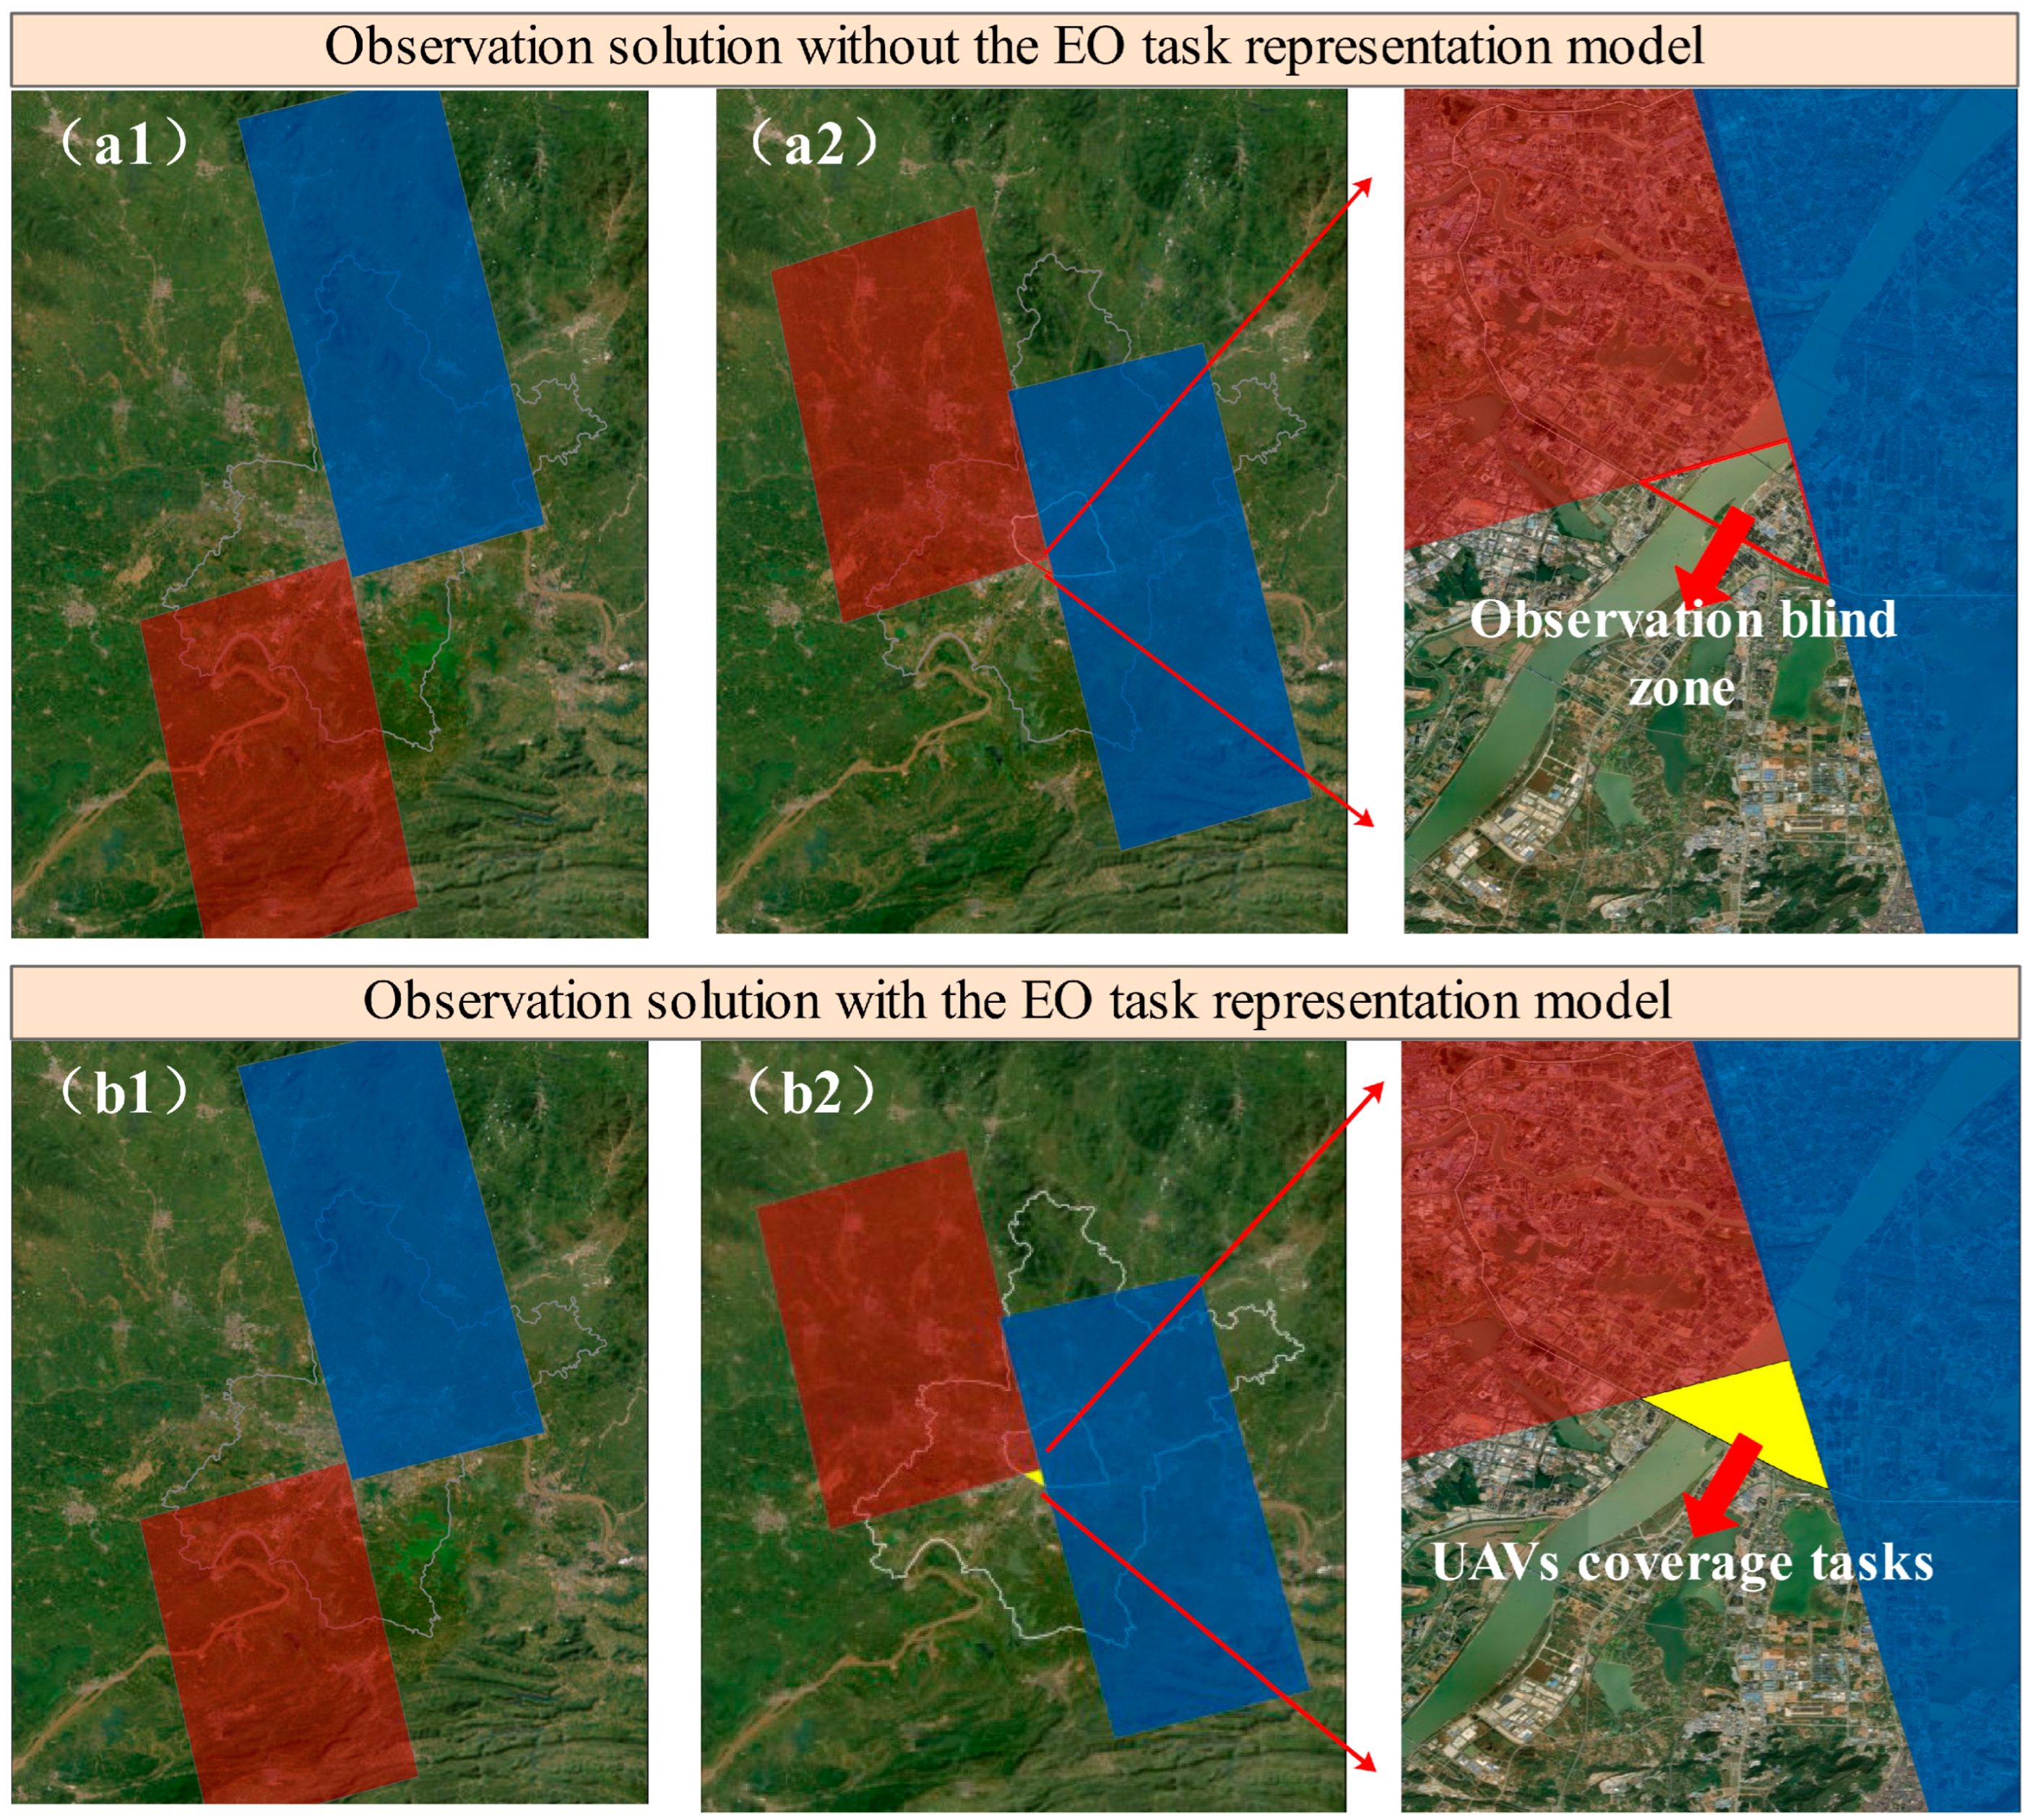
3.2.3. Coverage Effect Analysis Using EObTask

We conducted simulations to investigate the effects of observation coverage with and without the proposed representation model. Firstly, two observation tasks for Wuhan City, namely flood inundation monitoring (FIM) and secondary disaster monitoring (SDM), were generated from the flood task library. FIM was conducted on 7 July 2016, from 04:00 to 18:00 with a spatial resolution of 10 m, while SDM was conducted from 7 July 2016 at 05:00 to 8 July 2016 at 17:30 with a spatial resolution of 30 m. Secondly, as FIM and SDM tasks overlap in observation time and space, the combination mechanism was used to generate a new observation task with an observation space of Wuhan City, an observation frequency of once, an observation time of 7 July 2016, from 04:00 to 18:00, and a spatial resolution of 10 m. Additionally, the demands for observation tasks must be adjusted over time as disasters evolve, particularly in emergency response situations where critical observations are required in specific areas. For this specific test scenario, the central urban area of Wuhan was designated as the key monitoring area, and the task demands were continuously adjusted based on the proposed model’s update mechanism.
Finally, based on the satellite priority coverage principle, the proposed model separated the task into two: one with satellites as observation resources and the other with UAVs as the main observation resource (Figure 12b2). Figure 12 illustrates the effect of EObTask on observation coverage for observation tasks. The findings demonstrate that the overall coverage rates of the two programs in Wuhan are 73.76% and 75.30%, respectively, and the coverage rates in the central urban area are 97.62% and 100%. In this experimental scenario, utilizing the observation task representation model can enhance the overall coverage rate by 1.54% and increase the coverage rate of key areas by 2.38%.

4. Discussion

4.1. Enhancement for Flood Disaster Management

The proposed model can provide intelligent potential for flood disaster monitoring. (1) Improving the automation of EO task generation. At present, the EO planning process usually relies on human experience to work with semantic description information for different observation demands. These manual operations not only burden managers with analysis, but can also lead to the loss or omission of valuable information. Since the proposed model has an EO task separation and combination mechanism, it can reduce the dependency on manual experience and provide a reference for the full process automation of EO tasks. (2) Considering the dynamic requirements of EO tasks. Due to the time-varying dynamics of flood observation demands, the EO tasks should be dynamically adjusted to capture the real-time situation of the disaster, and the EO planning needs to consider the adaptability between tasks and sensors. The proposed model allows sensor planners to focus more on scheduling and planning agile satellites and flexible UAVs to satisfy the dynamic time-varying monitoring demand, which can minimize the probability of errors in planning.
Furthermore, the proposed model also supports unified and fine-grain task management for disaster emergency response. (1) Achieving uniform representation of observation tasks. Comprehensive, accurate, and timely access to disaster data is crucial in disaster emergency management, which involves scheduling heterogeneous sensors to collaborate to complete a certain observation task. In this case, a unified EO task representation model is required to support the collaborative observation process. The MOF-based EO task representation model can uniformly express observation tasks and provide extensibility. (2) Improving the fine-grain level of observation task management. In a traditional application scenario, decision makers are uncertain about which EO task to perform during the different flooding stages. Without prior knowledge, the proposed model allows decision makers to choose EO tasks from a flood task library during corresponding stages, thereby improving fine-grain EO task management.
Regional cooperation mechanisms, such as Copernicus EMS [16], the International Charter Space and Major Disasters (TICSMD) [18], and Sentinel Asia [17], commonly employ EO to support flood management. Table 1 compares the task representations of TICSMD with the work presented in this paper. It shows that TICSMD can characterize the observation task using a user request form. However, variations in the understanding of observation task demands between different agencies and stakeholders, particularly in the context of cross-regional or cross-sectoral collaborations, can affect the accuracy of observation planning and ultimately cause delays in disaster response. The proposed EO task representation model can establish a standardized representation of multidimensional observation demands, thereby eliminating any bias in understanding these demands and facilitating cross-regional or cross-sectoral cooperation. Furthermore, the proposed model can enhance the efficiency of sensor planners and the optimal utilization of observation resources by representing the process of observation tasks.

4.2. Versatility and Extensibility

An MOF-based metadata modeling framework that supports the description of scenario-specific EO task information is designed. This framework extends the metadata features on the basis of a five-component structure that is particularly critical for the fine-grain, dynamic representation of EO task information. This phenomenon is proven by allowing for the specification of the spatiotemporal variation of an EO task in various disaster event cycles, such as the flood inundation task during the flood response phase mentioned earlier. The EO task metamodel exhibits the ability to characterize the basic demand information of an EO task. In addition, it enables the monitoring of different disasters by setting up a library of EO tasks for a variety of application purposes.
During the metamodel design process, observation demands should be instantiated in accordance with the requirements of a certain application field. A library of EO tasks for a respective domain should be provided to make the EO task metamodel adaptable to various disaster observation task demands. To improve comprehensive earth observation services, the EO task metamodel can be extended to other domains by creating a library of EO tasks for these domains [49]. These services include the integrated disaster monitoring of landslides, forest fires, and meteorology. Such procedures may provide a new perspective for disaster chain observation management, which undoubtedly requires further investigation and research.
Furthermore, the model presented in this paper can be customized to address the uncertainties in the observation task. Specifically, an uncertainty associated with different observation platforms can be described by the proposed model and integrated into the solution component of the seven-tuple to expand the uncertainties for the observing task. For instance, optical satellites primarily describe total cloud cover, while SAR satellites focus on geometric deformation. UAVs account for uncertainty factors such as battery time, air temperature, flight speed, and maximum flight altitude, while in situ stations prioritize factors such as range, resolution, and accuracy.

4.3. Advantages of the Observation Task Process

To collect disaster data at different phases and facilitate decision-making, disaster situations require extensive and dynamic observations. For example, more observation tasks should be considered during the flood response phase. When the water level exceeds preventive levels, the water level and flow velocity should be monitored intensively to acquire sufficient information about the water condition. The continued rise in water levels must also be considered in ongoing or potential disasters as time passes, necessitating the use of multi-platform EO sensor resources, such as satellites, unmanned aerial vehicles, and mobile ground equipment, to work together and apply various capabilities in conducting observations.
Figure 13 presents a comparison between the models with and without the task process. The proposed EO task process considers EO task dynamic demands and the full process of a flood. Compared with the EO task model without a task process, it exhibits the following advantages. (1) The efficiency of using EO sensor resources can be improved by the combination process. (2) Accurate and fine-grain monitoring can be achieved by the separation process. (3) The updating process can support dynamic observations, and, thus, the uncertainty associated with the manual generation of tasks is reduced. Relevant data can be obtained in time to assist decision makers if the observation of disasters is integrated and dynamic. In this manner, human casualties and economic losses may be reduced.

4.4. Comparison with Other Models

In this section, we compare several flood disaster information models used in previous studies, namely FloodML [40], FLCNDEM [7], and OTChain [8], with EObTask (Table 1). Although all these models are used in flood disasters, they do not focus on the same aspects. FloodML provides standards and specifications for transmission data for river flow and flood alerts. Therefore, it is incompatible with the features listed in Table 2. FLCNDEM focuses on the cycle of natural disaster events. It supports time-series observation planning and limited dynamic observation information description. Similarly, OTChain supports time-series observation planning, limited dynamic observation information description, and observation interconnection. It focuses on disaster processes and sensor capability association. In contrast with the EO task process in EObTask, none of the aforementioned models provide an explicit EO task process for supporting dynamic task demands. Moreover, EObTask describes nonfunctional and functional metamodels. Task dynamics should be modeled as a process that enables fine-grain task process tracking by applying appropriate methods to convert input into output. Event processes, observation task demands, sensor information, and task processes are effectively associated in this manner. In summary, EObTask fully supports the features in Table 2 compared with the other models. It can bridge EO sensor capability association and collaborative observation planning. Accordingly, compared with the other models, the proposed EO task representation model can optimize the utilization of EO sensor resources, support the representation of the EO task dynamic process, and improve the disaster management of flooding.

5. Conclusions

An EO task representation model based on flood observation demands is introduced in this study. This model defines the five processes of an EO task: birth, separation, combination, updating, and extinction. A dynamic representation of observation can be achieved by introducing the functional metamodel. The EO task representation model is then applied to the 2016 Wuhan flooding event. In accordance with the results, the proposed model can effectively represent different flood observation tasks and support the expression of the EO task process. The proposed model can also be modified and extended to describe the EO tasks of other disasters. Consequently, the efficiency of disaster information management is improved.
This study focuses on the metamodel framework of the EO task representation model with a task process. Exploring how the proposed approach can be extended to construct respective metamodels on the basis of the special features of other single-hazard (e.g., landslide and debris flow) or multi-hazard integrated observation tasks with adequate consideration will be worthwhile. In addition, considering the development of on-orbit data processing, the Internet of Things, deep learning, knowledge graph, and cloud computing technologies in recent years, an intelligent and autonomous observation task process will offer greater assistance to integrated disaster management in the future.

Author Contributions

Conceptualization, C.H. and K.W.; Methodology, Z.Z.; Software, Z.Z., Z.X. and X.D.; Supervision, C.H. and K.W.; Writing—original draft, Z.Z.; Writing—review and editing, K.W. and Y.Z. All authors have read and agreed to the published version of the manuscript.

Funding

This work was supported by grants from the National Nature Science Foundation of China (NSFC) Program (No. 42071380), the Special Fund of Hubei Luojia Laboratory (No. 220100034), and the Open Fund of Hubei Luojia Laboratory (No. 220100056).

Data Availability Statement

The data of this article can be found online at https://figshare.com/articles/dataset/Data_7z/22121018 (accessed on 22 March 2023).

Conflicts of Interest

The authors declare no conflict of interest.

Appendix A

Algorithm A1: Birth Algorithm
  Input: Water level wl, Flood task list ftl, Water level thresholds for different flood
      cycle wi, Frequency thresholds for different flood cycle fi, Flood task graph
      composed of flood tasks in observation, Flood Task library G, Observation
      Task ObTask
  Use: floodCycle ← DetermineFloodCycle (wl, wi, fi);
  Output: new flood task list nftl
Remotesensing 15 02193 i001
Algorithm A2: Separation Algorithm
  Input: Observation Task ObTask, Flood task library G
  Output: New flood task list nftl
Remotesensing 15 02193 i002
Algorithm A3: Combination Algorithm
  Input: Flood atom task1 fat1, Flood atom task2 fat2
  Output: Flood task newTask
Remotesensing 15 02193 i003
Algorithm A4: Updating Algorithm
  Input: Observation task ObTask, Observation data Data
  Use: SFT ← SensingOfFloodTask (Data);
  Output: Observation task ObTask
Remotesensing 15 02193 i004
Algorithm A5: Extinction Algorithm
  Input: Flood task list ftl, Current time time
  Output: New flood task list nftl
Remotesensing 15 02193 i005

References

  1. Cortes, M.; Turco, M.; Ward, P.; Sanchez-Espigares, J.A.; Alfieri, L.; Llasat, M.C. Changes in Flood Damage with Global Warming on the Eastern Coast of Spain. Nat. Hazards Earth Syst. Sci. 2019, 19, 2855–2877. [Google Scholar] [CrossRef]
  2. Wang, S.; Zhang, K.; Chao, L.; Li, D.; Tian, X.; Bao, H.; Chen, G.; Xia, Y. Exploring the Utility of Radar and Satellite-Sensed Precipitation and Their Dynamic Bias Correction for Integrated Prediction of Flood and Landslide Hazards. J. Hydrol. 2021, 603, 126964. [Google Scholar] [CrossRef]
  3. Bates, P.D.; Quinn, N.; Sampson, C.; Smith, A.; Wing, O.; Sosa, J.; Savage, J.; Olcese, G.; Neal, J.; Schumann, G.; et al. Combined Modeling of US Fluvial, Pluvial, and Coastal Flood Hazard under Current and Future Climates. Water Resour. Res. 2021, 57, e2020WR028673. [Google Scholar] [CrossRef]
  4. Rentschler, J.; Salhab, M.; Jafino, B.A. Flood Exposure and Poverty in 188 Countries. Nat. Commun. 2022, 13, 3527. [Google Scholar] [CrossRef] [PubMed]
  5. Othman, S.H.; Beydoun, G. A Metamodel-Based Knowledge Sharing System for Disaster Management. Expert Syst. Appl. 2016, 63, 49–65. [Google Scholar] [CrossRef]
  6. Adikari, K.E.; Shrestha, S.; Ratnayake, D.T.; Budhathoki, A.; Mohanasundaram, S.; Dailey, M.N. Evaluation of Artificial Intelligence Models for Flood and Drought Forecasting in Arid and Tropical Regions. Environ. Model. Softw. 2021, 144, 105136. [Google Scholar] [CrossRef]
  7. Chen, N.; Du, W.; Song, F.; Chen, Z. FLCNDEMF: An Event Metamodel for Flood Process Information Management under the Sensor Web Environment. Remote Sens. 2015, 7, 7231–7256. [Google Scholar] [CrossRef]
  8. Yang, C.; Luo, J.; Hu, C.; Tian, L.; Li, J.; Wang, K. An Observation Task Chain Representation Model for Disaster Process-Oriented Remote Sensing Satellite Sensor Planning: A Flood Water Monitoring Application. Remote Sens. 2018, 10, 375. [Google Scholar] [CrossRef]
  9. Chen, N.; Wang, K.; Xiao, C.; Gong, J. A Heterogeneous Sensor Web Node Meta-Model for the Management of a Flood Monitoring System. Environ. Model. Softw. 2014, 54, 222–237. [Google Scholar] [CrossRef]
  10. Hu, C.; Tian, L.; Li, J.; Wang, K.; Chen, N. An Observation Capability Information Association Model for Multisensor Observation Integration Management: A Flood Observation Use Case in the Yangtze River Basin. IEEE Sens. J. 2019, 19, 11510–11525. [Google Scholar] [CrossRef]
  11. Chen, N.; Xing, C.; Zhang, X.; Zhang, L.; Gong, J. Spaceborne Earth-Observing Optical Sensor Static Capability Index for Clustering. IEEE Trans. Geosci. Remote Sens. 2015, 53, 5504–5518. [Google Scholar] [CrossRef]
  12. Tellman, B.; Sullivan, J.; Kuhn, C.; Kettner, A.; Doyle, C.; Brakenridge, G.; Erickson, T.; Slayback, D. Satellite Imaging Reveals Increased Proportion of Population Exposed to Floods. Nature 2021, 596, 80–86. [Google Scholar] [CrossRef] [PubMed]
  13. Li, D.; Wang, M.; Dong, Z.; Shen, X.; Shi, L. Earth Observation Brain (EOB): An Intelligent Earth Observation System. Geo-Spat. Inf. Sci. 2017, 20, 134–140. [Google Scholar] [CrossRef]
  14. Xiao, C.; Chen, N.; Wang, K. Design and Implementation of Geospatial Sensor Web Node Management Prototype System. In Proceedings of the 2013 21st International Conference on Geoinformatics, Kaifeng, China, 19–21 June 2013; pp. 1–5. [Google Scholar]
  15. Du, W.; Chen, N.; Yuan, S.; Wang, C.; Huang, M.; Shen, H. Sensor Web-Enabled Flood Event Process Detection and Instant Service. Environ. Model. Softw. 2019, 117, 29–42. [Google Scholar] [CrossRef]
  16. Copernicus Emergency Management Service. Available online: https://emergency.copernicus.eu/ (accessed on 23 March 2023).
  17. Sentinel Asia. Available online: https://sentinel-asia.org/ (accessed on 24 March 2023).
  18. About the Charter-International Disasters Charter. Available online: https://disasterscharter.org/web/guest/about-the-charter (accessed on 22 March 2023).
  19. Kreibich, H.; Di Baldassarre, G.; Vorogushyn, S.; Aerts, J.C.; Apel, H.; Aronica, G.T.; Arnbjerg-Nielsen, K.; Bouwer, L.M.; Bubeck, P.; Caloiero, T.; et al. Adaptation to Flood Risk: Results of International Paired Flood Event Studies. Earth’s Future 2017, 5, 953–965. [Google Scholar] [CrossRef]
  20. Kumar, P.; Debele, S.E.; Sahani, J.; Rawat, N.; Marti-Cardona, B.; Alfieri, S.M.; Basu, B.; Basu, A.S.; Bowyer, P.; Charizopoulos, N.; et al. An Overview of Monitoring Methods for Assessing the Performance of Nature-Based Solutions against Natural Hazards. Earth Sci. Rev. 2021, 217, 103603. [Google Scholar] [CrossRef]
  21. Varlas, G.; Anagnostou, M.N.; Spyrou, C.; Papadopoulos, A.; Kalogiros, J.; Mentzafou, A.; Michaelides, S.; Baltas, E.; Karymbalis, E.; Katsafados, P. A Multi-Platform Hydrometeorological Analysis of the Flash Flood Event of 15 November 2017 in Attica, Greece. Remote Sens. 2018, 11, 45. [Google Scholar] [CrossRef]
  22. Othman, S.H.; Beydoun, G. Model-Driven Disaster Management. Inf. Manag. 2013, 50, 218–228. [Google Scholar] [CrossRef]
  23. Global Flood Awareness System (Glofas-Gfm). Available online: https://www.globalfloods.eu/technical-information/glofas-gfm/ (accessed on 22 March 2023).
  24. Global Flood Monitoring System (GFMS). Available online: http://flood.umd.edu/ (accessed on 22 March 2023).
  25. European Flood Awareness System|Copernicus. Available online: https://www.copernicus.eu/en/european-flood-awareness-system (accessed on 26 March 2023).
  26. The Flood Observatory. Available online: https://floodobservatory.colorado.edu/ (accessed on 22 March 2023).
  27. Jafari, N.H.; Li, X.; Chen, Q.; Le, C.-Y.; Betzer, L.P.; Liang, Y. Real-Time Water Level Monitoring Using Live Cameras and Computer Vision Techniques. Comput. Geosci. 2021, 147, 104642. [Google Scholar] [CrossRef]
  28. JAXA Global Rainfall Watch (GSMaP). Available online: https://sharaku.eorc.jaxa.jp/GSMaP/ (accessed on 22 March 2023).
  29. ECMWF Charts. Available online: https://charts.ecmwf.int/products/medium-rain-acc?base_time=202303211200&projection=opencharts_europe&valid_time=202303211200 (accessed on 22 March 2023).
  30. Schumann, G.J.; Brakenridge, G.R.; Kettner, A.J.; Kashif, R.; Niebuhr, E. Assisting Flood Disaster Response with Earth Observation Data and Products: A Critical Assessment. Remote Sens. 2018, 10, 1230. [Google Scholar] [CrossRef]
  31. Zeng, Z.; Guan, D.; Steenge, A.E.; Xia, Y.; Mendoza-Tinoco, D. Flood Footprint Assessment: A New Approach for Flood-Induced Indirect Economic Impact Measurement and Post-Flood Recovery. J. Hydrol. 2019, 579, 124204. [Google Scholar] [CrossRef]
  32. Jian, W.; Li, S.; Lai, C.; Wang, Z.; Cheng, X.; Lo, E.Y.-M.; Pan, T.-C. Evaluating Pluvial Flood Hazard for Highly Urbanised Cities: A Case Study of the Pearl River Delta Region in China. Nat. Hazard. 2021, 105, 1691–1719. [Google Scholar] [CrossRef]
  33. Zhu, L.; He, S.; Qin, H.; He, W.; Zhang, H.; Zhang, Y.; Jian, J.; Li, J.; Su, P. Analyzing the Multi-Hazard Chain Induced by a Debris Flow in Xiaojinchuan River, Sichuan, China. Eng. Geol. 2021, 293, 106280. [Google Scholar] [CrossRef]
  34. Lan, H.; Peng, J.; Zhu, Y.; Li, L.; Pan, B.; Huang, Q.; Li, J.; Zhang, Q. Research on Geological and Surfacial Processes and Major Disaster Effects in the Yellow River Basin. Sci. China Earth Sci. 2022, 65, 234–256. [Google Scholar] [CrossRef]
  35. Jones, E.; Botterell, A. Common Alerting Protocol, Version 1.1; OASIS: Burlington, MA, USA, 2005.
  36. Raymond, M.; Webb, S.; Aymond, P. Emergency Data Exchange Language (EDXL) Distribution Element, Version 1.0; OASIS: Burlington, MA, USA, 2006.
  37. Aymond, P.; Brooks, R.; Grapes, T.; Ham, G.; Iannella, R.; Robinson, K.; Joerg, W.; Triglia, A. Emergency Data Exchange Language Resource Messaging (EDXL-RM), Version 1.0; OASIS: Burlington, MA, USA, 2009.
  38. Iannella, R.; Robinson, K. Tsunami Warning Markup Language (TWML), Version 1.0; National ICT Australia: Sydney, Australia, 2006.
  39. Babaie, H.A.; Babaei, A. Developing the Earthquake Markup Language and Database with UML and XML Schema. Comput. Geosci. 2005, 31, 1175–1200. [Google Scholar] [CrossRef]
  40. Xiang, Z.; Demir, I. Flood Markup Language—A Standards-Based Exchange Language for Flood Risk Communication. Environ. Model. Softw. 2022, 152, 105397. [Google Scholar] [CrossRef]
  41. Scherp, A.; Franz, T.; Saathoff, C.; Staab, S. F--A Model of Events Based on the Foundational Ontology Dolce+DnS Ultralight. In Proceedings of the Fifth International Conference on Knowledge Capture, 1 September 2009; Association for Computing Machinery: New York, NY, USA, 2009; pp. 137–144. [Google Scholar]
  42. Chen, N.; Zhou, L.; Chen, Z. A Sharable and Efficient Metadata Model for Heterogeneous Earth Observation Data Retrieval in Multi-Scale Flood Mapping. Remote Sens. 2015, 7, 9610–9631. [Google Scholar] [CrossRef]
  43. Chen, N.; Hu, C. A Sharable and Interoperable Meta-Model for Atmospheric Satellite Sensors and Observations. IEEE J. Sel. Top. Appl. Earth Obs. Remote Sens. 2012, 5, 1519–1530. [Google Scholar] [CrossRef]
  44. Sun, Z.; Yue, P.; Lu, X.; Zhai, X.; Hu, L. A Task Ontology Driven Approach for Live Geoprocessing in a Service-Oriented Environment. Trans. GIS 2012, 16, 867–884. [Google Scholar] [CrossRef]
  45. Atkinson, C.; Kuhne, T. Model-Driven Development: A Metamodeling Foundation. IEEE Softw. 2003, 20, 36–41. [Google Scholar] [CrossRef]
  46. Portele, C. OpenGIS Geography Markup Language (GML) Encoding Standard, Version 3.2.1 (OGC 07-036); Open Geospatial Consortium: Wayland, MA, USA, 2007.
  47. Botts, M.; Robin, A. OGC® SensorML: Model and XML Encoding Standard. OGC Encoding Standard, Version 2.0; Open Geospatial Consortium: Wayland, MA, USA, 2014.
  48. Robin, A. SWE Common Data Model, Encoding Standard, Version 2.0 (OGC 08-094r1); Open Geospatial Consortium: Wayland, MA, USA, 2010.
  49. Donlon, C.; Berruti, B.; Buongiorno, A.; Ferreira, M.-H.; Féménias, P.; Frerick, J.; Goryl, P.; Klein, U.; Laur, H.; Mavrocordatos, C.; et al. The Global Monitoring for Environment and Security (GMES) Sentinel-3 Mission. Remote Sens. Environ. 2012, 120, 37–57. [Google Scholar] [CrossRef]
Figure 1. Metamodel framework of earth observation task representation. EO task instances are represented at multiple levels by corresponding specific metadata collection types. A standard representation model of the EO task is constructed based on the EO task metamodel.
Remotesensing 15 02193 g001
Figure 2. Earth observation task representation of the metamodeling architecture.
Remotesensing 15 02193 g002
Figure 3. Full life cycle of an earth observation task.
Remotesensing 15 02193 g003
Figure 4. UML diagram for earth observation task metadata contents. (1..*: at least one instance, 0..*: zero or more instances).
Remotesensing 15 02193 g004
Figure 5. Mapping of the earth observation task contents to existing standard data types.
Remotesensing 15 02193 g005
Figure 6. Prototype of system architecture.
Remotesensing 15 02193 g006
Figure 7. Main interface of the prototype system.
Remotesensing 15 02193 g007
Figure 8. Interface of earth observation task modeling.
Remotesensing 15 02193 g008
Figure 9. Experimental scenario. (a,b) Study area and (c) rainfall and water level variation at the Hankou Hydrological Station.
Remotesensing 15 02193 g009
Figure 10. Segments of earth observation task representation instances (part). (a) Flood inundation observation task and (b) updated flood inundation observation task (the red circle shows the updated time and space information).
Remotesensing 15 02193 g010
Figure 11. Drag-and-drop modeling visualization of the earth observation task process.
Remotesensing 15 02193 g011
Figure 12. Effect of observation task observation representation model on the observation coverage. (a1,b1) Coverage of unchanged task demands, (a2) observation solution without EObTask after task demand change, (b2) observation solution with EObTask after task demand change.
Remotesensing 15 02193 g012
Figure 13. Comparison of models with and without a task process. (a) Diagram of an earth observation task without a task process and (b) diagram of an earth observation task with a task process.
Remotesensing 15 02193 g013
Table 1. Comparison of task representation of TICSMD and this work.
Task Representation of TICSMDTask Representation of This Work
1Authorized user (AU) describes the observation demands through the user request form (URF).Description of observation demands through a standardized EO task representation model.
2AU needs to resubmit the URF when the observation demand changes with the evolution of the disaster.Observation demands do not need to be resubmitted. The model supports updating the observation space and time through the task process mechanism.
3Supports only AU descriptions of satellite-oriented task demands.The model supports describing the different task demands of satellites, UAVs, and in situ stations.
Table 2. Comparison of flood disaster information models.

ModelsFloodMLFLCNDEMOTChainEObTask
Support Features
Dynamic observation information descriptionפ¤
EO task process description×××
Observation interconnection××
Time-series observation planning×
Notes: √ supported; ¤ partially supported; × unsupported.
Disclaimer/Publisher’s Note: The statements, opinions and data contained in all publications are solely those of the individual author(s) and contributor(s) and not of MDPI and/or the editor(s). MDPI and/or the editor(s) disclaim responsibility for any injury to people or property resulting from any ideas, methods, instructions or products referred to in the content.

