
Characterization of Three Surges of the Kyagar Glacier, Karakoram
 , ,
, ,
Abstract
:1. Introduction
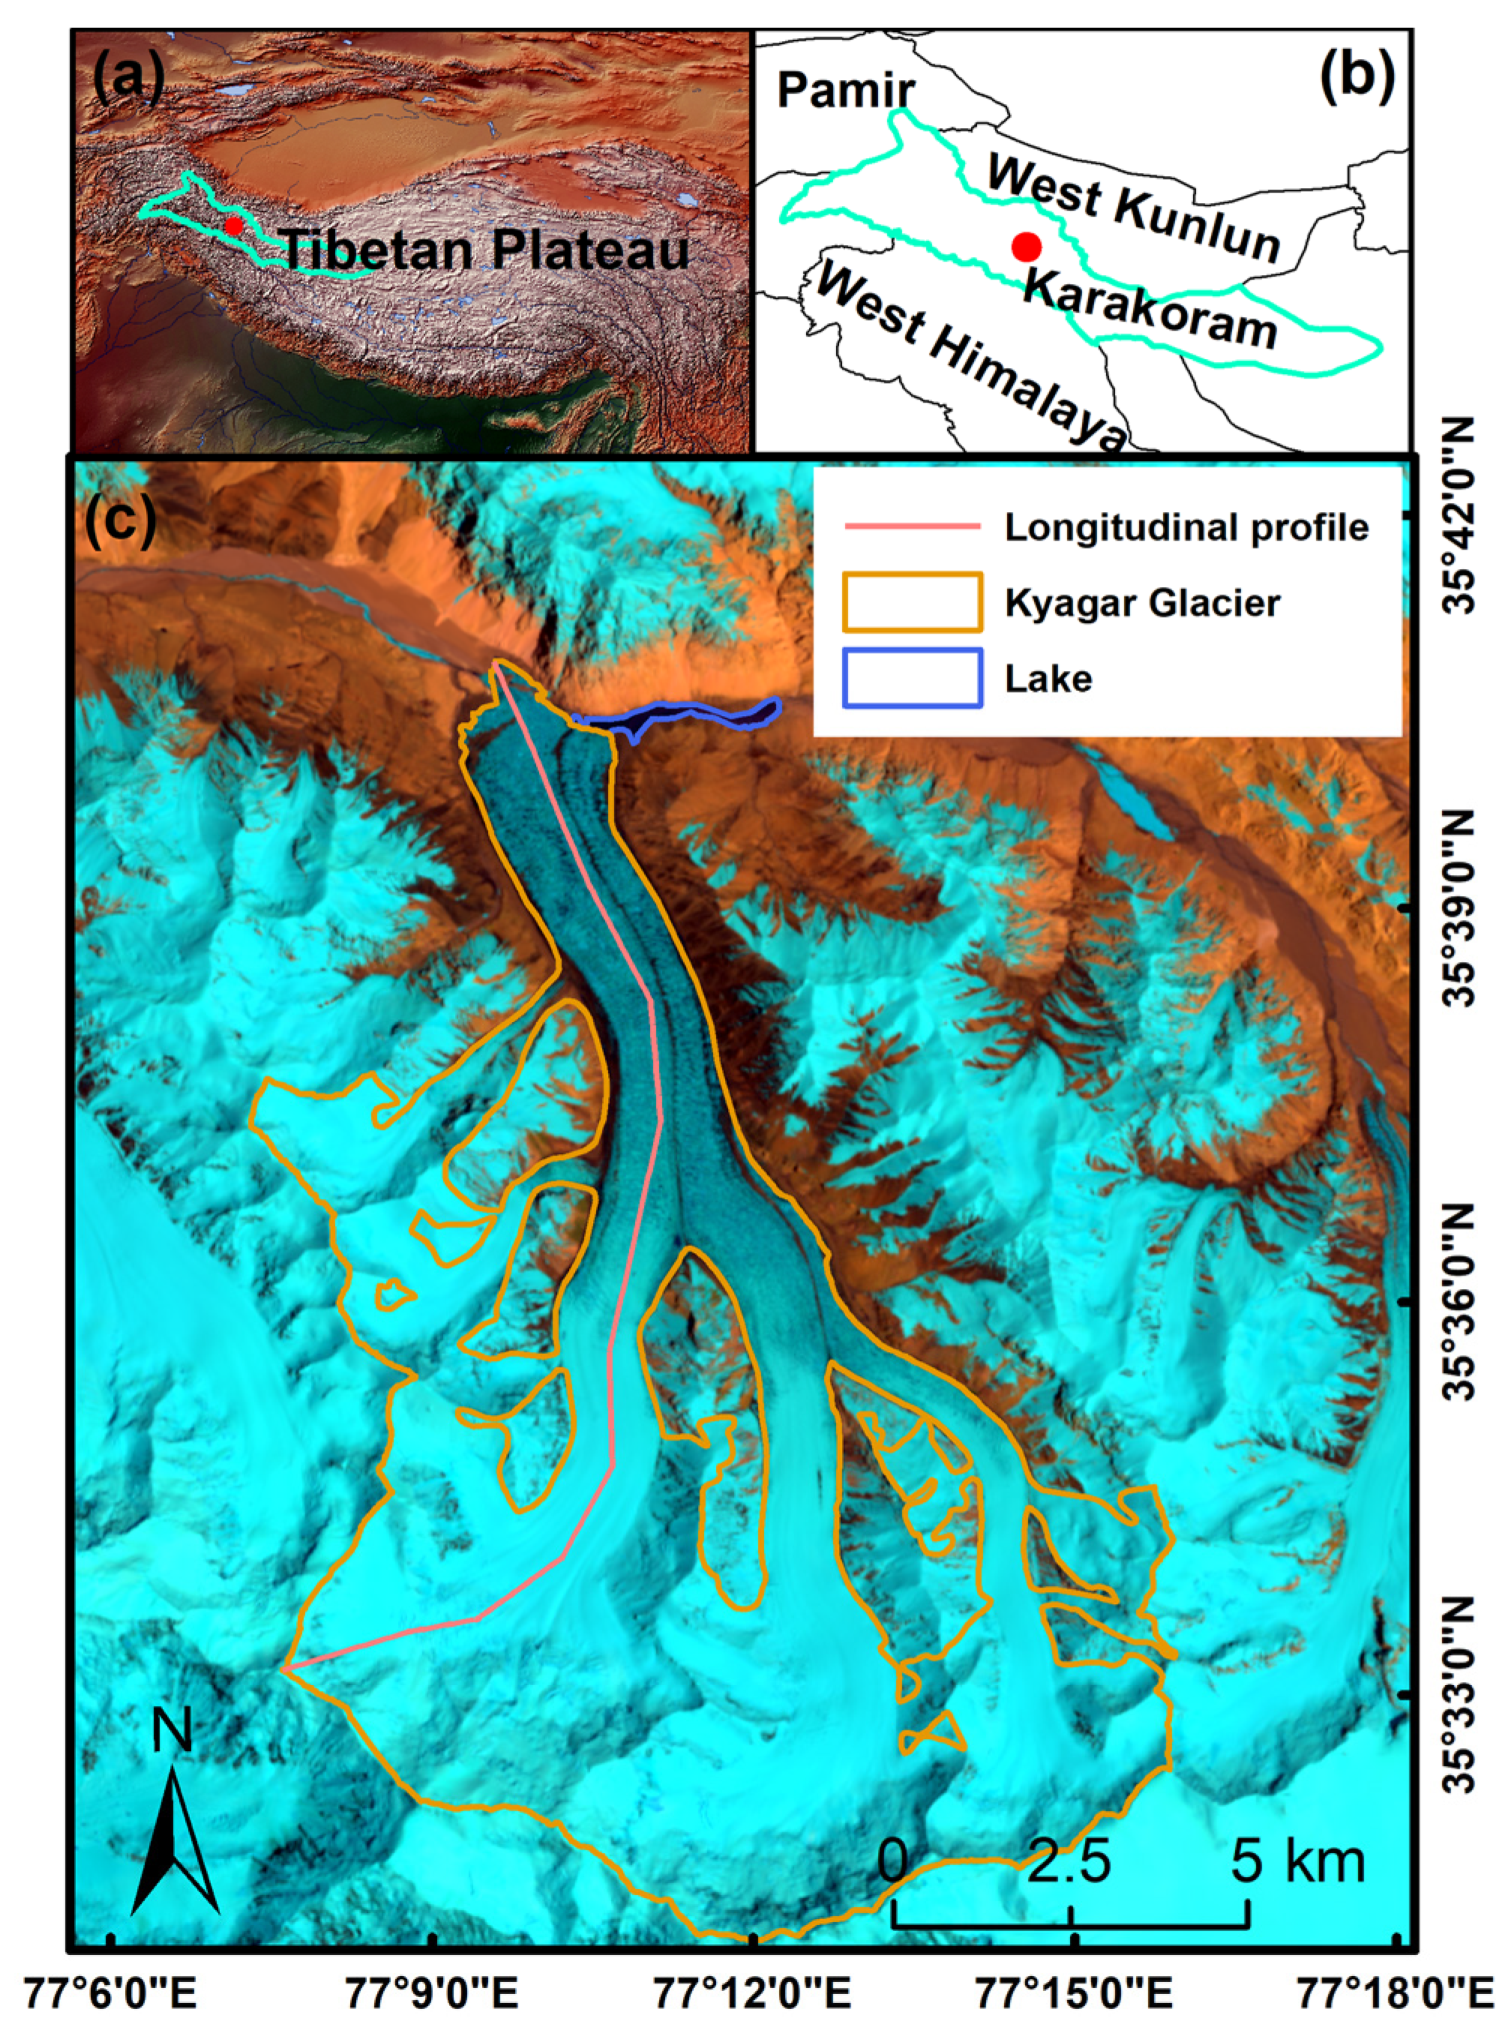
2. Study Site
3. Data and Methods
3.1. Data
3.1.1. Landsat Images
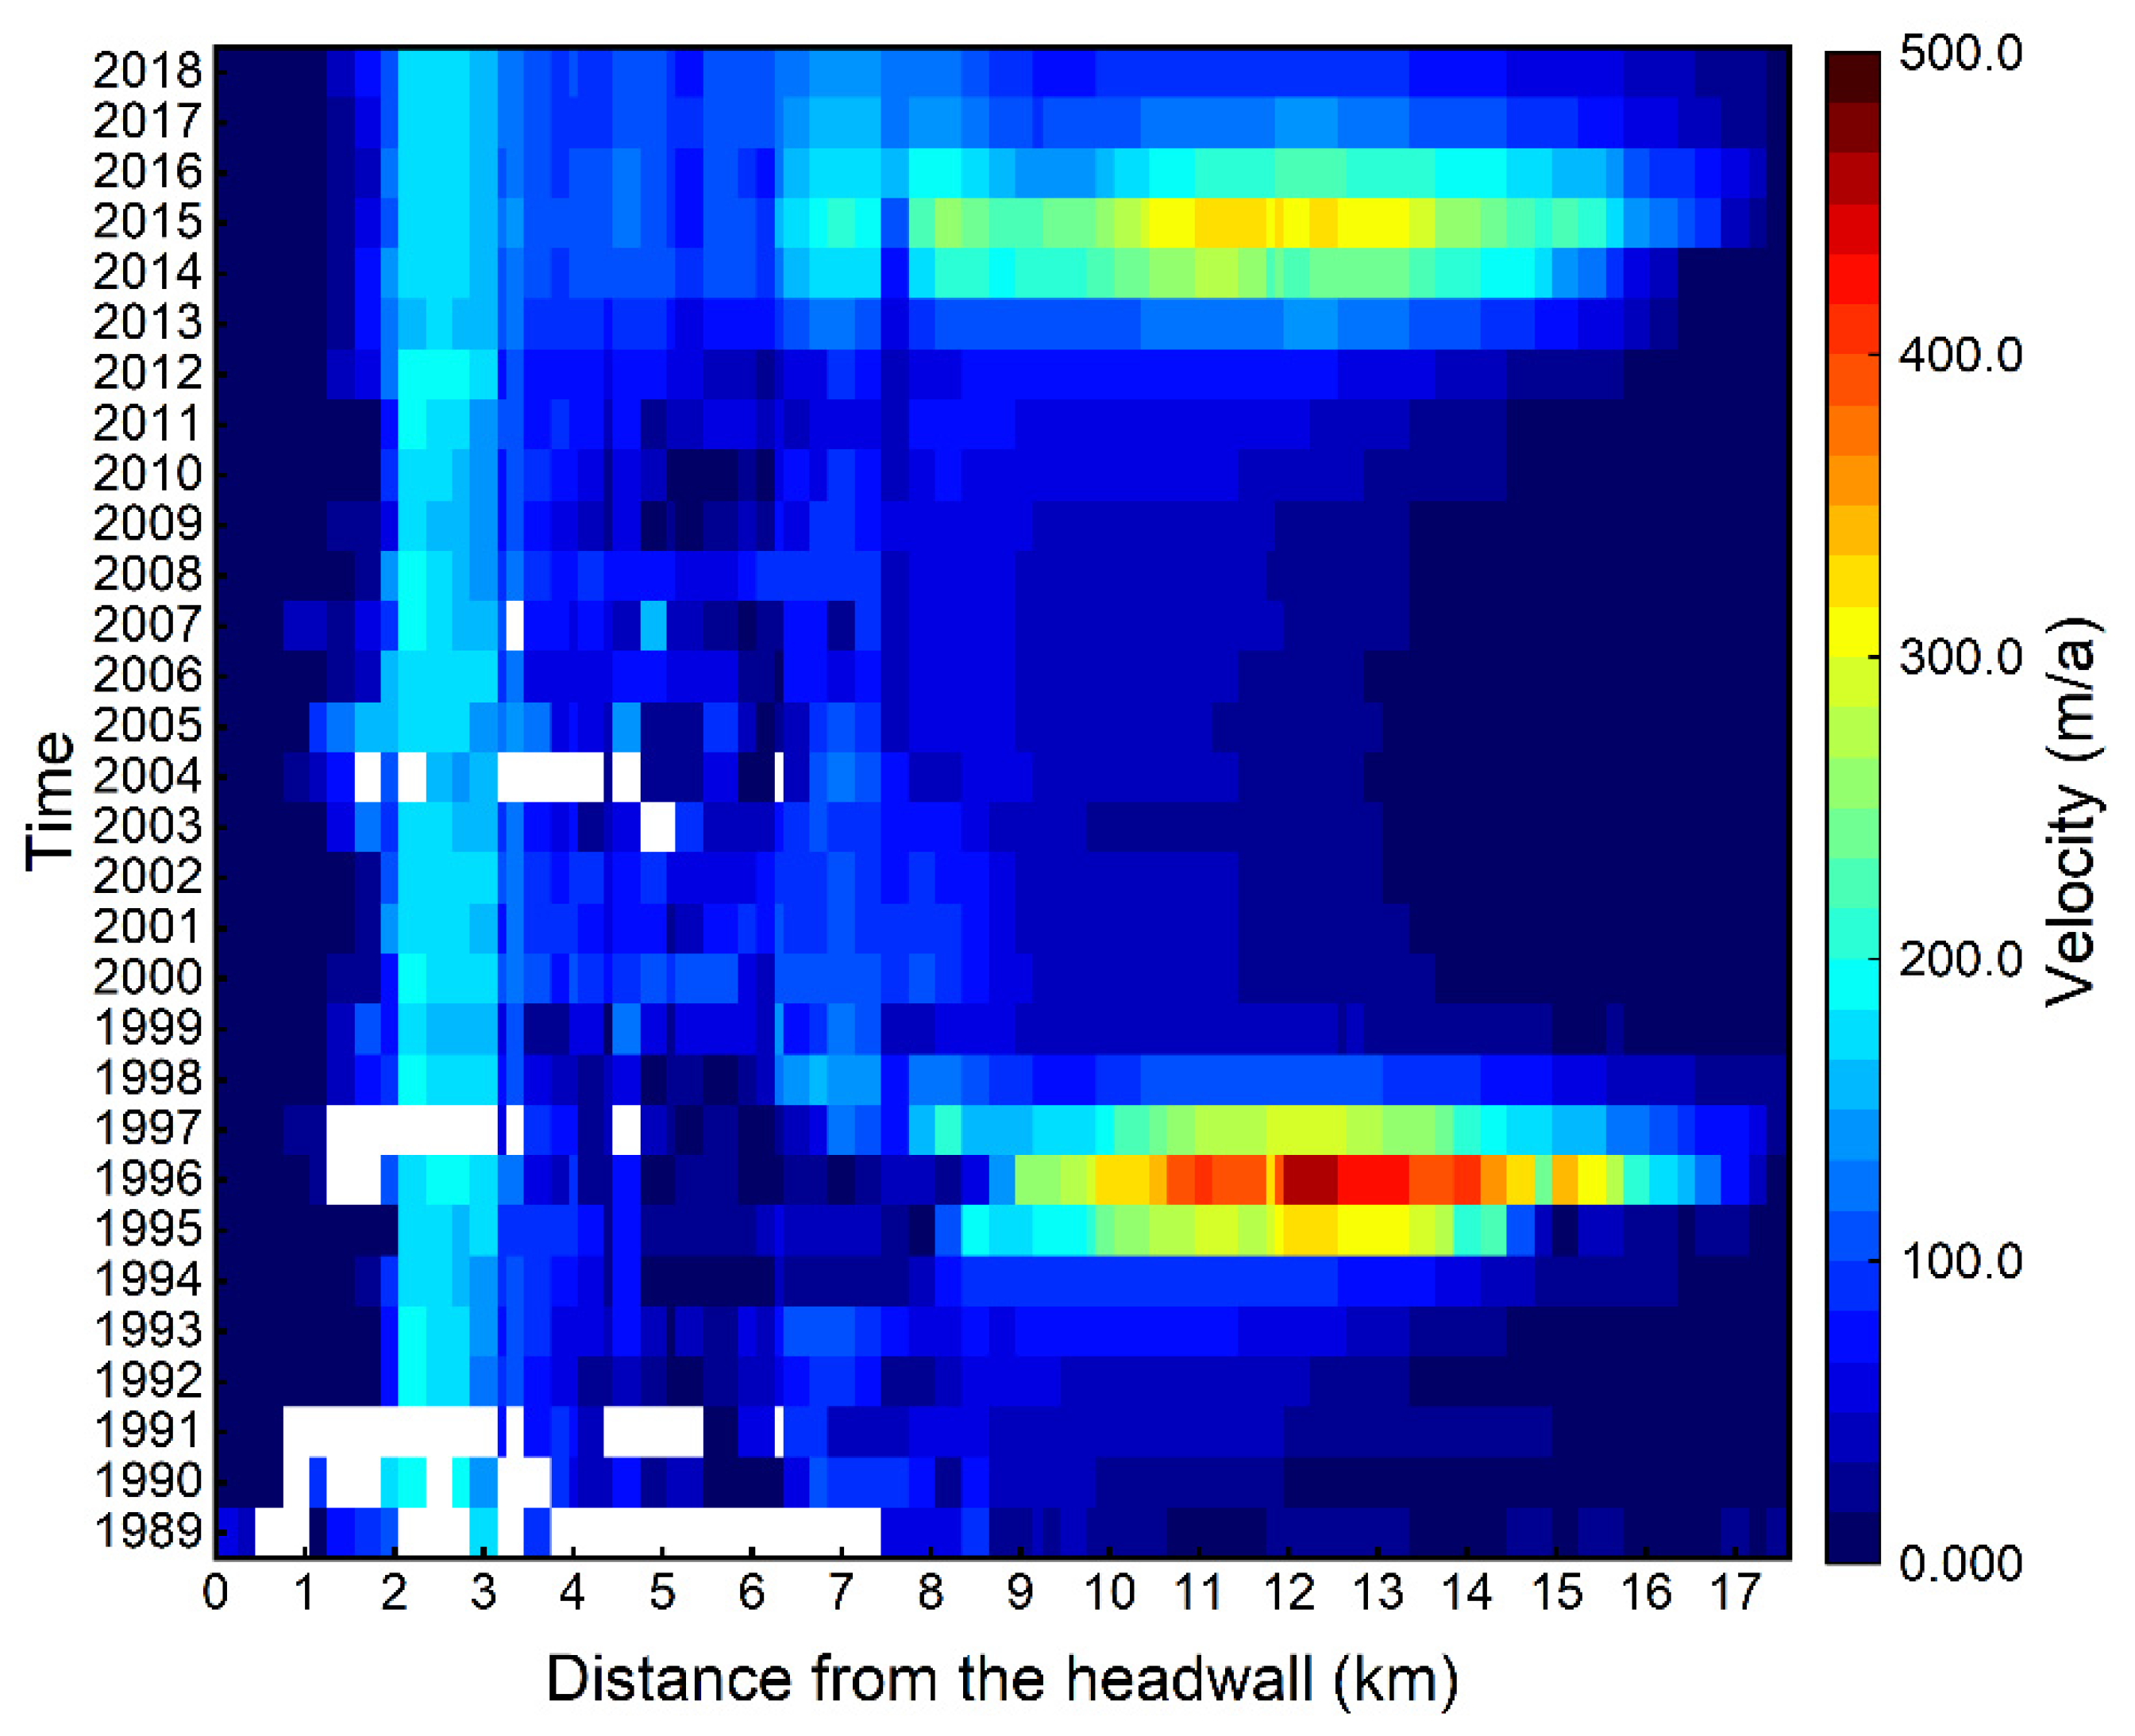
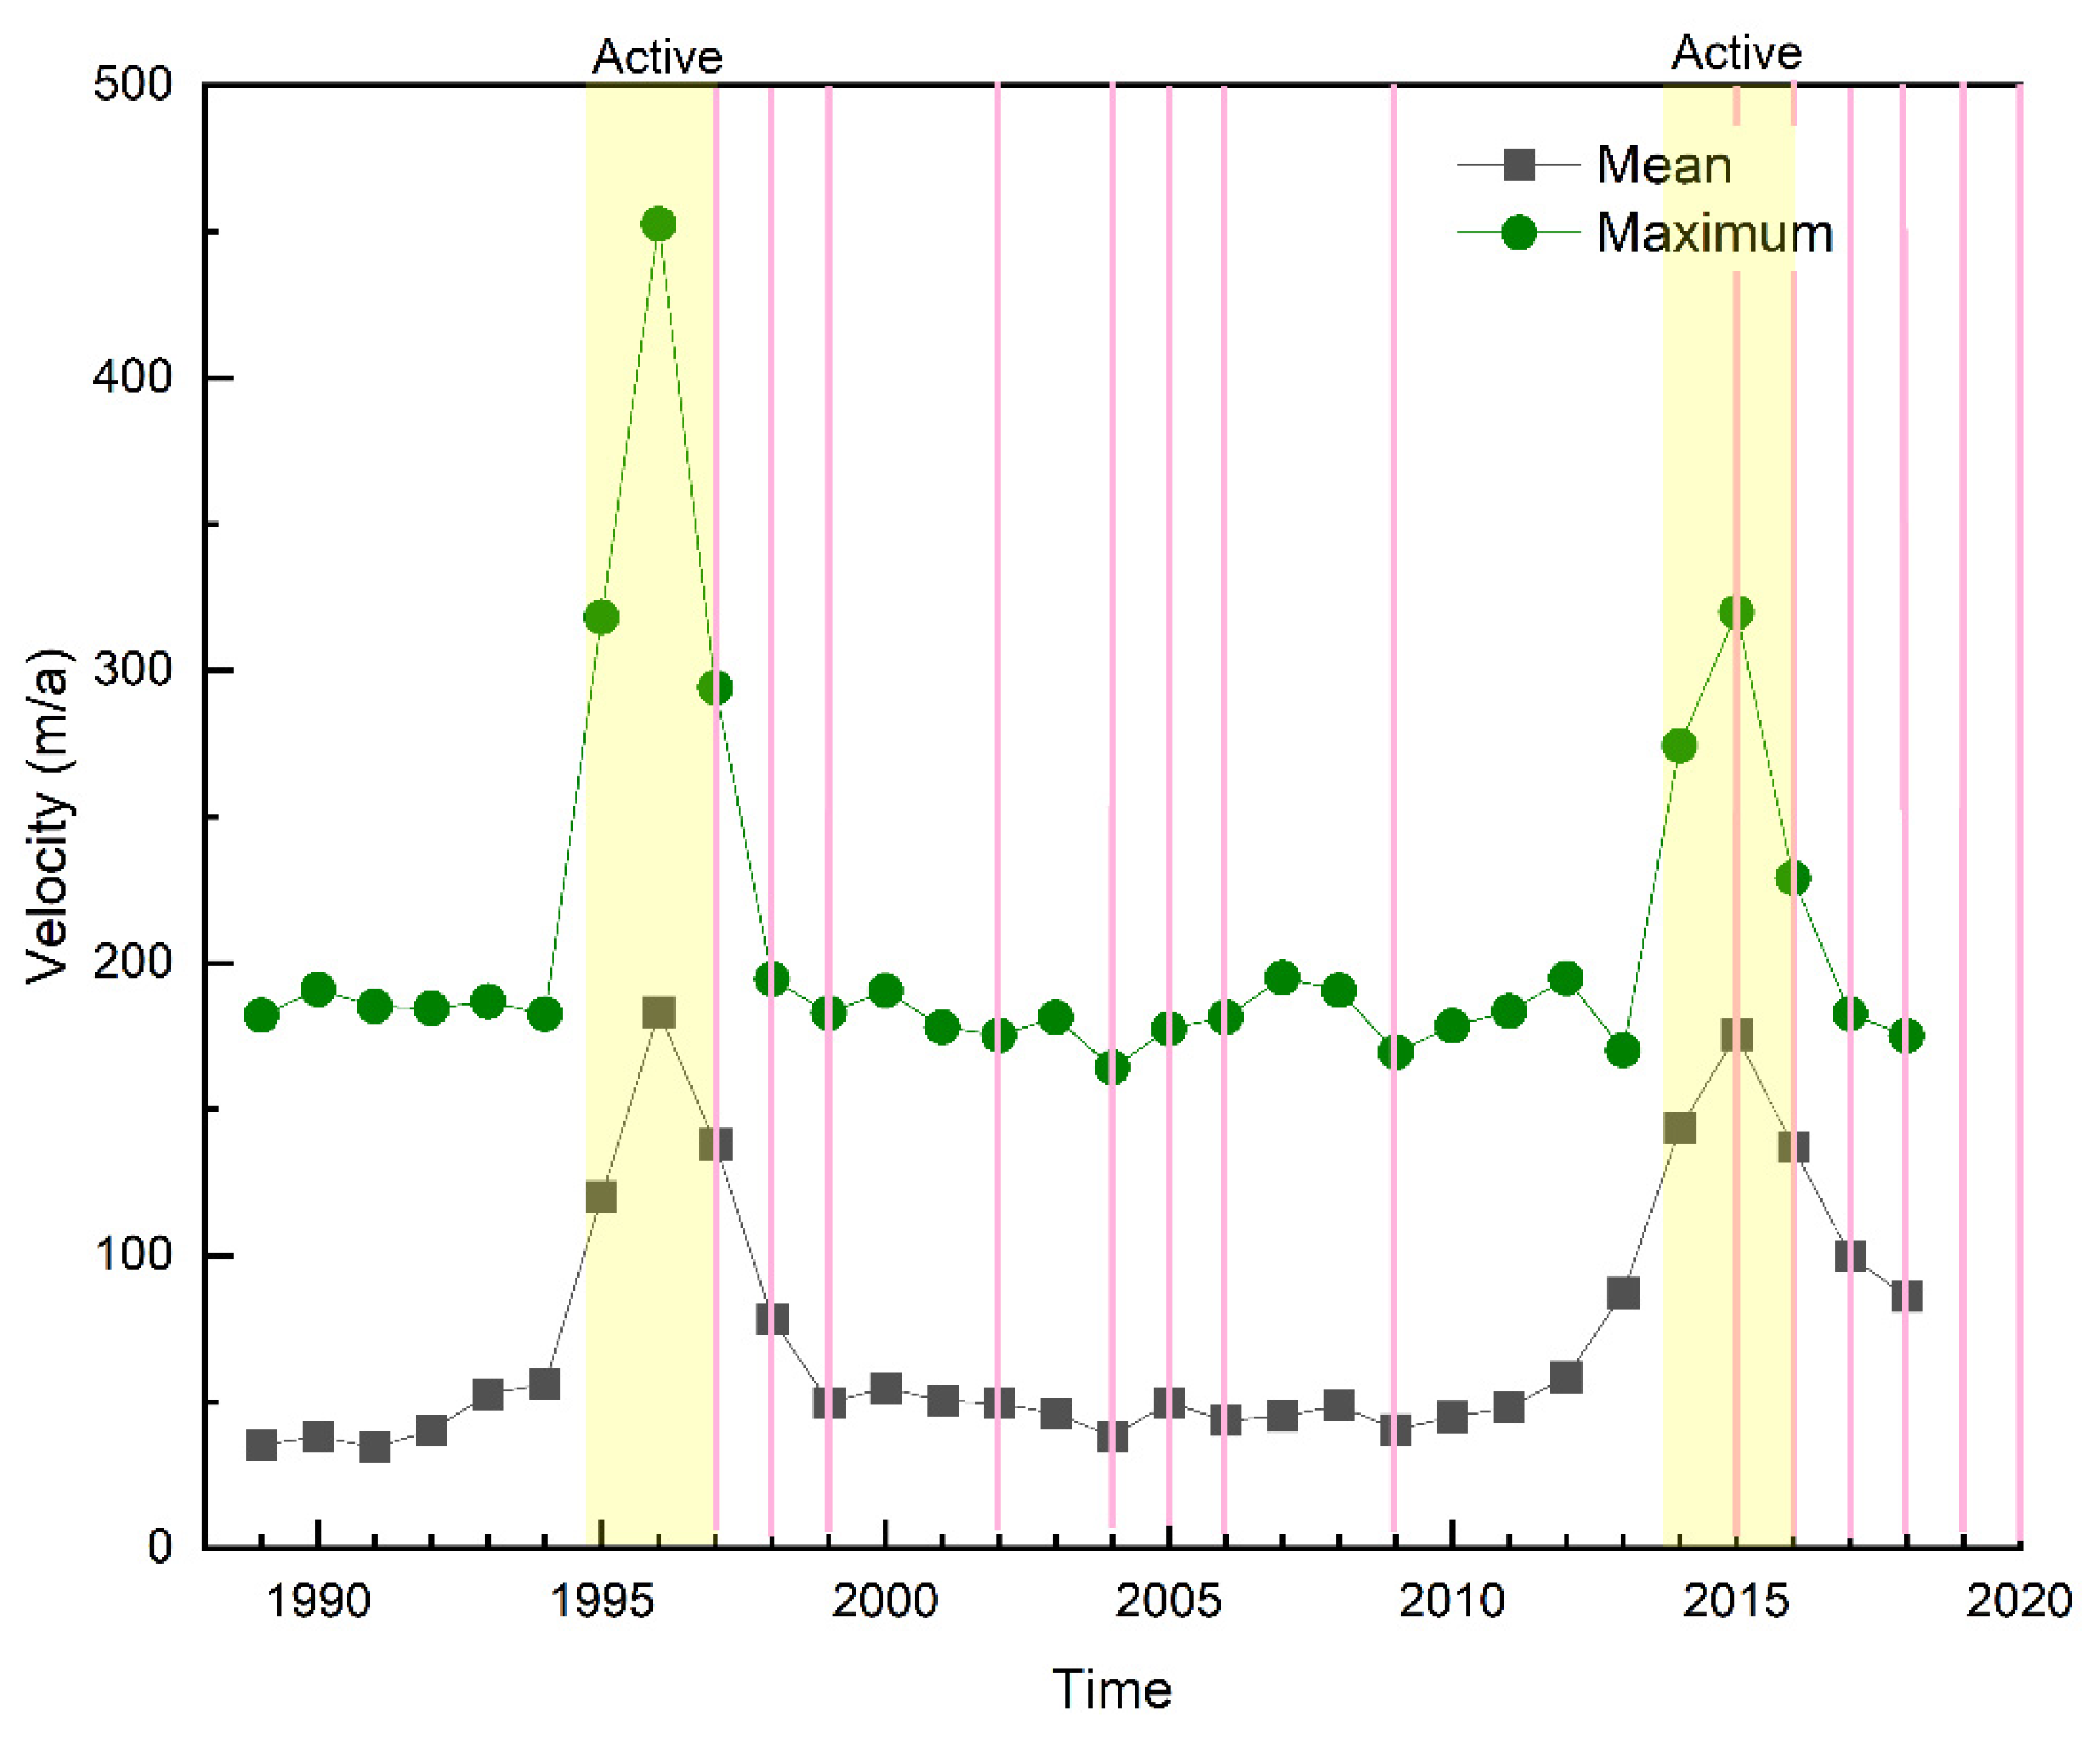
3.1.2. Glacier Surface Velocity Data
3.1.3. TerraSAR-X/TanDEM-X Data
3.1.4. Other Data
3.2. Glacier and Lake Parameter Extraction
3.3. DEM Production and Glacier Elevation Change Estimation
3.4. Uncertainties
3.4.1. Uncertainties in the Glacier Length and Area Changes Estimation
3.4.2. Uncertainty in Glacier Velocity Estimation
3.4.3. Uncertainty in Glacier Elevation Change Estimation
4. Results
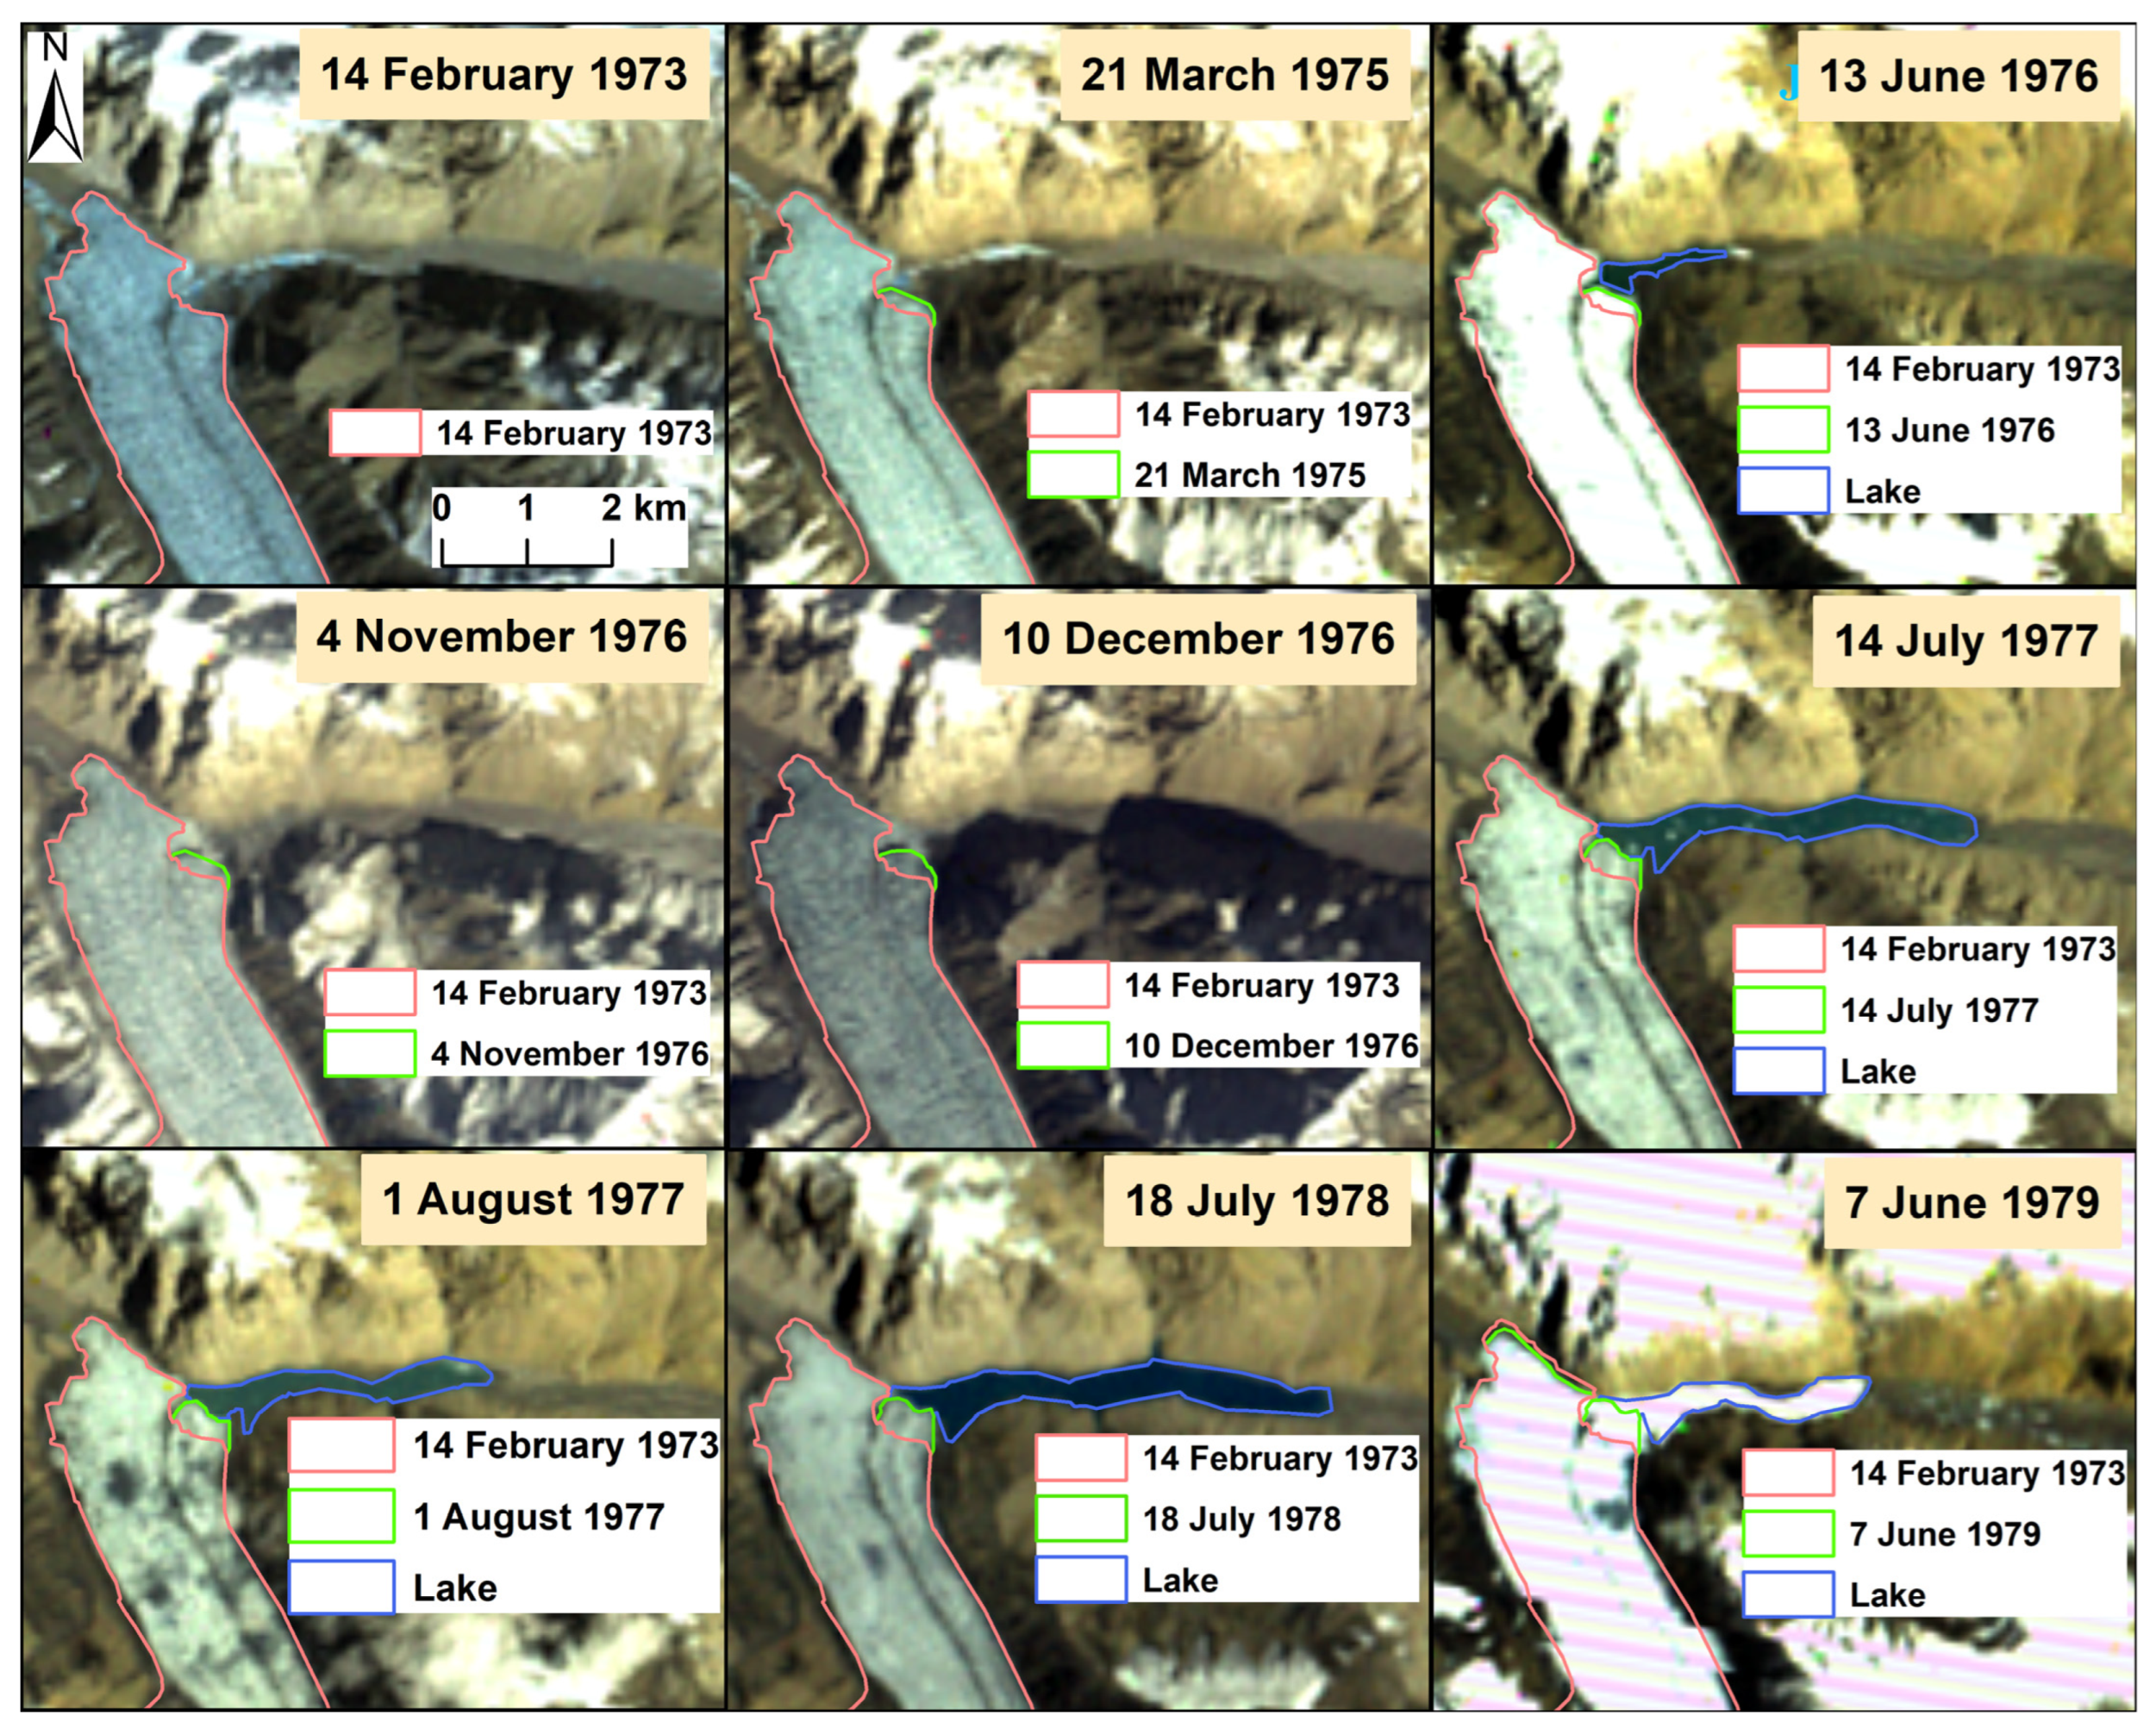
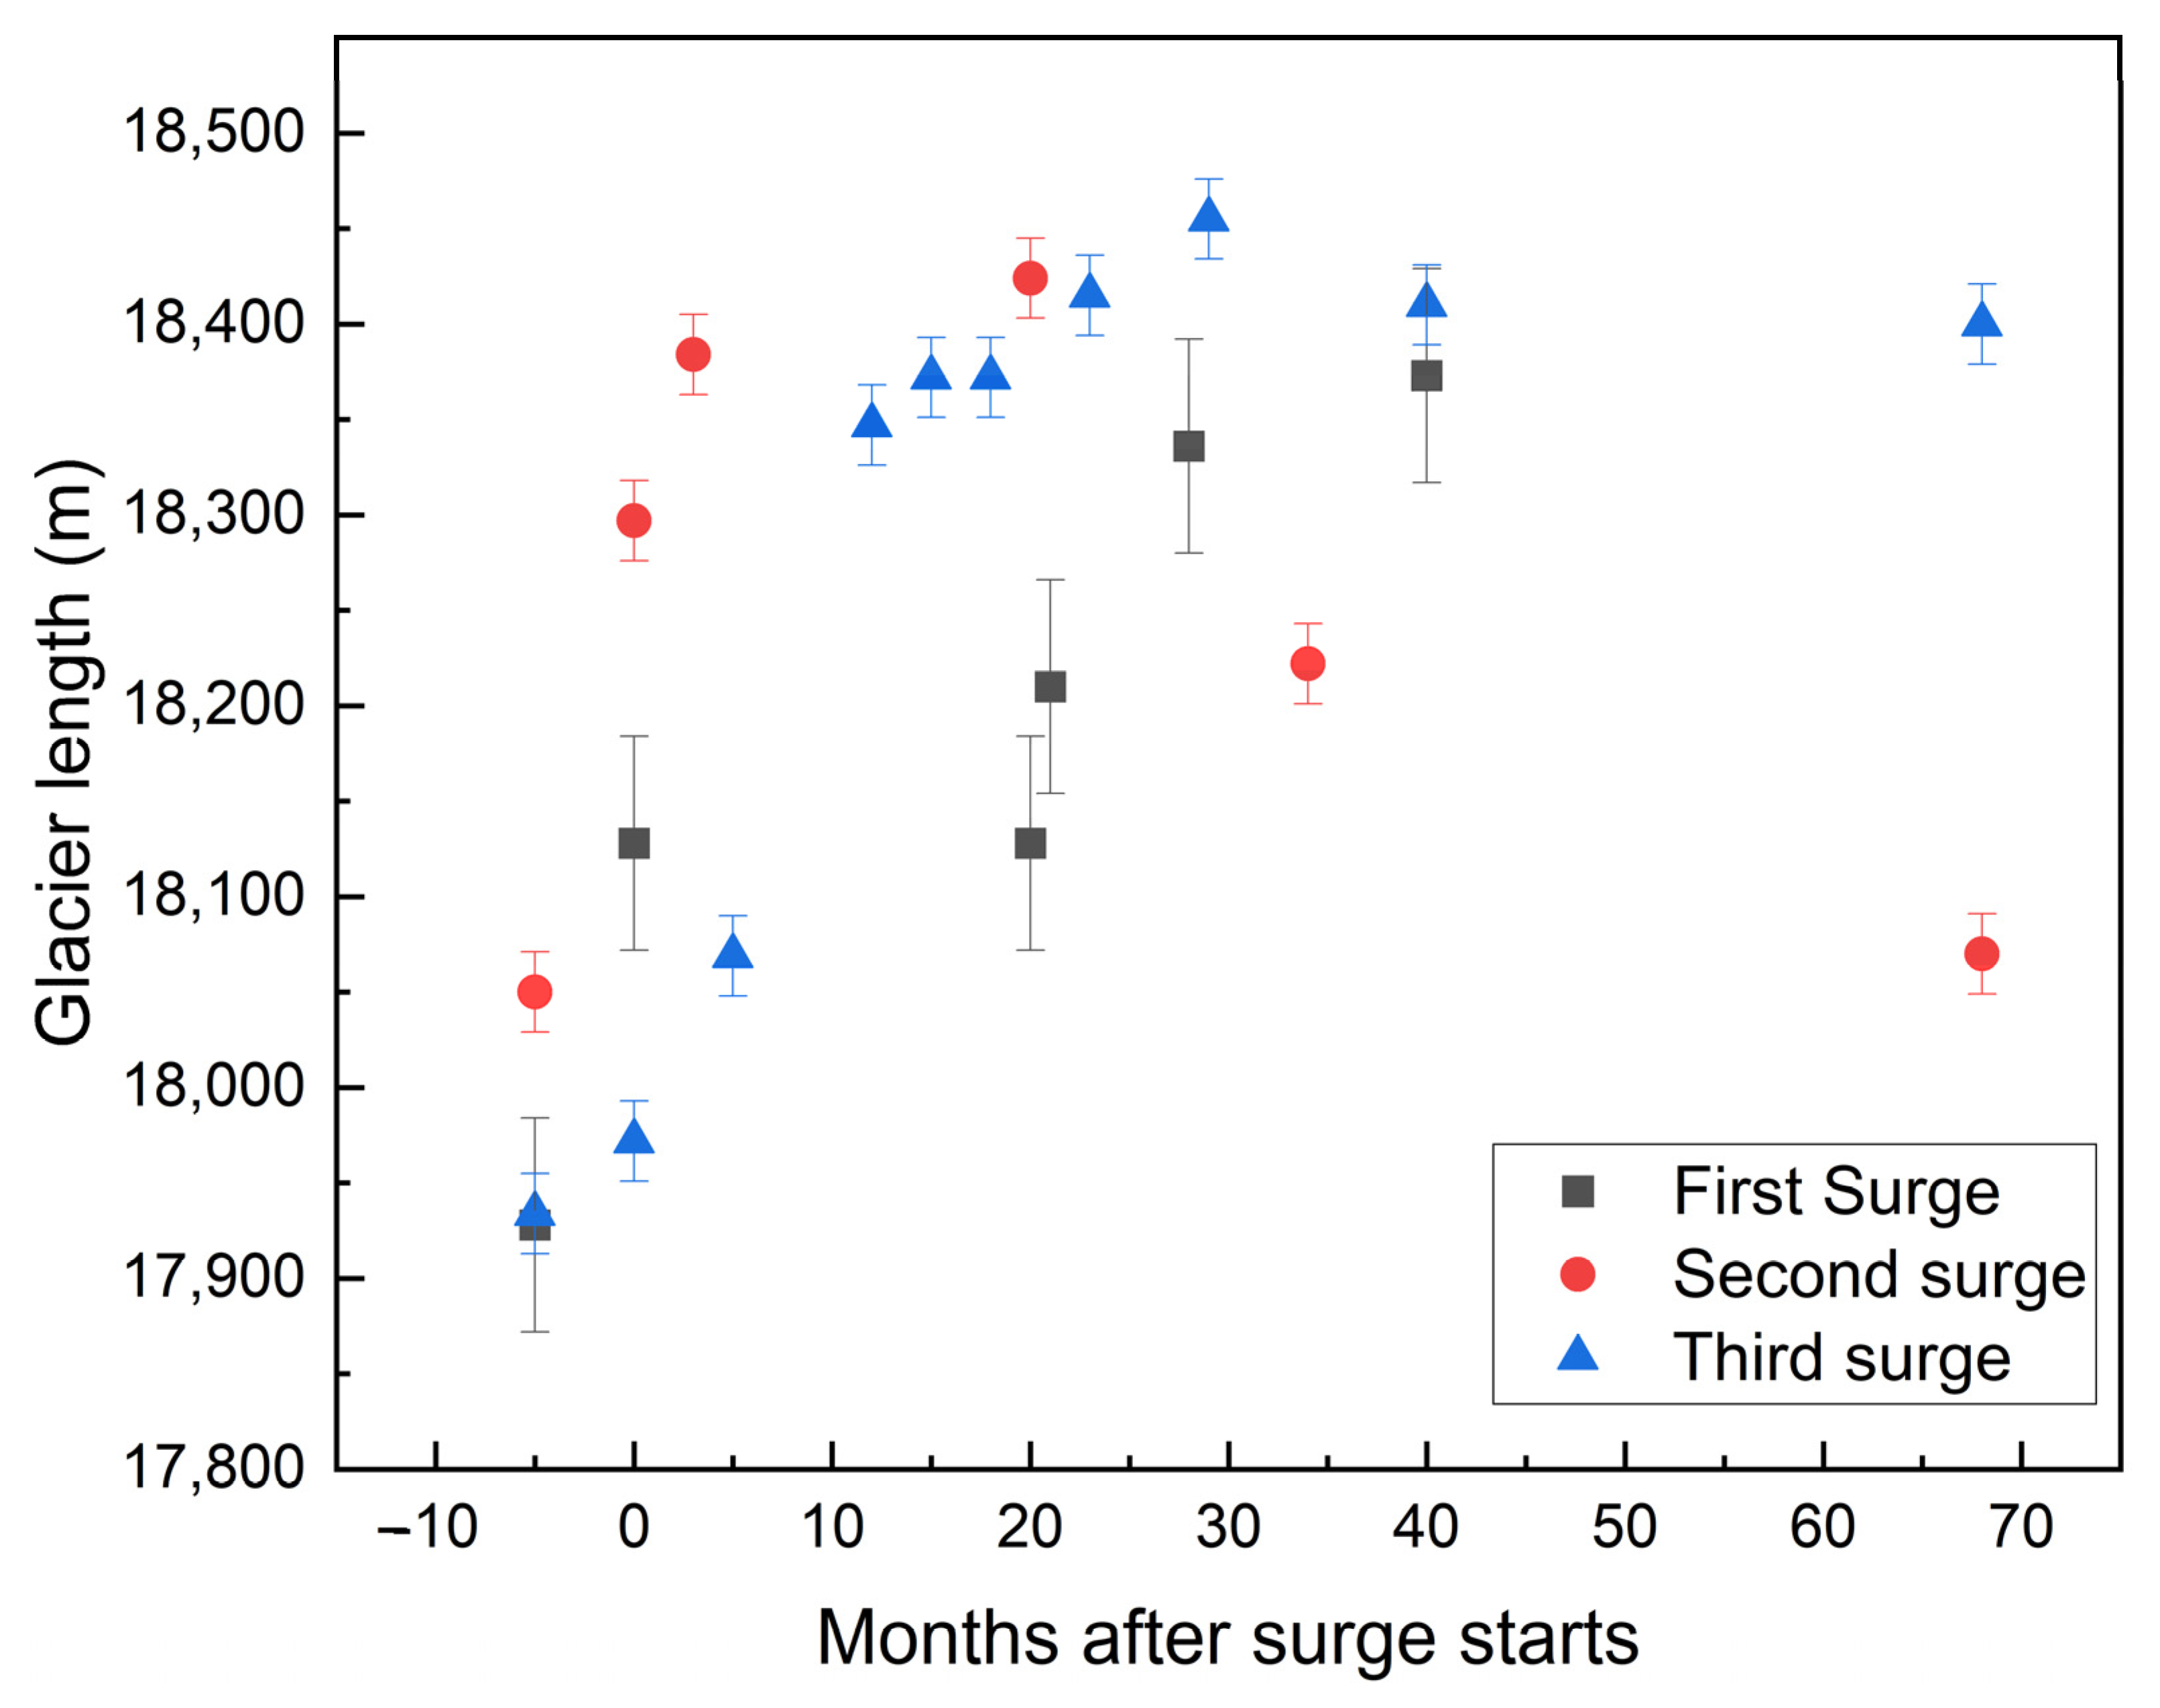
4.1. Glacier Surging during 1975–1978
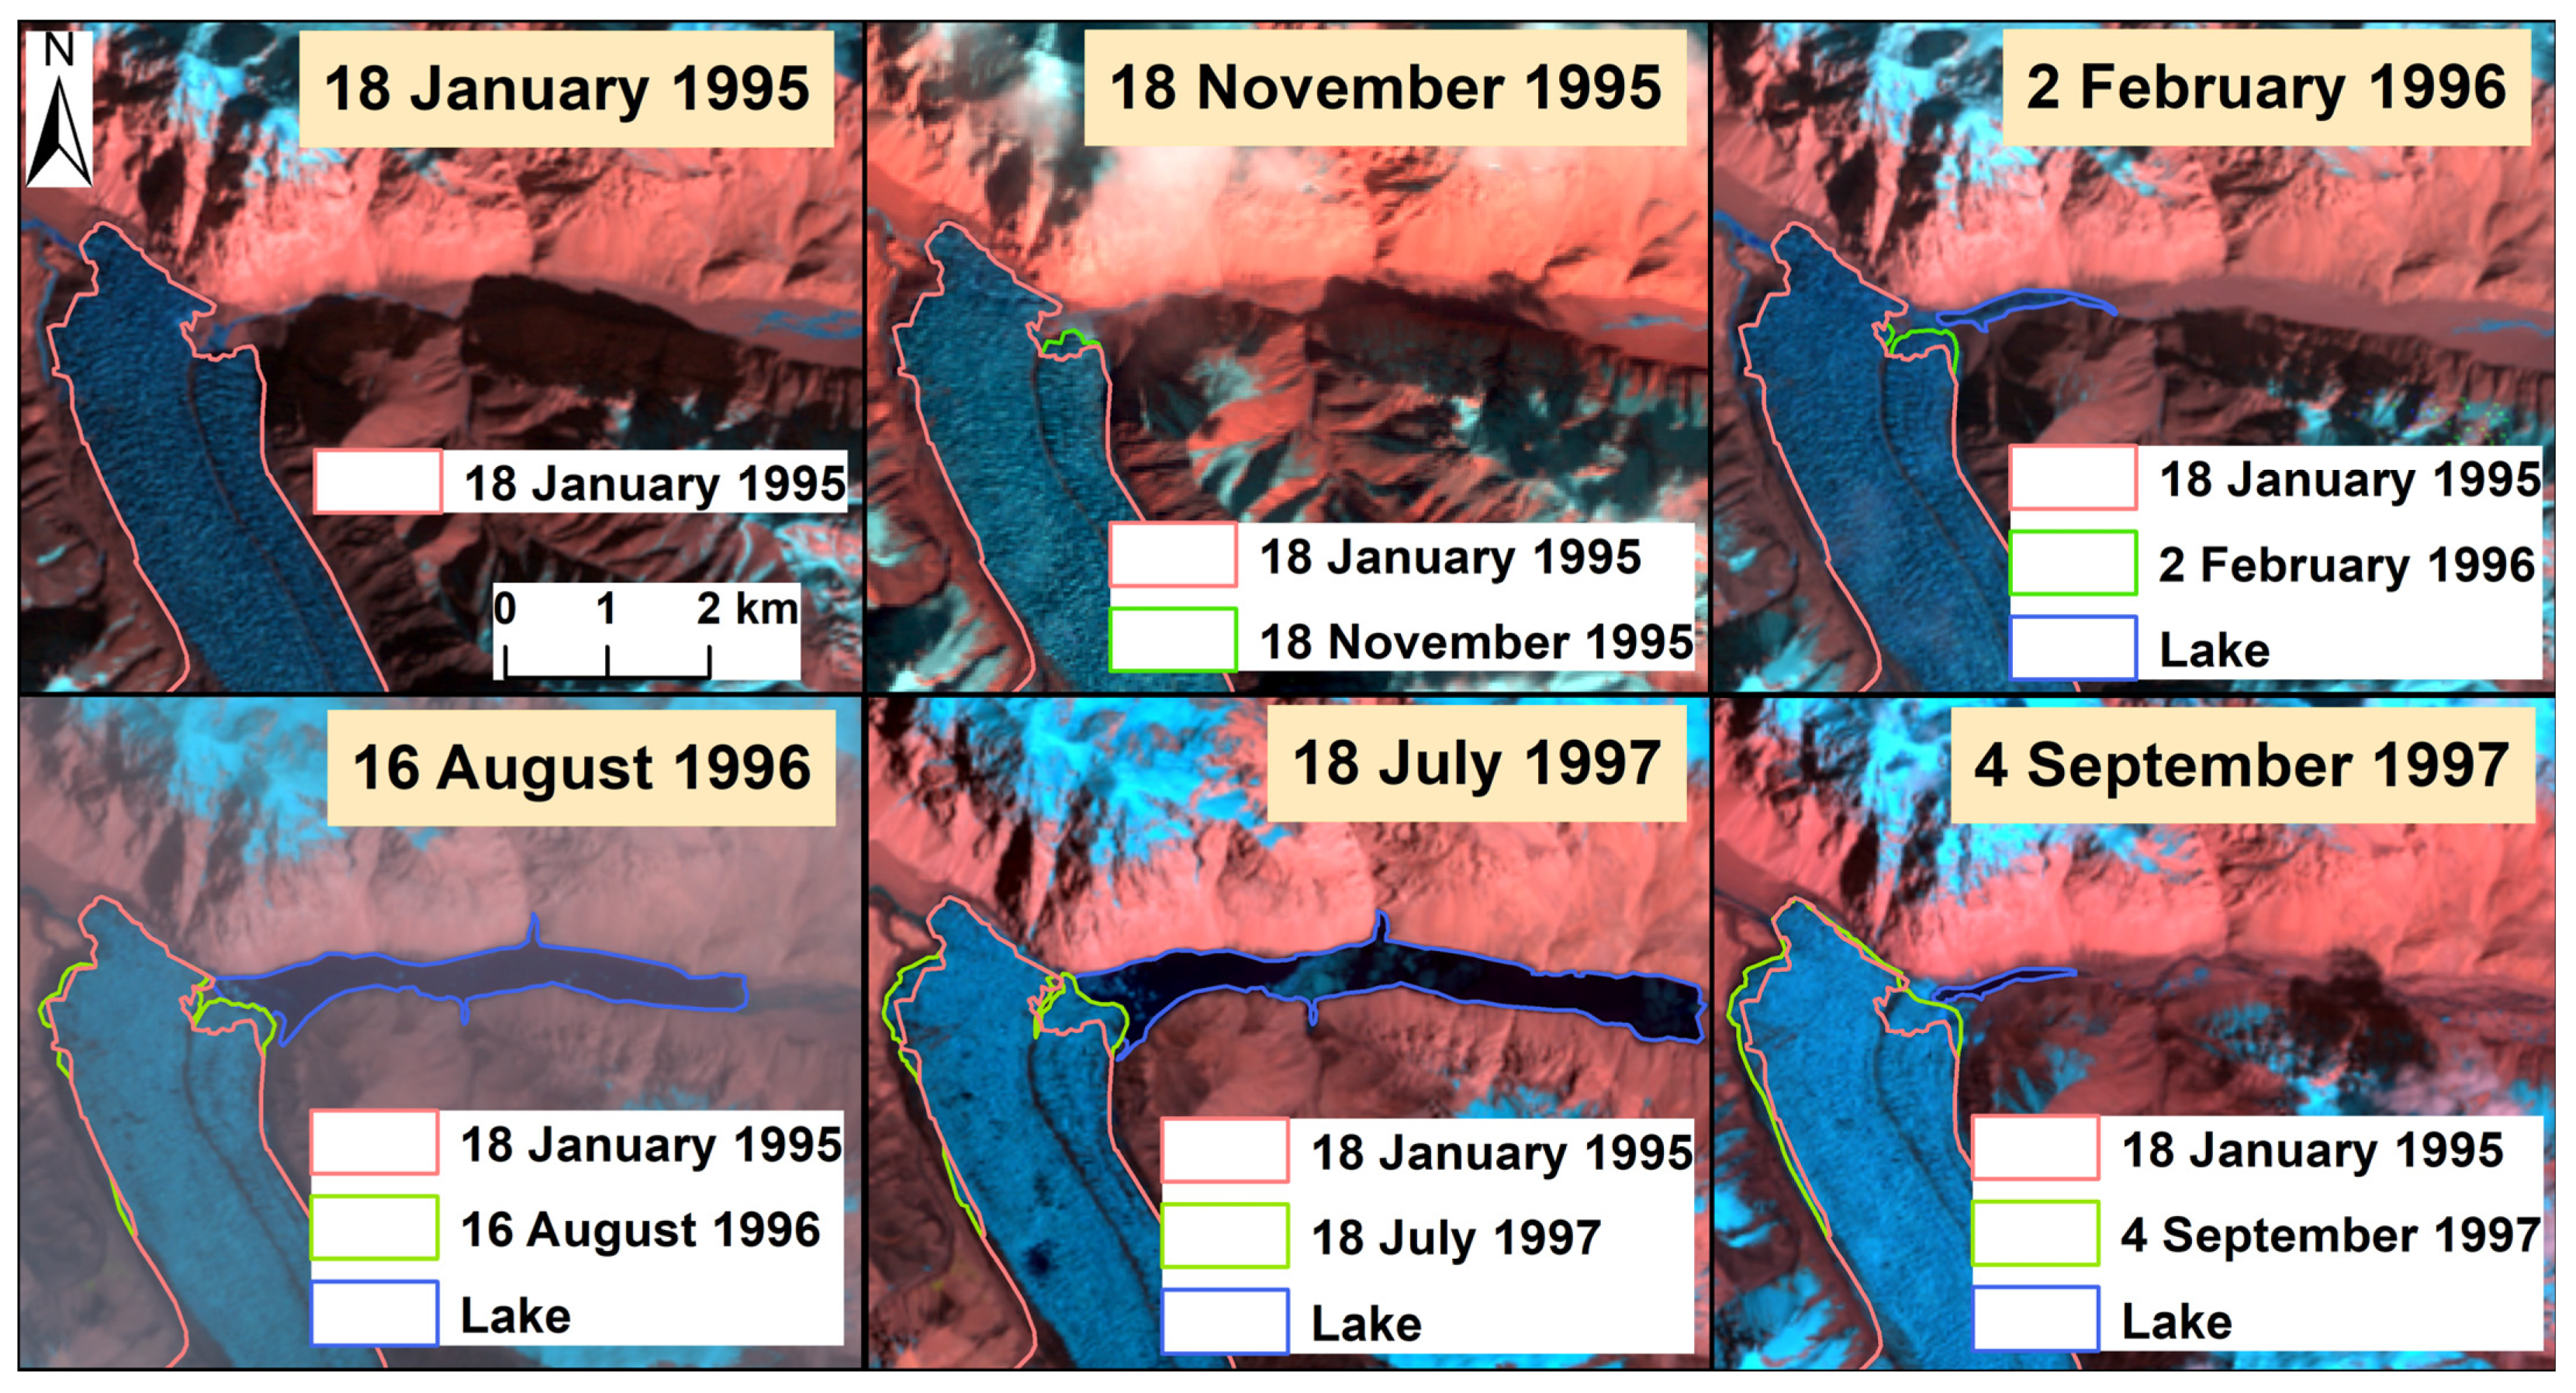
4.2. Glacier Surging during 1995–1997
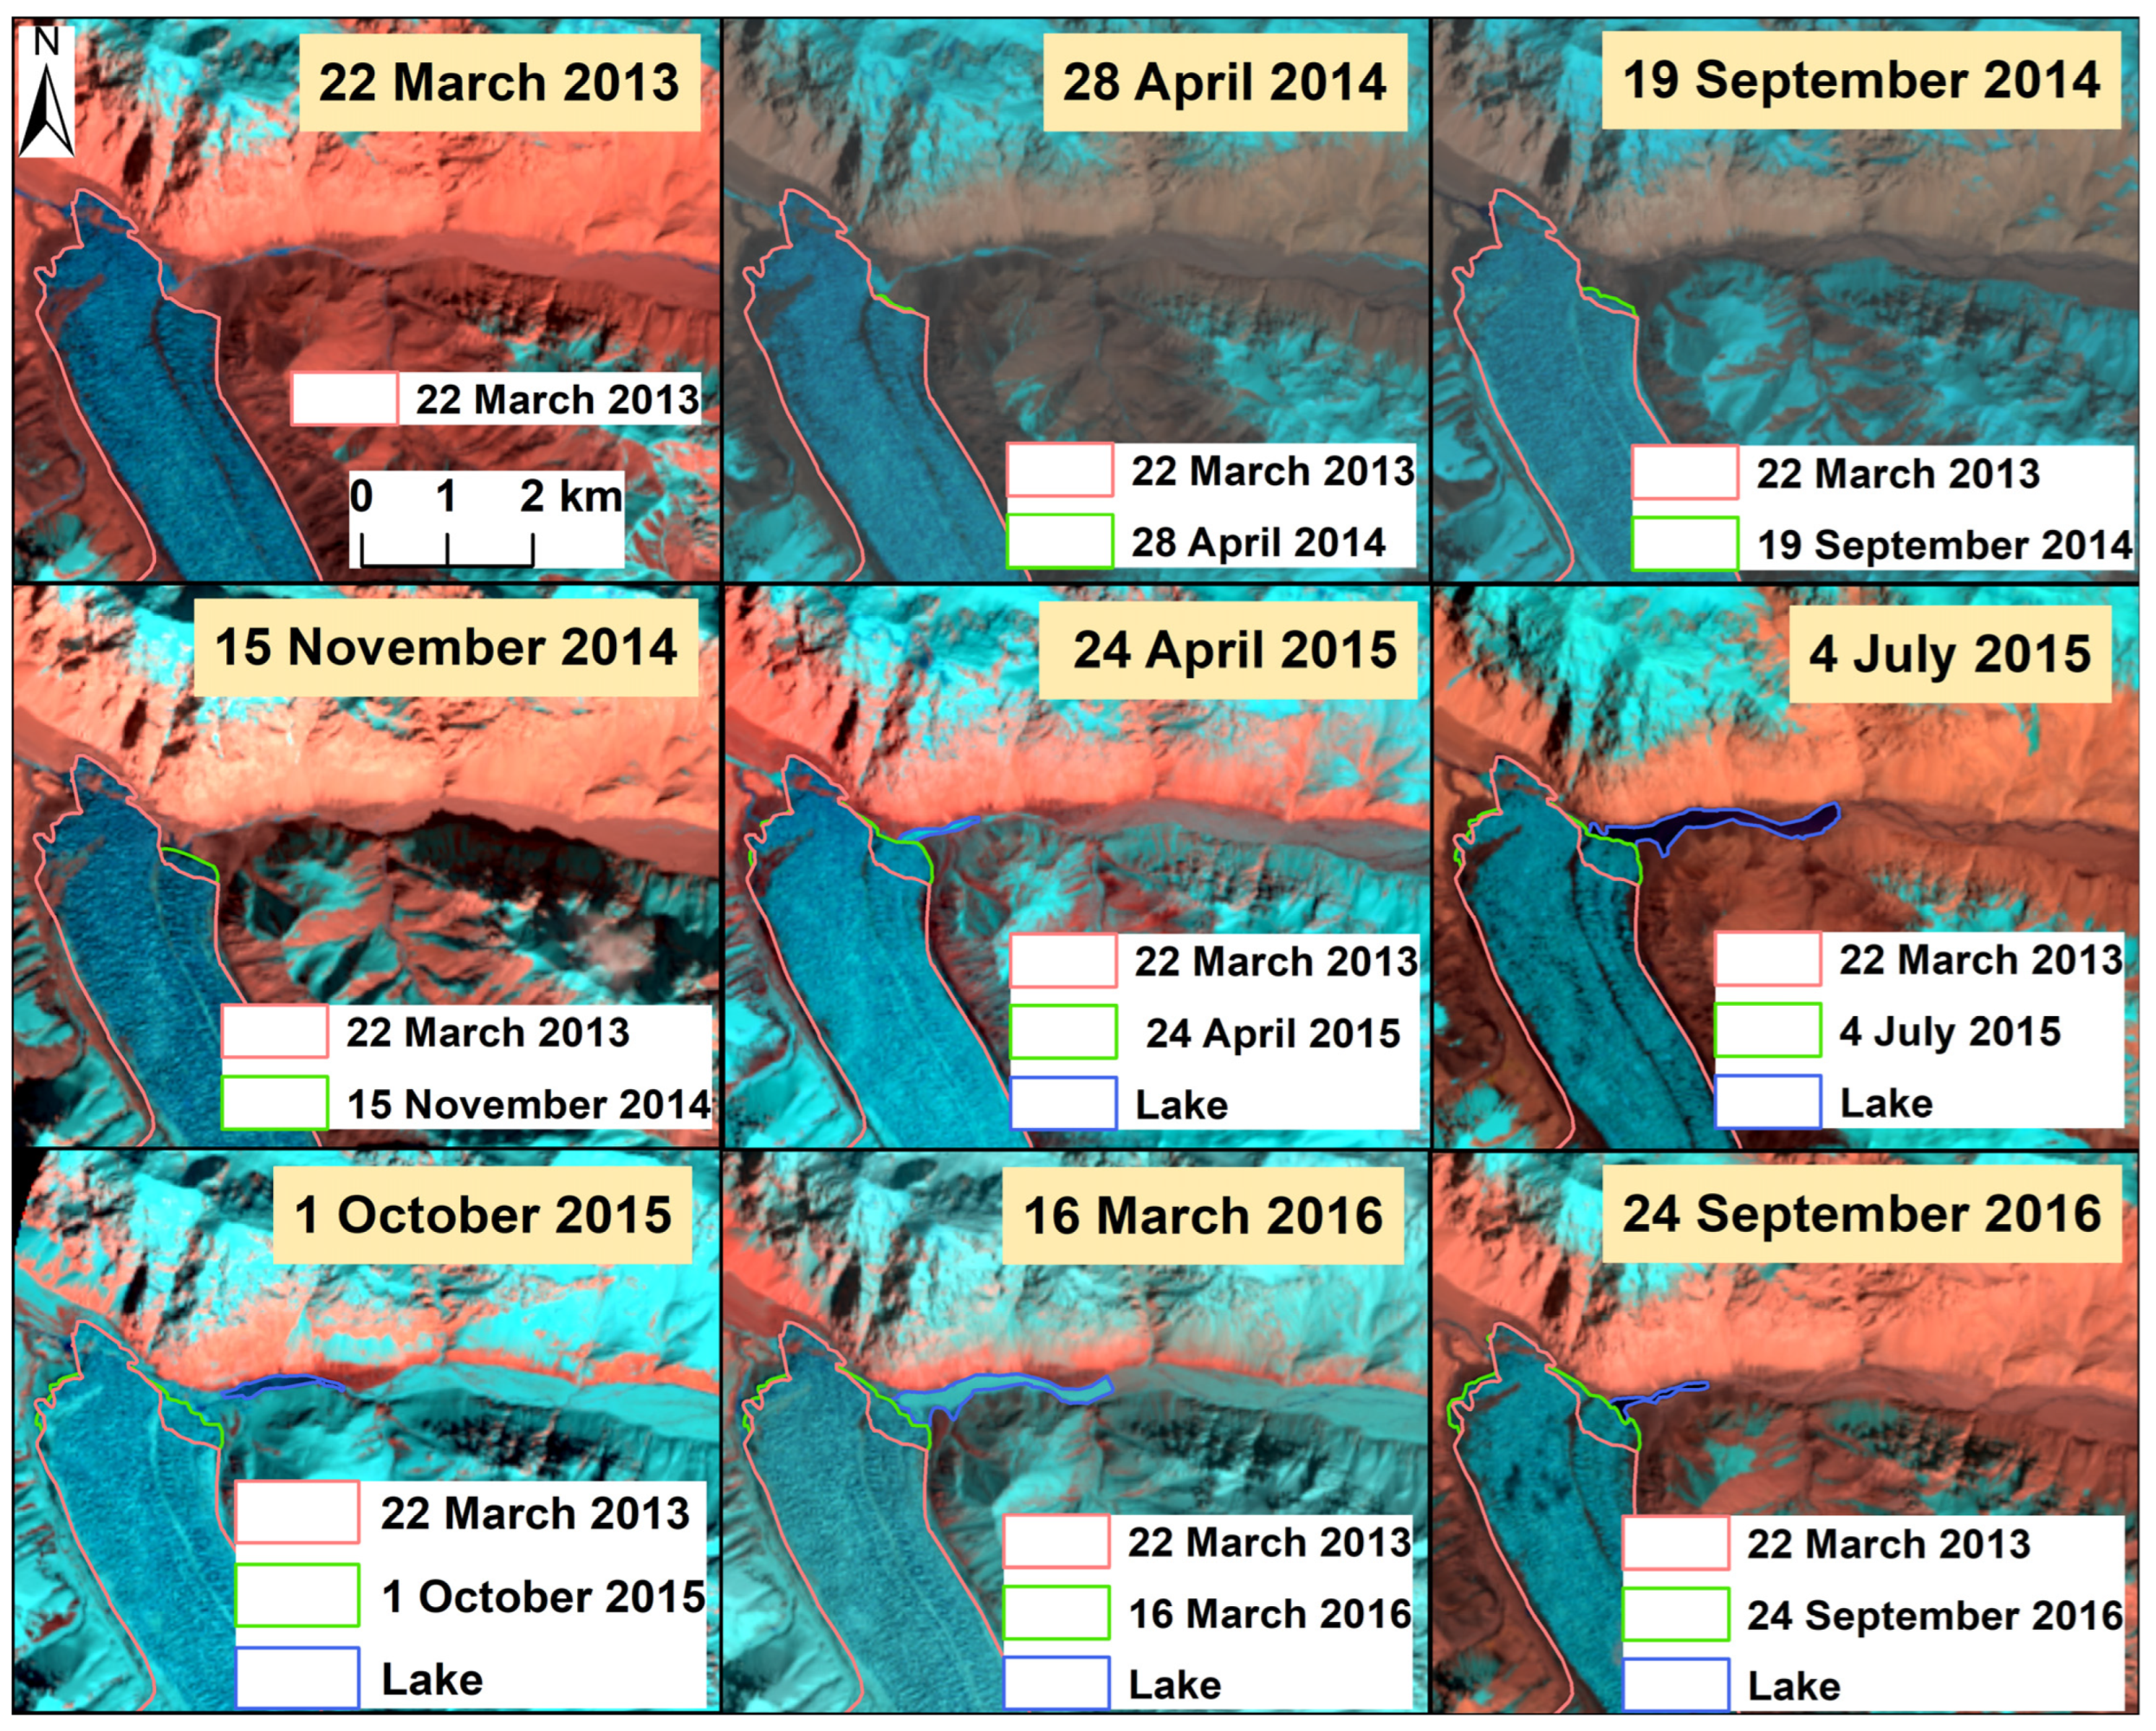
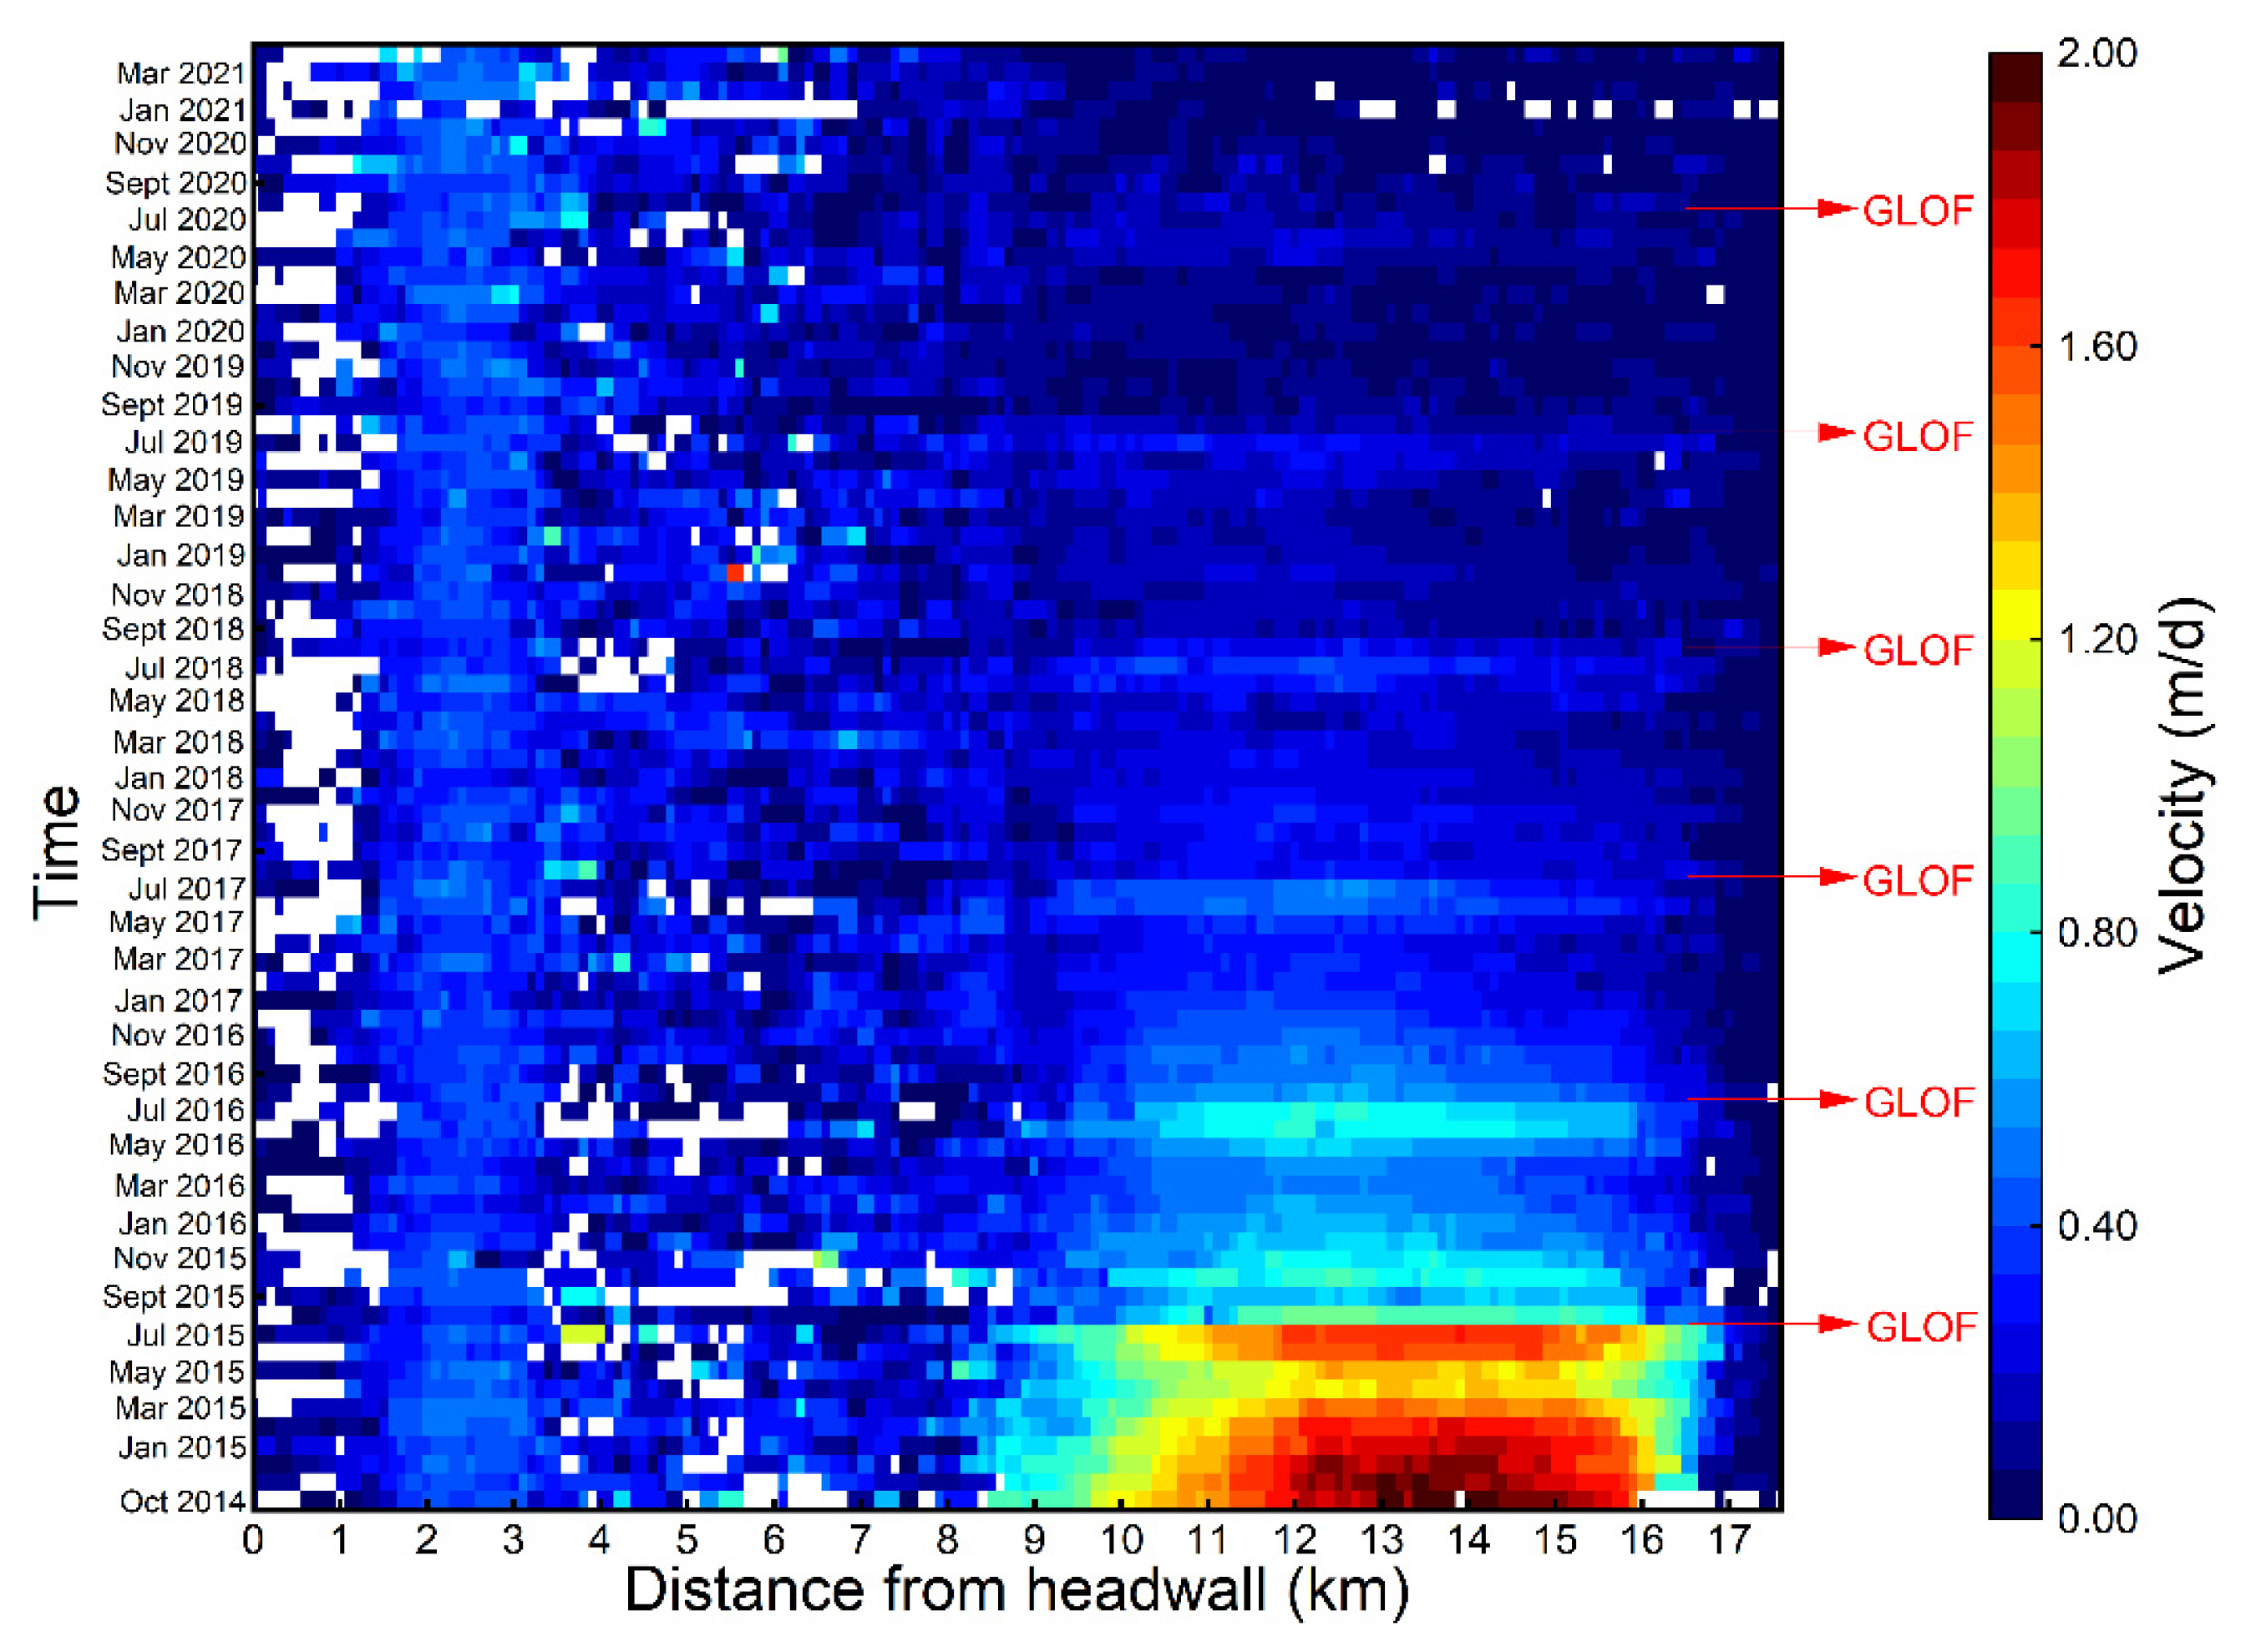
4.3. Glacier Surging during 2014–2016
4.4. Glacier Velocity Changes
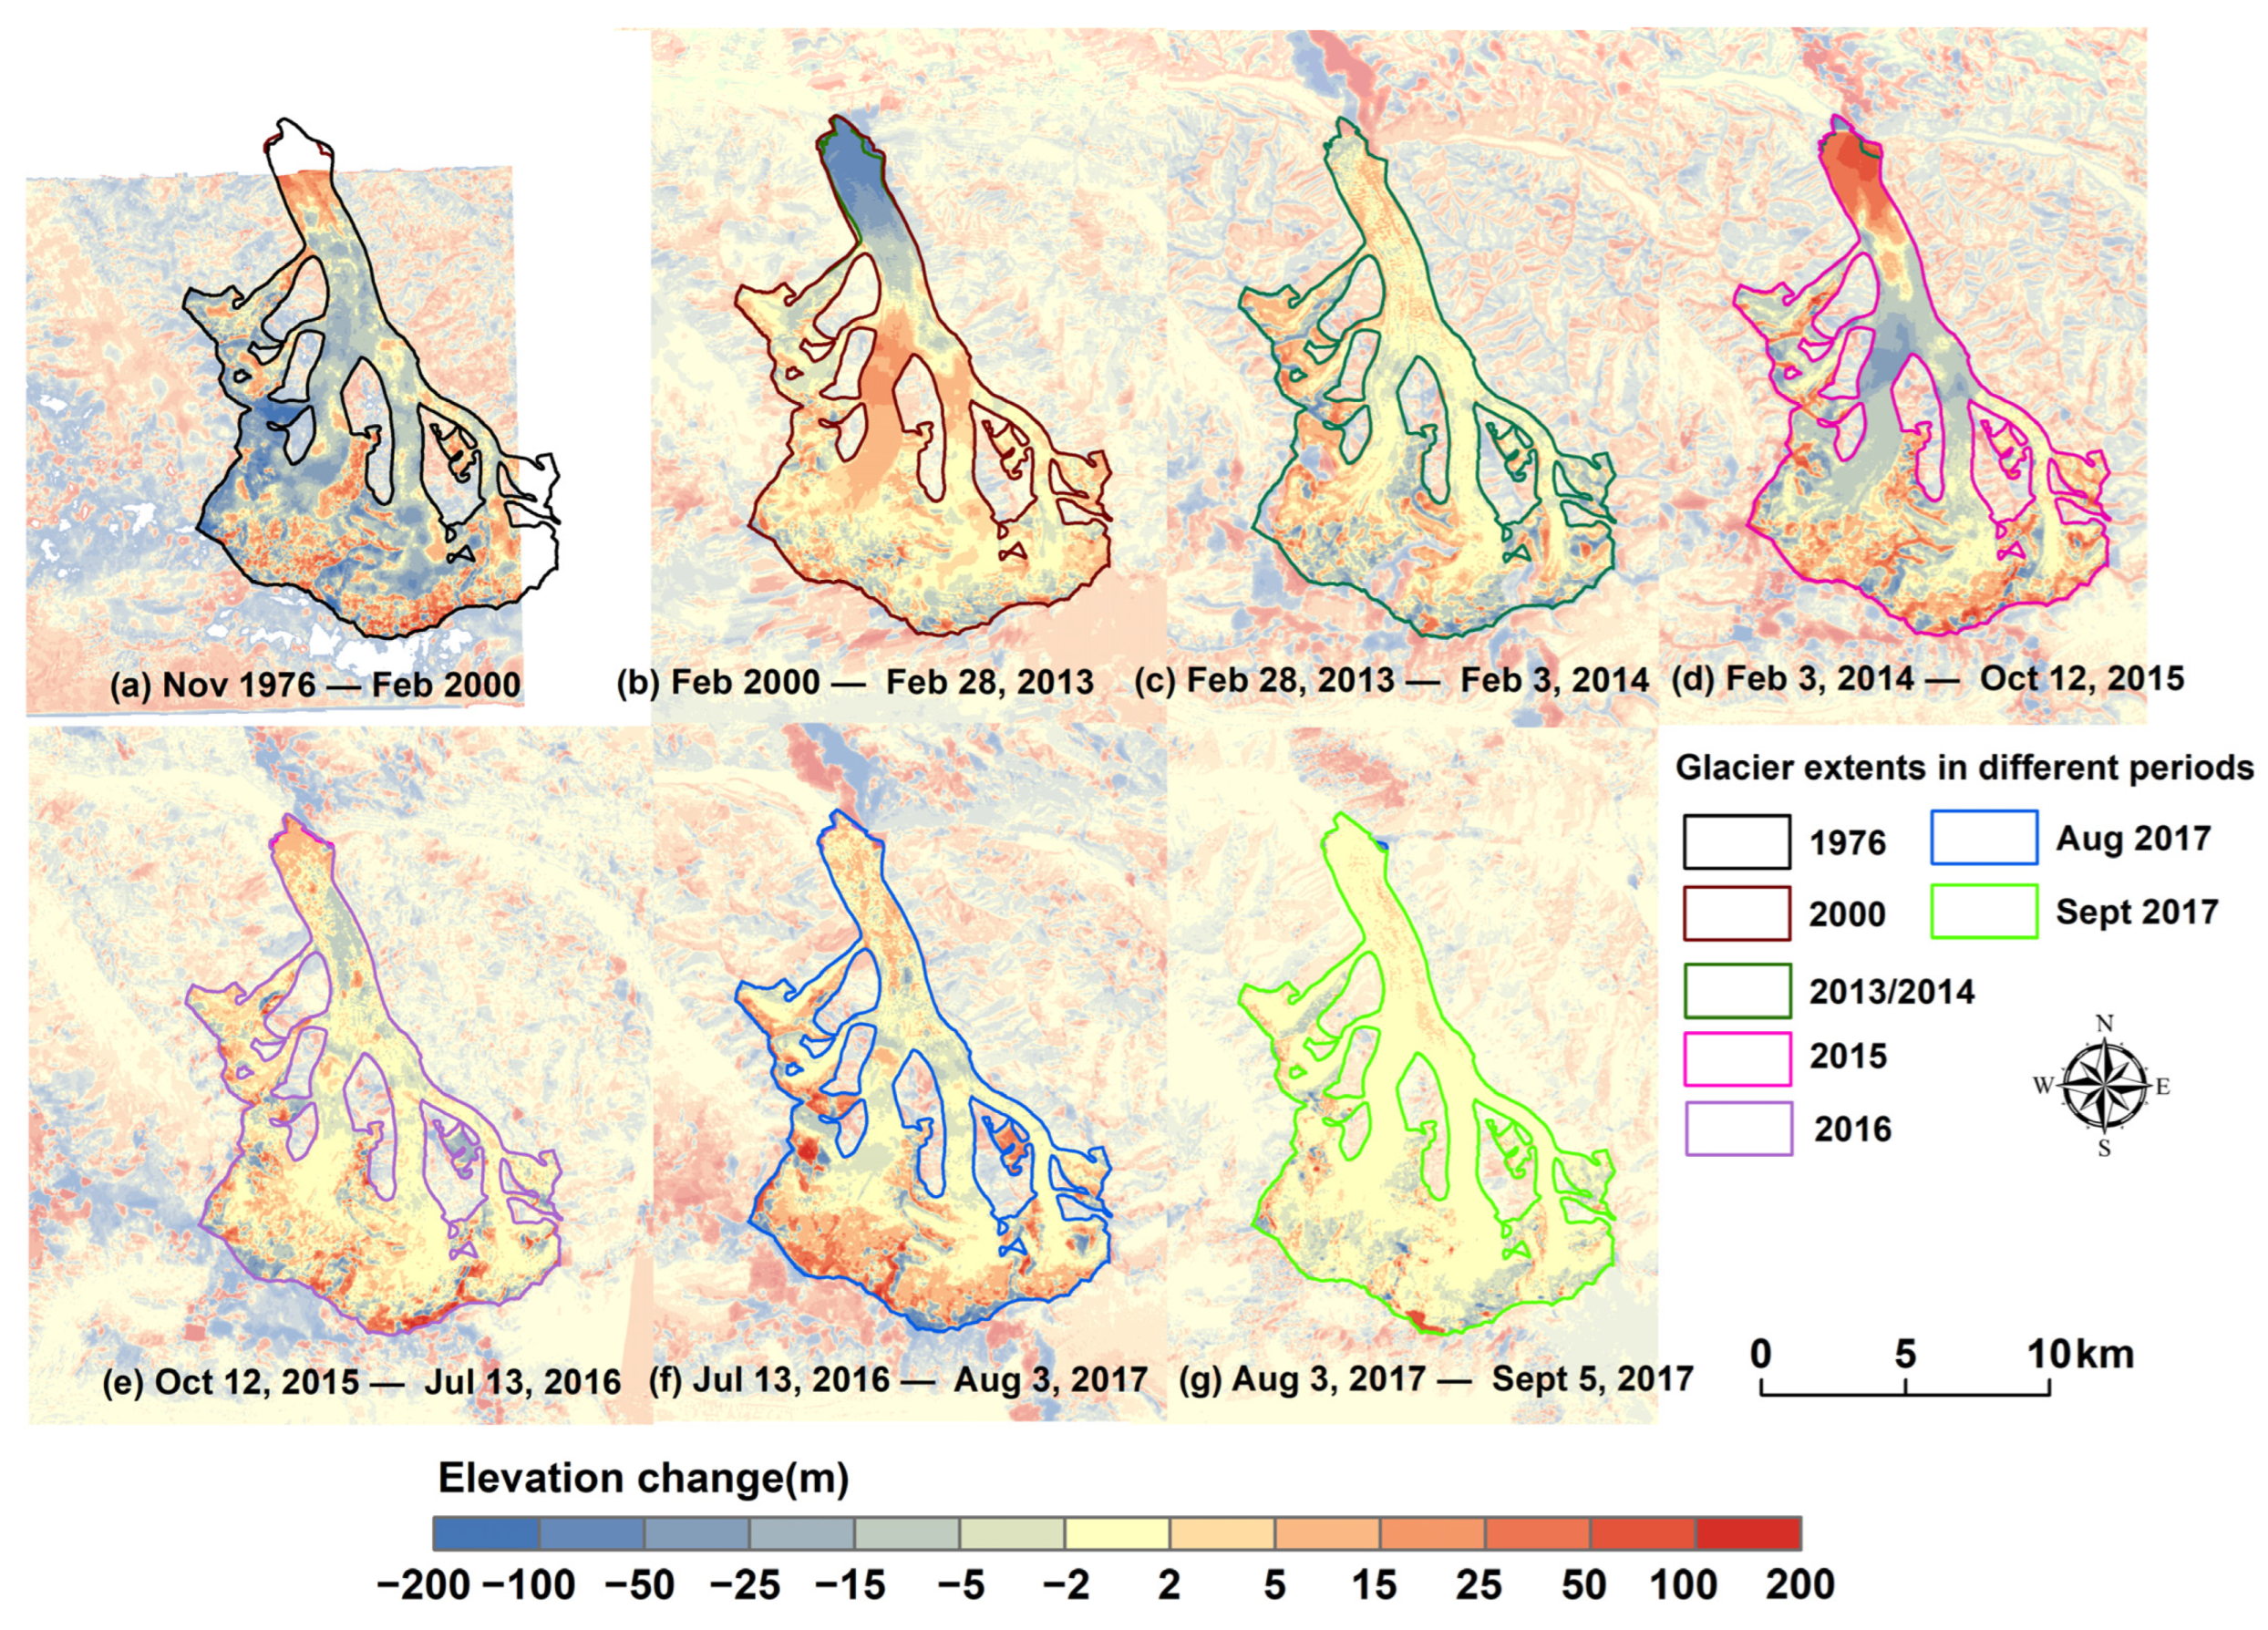
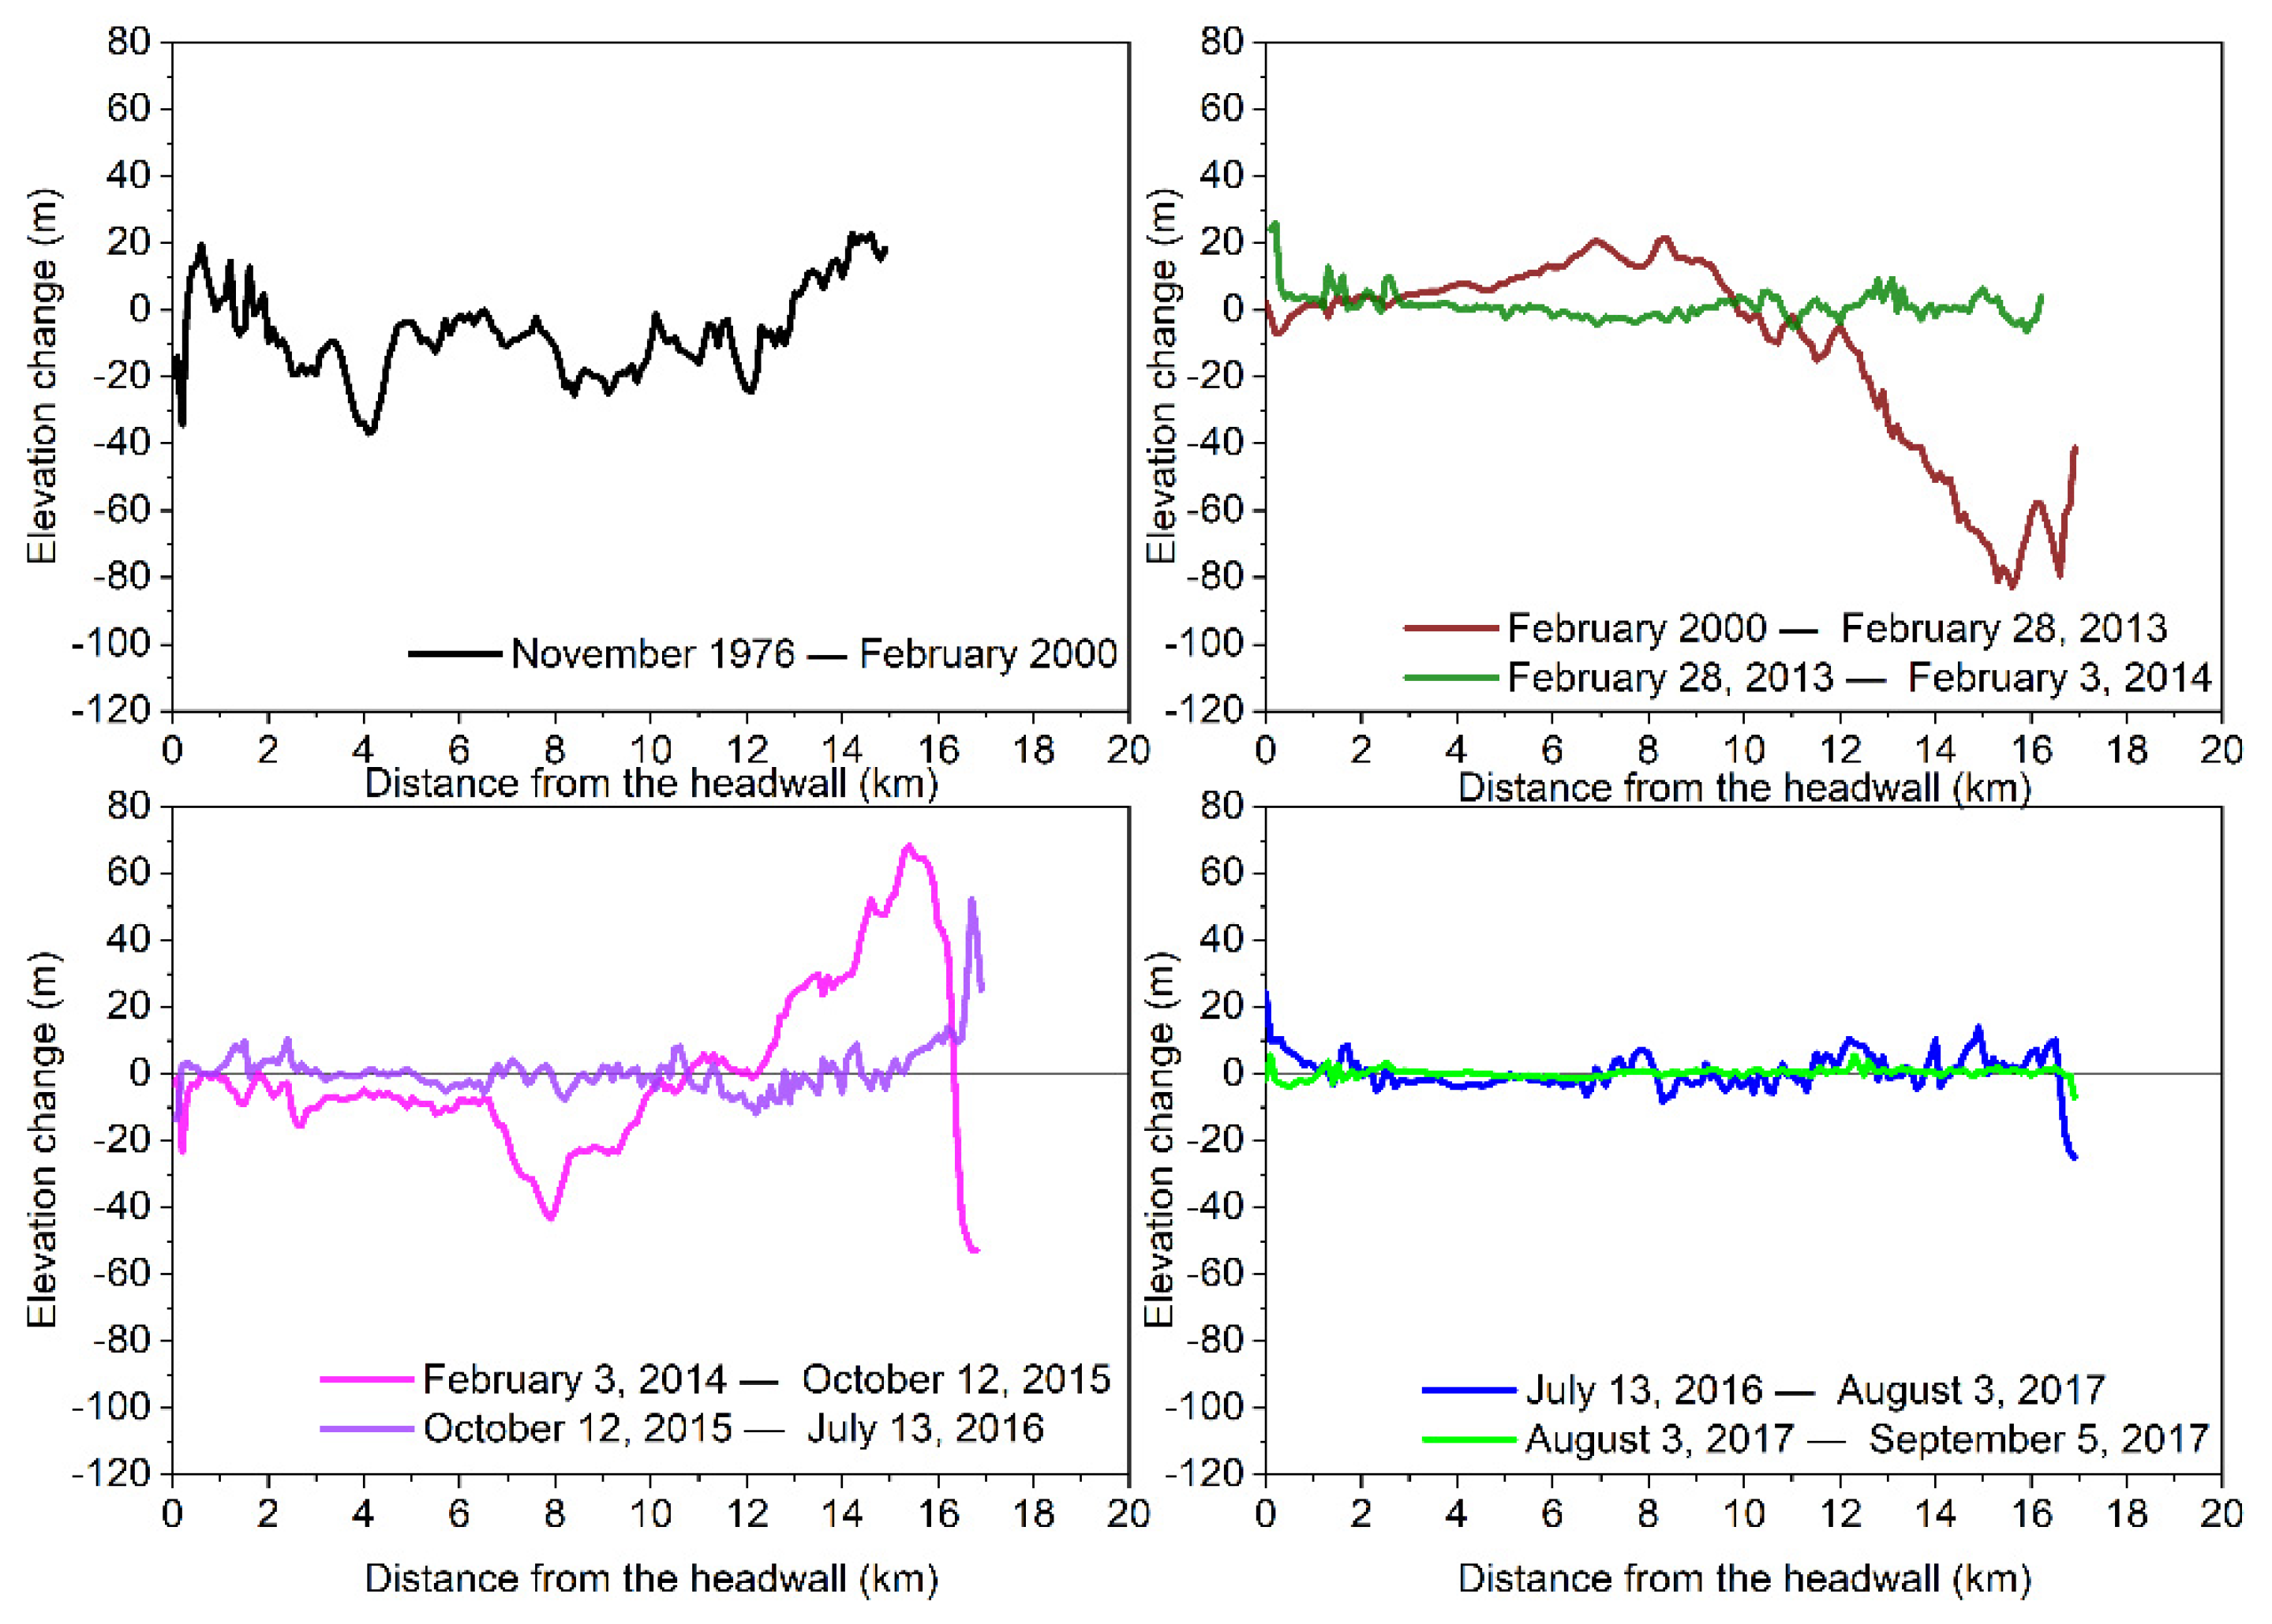
4.5. Glacier Elevation Changes during 1976–2017
4.6. Glacial Lake Formation
5. Discussion
5.1. Methodological Aspects
5.2. Glaciological Aspects
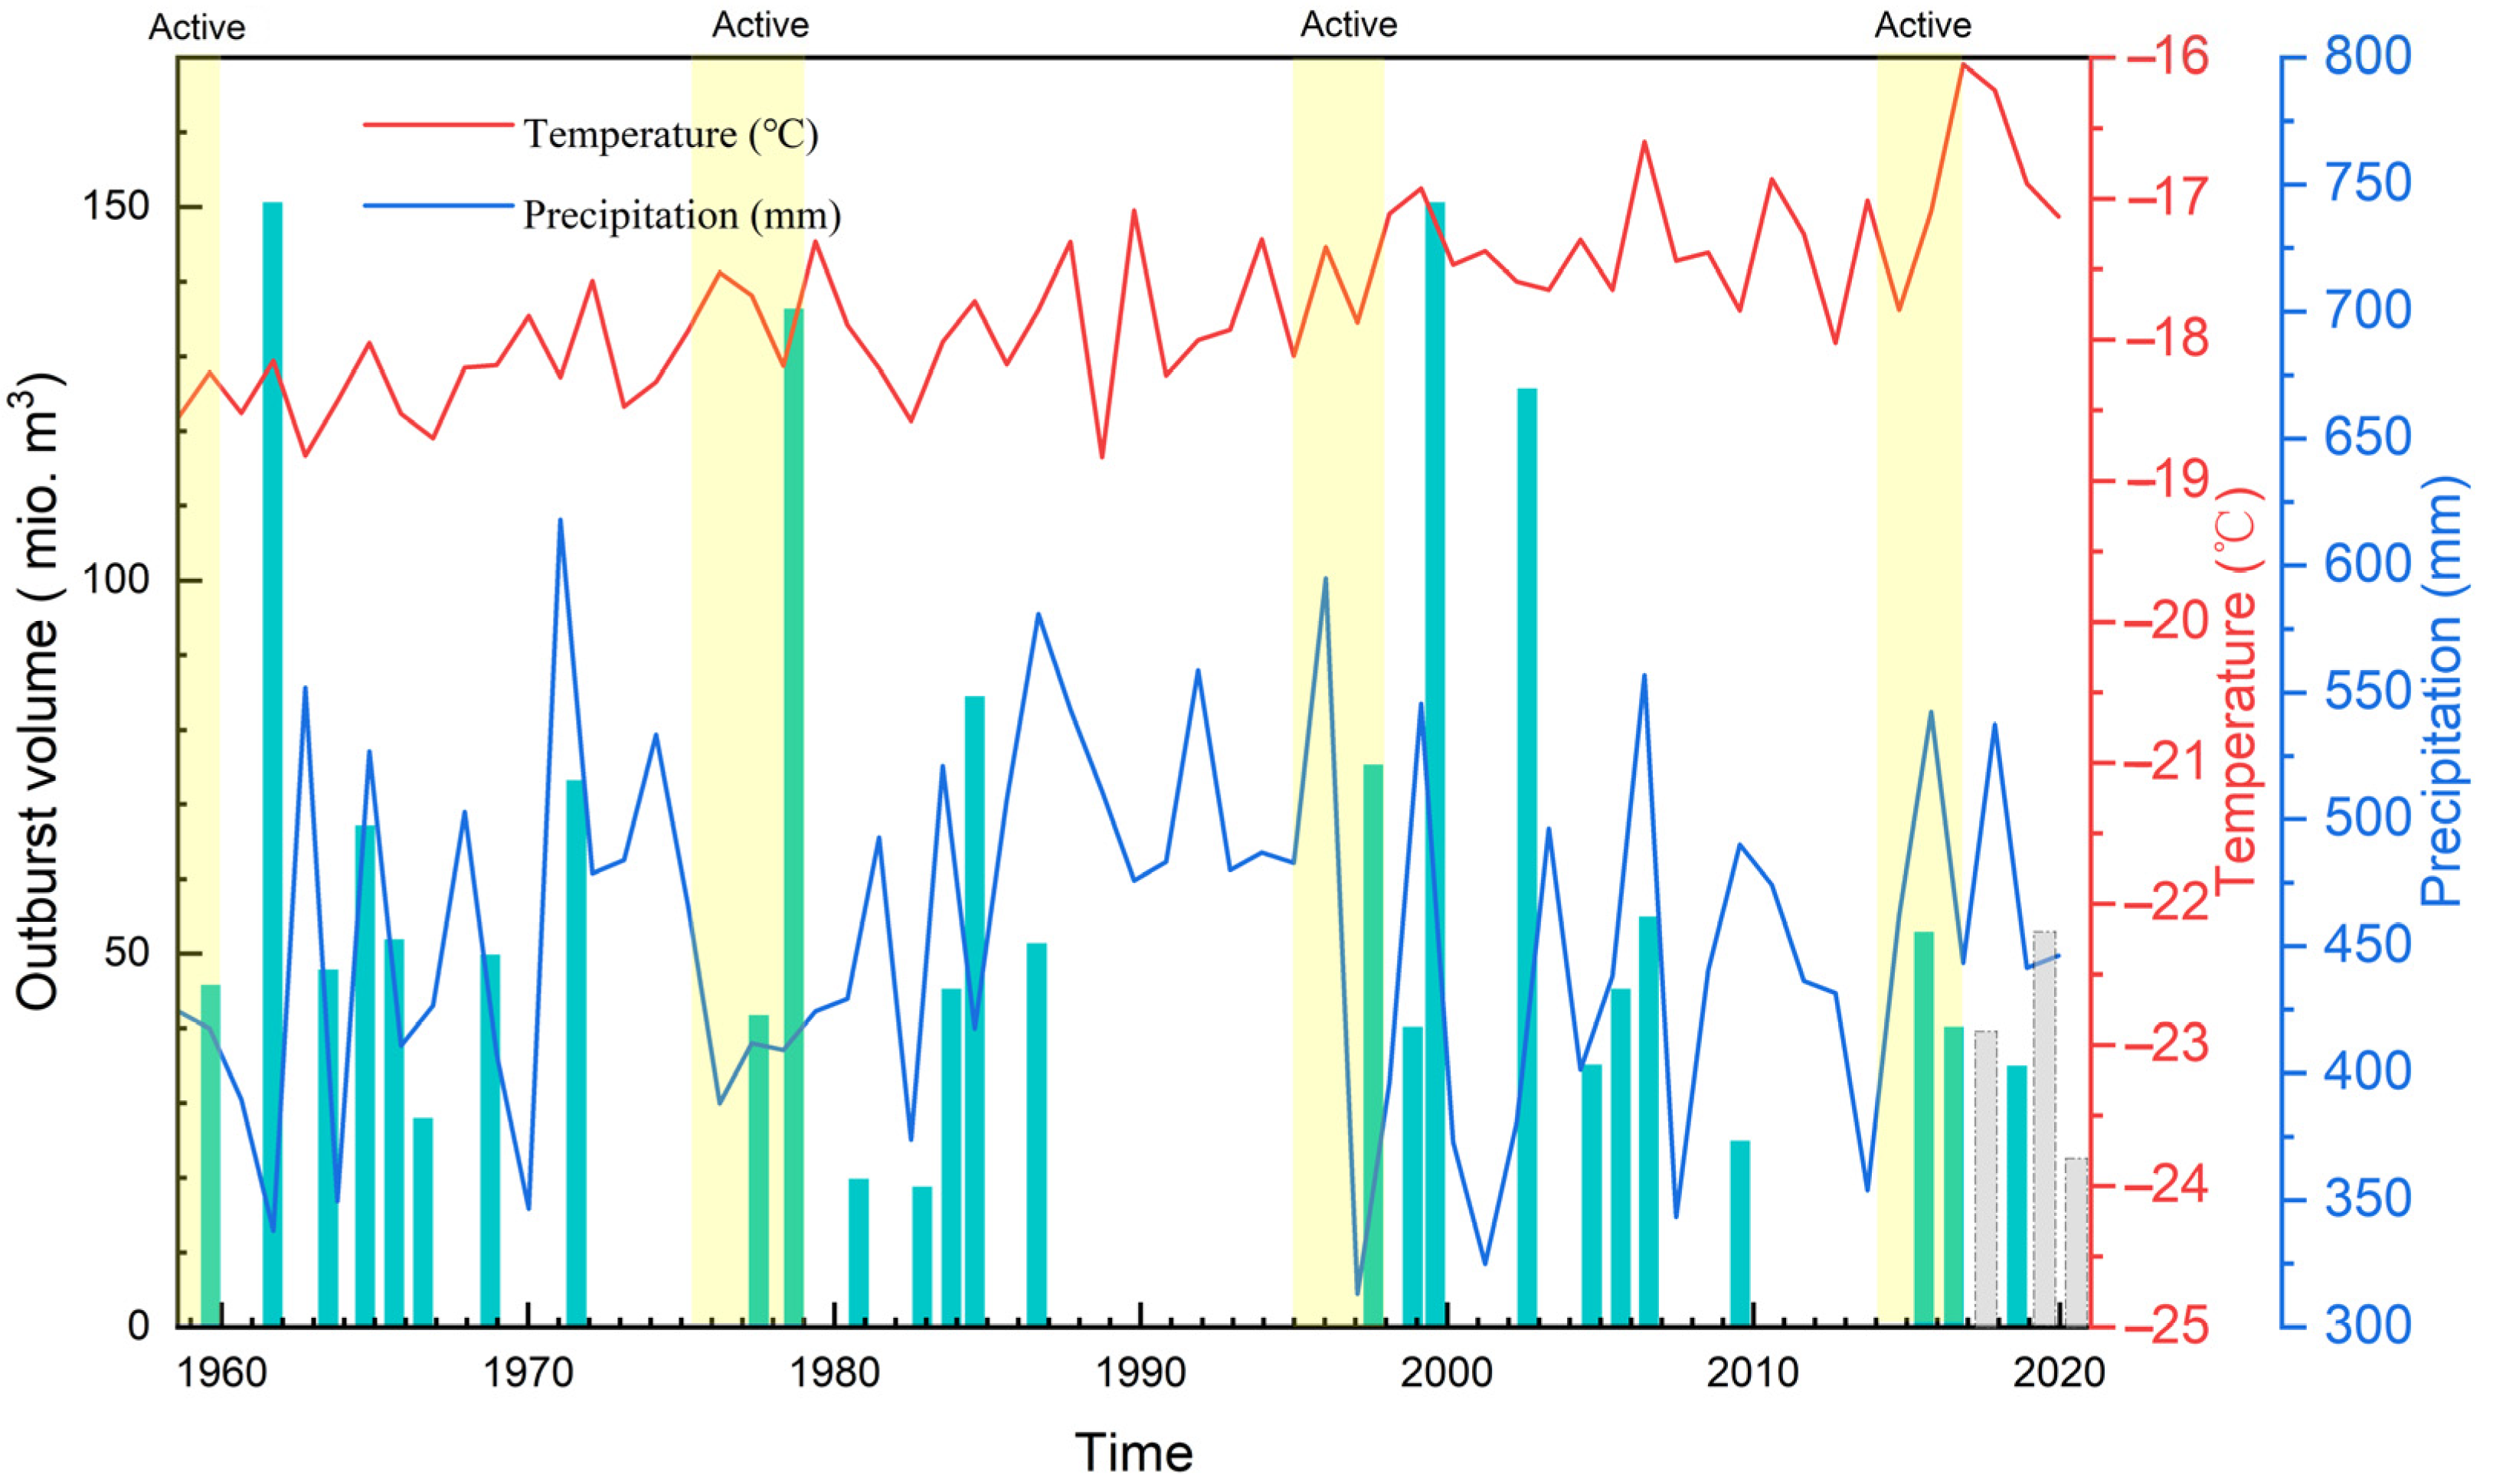
5.3. Comparison with Other Surge-Type Glaciers in the Karakoram
6. Conclusions
Author Contributions
Funding
Institutional Review Board Statement
Informed Consent Statement
Data Availability Statement
Acknowledgments
Conflicts of Interest
References
- Jiskoot, H. Glacier Surging. In Encyclopedia of Snow, Ice and Glaciers; Singh, V.P., Singh, P., Haritashya, U.K., Eds.; Springer: Dordrecht, The Netherlands, 2011; pp. 415–428. [Google Scholar]
- Dolgoushin, L.D.; Osipova, G.B. Glacier Surges and the Problem of Their Forecasting; IAHS Publication: Wallingford, UK, 1975; pp. 292–304. [Google Scholar]
- Cuffey, K.M.; Paterson, W.S.B. The Physics of Glaciers, Glaciology, 4th ed.; Butterworth-Heinemann/Elsevier: Burlington, NJ, USA, 2010. [Google Scholar]
- Wilson, R.; Harrison, S.; Reynolds, J.; Hubbard, A.; Glasser, N.F.; Wündrich, O.; Iribarren Anacona, P.; Mao, L.; Shannon, S. The 2015 Chileno Valley glacial lake outburst flood, Patagonia. Geomorphology 2019, 332, 51–65. [Google Scholar] [CrossRef]
- Haga, O.N.; McNabb, R.; Nuth, C.; Altena, B.; Schellenberger, T.; Kaab, A. From high friction zone to frontal collapse: Dynamics of an ongoing tidewater glacier surge, Negribreen, Svalbard. J. Glaciol. 2020, 66, 742–754. [Google Scholar] [CrossRef]
- Paul, F. Repeat Glacier Collapses and Surges in the Amney Machen Mountain Range, Tibet, Possibly Triggered by a Developing Rock-Slope Instability. Remote Sens. 2019, 11, 708. [Google Scholar] [CrossRef]
- Sevestre, H.; Benn, D.I. Climatic and geometric controls on the global distribution of surge-type glaciers: Implications for a unifying model of surging. J. Glaciol. 2015, 61, 646–662. [Google Scholar] [CrossRef]
- Falaschi, D.; Bolch, T.; Lenzano, M.G.; Tadono, T.; Lo Vecchio, A.; Lenzano, L. New evidence of glacier surges in the Central Andes of Argentina and Chile. Prog. Phys. Geogr. Earth Environ. 2018, 42, 792–825. [Google Scholar] [CrossRef]
- Miles, E.; McCarthy, M.; Dehecq, A.; Kneib, M.; Fugger, S.; Pellicciotti, F. Health and sustainability of glaciers in High Mountain Asia. Nat. Commun. 2021, 12, 2868. [Google Scholar] [CrossRef]
- Brun, F.; Berthier, E.; Wagnon, P.; Kaab, A.; Treichler, D. A spatially resolved estimate of High Mountain Asia glacier mass balances, 2000–2016. Nat. Geosci. 2017, 10, 668–673. [Google Scholar] [CrossRef] [PubMed]
- Bolch, T.; Pieczonka, T.; Mukherjee, K.; Shea, J. Brief communication: Glaciers in the Hunza catchment (Karakoram) have been nearly in balance since the 1970s. Cryosphere 2017, 11, 531–539. [Google Scholar] [CrossRef]
- Lin, H.; Li, G.; Cuo, L.; Hooper, A.; Ye, Q. A decreasing glacier mass balance gradient from the edge of the Upper Tarim Basin to the Karakoram during 2000-2014. Sci. Rep. 2017, 7, 6712. [Google Scholar] [CrossRef]
- Hewitt, K. The Karakoram anomaly? Glacier expansion and the’elevation effect,’Karakoram Himalaya. Mt. Res. Dev. 2005, 25, 332–340. [Google Scholar] [CrossRef]
- Bhambri, R.; Hewitt, K.; Kawishwar, P.; Pratap, B. Surge-type and surge-modified glaciers in the Karakoram. Sci. Rep. 2017, 7, 15391. [Google Scholar] [CrossRef] [PubMed]
- Copland, L.; Sylvestre, T.; Bishop, M.P.; Shroder, J.F.; Seong, Y.B.; Owen, L.A.; Bush, A.; Kamp, U. Expanded and Recently Increased Glacier Surging in the Karakoram. Arct. Antarct. Alp. Res. 2011, 43, 503–516. [Google Scholar] [CrossRef]
- Quincey, D.J.; Glasser, N.F.; Cook, S.J.; Luckman, A. Heterogeneity in Karakoram glacier surges. J. Geophys. Res. Earth Surf. 2015, 120, 1288–1300. [Google Scholar] [CrossRef]
- Paul, F.; Strozzi, T.; Schellenberger, T.; Kääb, A. The 2015 Surge of Hispar Glacier in the Karakoram. Remote Sens. 2017, 9, 888. [Google Scholar] [CrossRef]
- Singh, R.M.; Govil, H.; Shahi, A.P.; Bhambri, R. Characterizing the glacier surge dynamics in Yarkand basin, Karakoram using remote sensing. Quat. Int. 2021, 575–576, 190–203. [Google Scholar] [CrossRef]
- Paul, F. A 60-year chronology of glacier surges in the central Karakoram from the analysis of satellite image time-series. Geomorphology 2020, 352, 106993. [Google Scholar] [CrossRef]
- Goerlich, F.; Bolch, T.; Paul, F. More dynamic than expected: An updated survey of surging glaciers in the Pamir. Earth Syst. Sci. Data 2020, 12, 3161–3176. [Google Scholar] [CrossRef]
- Bhambri, R.; Hewitt, K.; Haritashya, U.K.; Chand, P.; Kumar, A.; Verma, A.; Tiwari, S.K.; Rai, S.K. Characteristics of surge-type tributary glaciers, Karakoram. Geomorphology 2022, 403, 108161. [Google Scholar] [CrossRef]
- Zhu, Q.; Ke, C.-Q.; Li, H. Monitoring glacier surges in the Kongur Tagh area of the Tibetan Plateau using Sentinel-1 SAR data. Geomorphology 2021, 390, 107869. [Google Scholar] [CrossRef]
- King, O.; Bhattacharya, A.; Bolch, T. The presence and influence of glacier surging around the Geladandong ice caps, North East Tibetan Plateau. Adv. Clim. Change Res. 2021, 12, 299–312. [Google Scholar] [CrossRef]
- Bazai, N.A.; Cui, P.; Liu, D.; Carling, P.A.; Wang, H.; Zhang, G.; Li, Y.; Hassan, J. Glacier surging controls glacier lake formation and outburst floods: The example of the Khurdopin Glacier, Karakoram. Glob. Planet. Change 2022, 208, 103710. [Google Scholar] [CrossRef]
- Friedl, P.; Seehaus, T.; Braun, M. Global time series and temporal mosaics of glacier surface velocities derived from Sentinel-1 data. Earth Syst. Sci. Data 2021, 13, 4653–4675. [Google Scholar] [CrossRef]
- Paul, F.; Bolch, T.; Kääb, A.; Nagler, T.; Nuth, C.; Scharrer, K.; Shepherd, A.; Strozzi, T.; Ticconi, F.; Bhambri, R.; et al. The glaciers climate change initiative: Methods for creating glacier area, elevation change and velocity products. Remote Sens. Environ. 2015, 162, 408–426. [Google Scholar] [CrossRef]
- Bhambri, R.; Hewitt, K.; Kawishwar, P.; Kumar, A.; Verma, A.; Snehmani; Tiwari, S.; Misra, A. Ice-dams, outburst floods, and movement heterogeneity of glaciers, Karakoram. Glob. Planet. Change 2019, 180, 100–116. [Google Scholar] [CrossRef]
- Haemmig, C.; Huss, M.; Keusen, H.; Hess, J.; Wegmüller, U.; Ao, Z.; Kulubayi, W. Hazard assessment of glacial lake outburst floods from Kyagar glacier, Karakoram mountains, China. Ann. Glaciol. 2014, 55, 34–44. [Google Scholar] [CrossRef]
- Hewitt, K.; Liu, J. Ice-Dammed Lakes and Outburst Floods, Karakoram Himalaya: Historical Perspectives on Emerging Threats. Phys. Geogr. 2010, 31, 528–551. [Google Scholar] [CrossRef]
- Round, V.; Leinss, S.; Huss, M.; Haemmig, C.; Hajnsek, I. Surge dynamics and lake outbursts of Kyagar Glacier, Karakoram. Cryosphere 2017, 11, 723–739. [Google Scholar] [CrossRef]
- Gardner, A.S.; Moholdt, G.; Scambos, T.; Fahnstock, M.; Ligtenberg, S.; van den Broeke, M.; Nilsson, J. Increased West Antarctic and unchanged East Antarctic ice discharge over the last 7 years. Cryosphere 2018, 12, 521–547. [Google Scholar] [CrossRef]
- Krieger, G.; Moreira, A.; Fiedler, H.; Hajnsek, I.; Werner, M.; Younis, M.; Zink, M. TanDEM-X: A Satellite Formation for High-Resolution SAR Interferometry. IEEE T Geosci. Remote 2007, 45, 3317–3341. [Google Scholar] [CrossRef]
- van Zyl, J.J. The Shuttle Radar Topography Mission (SRTM): A breakthrough in remote sensing of topography. Acta Astronaut. 2001, 48, 559–565. [Google Scholar] [CrossRef]
- Hersbach, H.; Bell, B.; Berrisford, P.; Hirahara, S.; Horányi, A.; Muñoz-Sabater, J.; Nicolas, J.; Peubey, C.; Radu, R.; Schepers, D.; et al. The ERA5 global reanalysis. Q. J. R. Meteorol. Soc. 2020, 146, 1999–2049. [Google Scholar] [CrossRef]
- Guo, W.; Liu, S.; Xu, J.; Wu, L.; Shangguan, D.; Yao, X.; Wei, J.; Bao, W.; Yu, P.; Liu, Q.; et al. The second Chinese glacier inventory: Data, methods and results. J. Glaciol. 2015, 61, 357–372. [Google Scholar] [CrossRef]
- Zhang, D.; Yao, X.; Duan, H.; Liu, S.; Guo, W.; Sun, M.; Li, D. A new automatic approach for extracting glacier centerlines based on Euclidean allocation. Cryosphere 2021, 15, 1955–1973. [Google Scholar] [CrossRef]
- Neckel, N.; Braun, A.; Kropáček, J.; Hochschild, V. Recent mass balance of the Purogangri Ice Cap, central Tibetan Plateau, by means of differential X-band SAR interferometry. Cryosphere 2013, 7, 1623–1633. [Google Scholar] [CrossRef]
- Nuth, C.; Kääb, A. Co-registration and bias corrections of satellite elevation data sets for quantifying glacier thickness change. Cryosphere 2011, 5, 271–290. [Google Scholar] [CrossRef]
- Guo, W.Q.; Liu, S.Y.; Wei, J.F.; Bao, W.J. The 2008/09 surge of central Yulinchuan glacier, northern Tibetan Plateau, as monitored by remote sensing. Ann. Glaciol. 2013, 54, 299–310. [Google Scholar] [CrossRef]
- Paul, F.; Barrand, N.E.; Baumann, S.; Berthier, E.; Bolch, T.; Casey, K.; Frey, H.; Joshi, S.P.; Konovalov, V.; Le Bris, R.; et al. On the accuracy of glacier outlines derived from remote-sensing data. Ann. Glaciol. 2013, 54, 171–182. [Google Scholar] [CrossRef]
- Dehecq, A.; Gourmelen, N.; Gardner, A.S.; Brun, F.; Goldberg, D.; Nienow, P.W.; Berthier, E.; Vincent, C.; Wagnon, P.; Trouvé, E. Twenty-first century glacier slowdown driven by mass loss in High Mountain Asia. Nat. Geosci. 2018, 12, 22–27. [Google Scholar] [CrossRef]
- Fischer, M.; Huss, M.; Hoelzle, M. Surface elevation and mass changes of all Swiss glaciers 1980–2010. Cryosphere 2015, 9, 525–540. [Google Scholar] [CrossRef]
- Rolstad, C.; Haug, T.; Denby, B. Spatially integrated geodetic glacier mass balance and its uncertainty based on geostatistical analysis: Application to the western Svartisen ice cap, Norway. J. Glaciol. 2009, 55, 666–680. [Google Scholar] [CrossRef]
- Gardelle, J.; Berthier, E.; Arnaud, Y. Slight mass gain of Karakoram glaciers in the early twenty-first century. Nat. Geosci. 2012, 5, 322–325. [Google Scholar] [CrossRef]
- Zhang, M.; Chen, F.; Tian, B.; Liang, D.; Yang, A. Characterization of Kyagar Glacier and Lake Outburst Floods in 2018 Based on Time-Series Sentinel-1A Data. Water 2020, 12, 184. [Google Scholar] [CrossRef]
- Mukherjee, K.; Bolch, T.; Goerlich, F.; Kutuzov, S.; Osmonov, A.; Pieczonka, T.; Shesterova, I. Surge-Type Glaciers in the Tien Shan (Central Asia). Arct. Antarct. Alp. Res. 2018, 49, 147–171. [Google Scholar] [CrossRef]
- Leclercq, P.W.; Kääb, A.; Altena, B. Brief communication: Detection of glacier surge activity using cloud computing of Sentinel-1 radar data. Cryosphere 2021, 15, 4901–4907. [Google Scholar] [CrossRef]
- Gardelle, J.; Berthier, E.; Arnaud, Y. Impact of resolution and radar penetration on glacier elevation changes computed from DEM differencing. J. Glaciol. 2012, 58, 419–422. [Google Scholar] [CrossRef]
- Björnsson, H. Hydrological characteristics of the drainage system beneath a surging glacier. Nature 1998, 395, 771–774. [Google Scholar] [CrossRef]
- Lv, M.; Guo, H.; Lu, X.; Liu, G.; Yan, S.; Ruan, Z.; Ding, Y.; Quincey, D.J. Characterizing the behaviour of surge- and non-surge-type glaciers in the Kingata Mountains, eastern Pamir, from 1999 to 2016. Cryosphere 2019, 13, 219–236. [Google Scholar] [CrossRef]
- Björnsson, H.; Palsson, F.; Sigurdsson, O.; Flowers, G.E. Surges of glaciers in Iceland. Ann. Glaciol. 2003, 36, 82–90. [Google Scholar] [CrossRef]
- Eisen, O.; Harrison, W.D.; Raymond, C.F.; Echelmeyer, K.A.; Bender, G.A.; Gorda, J.L.D. Variegated Glacier, Alaska, USA: A century of surges. J. Glaciol. 2005, 51, 399–406. [Google Scholar] [CrossRef]
- Dowdeswell, J.A.; Hamilton, G.S.; Hagen, J.O. The duration of the active phase on surge-type glaciers contrasts between Svalbard and other regions. J. Glaciol. 1991, 37, 388–400. [Google Scholar] [CrossRef]
- Striberger, J.; Bjorck, S.; Benediktsson, I.O.; Snowball, I.; Uvo, C.B.; Ingolfsson, O.; Kjaer, K.H. Climatic control of the surge periodicity of an Icelandic outlet glacier. J. Quat. Sci. 2011, 26, 561–565. [Google Scholar] [CrossRef]
- Dowdeswell, J.A.; Hodgkins, R.; Nuttall, A.M.; Hagen, J.O.; Hamilton, G.S. Mass-Balance Change as a Control on the Frequency and Occurrence of Glacier Surges in Svalbard, Norwegian High Arctic. Geophys. Res. Lett. 1995, 22, 2909–2912. [Google Scholar] [CrossRef]
- Hoinkes, H.C. Surges of the Vernagtferner in the Ötztal Alps since 1599. Can. J. Earth Sci. 1969, 6, 853–861. [Google Scholar] [CrossRef]
- Farinotti, D.; Immerzeel, W.W.; de Kok, R.; Quincey, D.J.; Dehecq, A. Manifestations and mechanisms of the Karakoram glacier Anomaly. Nat. Geosci. 2020, 13, 8–16. [Google Scholar] [CrossRef]
- Wu, K.; Liu, S.; Jiang, Z.; Zhu, Y.; Xie, F.; Gao, Y.; Yi, Y.; Tahir, A.A.; Muhammad, S. Surging Dynamics of Glaciers in the Hunza Valley under an Equilibrium Mass State since 1990. Remote Sens. 2020, 12, 2922. [Google Scholar] [CrossRef]
- Steiner, J.F.; Kraaijenbrink, P.D.A.; Jiduc, S.G.; Immerzeel, W.W. Brief communication: The Khurdopin glacier surge revisited—Extreme flow velocities and formation of a dammed lake in 2017. Cryosphere 2018, 12, 95–101. [Google Scholar] [CrossRef]
- Bhambri, R.; Watson, C.S.; Hewitt, K.; Haritashya, U.K.; Kargel, J.S.; Pratap Shahi, A.; Chand, P.; Kumar, A.; Verma, A.; Govil, H. The hazardous 2017-2019 surge and river damming by Shispare Glacier, Karakoram. Sci. Rep. 2020, 10, 4685. [Google Scholar] [CrossRef]
- Paul, F.; Piermattei, L.; Treichler, D.; Gilbert, L.; Girod, L.; Kääb, A.; Libert, L.; Nagler, T.; Strozzi, T.; Wuite, J. Three different glacier surges at a spot: What satellites observe and what not. Cryosphere 2022, 16, 2505–2526. [Google Scholar] [CrossRef]


| Data | Acquisition Date | Path/Row | Pixel Size (m)/Scale | Amount | Application |
|---|---|---|---|---|---|
| Landsat MSS | 1973–1979 | 159/35 | 79 | 9 | Glacier and glacial lake boundary identification |
| Landsat TM | 1995–1997 | 148/35 | 30 | 6 | |
| Landsat OLI | 2013–2021 | 147/35, 148/35 | 15 | 9 | |
| ITS_LIVE | 1989–2018 | 240 | 30 | Annual glacier velocity | |
| Sentinel-1 glacier velocity data | 2014–2021 | 200 | 79 | Monthly glacier velocity | |
| Topographic map | November 1976 | 1:50,000 | 1 | Glacier elevation change | |
| SRTM | 11–12 February 2000 | 30 | 1 | ||
| TerraSAR-X /TanDEM-X | 28 February 2013 3 February 2014 12 October 2015 13 July 2016 3 August 2017 5 September 2017 | 12 | 6 |
| Period | Maximum Velocity (m d−1) |
|---|---|
| Before 28 April 2014 | 0.5 ± 0.08 |
| From 28 April to 30 May 2014 | 1 ± 0.08 |
| From October 2014 to February 2015 | 2 ± 0.08 |
| From March to May 2015 | 1.5 ± 0.08 |
| From June to July 2015 | 1.7 ± 0.08 |
| August 2015 | 0.7 ± 0.08 |
| From January to May 2016 | 0.5 ± 0.08 |
| From June to July 2016 | 0.8 ± 0.08 |
| August 2016 | 0.6 ± 0.08 |
| Time | Lake Area (m2) | Lake Volume (mio. m3) |
|---|---|---|
| 13 June 1976 | 0.23 | 6.13 |
| 14 July 1977 | 1.52 | 58.93 |
| 1 August 1977 | 1.07 | 42.17 |
| 18 July 1978 | 1.92 | 114.10 |
| 7 June 1979 | 0.91 | 35.81 |
| 2 February 1996 | 0.22 | 5.56 |
| 16 August 1996 | 2.01 | 131.03 |
| 18 July 1997 | 2.78 | 214.83 |
| 4 September 1997 | 0.13 | 0.99 |
| 24 April 2015 | 0.08 | 0.63 |
| 4 July 2015 | 0.55 | 25.95 |
| 1 October 2015 | 0.15 | 1.90 |
| 16 March 2016 | 0.48 | 15.26 |
| 24 September 2016 | 0.10 | 0.64 |
| GLIMS ID | Glacier Name | Glacier Area (km2) | Active Phase (year) | Surge Cycle (year) | Whether It Causes GLOF by Surging (Number of GLOFs Caused by a Surge Cycle) | References |
|---|---|---|---|---|---|---|
| G077158E35562N | Kyagar | 97.10 | 1975–1978 (3) 1995–1997 (2) 2014–2016 (2) | 19–20 | Yes (7–8) | This study |
| G075308E36242N | Yazghil | 133.75 | 1997–1998 (2) 2005–2006 (2) 2010–2011 (2) 2018–2019 (2) | 5–8 | Yes | [14] |
| G077294E35212N | 5.51 | 1976–1978 (3) 1991–1994 (4) 2006–2010 (5) | 15 | No | [14] | |
| G076960E35666N | First Singhi | 8.49 | 1990–1996 (7) 2008–2011 (4) | 18 | No | [14] |
| G076900E35638N | Staghar | 76.13 | 1989–1991 (3) 2009–2011 (3) | 20 | Yes | [14] |
| G074619E36437N | Hassanabad | 45.71 | 1995–1997 (3) 2014–2016 (3) | 19 | Yes | [14] |
| G077662E35097N | Kichik Kumdun | 66.24 | 1902–1903 (2) 1935–1936 (2) 1970–1972 (3) 1998–2000 (3) | 28–35 | Yes | [14] |
| G075680E35803N | Tonga | 11.33 | 1990–1994 (4) 2014–2016 (2) | 24 | No | [14] |
| G074581E36501N | Batura | 311.65 | 1990–1995 (5) 2005–2010 (5) 2013–2018 (5) | 8–15 | Yes | [14] |
| G074990E36246N | Gharesa | 78.00 | 1995–1997 (2) 2001–2003 (2) 2015–2015 (1) | 6–14 | No | [14] |
| G075218E35874N | West Marpoh | 295.32 | 1995–1998 (3) 2005–2006 (1) 2013–2015 (2) | 8–10 | No | [14] |
| G075438E36192N | Khurdopin | 203.34 | 1977–1979 (3) 1998–2002 (4) 2016–2020 (4) | 19–20 | Yes (6) | [14,24] |
| G075653E36149N | Virjerab | 167.43 | 2004–2007 (4) 2018–? | 14 | Yes | [14] |
| G076036E35822N | 1st Feriole | 12.92 | 1953–1973 (20) 1998–2017 (20) | 45 | No | [19] |
| G076049E35853N | Shingchukpi | 14.51 | 1950–1960 (10) 1995–2006 (10) | 45 | No | [19] |
| G075959E35848N (Chiring) | 334.69 | 1955–1960 (5) 1992–1995 (3) | 35–40 | No | [19] | |
| G075959E35848N (Drenmang) | 334.69 | 1964–1967 (3) 2005–2007 (2) | 35–40 | No | [19] | |
| G076298E35850N (Sarpo Laggo) | 199.17 | 1950–1955 (5) 1993–1998 (5) | 40 | No | [19] | |
| G076298E35850N (NN7) | 199.17 | 1953–1963 (10) 1998–2009 (9) | 45 | No | [19] | |
| G076298E35850N (NN10) | 199.17 | 1945–1950 (5) 1993–2001 (8) | 50 | No | [19] | |
| G076261E35935N | 3.85 | 1954–1961 (7) 1980–1987 (7) 2002–2010 (8) | 20–25 | No | [19] | |
| G076406E35964N | 3.35 | 1980–1990 (10) 2000–2010 (10) | 20 | No | [19] | |
| G076267E35990N | 7.16 | 1945–1960 (15) 1995–2010 (15) | 50 | No | [19] | |
| G076247E36088N | 11.54 | 1980–1995 (15) 2005–2018 (13) | 35 | No | [19] | |
| G076225E36119N (North Crown) | 57.58 | 1950–1955 (5) 2008–2013 (5) | 60 | No | [19] | |
| G076225E36119N (NN30) | 57.58 | 1953–1958 (5) 1981–1986 (5) 2008–2015 (7) | 27 | No | [19] | |
| G076417E36281N | Tatulu Guo | 29.91 | 1940–1955 (15) 2002–2017 (15) | 60 | No | [19] |
| G075997E36267N | Saxinitulu | 39.51 | 1955–1960 (15) 2009–2015 (15) | 55 | No | [19] |
Disclaimer/Publisher’s Note: The statements, opinions and data contained in all publications are solely those of the individual author(s) and contributor(s) and not of MDPI and/or the editor(s). MDPI and/or the editor(s) disclaim responsibility for any injury to people or property resulting from any ideas, methods, instructions or products referred to in the content. |
© 2023 by the authors. Licensee MDPI, Basel, Switzerland. This article is an open access article distributed under the terms and conditions of the Creative Commons Attribution (CC BY) license (https://creativecommons.org/licenses/by/4.0/).
Share and Cite
Zhang, Z.; Zhao, J.; Liu, S.; Zhang, Q.; Jiang, Z.; Xu, Y.; Su, H. Characterization of Three Surges of the Kyagar Glacier, Karakoram. Remote Sens. 2023, 15, 2113. https://doi.org/10.3390/rs15082113
Zhang Z, Zhao J, Liu S, Zhang Q, Jiang Z, Xu Y, Su H. Characterization of Three Surges of the Kyagar Glacier, Karakoram. Remote Sensing. 2023; 15(8):2113. https://doi.org/10.3390/rs15082113
Chicago/Turabian StyleZhang, Zhen, Jinbiao Zhao, Shiyin Liu, Qibing Zhang, Zongli Jiang, Yangyang Xu, and Haoran Su. 2023. "Characterization of Three Surges of the Kyagar Glacier, Karakoram" Remote Sensing 15, no. 8: 2113. https://doi.org/10.3390/rs15082113