Communication

Super-Resolution Technique of Multi-Radar Fusion 2D Imaging Based on ExCoV Algorithm in Low SNR

1
School of Microelectronics, Nanjing University of Science and Technology, Nanjing 210094, China
2
National Key Laboratory of Science and Technology on Space Microwave, Xi’an 710000, China
*
Author to whom correspondence should be addressed.
Remote Sens. 2023, 15(8), 2108; https://doi.org/10.3390/rs15082108
Submission received: 29 March 2023 / Revised: 12 April 2023 / Accepted: 13 April 2023 / Published: 17 April 2023

Abstract

:
Limited by the hardware, the bandwidth of the transmitted signal is not wide enough for super resolution; this is the same for cross resolution, which is limited by the observation angle. In this paper, we propose a technique for imaging fusion using 2D-imaging super-resolution by using multi-radar data from different observation locations, and the resultant effective band is proposed. First, a sparse 2D parametric model based on GTD theory is introduced to construct a dictionary by matching the scattering theory of the radar observation target. Then, the multi-radar fusion imaging framework is constructed. Meanwhile, the 2D model’s sparse parameters are obtained in low SNR using an expansion-compression variance-component algorithm. Finally, radar echo data is expanded to realize the fusion imaging process. The simulation results show that the image quality is improved after multi-radar fusion, which is better than that of the single radar echo, verifying the effectiveness of our method.

Graphical Abstract

1. Introduction

Radar plays an important role, especially in military applications. High-resolution radar has been extensively applied to ballistic missile defense, radar imaging, target identification, etc. For traditional radar systems, the range resolution is determined by the signal’s bandwidth, while the observation angle range limits the cross resolution. A simple way to improve range resolution is to increase the radar signal bandwidth because the range resolution is inversely proportional to the signal’s bandwidth. As for cross-range resolution, the only way to improve is to increase the coherent process interval. However, the cost of the former approach is high, and the radar hardware must be upgraded to increase the signal bandwidth. Due to the constraints of the current technology lever, bandwidth cannot be improved indefinitely. Furthermore, long coherence processing intervals (CPIs) are usually unachievable, since radar targets are often uncooperative.
One way to improve resolution is to resort to super-resolution techniques, which can be adapted to the original radar hardware. In several studies, bandwidth extrapolation techniques are seen to improve range resolution [1,2]. On the other hand, frequency and aspect extrapolation techniques improve range and cross-range resolution [3]. However, these super resolutions are all based on a single radar system [4], having a limited practical impact on resolution improvement. We need to note that the improvement of hardware capabilities is greatly limited by the level of science and technology, and the signal bandwidth cannot be increased indefinitely, and similarly, the observation angle is too large to make the signal return from the incoherent scattering point, so as to obtain the ideal high azimuth resolution. Therefore, super-resolution imaging methods of single radars are often limited by the above conditions.
With the development of the signal processing technique, multi-radar fusion imaging has been extensively studied. The all-pole signal model is used to fit the radar echo with the various radars operating in different frequency bands, and the root-MUSIC algorithm estimates its parameters. Finally, the data samples of unknown sub-bands can be interpolated using the all-pole model. GTD models are used to finish multi-band fusion imaging [5,6].
The super-resolution technique of multi-radar fusion imaging has been widely applied to one-dimensional cases [7], while the two-dimensional case has little research, especially in low SNR. This paper focuses on the problem of fusion imaging under low signal-to-noise ratio, focusing on solving the problem that the estimation error of incoherent parameters is large and it is difficult to perform fusion imaging under low signal-to-noise ratio. First, this paper looks deeper into two-dimensional super-resolution problems based on multi-radar fusion. GTD model is adopted to construct the dictionary for sparse representation of multiband multi-angle radar data. Then, the expansion-compression variance-component algorithm (ExCoV) [8,9] is used to choose significant dictionary atoms, and the relevant weights are calculated. Finally, the chosen atoms and their weights are used to obtain the unknown sub-band sub-angle data and finish the multi-radar fusion 2D imaging process.
In Section 1, we were introduced to the issues and gaps faced by multi-radar fusion imaging and the potential super-resolution techniques to improve the fusion. The remainder of the paper is organized as follows. Section 2 introduces the 2D-GTD model of the radar echo and establishes the relationship between the super-resolution technique and sparse representation. Section 3 reviews the multi-radar fusion 2D imaging frame and ExCoV algorithm theory. Experimental results in Section 4 demonstrate the capacity and robustness of the proposed solution scheme. Finally, conclusions are drawn in Section 5.

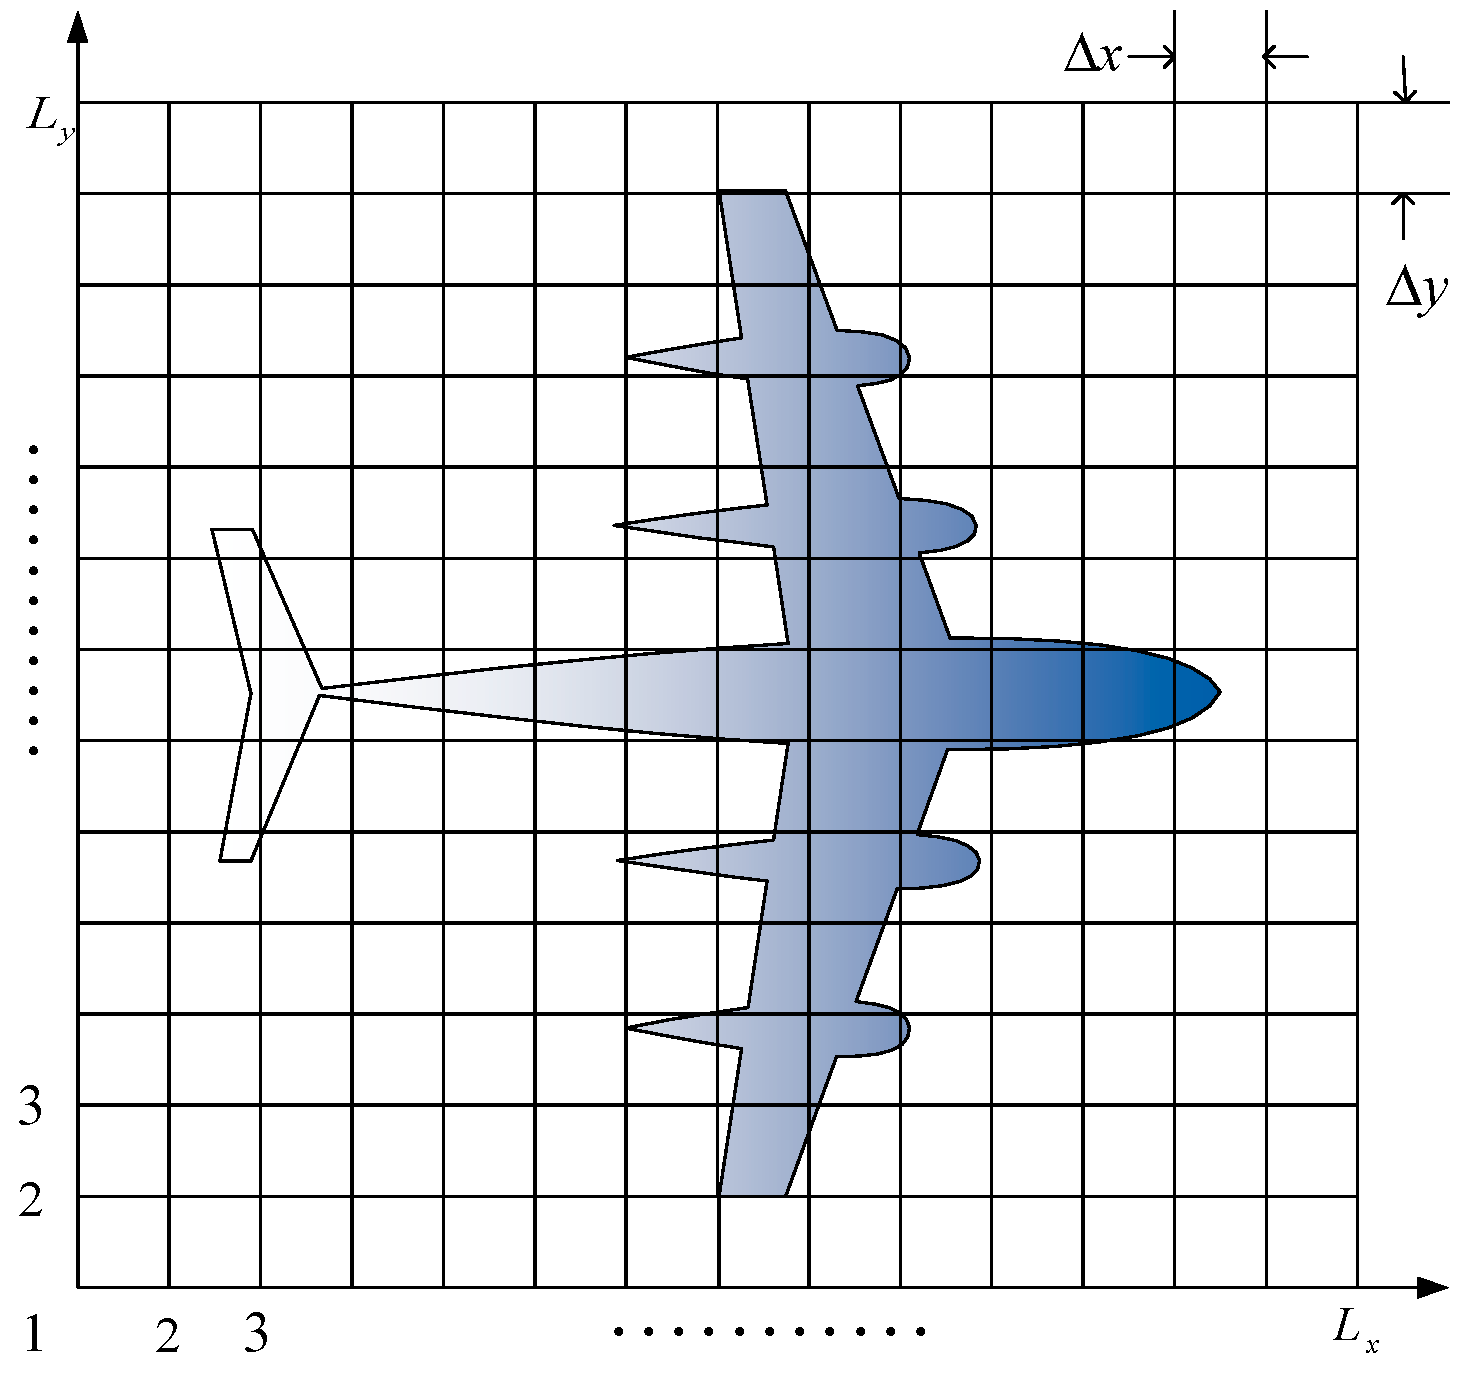
2. GTD Model and 2D RADAR Sparse Representation

According to electromagnetic field theory, the echo signal of radar can be thought of as the vector sum of the reflected signal from multiple scattering centers on the target. Based on the above theory, the GTD model is proposed to describe the backscattered field of an observation target at a sequence of stepped frequencies and angles as the following 2D GTD model, which assumes that the target consists of multiple strong scattering centers.
H θ ( f ) = m = 1 M σ ( x m y m ) exp [ j 4 π f ( x m cos θ + y m sin θ ) c ] ( j f f c ) α m
where E θ ( f ) is the radar echo of the target, and f = f c + ( k 1 ) Δ f is the frequency point, where k = 1 , 2 , 3 , , K . f c refers to the initial frequency, Δ f is the frequency step. Moreover, θ = θ 0 + ( n 1 ) Δ θ is the observation angle, where n = 1 , 2 , 3 , , N . θ 0 refers to the initial angle, Δ θ which is the observation angle step. c is the velocity of light. M is the number of scattering centers σ ( x m y m ) α m and denotes the scattering center’s complex amplitude and frequency-dependence factor with the location ( x m y m ) . It is worth mentioning that the frequency-dependence factor describes the scattering mechanism of the center, and as shown in Table 1, is its definition. In this theoretical model, it takes into account the different scattering characteristics of the target caused by changes in frequency and direction angle, and provides information about the type of scattering center that cannot be accurately expressed in the attenuation index and (Damped Exponential, DE) model, making its approximation closer to the actual scattering mechanism.
The target can be divided into small pixel grid as in the following picture in Figure 1.
Every pixel grid can be regarded as a scattering center, and so the radar echo can be represented as the sum of the echo from every scattering center:
H θ ( f ) = i = 1 L x g = 1 L y σ ( x i y g ) exp [ j 4 π f ( x i cos θ + y g sin θ ) c ] ( j f f c ) α i , g
which requires our special attention is the sparse feature of the L x × L y scattering centers, there are few large complex amplitude in radar echo.
Then, Formula (2) can be represented in matrix-vector form:
[ H θ 1 ( f 1 ) H θ 1 ( f K ) H θ 2 ( f 1 ) H θ 2 ( f K ) H θ N ( f K ) ] = [ E θ 1 f 1 ( 11 ) 1 E θ 1 f 1 ( L x L y ) 1 E θ 1 f 1 ( L x L y ) 1 E θ 1 f K ( 11 ) 1 E θ 1 f K ( L x L y ) 1 E θ 1 f K ( L x L y ) 1 E θ 2 f 1 ( 11 ) 1 E θ 2 f 1 ( L x L y ) 1 E θ 2 f 1 ( L x L y ) 1 E θ 2 f K ( 11 ) 1 E θ 2 f K ( L x L y ) 1 E θ 2 f K ( L x L y ) 1 E θ N f K ( 11 ) 1 E θ N f K ( L x L y ) 1 E θ N f K ( L x L y ) 1 ] [ σ ( 11 ) 1 σ ( L x L y ) 1 σ ( 11 ) 0.5 σ ( L x L y ) 0.5 σ ( L x L y ) 1 ] H = E σ
H is the radar echo vector in all frequencies and observation angles. σ is the complex amplitude vector. E is a dictionary matrix with the definition in (4).
H is the echo vector defined in time-frequency domain, contains all frequency and observation angle information, and the dictionary matrix E is defined in (4), σ is the complex amplitude vector of scattering centers.
E = [ E 1 E 0.5 E 0 E 0.5 E 1 ] E p = [ E θ 1 f 1 ( 11 ) p E θ 1 f 1 ( L x L y ) p E θ N f K ( 11 ) p E θ N f K ( L x L y ) p ] E θ n f k ( x i y g ) p = ( j f f c ) p exp [ j 4 π f k ( x i cos θ n + y g sin θ n ) c ]

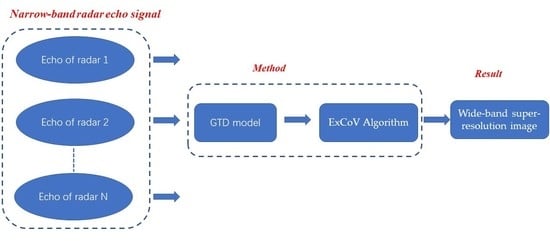
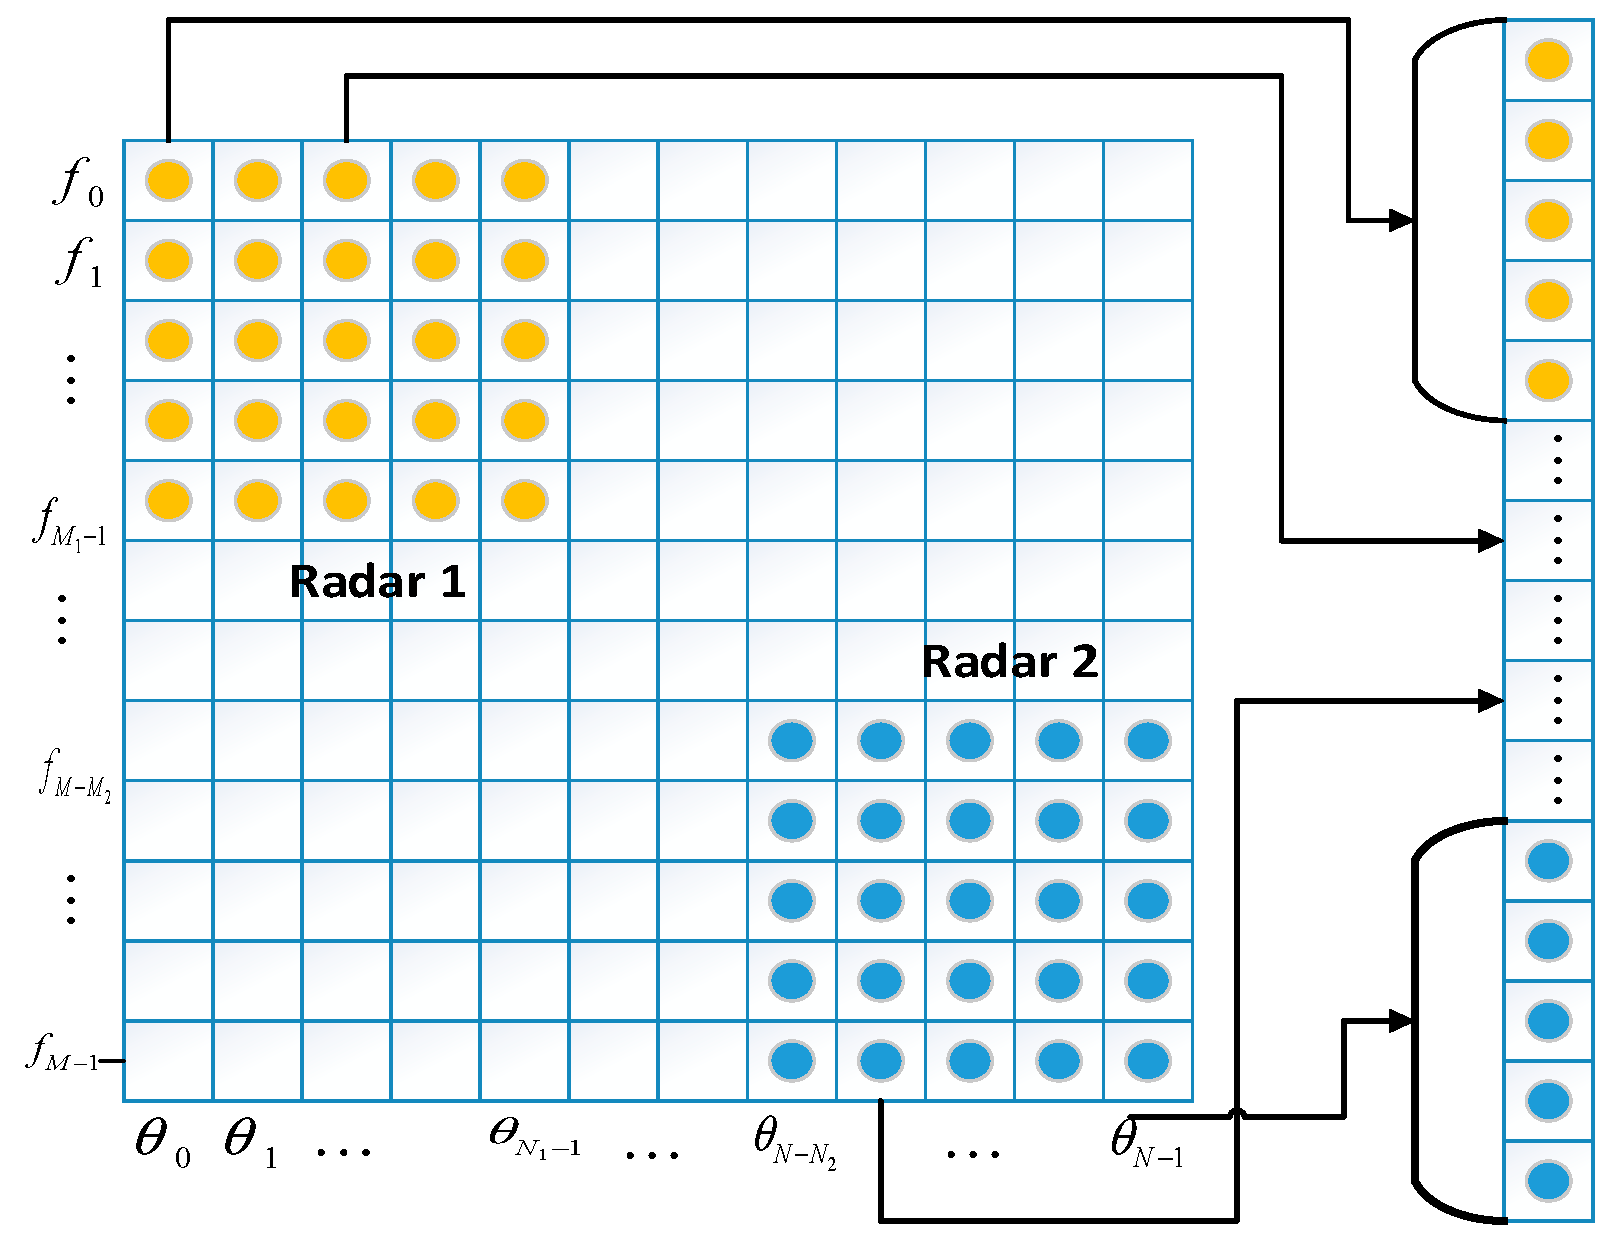
3. Review of the Multi-Radar Fusion 2D Imaging Frame and ExCoV Algorithm Theory

The radars work on different frequency bands and observation angles for two radar systems, as shown in Figure 2.
Regarding observation frequency and angle, we can only obtain the echo of radar 1 and 2. Furthermore, the observation angle is more diminutive in radar 1 than in radar 2.
Hence, the echo of the two radar systems is explained as follows:
H ¯ = [ H ¯ 1 H ¯ 2 ] T = E ¯ σ
where H ¯ 1 is radar 1 echo, represented by yellow dots, and H ¯ 2 is radar 2 echo, represented by blue dots (see Figure 3). The white part in Figure 3 is unknown and needs to be interpolated. E ¯ is the corresponding dictionary of radar 1 and radar 2.
Based on the above analysis, the super-resolution problem of Multi-radar Fusion 2D Imaging can be transformed into the canonical form of a sparse representation problem and the amplitude vector σ can be obtained by the solution of the optimization problem (6).
The high-resolution 2D imaging with full-band angle echo can be accomplished by multiplying E with σ using the data from multiband and multi-angle.
min σ = σ l 0 s . t . H ¯ E ¯ σ < δ
Usually, the number of columns in the dictionary E ¯ is larger than the number of its rows. (6) is an underdetermined problem; solving it is an NP-hard problem. Many sparse representation algorithms have been used to solve this problem, such as OMP, FOCUSS, BCS, etc. Because radar works in noisy environments, we use the ExCoV algorithm [3,4] to solve the problem of (6).
The additive Gaussian noise is introduced into the multi-radar echo, and the pdf can be written as:
p ( H ¯ | σ , σ 2 ) = N ( H ¯ ; E ¯ σ , σ 2 I )
Considering the sparsity feature of the real signal, different variance components are given to different signal elements, while the same variance component to the rest. The algorithm implementation mainly has two core processes: one is the determination of the essential signal elements and the insignificant signal index, and the other is the estimation of the model parameters in the case of above determination. The model parameters are as follows:
ϑ = ( U , ρ U ) ρ U = ( δ U , η 2 , σ 2 )
where σ is the amplitude vector, ϑ is a variable parameter, η is the incoherent parameters, characterizes the phase difference due to the incoherence of the two radars. As long as the parameter ϑ can be correctly estimated, accurate estimation of the corresponding parameters can be achieved. Under the determation of the set of essential and insignificant signal index, the corresponding parameters can be found by maximizing the likelihood function described below:
p ( H | ϑ ) = p ( H | σ , σ 2 ) · p ( σ | δ U , η 2 ) d σ = N ( H , P 1 ( ϑ ) ) P ( ϑ ) = [ R U D U ( δ U ) R U T + η 2 R Q R Q T + σ 2 E ] 1
where U and Q are, respectively, the index of essential and insignificant signal elements. m U is the dimension of the U index. D U ( δ U ) = d i a g ( δ A , 1 2 , δ A , 2 2 , , δ A , m U 2 ) and D B ( η 2 ) = η 2 I m Q are the covariance matrices of the echo data. R U and R Q are the base matrix of U and Q. Increase the U index by maximizing the generalized maximum likelihood function, and then decrease U index by minimizing the generalized maximum likelihood function until there is no more extended changes, so the ϑ can be acquired from (9).

4. Experimental Results

In this part, two examples are given to verify the effectiveness of the proposed method based on the analytical and simulated data.

4.1. Example 1: Analytical Result

The backscattered field consists of 5 scattering centers which are given as
H θ ( f ) = m = 1 5 σ ( x m y m ) ( j f f c ) α m exp [ j 4 π f ( x m cos θ + y m sin θ ) / c ]
The parameters of the scattering centers are shown in Table 2.
Assume the full frequency range is 10 GHz to 14 GHz with an 80 MHz frequency step, and the total observation angle range is −5° to 5° with a 0.5° observation angle step; we only have data on the scattered field of two sub-radars. Radar 1 has a frequency band of 10 GHz to 10.8 GHz and an observation angle of −5° to −1.5°. The frequency band for radar 2 is 13.2 GHz to 14 GHz, with an observation angle range of 1.5° to 5°. Figure 4 depicts the fundamental part of the fusion data obtained by different algorithms at different SNRs. Figure 4 shows that in 10 dB SNR, the complete fitted band data 0° obtained by BCS algorithms, ExCoV algorithms, and the actual complete band data agree well. In 4 dB SNR, however, the mismatch error between complete fitted band data 0° obtained by BCS algorithms and actual complete band data is much larger than that of complete fitted band data 0° obtained by ExCoV algorithms, as shown in Figure 5.
Radar 1 and radar 2 have low resolution and blurred imaging due to insufficient bandwidth and viewing angle, as shown in Figure 6a,b. At a signal-to-noise ratio of 10 dB, both BCS method estimation and ExCoV method estimation can obtain good fusion imaging results, as shown in Figure 6c,d. However, when the signal-to-noise ratio is reduced to 4 dB, the BCS method cannot accurately estimate the incoherent parameters due to the low signal-to-noise ratio: the imaging quality is reduced, the image is blurred, and false spots appear (Figure 6e), while the ExCoV method can still accurately estimate the incoherent parameters, and the imaging effect (Figure 6f) is closer to the full-band full-angle imaging results (Figure 6g).
Aiming at a multi-radar system, it is worth mentioning that the single radar frequency band has an important influence on the multi-radar fusion imaging result. We assign the definition of the loss rate of the bandwidth in every observation angle as:
blr = b a n d w i d t h l o s s r a t e = 1 r a d a r 1 band + r a d a r 2 band true full band
The (MSE) of the fitted band in every observation is assigned as follows (MES is the average deviation between the estimated value and the true value):
m s e = E θ ( : ) e s t i m a t e d E θ ( : ) t r u e M
The application of fitted data has a significant impact on imaging quality. Figure 7 shows how the fitted band data is used in each observation. We can see that as blr increases, the mse becomes more significant. Furthermore, the mse of the ExCoV algorithm-fitted data is small in both high and low SNR, whereas the mse of the BCS algorithm-fitted data is large in low SNR. This partially validates the proposed method’s anti-noise performance. Nonetheless, it is worth noting that the analysis is preliminary, and the relationship between the bandwidth loss rate and the imaging results should be reduced in the future.

4.2. Example 2: Simulation Outcomes

Figure 8 depicts a physical warhead model as the radar target and measures 0.9 m in length and 0.6 m in width. The PO method simulates the warhead model’s VV polarization backscattered field. The frequency range is from 10 GHz to 14 GHz with an 80 MHz frequency step, and the observation angle range is from −5° to 5° with a 0.5 observation angle step. We only have information on the scattered field of two sub-radars. Furthermore, the parameters of the sub-radars are identical to those in Example 1.
Figure 9 shows a two-dimensional radar image of the warhead model. The radar 1 and 2 images are shown in Figure 9a,b, which are blurry due to the low resolution. Images obtained by the multi-radar fusion technique based on the BCS and ExCoV algorithms in 10 dB SNR are shown in Figure 9c,d. Figure 9 shows how the images agree with the full-band complete angle data (e). Nonetheless, the image based on the BCS algorithm becomes blurry at 4 dB SNR. In contrast, the ExCoV algorithm-based method is still visible, and the shapes and sizes can be seen in the end, proving the effectiveness of the proposed method in low SNR.

4.3. Example 3: Comparison of Simulation Results

The electromagnetic high-frequency algorithm simulation of another warhead target obtains the radar echo, and the warhead model is shown in the Figure 10:
The radar system is composed of two radars, working in the full frequency band 12–16 GHz, frequency interval 20 MHz, frequency sampling points 201, radar 1 working bandwidth band 12–12.8 GHz, frequency interval 20 MHz, frequency sampling point 41 radar 2 working bandwidth 15.2–16 GHz, frequency interval 20 MHz, frequency sampling point 41. The observation angle is −90~90°, the interval is 1°, the radar target observation is 181 angles, and the working frequency band is missing by 50% under the same viewing angle. Grid discretization is 0.025.
The BP imaging results of reconstructing the same viewing angle echo at 4 dB signal-to-noise ratio and completing BP imaging are as follows:
From the simulation results shown in Figure 11, it can be seen that for the same viewing angle multi-band fusion imaging, when the missing band reaches 60% and the signal-to-noise ratio is 4 dB, the imaging quality of the Reconstructed Echo BP by the ExCoV method is almost the same as the original full-band echo BP imaging quality. However, the echo imaging and original full-band imaging after ExCoV reconstruction can clearly see the fine structure of the warhead and other structural information, which also proves that the proposed method can achieve better echo reconstruction under low signal-to-noise ratio and realize high-resolution imaging with multi-band fusion of the same viewing angle.

5. Conclusions

The paper describes a frame that uses the super-resolution multi-radar fusion 2D imaging technique. The two-dimensional GTD model constructs a dictionary of the radar echo’s sparse representation. The ExCoV algorithm is used to solve the underdetermined equation and obtain full band, complete angle data via the full dictionary matrix, increasing the bandwidth and observation angle data and improving 2D radar imaging without changing the radar hardware system. Moreover, SNR and the bandwidth loss rate influence fusing imaging results is investigated. According to the simulation, the resolution of this method’s 2D imaging is superior to that of the sub-radar. The method’s accuracy and effectiveness are thus validated. Future work will include adapting the presented framework to the complex electromagnetic environment and investigating the impact of interference and clutter. Furthermore, a more precise model should be analyzed to fit the complex target’s radar echo.
As an important means of super-resolution imaging, fusion imaging has attracted more and more attention from scholars in recent years. The authors believe that fusion imaging still has several key issues worth in-depth study, including, first of all, the signal model. The choice of a more realistic signal model can undoubtedly describe the physical model more appropriately, the more accurate the model, the closer the reconstruction signal is to the actual broadband signal [10,11]. Therefore, the study of signal model will be an important means to improve the quality of fusion imaging in the future. Secondly, as the reviewer suggested, when the target does not fall exactly on the divided grid, it is necessary to study a special algorithm to compensate, so as to reduce the error. Third, studying the fusion imaging method suitable for the motion platform can undoubtedly greatly improve the adaptability of the algorithm, but how to extract the rotation information of the platform and reduce the influence of translational information on imaging will be a major technical difficulty.

Author Contributions

Conceptualization, S.S.; methodology, D.S.; formal analysis, D.D. All authors have read and agreed to the published version of the manuscript.

Funding

This work was supported by the National Natural Science Foundation of China under Grant 61931021.

Data Availability Statement

The data is unavailable due to privacy or ethical restrictions.

Conflicts of Interest

The authors declare no conflict of interest.

References

  1. Wang, L.; Wen, W.; Wei, M. Super-resolution SAR image reconstruction via Generative adversarial network. In Proceedings of the 12th International Symposium Antennas, Propagation, and EM Theory (ISAPE), Hangzhou, China, 3–6 December 2018; pp. 441–461. [Google Scholar]
  2. Ji, B.; Wang, Y.; Zhao, B. Multi-static InISAR imaging for ships under sparse aperture. J. Syst. Eng. Electron. 2022, 33, 575–584. [Google Scholar] [CrossRef]
  3. Li, W.; Liu, L. Fusion of SAR and optical Image for Sea Ice Extraction. J. Ocean. Univ. China 2021, 20, 1440–1450. [Google Scholar] [CrossRef]
  4. Özdemir, C. Inverse Synthetic Aperture Radar Imaging with MATLAB Algorithms; John Wiley & Sons: Hoboken, NJ, USA, 2012. [Google Scholar]
  5. Fan, Y.; He, F.; Zhu, J. Multi-band Radar Signal Fusion based on GTD Model. In Proceedings of the 8th European Conference on Synthetic Aperture Radar, Aachen, Germany, 7–10 June 2010; pp. 1–4. [Google Scholar]
  6. Huan, Z.H.; Chen, R.S. Coherent Processing and Superresolution Technique of Multi-Band Radar Data Based on Fast Sparse Bayesian Learning Algorithm. IEEE Trans. Antennas Propag. 2014, 62, 6217–6227. [Google Scholar]
  7. Wang, J.; Qin, C. A multi-source image fusion algorithm based on gradient regularized convolution sparse representation. J. Syst. Eng. Electron. 2020, 31, 447–459. [Google Scholar]
  8. Xu, Y. Analysis of Multi-sensor Image Fusion. In Proceedings of the 5th International Conference on Electrical and Electronics Engineering and Computer Science, Malang, Indonesia, 16–18 October 2018; pp. 312–318. [Google Scholar]
  9. Su, W.; Wang, H.; Deng, B.; Wang, R. Sparse Bayesian SAR imaging of moving target via the EXCOV method. In Proceedings of the 2014 IEEE Workshop on Statistical Signal Processing (SSP), Gold Coast, Australia, 29 June–2 July 2014; pp. 448–451. [Google Scholar]
  10. Mu, W.; Li, J.; Liu, Y.; Meng, X.; Yang, D. Research on the Image Fusion Technology based on Redundant Contourlet Transform. In Proceedings of the 2019 3rd Scientific Conference on Mechatronics Engineering and Computer Science, Chongqing, China, 11–12 October 2019. [Google Scholar]
  11. Yang, D.; Hu, S.; Liu, S.; Ma, X.; Sun, Y. Multi-focus image fusion based on block matching in 3D transform domain. J. Syst. Eng. Electron. 2018, 29, 415–428. [Google Scholar] [CrossRef]
Figure 1. Small pixel grid of the imaging area.
Remotesensing 15 02108 g001
Figure 2. Configuration of two radar observation system.
Remotesensing 15 02108 g002
Figure 3. Fusion of multiband multi-angle data from multi-radars.
Remotesensing 15 02108 g003
Figure 4. Fitted data in 0° in 10 dB SNR.
Remotesensing 15 02108 g004
Figure 5. Fitted data in 0° in 4 dB SNR.
Remotesensing 15 02108 g005
Figure 6. (a) Radar 1 imaging; (b) radar 2 imaging; (c) fitted by BCS in 10 dB; (d) fitted by ExCoV in 10 dB; (e) fitted by BCS in 4 dB; (f) fitted by ExCoV in 4 dB; (g) a true full-band full angle.
Remotesensing 15 02108 g006
Figure 7. Mse of fitted band data in different blr.
Remotesensing 15 02108 g007
Figure 8. Warhead model.
Remotesensing 15 02108 g008
Figure 9. (a) Radar 1 imaging; (b) radar 2 imaging; (c) fitted by BCS in 10 dB; (d) fitted by ExCoV in 10 dB; (e) fitted by BCS in 4 dB; (f) fitted by ExCoV in 4 dB; (g) true full-band full angle.
Remotesensing 15 02108 g009aRemotesensing 15 02108 g009b
Figure 10. Simulation model.
Remotesensing 15 02108 g010
Figure 11. (a) Raw data image; (b) ExCoV reconstructs the image; (c) image of radar 1; (d) image of radar 2.
Remotesensing 15 02108 g011
Table 1. The definition of the frequency-dependence factor.
α Definition
−1corner diffraction
−0.5edge diffraction
0point scatter
0.5singly curved surface reflection
1flat plate at broadside; dihedral
Table 2. Scattering center parameters of target.
Scattering Center12345
location (x, y)(0.15, 0.2)(0.15, −0.2)(0, 0)(−0.15, 0.2)(−0.15, −0.2)
amplitude11111
scattering type001−0.5−1
Disclaimer/Publisher’s Note: The statements, opinions and data contained in all publications are solely those of the individual author(s) and contributor(s) and not of MDPI and/or the editor(s). MDPI and/or the editor(s) disclaim responsibility for any injury to people or property resulting from any ideas, methods, instructions or products referred to in the content.

