
Multisensor Satellite Data and Field Studies for Unravelling the Structural Evolution and Gold Metallogeny of the Gerf Ophiolitic Nappe, Eastern Desert, Egypt

 , , , , ,
Abstract
:
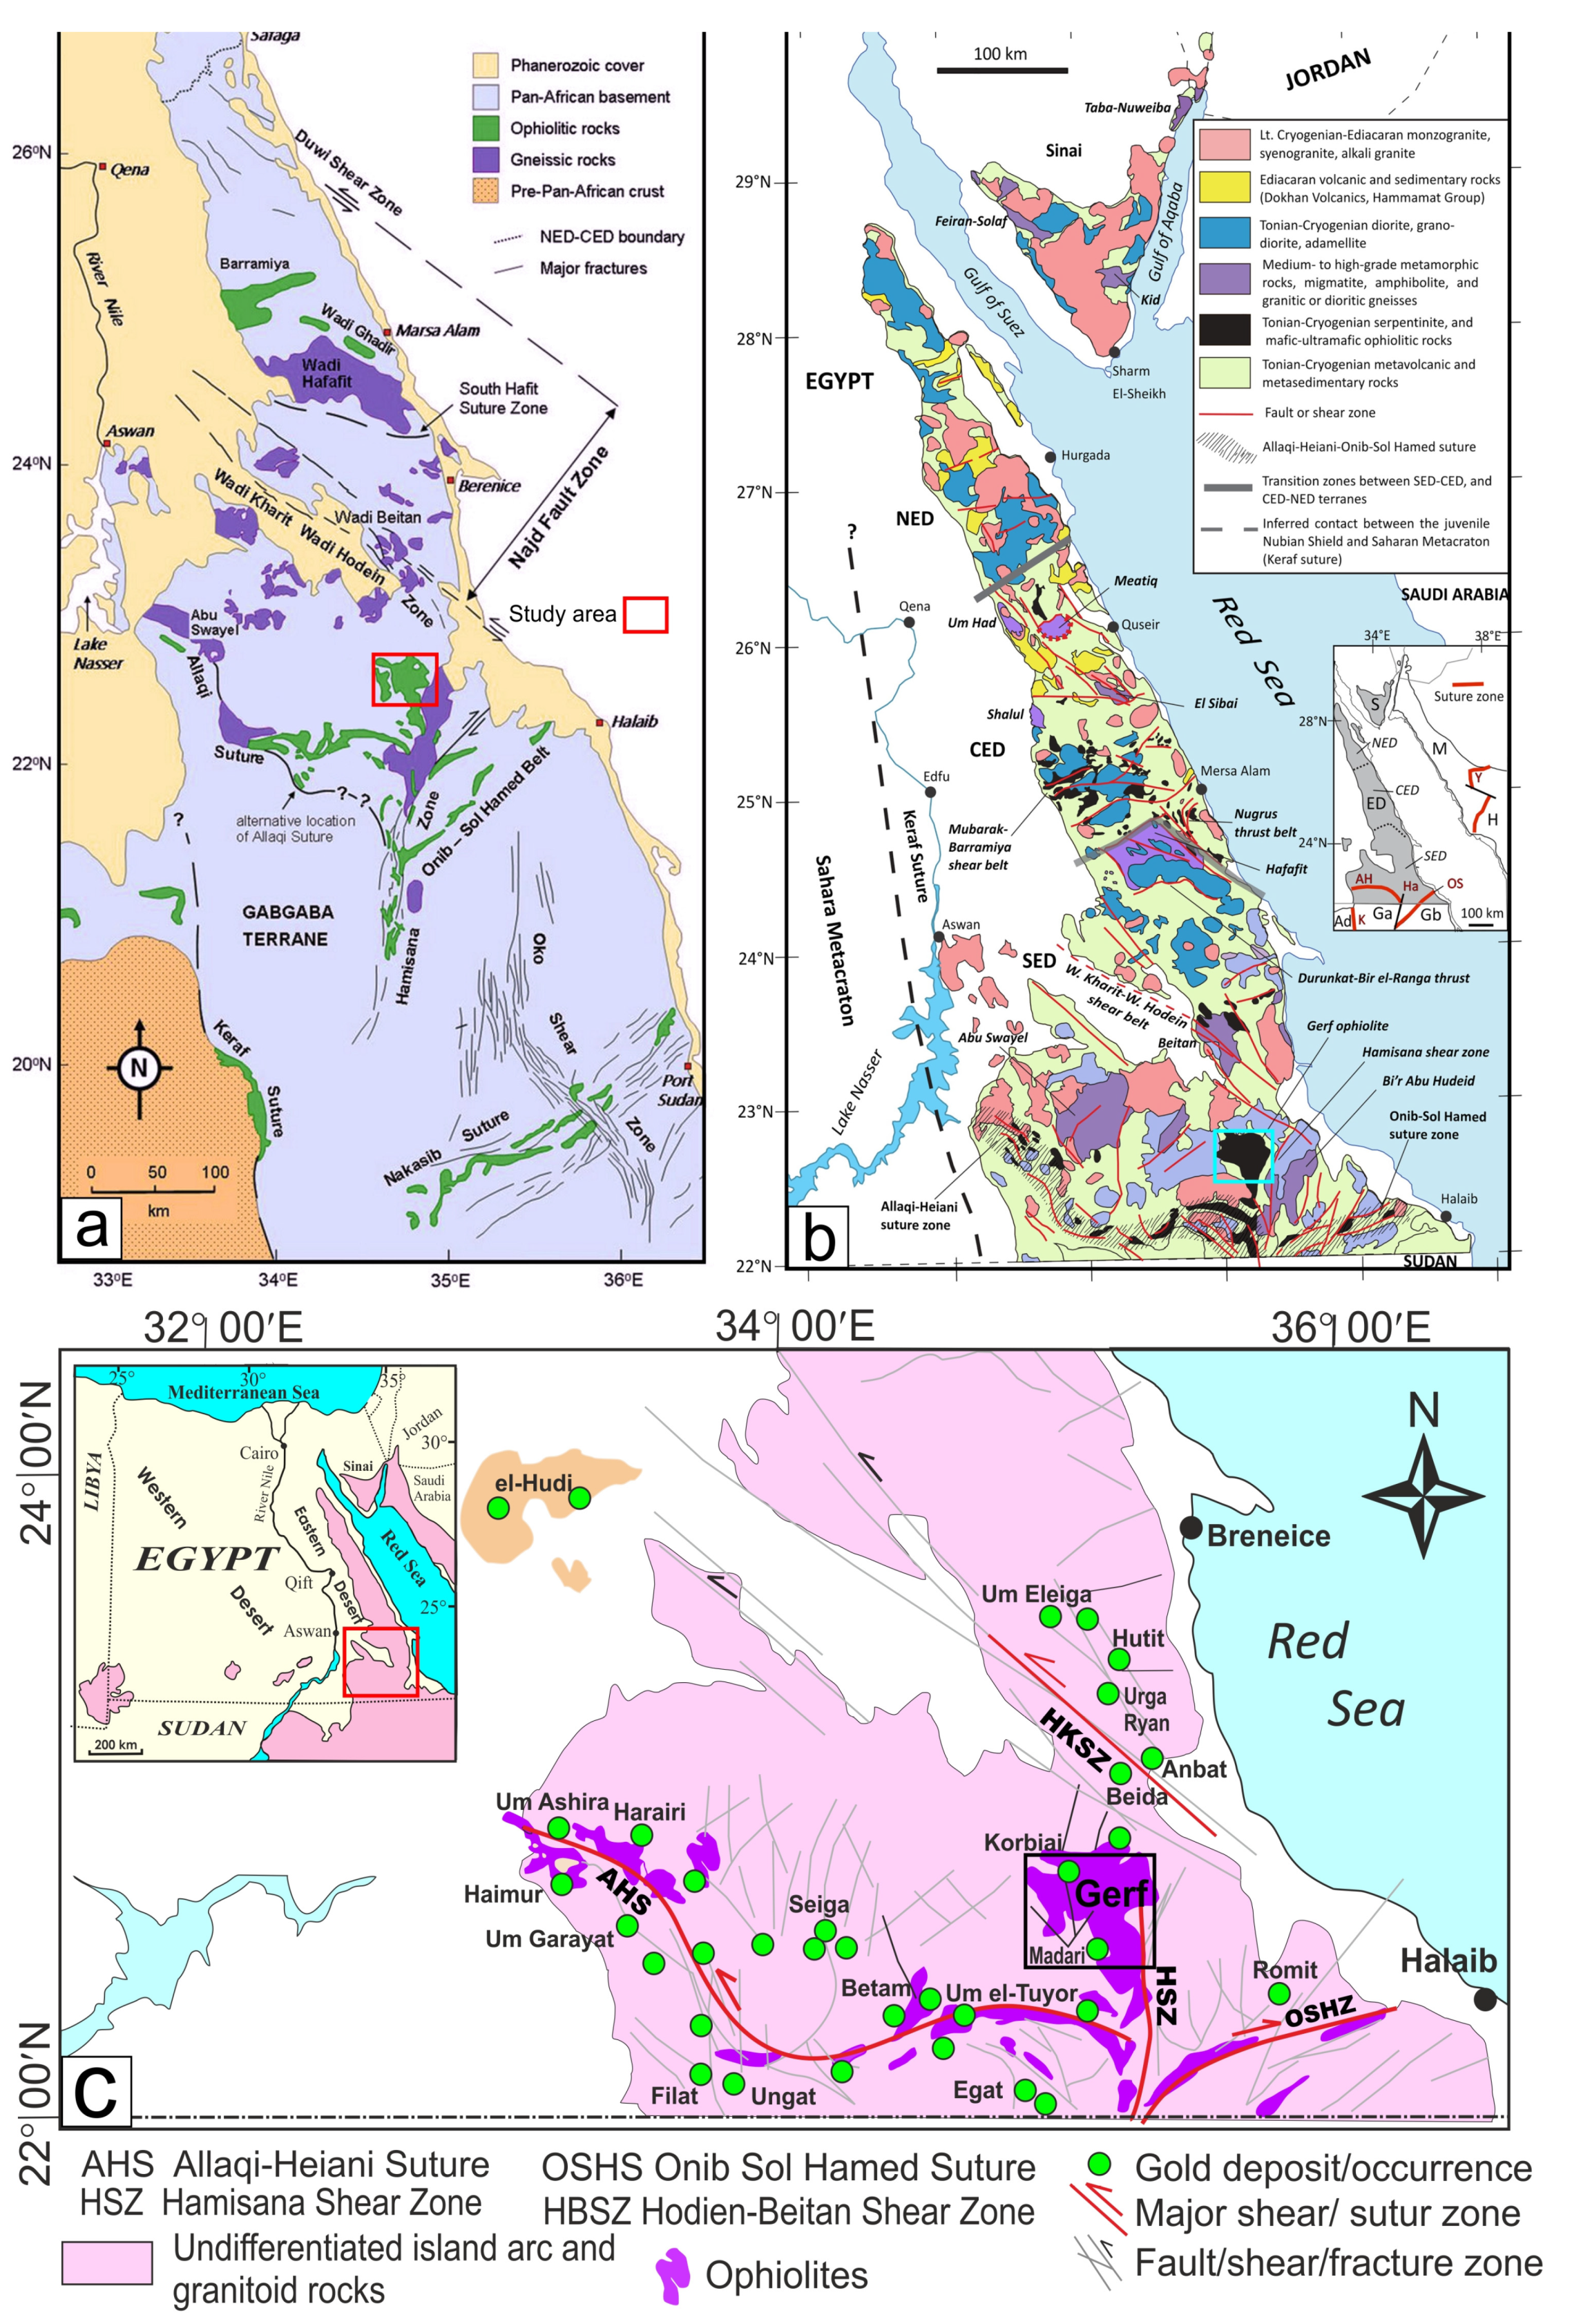
1. Introduction
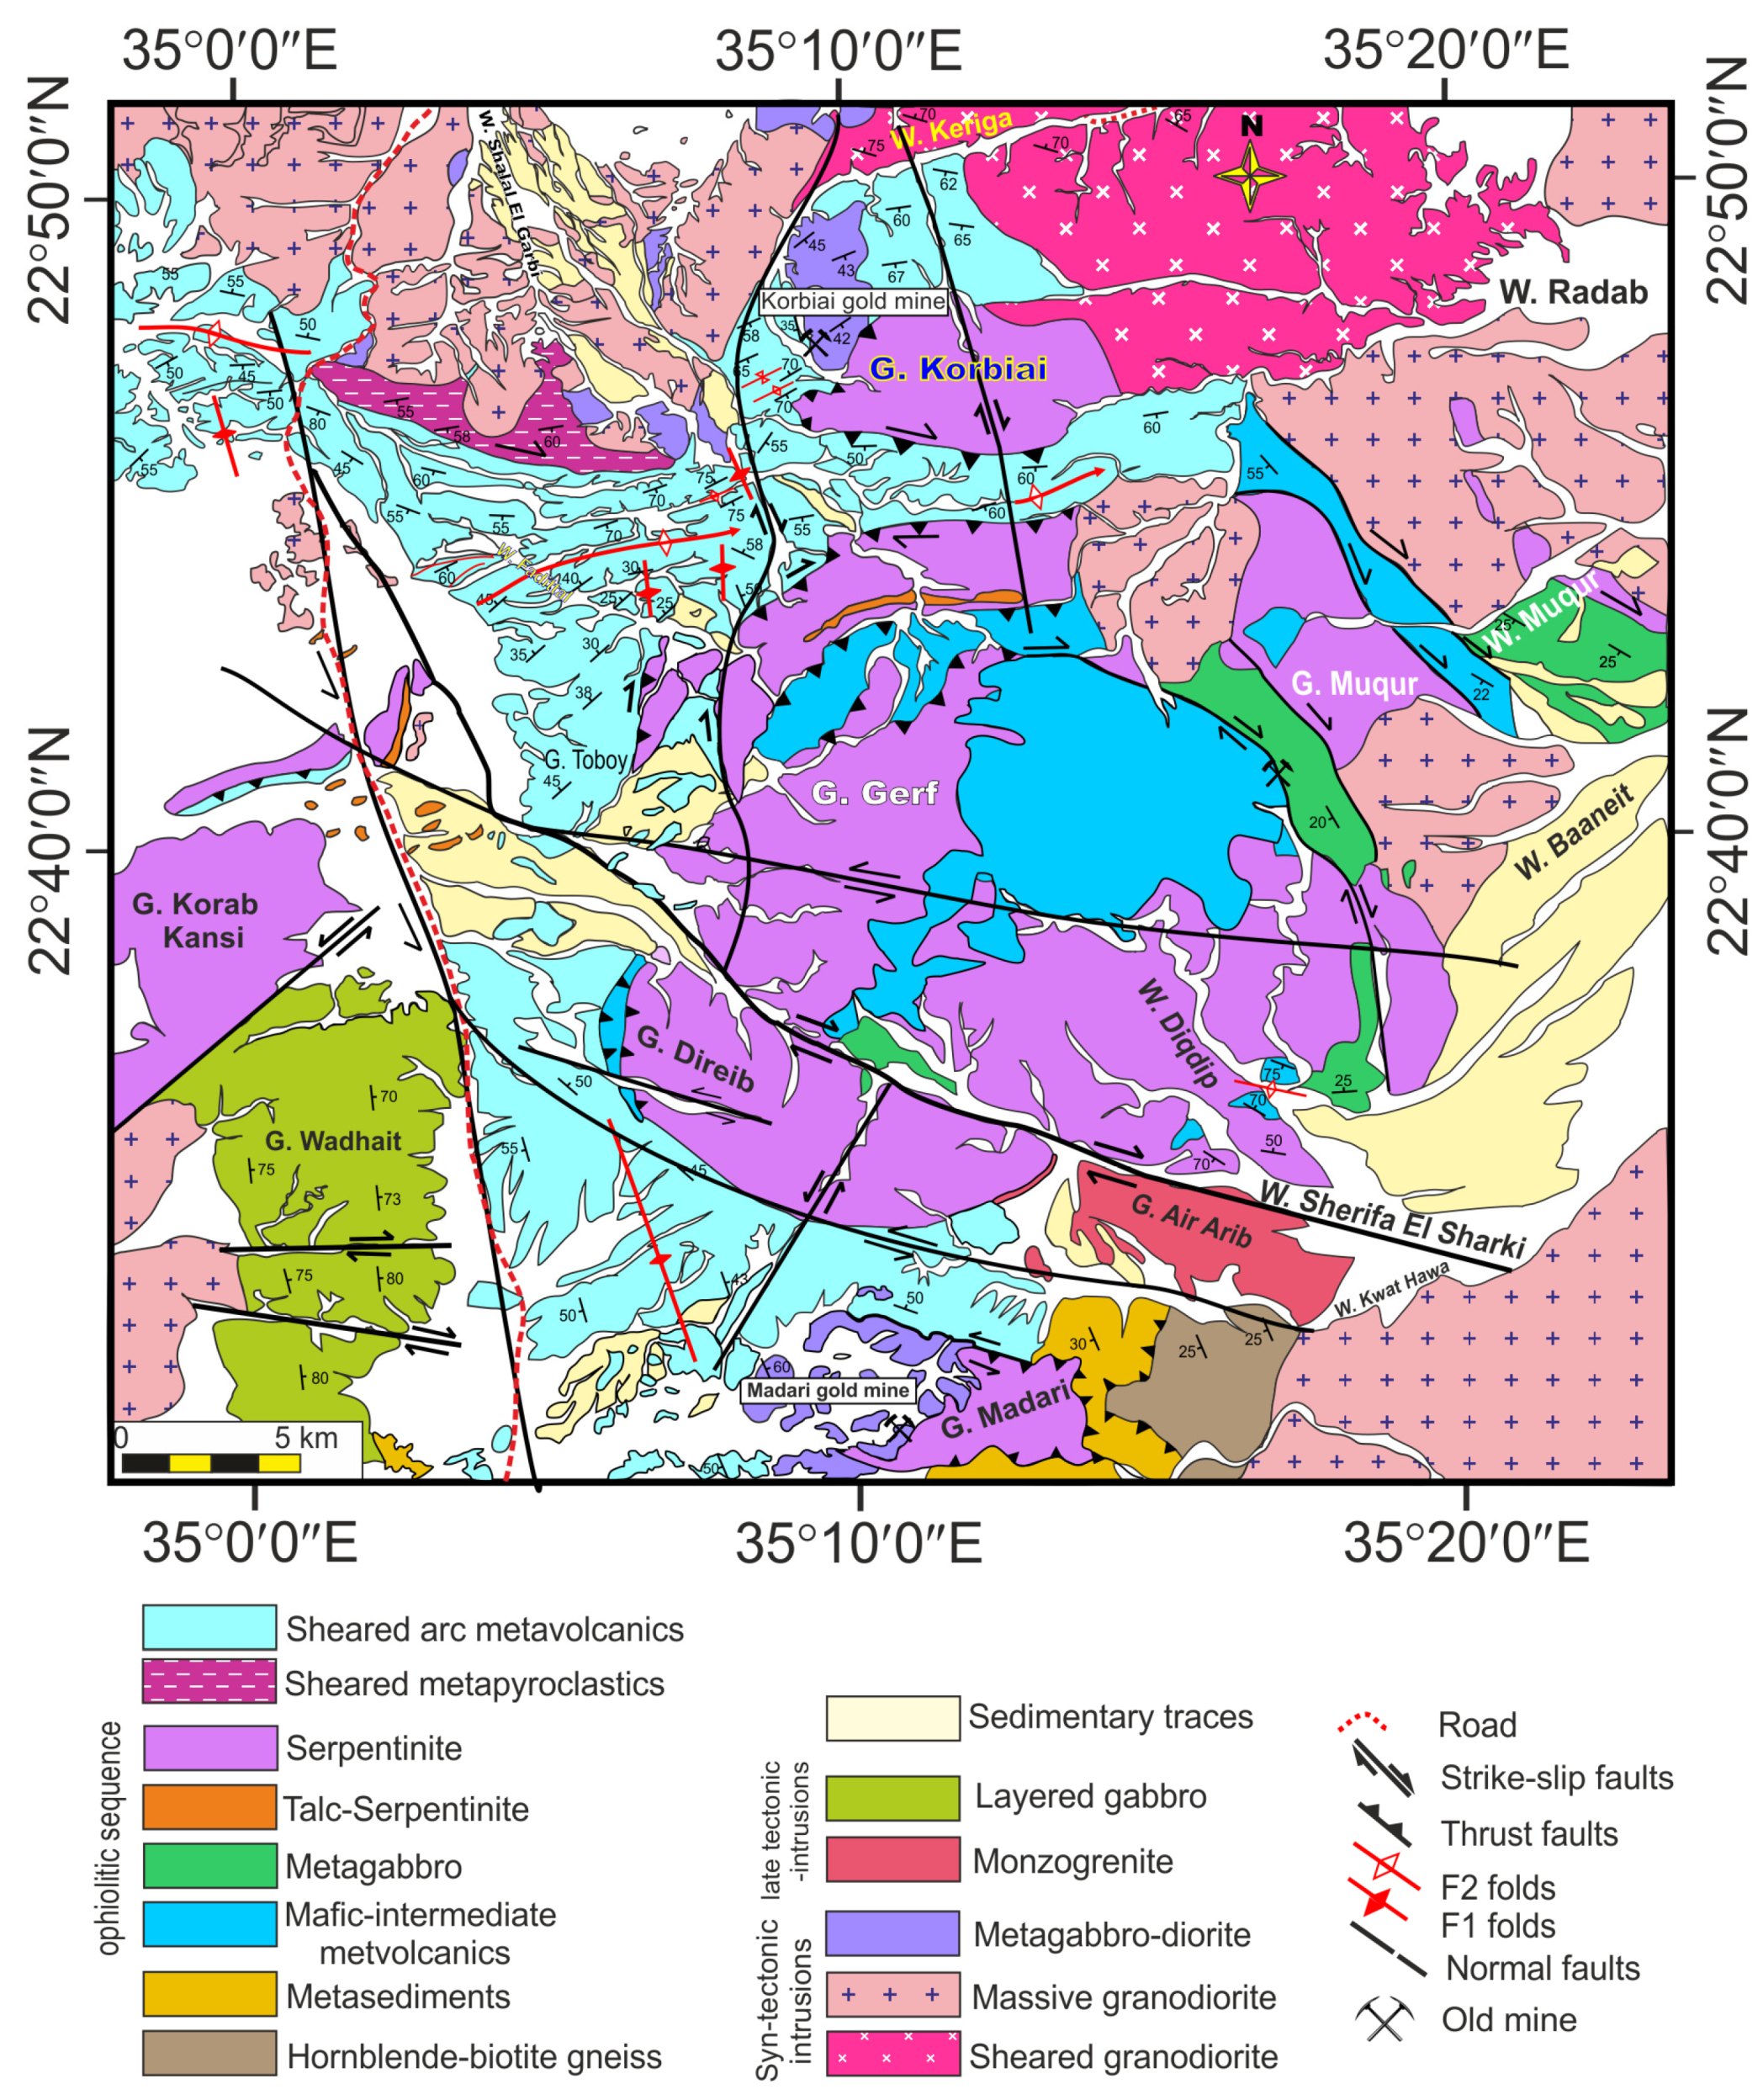
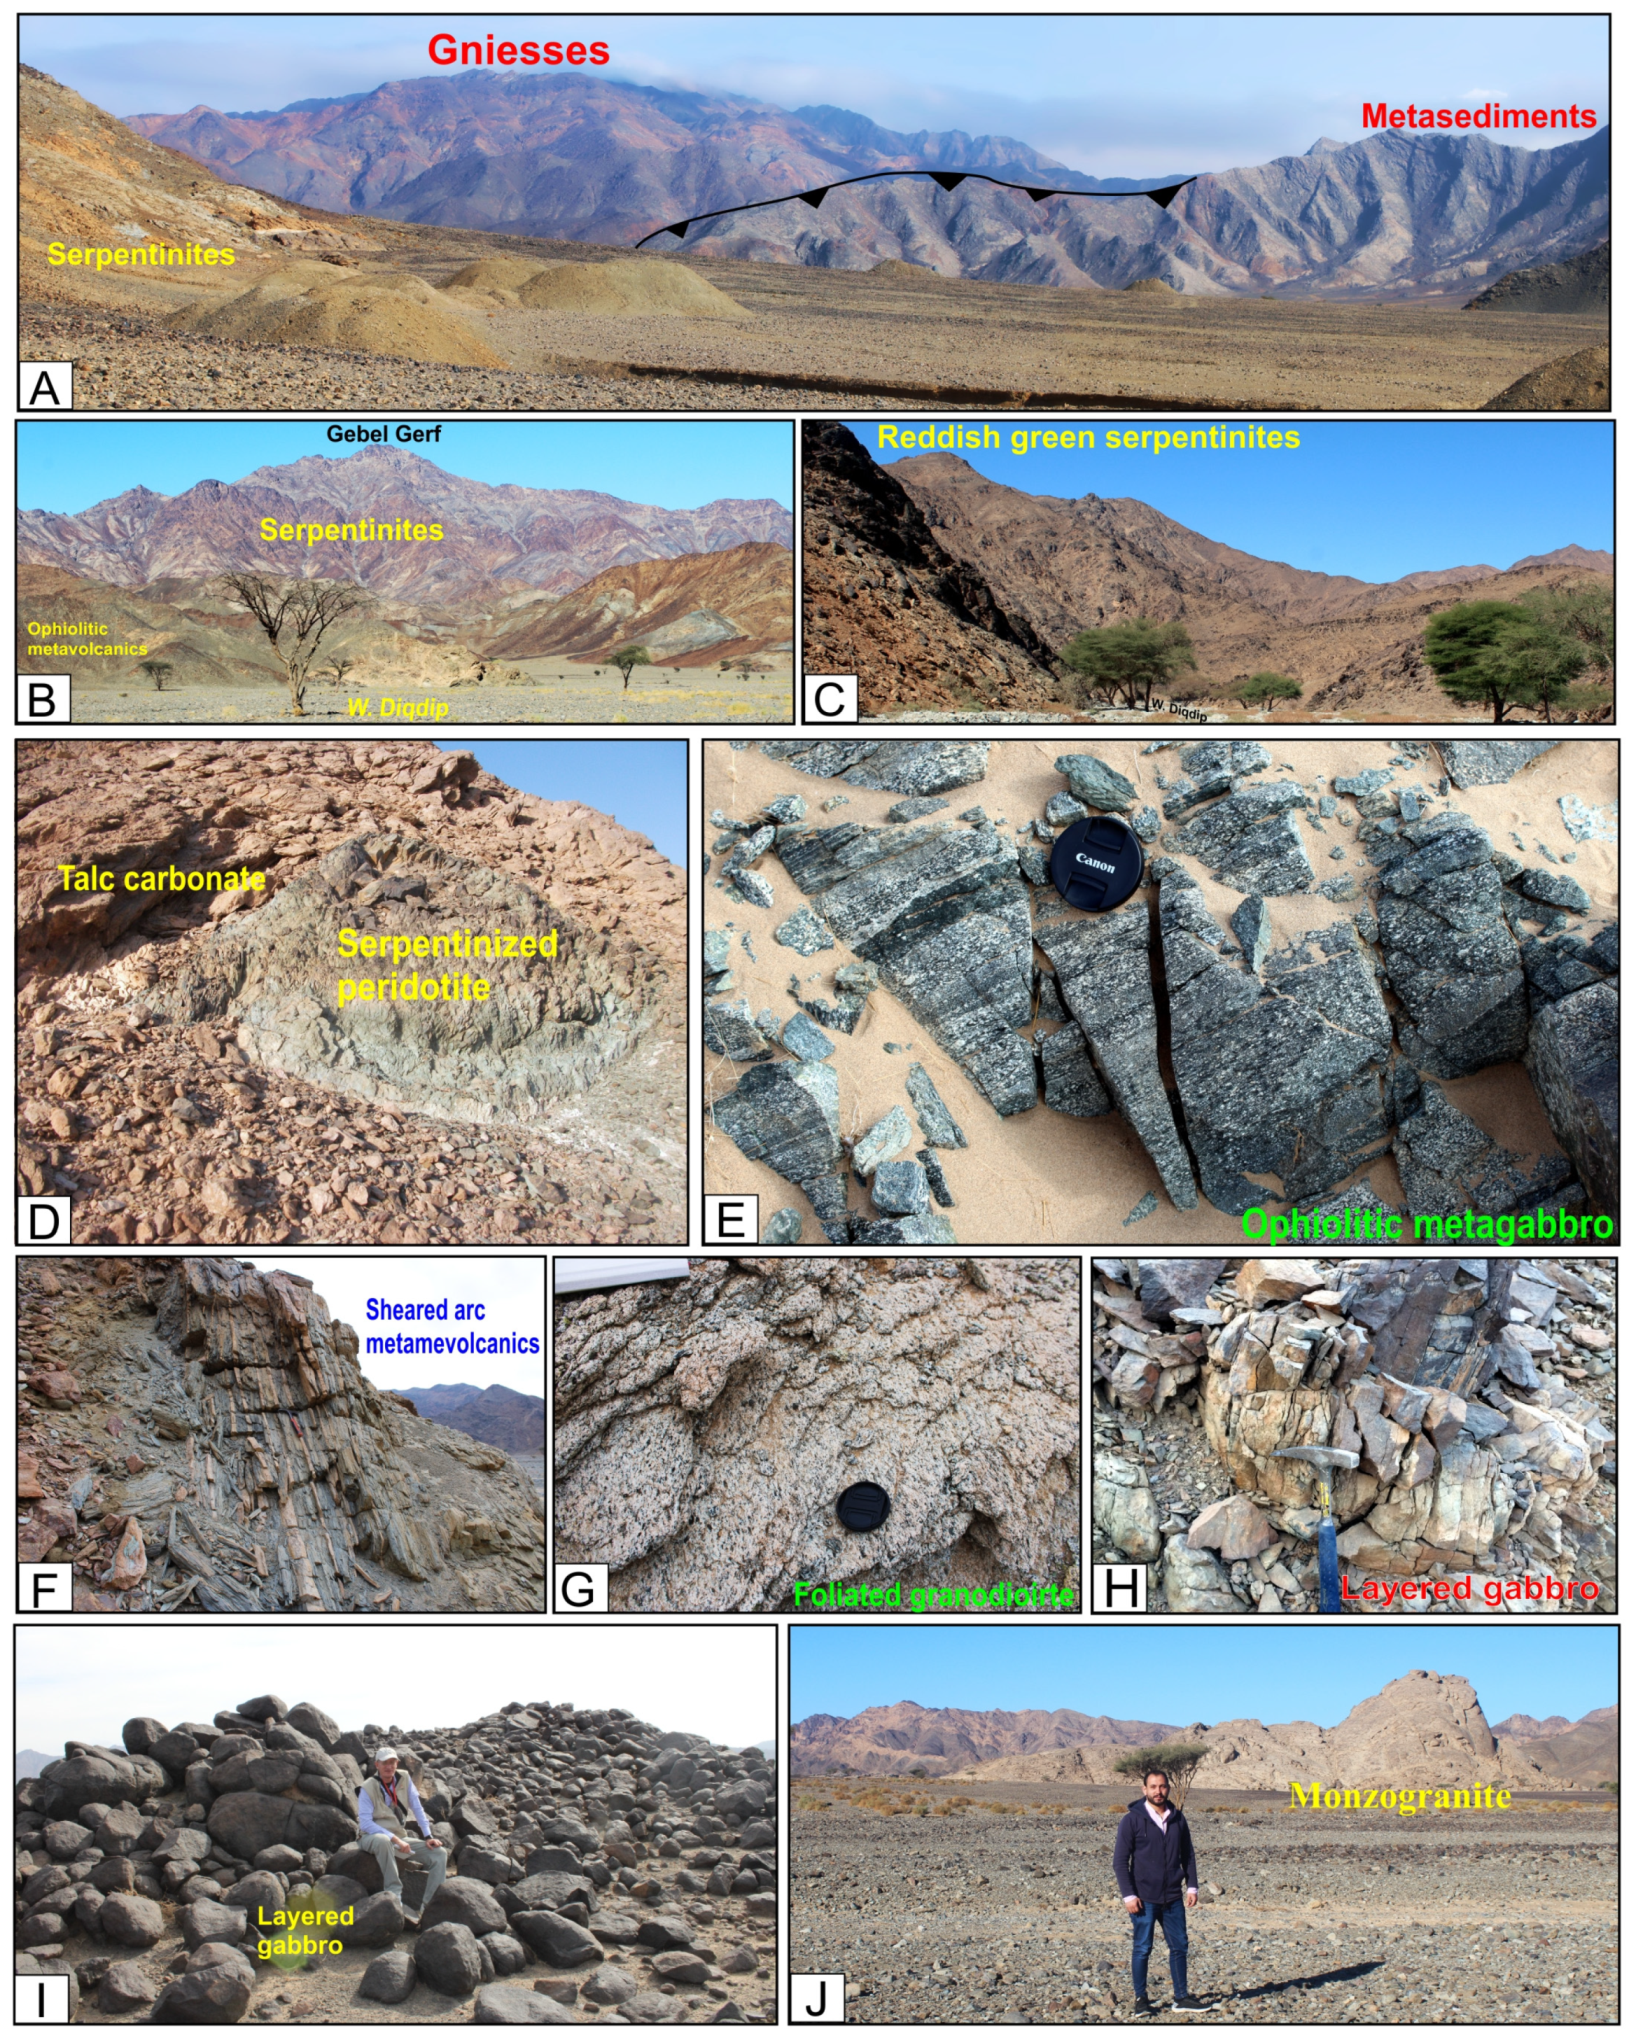
2. Geology of the Gerf Area
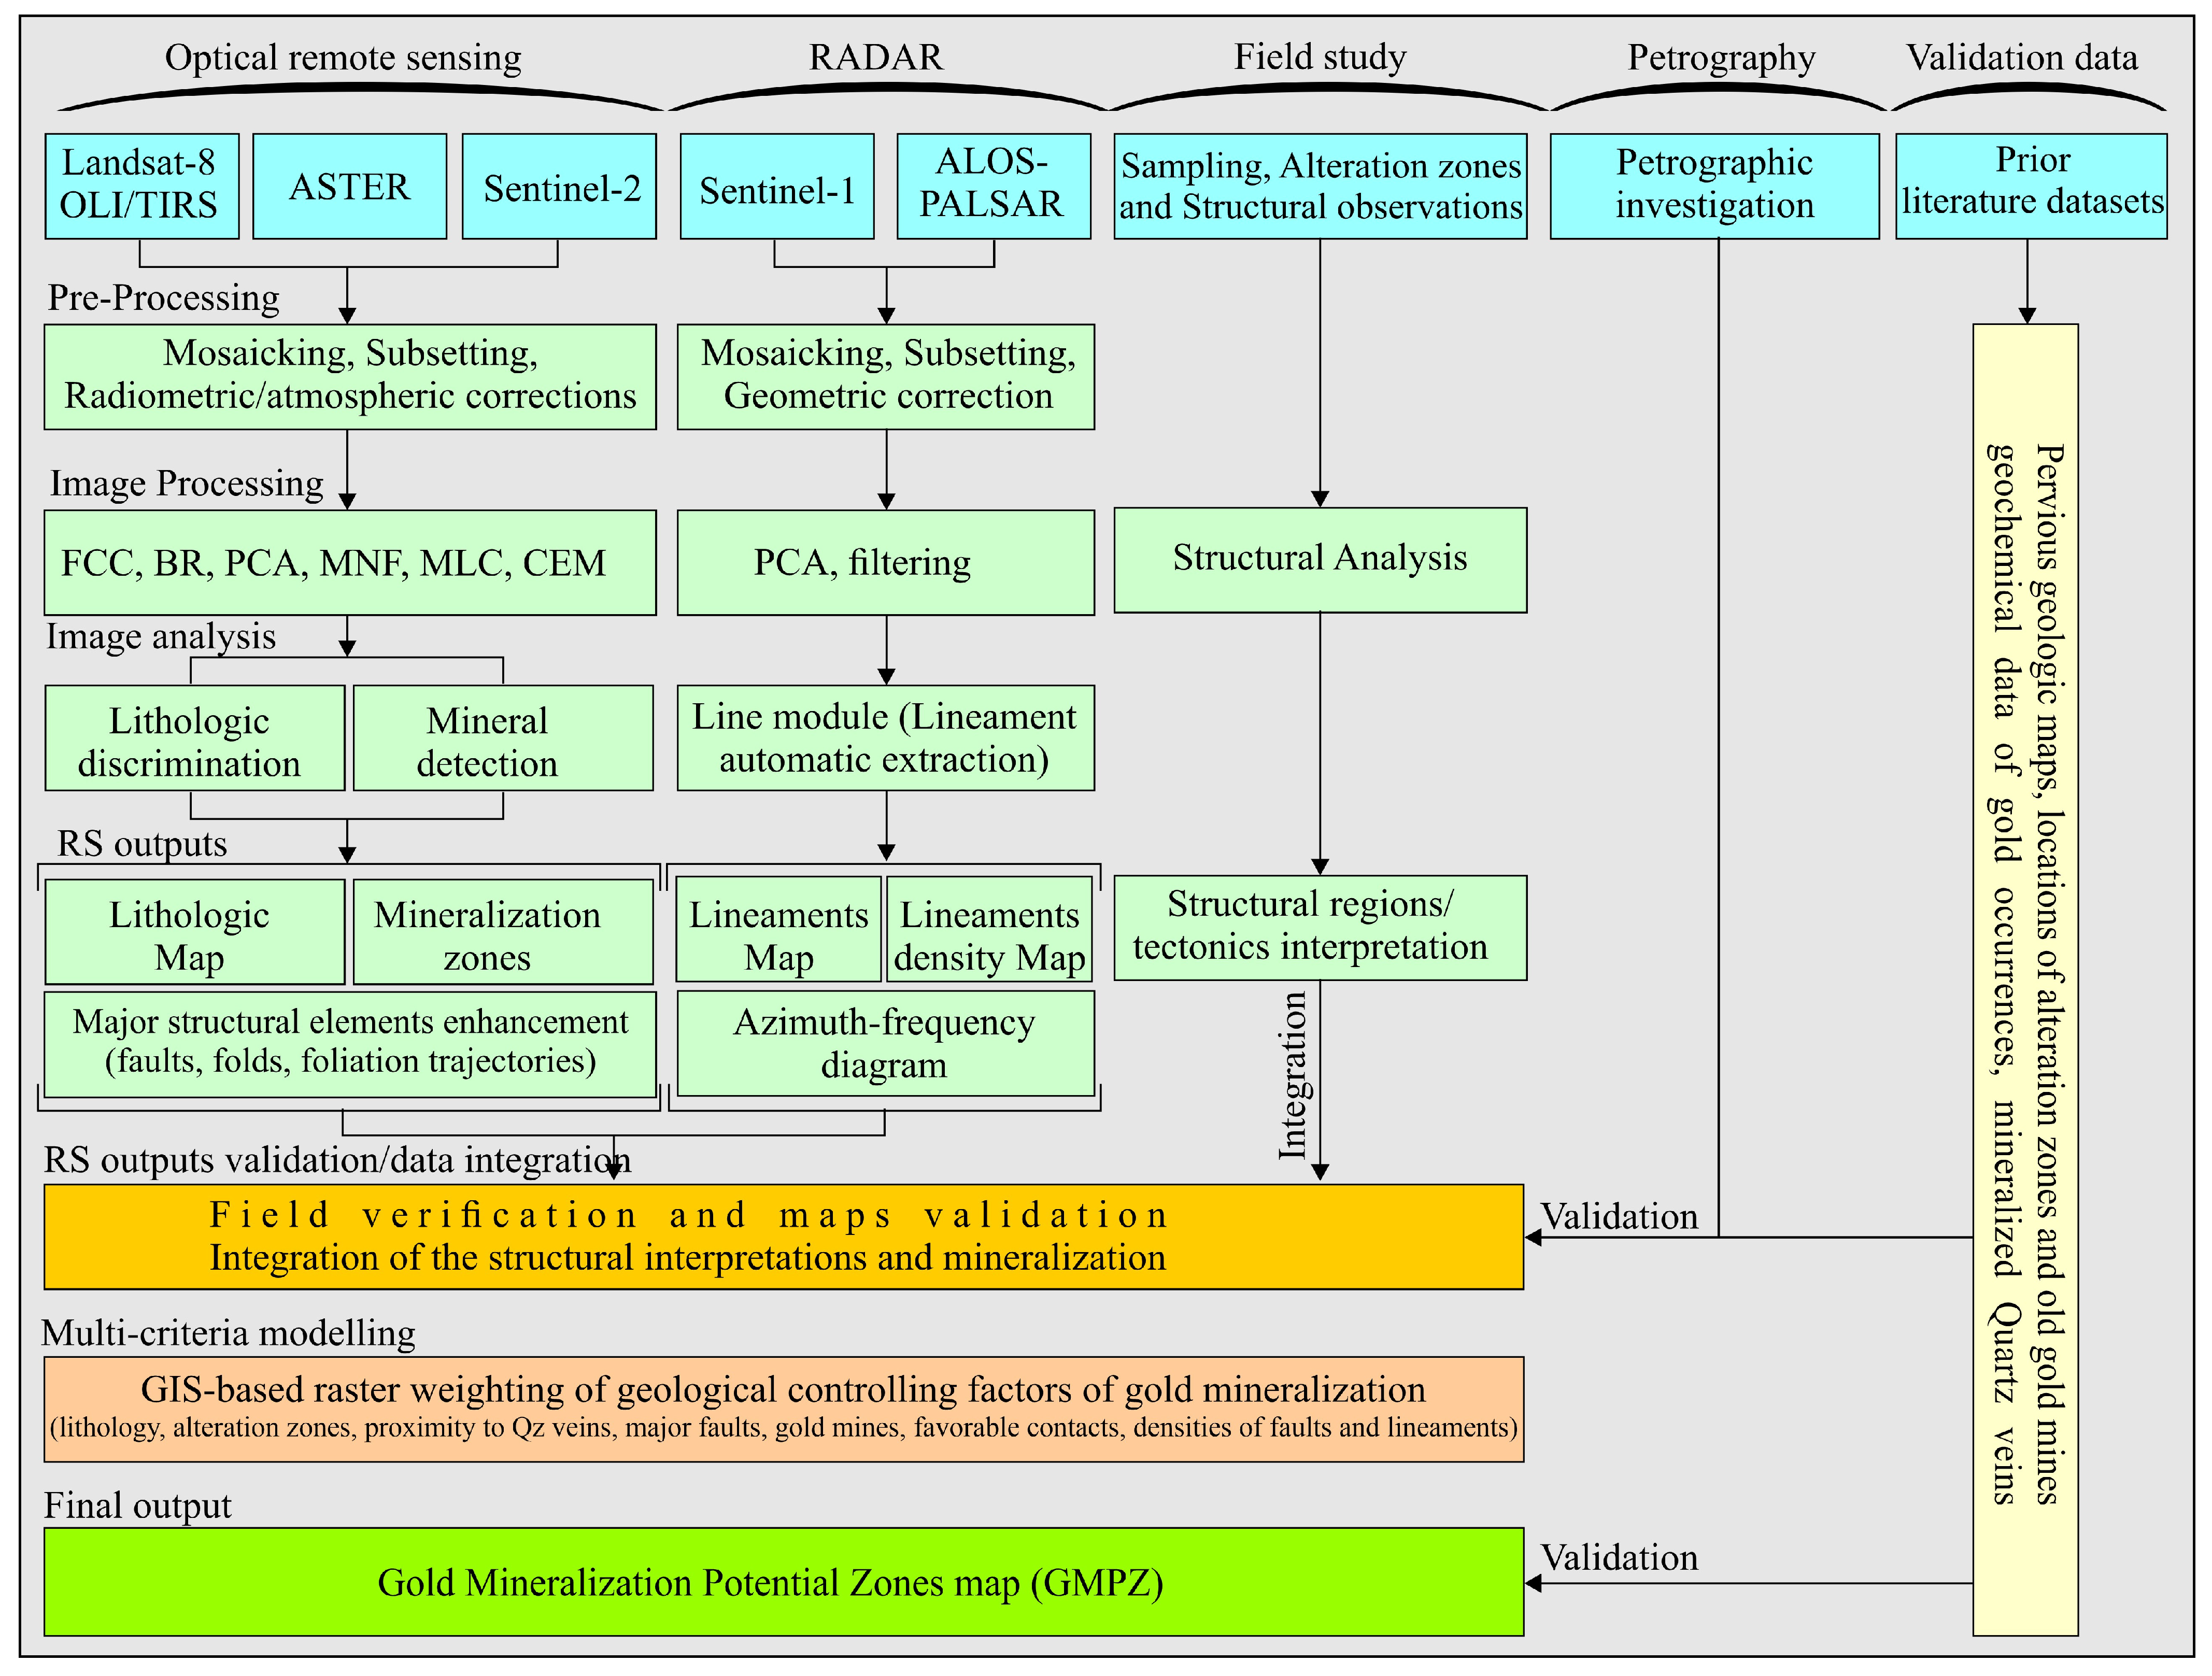
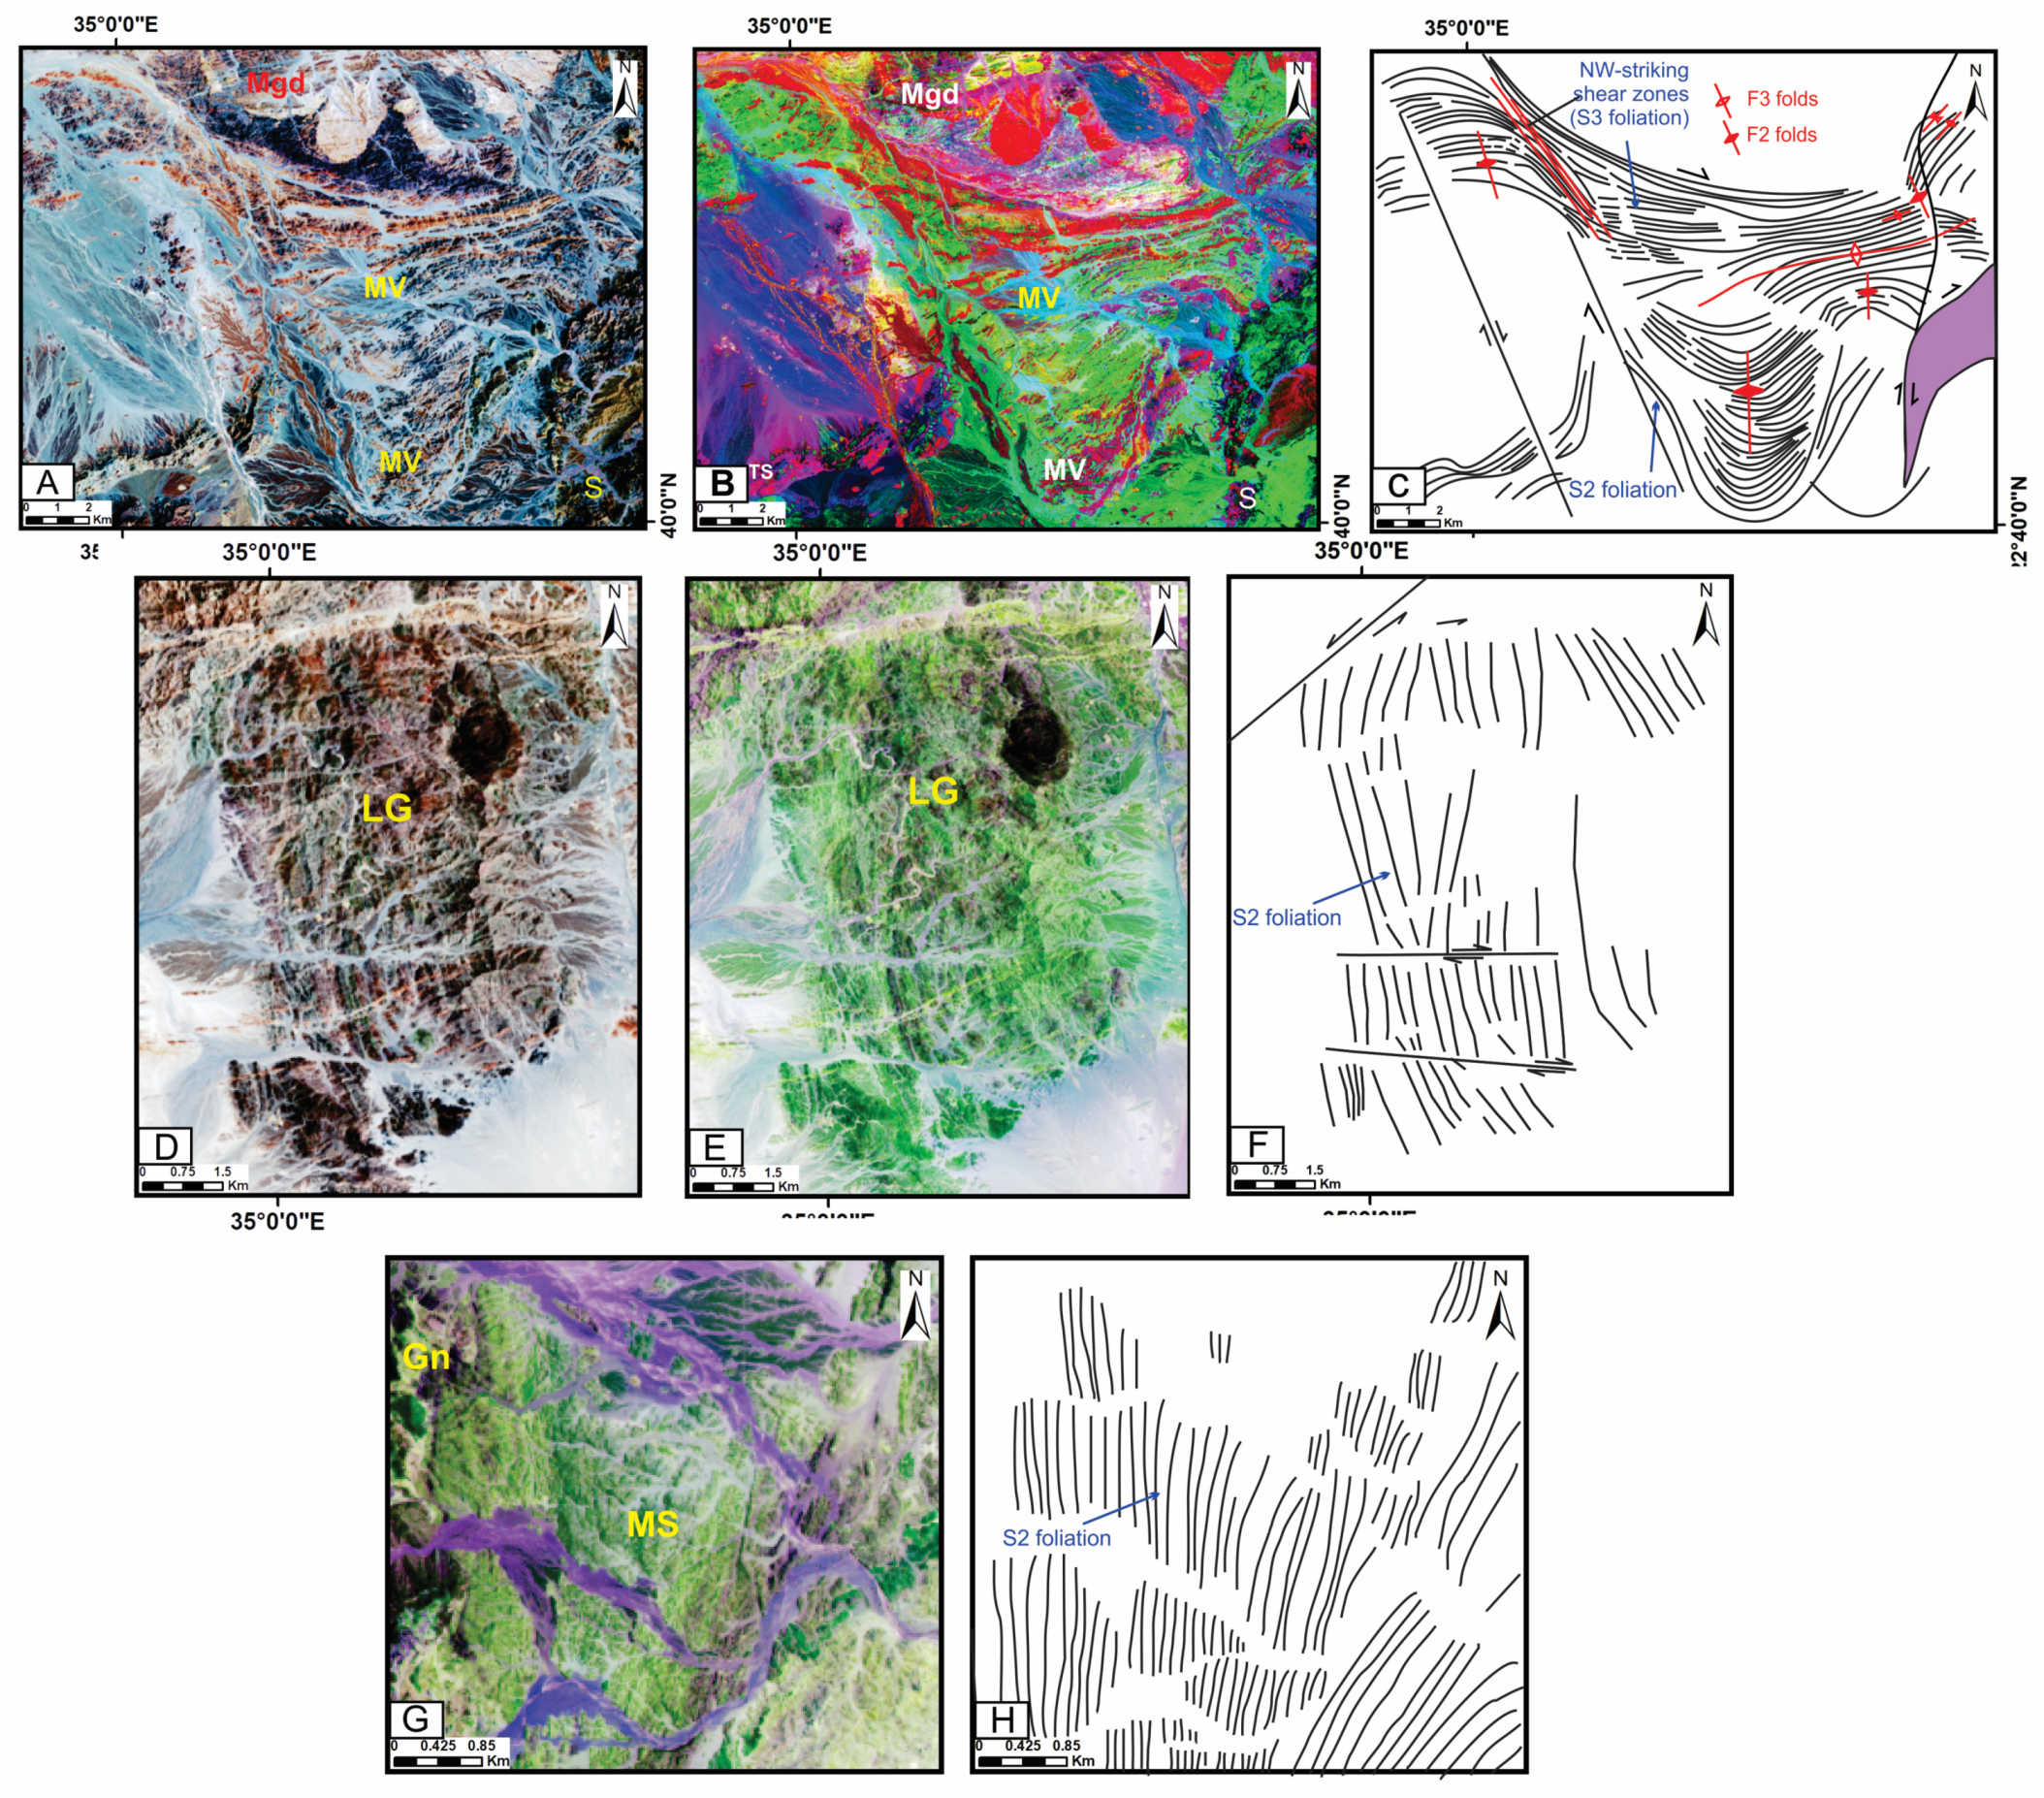
3. Remotely Sensed Data Characteristics and Analysis
3.1. Preprocessing of the Satellite Data
3.2. Processing of the Satellite Data
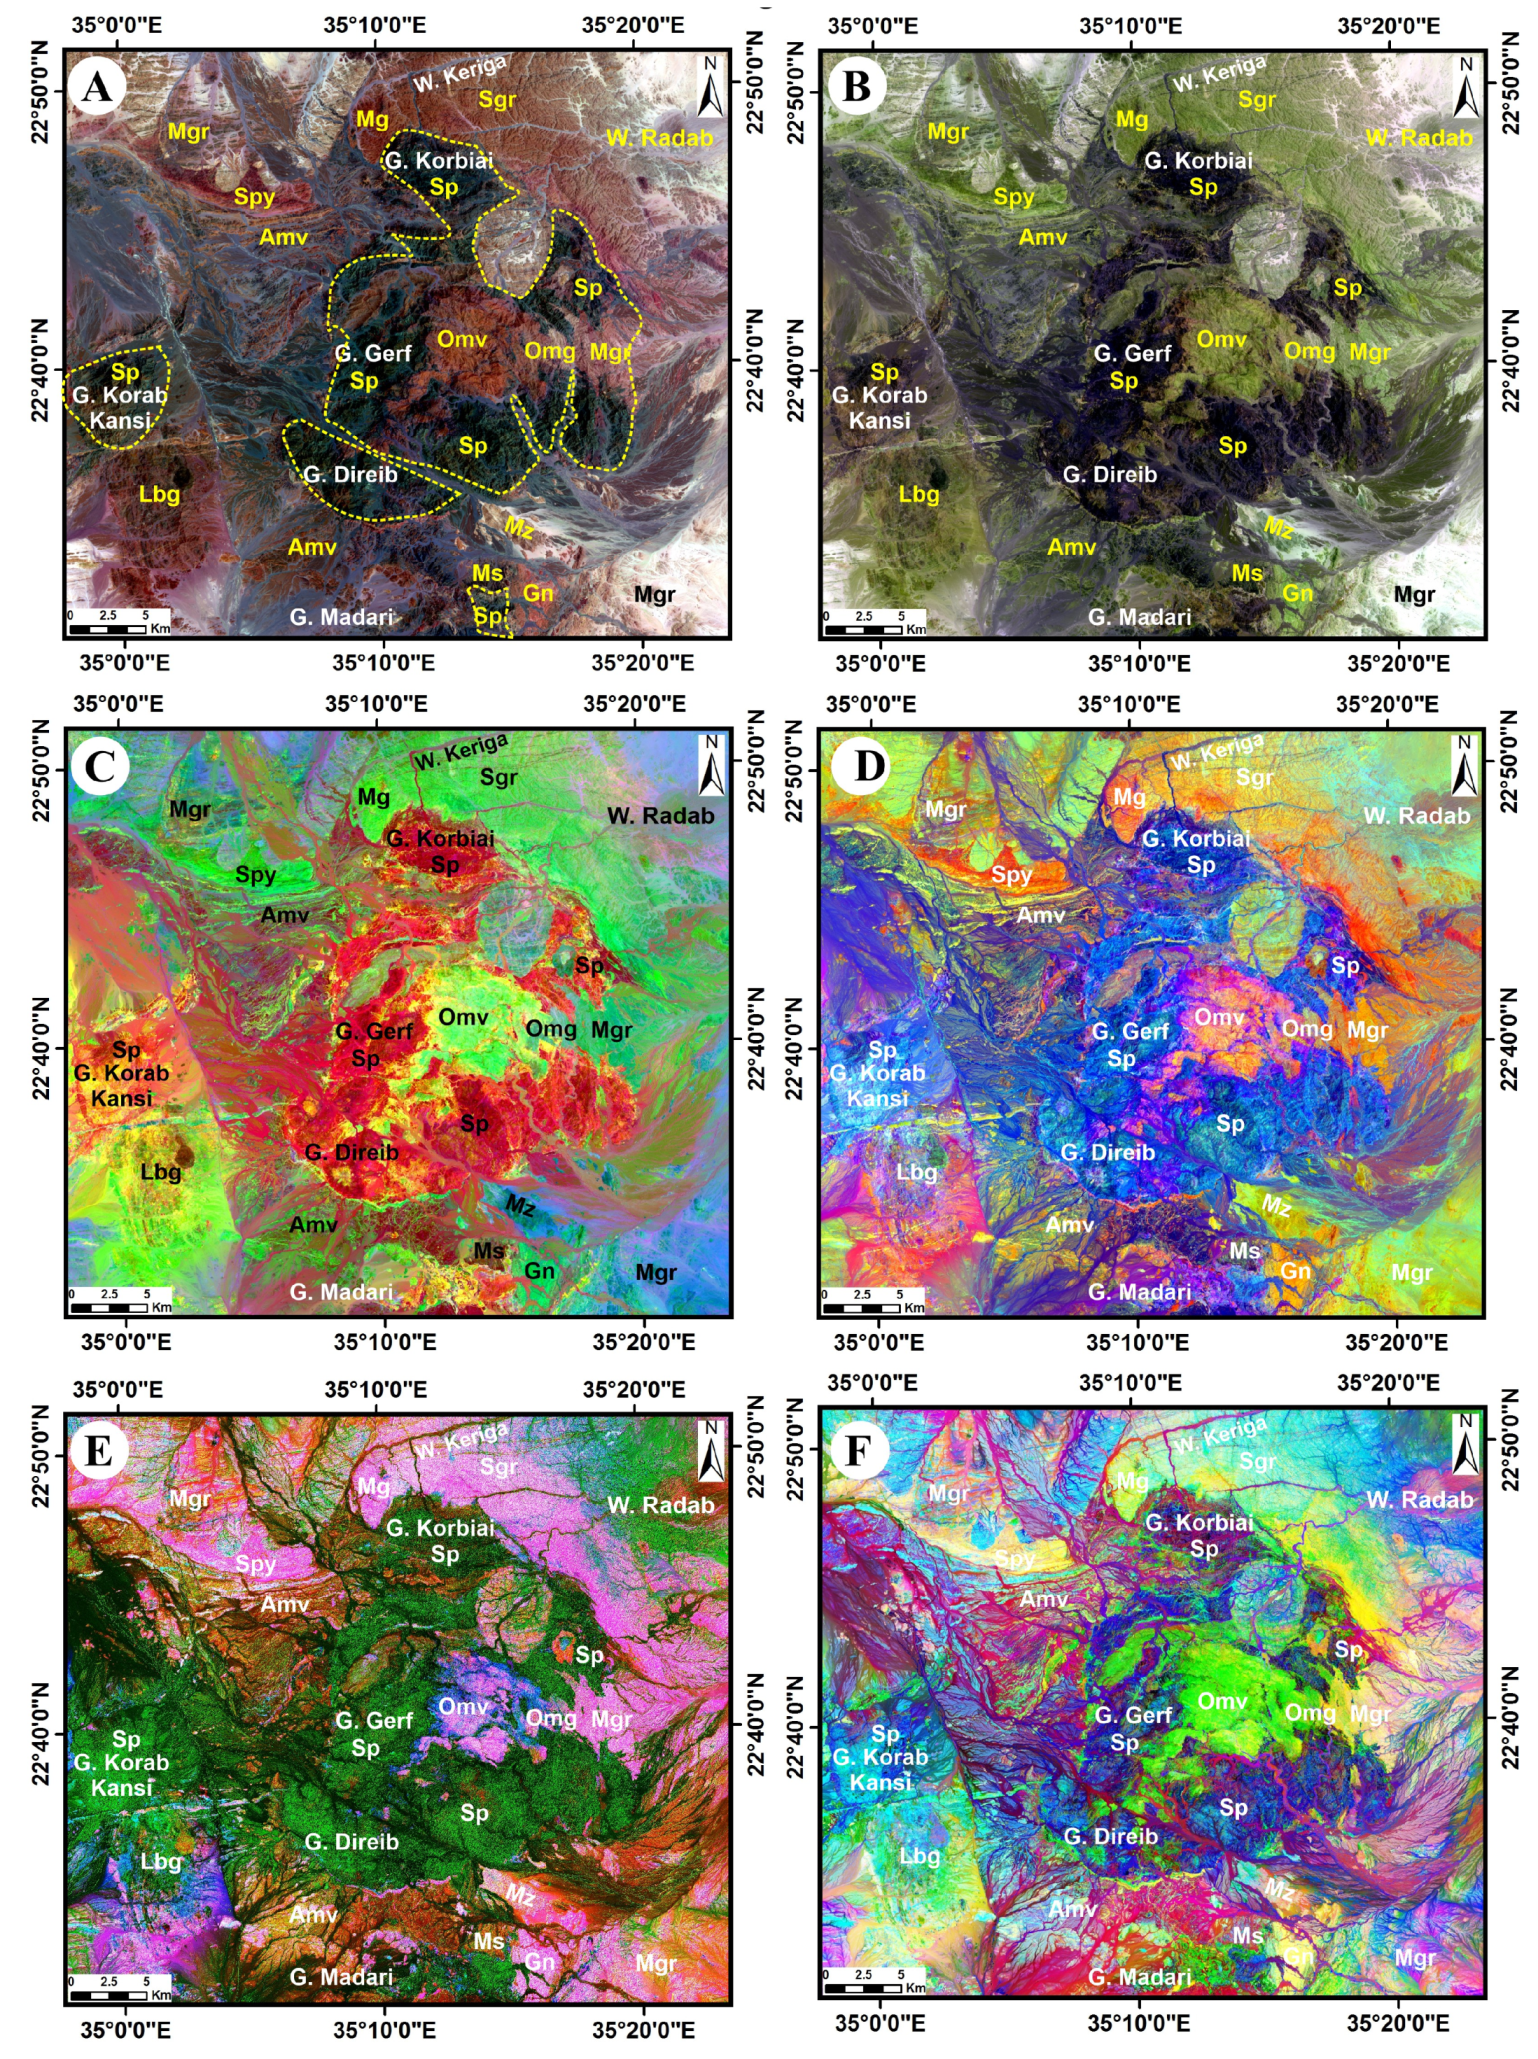
3.3. Lithological Mapping Based-Optical Sensors Data
3.3.1. False Color Composite (FCC)
3.3.2. Band Ratio
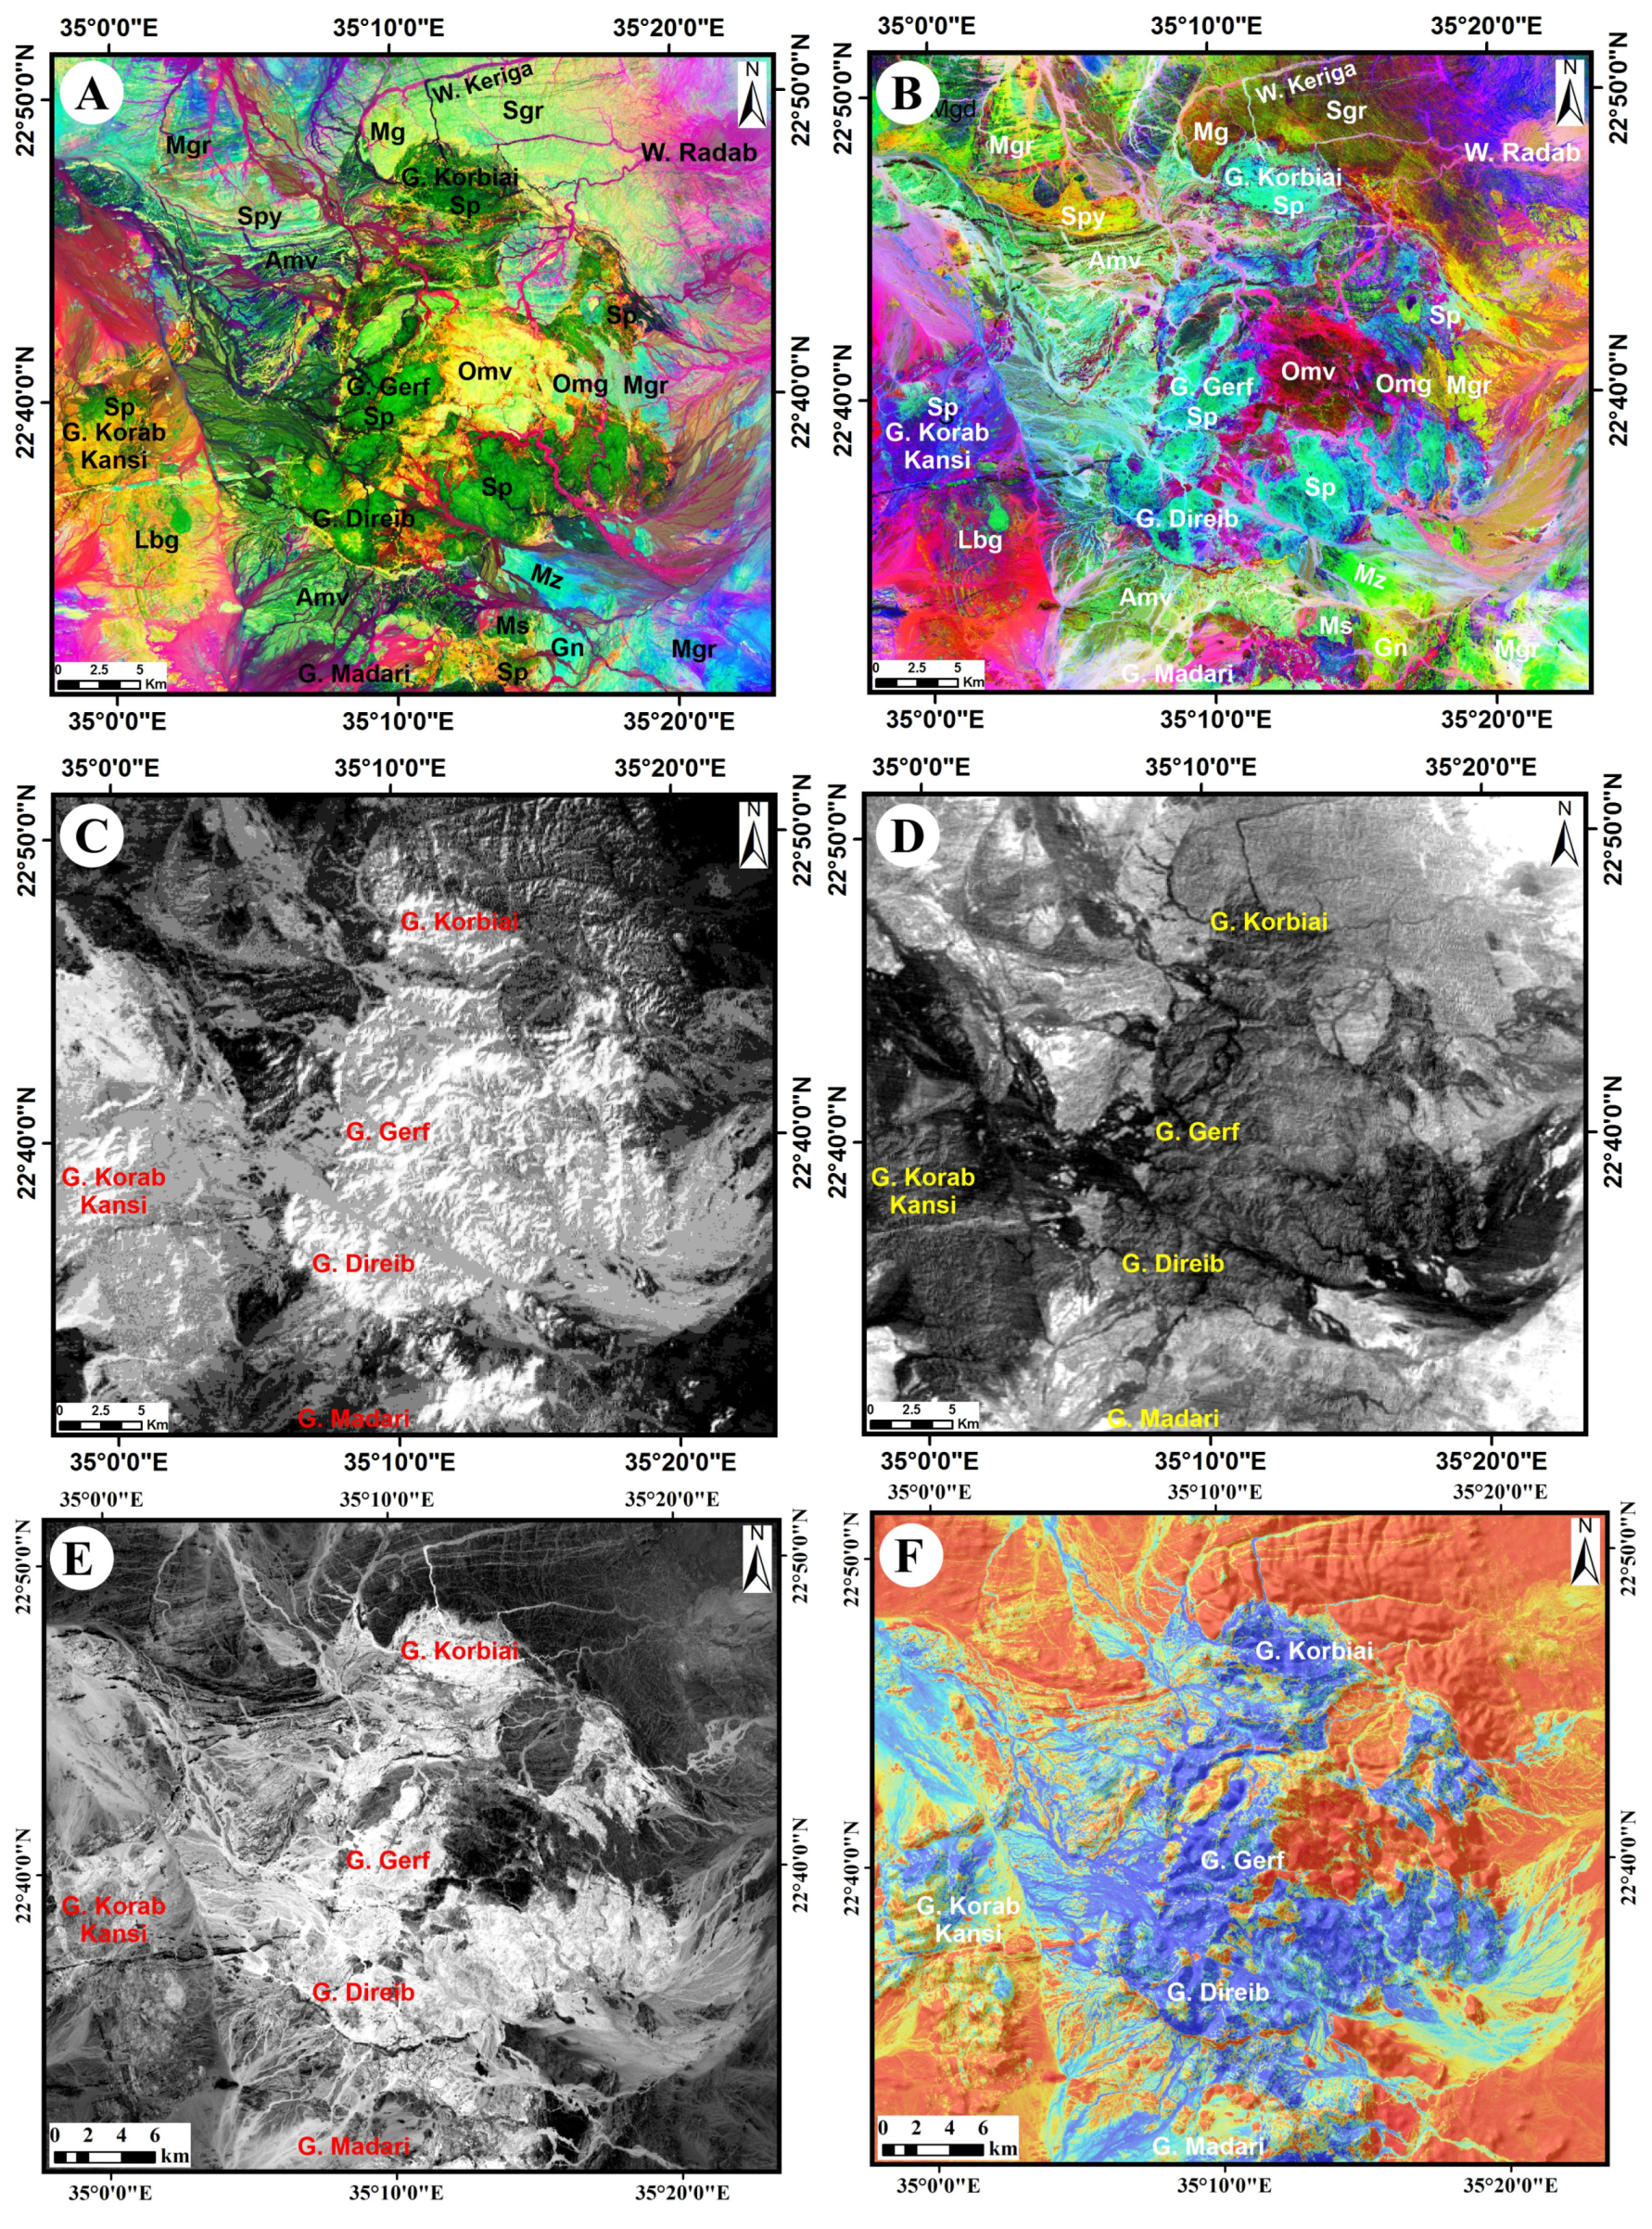
3.3.3. Principal Component Analysis (PCA) and Minimum Noise Fraction (MNF)
3.3.4. Ophiolitic Assemblage Mapping
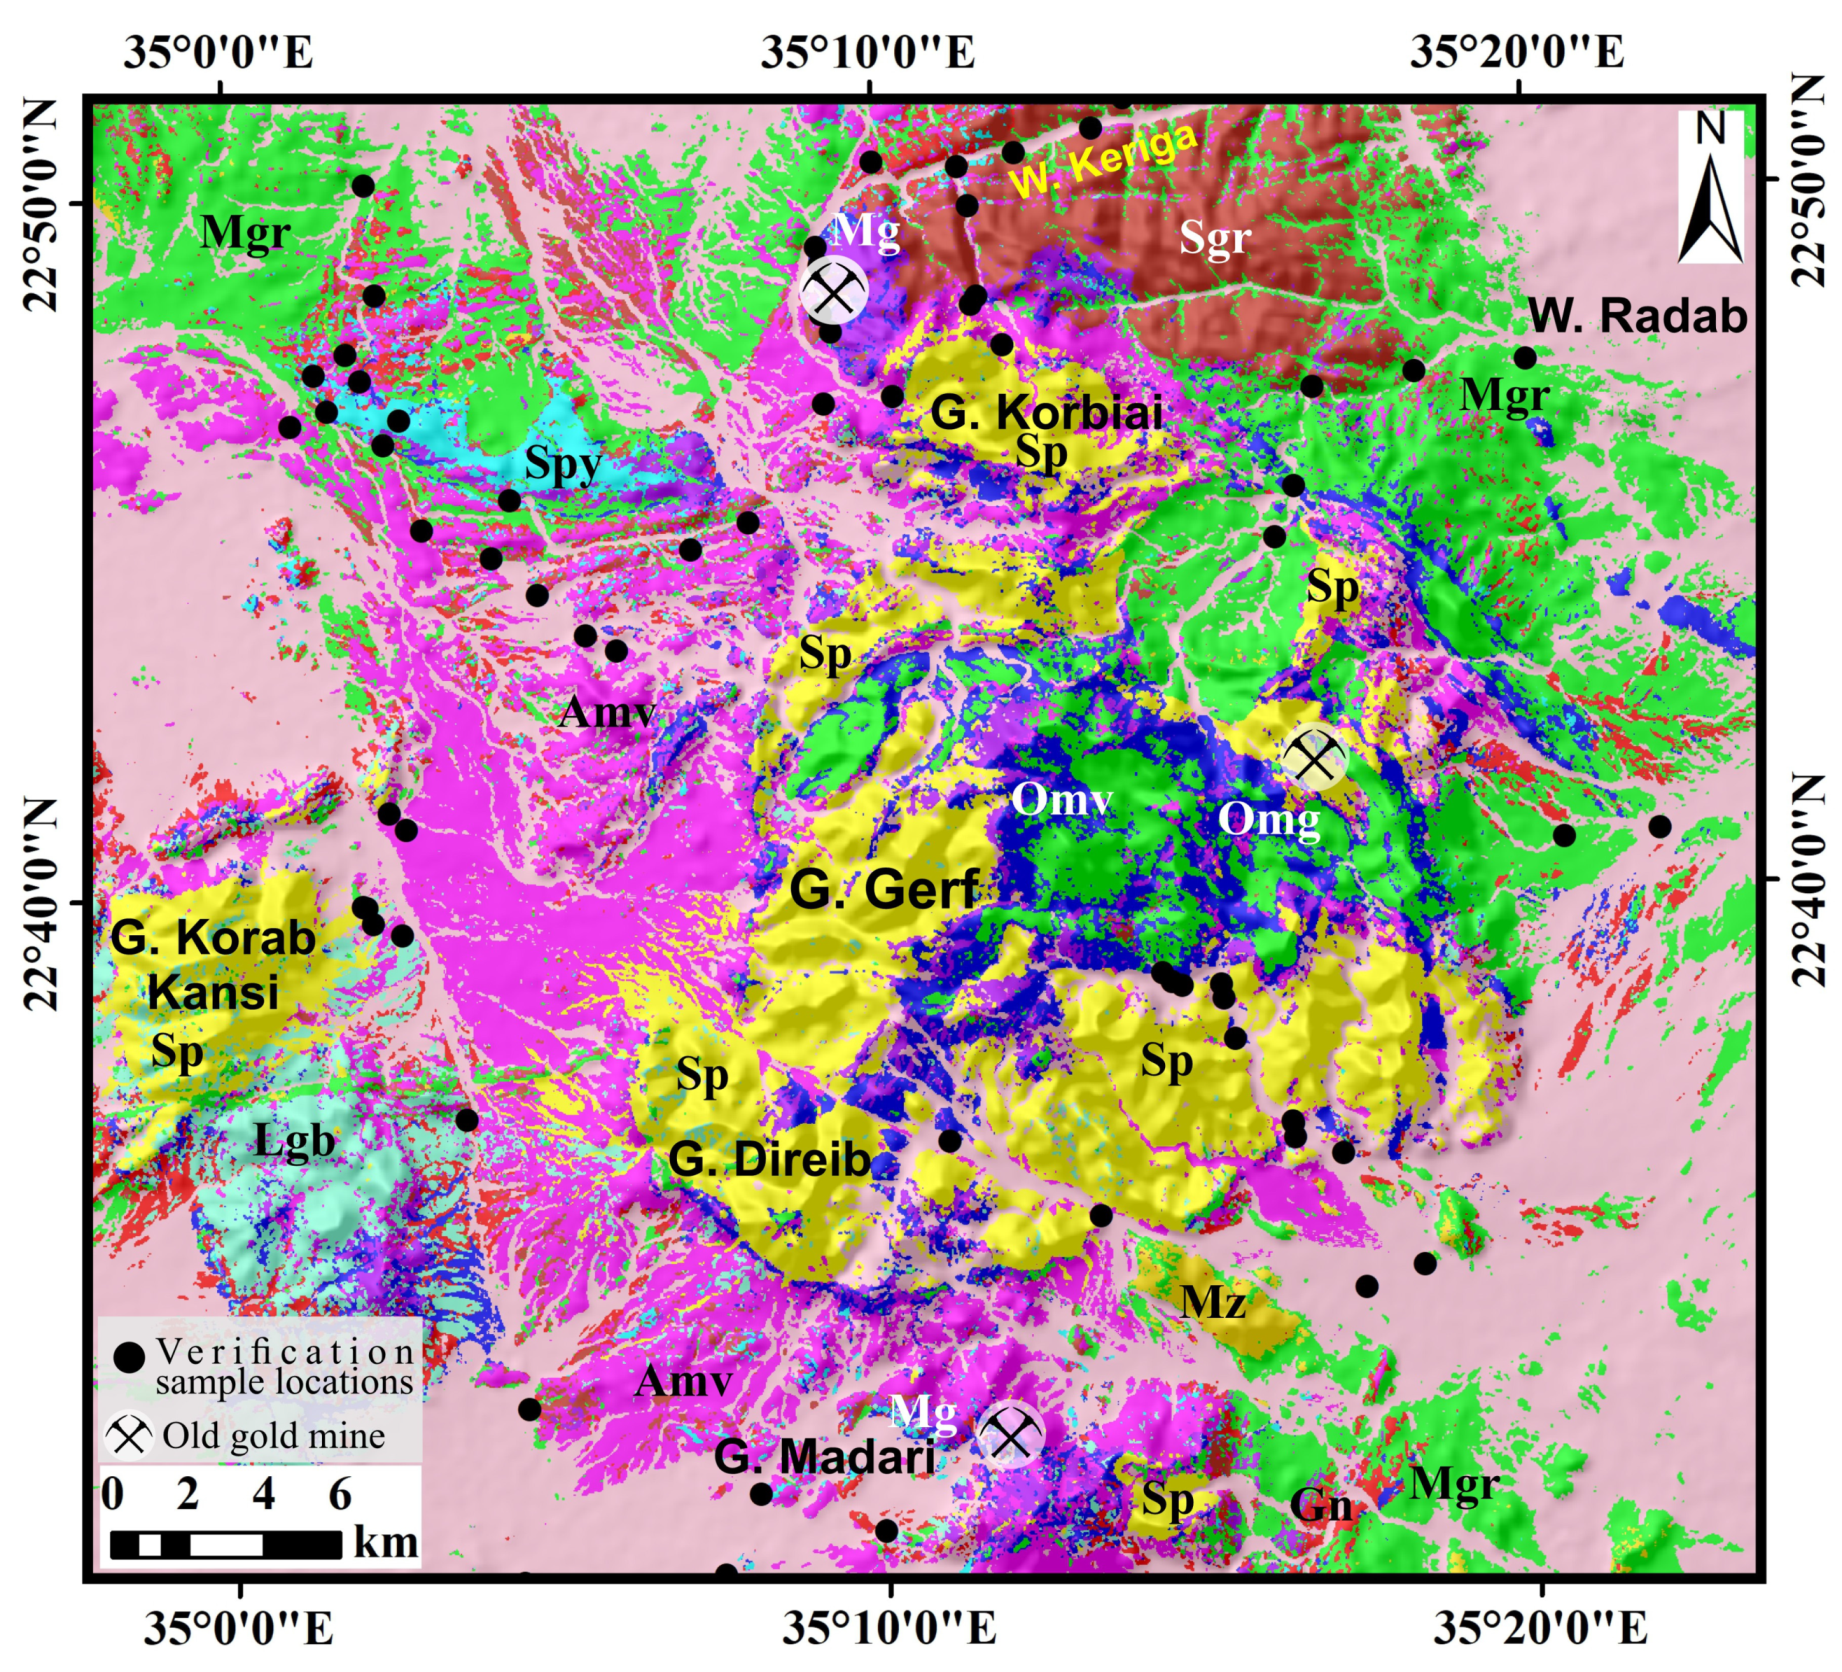
3.3.5. Maximum Likelihood Classifier (MLC)
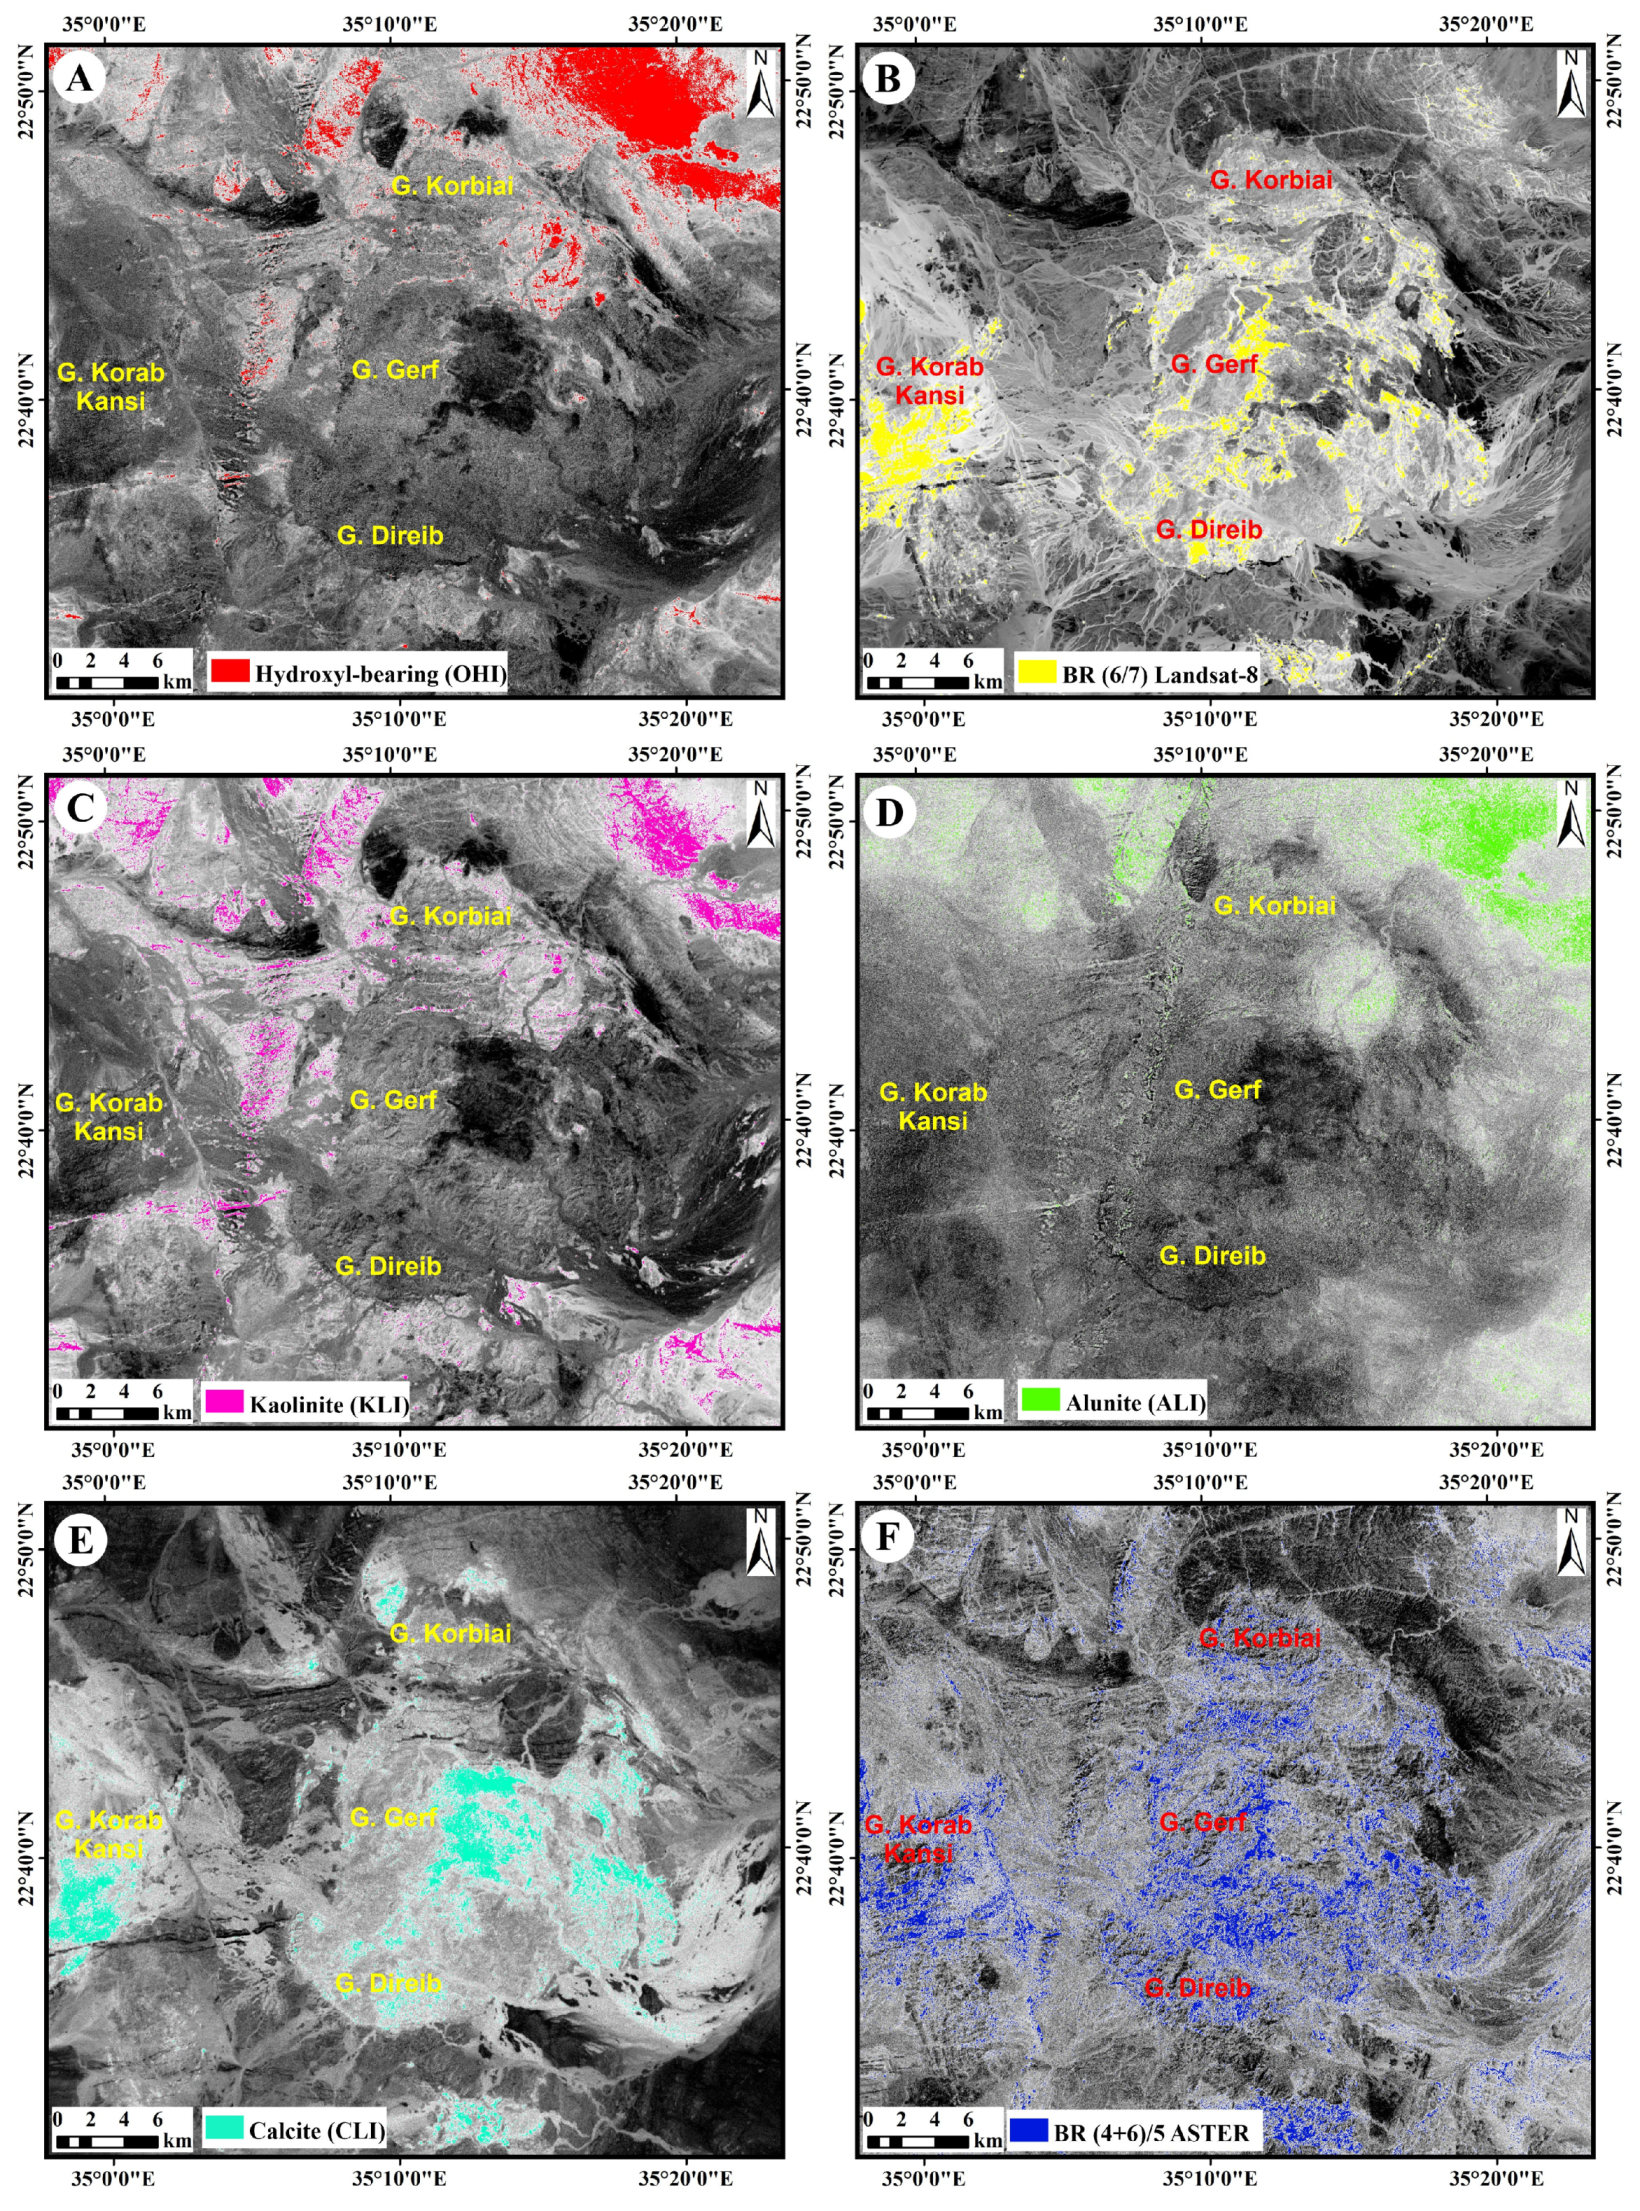
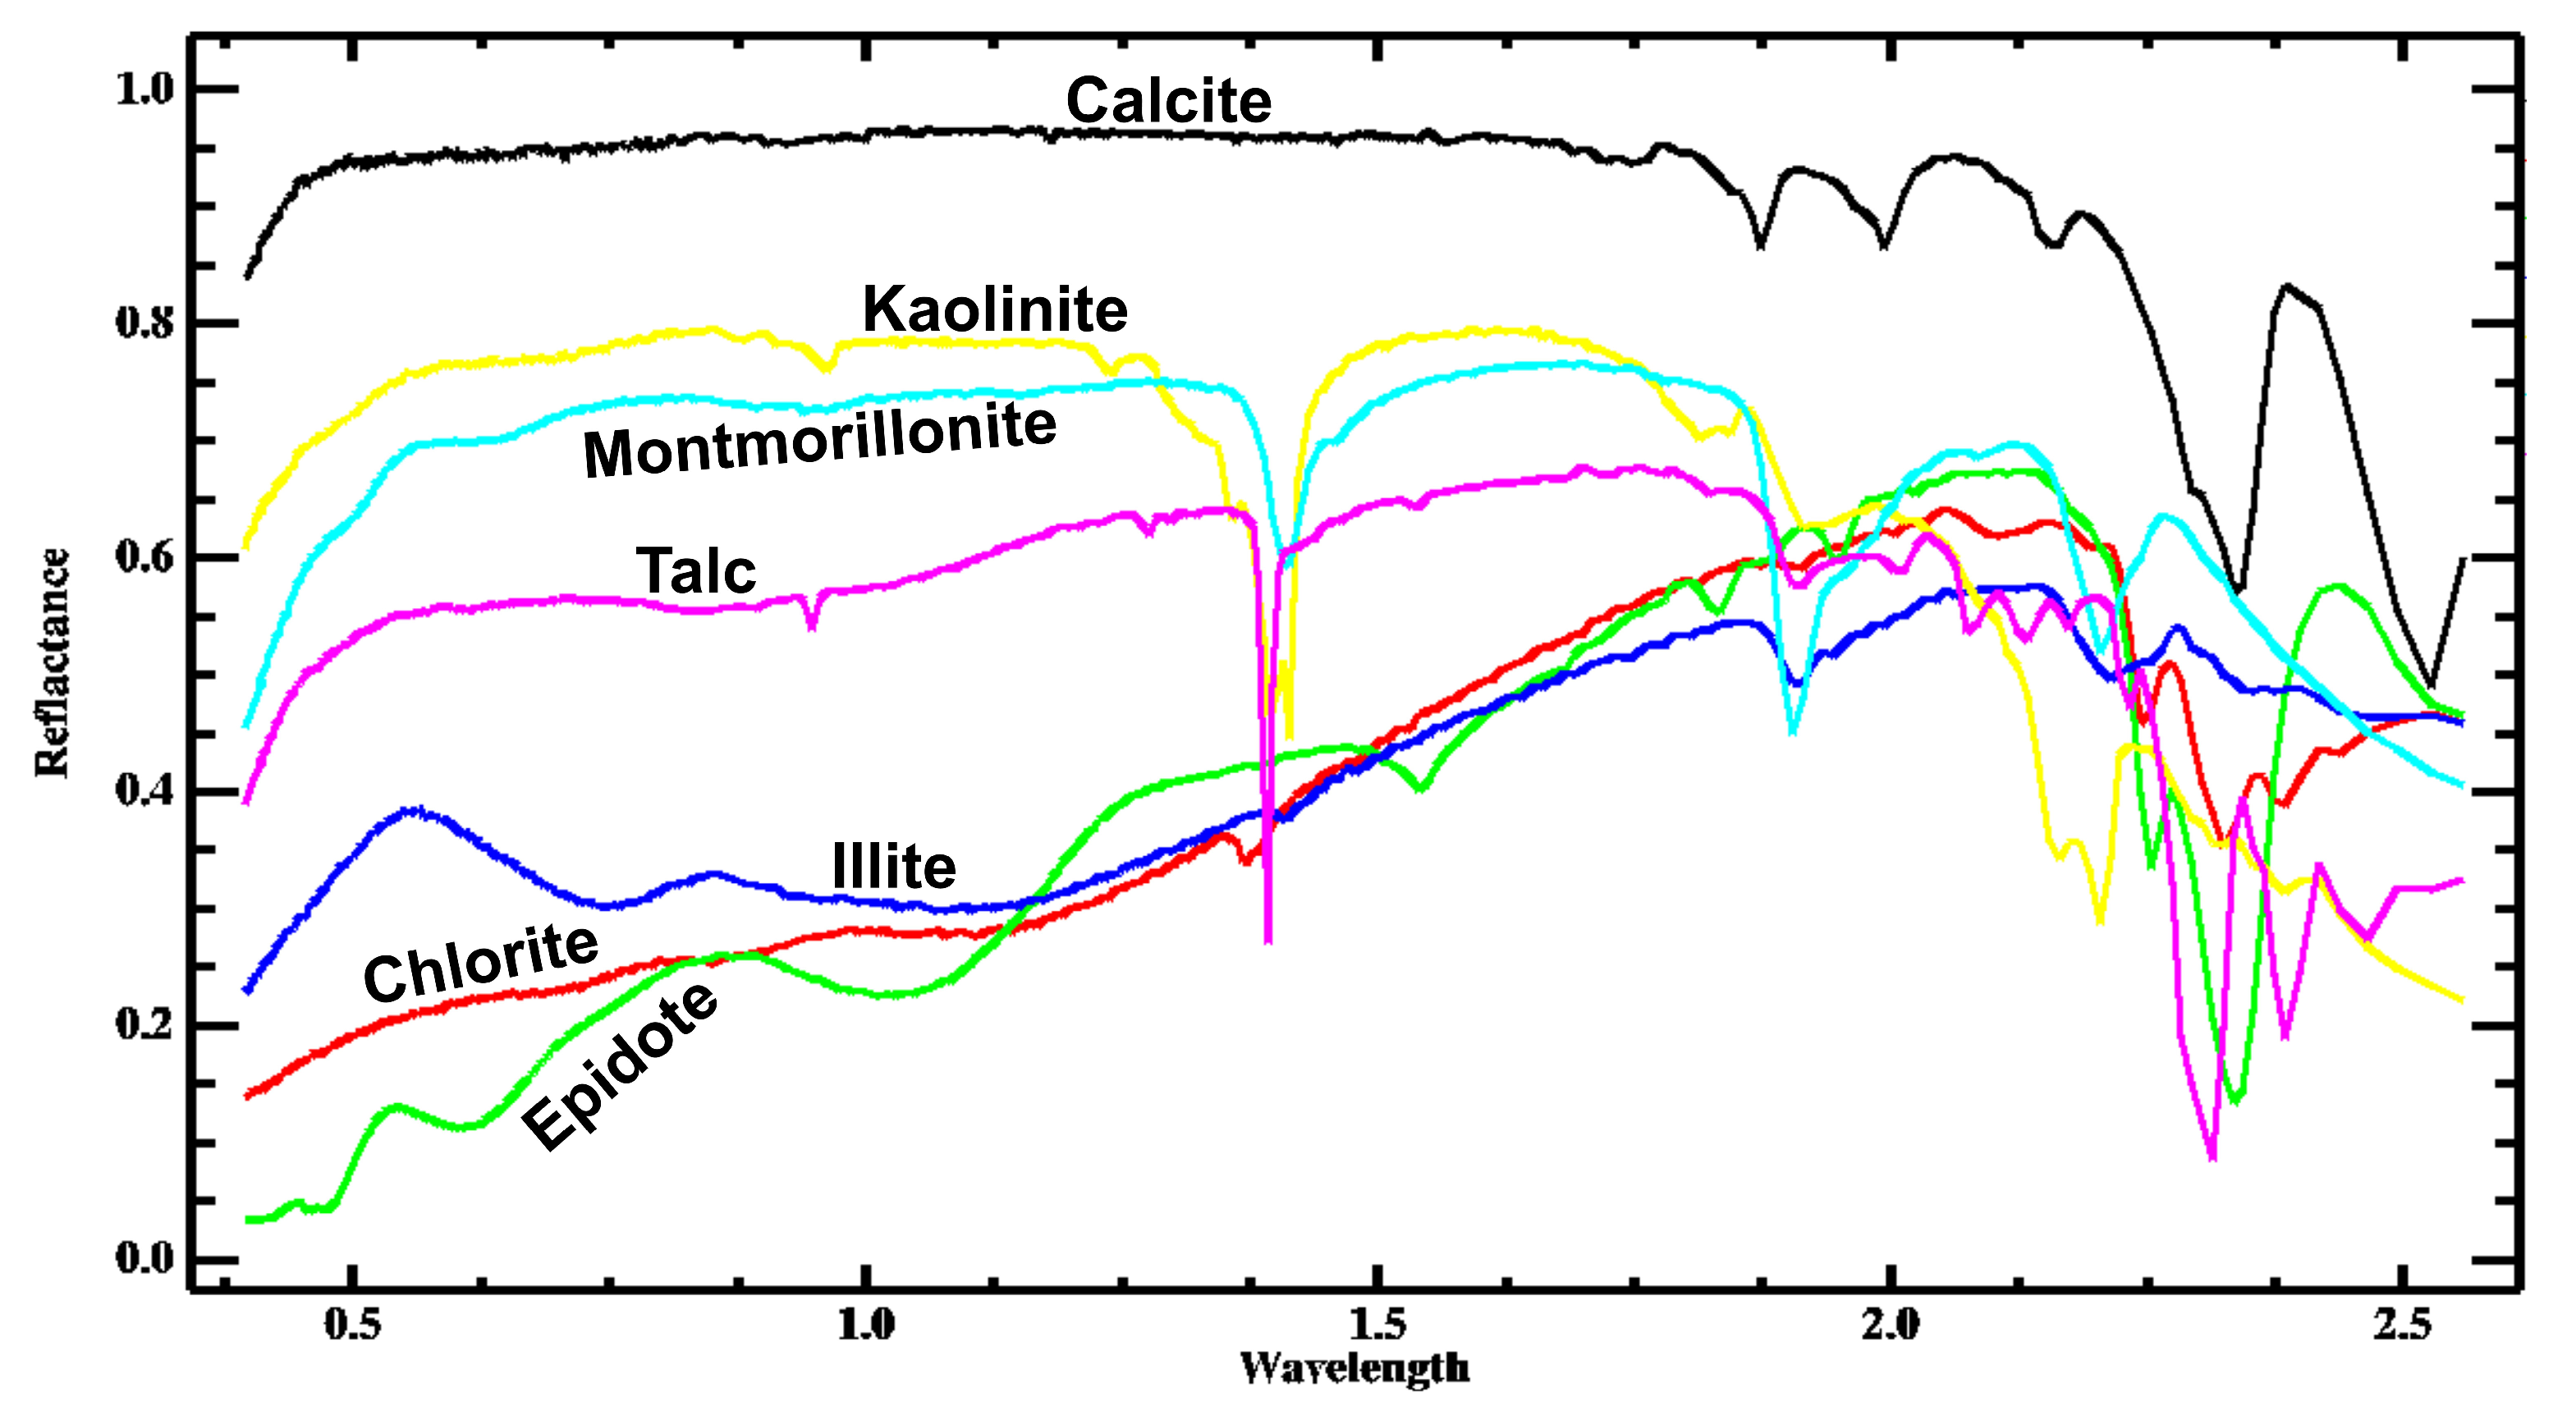
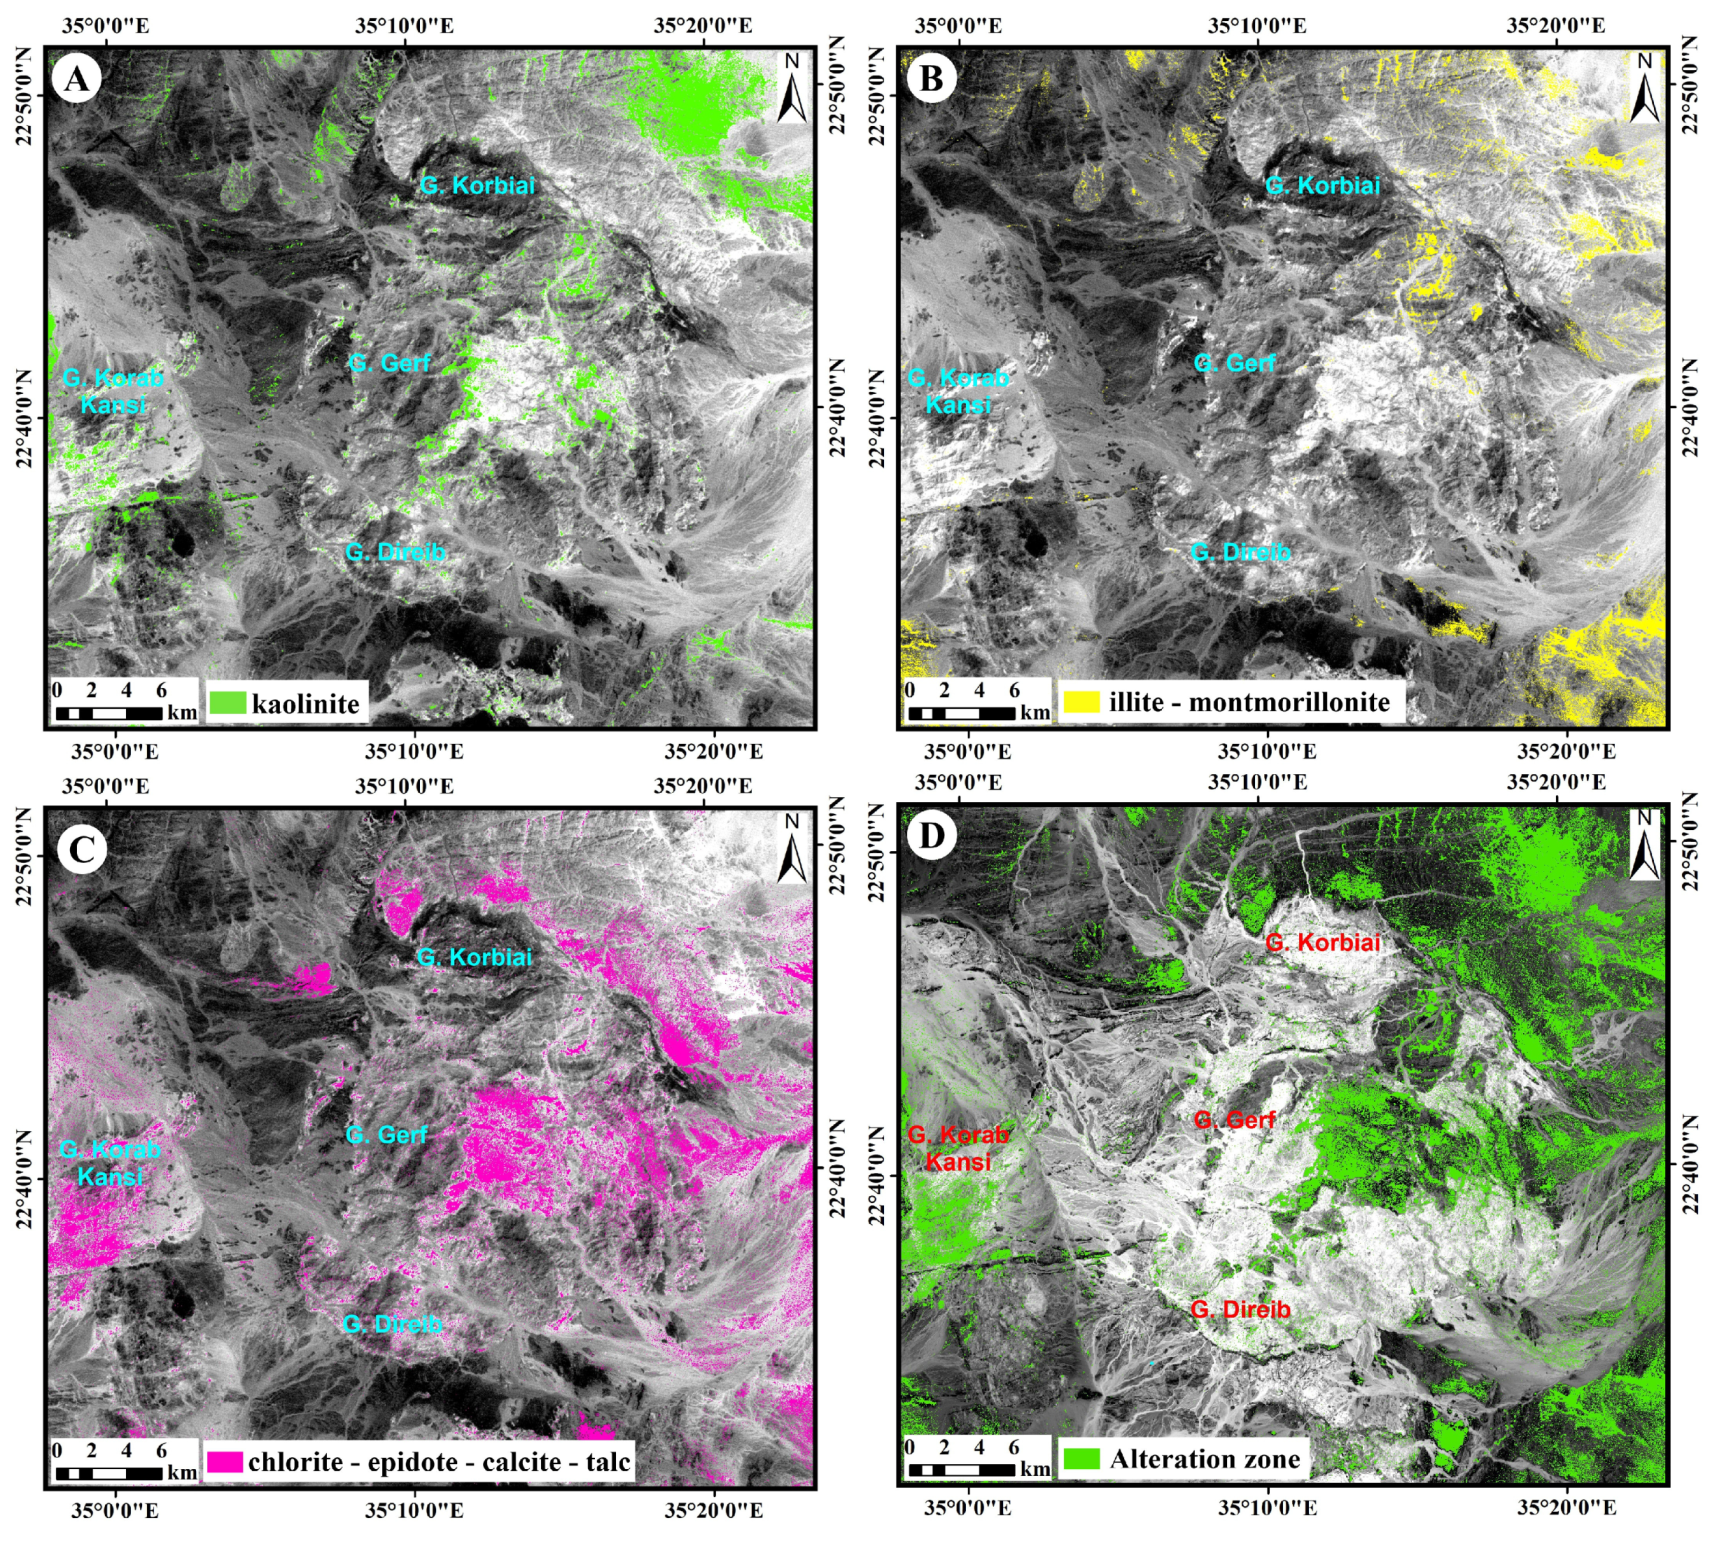
3.4. Alteration Mineral Mapping
3.4.1. Mineral Indices and Band Ratio
3.4.2. Constrained Energy Minimization (CEM)
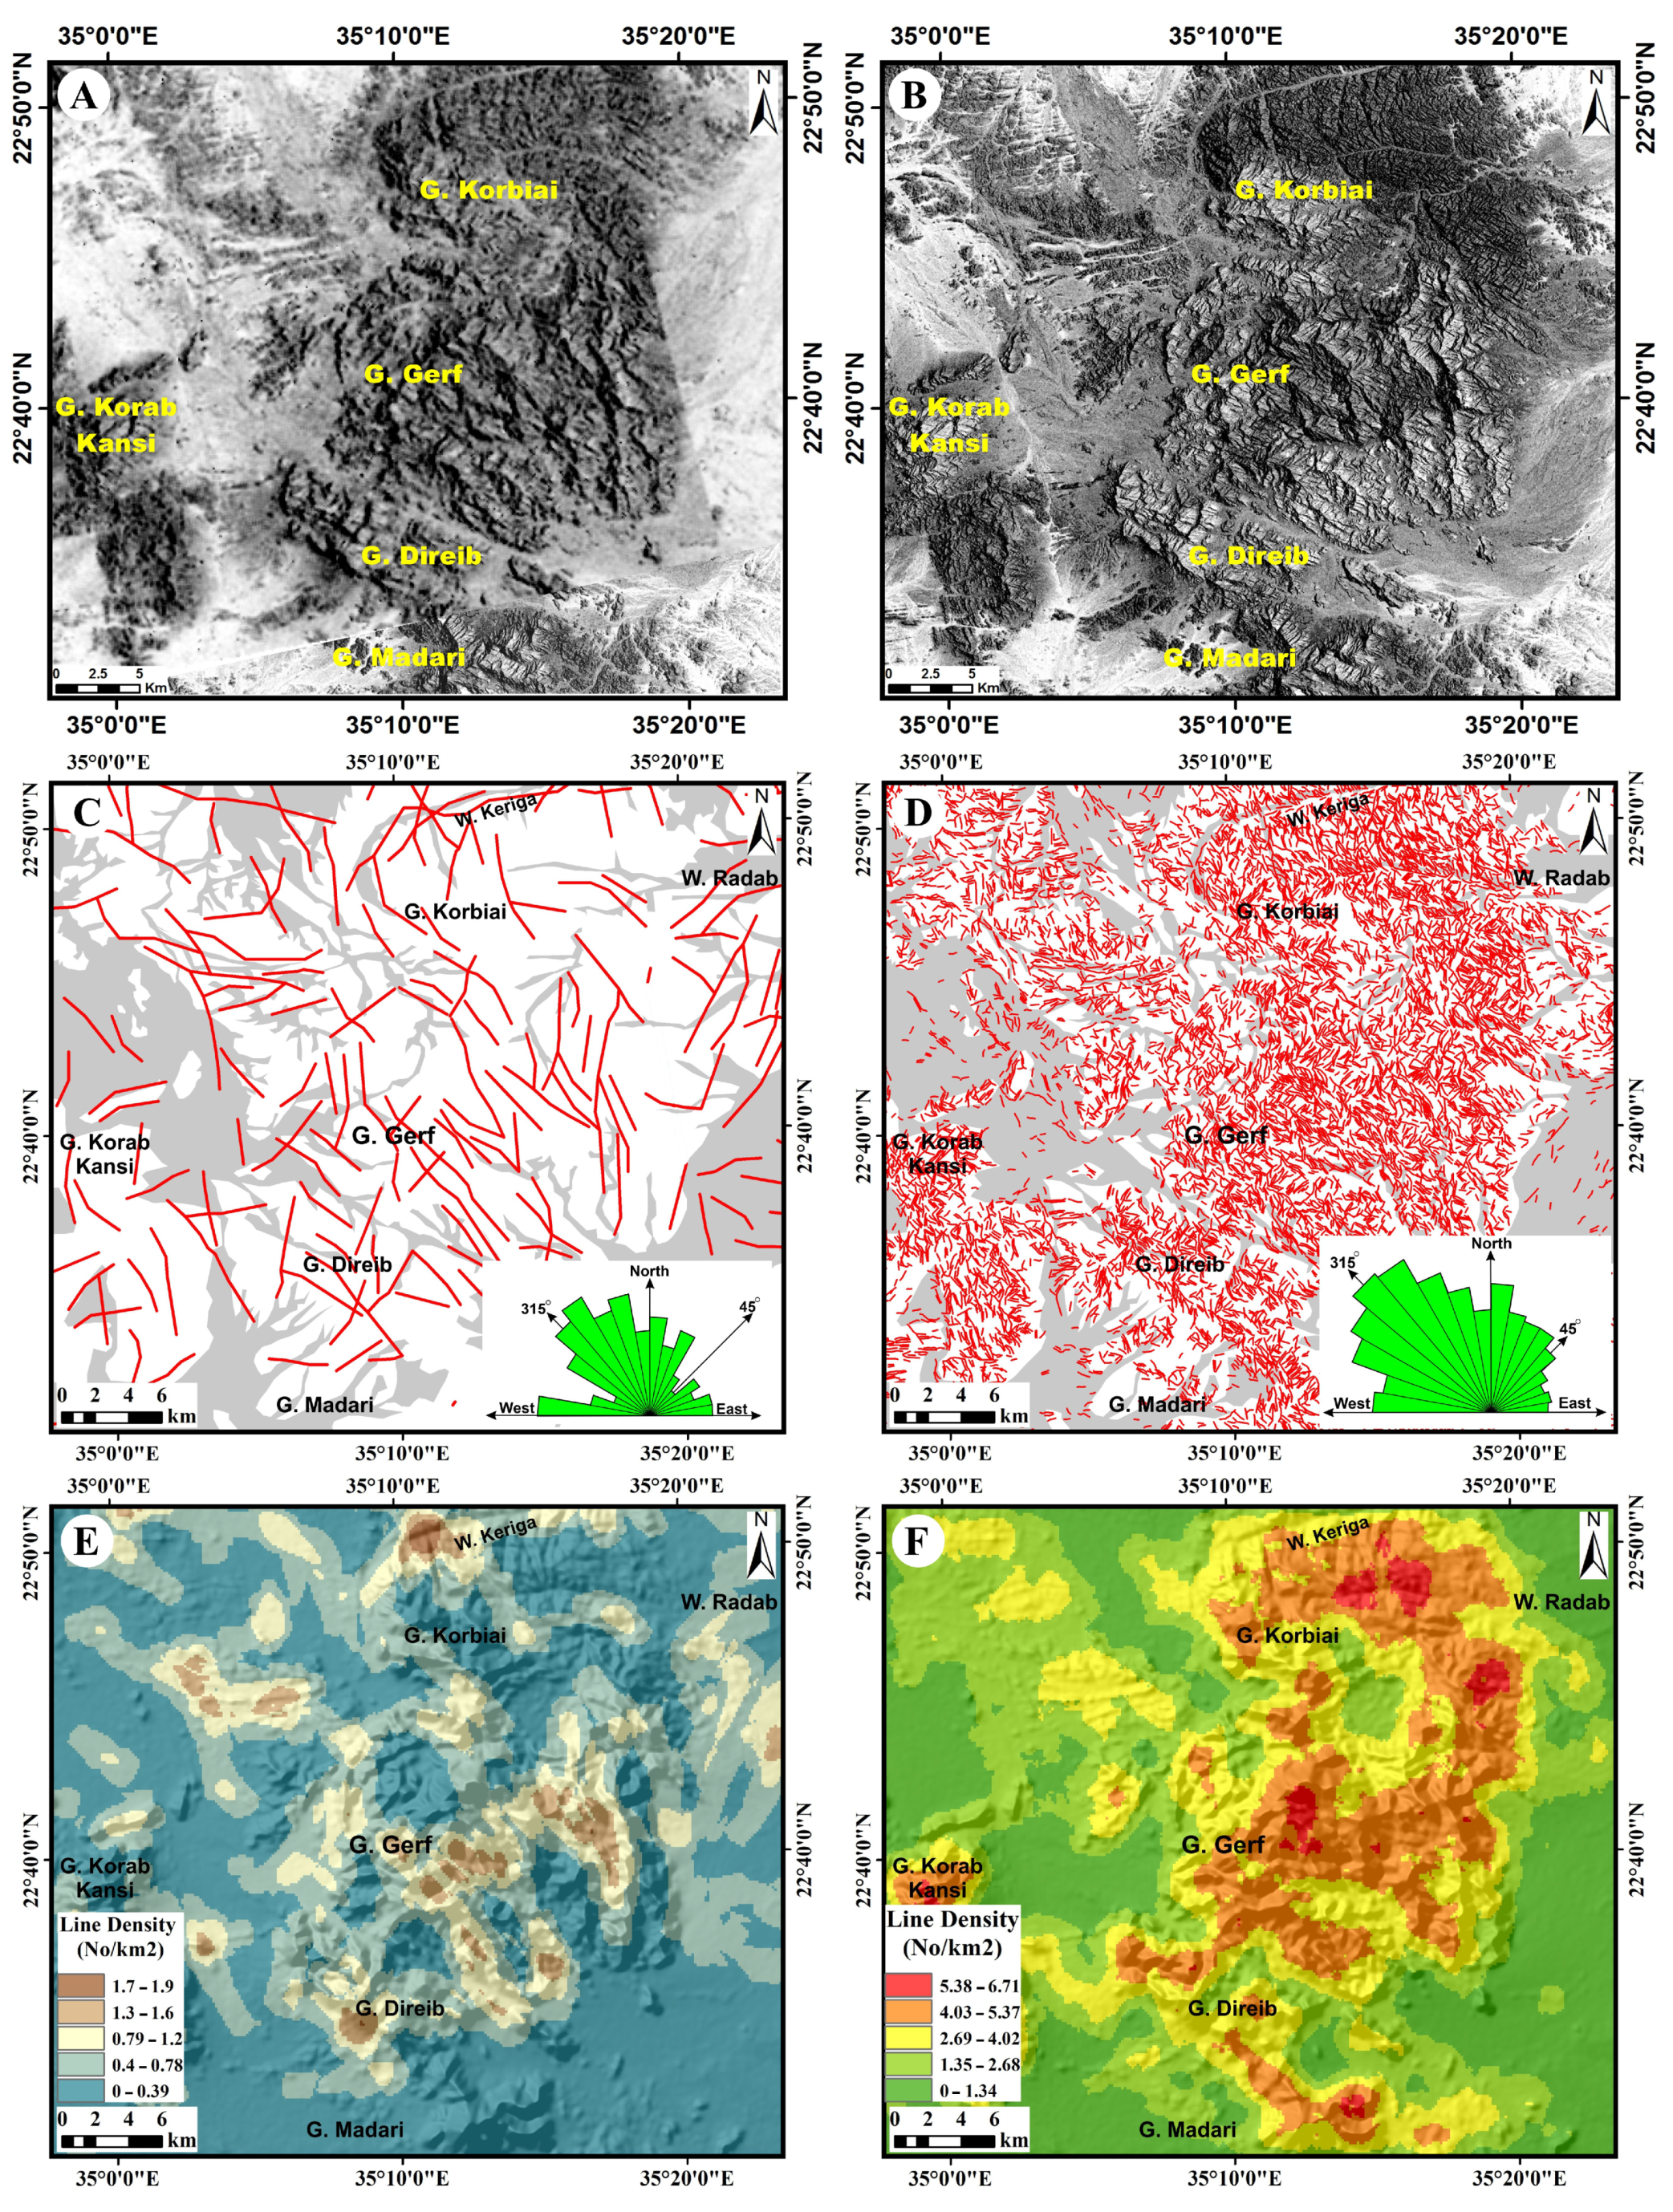
3.5. PALSAR/Sentinel-1B-Based Lineaments Extraction
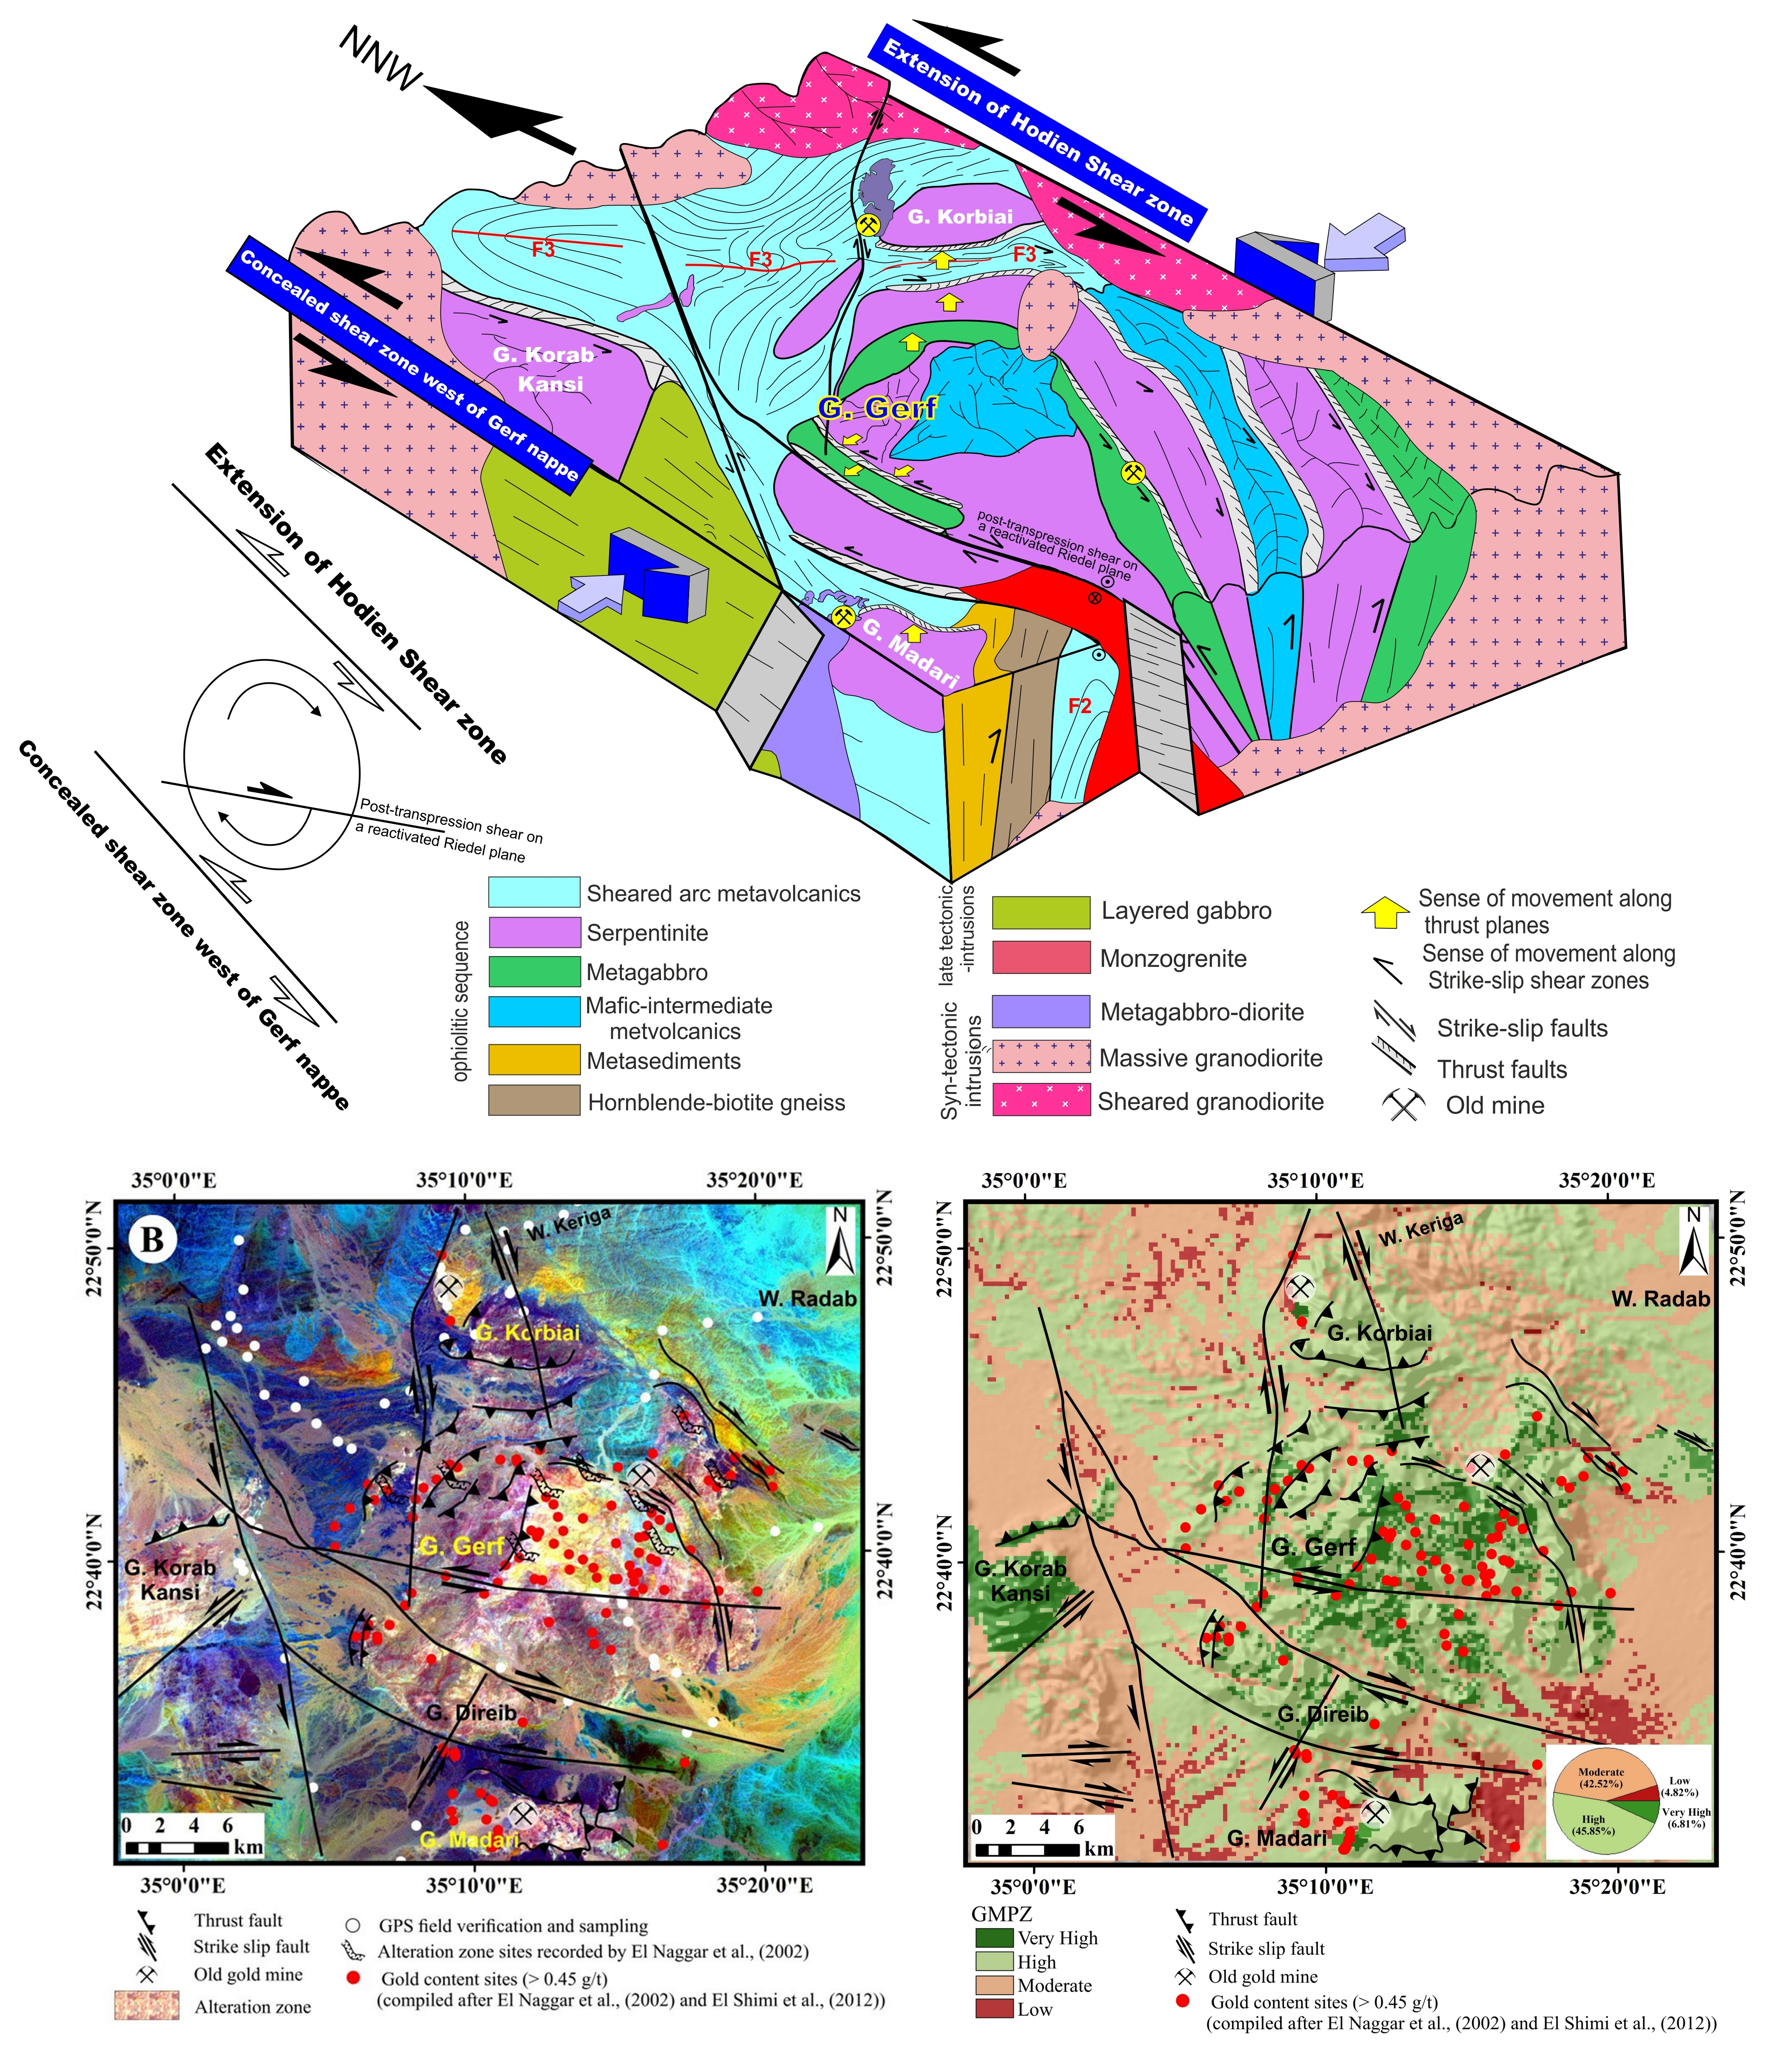
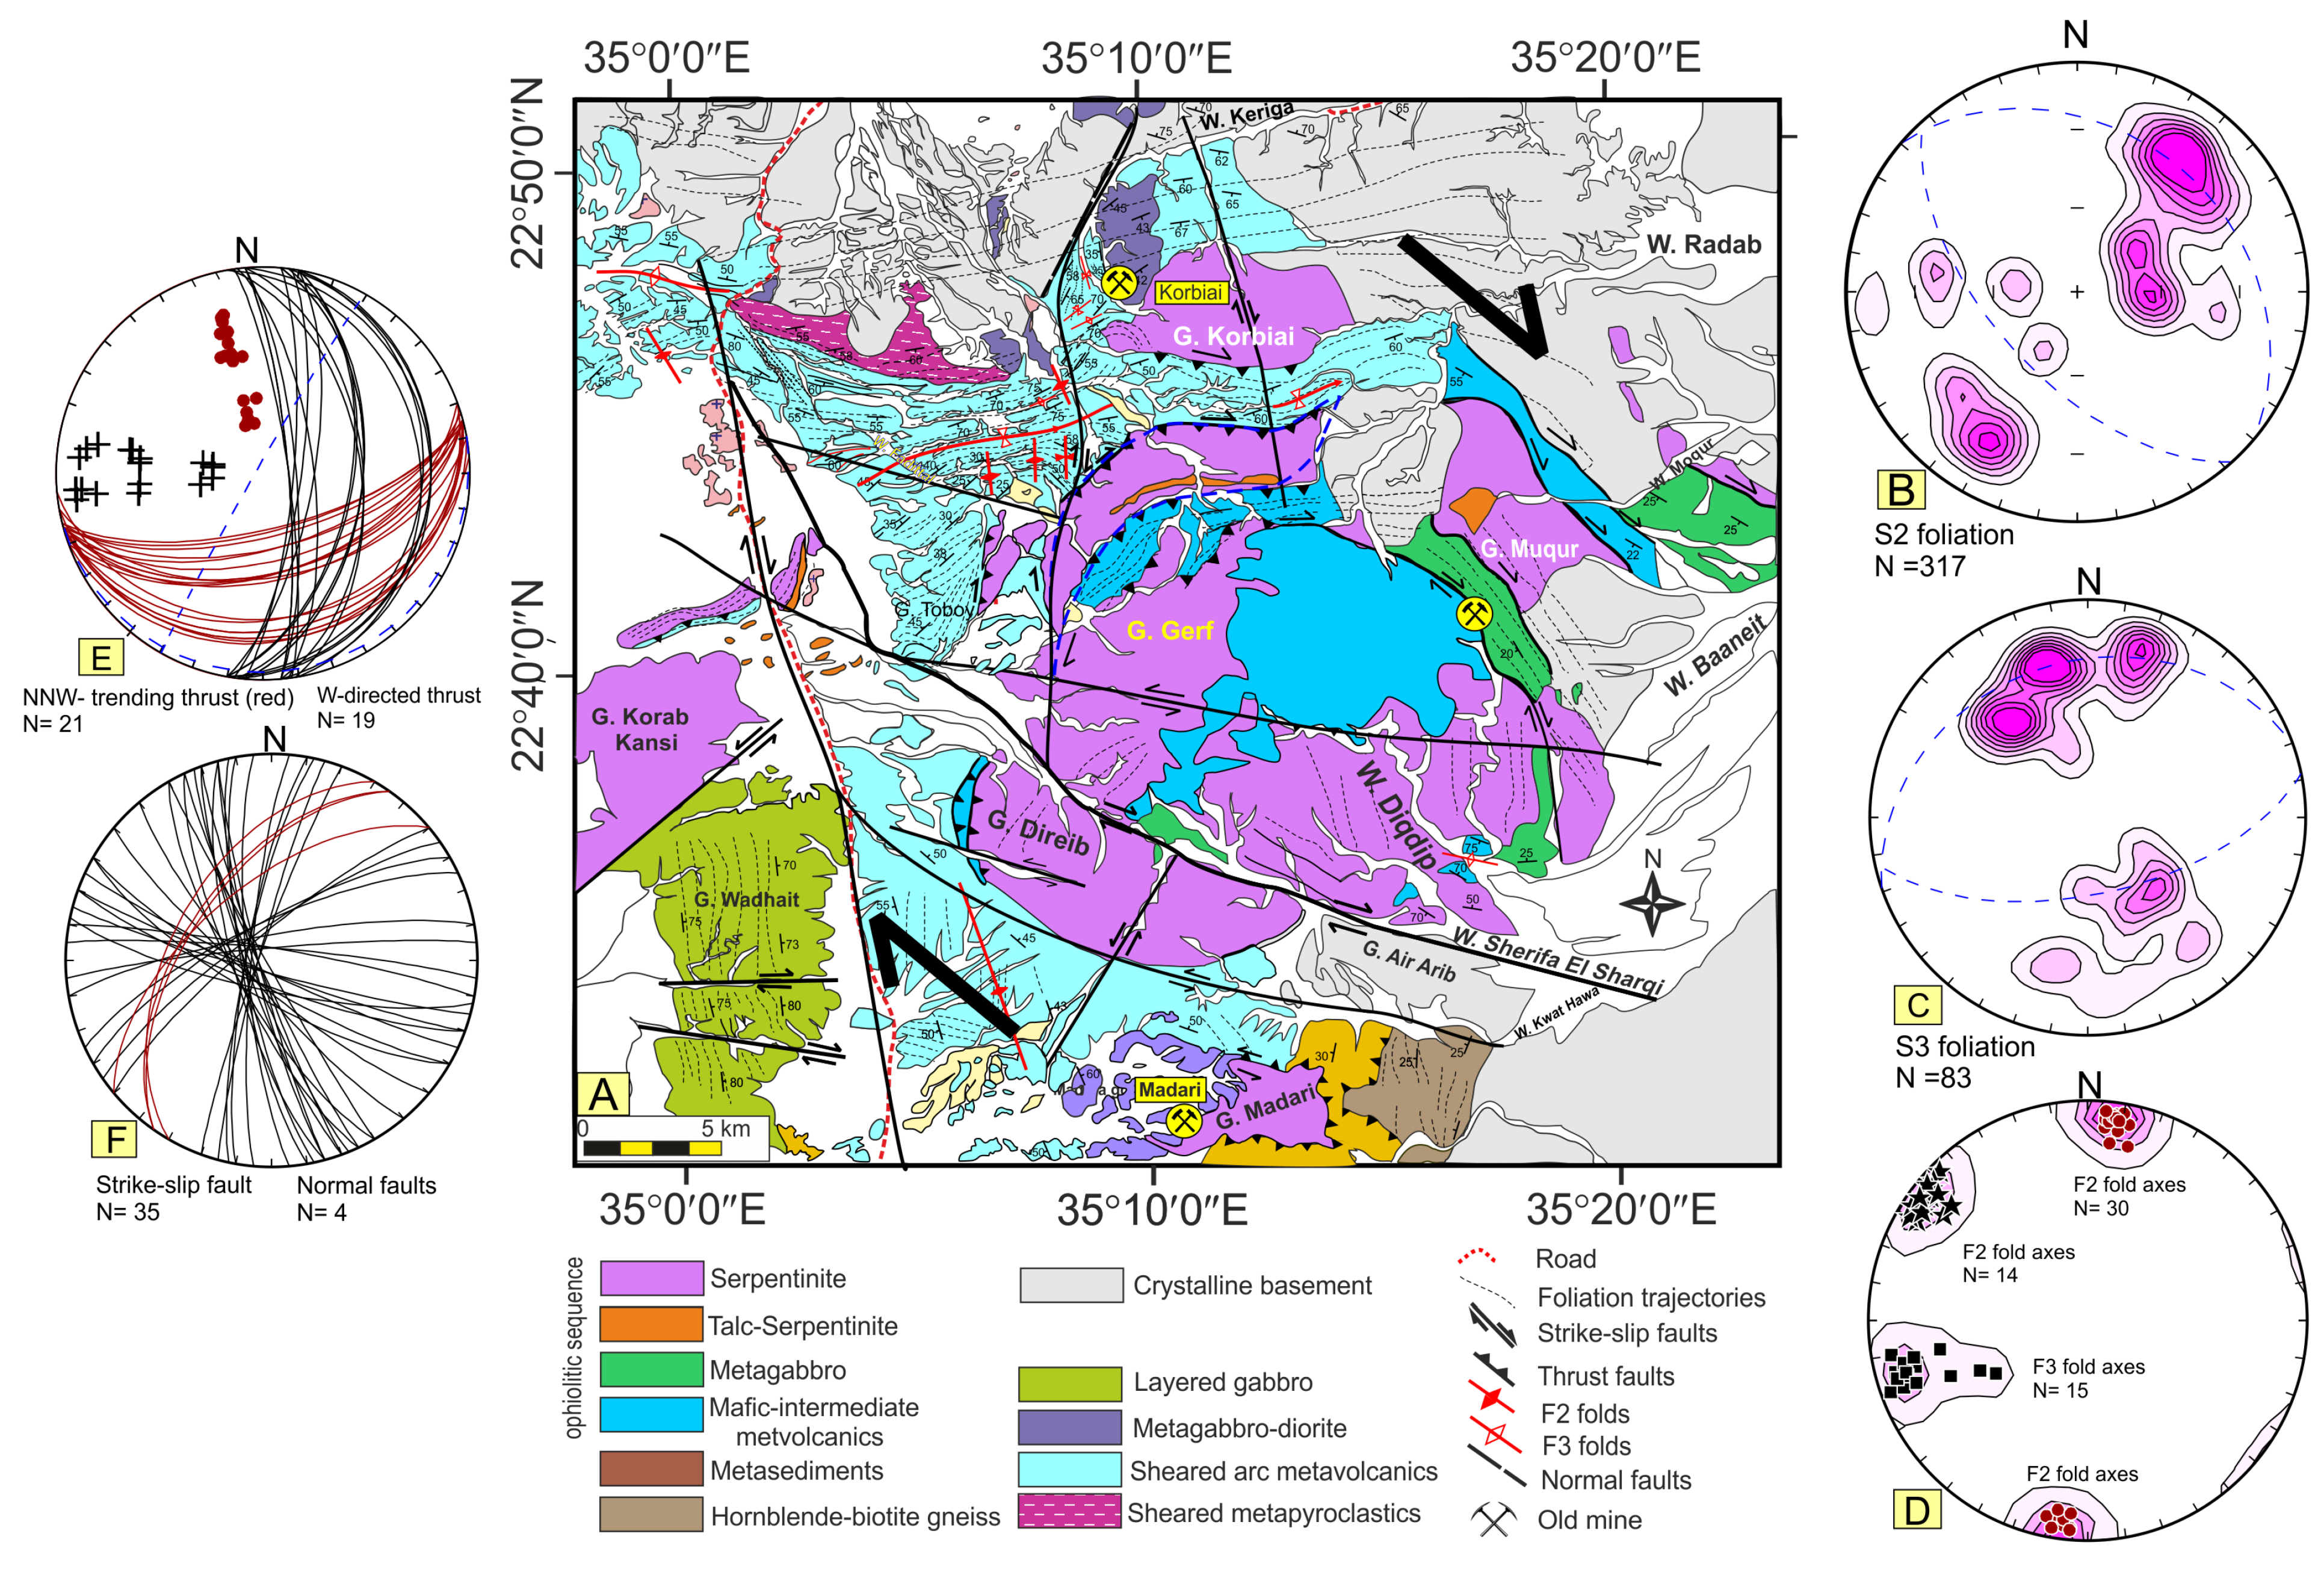
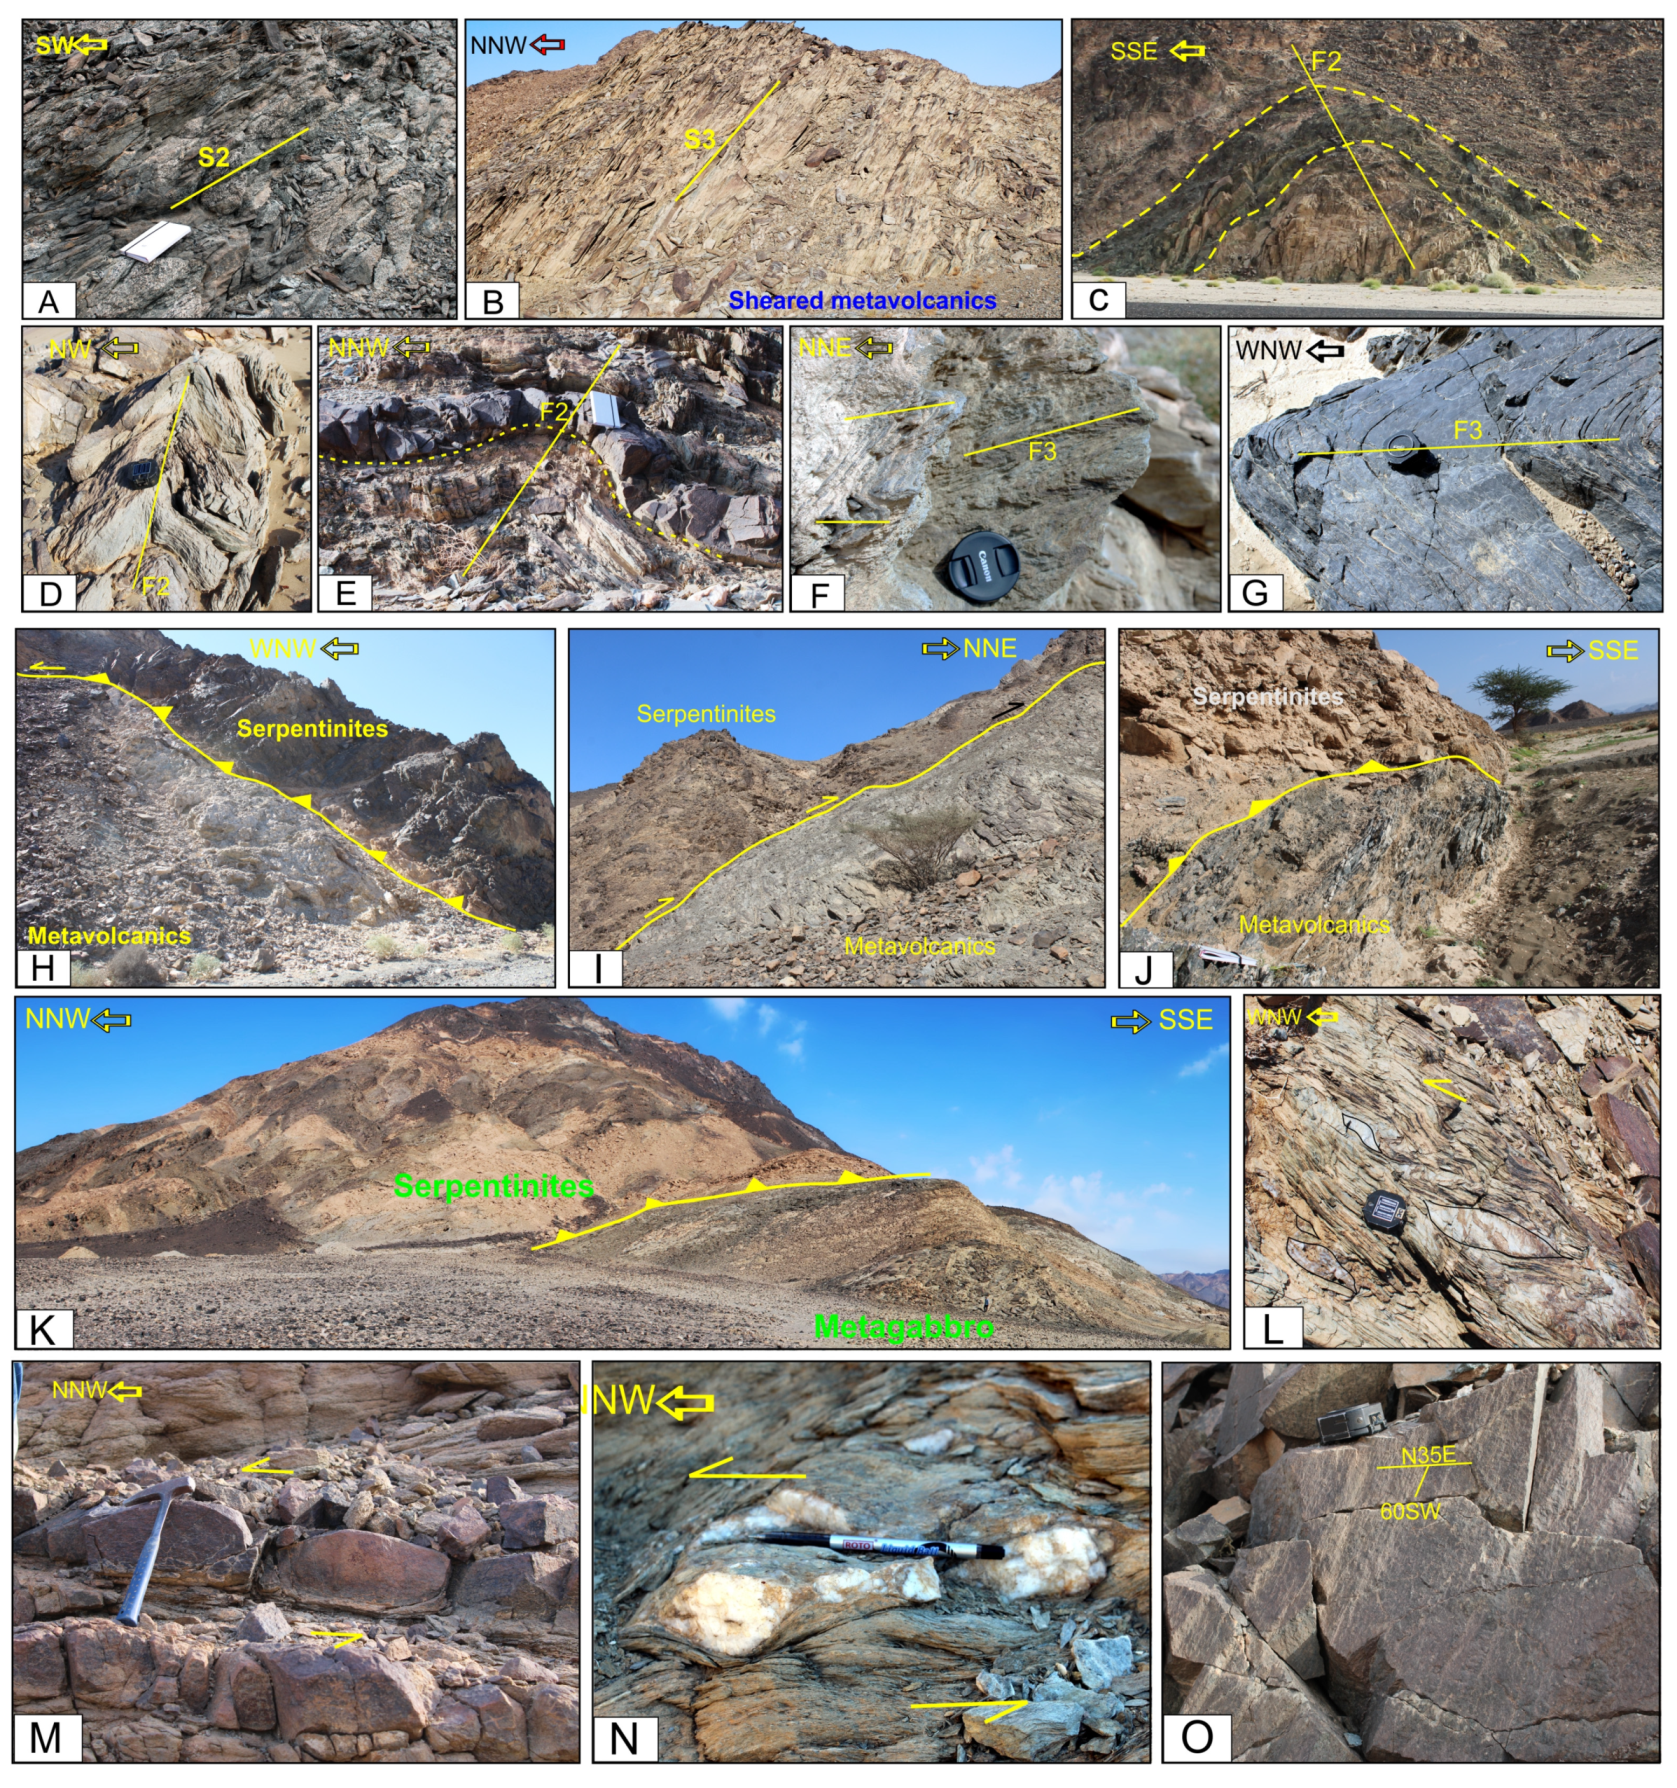
4. Structural Setting of the Gerf Area
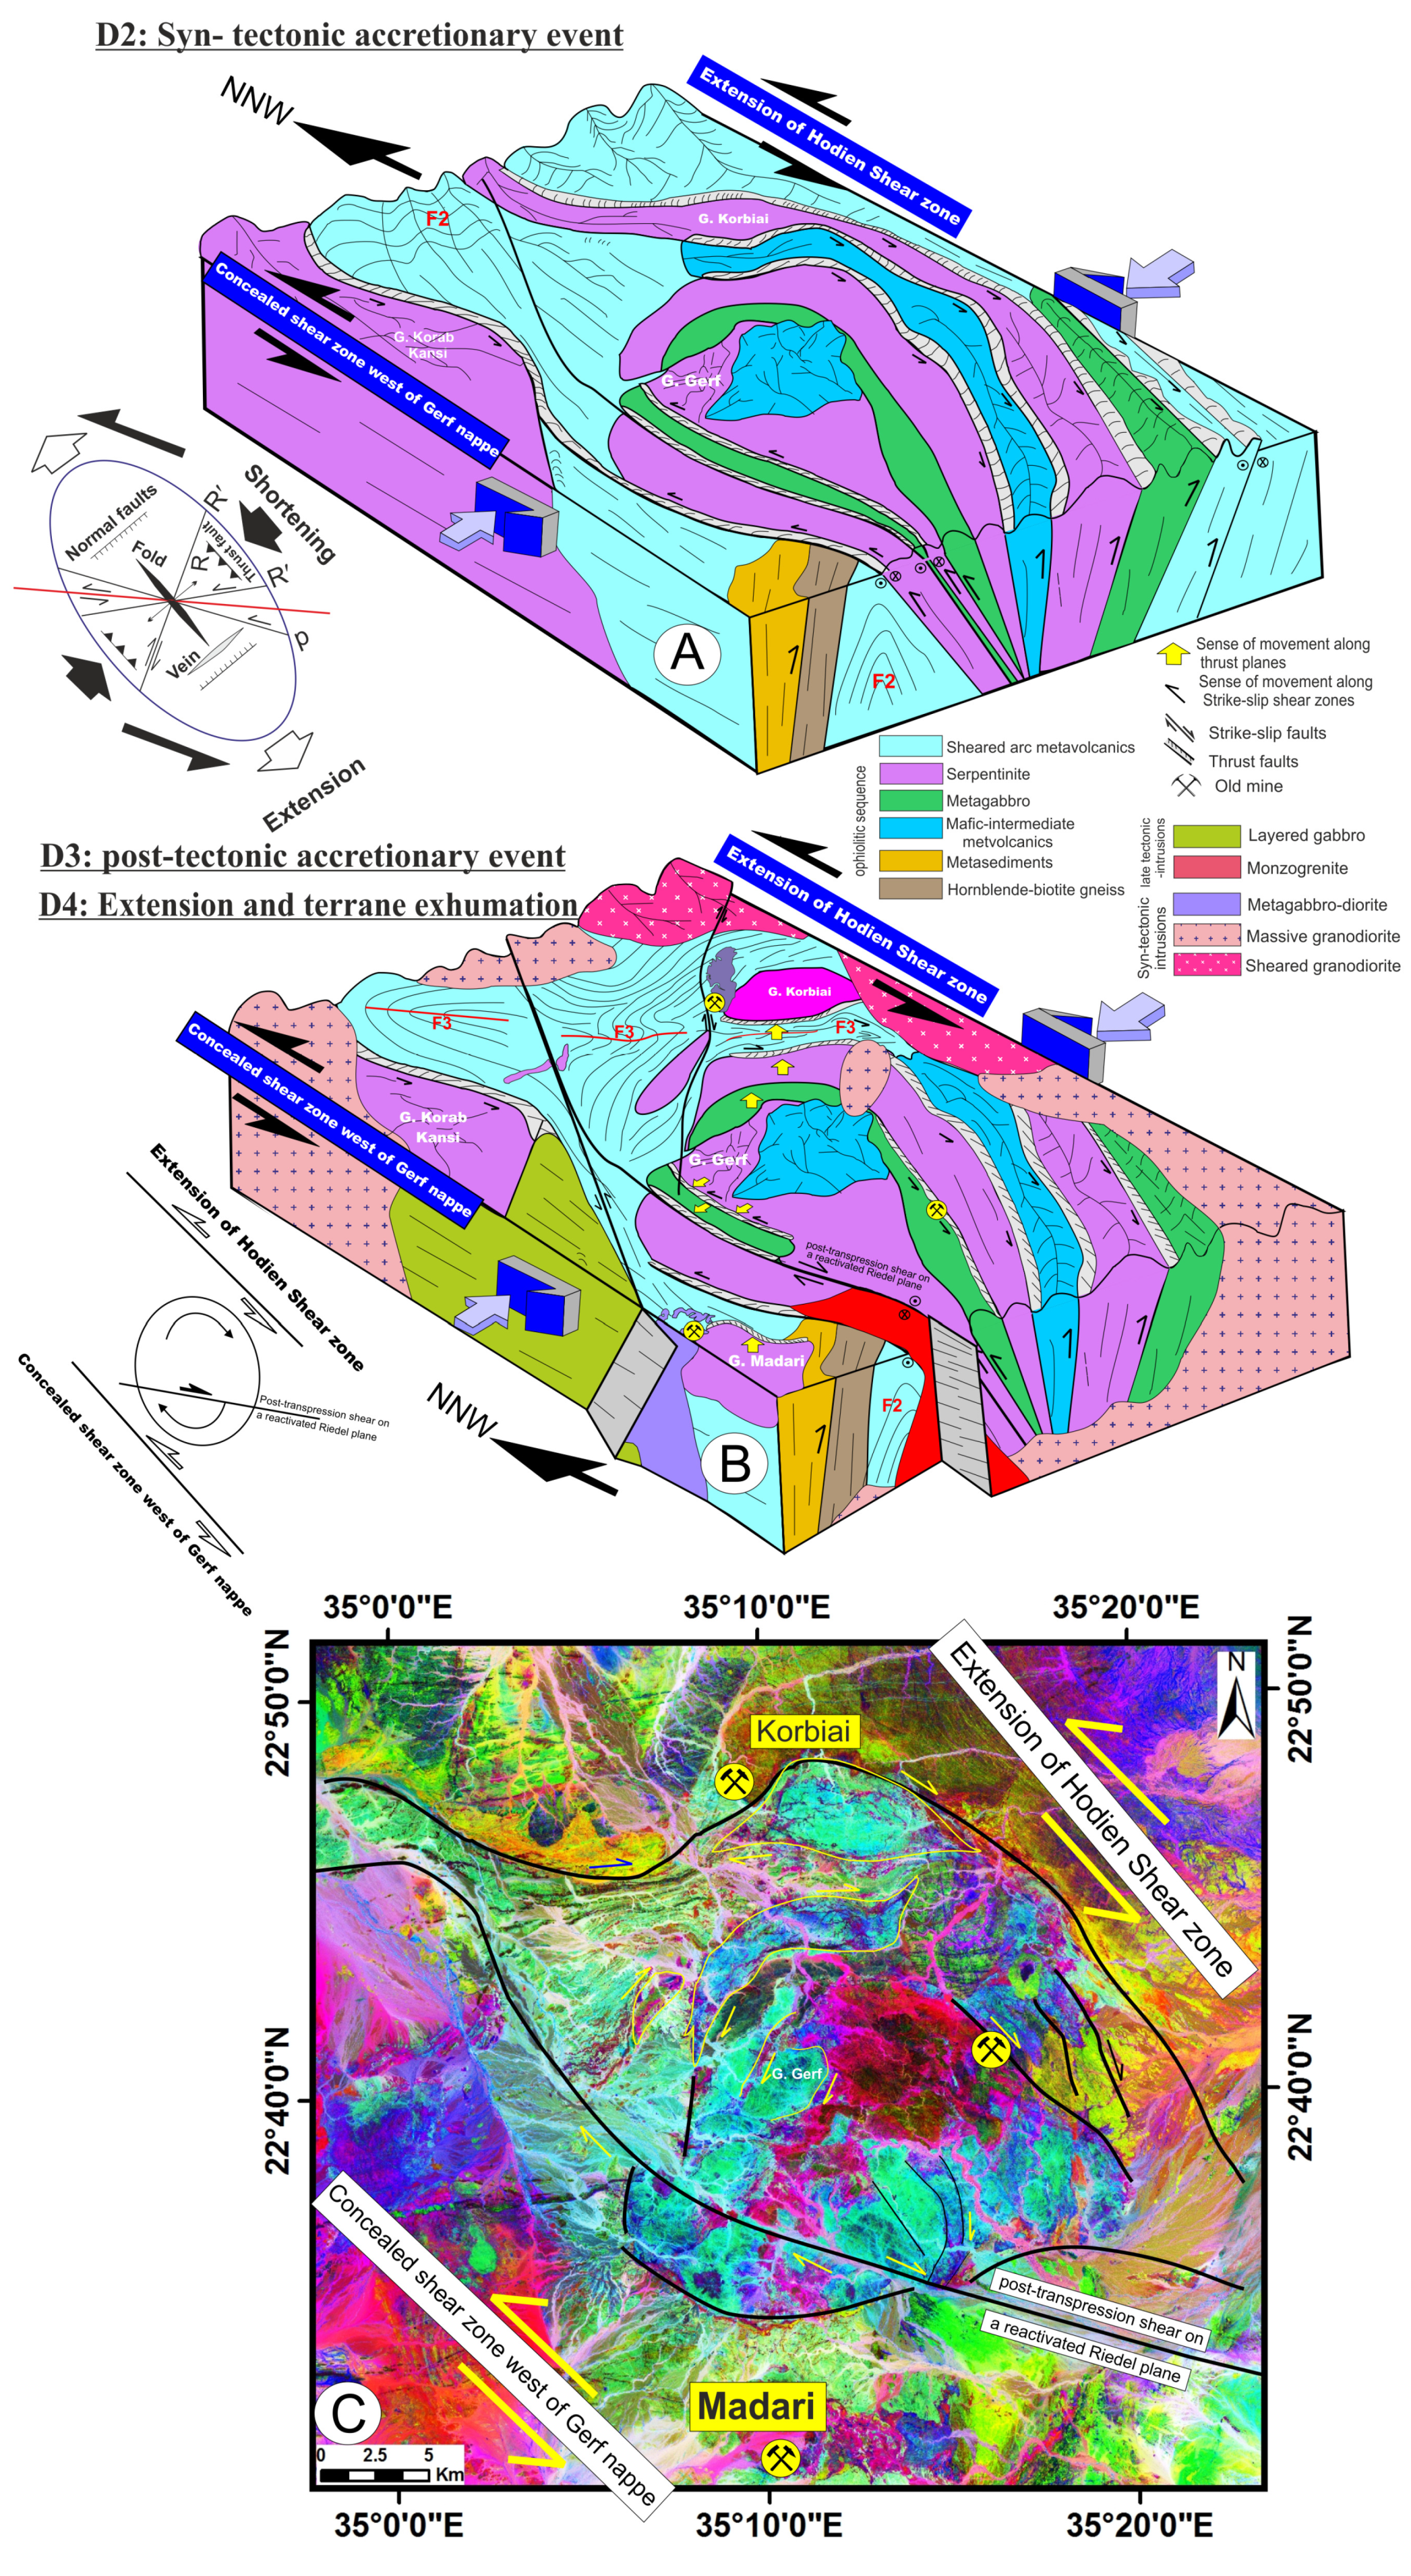
5. Deformational History
5.1. D2: E-W Shortening Syn-Tectonic Accretionary Event
5.2. D3: Post-Tectonic Accretionary Event
5.3. D4: Extension and Terrane Exhumation
6. Gold Occurrence and Shear Zones
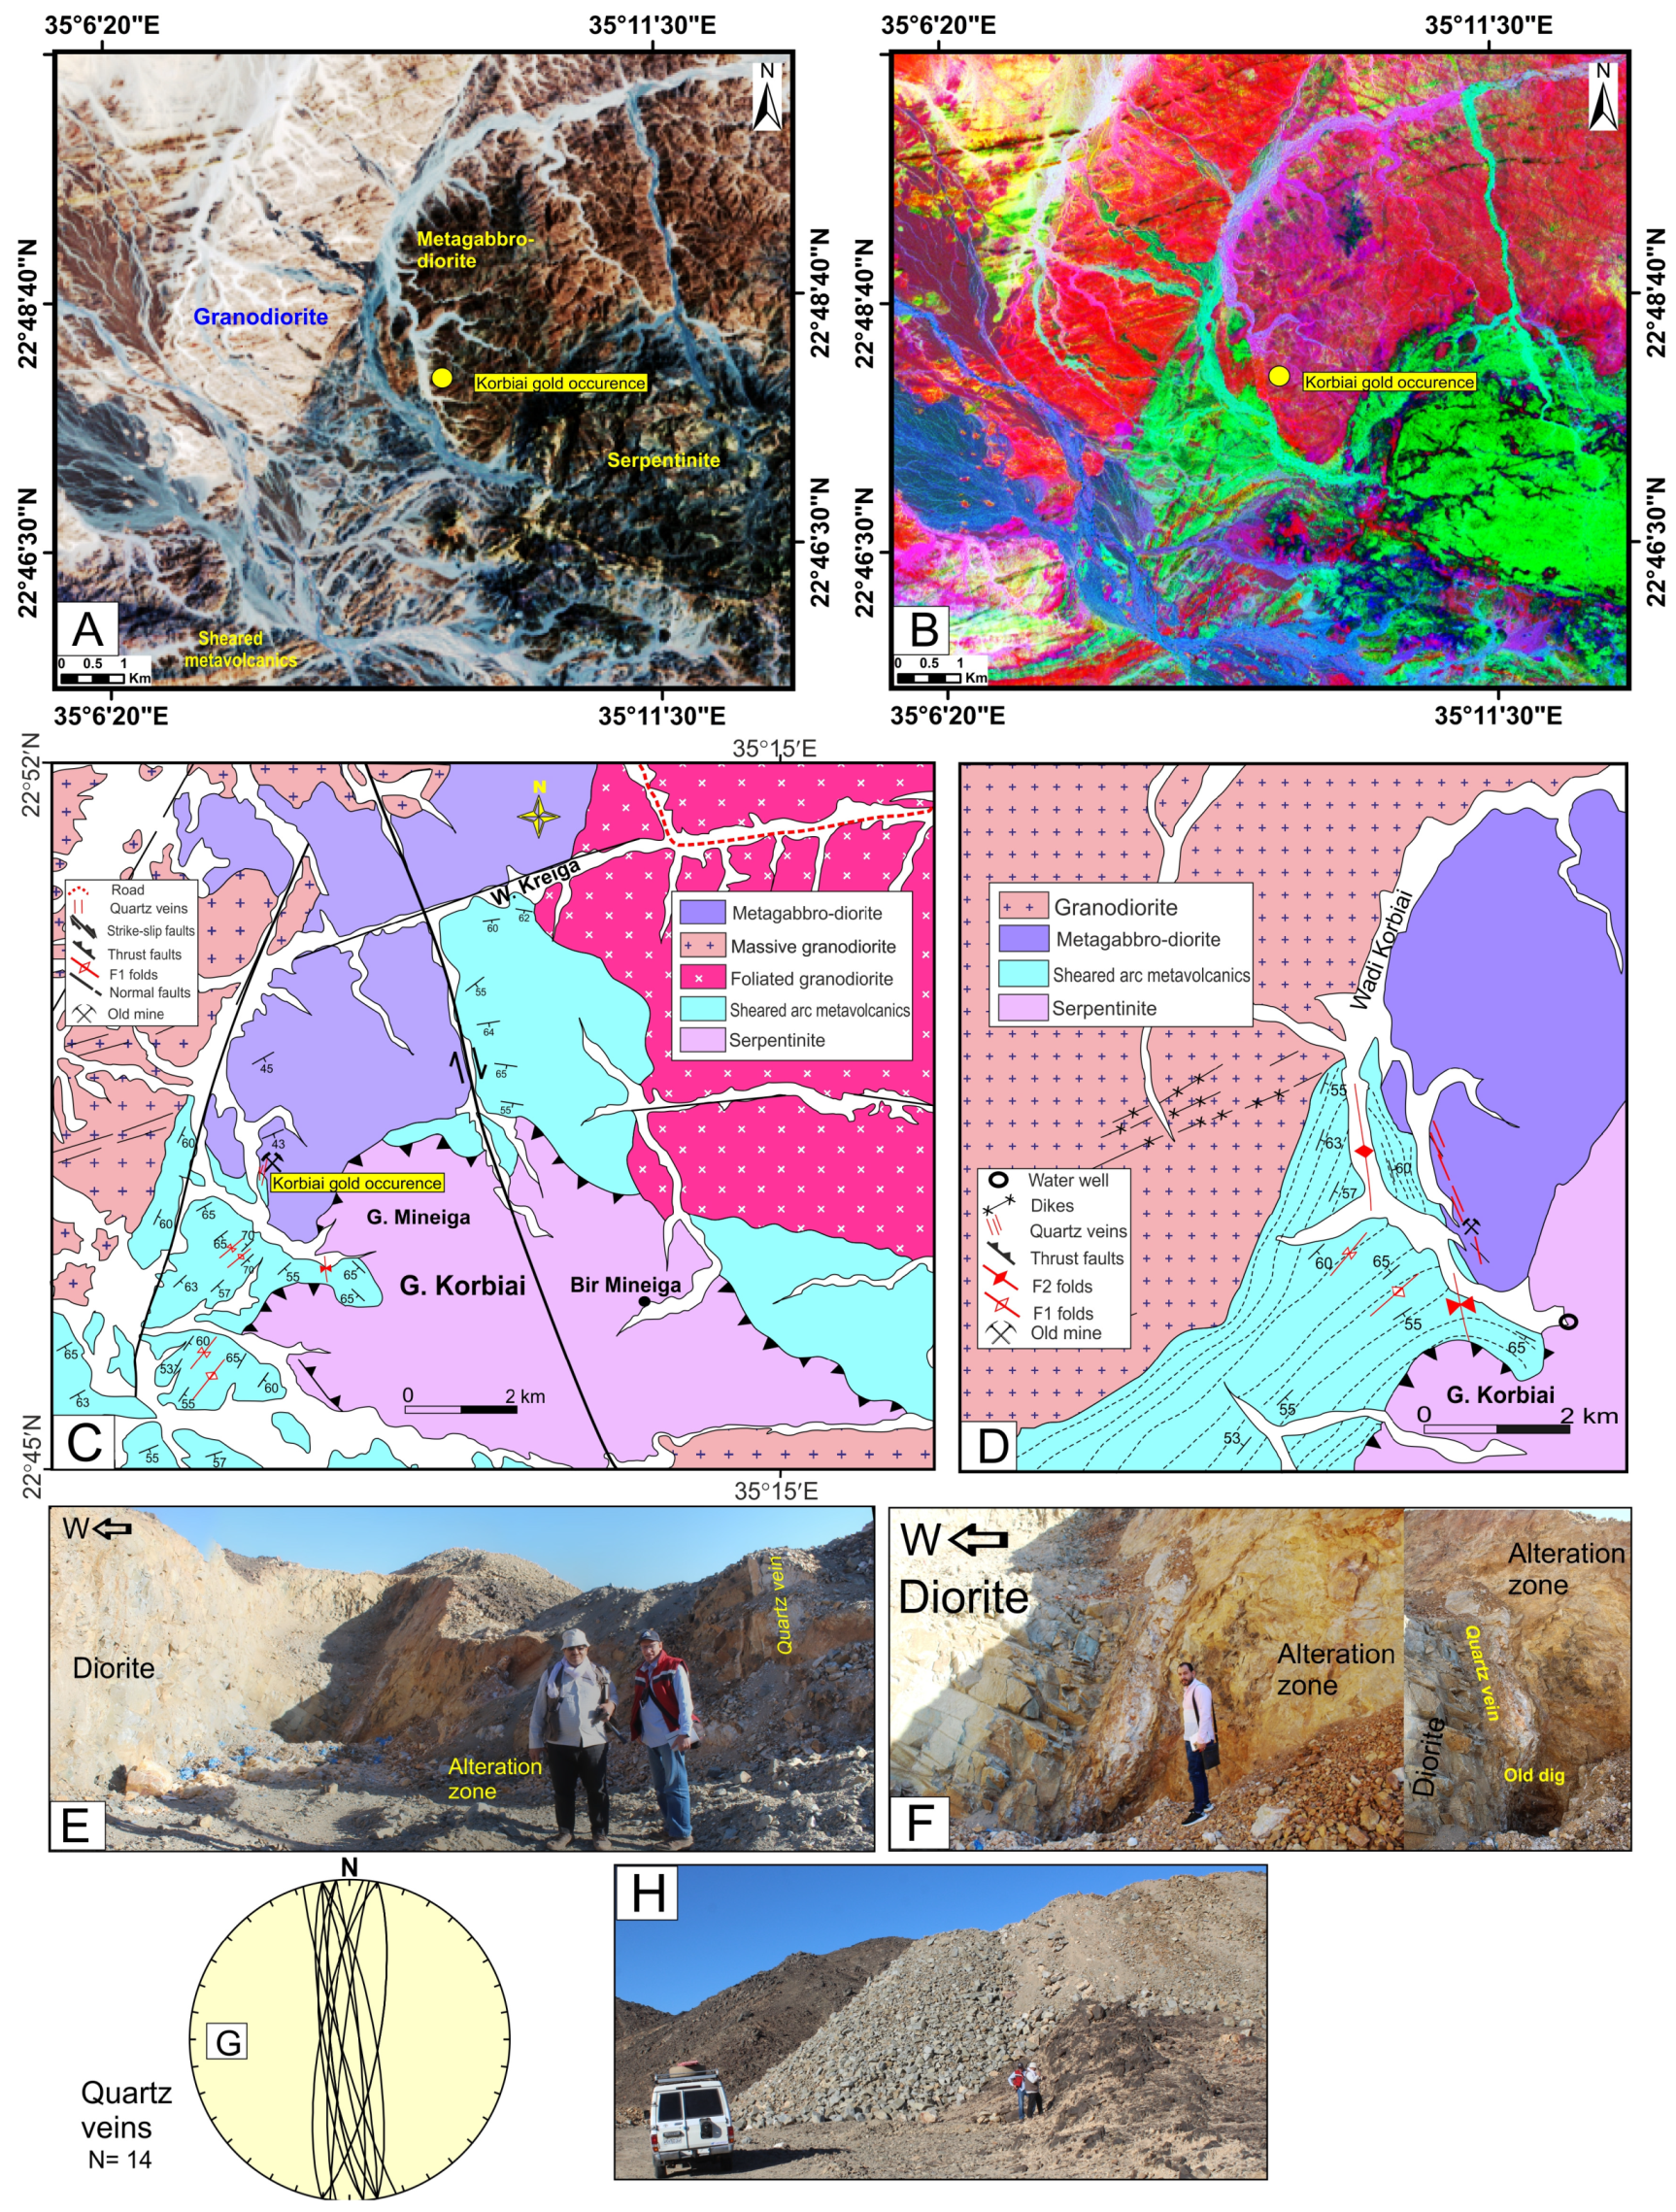
6.1. Korbiai Gold Occurrence
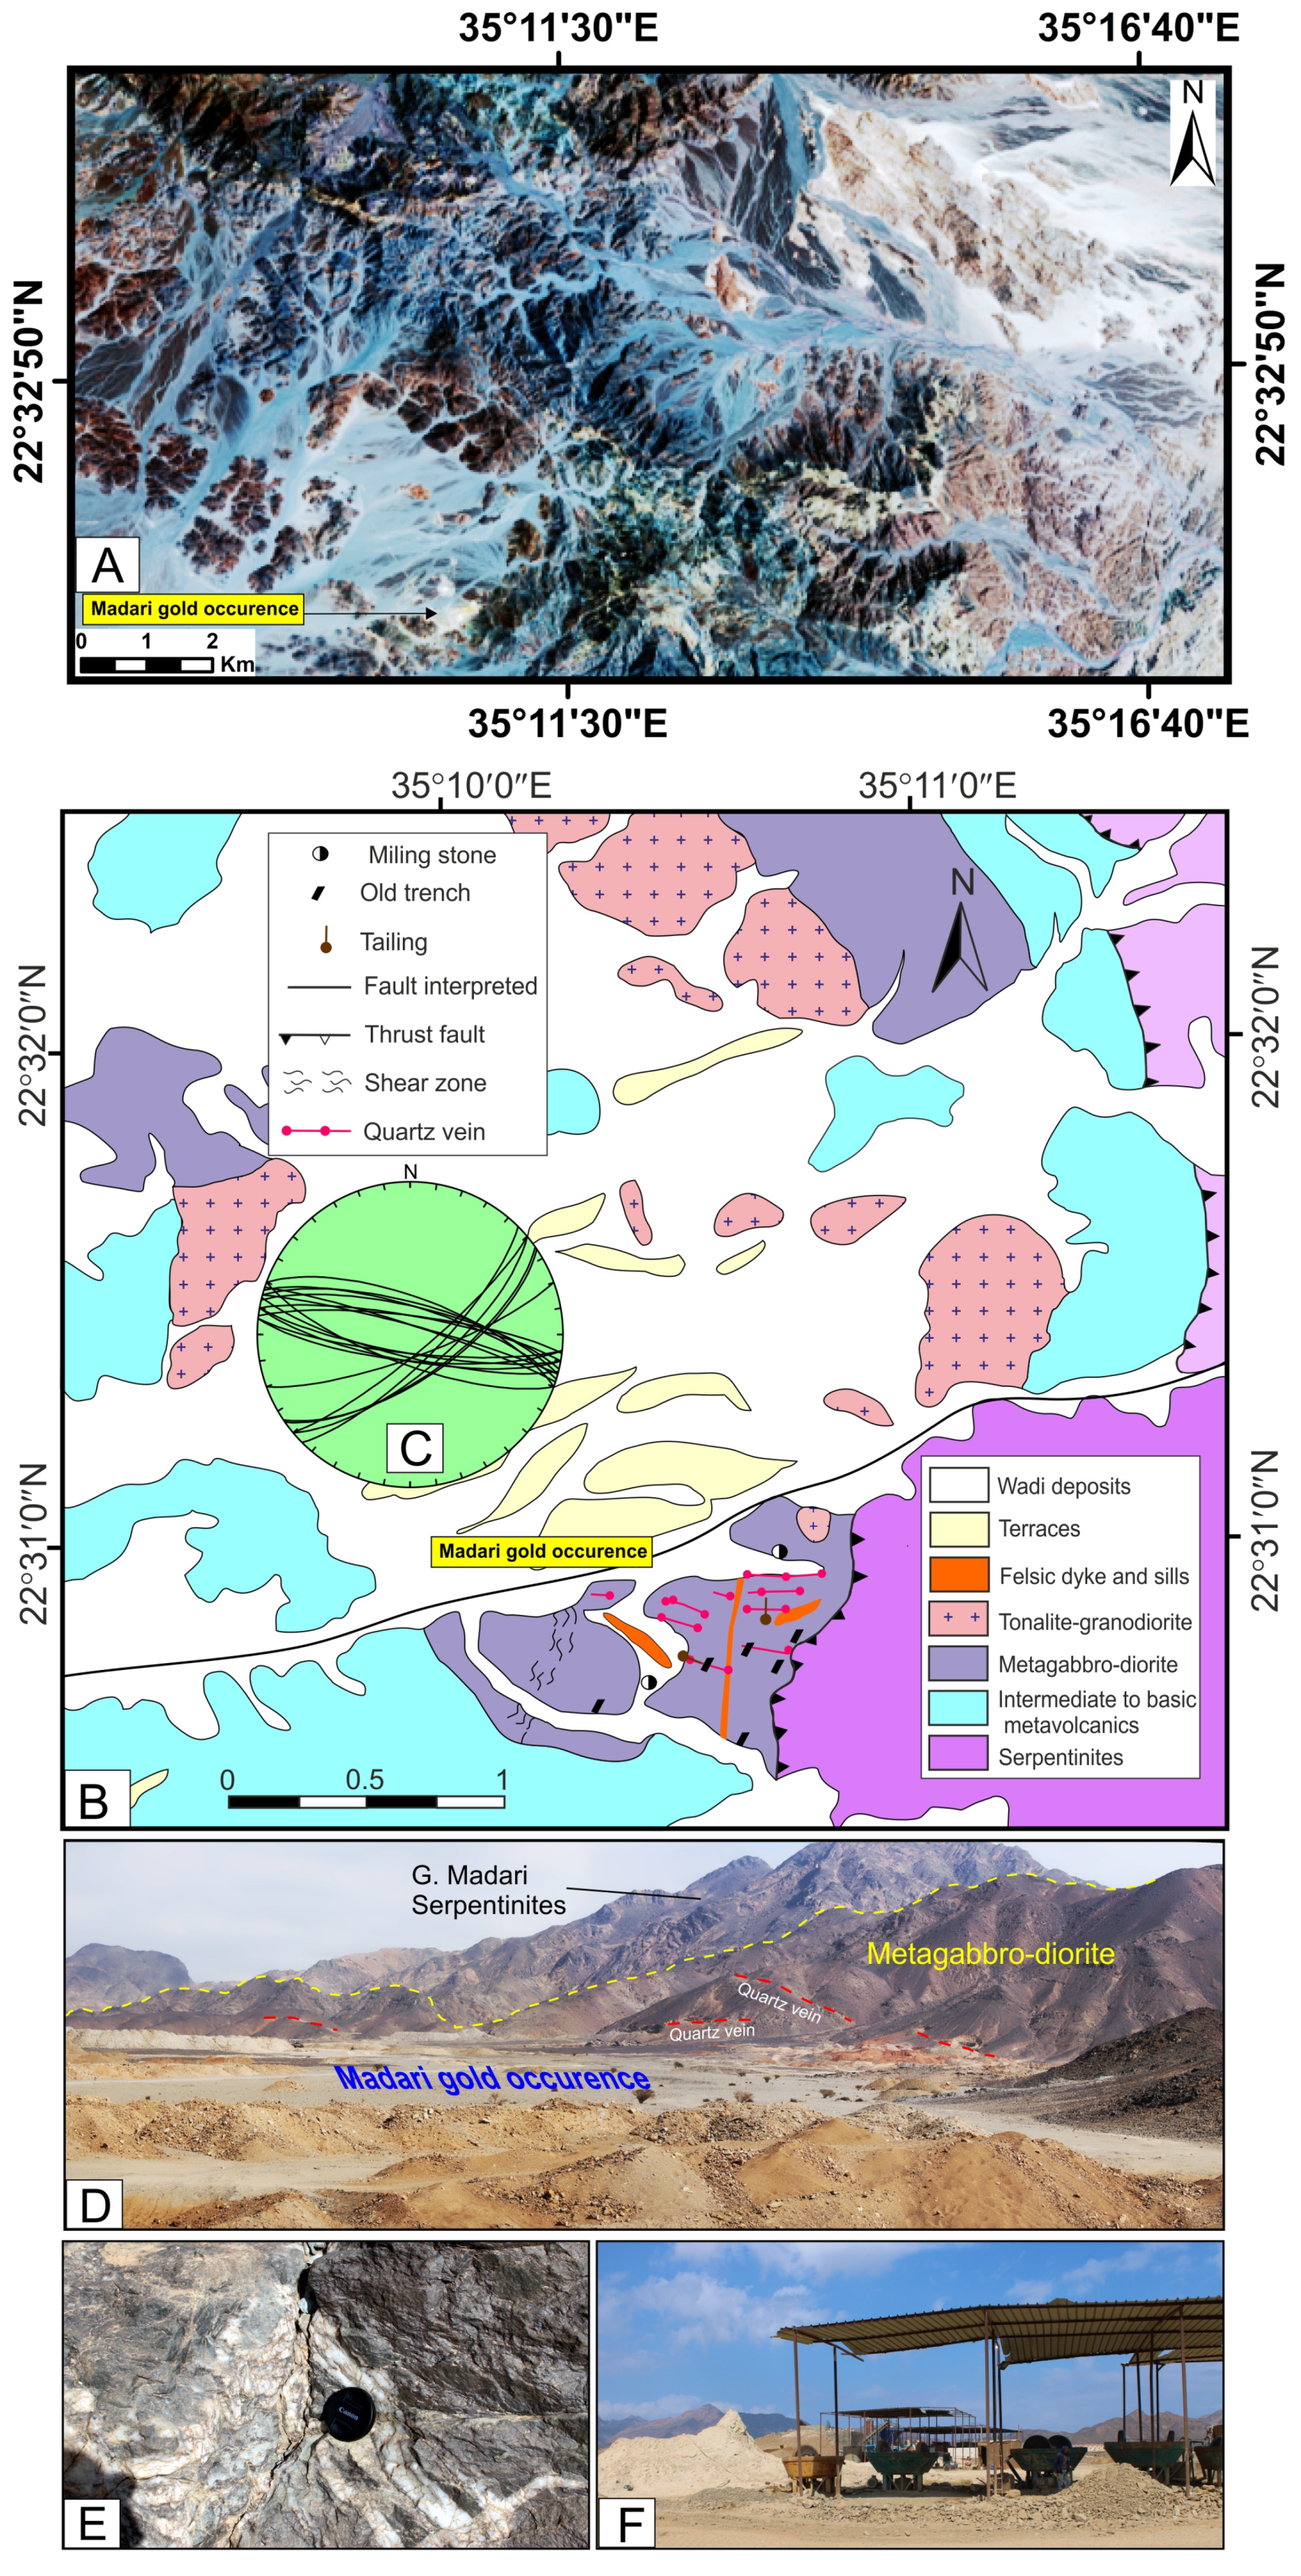
6.2. Madari Gold Occurrence
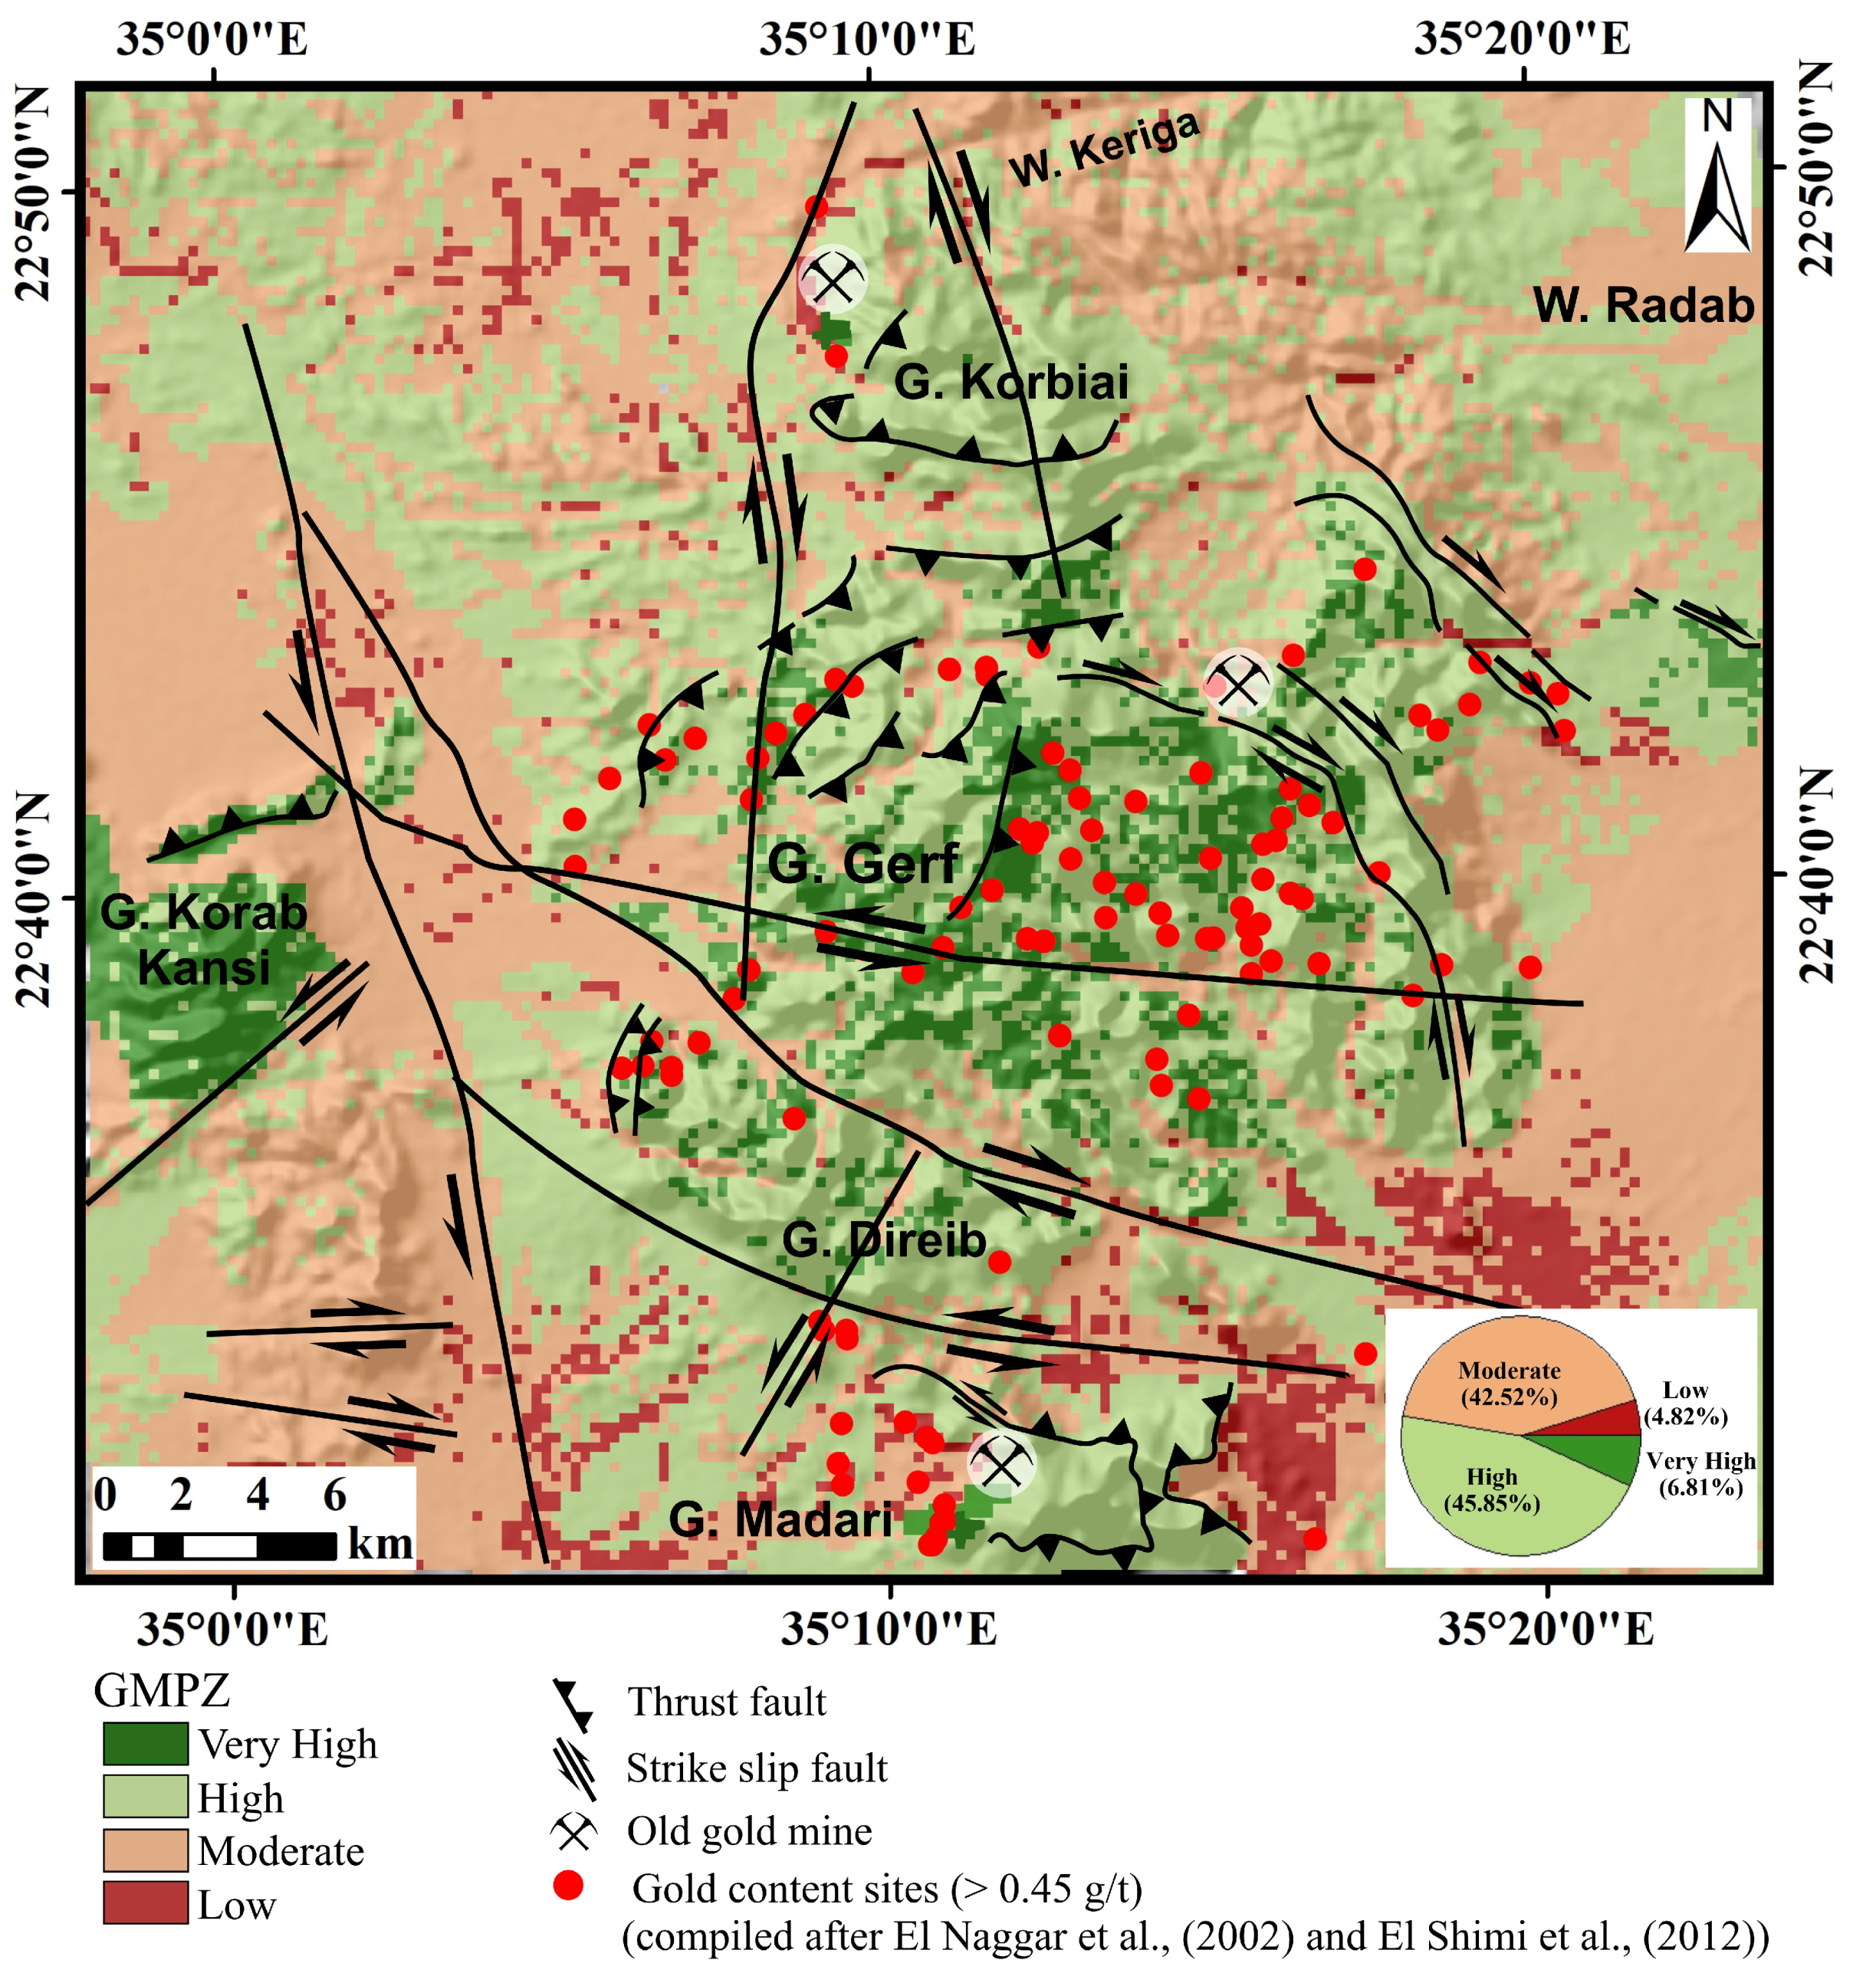
7. GIS-Based Gold Potentiality Mapping
8. Discussion
8.1. Lithological and Alteration Zones Mapping
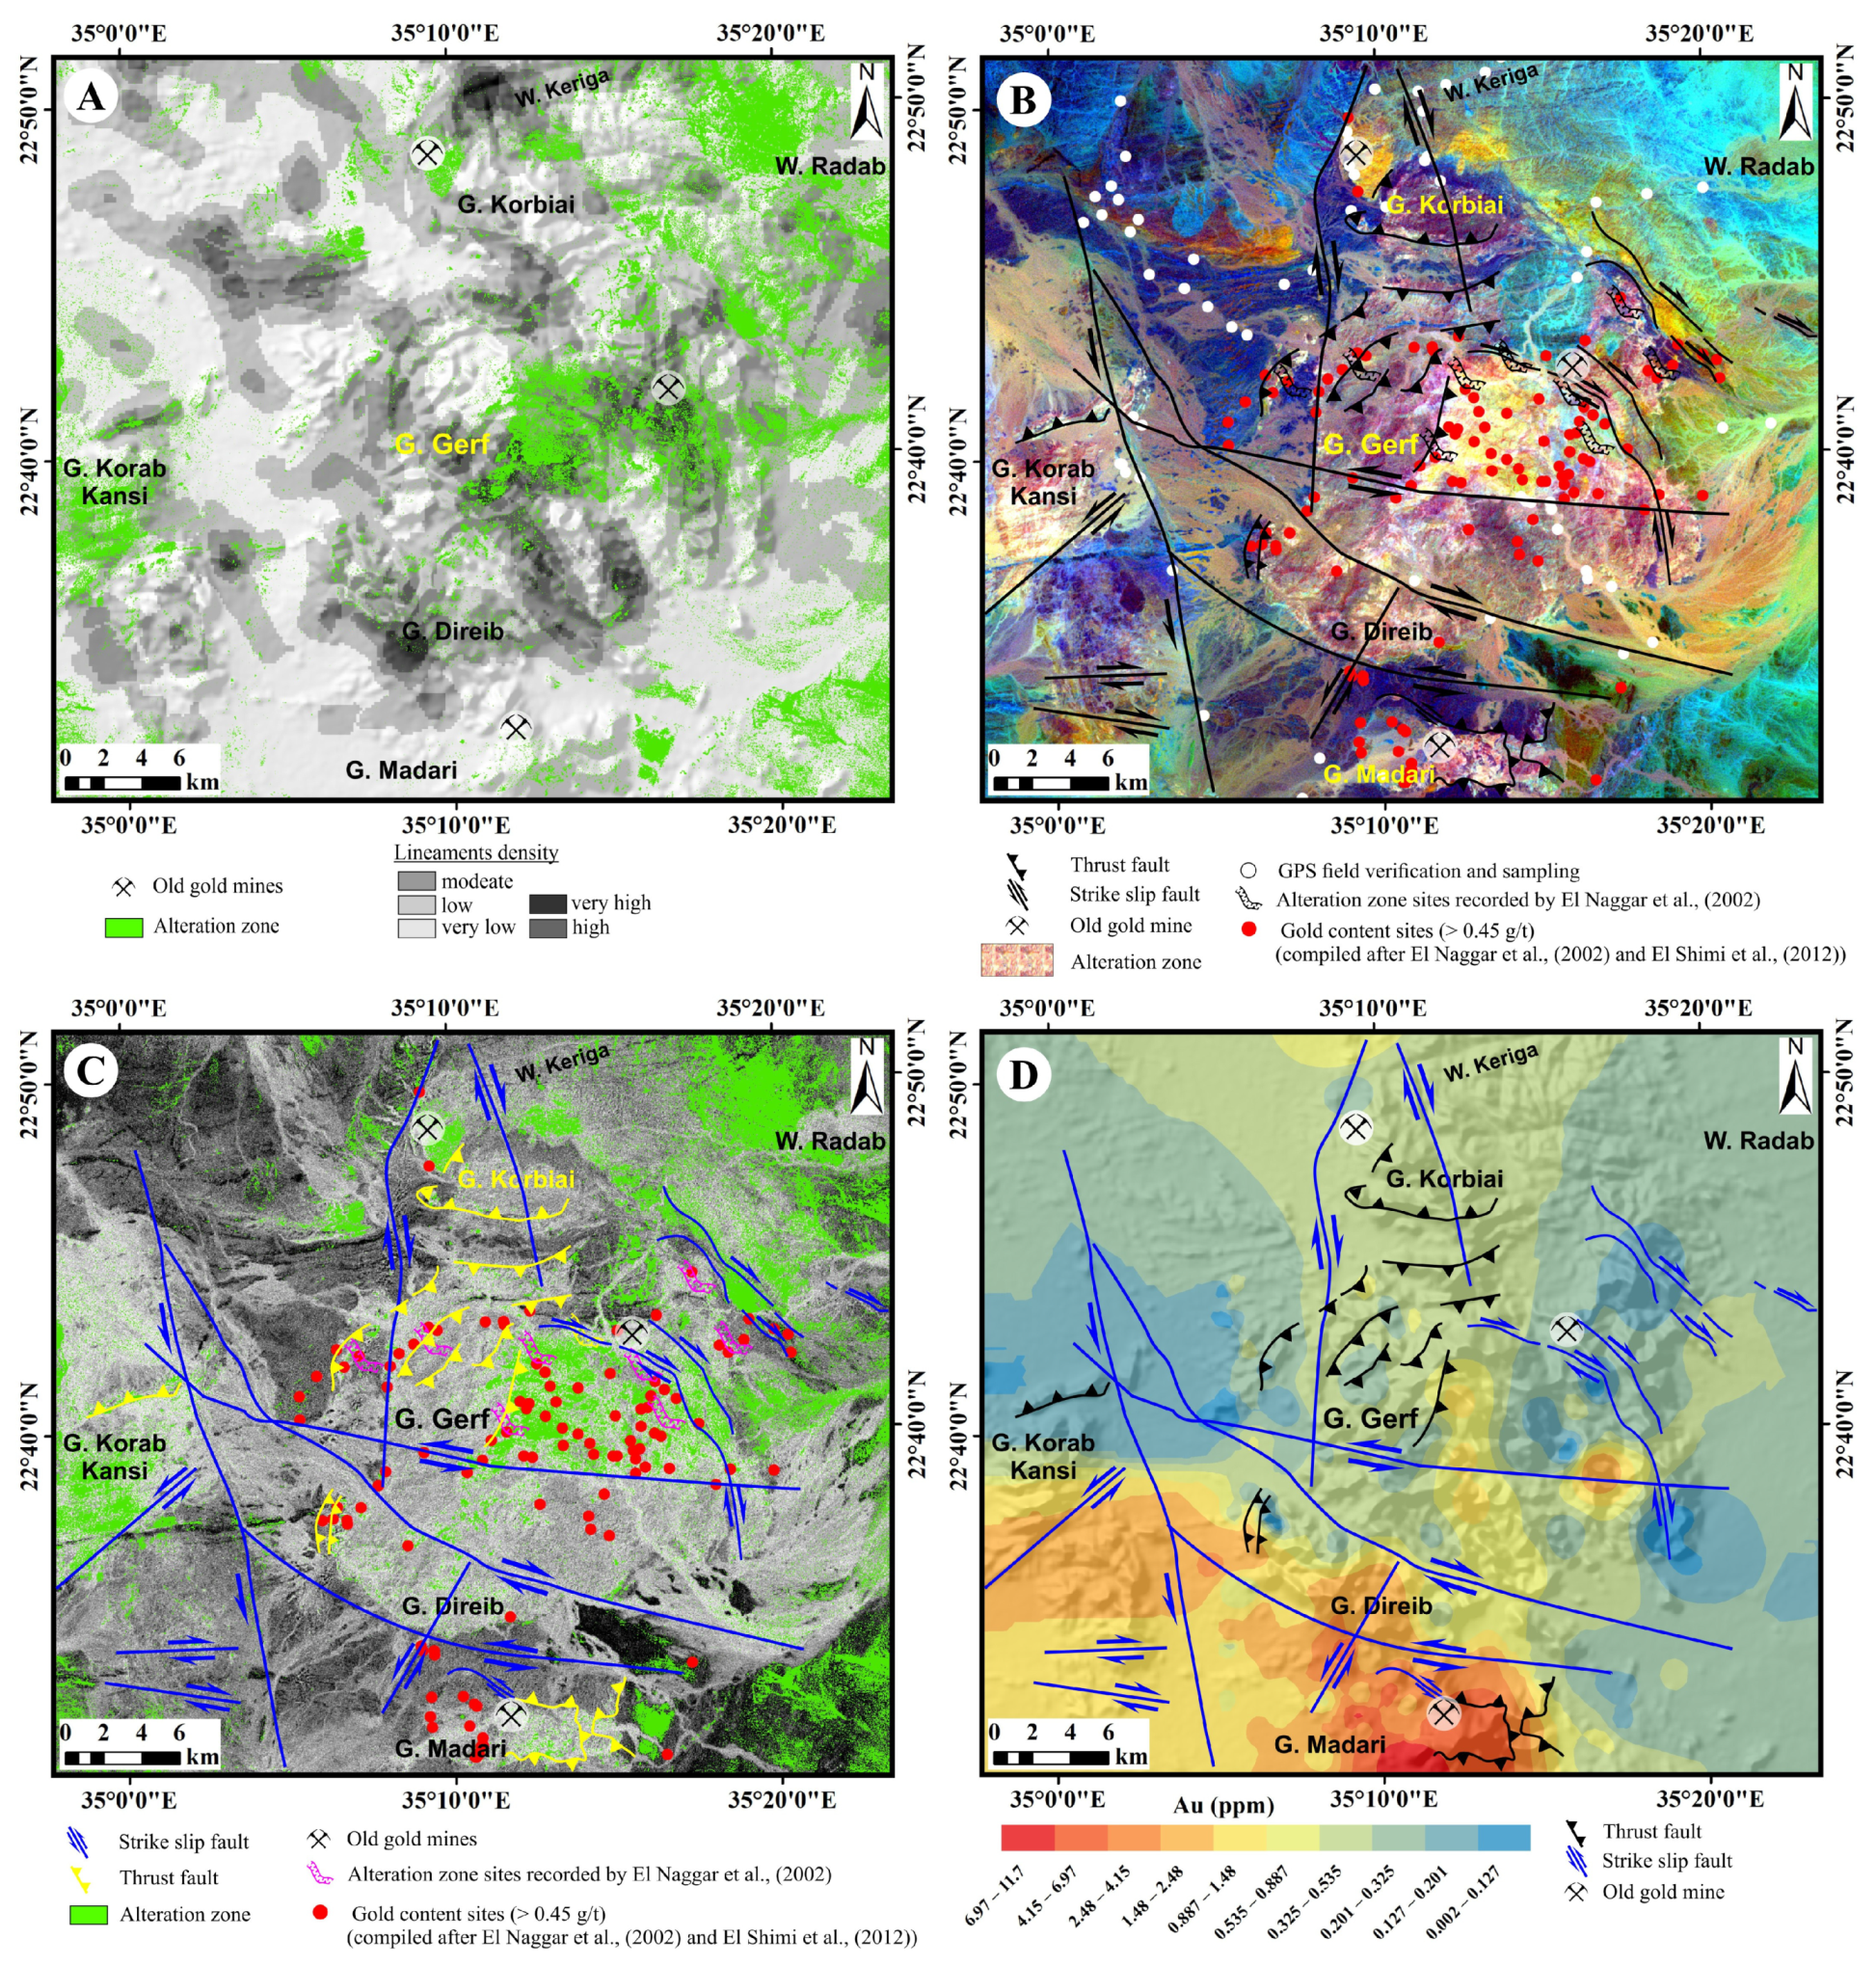
8.2. Integration of Mineralization to Lineament and Structural Elements
8.3. Data Integration and Validation
8.4. Tectonic Evolution of Gerf Area
9. Conclusions
Supplementary Materials
Author Contributions
Funding
Acknowledgments
Conflicts of Interest
References
- Stern, R.J. Arc assembly and continental collision in the Neoproterozoic East African Orogen: Implications for the consolidation of Gondwanaland. Annu. Rev. Earth Planet Sci. 1994, 22, 319–351. [Google Scholar] [CrossRef]
- Fritz, H.; Dallmeyer, D.R.; Wallberecher, E.; Loizenbauer, J.; Hoinkes, G.; Neumayr, P.; Khudeir, A.A. Neoproterozoic tectonothermal evolution of the central Eastern Desert, Egypt: A slow velocity tectonic process of core complex exhumation. J. Afr. Earth Sci. 2002, 34, 137–155. [Google Scholar] [CrossRef]
- Fritz, H.; Wallbrecher, E.; Khudier, A.A.; Abu El Ela, F.; Dallmeyer, R.D. Formation of Neoproterozoic metamorphic core complexes during oblique convergence, Eastern Desert, Egypt. J. Afr. Earth Sci. 1996, 23, 311–329. [Google Scholar] [CrossRef]
- Abdeen, M.M.; Greiling, R.O. A quantitative structural study of Late Pan-African compressional deformation in the central Eastern Desert (Egypt) during Gondwana assembly. Gondwana Res. 2005, 8, 457–471. [Google Scholar] [CrossRef]
- Abd El-Wahed, M.A. Thrusting and transpressional shearing in the Pan-African nappe southwest El-Sibai core complex, Central Eastern Desert, Egypt. J. Afr. Earth Sci. 2008, 50, 16–36. [Google Scholar] [CrossRef]
- Fritz, H.; Abdelsalam, M.; Ali, K.A.; Bingen, B.; Collins, A.S.; Fowler, A.R.; Ghebreab, W.; Hauzenberger, C.A.; Johnson, P.R.; Kusky, T.M.; et al. Orogen styles in the East African Orogen: A review of the Neoproterozoic to Cambrian tectonic evolution. J. Afr. Earth Sci. 2013, 86, 65–106. [Google Scholar] [CrossRef]
- Zoheir, B.A.; Emam, A.; El-Amawy, M.; Abu-Alam, T. Auriferous shear zones in the central Allaqi-Heiani belt: Orogenic gold in post-accretionary structures, SE Egypt. J. Afr. Earth Sci. 2018, 146, 118–131. [Google Scholar] [CrossRef]
- Zoheir, B.A.; Feigenson, M.; Zi, J.-W.; Turrin, B.; Deshesh, F.; El-Metwally, A. Ediacaran (~600 Ma) orogenic gold in Egypt: Age of the Atalla gold mineralization and its geological significance. Int. Geol. Rev. 2018, 61, 779–794. [Google Scholar] [CrossRef]
- Zoheir, B.A.; Emam, A.; Abd El-Wahed, M.; Soliman, N. Gold endowment in the evolution of the Allaqi-Heiani suture, Egypt: A synthesis of geological, structural, and space-borne imagery data. Ore Geol. Rev. 2019, 110, 102938. [Google Scholar] [CrossRef]
- Zoheir, B.; Abd El-Wahed, M.A.; Pour, A.B.; Abdelnasser, A. Orogenic Gold in Transpression and Transtension Zones: Field and Remote Sensing Studies of the Barramiya–Mueilha Sector, Egypt. Remote Sens. 2019, 11, 2122. [Google Scholar] [CrossRef] [Green Version]
- Hamimi, Z.; Abd El-Wahed, M.A.; Gahlan, H.A.; Kamh, S.Z. Tectonics of the Eastern Desert of Egypt: Key to understanding the Neoproterozoic evolution of the Arabian-Nubian Shield (East African Orogen). In Geology of the Arab World—An Overview; Bendaoud, A., Hamimi, Z., Hamoudi, M., Djemai, S., Zoheir, B., Eds.; Springer Geology; Springer: Berlin, Germany, 2019; pp. 1–81. [Google Scholar]
- Abd El-Wahed, M.A.; Lebda, E.; Ali, A.; Kamh, S.; Attia, M. The structural geometry and metamorphic evolution of the Umm Gheig shear belt, Central Eastern Desert, Egypt: Implications for exhumation of Sibai Core Complex during oblique transpression. Arab. J. Geosci. 2019, 12, 764. [Google Scholar] [CrossRef]
- Abd El-Wahed, M.A.; Zoheir, B.; Pour, A.B.; Kamh, S. Shear-Related Gold Ores in the Wadi Hodein Shear Belt, South Eastern Desert of Egypt: Analysis of Remote Sensing, Field and Structural Data. Minerals 2021, 11, 474. [Google Scholar] [CrossRef]
- Abd El-Wahed, M.A.; Attia, M. Genesis of the gneissic core complexes in the Arabian-Nubian Shield and its tectonic implications: A regional overview. J. Asian Earth Sci. 2022, 236, 105337. [Google Scholar] [CrossRef]
- Kröner, A.; Stern, R.J. Pan-African orogeny. In Encyclopedia of Geology, 1st ed.; Selley, R.C., Cocks, L.R.M., Plimer, I.R., Eds.; Elsevier: Amsterdam, The Netherlands, 2004; pp. 1–12. [Google Scholar]
- Stern, R.J.; Hedge, C.E. Geochronologic and isotopic constraints on Late Precambrian crustal evolution in the Eastern Desert of Egypt. Am. J. Sci. 1985, 285, 97–127. [Google Scholar] [CrossRef]
- El Gaby, S.; List, F.K.; Tehrani, R. Geology, evolution and metallogenesis of the Pan-African Belt in Egypt. In The Pan African Belt of Northeast Africa and Adjacent Areas; El Gaby, S., Greiling, R.O., Eds.; Vieweg & Sohn: Braunschweig, Germany; Wiesbaden, Germany, 1988; pp. 17–68. [Google Scholar]
- Abd El-Wahed, M.A.; Ashmawy, M.H.; Tawfik, H.A. Structural setting of Cretaceous pull-apart basins and Miocene extensional folds in Quseir-Umm Gheig region, northwestern Red Sea, Egypt. Lithosphere 2010, 2, 13–32. [Google Scholar] [CrossRef] [Green Version]
- Abd El-Wahed, M.A.; Harraz, H.Z.; El-Behairy, M.H. Transpressional imbricate thrust zones controlling gold mineralization in the Central Eastern Desert of Egypt. Ore Geol. Rev. 2016, 78, 424–446. [Google Scholar] [CrossRef]
- Abu-Alam, T.S.; Stüwe, K. Exhumation during oblique transpression: The Feiran-Solaf region, Egypt. J. Metamorph. Geol. 2009, 27, 439–459. [Google Scholar] [CrossRef]
- Abd El-Wahed, M.A.; Kamh, S.Z. Pan African dextral transpressive duplex and flower structure in the Central Eastern Desert of Egypt. Gondwana Res. 2010, 18, 315–336. [Google Scholar] [CrossRef]
- Abu-Alam, T.S.; Abdel El Monsef, M.; Grosch, E. Shear-zone hosted gold mineralization of the Arabian-Nubian Shield: Devolatilization processes across the greenschist-amphibolite facies transition. In Metamorphic Geology: Microscale to Mountain Belts; Ferrero, S., Lanari, P., Goncalves, P., Grosch, E.G., Eds.; The Geological Society of London: London, UK, 2018; Volume 478, pp. 287–313. [Google Scholar]
- Hamimi, Z.; Fowler, A.R. Najd Shear System in the Arabian-Nubian Shield. In The Geology of the Arabian-Nubian Shield. Regional Geology Reviews; Hamimi, Z., Fowler, A.R., Liégeois, J.P., Collins, A., Abdelsalam, M.G., Abd EI-Wahed, M., Eds.; Springer: Cham, Switzerland, 2021; pp. 359–392. [Google Scholar]
- Stern, R.J.; Ali, K. Crustal Evolution of the Egyptian Precambrian Rocks. In The Geology of Egypt, Regional Geology Reviews; Springer: Cham, Switzerland, 2020; pp. 153–189. [Google Scholar]
- Helmy, H.M.; Kaindl, R.; Fritz, H.; Loizenbauer, J. The Sukari gold mine, eastern Desert-Egypt: Structural setting, mineralogy and fluid inclusion study. Miner. Depos. 2004, 39, 495–511. [Google Scholar] [CrossRef]
- Zoheir, B.A. Transpressional zones in ophiolitic mélange terranes: Potential exploration targets for gold in the South Eastern Desert, Egypt. J. Geochem. Explor. 2011, 111, 23–38. [Google Scholar] [CrossRef]
- Zoheir, B.A. Lode-gold mineralization in convergent wrench structures: Examples from South Eastern Desert, Egypt. J. Geochem. Explor. 2012, 114, 82–97. [Google Scholar] [CrossRef]
- Zoheir, B.A. Controls on lode gold mineralization, Romite deposit, South Eastern Desert, Egypt. Geosci. Front. 2012, 3, 571–585. [Google Scholar] [CrossRef] [Green Version]
- Emam, A.; Zoheir, B. Au and Cr mobilization through metasomatism: Microchemical evidence from ore-bearing listvenite, South Eastern Desert of Egypt. J. Geochem. Explor. 2013, 125, 34–45. [Google Scholar] [CrossRef]
- Rosenqvist, A.; Shimada, M.; Watanabe, M.; Tadono, T.; Yamauchi, K. Implementation of systematic data observation strategies for ALOS PALSAR, PRISM andAVNIR-2. In Proceedings of the 2004 IEEE International Geoscience and Remote Sensing Symposium, Anchorage, AK, USA, 20–24 September 2004. [Google Scholar]
- Paillou, P.; Lopez, S.; Farr, T.; Rosenqvist, A. Mapping subsurface geology in Sahara using L-Band SAR: First results from the ALOS/PALSAR imaging Radar. IEEE J. Sel. Top. Appl. Earth Obs. Remote Sens. 2010, 3, 632–636. [Google Scholar] [CrossRef]
- Abrams, M.; Tsu, H.; Hulley, G.; Iwao, K.; Pieri, D.; Cudahy, T.; Kargel, J. The Advanced Spaceborne Thermal Emission and Reflection Radiometer (ASTER) after Fifteen Years: Review of Global Products. Int. J. Appl. Earth Obs. Geoinf. 2015, 38, 292–301. [Google Scholar] [CrossRef]
- Paek, S.W.; Balasubramanian, S.; Kim, S.; de Weck, O. Small-Satellite Synthetic Aperture Radar for Continuous Global Biospheric Monitoring: A Review. Remote Sens. 2020, 12, 2546. [Google Scholar] [CrossRef]
- Abdelsalam, M.G.; Robinson, C.; El-Baz, F.; Stern, R. Application of orbital imaging radar for geologic studies in arid regions: The Saharan Testimony. Photogramm. Eng. Remote Sens. 2000, 66, 717–726. [Google Scholar]
- Kusky, T.M.; Ramadan, T.M. Structural controls on Neoproterozoic mineralization in the South Eastern Desert, Egypt: An integrated field, Landsat TM, and SIR-C/X SAR approach. J. Afr. Earth Sci. 2002, 35, 107–121. [Google Scholar] [CrossRef]
- Pour, A.B.; Hashim, M.; Makoundi, C.; Zaw, K. Structural Mapping of the Bentong-Raub Suture Zone Using PALSAR Remote Sensing Data, Peninsular Malaysia: Implications for Sedimenthosted/Orogenic Gold Mineral Systems Exploration. Resour. Geol. 2016, 66, 368–385. [Google Scholar] [CrossRef]
- Pour, A.B.; Park, T.S.; Park, Y.; Hong, J.K.; Zoheir, B.; Pradhan, B.; Ayoobi, I.; Hashim, M. Application of multi-sensor satellite data for exploration of Zn-Pb sulfide mineralization in the Franklinian Basin, North Greenland. Remote Sens. 2018, 10, 1186. [Google Scholar] [CrossRef] [Green Version]
- Pour, B.A.; Hashim, M. Structural mapping using PALSAR data in the Central Gold Belt, Peninsular Malaysia. Ore Geol. Rev. 2015, 64, 13–22. [Google Scholar] [CrossRef] [Green Version]
- Hunt, G.R. Spectral Signatures of Particulate Minerals in the Visible and Near Infrared. Geophysics 1997, 42, 501–513. [Google Scholar] [CrossRef] [Green Version]
- Clark, R.N.; King, T.V.V.; Klejwa, M.; Swayze, G.A.; Vergo, N. High spectral resolution reflectance spectroscopy of minerals. J. Geophys. Res. 1990, 95, 12653–12680. [Google Scholar] [CrossRef] [Green Version]
- El Ramly, M.F.; Hussein, A.A. The Alkaline Ring Complex of Egypt; Paper No. 63; Egypt Geological Survey: Cairo, Egypt, 1983. [Google Scholar]
- Sadek, M.F.; Tolba, M.I.; Yousef, M.M.; Abdel Gawad, G.M.; Salem, S.M.; Atia, S.A. Geology of Wadi Kreiga-Gabal Korbiai Area, South Eastern Desert, Egypt; Report of Expedition 9/95; Egypt Geological Survey: Cairo, Egypt, 1996. [Google Scholar]
- Tolba, M.I. Geological and Petrological Studies on the Basement Complex in the Area around Bir Madi, South Eastern Desert, Egypt. Ph.D. Thesis, Ain Shams University, Cairo, Egypt, 2000; p. 247. [Google Scholar]
- Egyptian Geological Survey and Mining Authority (EGSMA). Geological Map of Marsa Shaab Quadrangle, Egypt; Scale.1: 250,000; Egyptian Geological Survey and Mining Authority (EGSMA): Cairo, Egypt, 2002. [Google Scholar]
- Stern, R.J.; Kroner, A.; Manton, W.I.; Reischmann, T.; Mansour, M.; Hussein, I.M. Geochronology of the Late Precambrian Hamisana shear zone, Red Sea Hills, Sudan and Egypt. J. Geol. Soc. Lond. 1989, 146, 1017–1029. [Google Scholar] [CrossRef] [Green Version]
- Miller, M.M.; Dixon, T.H. Late Proterozoic evolution of the northern part of the Hamisana zone, northeast Sudan: Constraints on Pan-African accretionary tectonics. J. Geol. Soc. Lond. 1992, 149, 743–750. [Google Scholar] [CrossRef]
- Abdel-Karim, A.M.; Soliman, M.M.; El-Kazzaz, Y.A.; Mazhar, A.A.; Abdel-Gawad, G.M. Geological and geochemical characteristics of the mafic–ultramafic rocks of Gabal Gerf Area, Southeastern Desert of Egypt. Ann. Geol. Surv. Egypt 2001, 24, 193–218. [Google Scholar]
- Gahlan, H.A. Petrological Characteristics of the Mantle Section in the Proterozoic Ophiolites from the Pan-African Belt. Ph.D. Thesis, Kanazawa University, Kanazawa, Japan, 2006; p. 227. [Google Scholar]
- De Wall, H.; Greiling, R.O.; Sadek, M.F. Post-collisional shortening in the late Pan-African Hamisana high strain zone, SE Egypt: Field and magnetic fabric evidence. Precambrian Res. 2001, 107, 179–194. [Google Scholar] [CrossRef]
- Ali-Bik, M.W.; Sadek, M.F.; Ghabria, L.D.S. Late Neoproterozoic metamorphic assemblages along the Pan-African Hamisana Shear Zone, southeastern Egypt: Metamorphism, geochemistry and petrogenesis. J. Afr. Earth Sci. 2014, 99, 24–38. [Google Scholar] [CrossRef]
- Bennet, J.D.; Mosley, P.N. Tiered-tectonics and evolution, Eastern Desert and Sinai, Egypt. In Proceedings of the 14th Colloquium on African Geology, Berlin, Germany, 18 August 1987; pp. 79–82. [Google Scholar]
- Greiling, R.O.; Abdeen, M.M.; Dardir, A.A.; El Akhal, H.; El Ramly, M.F.; Kamal, G.E.D.; Sadek, M.F. A structural synthesis of the Proterozoic Arabian-Nubian Shield in Egypt. Geol. Rundsch. 1994, 83, 484–501. [Google Scholar] [CrossRef]
- Zimmer, M.; Kröner, A.; Jochum, K.P.; Reischmann, T.; Todt, W. The Gabal Gerf complex: A Precambrian N-MORB ophiolite in the Nubian Shield, NE Africa. Chem. Geol. 1995, 123, 29–51. [Google Scholar] [CrossRef]
- Abdel-Karim, A.M.; Ahmed, Z. Possible origin of the ophiolites of Eastern Desert, Egypt, from geochemical perspectives. Arab. J. Sci. Eng. 2010, 35, 115–143. [Google Scholar]
- Sadek, M.F. Geology and spectral characterization of the basement rocks at Gabal Gerf area, Southeastern Egypt, Egypt. J. Remote Sens. Space Sci. 2005, 8, 109–128. [Google Scholar]
- Sadek, M.F.; Ali-Bik, M.W.; Hassan, S.M. Late Neoproterozoic basement rocks of Kadabora-Suwayqat area, Central Eastern Desert, Egypt: Geochemical and remote sensing characterization. Arab. J. Geosci. 2015, 8, 10459–10479. [Google Scholar] [CrossRef]
- Hassan, S.; Sadek, M. Geological mapping and spectral based classification of basement rocks using remote sensing data analysis: The Korbiai-Gerf nappe complex, South Eastern Desert. Egypt. J. Asian Earth Sci. 2017, 134, 404–418. [Google Scholar] [CrossRef]
- Kröner, A.; Todt, W.; Hussein, I.M.; Mansour, M.; Rashwan, A.A. Dating of late Proterozoic ophiolites in Egypt and the Sudan using the single grain zircon evaporation technique. Precambrian Res. 1992, 59, 15–32. [Google Scholar] [CrossRef]
- Ali, K.A.; Azer, M.K.; Gahlan, H.A.; Wilde, S.A.; Samuel, M.D.; Stern, R.J. Age constraints on the formation and emplacement of Neoproterozoic ophiolites along the Allaqi–Heiani Suture, South Eastern Desert of Egypt. Gondwana Res. 2010, 18, 583–595. [Google Scholar] [CrossRef]
- Van der Meer, F.; Van der Werff, H.M.A.; Van Ruitenbeek, F.J.A. Potential of ESA’s Sentinel-2 for geological applications. Remote Sens. Environ. 2014, 148, 124–133. [Google Scholar] [CrossRef]
- Attema, E.; Bargellini, P.; Edwards, P.; Levrini, G.; Lokas, S.; Moeller, L.; Rosich-Tell, B.; Secchi, P.; Torres, R.; Davidson, M. Sentinel-1: The Radar Mission for GMES Operational Land and Sea Services. ESA Bull. 2007, 131, 10–17. [Google Scholar]
- Balzter, H.; Cole, B.; Thiel, C.; Schmullius, C. Mapping CORINE Land Cover from Sentinel-1A SAR and SRTM Digital Elevation Model Data using Random Forests. Remote Sens. 2015, 7, 14876–14898. [Google Scholar] [CrossRef] [Green Version]
- Igarashi, T. ALOS Mission requirement and sensor specification. Adv. Space Res. 2001, 28, 127–131. [Google Scholar] [CrossRef]
- Earth Remote Sensing Data Analysis Center (ERSDAC). PALSAR User’s Guide, 1st ed.; ERSDAC, Technical Department II, PALSAR Data Service Section: Japan, 2019; Available online: http://www.eorc.jaxa.jp/ALOS/en/doc/alos_userhb_en.pdf (accessed on 3 September 2022).
- Sheng, Y.; Xia, Z. A comprehensive evaluation of filters for radar speckle suppression. In Proceedings of the 1996 International Geoscience and Remote Sensing Symposium (IGARSS ’96), Lincoln, NE, USA, 31 May 1996. [Google Scholar]
- Ge, W.; Cheng, Q.; Tang, Y.; Jing, L.; Gao, C. Lithological classification using sentinel-2A data in the Shibanjing ophiolite complex in Inner Mongolia, China. Remote Sens. 2018, 10, 638. [Google Scholar] [CrossRef] [Green Version]
- Khan, S.D.; Mahmood, K.; Casey, J.F. Mapping of Muslim Bagh ophiolite complex (Pakistan) using new remote sensing, and field data. J. Asian Earth Sci. 2007, 30, 333–343. [Google Scholar] [CrossRef]
- Pournamdari, M.; Hashim, M.; Pour, A.B. Application of ASTER and Landsat TM Data for Geological Mapping of Esfandagheh Ophiolite Complex, Southern Iran. Resour. Geol. 2014, 64, 233–246. [Google Scholar] [CrossRef]
- Green, A.A.; Berman, M.; Switzer, P.; Craig, M.D. A transformation for ordering multispectral data in terms of image quality with implications for noise removal. IEEE Trans. Geosci. Remote Sens. 1988, 26, 65–74. [Google Scholar] [CrossRef] [Green Version]
- Gupta, R.P.; Tiwari, R.K.; Saini, V.; Srivastava, N.A. Simplified approach for interpreting principal component images. Adv. Remote Sens. 2013, 2, 111–119. [Google Scholar] [CrossRef] [Green Version]
- Ninomiya, Y.; Fu, B.; Cudhy, T.J. Detecting lithology with Advanced Spaceborne Thermal Emission and Refection Radiometer (ASTER) multispectral thermal infrared “radiance-at-sensor” data. Remote Sens. Environ. 2005, 99, 127–135. [Google Scholar] [CrossRef]
- Ding, C.; Liu, X.; Liu, W.; Liu, M.; Li, Y. Mafic-ultramafic and quartz-rich indices deduced from ASTER thermal infrared data using a linear approximation to the Planck function. Ore Geol. Rev. 2014, 60, 161–173. [Google Scholar] [CrossRef]
- Crósta, A.P.; Souza Filho, C.R.; Azevedo, F.; Brodie, C. Targeting key alteration minerals in epithermal deposits in Patagonia, Argentina, using ASTER imagery and principal component analysis. Int. J. Remote Sens. 2003, 24, 4233–4240. [Google Scholar] [CrossRef]
- Ninomiya, Y. A Stabilized Vegetation Index and Several Mineralogic Indices Defined for ASTER VNIR and SWIR Data. In Proceedings of the IEEE 2003 International Geosciences and Remote Sensing Symposium (IGARSS ’03), Toulouse, France, 21–25 July 2003; pp. 1552–1554. [Google Scholar]
- Harsanyi, J.C.; Farrand, W.; Chang, C.I. Detection of subpixel spectral signatures in hyperspectral image sequences. In Proceedings of the American Society for Photogrammetry and Remote Sensing, Phoenix, AZ, USA, 25–27 October 1994; pp. 236–247. [Google Scholar]
- Eldosouky, A.M.; Pour, A.; Hamed, A.; Taha, A.; Gamal, M.; Mahmoud, A.; Pham, L. Utilization of Landsat-8 Imagery and Aeromagnetic Data for Deciphering Alteration Zones and Structures: Implications for Mineral Exploration in the Southeastern Desert of Egypt. FSRT J. 2021, 2, 19–28. [Google Scholar] [CrossRef]
- El Naggar, A.A.; Ahmad, A.A.; Salama, F.M.; Moselhy, N.A.; Ali, A.B.; Awad, S.M.; Oweiss, K.A. Geological and Geochemical Exploration at North Gabal Gerf Area, South Eastern Desert, Egypt; Expedition No. 12/2001; Egypt Geological Survey: Cairo, Egypt, 2002; pp. 1–107. [Google Scholar]
- El Shimi, K.; Hassan, A.A.; Ali, M.; El Miligy, A.B. Report on Reconnaissance Survey of Ancient Gold Occurrences at Southeastern Corner of Eastern Desert, Egypt; Expedition No. G6/2010; Egypt Geological Survey: Cairo, Egypt, 2012; pp. 1–40. [Google Scholar]
- Mars, J.C.; Rowan, L.C. Mapping Phyllic and Argillic-Altered Rocks in Southeastern Afghanistan Using Advanced Spaceborne Thermal Emission and Reflection Radiometer (ASTER) Data; Open-File Report 2007-1006; USGS: Denver, CO, USA, 2007. [Google Scholar]
- Bannari, A.; El-Battay, A.; Saquaque, A.; Miri, A. PALSAR-FBS L-HH Mode and Landsat-TM Data Fusion for Geological Mapping. Adv. Remote Sens. 2016, 5, 246–268. [Google Scholar] [CrossRef] [Green Version]
- Lang, F.; Yang, J.; Li, D. Adaptive-window polarimetric SAR image speckle filtering based on a homogeneity measurement. IEEE Trans. Geosci. Remote Sens. 2015, 53, 5435–5446. [Google Scholar] [CrossRef]
- Klemm, D.; Klemm, R.; Murr, A. Gold of the Pharaohs-6000 years of gold mining in Egypt and Nubian. J. Afr. Earth Sci. 2001, 33, 643–659. [Google Scholar] [CrossRef]
- McClay, K.; Bonora, M. Analog models of restraining stepovers in strike-slip fault systems. Am. Assoc. Petrol. Geol. 2001, 85, 233–260. [Google Scholar]
- Sedki, T. Placer Gold Deposits in Madari Gold Mine, Southern Eastern Desert, Egypt: Orientation, Source and Distribution. World Acad. Sci. Eng. Technol. Int. J. Geol. Environ. Eng. 2021, 15, 18–24. [Google Scholar]
- Said, A.; Zaghlol, K.; El Shimi, K. Gold bearing-quartz veins in island arc metavolcanics, case study: Wadi mahasin, west Qusier, Central Eastern Desert, Egypt. Ann. Geol. Surv. Egypt 2015, 32, 177–188. [Google Scholar]
- Hassan, O.A.; El-Manakhly, M.M. Gold deposits in the southern Eastern Desert, Egypt. In A Commodity Package; Egyptian Geological Survey and Mining Authority: Cairo, Egypt, 1986. [Google Scholar]
- Zoheir, B.A.; Emam, A. Field and ASTER imagery data for the setting of gold mineralization in Western Allaqi–Heiani belt, Egypt: A case study from the Haimur deposit. J. Afr. Earth Sci. 2014, 99, 150–164. [Google Scholar] [CrossRef]
- Abu El-Leil, A.; Soliman, N.M.A.; Bekiet, M.H.; Elhebiry, M.A. Enhancing multispectral remote sensing data interpretation for historical gold mines in Egypt: A case study from Madari gold mine. Arab. J. Geosci. 2019, 12, 3. [Google Scholar] [CrossRef]
- Oweiss, K.A.; Shabaan, G.M.; El-Shamy, M.H.; Abdel-Razik, K.A.; Khattab, M.M. Report on Detailed Geological and Geochemical Exploration at Gabal Gerf Area, South Eastern Desert, Egypt; Internal Report No. 47/96; Egypt Geological Survey: Cairo, Egypt, 1996. [Google Scholar]
- Malczewski, J. GIS-Based Multicriteria Decision Analysis: A Survey of the Literature. Int. J. Geogr. Inf. Sci. 2006, 20, 703–726. [Google Scholar] [CrossRef]
- Shebl, A.; Csamer, A. Stacked vector multi-source lithologic classification utilizing Machine Learning Algorithms: Data potentiality and dimensionality monitoring. Remote Sens. Appl. Soc. Environ. 2021, 24, 100643. [Google Scholar] [CrossRef]
- Shebl, A.; Kusky, T.; Csamer, A. Advanced land imager superiority in lithological classification utilizing machine learning algorithms. Arab. J. Geosci. 2022, 15, 923. [Google Scholar] [CrossRef]
- Shebl, A.; Csamer, A. Reappraisal of DEMs, Radar and optical datasets in lineaments extraction with emphasis on the spatial context. Remote Sens. Appl. Soc. Environ. 2021, 24, 100617. [Google Scholar] [CrossRef]
- Mohamed, M.T.A.; Al-Naimi, L.S.; Mgbeojedo, T.I.; Agoha, C.C. Geological mapping and mineral prospectivity using remote sensing and GIS in parts of Hamissana, Northeast Sudan. J. Pet. Explor. Prod. Technol. 2021, 11, 1123–1138. [Google Scholar] [CrossRef]
- Taha, M.A.M.; Xi, Y.; He, Q.; Hu, A.; Wang, S.; Liu, X. Investigating the Capabilities of Various Multispectral Remote Sensors Data to Map Mineral Prospectivity Based on Random Forest Predictive Model: A Case Study for Gold Deposits in Hamissana Area, NE Sudan. Minerals 2022, 13, 49. [Google Scholar] [CrossRef]
- Abdelkareem, M.; Al-Arifi, N. Synergy of Remote Sensing Data for Exploring Hydrothermal Mineral Resources Using GIS-Based Fuzzy Logic Approach. Remote Sens. 2021, 13, 4492. [Google Scholar] [CrossRef]
- Abd El-Wahed, M.A.; Attia, M. Structural and tectonic evolution of suture-related belts and post-accretionary systems in the Arabian-Nubian Shield. Geol. J. 2023. [Google Scholar] [CrossRef]


| Landsat-8 OLI/TIRS | ASTER | Sentinel-2B | ||||||
|---|---|---|---|---|---|---|---|---|
| Band | Central Wavelength (µm) | Spatial Resolution (m) | Band | Central Wavelength (µm) | Spatial Resolution (m) | Band | Central Wavelength (µm) | Spatial Resolution (m) |
| 1 | 0.4430 | 30 | 1 | 0.5560 | 15 | 1 | 0.4430 | 60 |
| 2 | 0.4826 | 2 | 0.6610 | 2 | 0.4900 | 10 | ||
| 3 | 0.5613 | 3N | 0.8070 | 3 | 0.5600 | |||
| 4 | 0.6546 | 3B | 0.8070 | 30 | 4 | 0.6650 | ||
| 5 | 0.8646 | 4 | 1.6560 | 5 | 0.7050 | 20 | ||
| 6 | 1.6090 | 5 | 2.1670 | 6 | 0.7400 | |||
| 7 | 2.2010 | 6 | 2.2090 | 7 | 0.7830 | |||
| 8 | 0.5917 | 15 | 7 | 2.2620 | 8 | 0.8420 | 10 | |
| 9 | 1.3730 | 30 | 8 | 2.3360 | 8A | 0.8650 | 20 | |
| 10 | 10.9000 | 100 | 9 | 2.4000 | 90 | 9 | 0.9450 | 60 |
| 11 | 12.000 | 10 | 8.2910 | 10 | 1.3750 | |||
| - | - | - | 11 | 8.6340 | 11 | 1.6100 | 20 | |
| - | - | - | 12 | 9.0750 | 12 | 2.1900 | ||
| - | - | - | 13 | 10.6570 | - | - | - | |
| - | - | - | 14 | 11.3180 | - | - | - | |
| Ground Truth | ||||||||||||||||
|---|---|---|---|---|---|---|---|---|---|---|---|---|---|---|---|---|
| Class | gn | omv | omg | sp | mpy | amv | sgr | mgr | mg | yg | lgb | wd | Total | PA | UA | |
| Classified classes | gn | 209 | 0 | 1 | 0 | 0 | 4 | 7 | 6 | 0 | 0 | 9 | 0 | 236 | 98.58 | 88.56 |
| omv | 0 | 704 | 18 | 0 | 0 | 22 | 0 | 0 | 0 | 0 | 0 | 0 | 744 | 99.29 | 94.62 | |
| omg | 0 | 5 | 325 | 0 | 0 | 105 | 0 | 0 | 2 | 0 | 0 | 0 | 437 | 90.78 | 74.37 | |
| sp | 0 | 0 | 0 | 982 | 0 | 12 | 0 | 0 | 0 | 0 | 0 | 57 | 1051 | 99.19 | 93.43 | |
| mpy | 2 | 0 | 0 | 0 | 201 | 42 | 11 | 8 | 4 | 0 | 8 | 0 | 276 | 98.53 | 72.83 | |
| amv | 0 | 0 | 0 | 0 | 0 | 773 | 5 | 96 | 8 | 0 | 8 | 105 | 995 | 61.79 | 77.69 | |
| sgr | 0 | 0 | 0 | 0 | 3 | 103 | 920 | 70 | 0 | 0 | 0 | 1 | 1097 | 96.94 | 83.87 | |
| mgr | 1 | 0 | 0 | 0 | 0 | 27 | 1 | 1731 | 0 | 4 | 0 | 9 | 1773 | 87.91 | 97.63 | |
| mg | 0 | 0 | 5 | 0 | 0 | 56 | 0 | 0 | 372 | 0 | 5 | 0 | 438 | 95.63 | 84.93 | |
| yg | 0 | 0 | 0 | 0 | 0 | 0 | 0 | 53 | 0 | 381 | 0 | 0 | 434 | 98.96 | 87.79 | |
| lgb | 0 | 0 | 0 | 8 | 0 | 91 | 5 | 4 | 3 | 0 | 618 | 109 | 838 | 95.37 | 73.75 | |
| wd | 0 | 0 | 9 | 0 | 0 | 16 | 0 | 1 | 0 | 0 | 0 | 1947 | 1973 | 87.39 | 98.68 | |
| Total | 212 | 706 | 358 | 990 | 204 | 1251 | 949 | 1969 | 389 | 385 | 648 | 2228 | 10,292 | |||
| Overall Accuracy = 89.03% (9163/10292 pixels); Kappa Coefficient = 0.88 | ||||||||||||||||
| Mineral | Min. | Max. | Mean | Stdv | Threshold | Confidence (%) | Area (km2) |
|---|---|---|---|---|---|---|---|
| Mineral indices | |||||||
| OHI | 0 | 255 | 104 | 55 | 215 | 95 | 87.1 |
| KLI | 0 | 255 | 125 | 62 | 249 | 95 | 55.8 |
| ALI | 0 | 255 | 130 | 61 | 252 | 95 | 54.8 |
| CLI | 0 | 255 | 118 | 64 | 247 | 95 | 50.9 |
| BR | |||||||
| Landsat-8 (6/7) | 0 | 255 | 147 | 56 | 203 | 92 | 44.8 |
| ASTER (4 + 6/5) | 0 | 255 | 134 | 59 | 252 | 92 | 147.4 |
| CEM | |||||||
| Kaolinite | 0 | 255 | 132 | 51 | 234 | 95 | 76.7 |
| Montmorillonite | 0 | 255 | 93 | 56 | 205 | 95 | 101.7 |
| Illite | 0 | 255 | 129 | 62 | 254 | 95 | 44.1 |
| Talc | 0 | 255 | 130 | 61 | 252 | 95 | 49.7 |
| Epidote | 0 | 255 | 158 | 58 | 216 | 92 | 58.6 |
| Chlorite | 0 | 255 | 134 | 60 | 254 | 95 | 66.9 |
| Calcite | 0 | 255 | 143 | 59 | 202 | 92 | 49.8 |
| Parameters/Data Type | PALSAR | Sentinel-1B |
|---|---|---|
| Count | 533 | 7425 |
| Minimum (km) | 0.03 | 0.28 |
| Maximum (km) | 5.4 | 2.61 |
| Sum (km) | 894.23 | 4402.04 |
| average | 1.68 | 0.59 |
| Standard Deviation | 0.92 | 0.27 |
| D1 | D2 | D3 | D4 | |
|---|---|---|---|---|
| Present study | Missing | ENE-WSW transpression/oblique convergence (Syn-accretionary phase) -Major NNW-striking steeply dipping S1 foliation. -NNE- and NNW-plunging F2 folds. -NNW-SSE thrust-dominated shear zones and thrust segments (W-directed thrusts. | E-W oblique far field compressional regime (post-accretionary phase) -ENE-WSW moderately dipping foliation. -Open ENE-WSW (F3) folds and crenulations overprint the D2 structures. -Formation of S-dipping thrusts. - Formation of NNW-SSE sinistral strike slip faults overprint the early developed NNW-SSE thrust. - Formation of NW-SE dextral strike slip faults | Extensional tectonics and rapid terrane exhumation Brittle deformation brought on by terrane exhumation and cooling after the emplacement of late-orogenic intrusions. -kilometer-scale dextral strike-slip faults strike mainly NW-SE, NNW-SSE, and E-W. |
| Zoheir et al. [9] | N-S shortening/terrane accretion - Penetrative cleavage foliation (S1), - Mineral stretching lineation (L1), - E- and WNW-oriented folds (F1), - Major E-W to WNW-striking thrust faults. | NE-SW transpression/oblique convergence - Regional NW-plunging folds. - Pervasive NW-SE foliation (S2). - NNW- and NNE-oriented thrusts (T2). - Sinistral transpression along the pre-early developed, regional WNW-oriented thrusts. | E-W compressional regime/N-ward tectonic escape - Major N-striking steeply dipping S3 foliation. - NNE- and NNW-plunging F3 folds. - NNW-SSE thrust-dominated shear zones and thrust segments (T3). | Extension and terrane uplift Brittle deformation, mostly associated with terrane exhumation and cooling subsequent to the emplacement of late-orogenic intrusions. - NNE-SSW and NE-SW strike slip faults |
| Zoheir et al. [7] | - Moderately NW-dipping thrusts separate the ophiolitic blocks (top) apart from the underlying island arc rocks. - F1 upright and overturned folds with axial traces parallel to the thrust planes (WNW-ESE). | - S2 fabrics. - Asymmetric small-scale and regional NW-SE F2-folds. - L2 lineation plunges mostly to N. - Related extensional shear fractures are subsidiary and mainly confined to the hinge zones of the F2 folds. - Orientation of the major D2 structures at high angles to the major fold-and-thrust structures of D1 reflects a change in direction of the compressional regime during D2. | - Open F3 folds and crenulations overprint the D2 structures - Formation of NNW-SSE strike slip faults extended parallel or subparallel to the axial planes of F3 folds. - The D3 led to general uplift of the central part of the study area. - The D3 is interpreted as a manifestation of a NE-SW non-coaxial compressional stress regime. | - N-trending S4 and NE-trending faults cut the early developed structures. - The D4 records an episode of E-W compression and transcurrent deformation resulting largely in slip reactivation of the pre-existing NNW-trending shear zones, of which, many are gold-bearing. |
| Zoheir and Klemm [82] | Fold-and-thrust system formation. (Ophiolite emplacement) — Overturned to recumbent folds (F1) commonly verging to S or SE. | NE–SW-compressional regime (Early stage shortening—Right-lateral strike slip faults crosscutting the former fabrics and dislocating the ophiolitic blocks — F2 asymmetric upright folds — Early, penetrative slate foliation (S2) striking roughly NW–SE | E–W-compressional regime (Late stage shortening) — Discrete shear zones, generally NNW-trending, commonly traversing the ophiolitic and island arc rocks — F3 major and minor syncline and anticline structures developed in the ophiolitic and island arc rocks — S3 (NNW–SSE) crenulation cleavage and kinks, coaxial with F3 axial planes. | –WNW–ESE, NNE–SSW and N–S joint/fracture systems traverse the syn- and post-orogenic granites and the pre-existing rocks with no obvious transpression. |
| Abdelsalam et al. [34] | D1a: N-S shortening produced an imbricate fan with the emplacement of the thrust sheets from north to south. D1b: Continuation of the N-S shortening superimposed as co-axial, but non co-planar deformation in the form of E-trending upright folds which deform the earlier S-verging structure | E-W shortening superimposed on non-axial and non-co-planar deformation in the form of N-trending upright folds and NE-trending sinistral strike–strike-slip faults. which deform the earlier E-trending folds into a crescentic dome interference pattern. | - | - |
| Kusky and Ramadan [35] | (750–720 Ma) Collision of Gerf and Gabgaba arc terranes: early stages —W-plunging steeply N-dipping axial planar cleavage — E–W striking, steeply N-dipping axial planar cleavage — East plunging isoclinal folds | (750–720 Ma) Collision of Gerf and Gabgaba terranes. late stages — Regional S-vergent thrusts. imbrication of arc/arc accretionary complex | (650–550 Ma) Shortening related to the collision of East and West Gondwana; tectonic escape toward the oceanic free face to N along WNW striking Najd faults WNW–ESE and NW–SE shear zones and open folds, crenulation cleavage, SC fabrics, sigmoidal foliation patterns | (650–550 Ma) NE-striking strike slip faults –E–W fractures |
| Greiling et al. [52] | Open-tight folds, regional penetrative foliation, metamorphism metamorphic banding, migmatites Island arc andesites and related tufts; generation of an oceanic crust, ophiolitic serpentinites, amphibolites and metagabbro) | Shear fabric, rnylonitic foliation and stretching lineation, regional thrusting and transpression | Regional folds, crenulation and kink bands –E–W fractures | Weak foliation |
| Stern [1] | Rodinia break-up (late stage) 870–690 Ma Seaf loor spreading, arc and back-arc basin formation, and terrane accretion. | Greater Gondwanaland assembly ~700 Ma Continental collision 750–650 Ma | Greater Gondwana break-up ~550 Ma Crustal shortening. and escape tectonics ~640–550 Ma |
| Thematic Layer | Class Ranges | Layer Weight | Influence (%) | Class Rank | Data Source and Technique |
|---|---|---|---|---|---|
| Favorable host lithology | sp/omv/omg/mg | 0.30 | 30 | 5 | L 8 and S2B processed using FCC, BR, PCA, MNF, and MLC |
| amv/mz | 4 | ||||
| ms/sgr/mgr | 3 | ||||
| lgb | 2 | ||||
| gn | 1 | ||||
| Alteration zones map | Argillic (K., Mont., Illite) | 0.20 | 20 | 5 | L 8 and ASTER processed using BR, mineral indices and CEM |
| Propylitic (Epidote, Chlorite) | 4 | ||||
| OH-bearings rocks | 3 | ||||
| Ophio-carbonates (calcite, Talc) | 2 | ||||
| Proximity to mineralized quartz veins (km) | <1 | 0.10 | 10 | 4 | Previous work processed by ArcGIS |
| 1–3 | 3 | ||||
| >3 | 2 | ||||
| Proximity to thrust faults (km) | <1 | 0.10 | 10 | 3 | Processed L 8 and S2B images and fieldwork |
| 1–3 | 2 | ||||
| >3 | 1 | ||||
| Proximity to old gold mines (km) | <10 | 0.09 | 9 | 3 | Previous work processed by ArcGIS |
| 10–20 | 2 | ||||
| >20 | 1 | ||||
| Proximity to favorable contacts (km) | <2 | 0.08 | 8 | 3 | L 8 and S2B processed using FCC, BR, PCA, MNF and MLC |
| 2–10 | 2 | ||||
| >10 | 1 | ||||
| Lineaments density (km/km2) | 1.7–1.9 | 0.07 | 7 | 5 | Produced using the spatial analyst function included in ArcGIS |
| 1.3–1.6 | 4 | ||||
| 0.79–1.2 | 3 | ||||
| 0.4–0.78 | 2 | ||||
| 0–0.39 | 1 | ||||
| Major faults density (km/km2) | 1.14–1.41 | 0.06 | 6 | 5 | Produced using the spatial analyst function included in ArcGIS |
| 0.85–1.13 | 4 | ||||
| 0.57–0.84 | 3 | ||||
| 0.29–0.56 | 2 | ||||
| 0–0.28 | 1 |
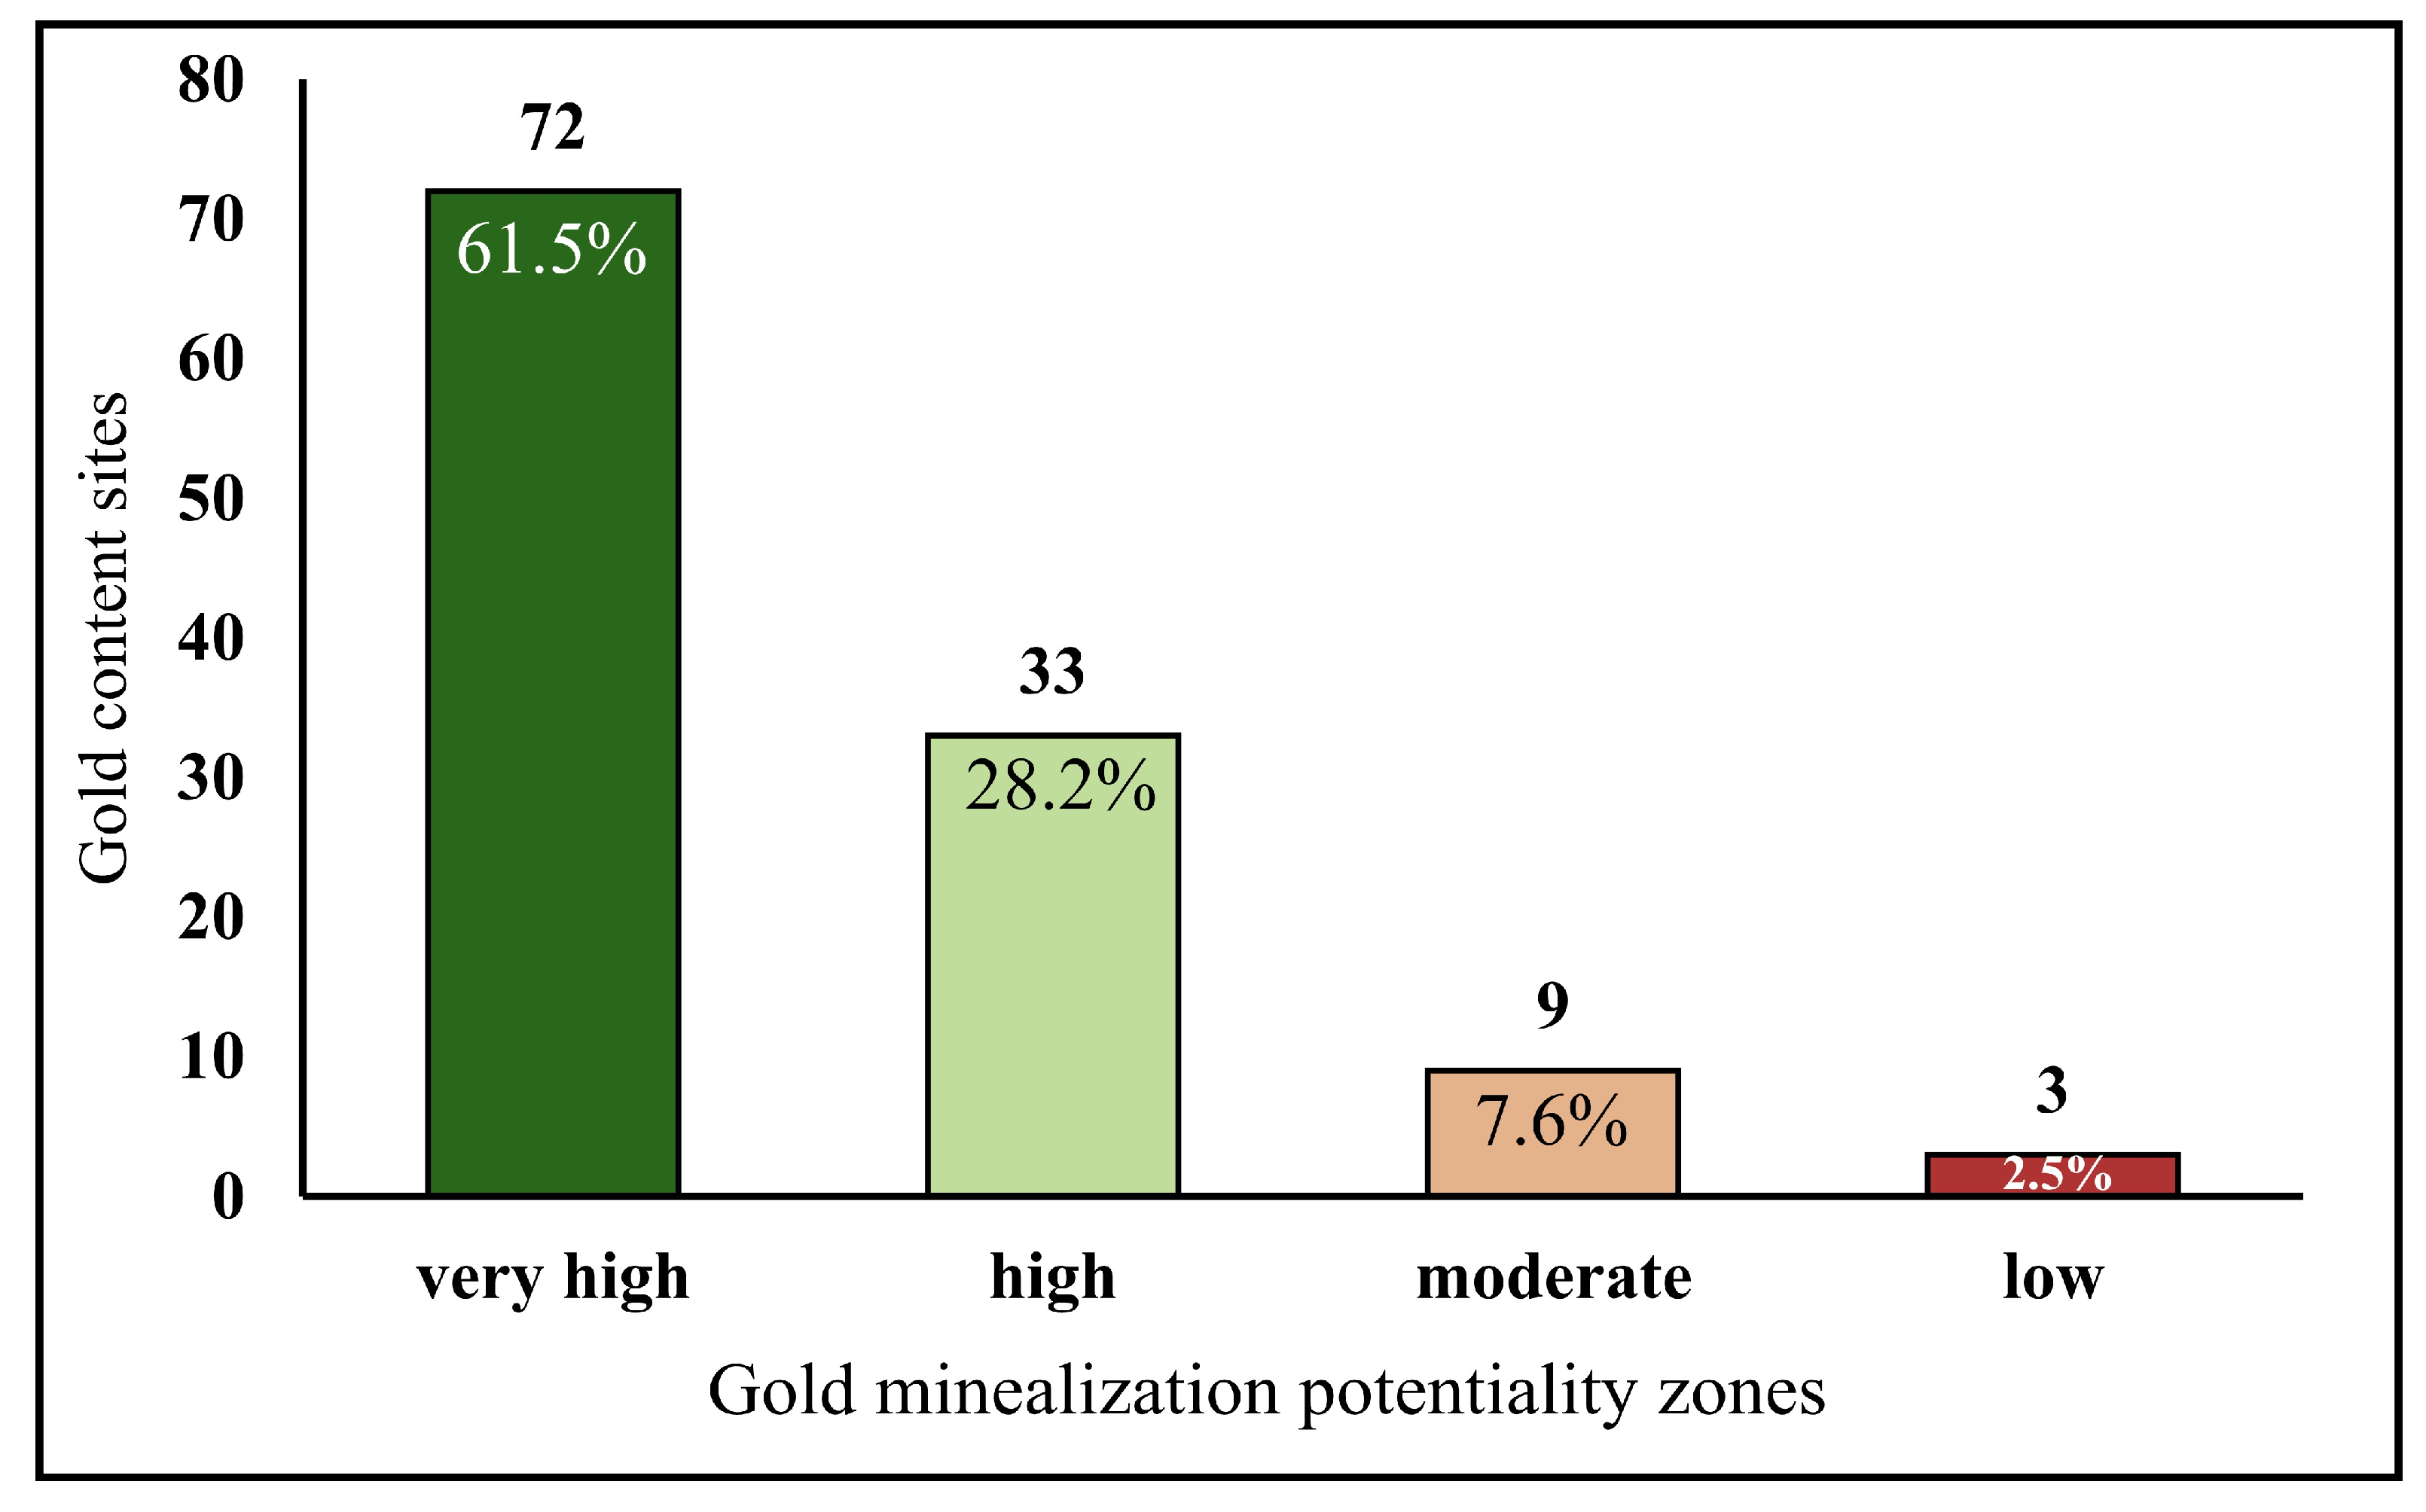
| Zone | Very High | High | Moderate | Low | Total |
|---|---|---|---|---|---|
| Gold content sites | 72 | 33 | 9 | 3 | 117 |
| Percent (%) | 61.5 | 28.2 | 7.6 | 2.5 | 100 |
Disclaimer/Publisher’s Note: The statements, opinions and data contained in all publications are solely those of the individual author(s) and contributor(s) and not of MDPI and/or the editor(s). MDPI and/or the editor(s) disclaim responsibility for any injury to people or property resulting from any ideas, methods, instructions or products referred to in the content. |
© 2023 by the authors. Licensee MDPI, Basel, Switzerland. This article is an open access article distributed under the terms and conditions of the Creative Commons Attribution (CC BY) license (https://creativecommons.org/licenses/by/4.0/).
Share and Cite
Abd El-Wahed, M.; Kamh, S.; Abu Anbar, M.; Zoheir, B.; Hamdy, M.; Abdeldayem, A.; Lebda, E.M.; Attia, M. Multisensor Satellite Data and Field Studies for Unravelling the Structural Evolution and Gold Metallogeny of the Gerf Ophiolitic Nappe, Eastern Desert, Egypt. Remote Sens. 2023, 15, 1974. https://doi.org/10.3390/rs15081974
Abd El-Wahed M, Kamh S, Abu Anbar M, Zoheir B, Hamdy M, Abdeldayem A, Lebda EM, Attia M. Multisensor Satellite Data and Field Studies for Unravelling the Structural Evolution and Gold Metallogeny of the Gerf Ophiolitic Nappe, Eastern Desert, Egypt. Remote Sensing. 2023; 15(8):1974. https://doi.org/10.3390/rs15081974
Chicago/Turabian StyleAbd El-Wahed, Mohamed, Samir Kamh, Mohamed Abu Anbar, Basem Zoheir, Mohamed Hamdy, Abdelaziz Abdeldayem, El Metwally Lebda, and Mohamed Attia. 2023. "Multisensor Satellite Data and Field Studies for Unravelling the Structural Evolution and Gold Metallogeny of the Gerf Ophiolitic Nappe, Eastern Desert, Egypt" Remote Sensing 15, no. 8: 1974. https://doi.org/10.3390/rs15081974