
Integrated Geophysical Approach of Groundwater Potential in Wadi Ranyah, Saudi Arabia, Using Gravity, Electrical Resistivity, and Remote-Sensing Techniques


Abstract
:1. Introduction
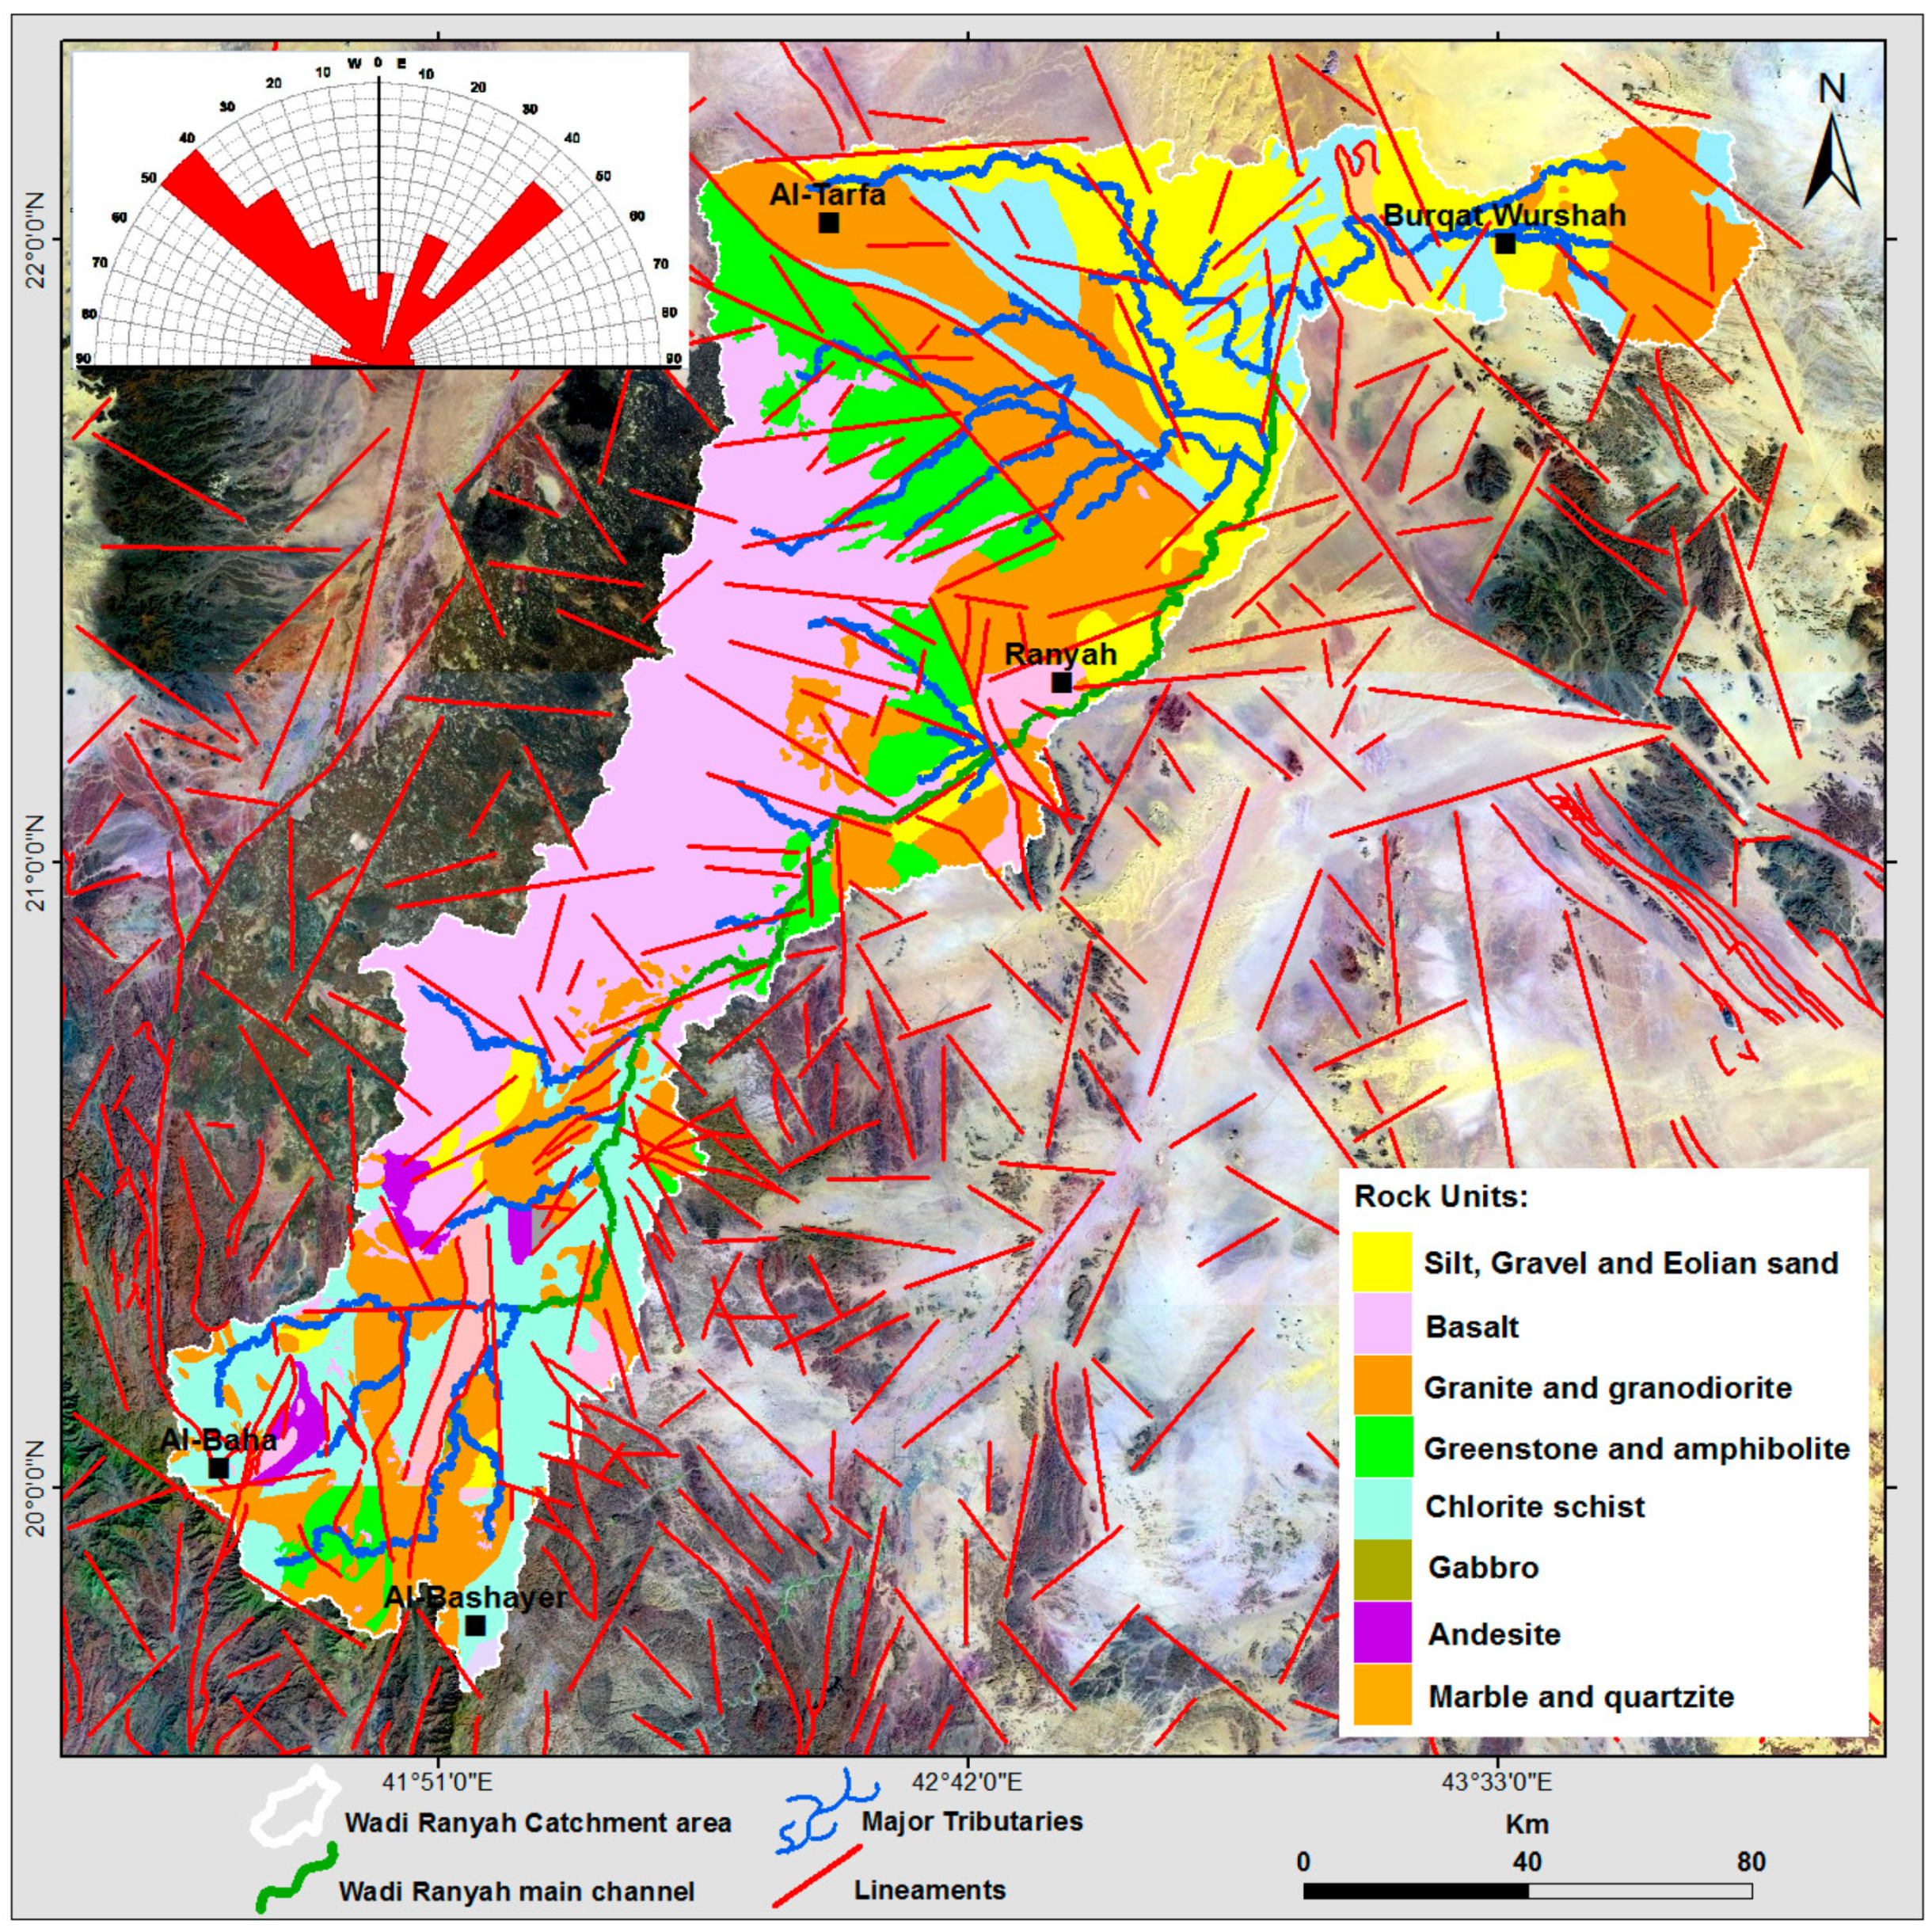
2. Geology
3. Data and Methods
3.1. GRACE Mascon Data
3.2. GLDAS Data
3.3. TRMM Data
3.4. VES and TDEM Data
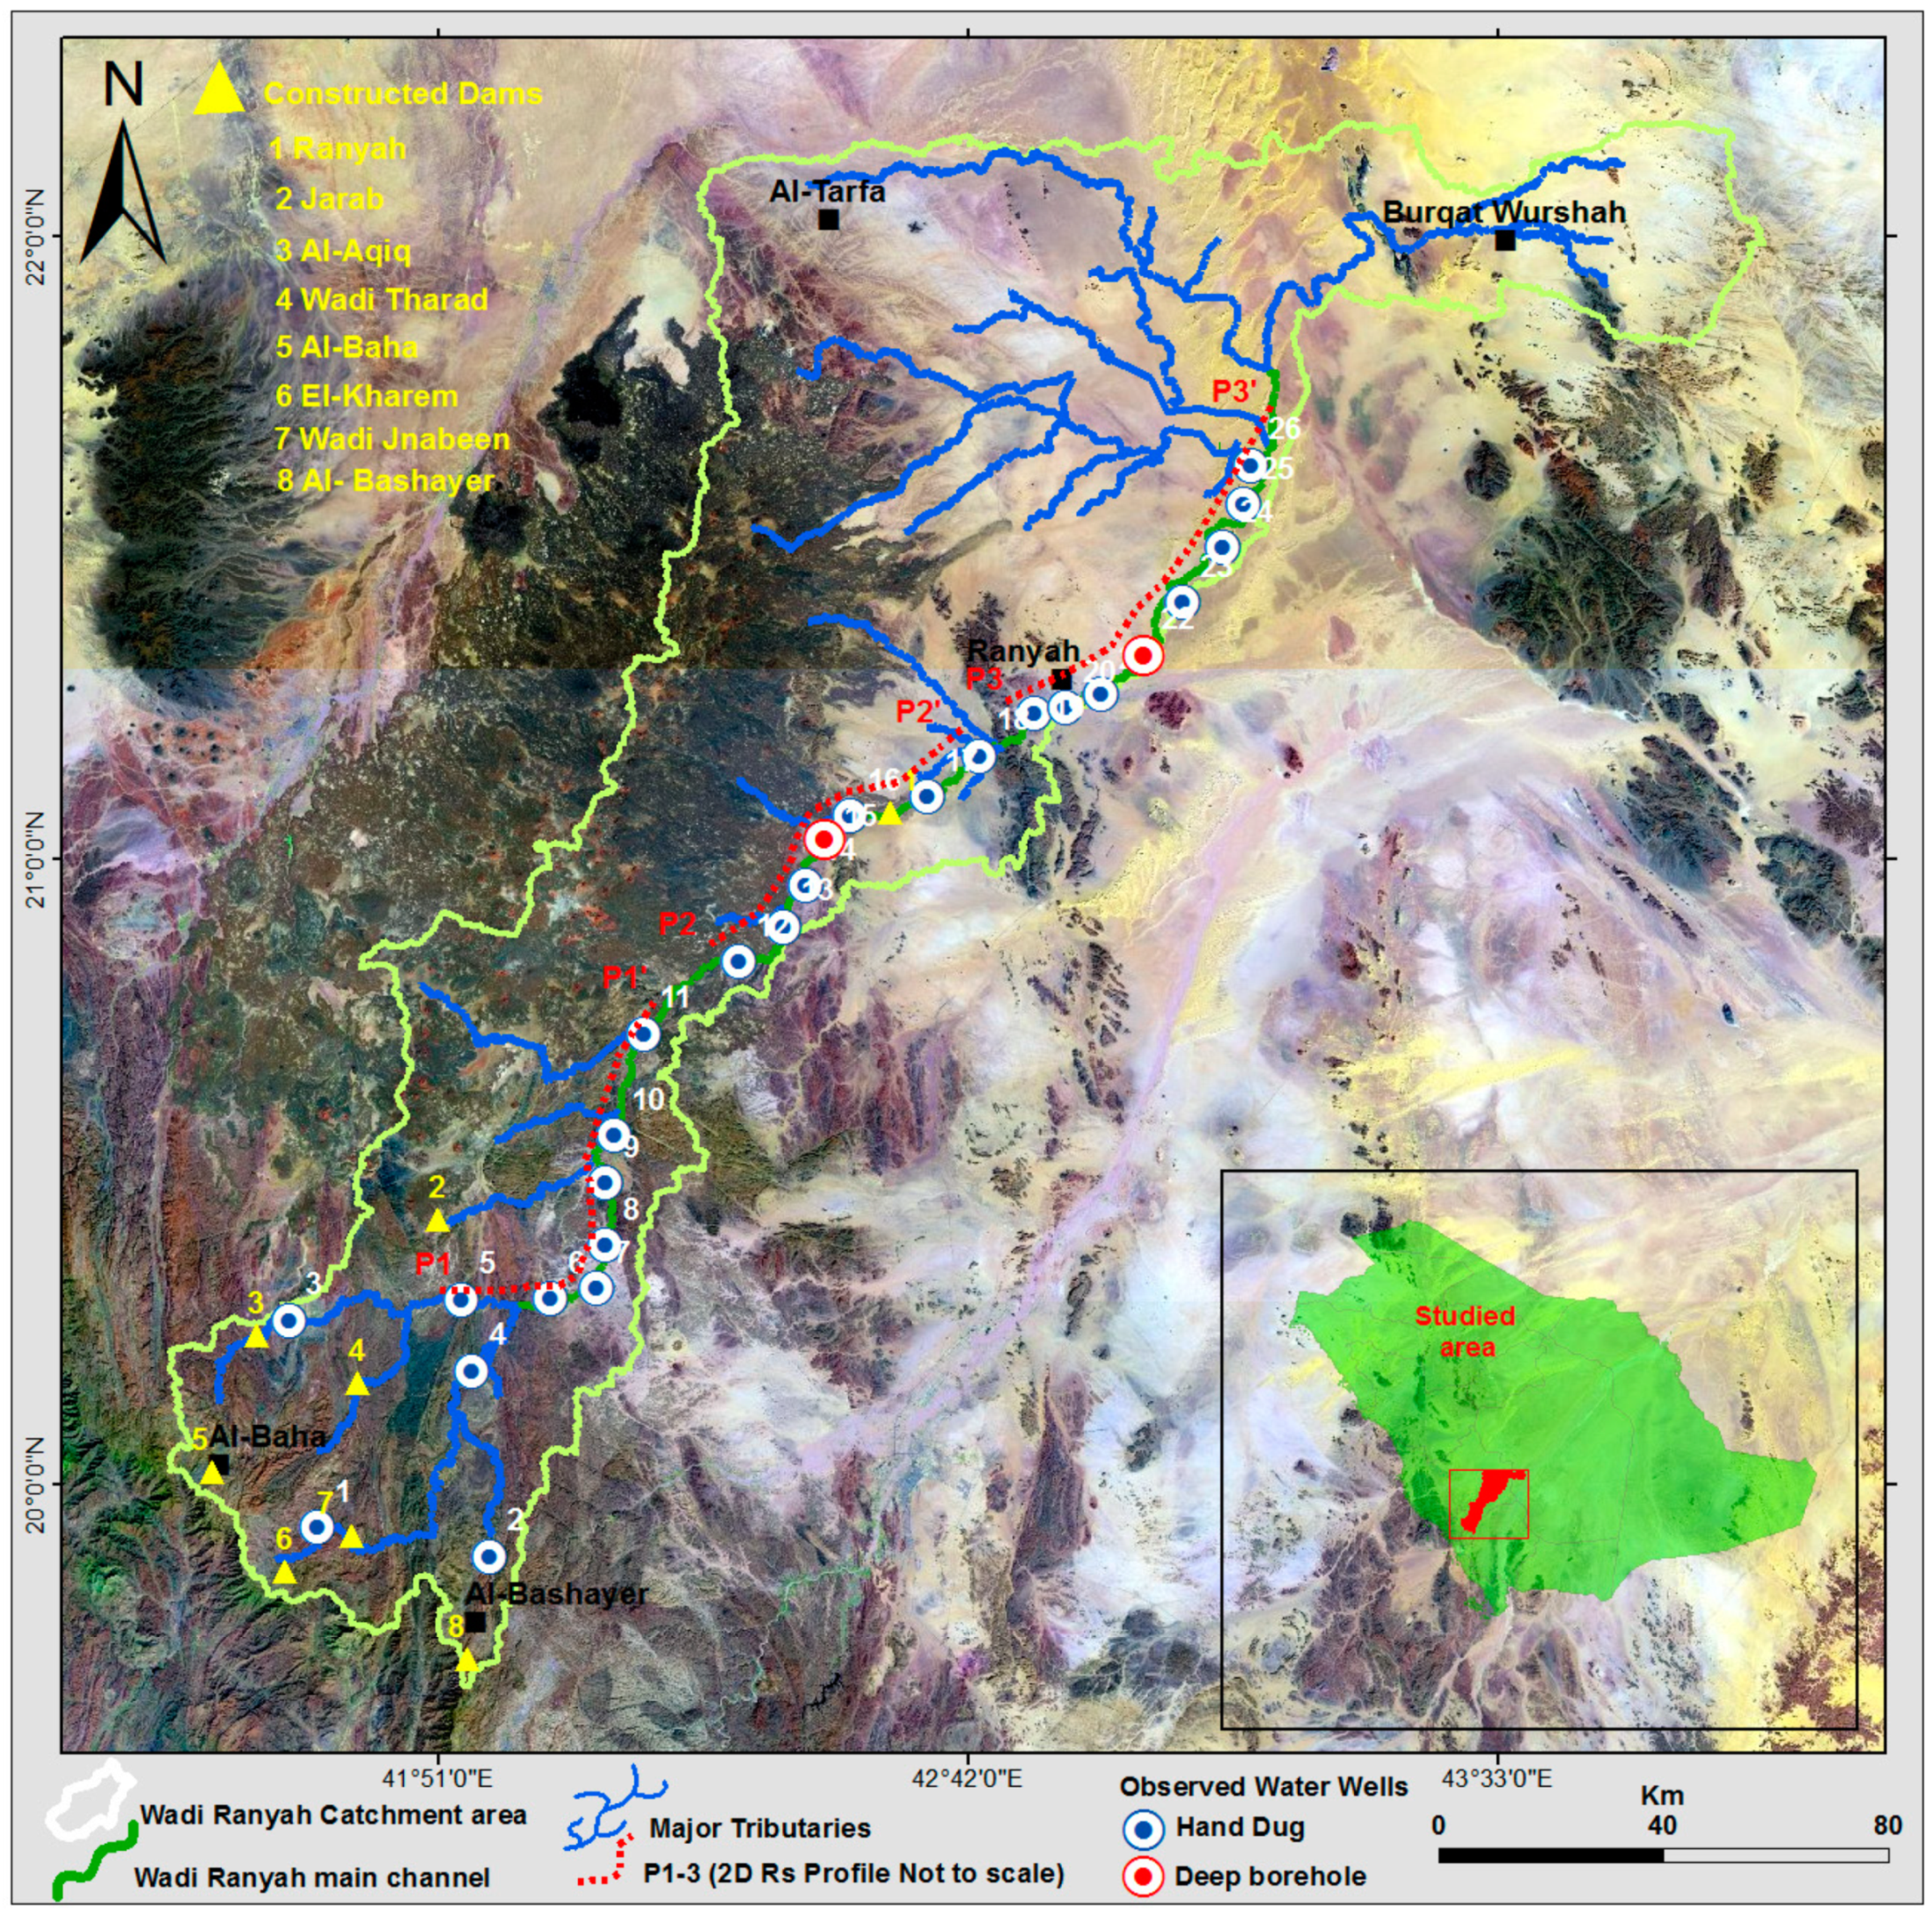
3.5. Field Measurements
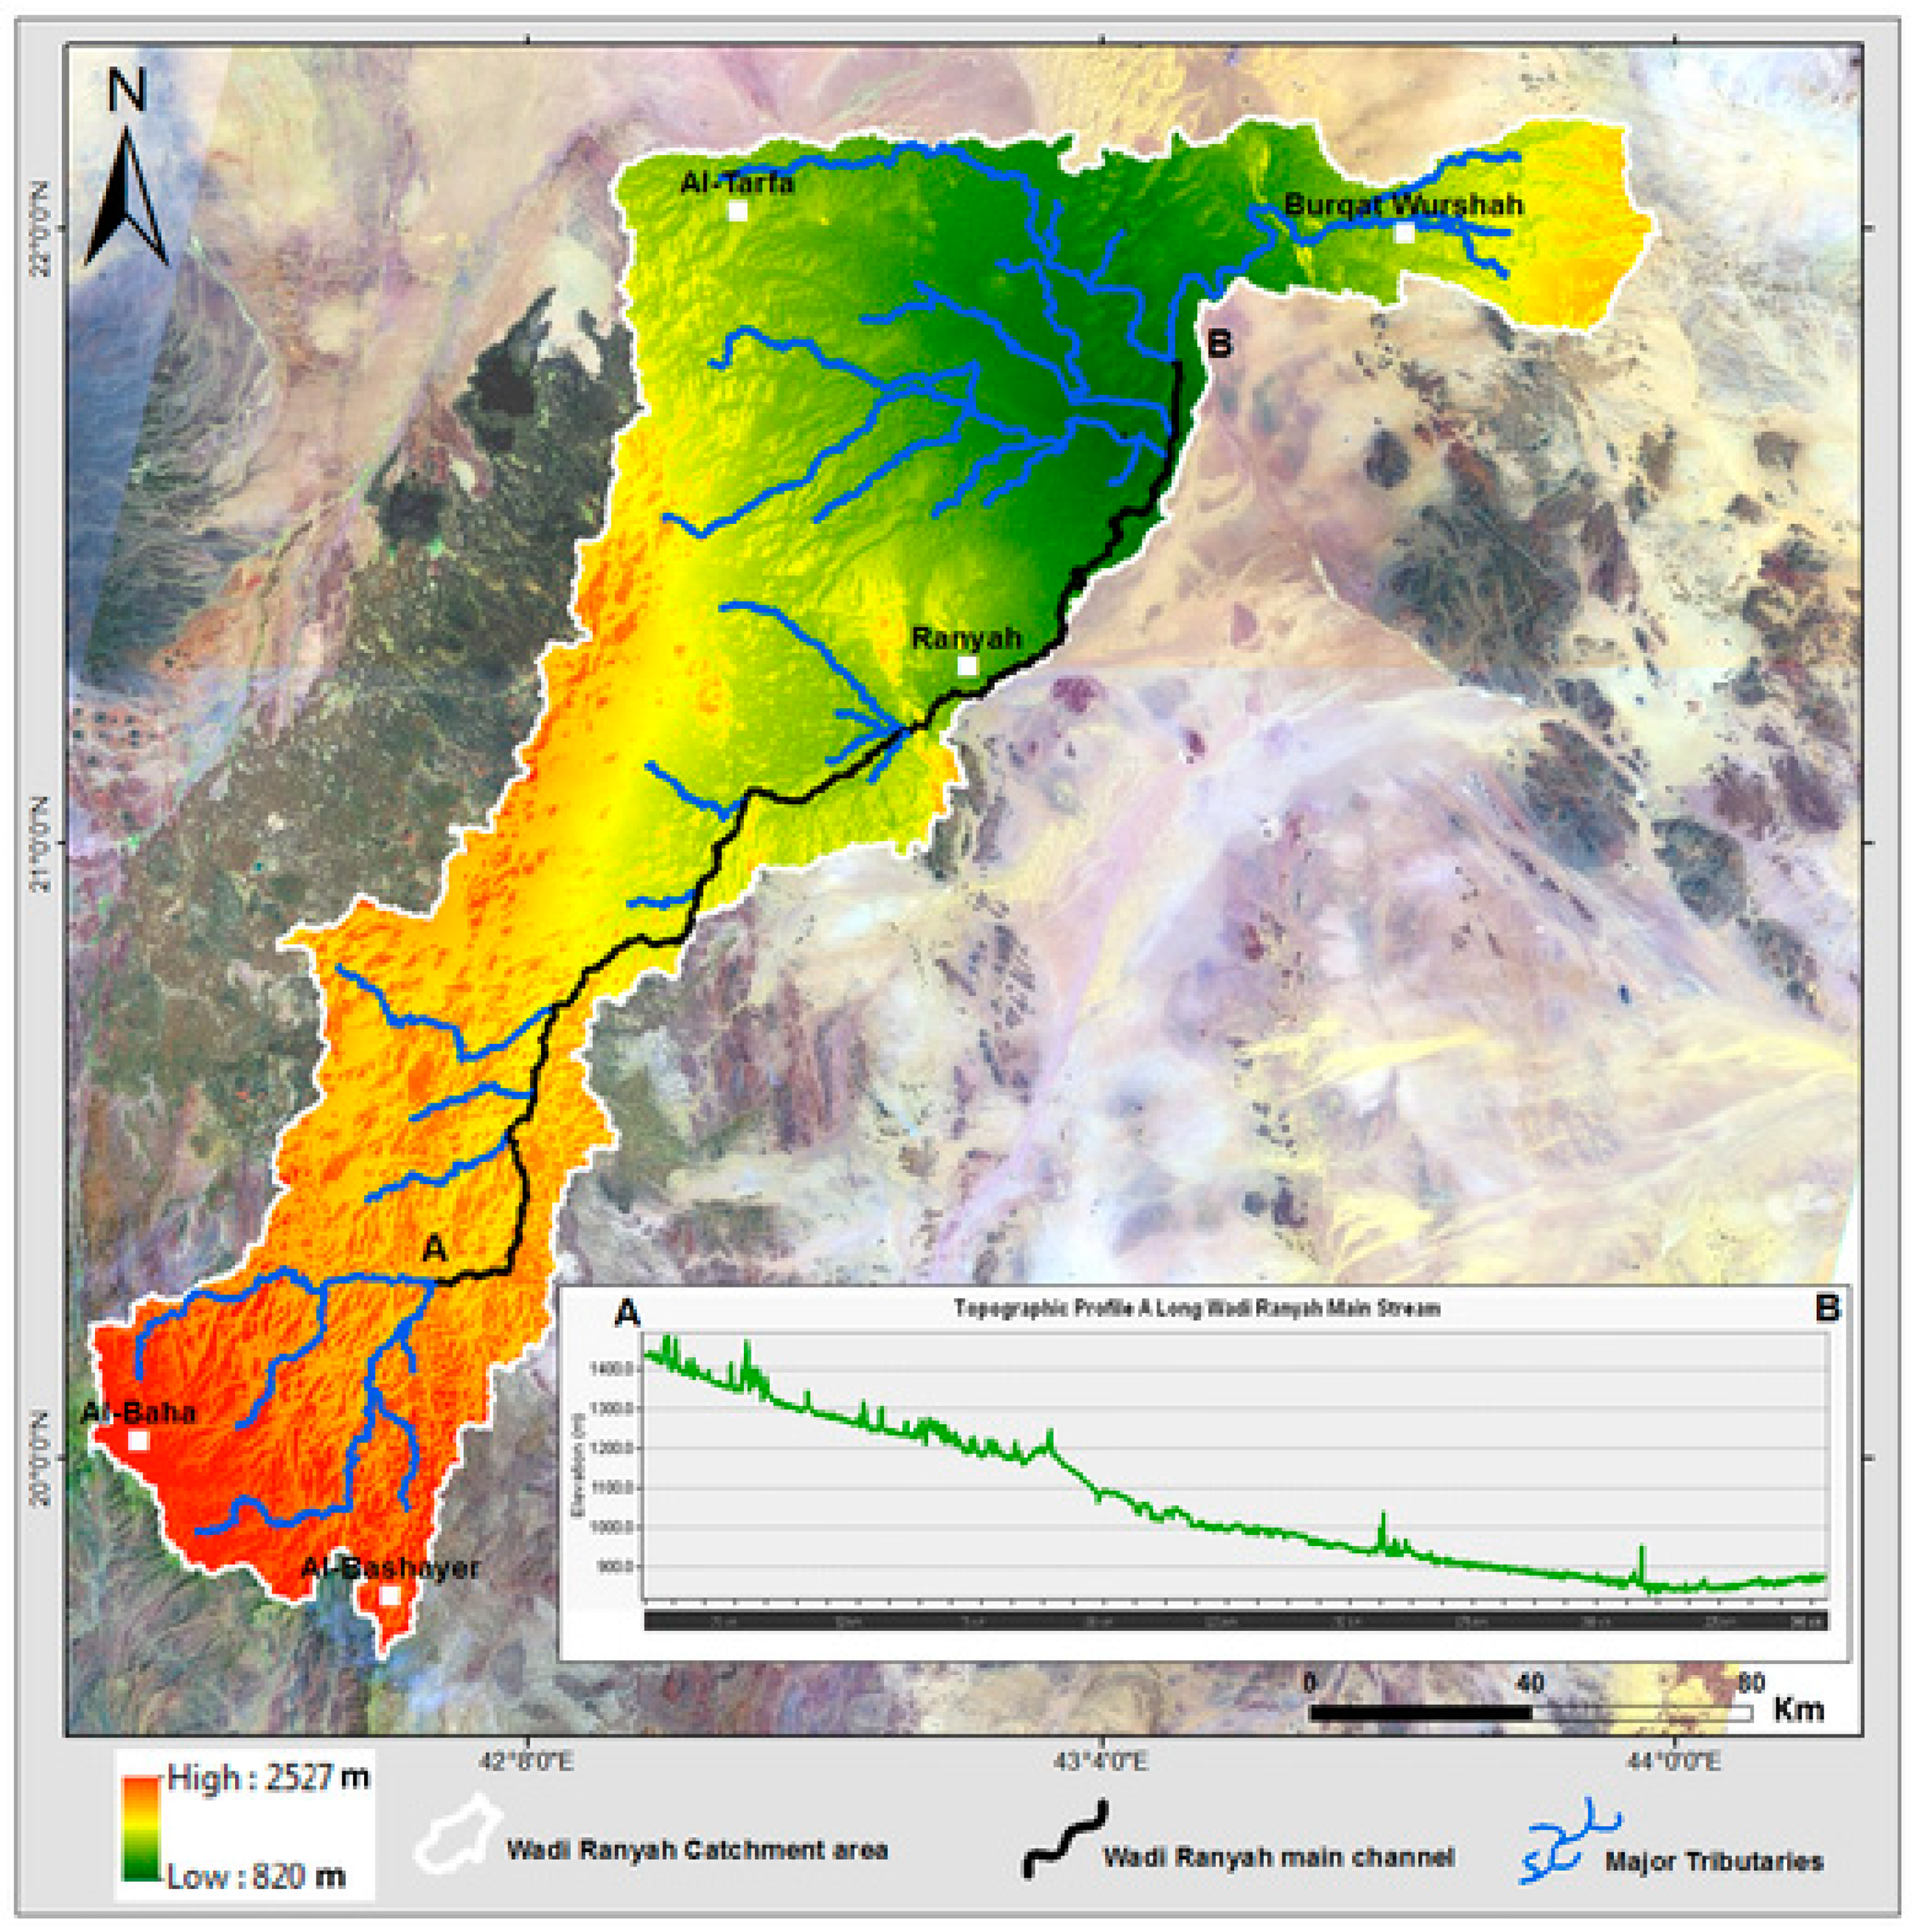
3.6. Landsat and SRTM Data
4. Result and Discussion
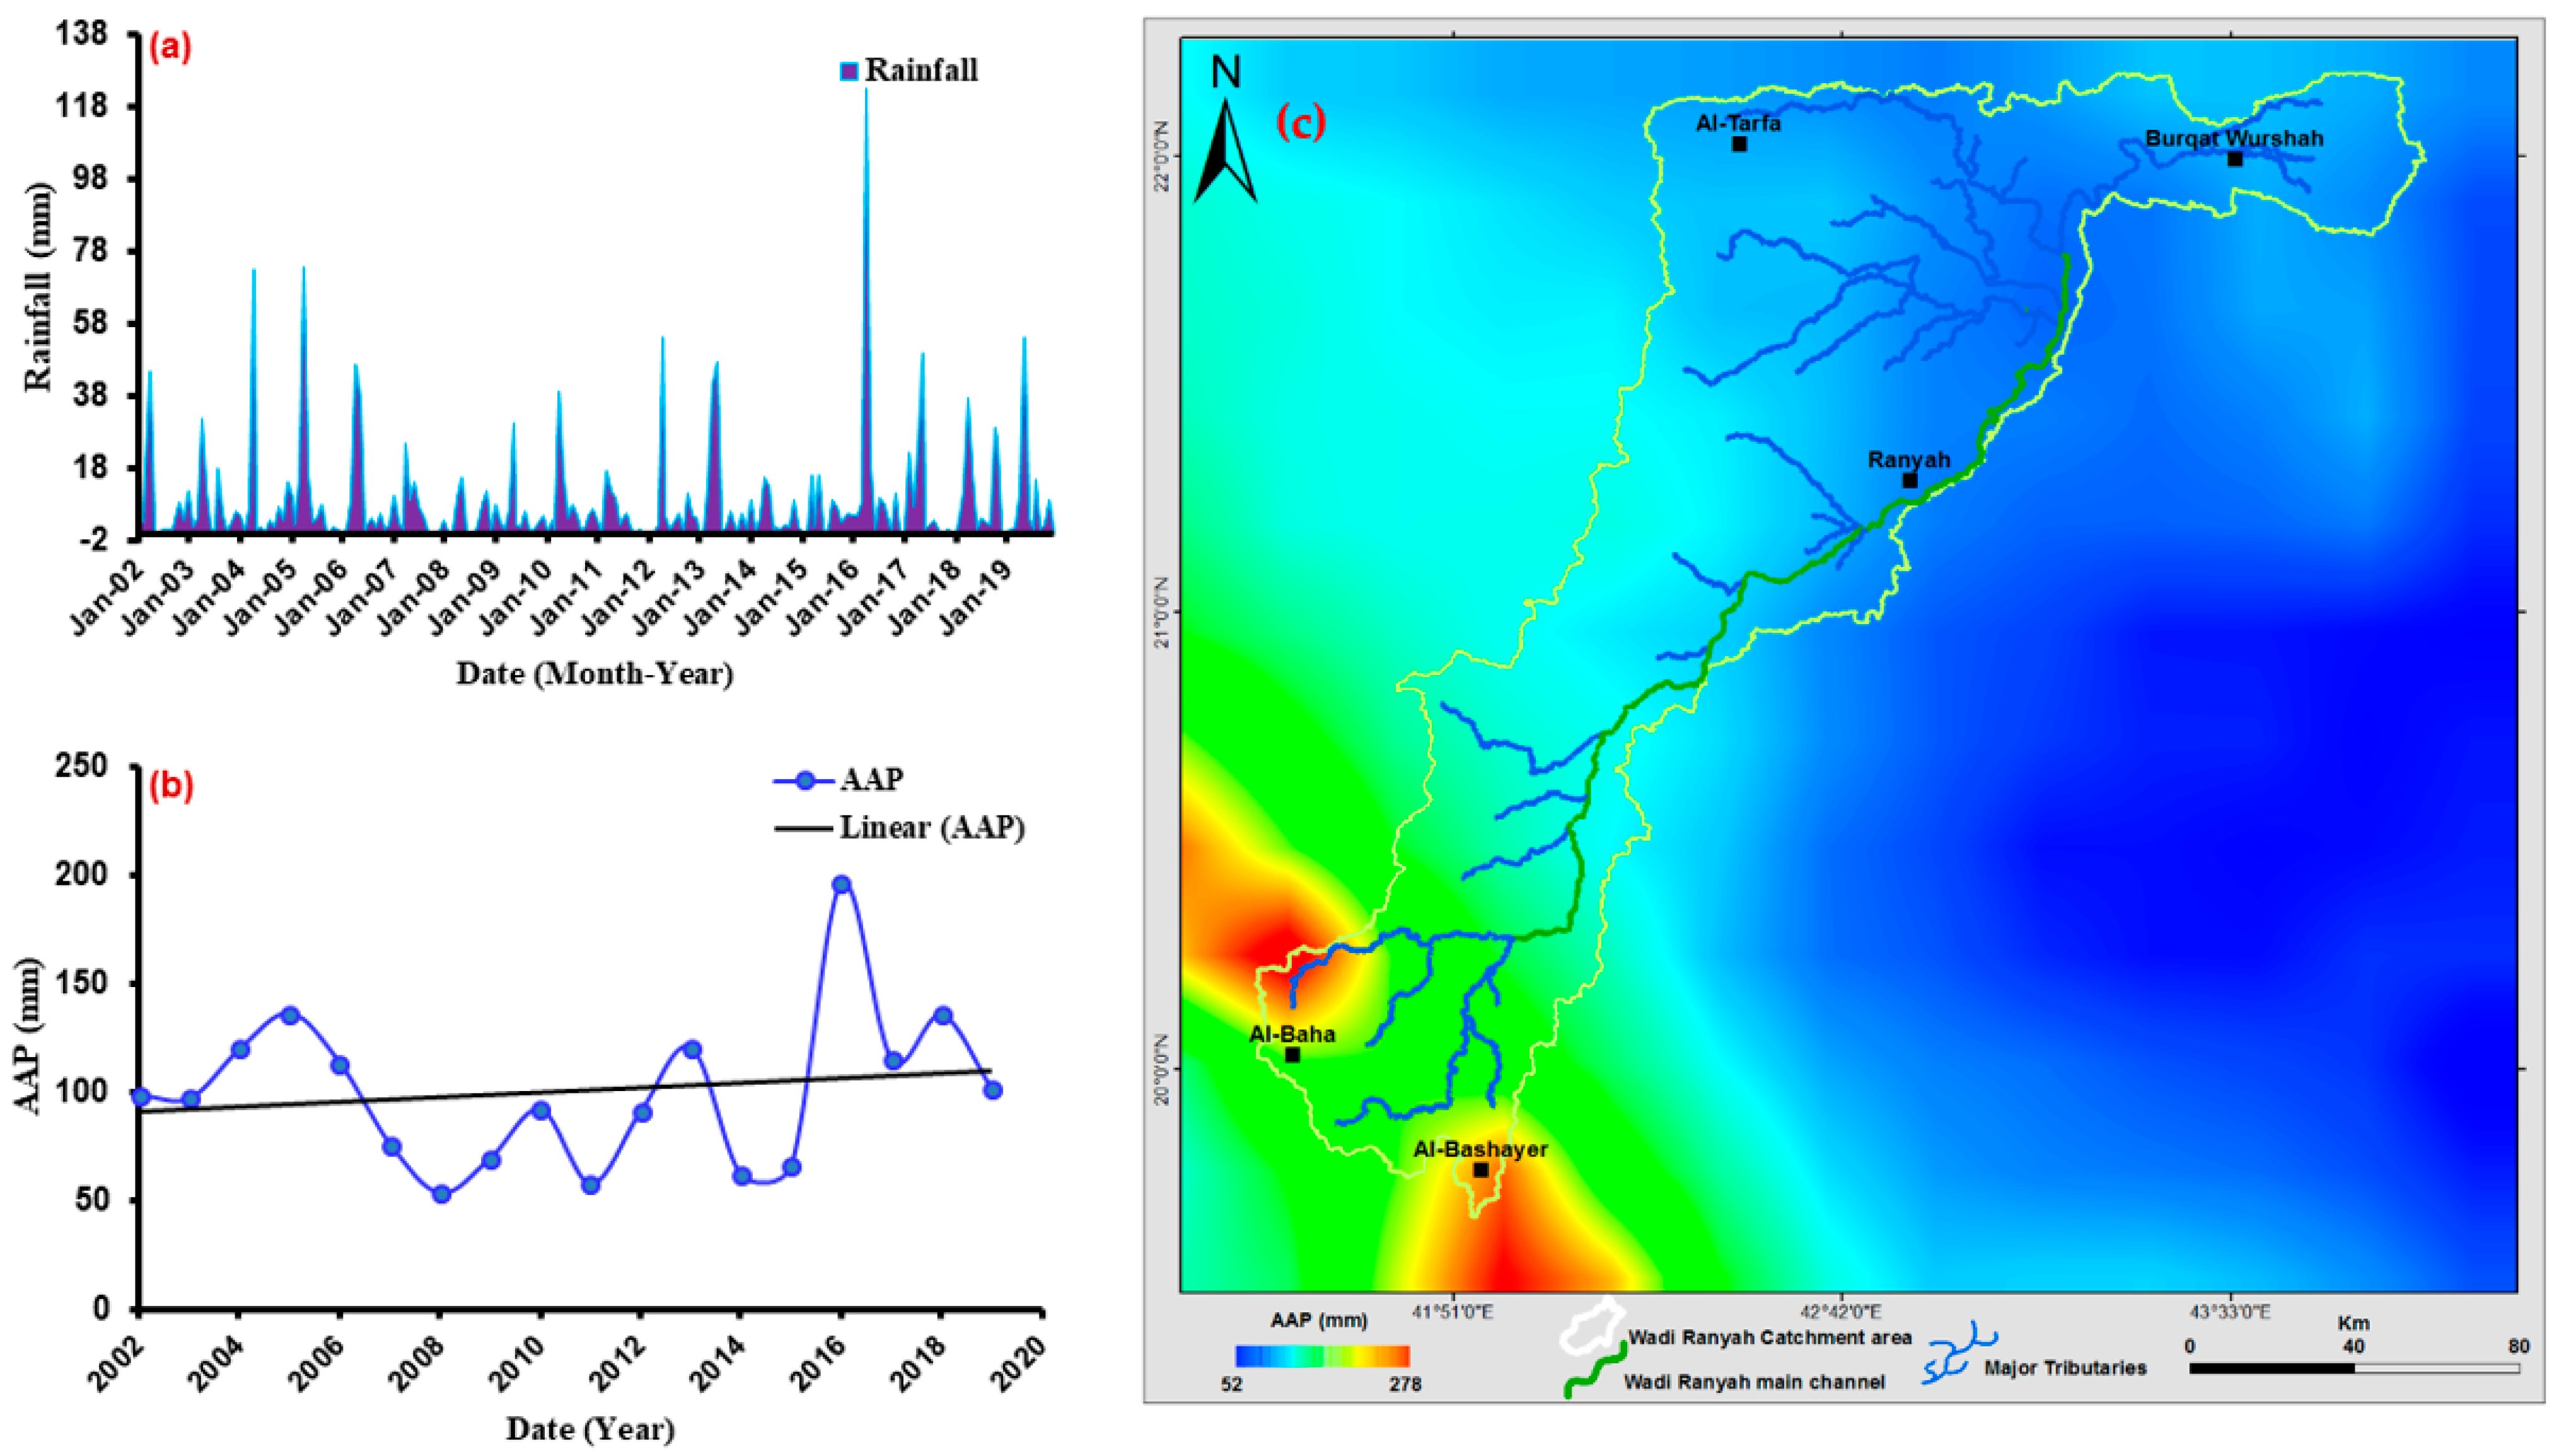
4.1. Average Annual Precipitation (AAP)
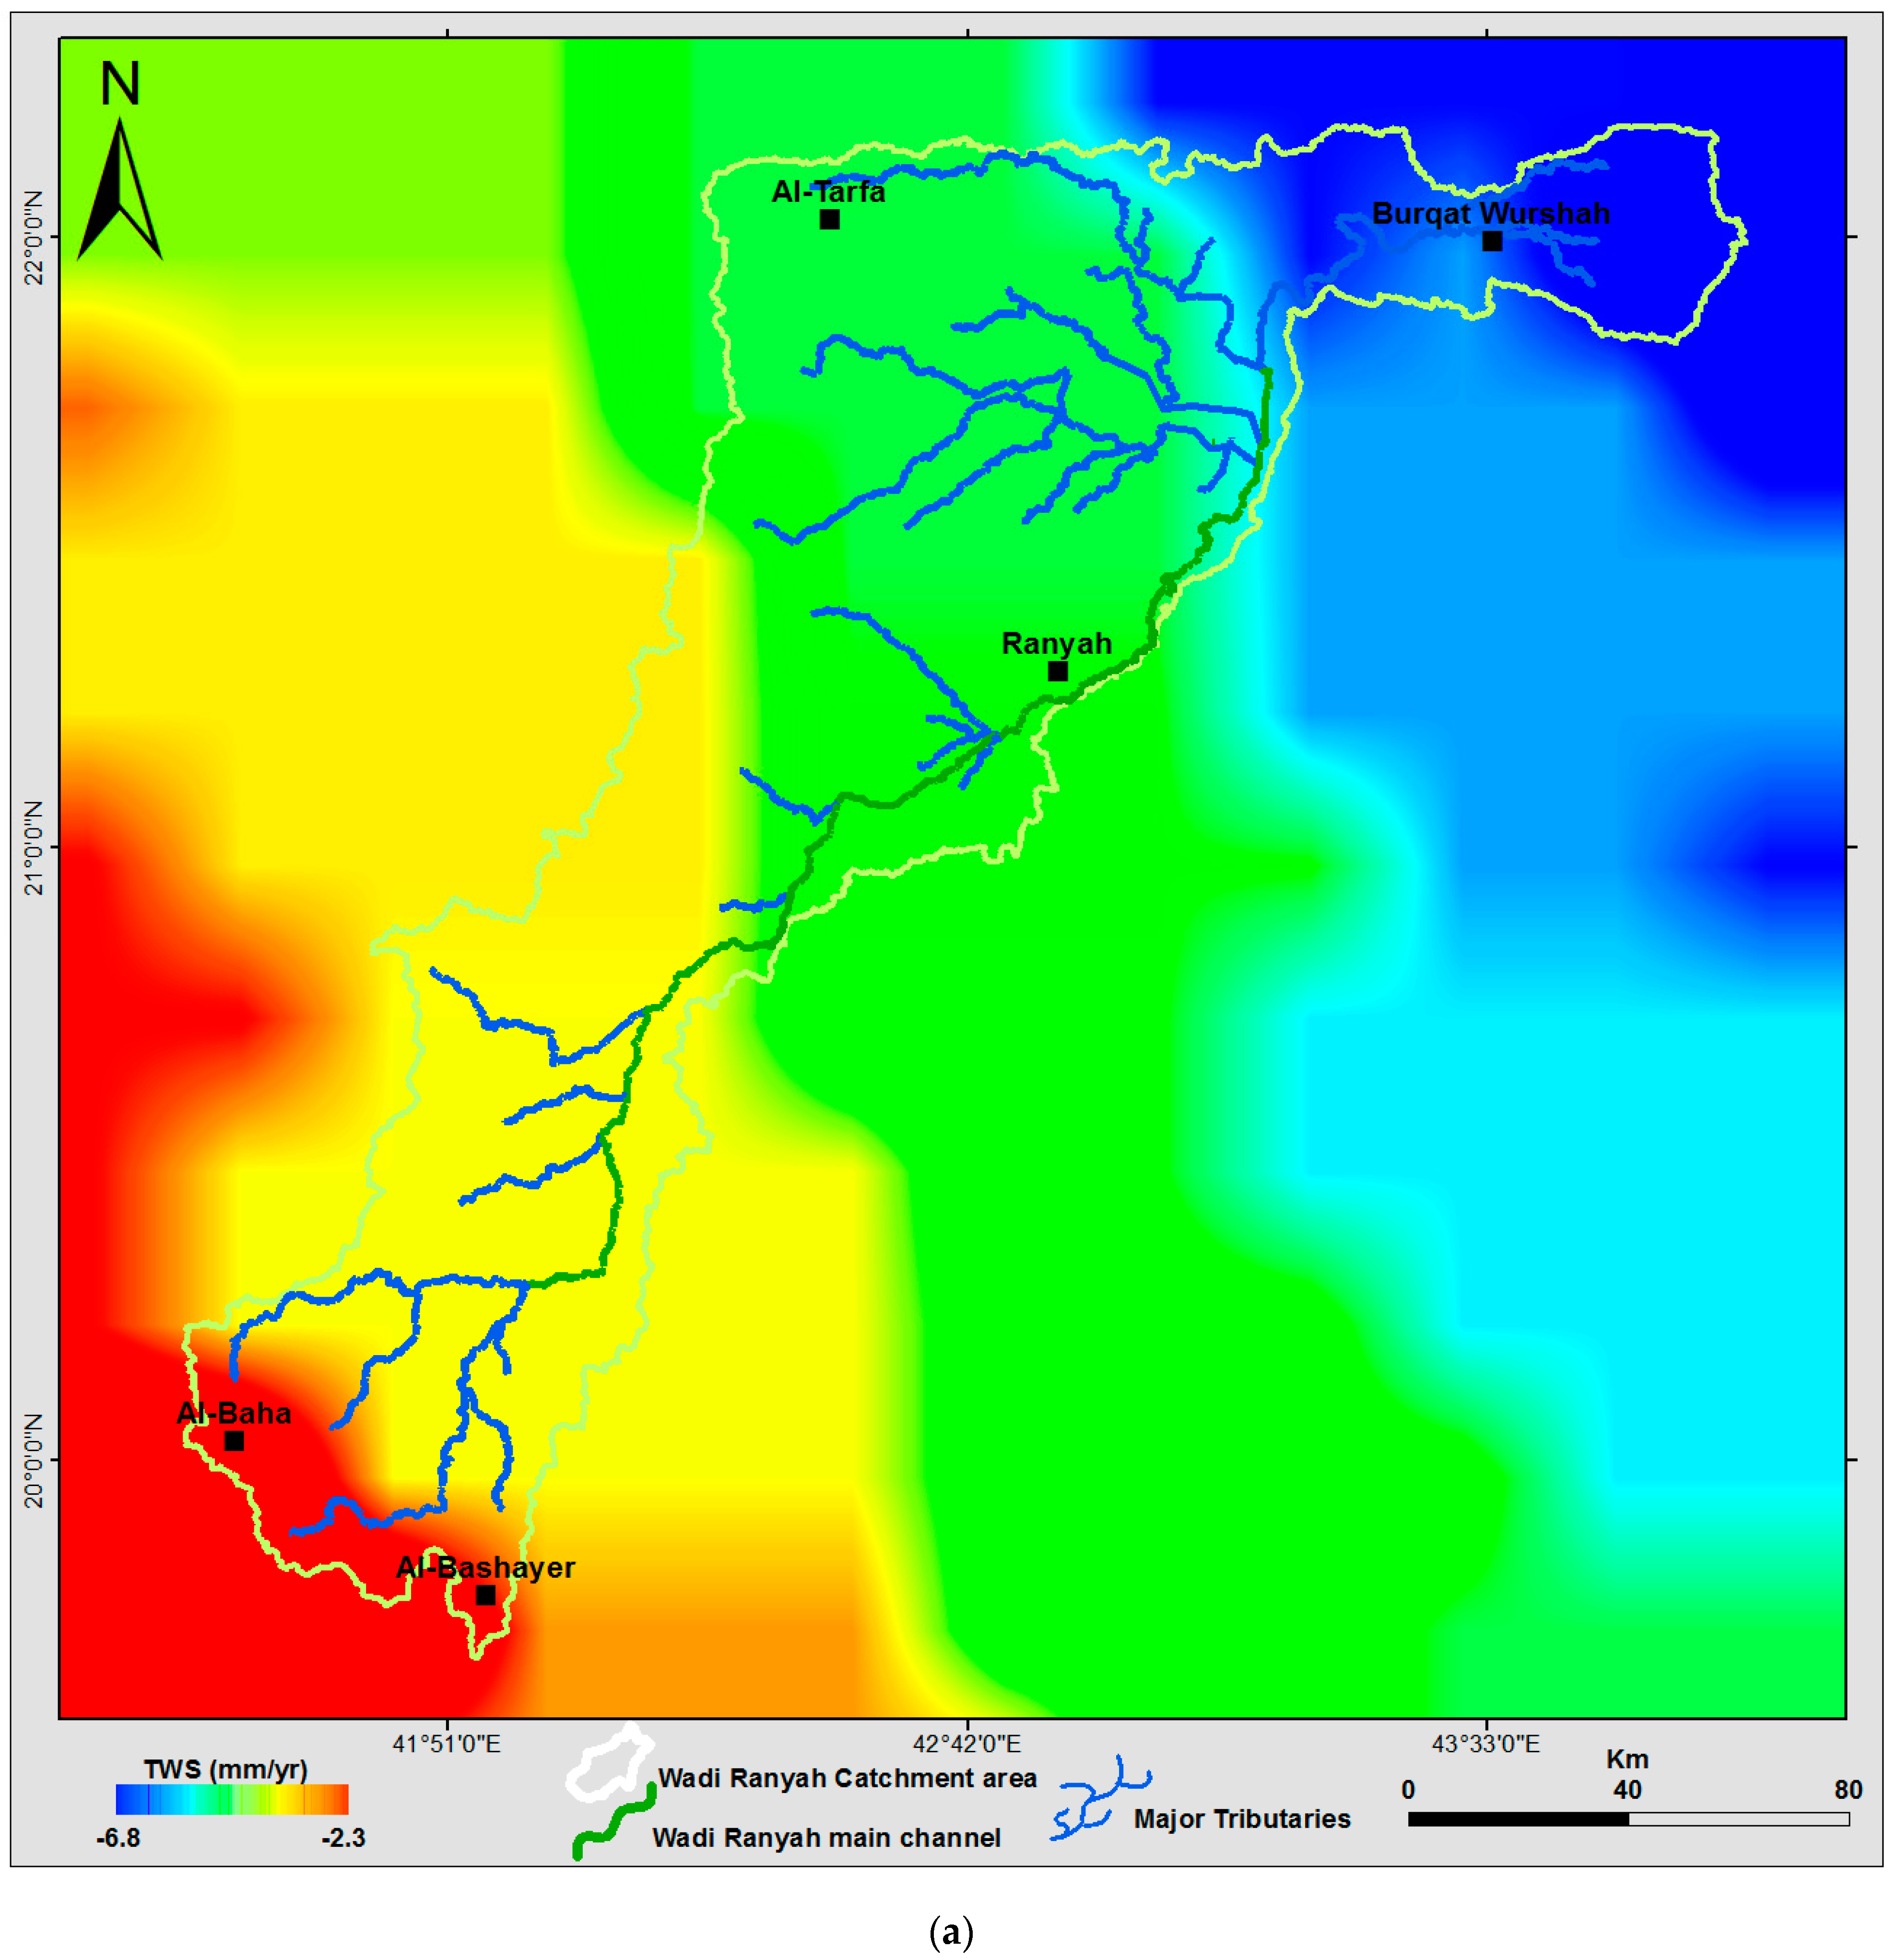
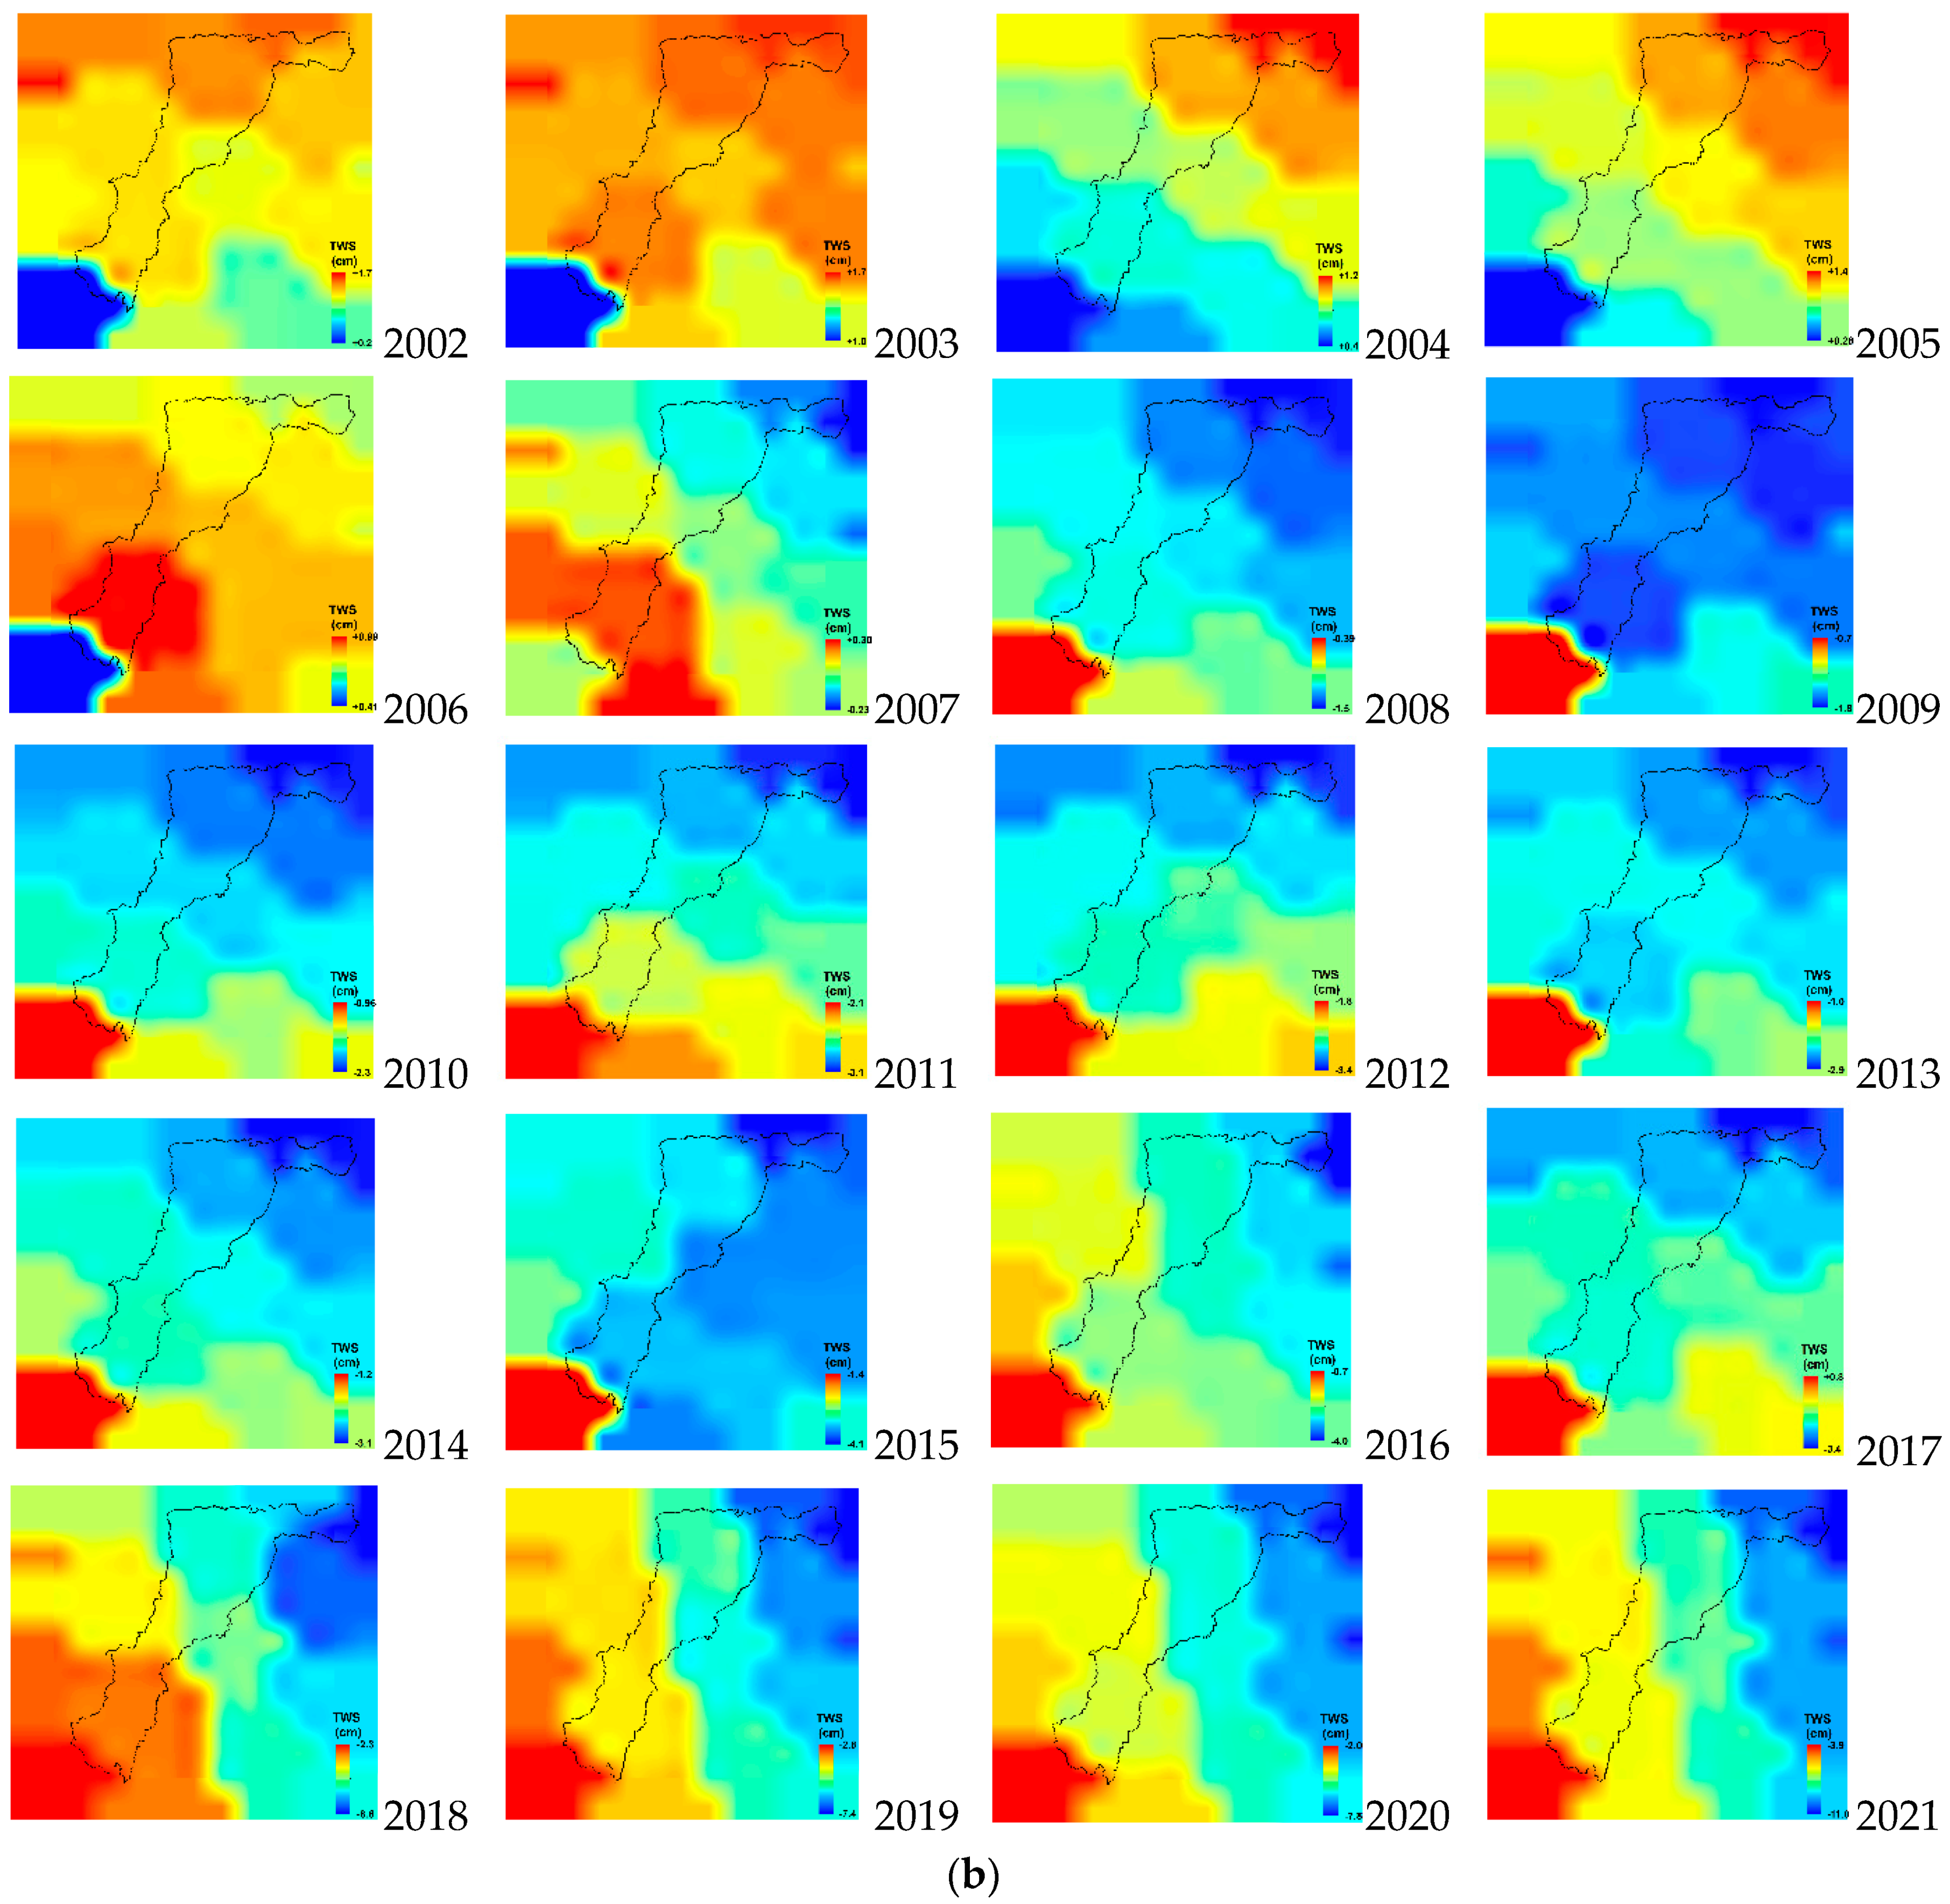
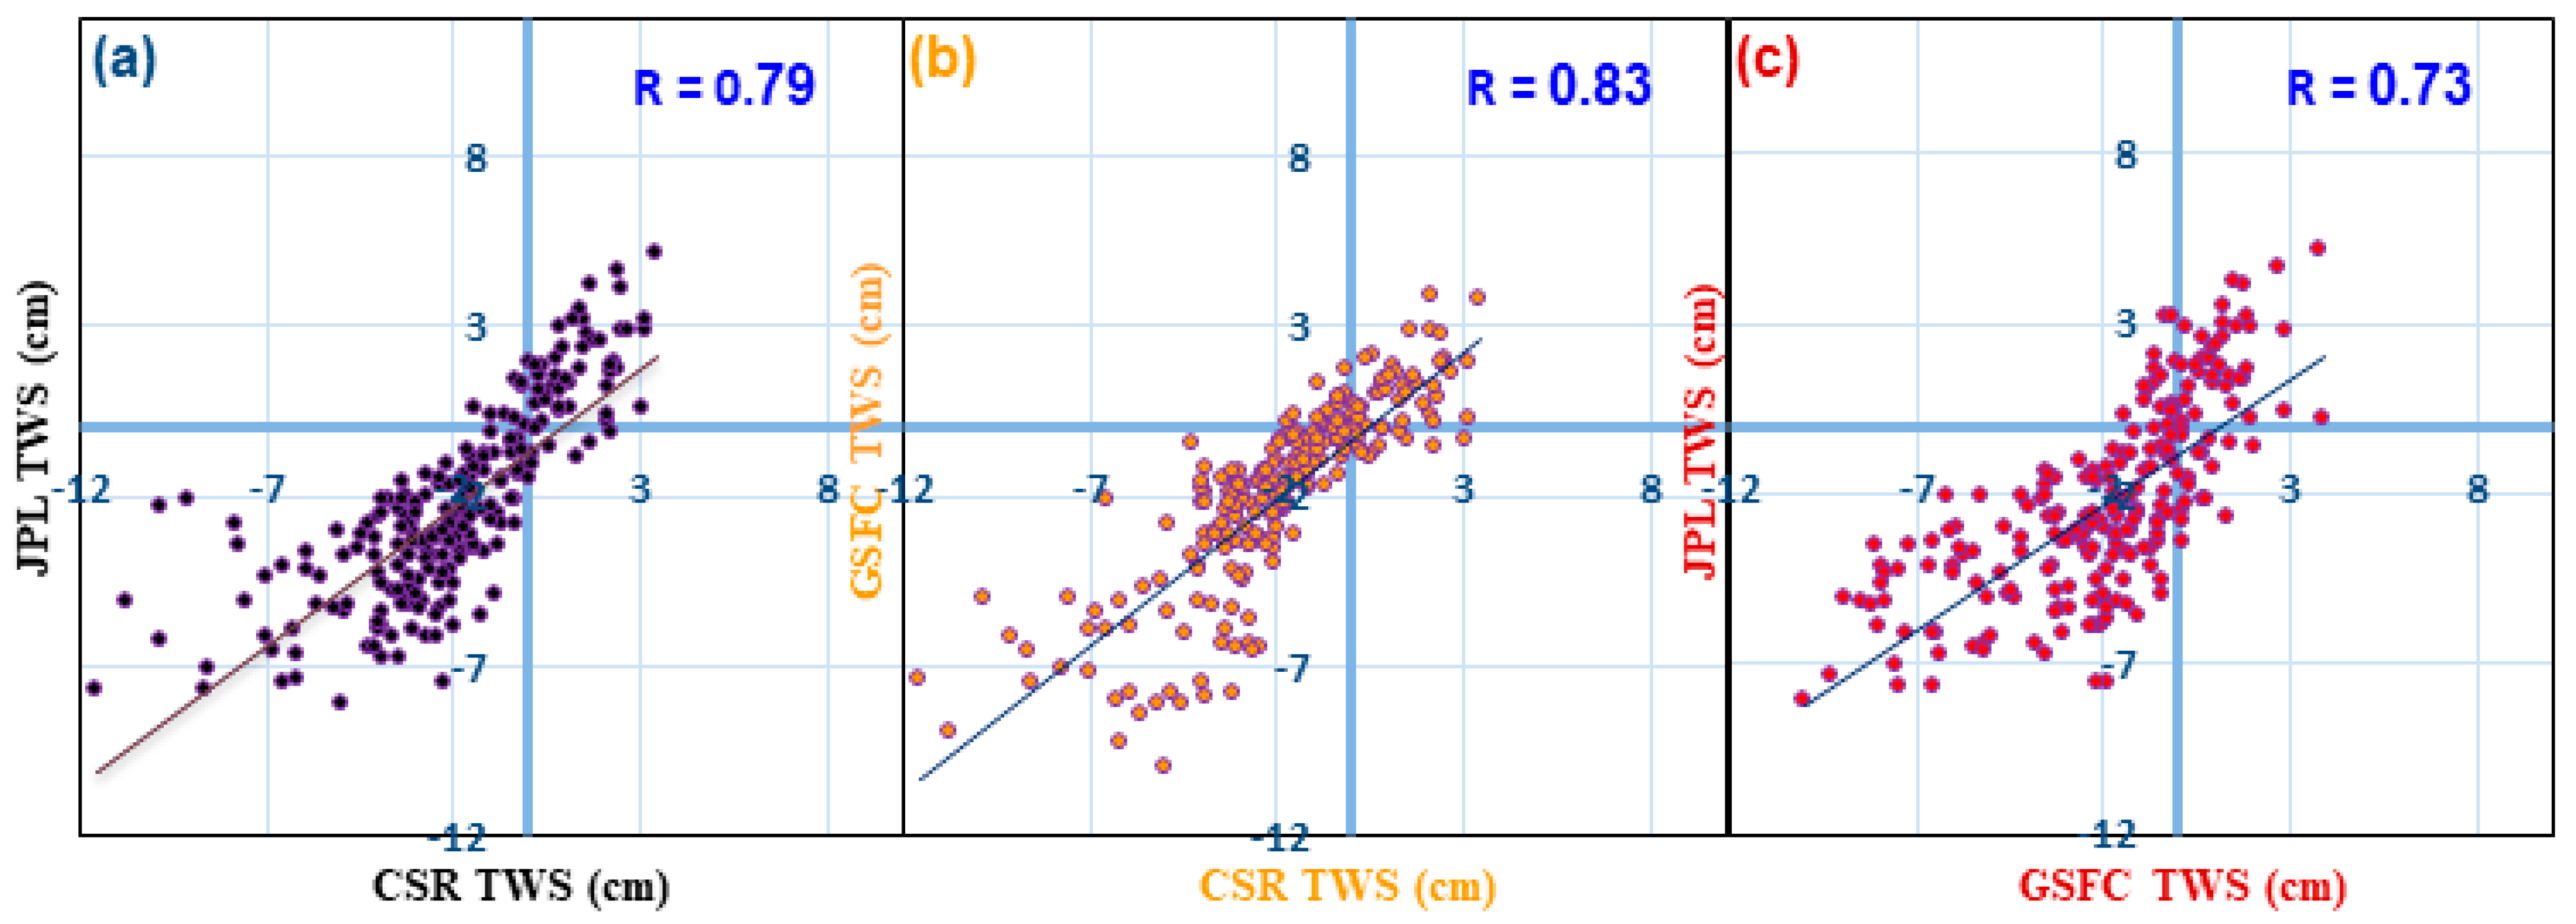
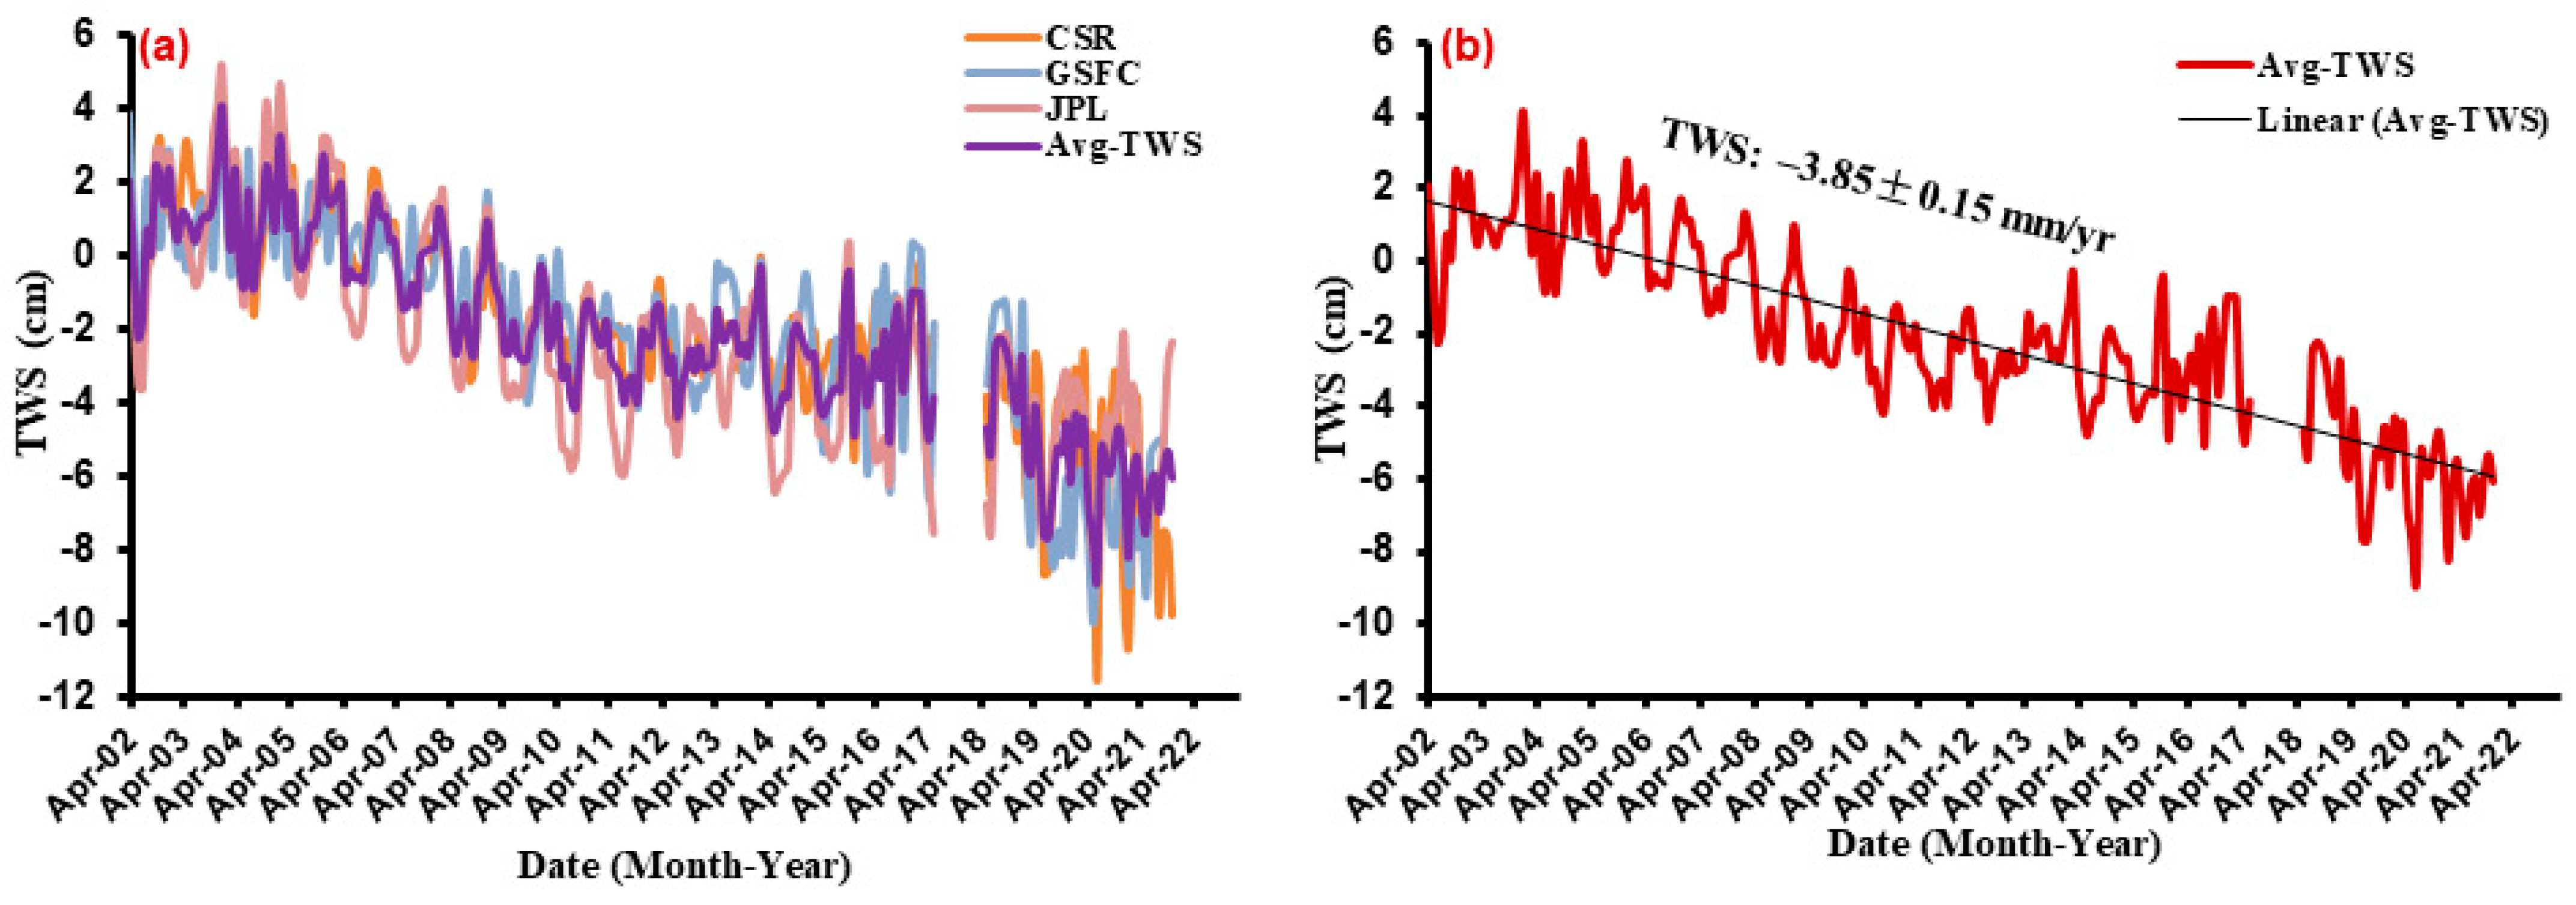
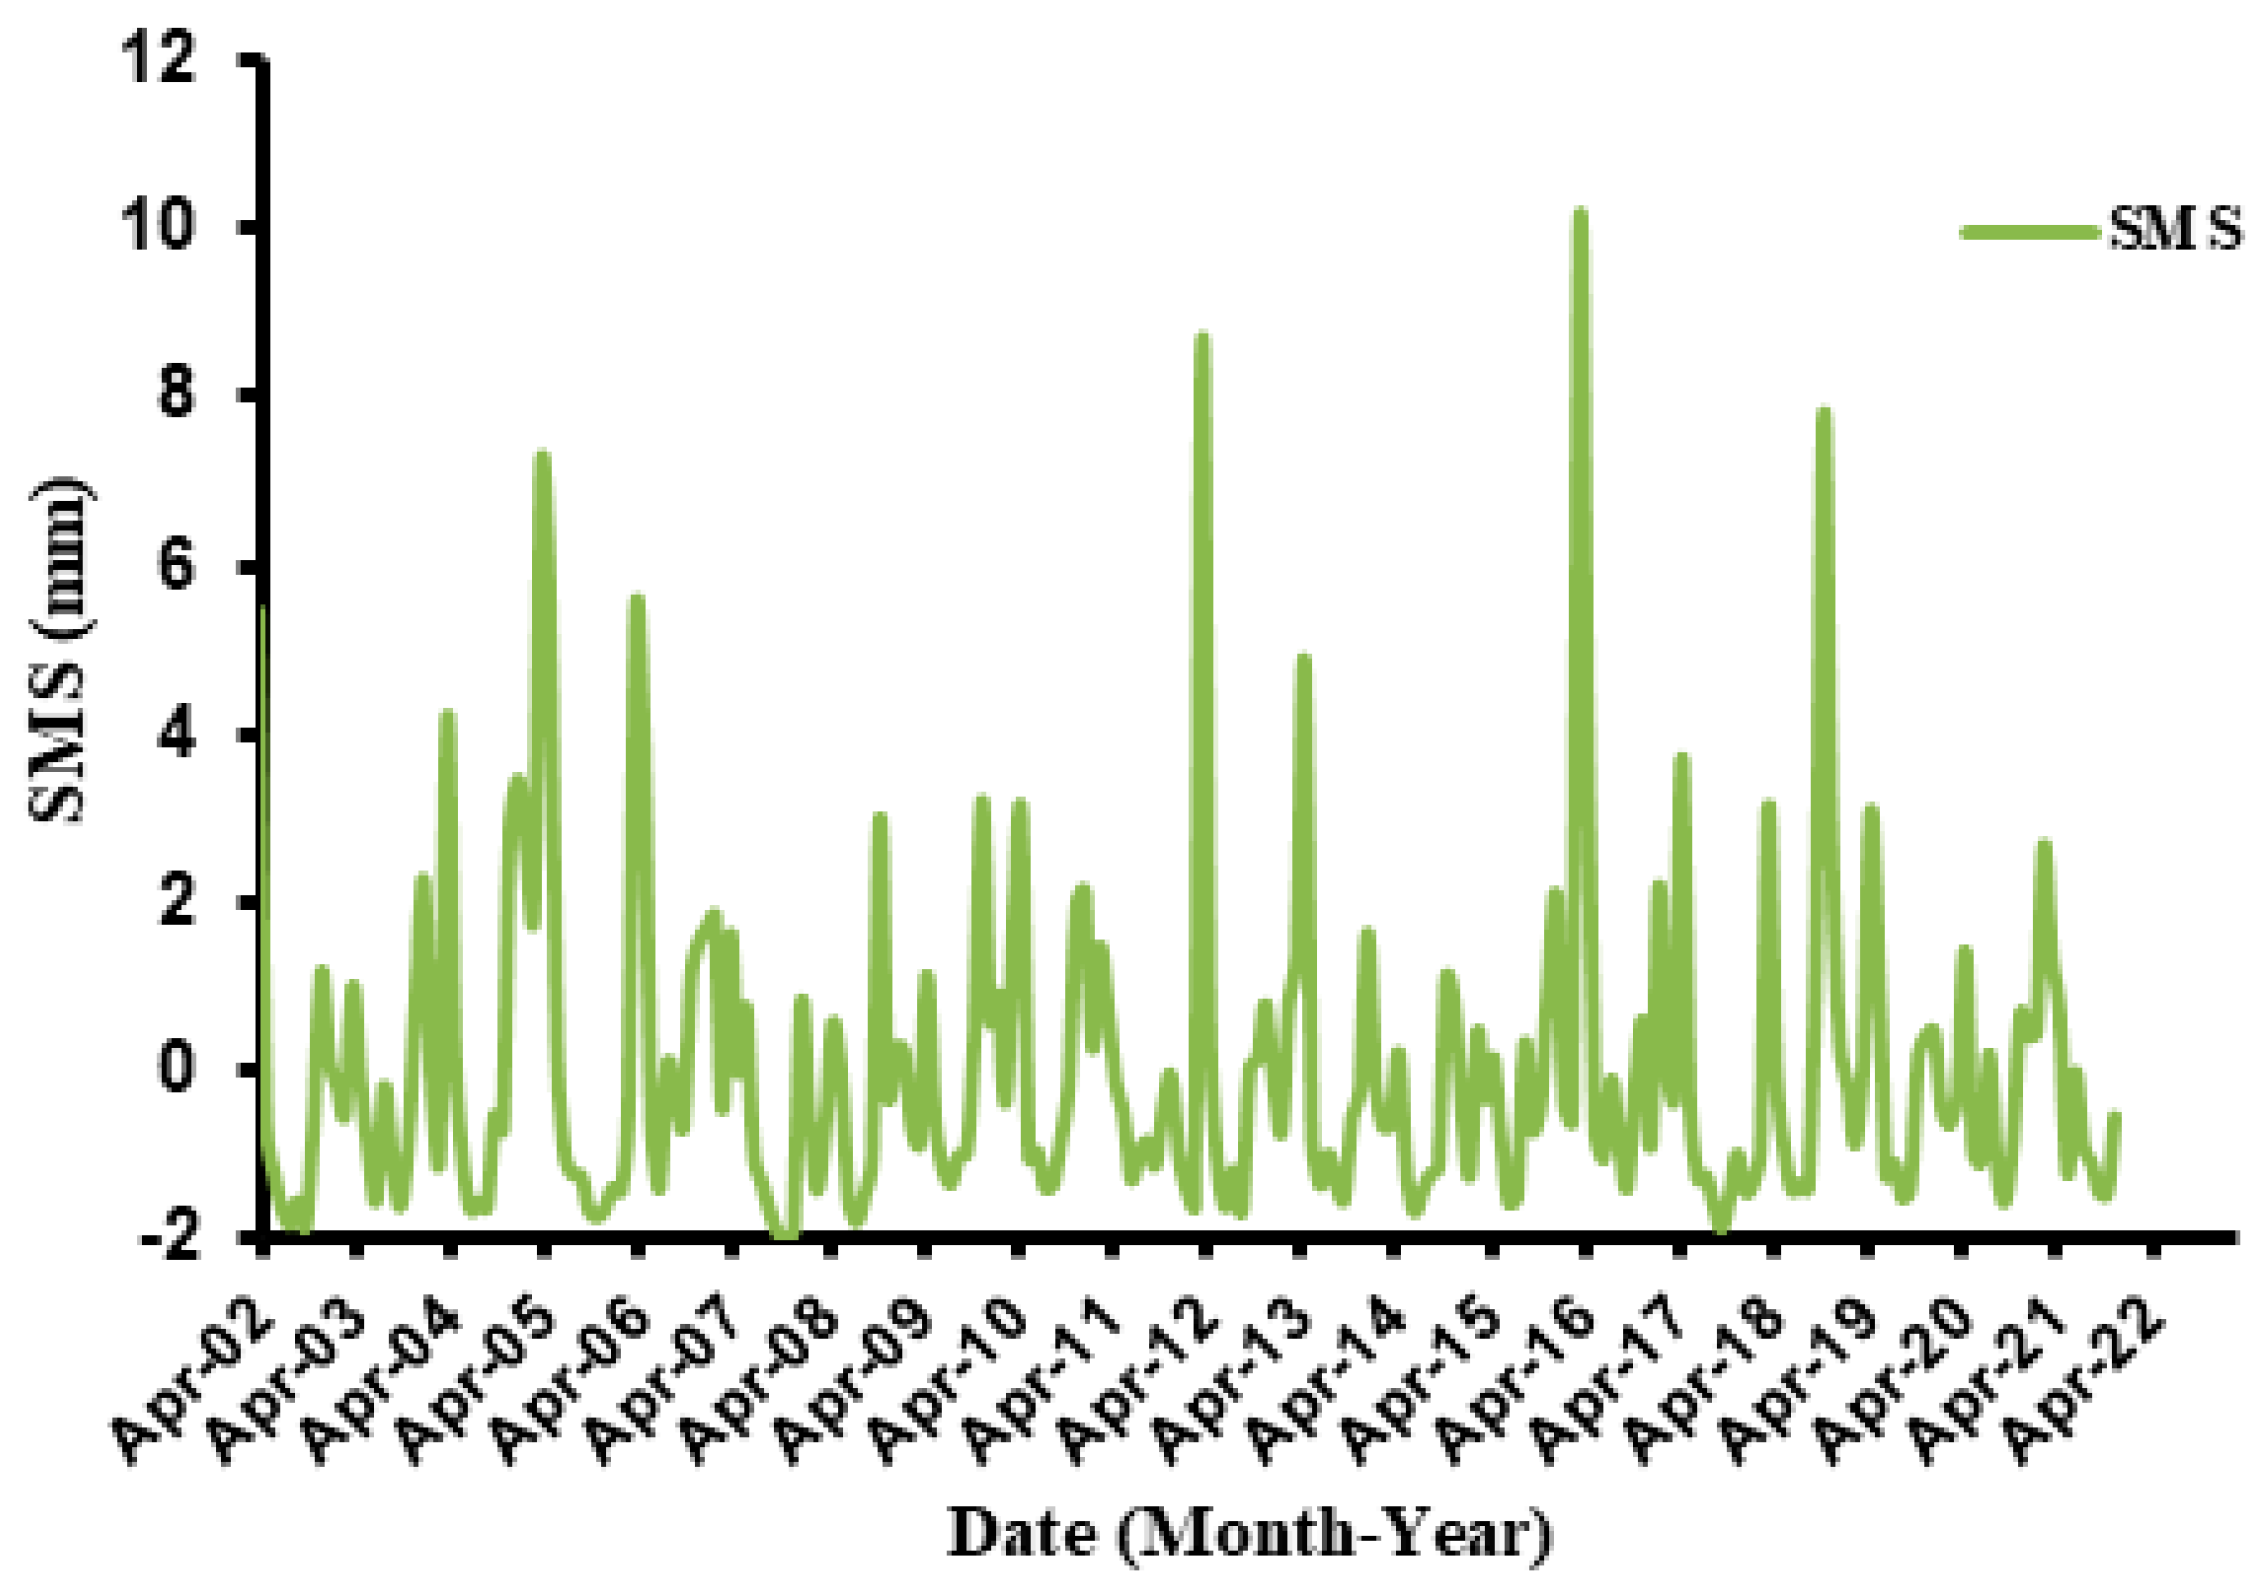
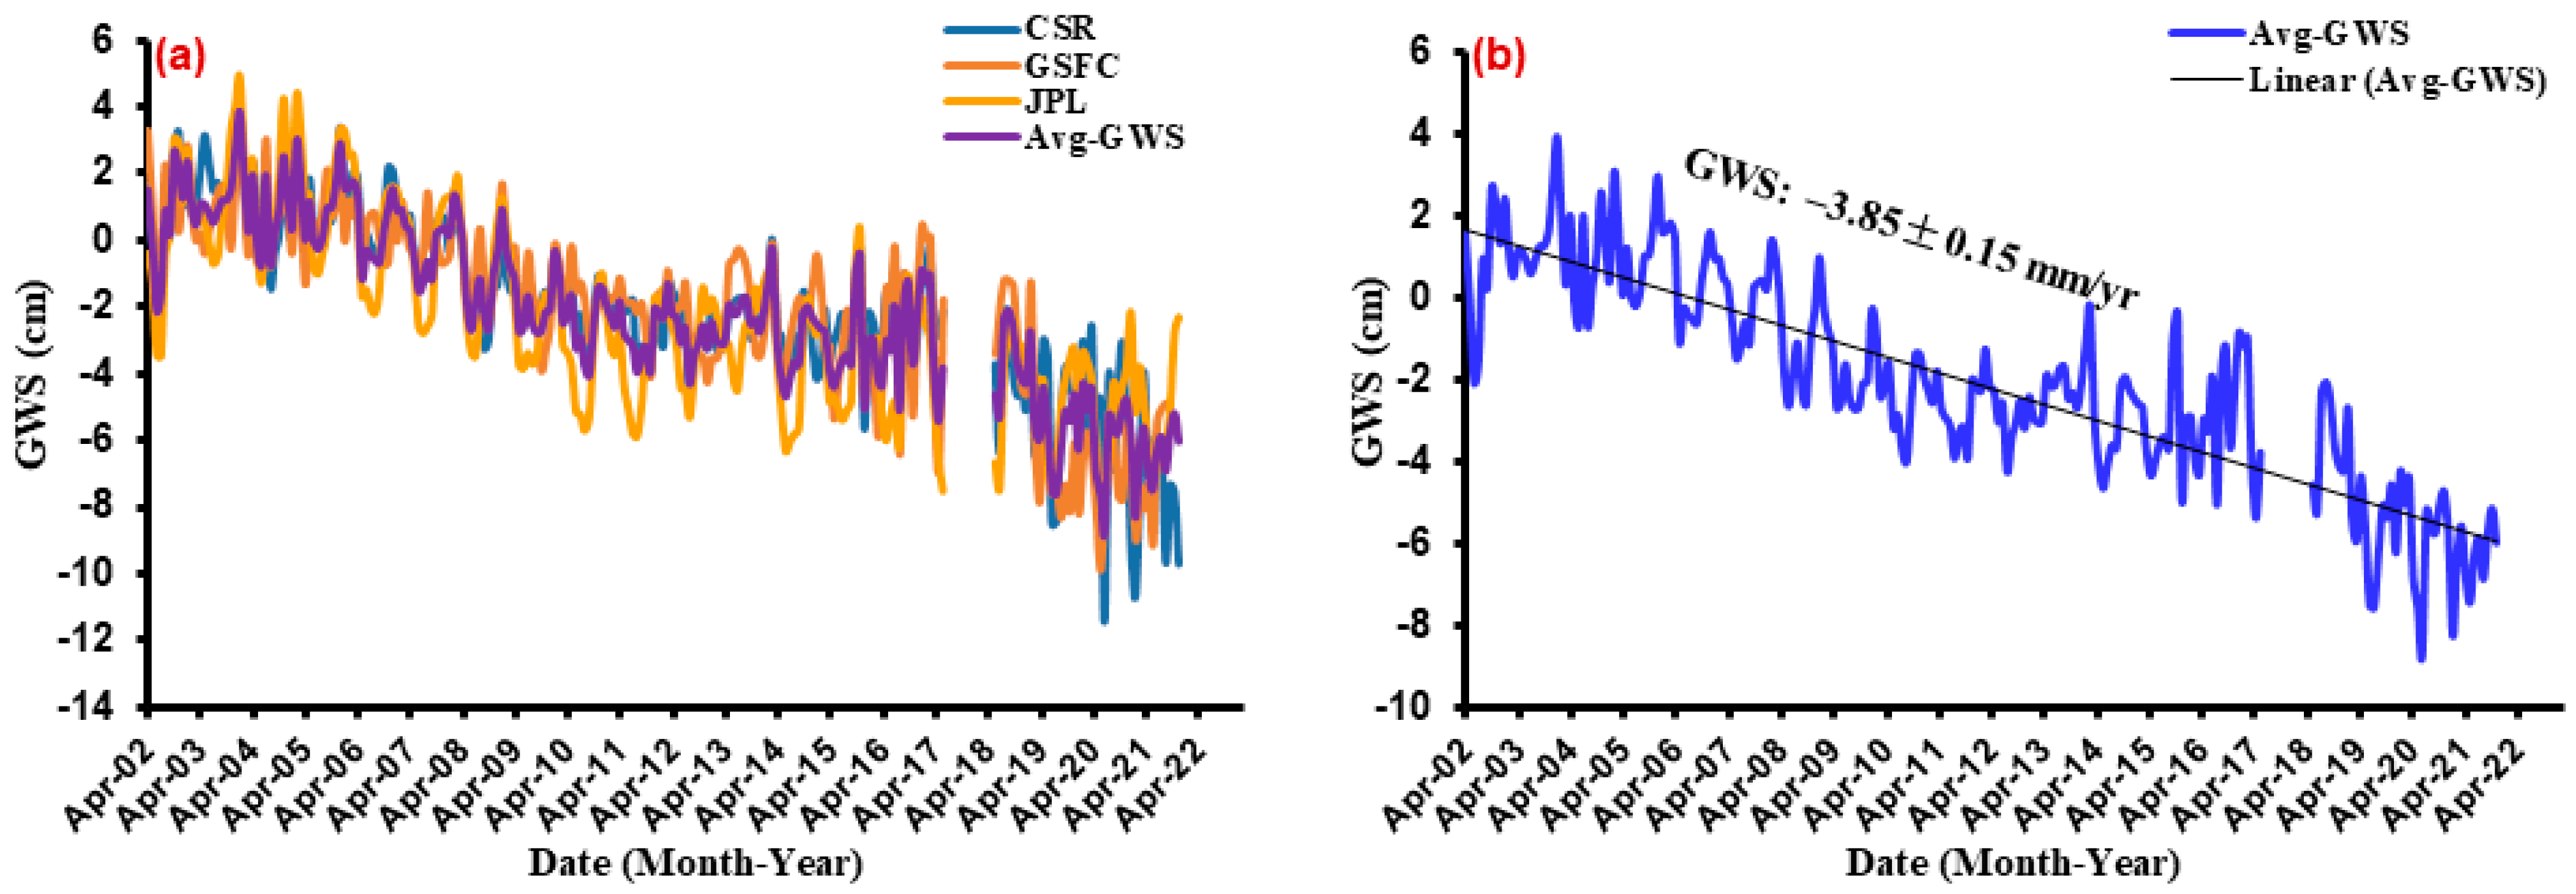
4.2. ΔTWS and ΔGWS in the Wadi Ranyah Region
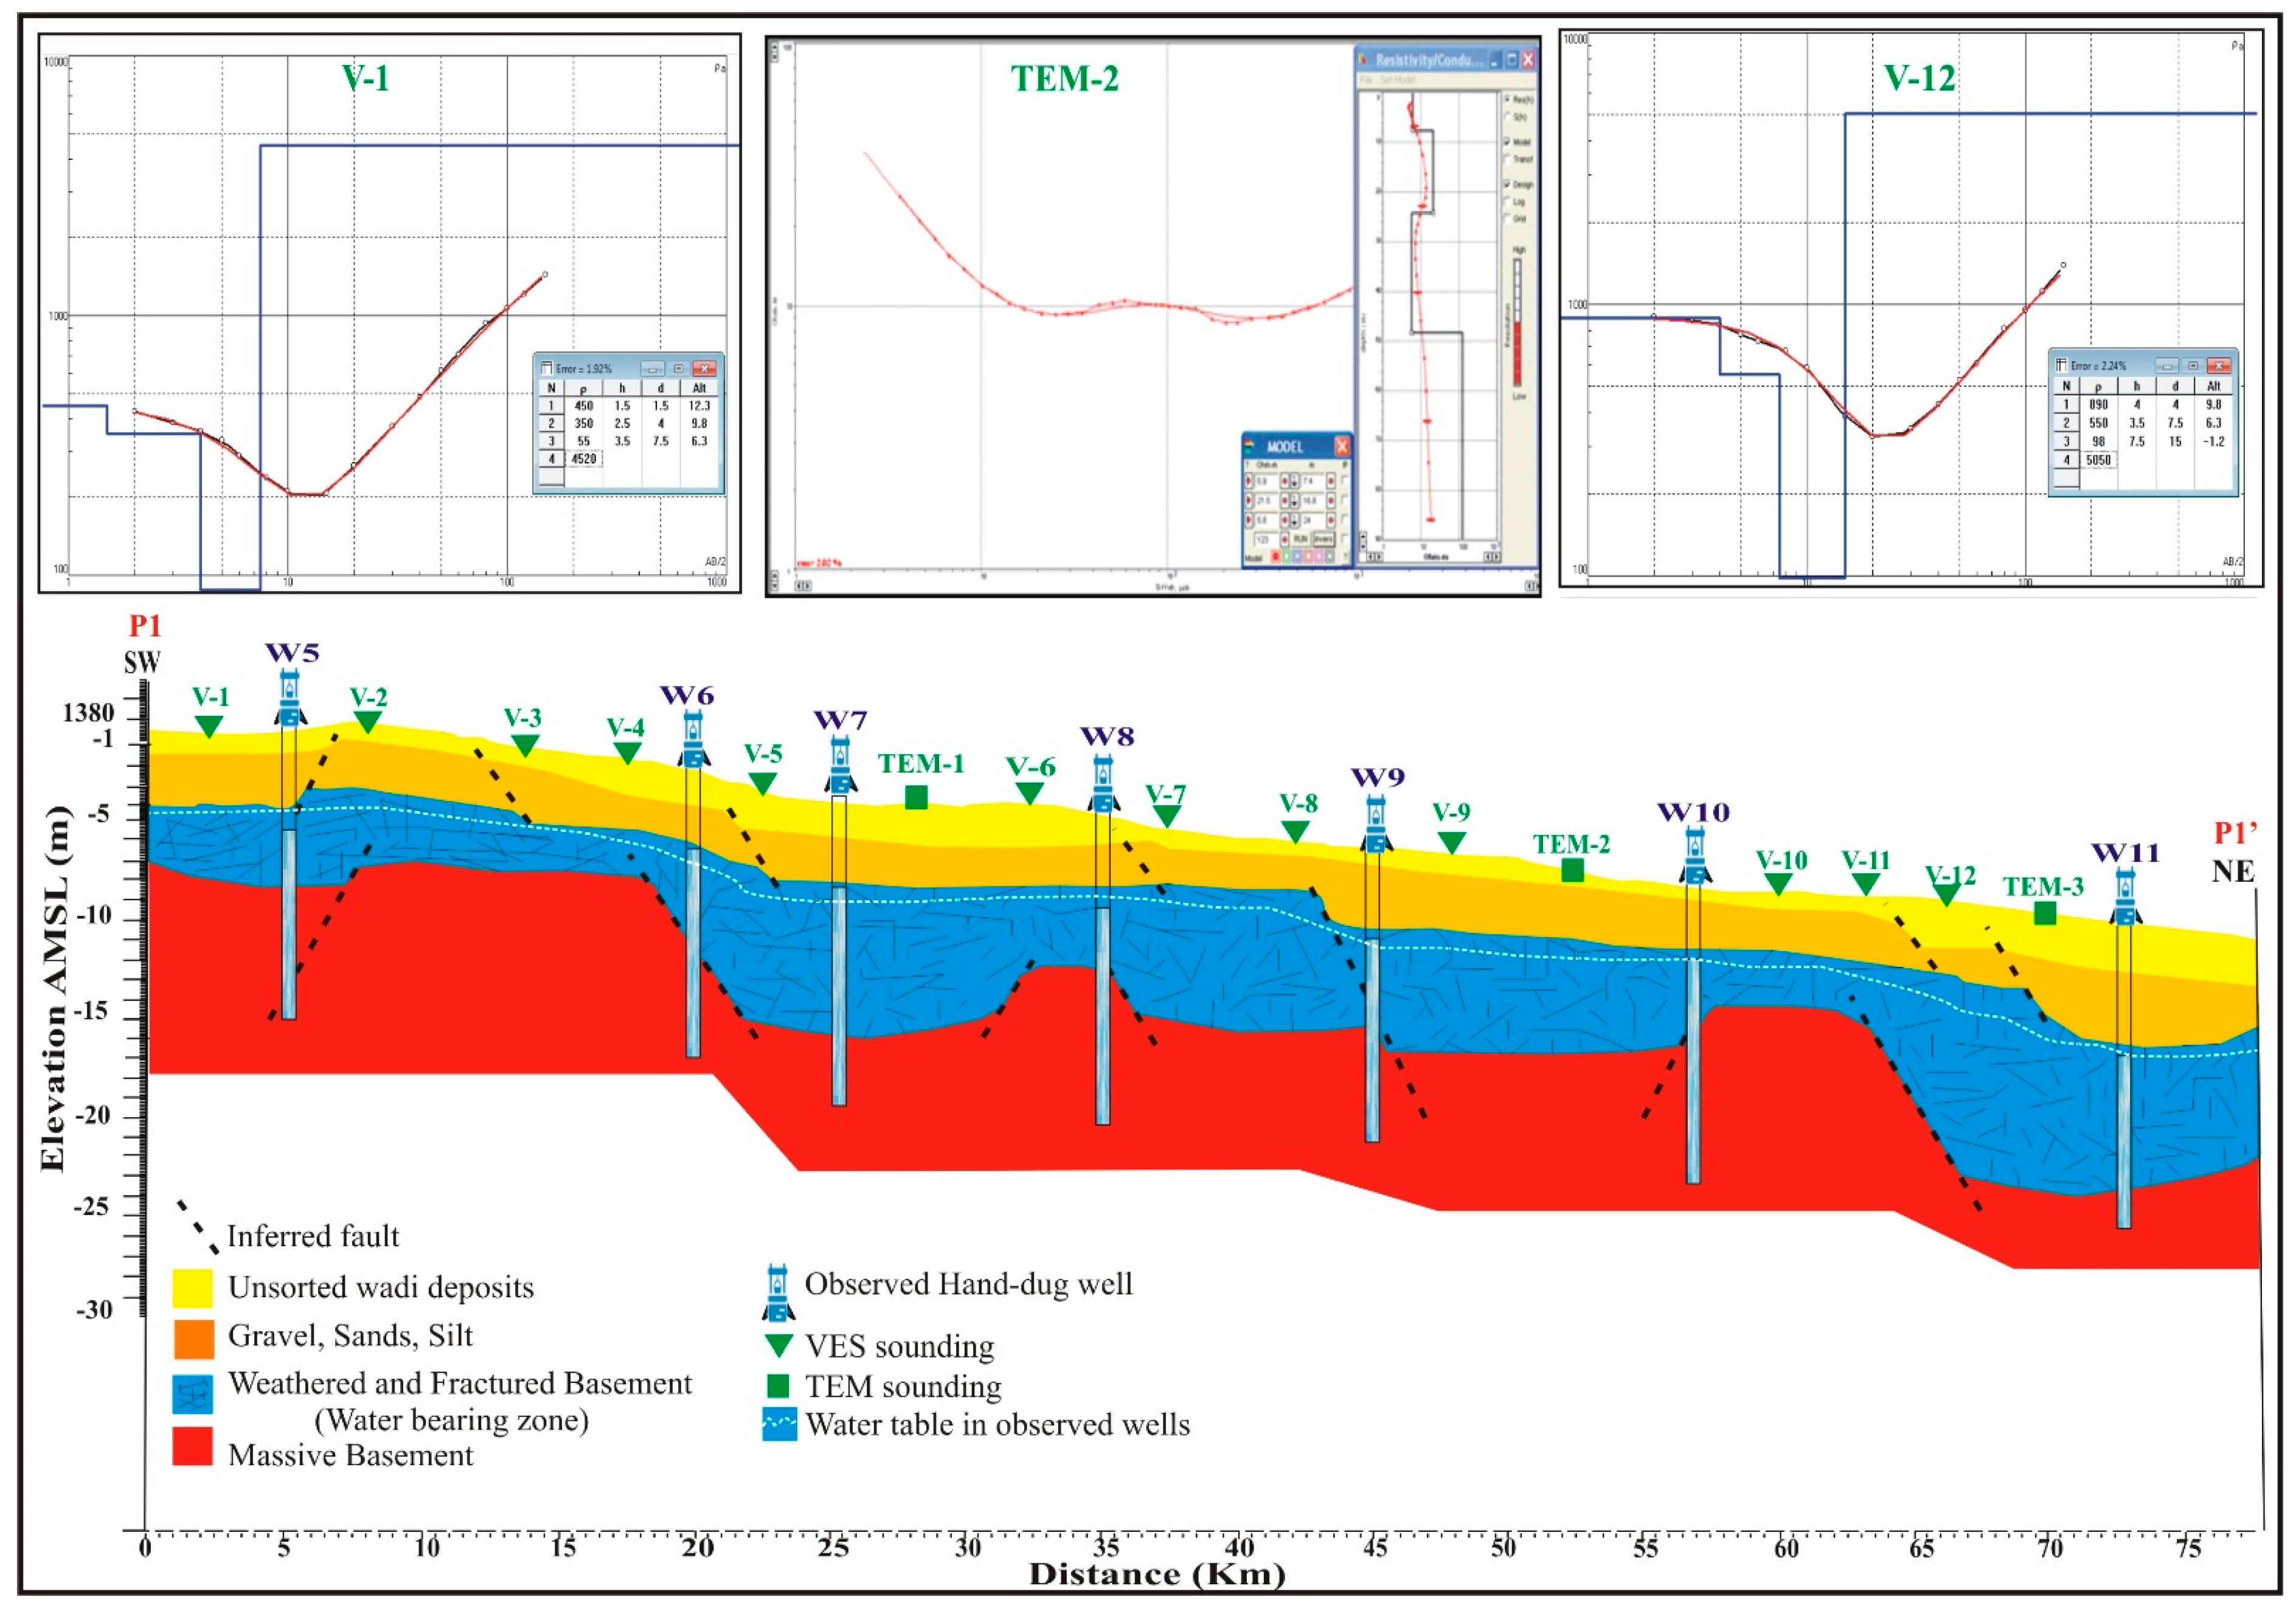
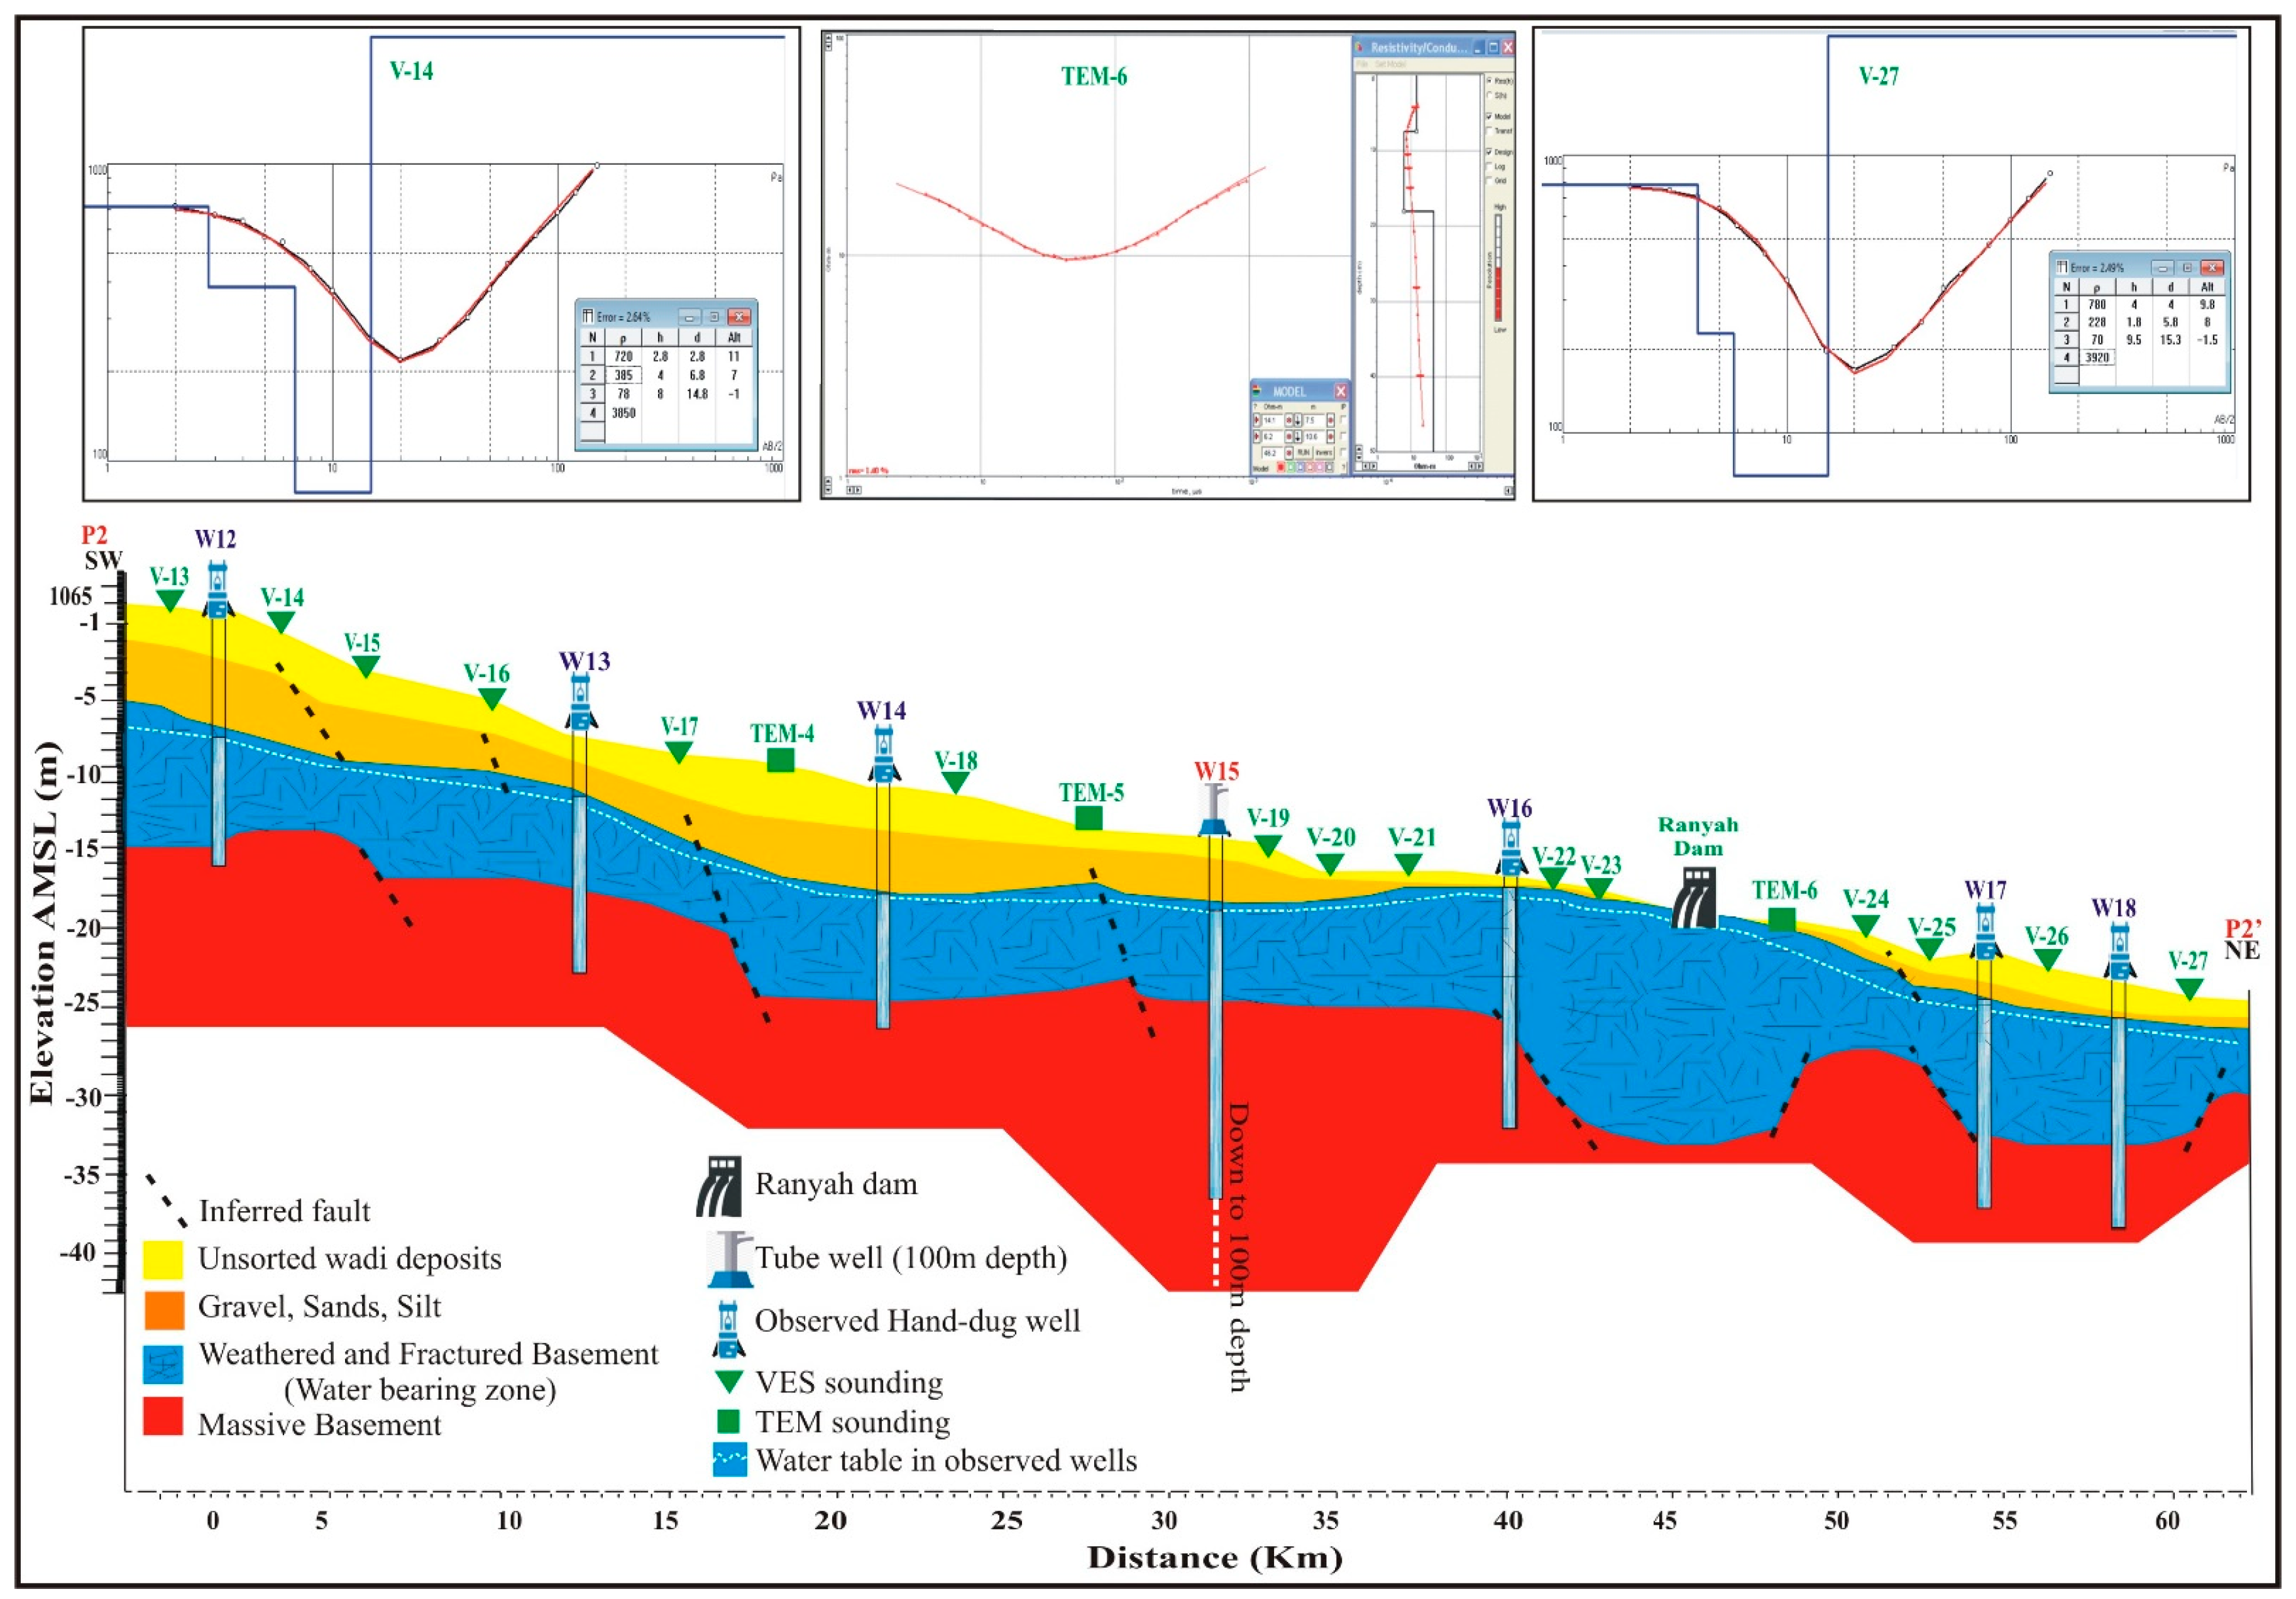
4.3. Resistivity Results
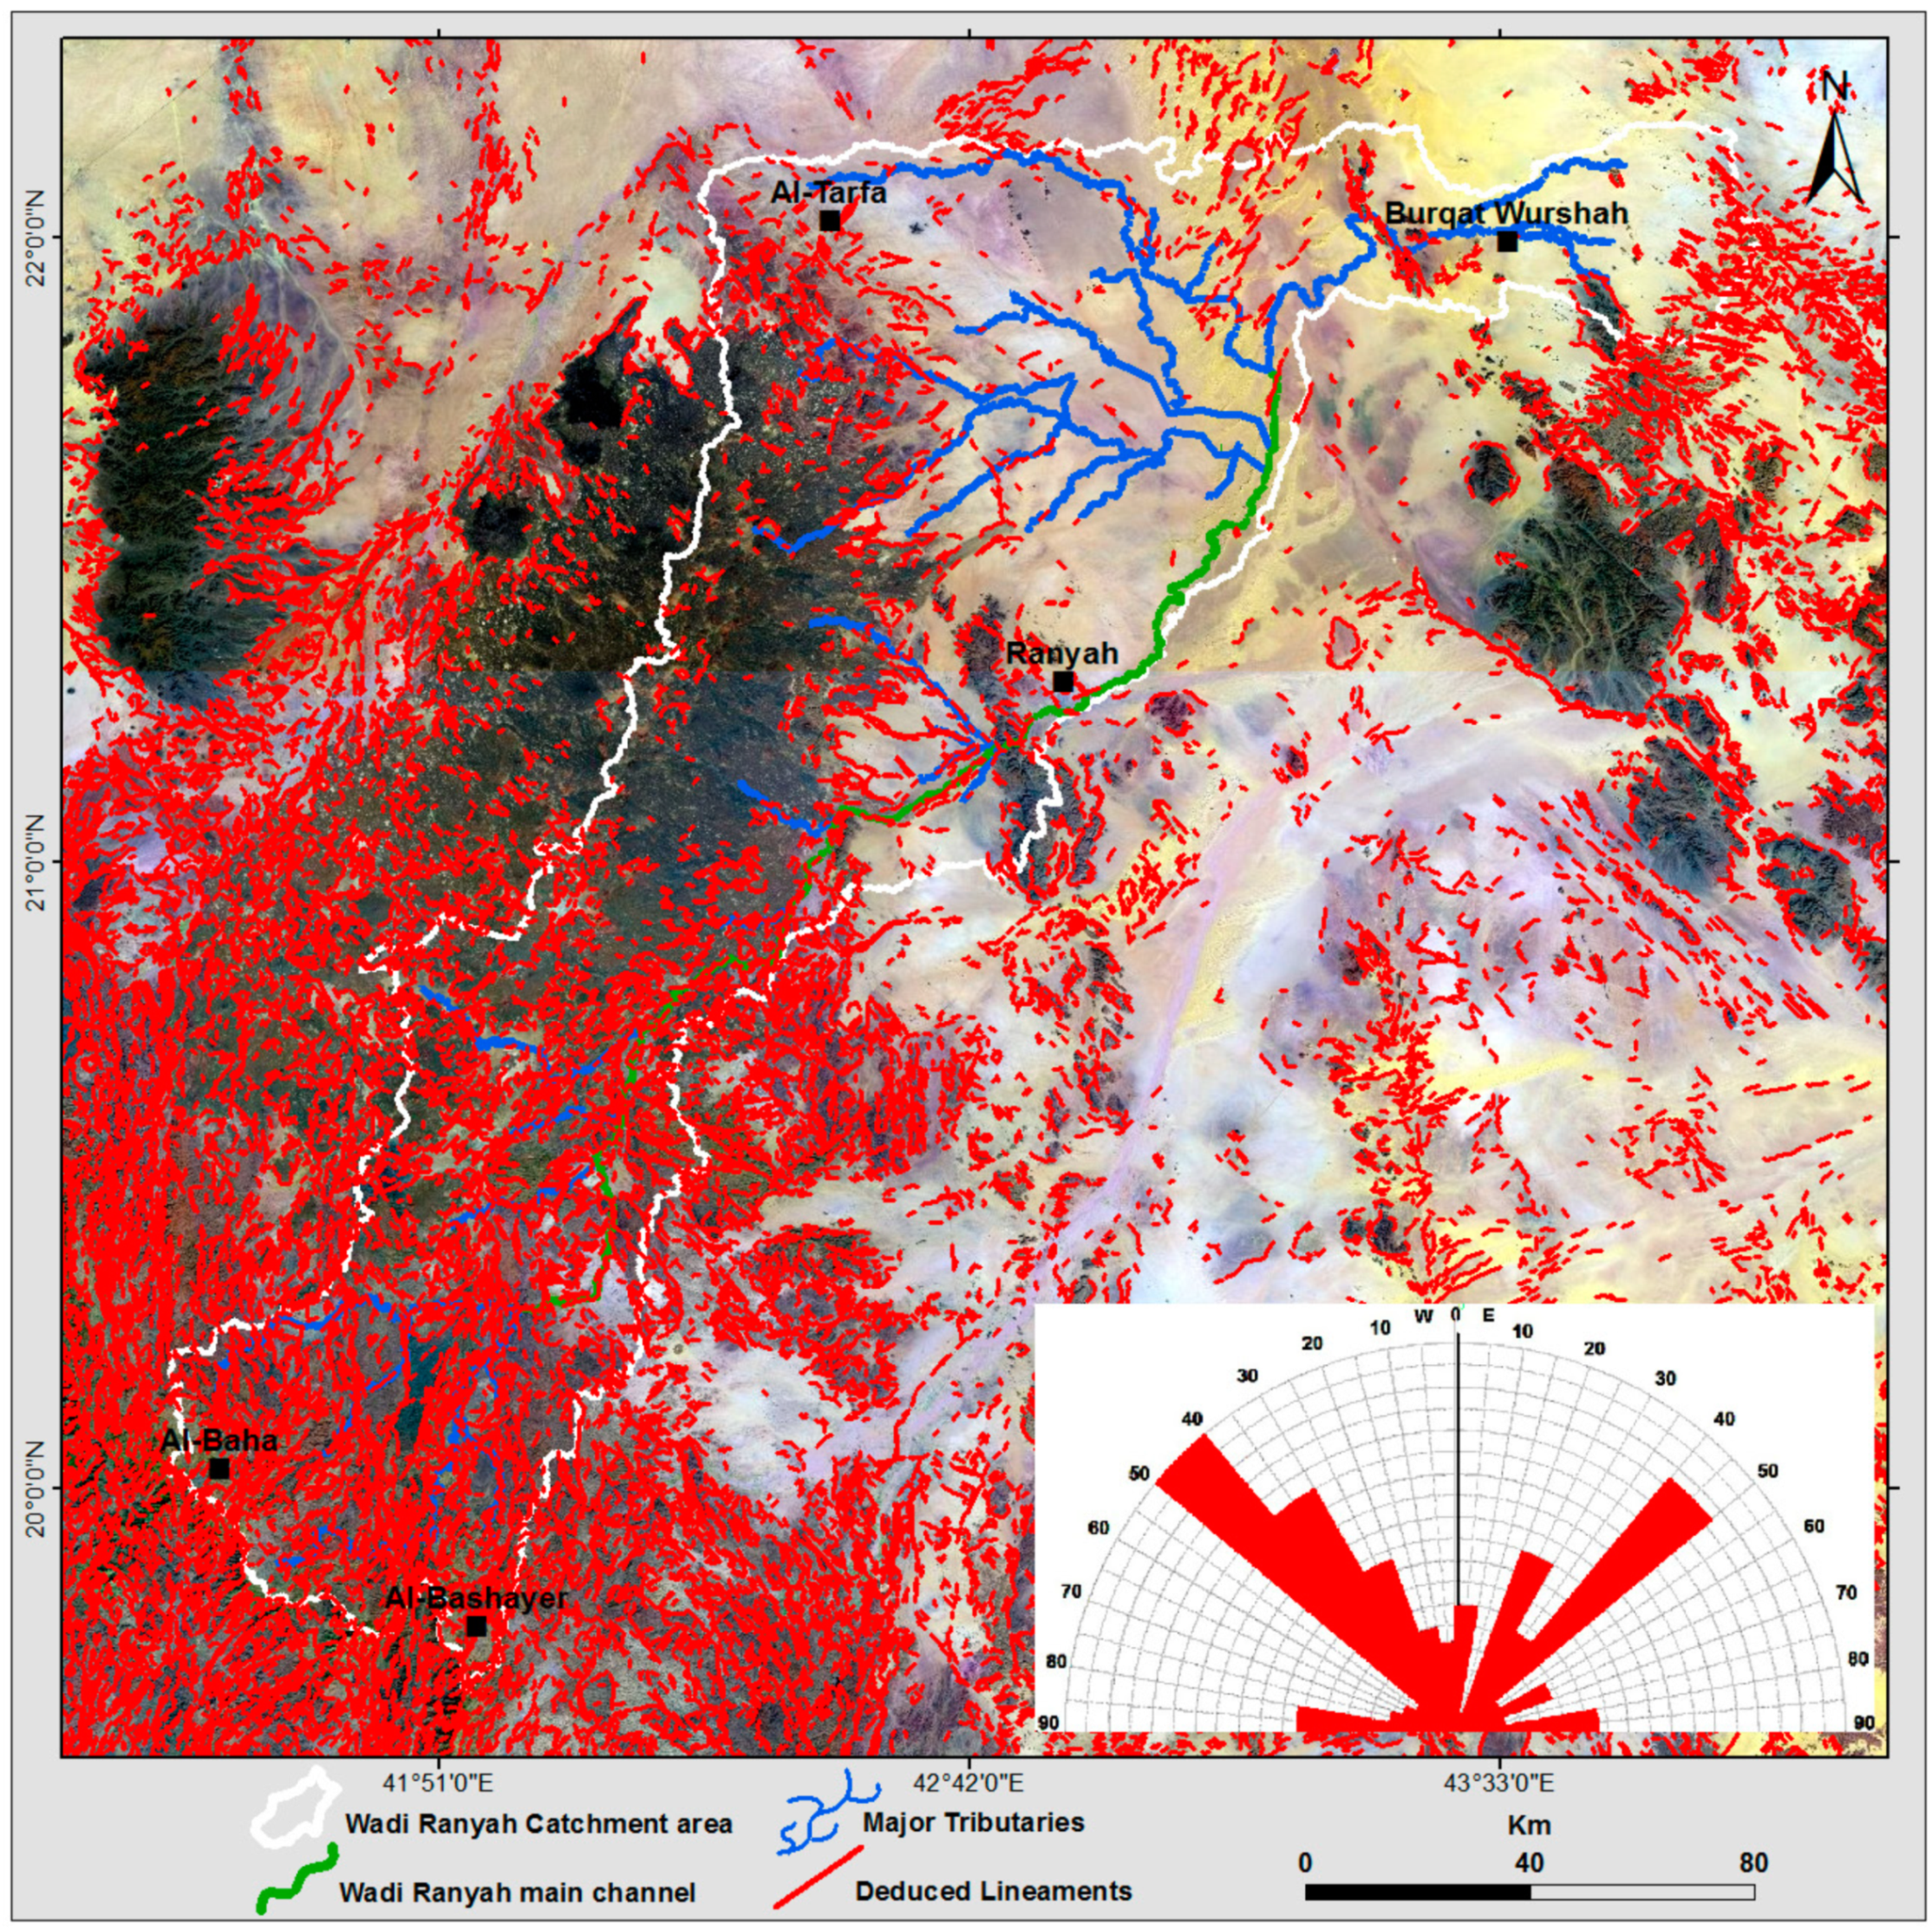
4.4. Impact of Structural Elements on the Groundwater Flow and Accumulation
4.5. Hydrogeology and Surface Water
4.6. Integration of Geophysical Data and Existing Drilled Boreholes
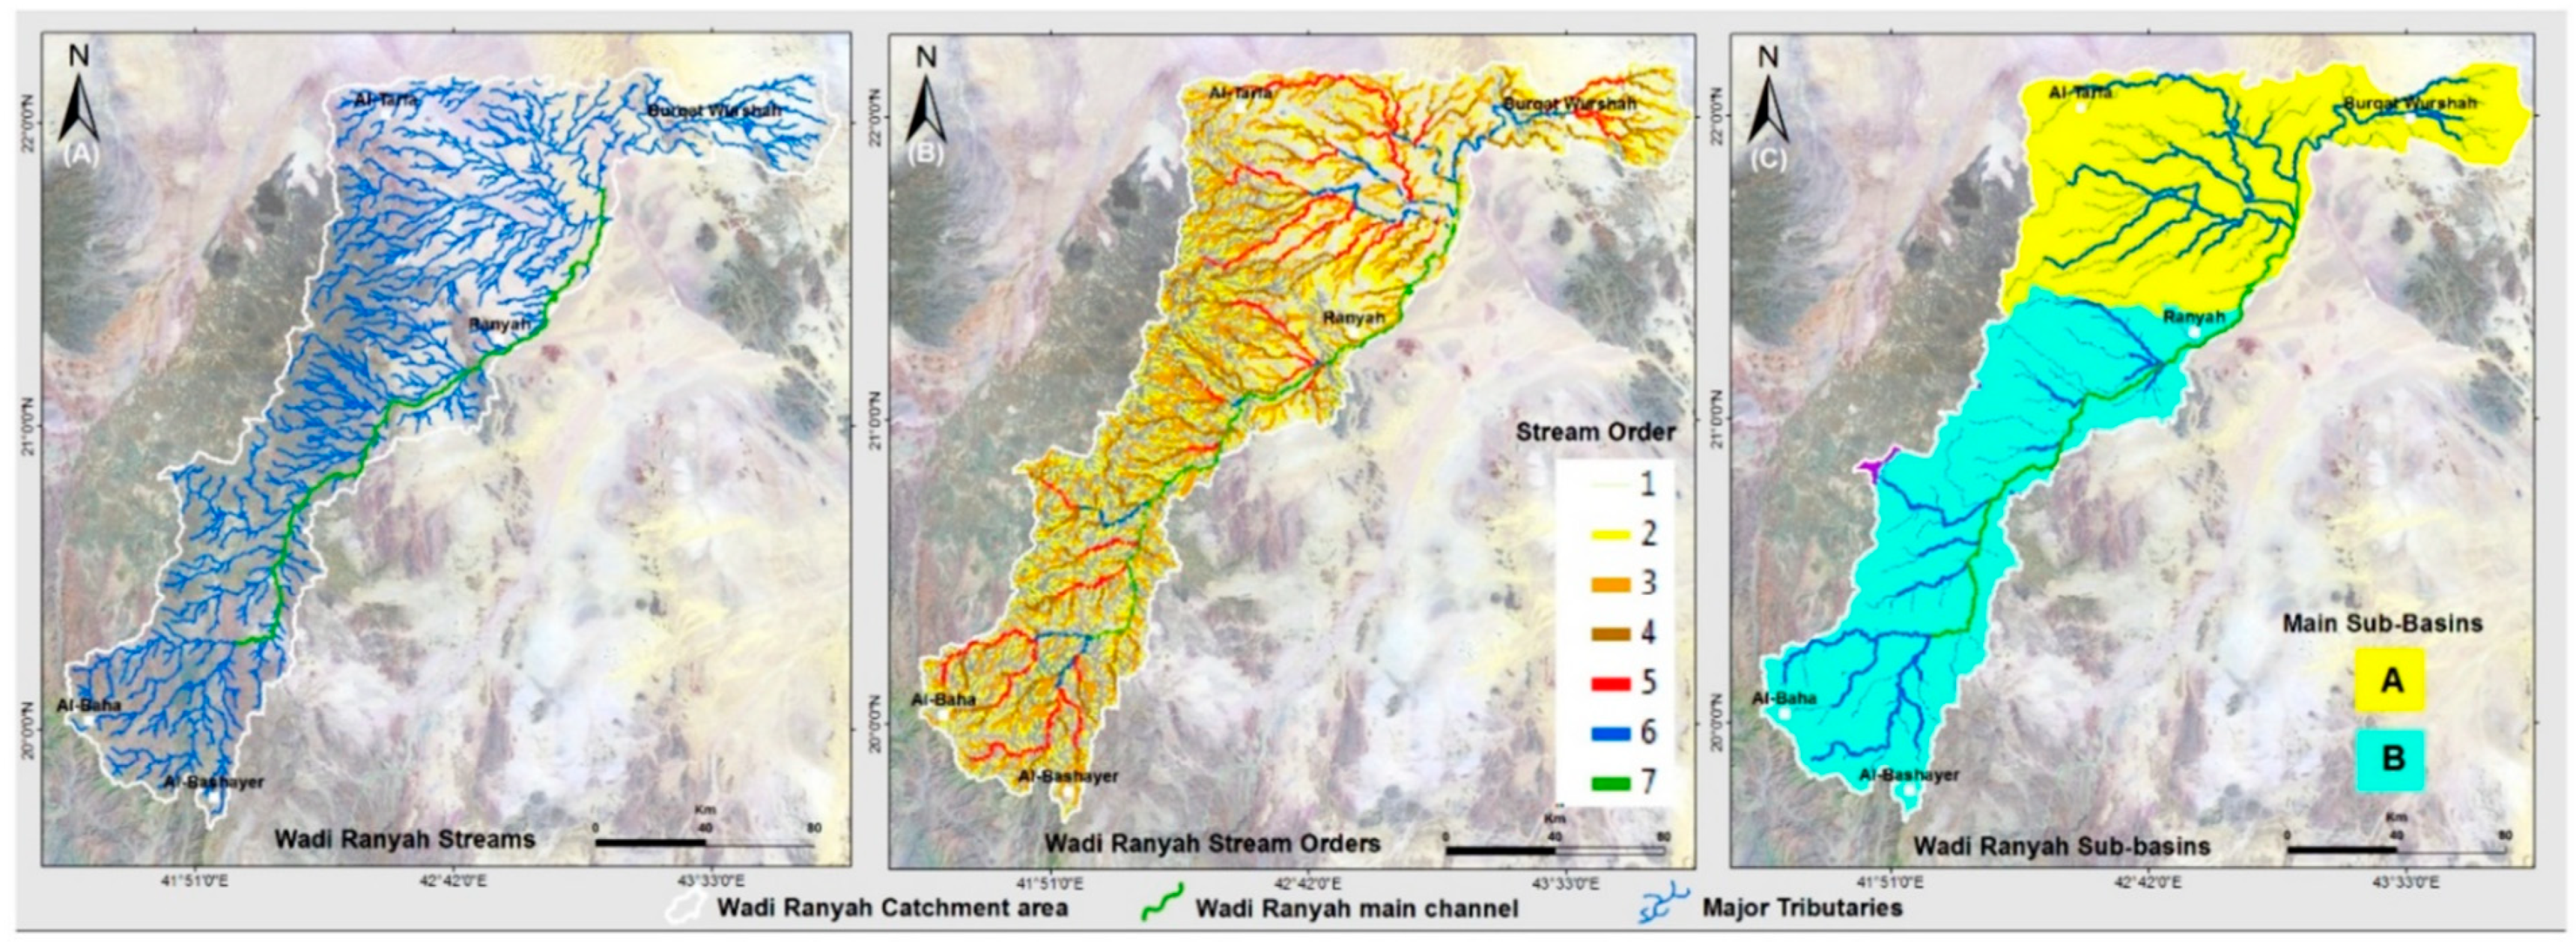
4.7. Stream Networks
4.8. Comparison with Previous Investigations
5. Conclusions
Author Contributions
Funding
Data Availability Statement
Acknowledgments
Conflicts of Interest
References
- Vorosmarty, C.J.; Green, P.; Salisbury, J.; Lammers, R.B. Global Water Resources Vulnerability from Climate Change and Pop-477 ulation Growth. Science 2000, 289, 284–288. [Google Scholar] [CrossRef] [Green Version]
- Immerzeel, W.W.; Beek, L.P.H.v.; Bierkens, M.F.P. Climate change will affect the Asian water towers. Science 2010, 28, 1382–1385. [Google Scholar] [CrossRef] [PubMed]
- Wang, S.; Zhang, M.; Crawford, J.; Hughes, C.E.; Du, M.; Liu, X. The effect of moisture source and synoptic conditions on precipitation isotopes in arid central Asia. J. Geophys. Res. Atmos. 2017, 122, 2667–2682. [Google Scholar] [CrossRef]
- Aljeddani, S.M.A. Forecasting temperature of the Saudi Arabian Province of Makkah using a discrete state–space modeling approach. J. Umm Al-Qura Univ. Eng. Archit 2023. [Google Scholar] [CrossRef]
- Rajaee, T.; Ebrahimi, H.; Nourani, V. A review of the artificial intelligence methods in groundwater level modeling. J. Hydrol. 2019, 572, 336–351. [Google Scholar] [CrossRef]
- Wada, Y.; Van Beek, L.P.; Van Kempen, C.M.; Reckman, J.W.; Vasak, S.; Bierkens, M.F. Global depletion of groundwater re-670 sources. Geophys. Res. Lett. 2010, 37, L20402. [Google Scholar] [CrossRef] [Green Version]
- Scanlon, B.R.; Healy, R.W.; Cook, P.G. Choosing appropriate techniques for quantifying groundwater recharge. Hydrogeol. J. 2002, 10, 18–39. [Google Scholar] [CrossRef]
- de Vries, J.J.; Simmers, I. Groundwater recharge: An overview of process and challenges. Hydrogeol. J. 2002, 10, 5–17. [Google Scholar] [CrossRef]
- Milewski, A.; Sultan, M.; Yan, E.; Becker, R.; Abdeldayem, A.; Soliman, F.; Gelil, K.A. A remote sensing solution for estimating runoff and recharge in arid environments. J. Hydrol. 2009, 373, 1–14. [Google Scholar] [CrossRef]
- Wang, J.; Song, C.; Reager, J.T.; Yao, F.; Famiglietti, J.S.; Sheng, Y.; MacDonald, G.M.; Brun, F.; Schmied, H.M.; Marston, R.A.; et al. Recent global decline in endorheic basin water storages. Nat. Geosci. 2018, 11, 926–932. [Google Scholar] [CrossRef] [Green Version]
- Mohamed, A.; Ahmed, E.; Alshehri, F.; Abdelrady, A. The groundwater flow behavior and the recharge in the Nubian Sandstone Aquifer System during the wet and arid periods. Sustainability 2022, 14, 6823. [Google Scholar] [CrossRef]
- Mohamed, A.; Asmoay, A.; Alshehri, F.; Abdelrady, A.; Othman, A. Hydro-geochemical applications and multivariate analysis to assess the water–rock interaction in arid environments. Appl. Sci. 2022, 12, 6340. [Google Scholar] [CrossRef]
- Mohamed, A.; Sultan, M.; Ahmed, M.; Yan, E.; Ahmed, E. Aquifer recharge, depletion, and connectivity: Inferences from GRACE, land surface models, and geochemical and geophysical data. Bull. Geol. Soc. Am. 2017, 129, 534–546. [Google Scholar] [CrossRef] [Green Version]
- Mohanty, S.; Jha, M.K.; Kumar, A.; Sudheer, K. Artificial neural network modeling for groundwater level forecasting in a river 678 island of eastern India. Water Resour. Manag. 2010, 24, 1845–1865. [Google Scholar] [CrossRef]
- Wagena, M.B.; Goering, D.; Collick, A.S.; Bock, E.; Fuka, D.R.; Buda, A.; Easton, Z.M. Comparison of short-term streamflow 680 forecasting using stochastic time series, neural networks, process-based, and Bayesian models. Environ. Model. Softw. 2020, 126, 104669. [Google Scholar] [CrossRef]
- Su, T.; Miao, C.; Duan, Q.; Gou, J.; Guo, X.; Zhao, X. Hydrological response to climate change and human activities in the Three-River Source Region. Hydrol. Earth Syst. Sci. Discuss. 2022; in review. [Google Scholar] [CrossRef]
- Oberndorfer, H.; Miiller, J.; Rummel, R.; Sneeuw, N. A simulation tool for the new gravity field satellite missions. Adv. Space Res. 2002, 30, 227–232. [Google Scholar] [CrossRef]
- Swenson, S.; Wahr, J. Methods for inferring regional surface-mass anomalies from Gravity Recovery and Climate Experiment 494 (GRACE) measurements of time-variable gravity. J. Geophys. Res. 2002, 107, 2193. [Google Scholar] [CrossRef] [Green Version]
- Chao, B.F.; Liau, J.R. Gravity Changes Due to Large Earthquakes Detected in GRACE Satellite Data via Empirical Orthogonal 496 Function Analysis. J. Geophys. Res. Solid Earth 2019, 124, 3024–3035. [Google Scholar] [CrossRef]
- Tang, L.; Li, J.; Chen, J.; Wang, S.-Y.; Wang, R.; Hu, X. Seismic Impact of Large Earthquakes on Estimating Global Mean Ocean 500 Mass Change from GRACE. Remote Sens. 2020, 12, 935. [Google Scholar] [CrossRef] [Green Version]
- Velicogna, I.; Wahr, J. Measurements of Time Variable Gravity Show Mass Loss in Antarctica. Science 2006, 311, 1754–1756. [Google Scholar] [CrossRef] [Green Version]
- Luthcke, S.B.; Zwally, H.J.; Abdalati, W.; Rowlands, D.D.; Ray, R.D.; Nerem, R.S.; Lemoine, F.G.; McCarthy, J.J.; Chinn, D.S. Recent Greenland ice mass loss by drainage system from satellite gravity observations. Science 2006, 314, 1286–1289. [Google Scholar] [CrossRef] [PubMed] [Green Version]
- Mohamed, A.; Sultan, M.; Yan, E.; Ahmed, E.; Sturchio, N.C. Towards a Better Understanding of the Hydrologic Setting of the Nubian Sandstone Aquifer System: Inferences from Groundwater Flow Models, CL-36 Ages, and GRACE Data. 2015. AGU Fall Meeting Abstracts, San Francisco. Available online: https://www.researchgate.net/publication/289538910_Towards_a_better_understanding_of_the_hydrologic_setting_of_the_Nubian_Sandstone_Aquifer_System_Inferences_from_groundwater_flow_models_Cl-36_ages_and_GRACE_data (accessed on 16 March 2023).
- Fallatah, O.A.; Ahmed, M.; Save, H.; Akanda, A.S. Quantifying Temporal Variations in Water Resources of a Vulnerable Middle Eastern Transboundary Aquifer System. Hydrol. Process 2017, 31, 4081–4091. [Google Scholar] [CrossRef]
- Fallatah, O.A.; Ahmed, M.; Cardace, D.; Boving, T.; Akanda, A.S. Assessment of Modern Recharge to Arid Region Aquifers Using an Integrated Geophysical, Geochemical, and Remote Sensing Approach. J. Hydrol. 2019, 569, 600–611. [Google Scholar] [CrossRef]
- Mohamed, A. Gravity based estimates of modern recharge of the Sudanese area. J. Afr. Earth Sci. 2020, 163, 103740. [Google Scholar] [CrossRef]
- Mohamed, A. Gravity applications to groundwater storage variations of the Nile Delta Aquifer. J. Appl. Geophys. 2020, 182, 104177. [Google Scholar] [CrossRef]
- Mohamed, A.; Ragaa Eldeen, E.; Abdelmalik, K. Gravity based assessment of spatio-temporal mass variations of the groundwater resources in the Eastern Desert, Egypt. Arab. J. Geosci. 2021, 14, 500. [Google Scholar] [CrossRef]
- Mohamed, A.; Gonçalvès, J. Hydro-geophysical monitoring of the North Western Sahara Aquifer System’s groundwater resources using gravity data. J. Afr. Earth Sci. 2021, 178, 104188. [Google Scholar] [CrossRef]
- Alshehri, F.; Mohamed, A. Analysis of Groundwater Storage Fluctuations Using GRACE and Remote Sensing Data in Wadi As-Sirhan, Northern Saudi Arabia. Water 2023, 15, 282. [Google Scholar] [CrossRef]
- Mohamed, A. Hydro-geophysical study of the groundwater storage variations over the Libyan area and its connection to the Dakhla basin in Egypt. J. Afr. Earth Sci. 2019, 157, 103508. [Google Scholar] [CrossRef]
- Mohamed, A. Gravity applications in estimating the mass variations in the Middle East: A case study from Iran. Arab. J. Geosci. 2020, 13, 364. [Google Scholar] [CrossRef]
- Othman, A.; Abdelrady, A.; Mohamed, A. Monitoring Mass Variations in Iraq Using Time-Variable Gravity Data. Remote Sens. 2022, 14, 3346. [Google Scholar] [CrossRef]
- Mohamed, A.; Abdelrahman, K.; Abdelrady, A. Application of Time-Variable Gravity to Groundwater Storage Fluctuations in Saudi Arabia. Front. Earth Sci. 2022, 10, 873352. [Google Scholar] [CrossRef]
- Mohamed, A.; Faye, C.; Othman, A.; Abdelrady, A. Hydro-geophysical Evaluation of the Regional Variability of Senegal’s Terrestrial Water Storage Using Time-Variable Gravity Data. Remote Sens. 2022, 14, 4059. [Google Scholar] [CrossRef]
- Mohamed, A.; Abdelrady, A.; Alarifi, S.S.; Othman, A. Geophysical and Remote Sensing Assessment of Chad’s Groundwater Resources. Remote Sens. 2023, 15, 560. [Google Scholar] [CrossRef]
- Taha, A.I.; Al Deep, M.; Mohamed, A. Investigation of groundwater occurrence using gravity and electrical resistivity methods: A case study from Wadi Sar, Hijaz Mountains, Saudi Arabia. Arab. J. Geosci. 2021, 14, 334. [Google Scholar] [CrossRef]
- Mohamed, A.; Al Deep, M.; Othman, A.; Taha, A.L.; Alshehri, F.; Abdelrady, A. Integrated Geophysical Assessment of groundwater potential in southwestern Saudi Arabia. Front. Earth Sci. 2022, 10, 937402. [Google Scholar] [CrossRef]
- Wang, Z.; Zhang, B.; Jiang, W.; Che, G. Ocean Mass Variations in the South China Sea Inferred from Satellite Altimetry, GRACE, Oceanographic and Meteorological Data. Geomat. Inf. Sci. Wuhan Univ. 2018, 508, 571–578, (In Chinese Abstract). [Google Scholar]
- Royston, S.; Dutt Vishwakarma, B.; Westaway, R.; Rougier, J.; Sha, Z.; Bamber, J. Can We Resolve the Basin-Scale Sea Level 512 Trend Budget from GRACE Ocean Mass? J. Geophys. Res. Ocean. 2020, 125, e2019JC015535. [Google Scholar] [CrossRef] [Green Version]
- Rodell, M.; Famiglietti, J.S.; Wiese, D.N.; Reager, J.T.; Beaudoing, H.K.; Landerer, F.W.; Lo, M.H. Emerging trends in global freshwater availability. Nature 2018, 557, 651–659. [Google Scholar] [CrossRef]
- Amery, H.A.; Wolf, A.T. Water in the Middle East: A Geography of Peace; University of Texas Press: Austin, TX, USA, 2000. [Google Scholar]
- Wolf, A.T.; Newton, J.T. Case Study Transboundary Dispute Resolution: The Tigris-Euphrates Basin. Oregon State University, Transboundary Freshwater Dispute Database (TFDD). 2007. Available online: http://www.transboundarywaters.orst.edu/ (accessed on 7 December 2022).
- Wolf, A. Conflict and cooperation along international waterways. Water Policy 1998, 1, 251–265. [Google Scholar] [CrossRef]
- Al-Ibrahim, A.A. Excessive use of groundwater resources in Saudi Arabia: Impacts and policy options. AMBIO 1992, 20, 34–37. [Google Scholar]
- FAO. Saudi Arabia. Irrigation in the Middle East regions in figures. Aquastat Survey, 2008. In FAO Land and Water Division Report 34; Freken, K., Ed.; FAO: Rome, Italy, 2009; pp. 325–337. [Google Scholar]
- Hassan, R.A.; Almatani, T.U. Assessment of radon levels in groundwater in the city of Makkah, KSA. J. Umm Al-Qura Univ. Appl. Sci. 2022, 8, 2–7. [Google Scholar] [CrossRef]
- Ouda, O.K.M. Water demand versus supply in Saudi Arabia: Current and future challenges. Int. J. Water Resour. Dev. 2014, 30, 335–344. [Google Scholar] [CrossRef]
- General Authority of Statistics, Sustainable Development Goals in the Kingdom of Saudi Arabia. Report; 2019. Available online: https://www.stats.gov.sa/ (accessed on 7 December 2022).
- Water Challenges in KSA. Fanack Water. 20 June 2021. Available online: water.fanack.com/saudi-arabia/water-challenges-in-ksa (accessed on 7 December 2022).
- Dahlin, T.; Bjelm, L.; Svensson, C. Use of Electrical Imaging in Site Investigations for a Railway Tunnel through the Hallandsås Horst, Sweden. Q. J. Eng. Geol. Hydrogeol. 1999, 32, 163–172. [Google Scholar] [CrossRef] [Green Version]
- Muchingami, I.; Hlatywayo, D.J.; Nel, J.M.; Chuma, C. Electrical resistivity survey for groundwater investigations and shallow subsurface evaluation of the basaltic-greenstone formation of the urban Bulawayo aquifer. Phys. Chem. Earth 2012, 50–52, 44–51. [Google Scholar] [CrossRef]
- Reynolds, J.M. An Introduction to Applied and Environmental Geophysics; John Wiley and Sons Ltd.: Chichester, UK, 1997; 796p. [Google Scholar]
- Choudhury, K.; Saha, D.K.; Chakraborty, P. Geophysical Study for Saline Water Intrusion in a Coastal Alluvial Terrain. J. Appl. Geophys. 2001, 46, 189–200. [Google Scholar] [CrossRef]
- Frohlich, R.K.; Kelly, W.E. Estimates of Specific Yield with the Geoelectric Resistivity Method in Glacial Aquifers. J. Hydrol. 1988, 97, 33–44. [Google Scholar] [CrossRef]
- Troisi, S.; Fallico, C.; Straface, S.; Migliari, E. Application of Kriging with External Drift to Estimate Hydraulic Conductivity from Electrical-Resistivity Data in Unconsolidated Deposits Near Montalto Uffugo, Italy. Hydrogeol. J. 2000, 8, 356–367. [Google Scholar] [CrossRef]
- Kessels, W.; Flentge, I.; Kolditz, H. Dc Geoelectric Sounding to Determine Water Content in the Salt Mine Asse (FRG). Geophys. Prospect. 1985, 33, 446–456. [Google Scholar] [CrossRef]
- Raju, N.; Reddy, T. Fracture pattern and electrical resistivity studies for groundwater exploration. Environ. Geol. 1998, 34, 175–182. [Google Scholar] [CrossRef]
- Chandra, S.; Nagaiah, E.; Reddy, D.V.; Rao, V.A.; Ahmed, S. Exploring Deep Potential Aquifer in Water Scarce Crystalline Rocks. J. Earth Syst. Sci. 2012, 121, 1455–1468. [Google Scholar] [CrossRef] [Green Version]
- ALDeep, M.; Araffa, S.A.S.; Mansour, S.A.; Taha, A.I.; Mohamed, A.; Othman, A. Geophysics and remote sensing applications for groundwater exploration in fractured basement: A case study from Abha area, Saudi Arabia. J. Afr. Earth Sci. 2021, 184, 104368. [Google Scholar] [CrossRef]
- Karlik, G.; Kaya, M.A. Investigation of Groundwater Contamination Using Electric and Electromagnetic Methods at an Open Waste Disposal Site: A Case Study from Isparta, Turkey. Environ. Geol. 2001, 40, 725–731. [Google Scholar] [CrossRef]
- Ebong, E.D.; Akpan, A.E.; Onwuegbuche, A.A. Estimation of Geohydraulic Parameters from Fractured Shales and Sandstone Aquifers of Abi (Nigeria) Using Electrical Resistivity and Hydrogeologic Measurements. J. Afr. Earth Sci. 2014, 96, 99–109. [Google Scholar] [CrossRef]
- Christiansen, A.V.; Auken, E.; Sorensen, K. The Transient Electromagnetic Method. In Groundwater Geophysics—A Tool for Hydrogeology; Kirsch, R., Ed.; GSW Ltd.: Aarhus, Denmark, 2006; pp. 179–225. [Google Scholar] [CrossRef]
- Brown, G.F.; Jackson, R.O. Geologic Map of the Asir Quadrangle, Kingdom of Saudi Arabia. In U.S. Geological Survey Miscellaneous Geologic Investigations Map I-217A: Scale: 1:500,000; 1979. USGS Publications Warehouse. Available online: http://pubs.er.usgs.gov/publication/i217A (accessed on 7 December 2022).
- Gao, F.; Wang, H.; Liu, C. Long-term assessment of groundwater resources carrying capacity using GRACE data and Budyko 760 model. J. Hydrol. 2020, 58, 125042. [Google Scholar] [CrossRef]
- Save, H.; Bettadpur, S.; Tapley, B.D. High-resolution CSR GRACERL05 Mascons. J. Geophys. Res. Solid Earth 2016, 121, 7547–7569. [Google Scholar] [CrossRef]
- Save, H. CSR GRACE and GRACE-FO RL06 Mascon Solutions v02. Mascon Solut. 2020, 12, 24. [Google Scholar] [CrossRef]
- Watkins, M.M.; Wiese, D.N.; Yuan, D.-N.; Boening, C.; Landerer, F.W. Improved methods for observing Earth’s time variable mass distribution with GRACE using spherical cap mascons. J. Geophys. Res. Solid Earth 2015, 120, 2648–2671. [Google Scholar] [CrossRef]
- Wiese, D.N.; Landerer, F.W.; Watkins, M.M. Quantifying and reducing leakage errors in the JPL RL05M GRACE mascon solution. Water Resour. Res. 2016, 52, 7490–7502. [Google Scholar] [CrossRef]
- Landerer, F.W.; Flechtner, F.M.; Save, H.; Webb, F.H.; Bandikova, T.; Bertiger, W.I.; Bettadpur, S.V.; Byun, S.H.; Dahle, C.; Dobslaw, H.; et al. Extending the Global Mass Change Data Record: GRACE Follow-On Instrument and Science Data Performance. Geophys. Res. Lett. 2020, 47, e2020GL088306. [Google Scholar] [CrossRef]
- Luthcke, S.B.; Sabaka, T.J.; Loomis, B.D.; Arendt, A.A.; McCarthy, J.J.; Camp, J. Antarctica, Greenland, and Gulf of Alaska land-ice evolution from an iterated GRACE global mascon solution. J. Glaciol. 2013, 59, 216. [Google Scholar] [CrossRef]
- Ahmed, M.; Abdelmohsen, K. Quantifying modern recharge and depletion rates of the Nubian aquifer in Egypt. Surv. Geophys. 2018, 39, 729–751. [Google Scholar] [CrossRef]
- Shamsudduha, M.; Taylor, R.G.; Longuevergne, L. Monitoring groundwater storage changes in the highly seasonal humid tropics: Validation of GRACE measurements in the Bengal Basin. Water Resour. Res. 2012, 48, W02508. [Google Scholar] [CrossRef] [Green Version]
- Rodell, M.; Houser, P.R.; Jambor, U.; Gottschalck, J.; Mitchell, K.; Meng, C.-J.; Arsenault, K.; Cosgrove, B.; Radakovich, J.; Bosilovich, M.; et al. The Global Land Data Assimilation System. Bull. Am. Meteorol. Soc. 2004, 85, 381–394. [Google Scholar] [CrossRef] [Green Version]
- Akingboye, A.S.; Bery, A.A.; Kayode, J.S.; Asulewon, A.M.; Bello, R.; Agbasi, O.E. Near-Surface Crustal Architecture and Geohydrodynamics of the Crystalline Basement Terrain of Araromi, Akungba-Akoko, SW Nigeria, Derived from Multi-Geophysical Methods. Nat. Resour. Res. 2022, 31, 215–236. [Google Scholar] [CrossRef]
- McLachlan, P.; Blanchy, G.; Chambers, J.; Sorensen, J.; Uhlemann, S.; Wilkinson, P.; Binley, A. The application of electromagnetic induction methods to reveal the hydrogeological structure of a riparian wetland. Water Resour. Res. 2021, 57, e2020WR029221. [Google Scholar] [CrossRef]
- Ren, Z.; Kalscheuer, T. Uncertainty and Resolution Analysis of 2D and 3D Inversion Models Computed from Geophysical Electromagnetic Data. Surv. Geophys. 2020, 41, 47–112. [Google Scholar] [CrossRef] [Green Version]
- Constable, S.C.; Parker, R.L.; Constable, C.G. Occam’s inversion: A practical algorithm for generating smooth models from electromagnetic sounding data. Geophysics 1987, 52, 289–300. [Google Scholar] [CrossRef]
- Bobachev, A.A. IPI2WIN Program 2005, Version 3.1 2: 17. 10. 08 (1990–2008) Copyright al 1990; Programs set for VEs data interofretion. Dep. Geophysics, Geological Fac. Moseeow State VnV. Fussow, 119899. Available online: https://ijiset.com/vol2/v2s12/IJISET_V2_I12_59.pdf (accessed on 7 December 2022).
- TEM-Researcher Software, Version 7; Applied Electromagnetic Research (AEMR); The Netherlands, 2007. p. 49. Available online: https://scirp.org/reference/referencespapers.aspx?referenceid=1404300 (accessed on 7 December 2022).
- USGS. The United States Geological Survey, Earth Resources Observation and Science Data Centre (EROS). 2022. Available online: http://eros.usgs.gov (accessed on 7 December 2022).
- SRTM. National Aeronautics and Space Administration (NASA) Topography, Shuttle Radar Topography Mission. USA; 2013. Available online: https://www.usgs.gov/centers/eros/science/usgs-eros-archive-digital-elevation-shuttle-radar-topography-mission-srtm-1 (accessed on 7 December 2022).
- Jamal, S.; Ali, A. A comparative study of automatic drainage network extraction using ASTER GDEM, SRTM DEM and Cartosat-1 DEM in parts of Kosi basin, Bihar, India. J. Umm Al-Qura Univ. Eng. Archit. 2023. [Google Scholar] [CrossRef]
- Anwar, A.; Shawki, N.; Abdoh, G. Landsat ETM-7 for LineamentMappingUsing Automatic Extraction Technique in the SWPart of Taiz Area, Yemen. Glob. J. Hum. Soc. Sci. Geogr. Geo-Sci. Environ. Disaster Manag. 2013, 13, 35. [Google Scholar]
- Geomatica PCI; PCI Geomatics Enterprises, Inc.: Markham, ON, Canada, 2018; p. 6H3.
- ESRI. ArcGIS 10.5 Desktop; Environmental System Research Institute, Inc.: Redlands, CA, USA, 2017. [Google Scholar]
- Rodell, M.; Chen, J.; Kato, H.; Famiglietti, J.S.; Nigro, J.; Wilson, C.R. Estimating groundwater storage changes in the Mississippi River basin (USA) using GRACE. Hydrogeol. J. 2009, 15, 159–166. [Google Scholar] [CrossRef] [Green Version]
- Gonçalvès, J.; Petersen, J.; Deschamps, P.; Hamelin, B.; Baba-Sy, O. Quantifying the modern recharge of the “fossil” Sahara aquifers. Geophys. Res. Lett. 2013, 40, 2673–2678. [Google Scholar] [CrossRef]
- Bhanja, S.N.; Mukherjee, A.; Rodell, M. Groundwater storage variations in India. In Groundwater of South Asia; Mukherjee, A., Ed.; Springer: Singapore, 2018; pp. 49–59. [Google Scholar]
- World Health Organization (WHO). Guidelines for Drinking-Water Quality: Fourth Edition Incorporating the First and Second Addenda. 2022. Available online: https://www.who.int/publications/i/item/9789240045064 (accessed on 3 February 2023).
- Morsy, E.A.; Othman, A. Delineation of Shallow Groundwater Potential Zones Using Integrated Hydrogeophysical and Topographic Analyses, Western Saudi Arabia. J. King Saud Univ. Sci. 2021, 33, 101559. [Google Scholar] [CrossRef]
- Mohamed, A.; Al Deep, M. Depth to the Bottom of the Magnetic Layer, Crustal Thickness, and Heat Flow in Africa: Inferences from Gravity and Magnetic Data. J. Afr. Earth Sci. 2021, 179, 104204. [Google Scholar] [CrossRef]
- Mohamed, A.; Al Deep, M.; Abdelrahman, K.; Abdelrady, A. Geometry of the magma chamber and curie point depth beneath Hawaii Island: Inferences from magnetic and gravity data. Front. Earth Sci. 2022, 10, 847984. [Google Scholar] [CrossRef]
- Othman, A. Measuring and Monitoring Land Subsidence and Earth Fissures in Al-Qassim Region, Saudi Arabia: Inferences from InSAR. In Advances in Remote Sensing and Geo Informatics Applications, Proceedings of the Conference of the Arabian Journal of Geosciences, CAJG 2018, Hammamet, Tunisia, 12–15 November 2018; El-Askary, H., Lee, S., Heggy, E., Pradhan, B., Eds.; Advances in Science, Technology & Innovation (IEREK Interdisciplinary Series for Sustainable Development); Springer: Cham, Switzerland, 2019. [Google Scholar]


| Component (mm) | Entire Period | |
|---|---|---|
| GRACE Total (ΔTWS) | CSR | −3.94 ± 0.18 |
| GSFC | −3.99 ± 0.19 | |
| JPL | −3.62 ± 0.22 | |
| AVG | −3.85 ± 0.15 | |
| ΔSMS | −0.007 ± 0.002 | |
| ΔGWS | −3.85 ± 0.15 | |
| AAP | 100 | |
| Profile | P1–P1’ | P2–P2’ | P3–P3’ | |||
|---|---|---|---|---|---|---|
| Layer | Resistivity (Ω m) | Thickness (m) | Resistivity (Ω m) | Thickness (m) | Resistivity (Ω m) | Thickness (m) |
| 1st Layer (Upper) | 440–1020 | 1.5–4 | 235–850 | 2–4 | 345–985 | 3–4 |
| 2nd Layer | 310–980 | 2.5–5 | 225–760 | 4–4.5 | 275–740 | 2.5–5 |
| 3rd Layer | 40–120 | 3–7.5 | 65–105 | 9–16 | 55–115 | 8–16.5 |
| 4th Layer (Lower) | 850–5200 | - | 780–4050 | - | 800–7850 | - |
Disclaimer/Publisher’s Note: The statements, opinions and data contained in all publications are solely those of the individual author(s) and contributor(s) and not of MDPI and/or the editor(s). MDPI and/or the editor(s) disclaim responsibility for any injury to people or property resulting from any ideas, methods, instructions or products referred to in the content. |
© 2023 by the authors. Licensee MDPI, Basel, Switzerland. This article is an open access article distributed under the terms and conditions of the Creative Commons Attribution (CC BY) license (https://creativecommons.org/licenses/by/4.0/).
Share and Cite
Mohamed, A.; Othman, A.; Galal, W.F.; Abdelrady, A. Integrated Geophysical Approach of Groundwater Potential in Wadi Ranyah, Saudi Arabia, Using Gravity, Electrical Resistivity, and Remote-Sensing Techniques. Remote Sens. 2023, 15, 1808. https://doi.org/10.3390/rs15071808
Mohamed A, Othman A, Galal WF, Abdelrady A. Integrated Geophysical Approach of Groundwater Potential in Wadi Ranyah, Saudi Arabia, Using Gravity, Electrical Resistivity, and Remote-Sensing Techniques. Remote Sensing. 2023; 15(7):1808. https://doi.org/10.3390/rs15071808
Chicago/Turabian StyleMohamed, Ahmed, Abdullah Othman, Wael F. Galal, and Ahmed Abdelrady. 2023. "Integrated Geophysical Approach of Groundwater Potential in Wadi Ranyah, Saudi Arabia, Using Gravity, Electrical Resistivity, and Remote-Sensing Techniques" Remote Sensing 15, no. 7: 1808. https://doi.org/10.3390/rs15071808