
Drought Disasters in China from 1991 to 2018: Analysis of Spatiotemporal Trends and Characteristics
 , , ,
, , , 
Abstract
:1. Introduction
2. Study Area, Data, and Methods
2.1. Study Area
2.2. Data Sources
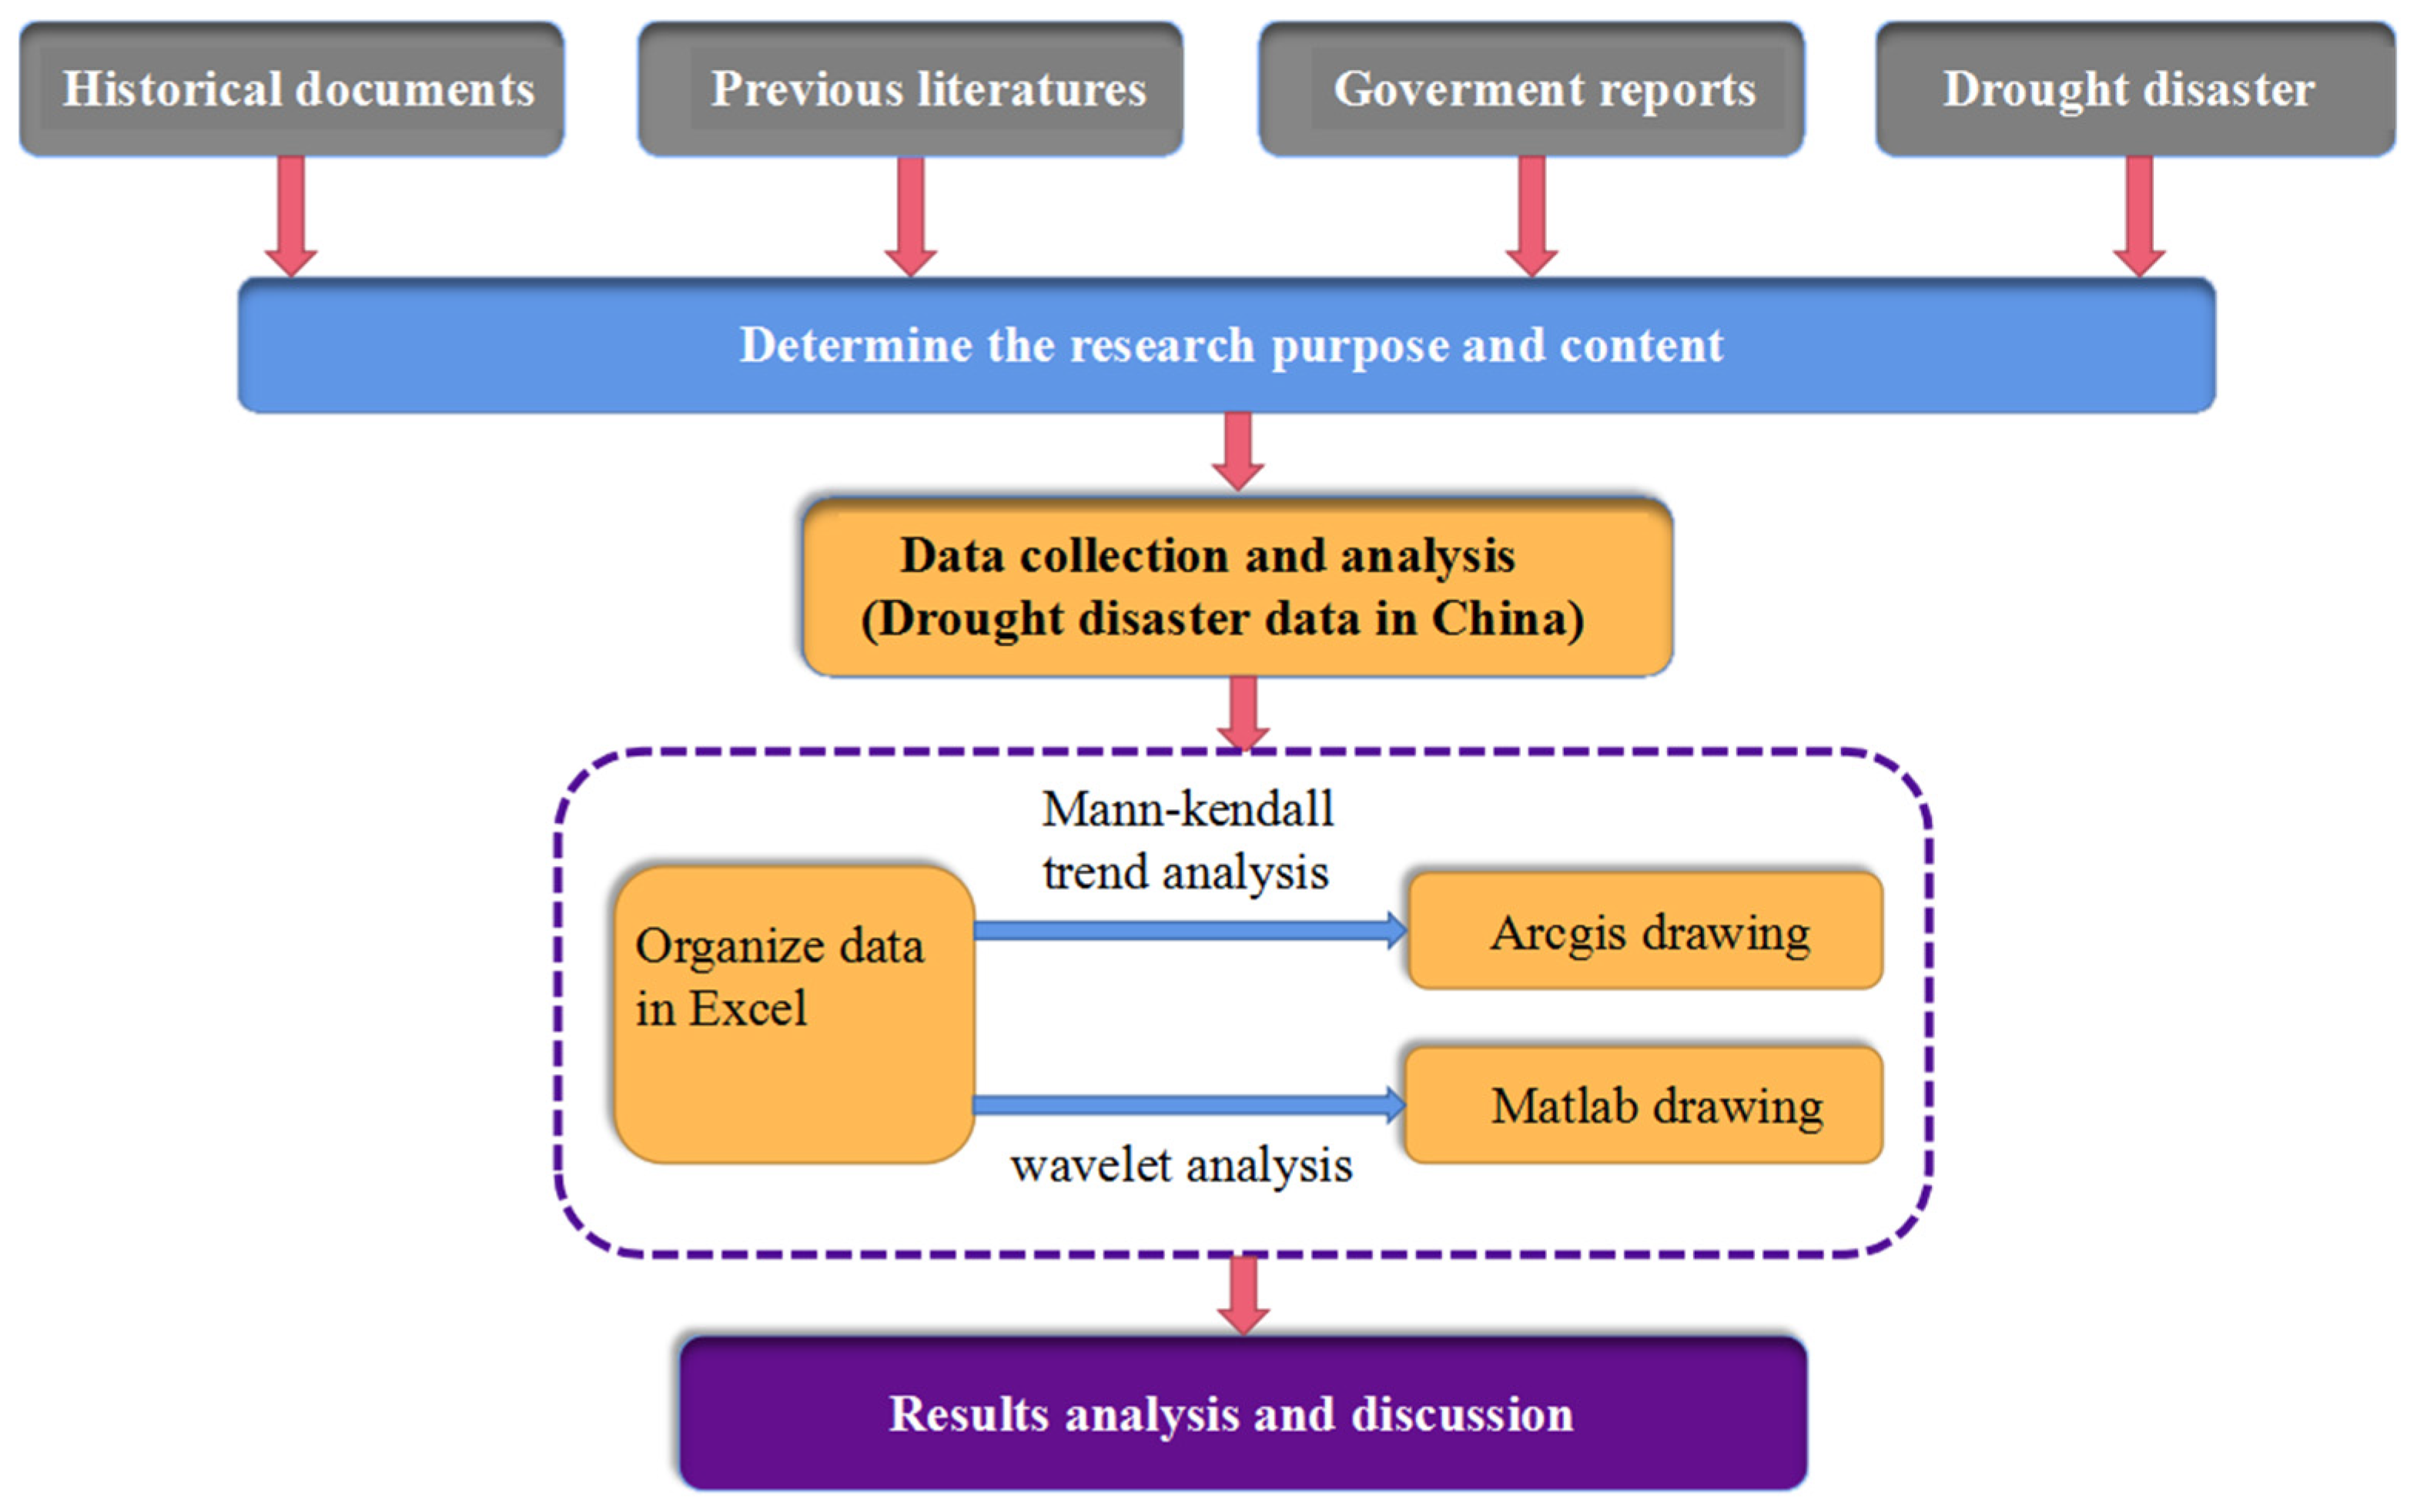
2.3. Methods
2.3.1. M-K Trend Analysis
2.3.2. Wavelet Analysis
3. Results
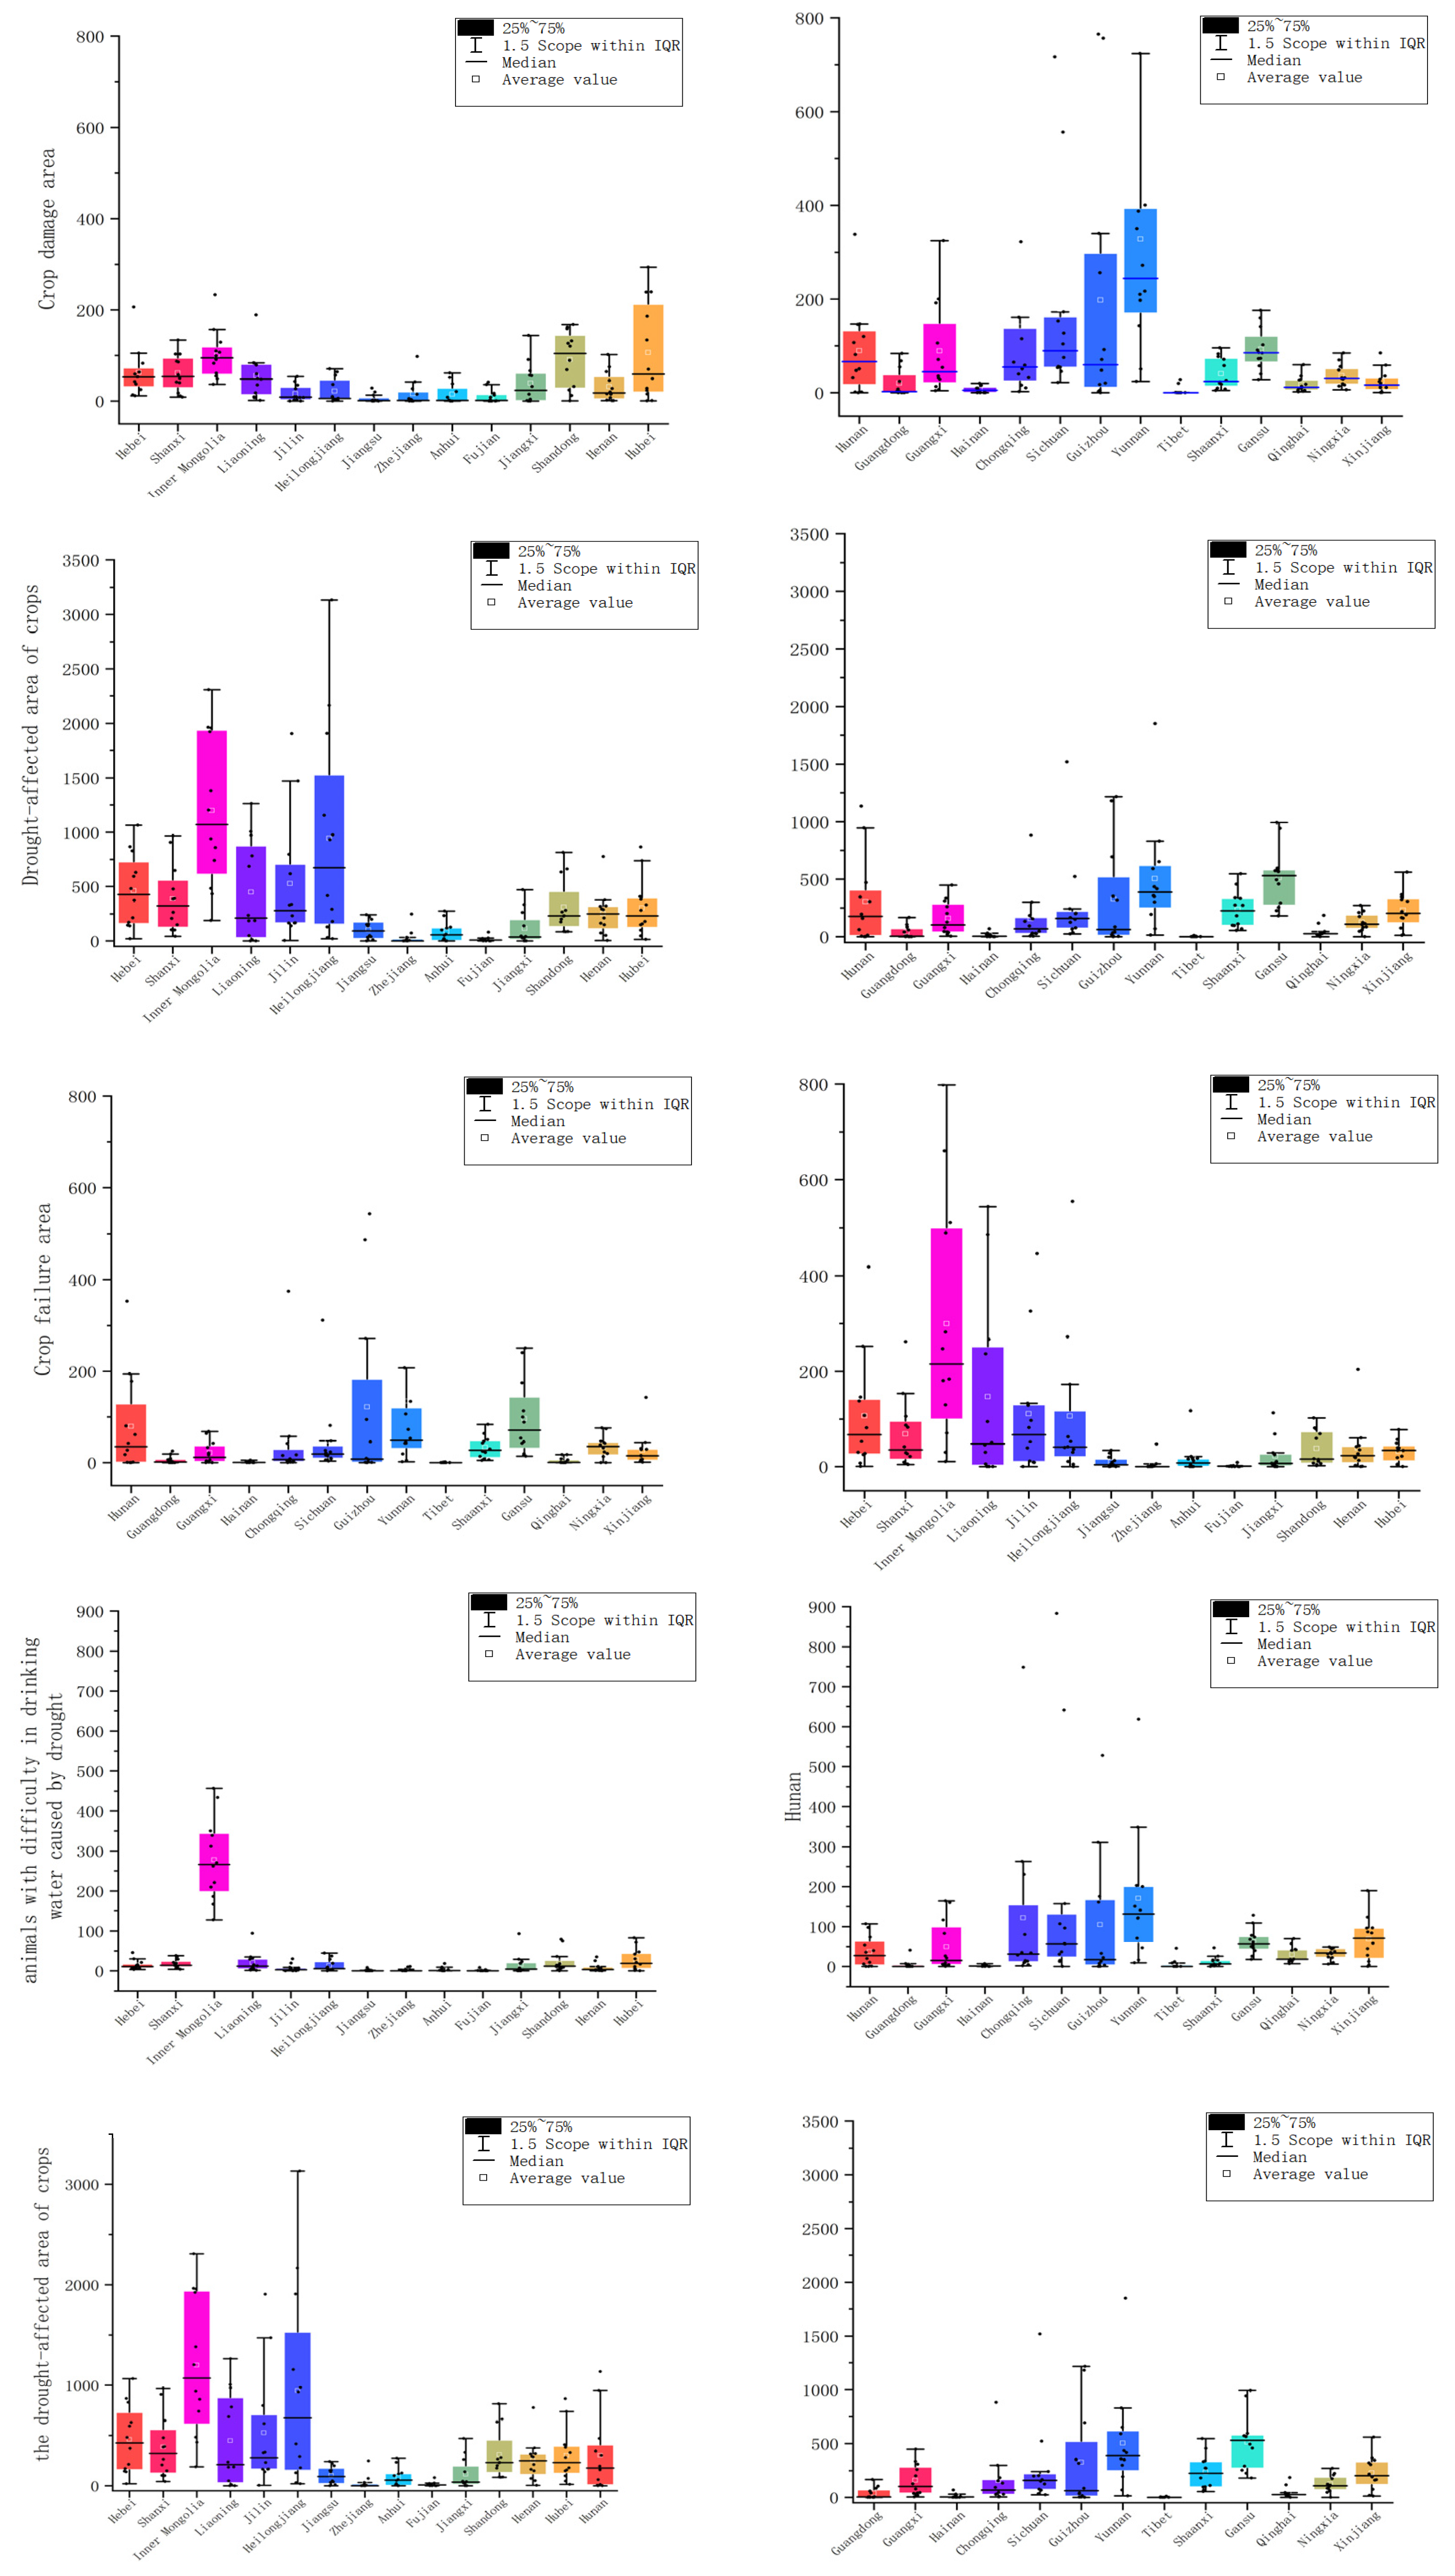
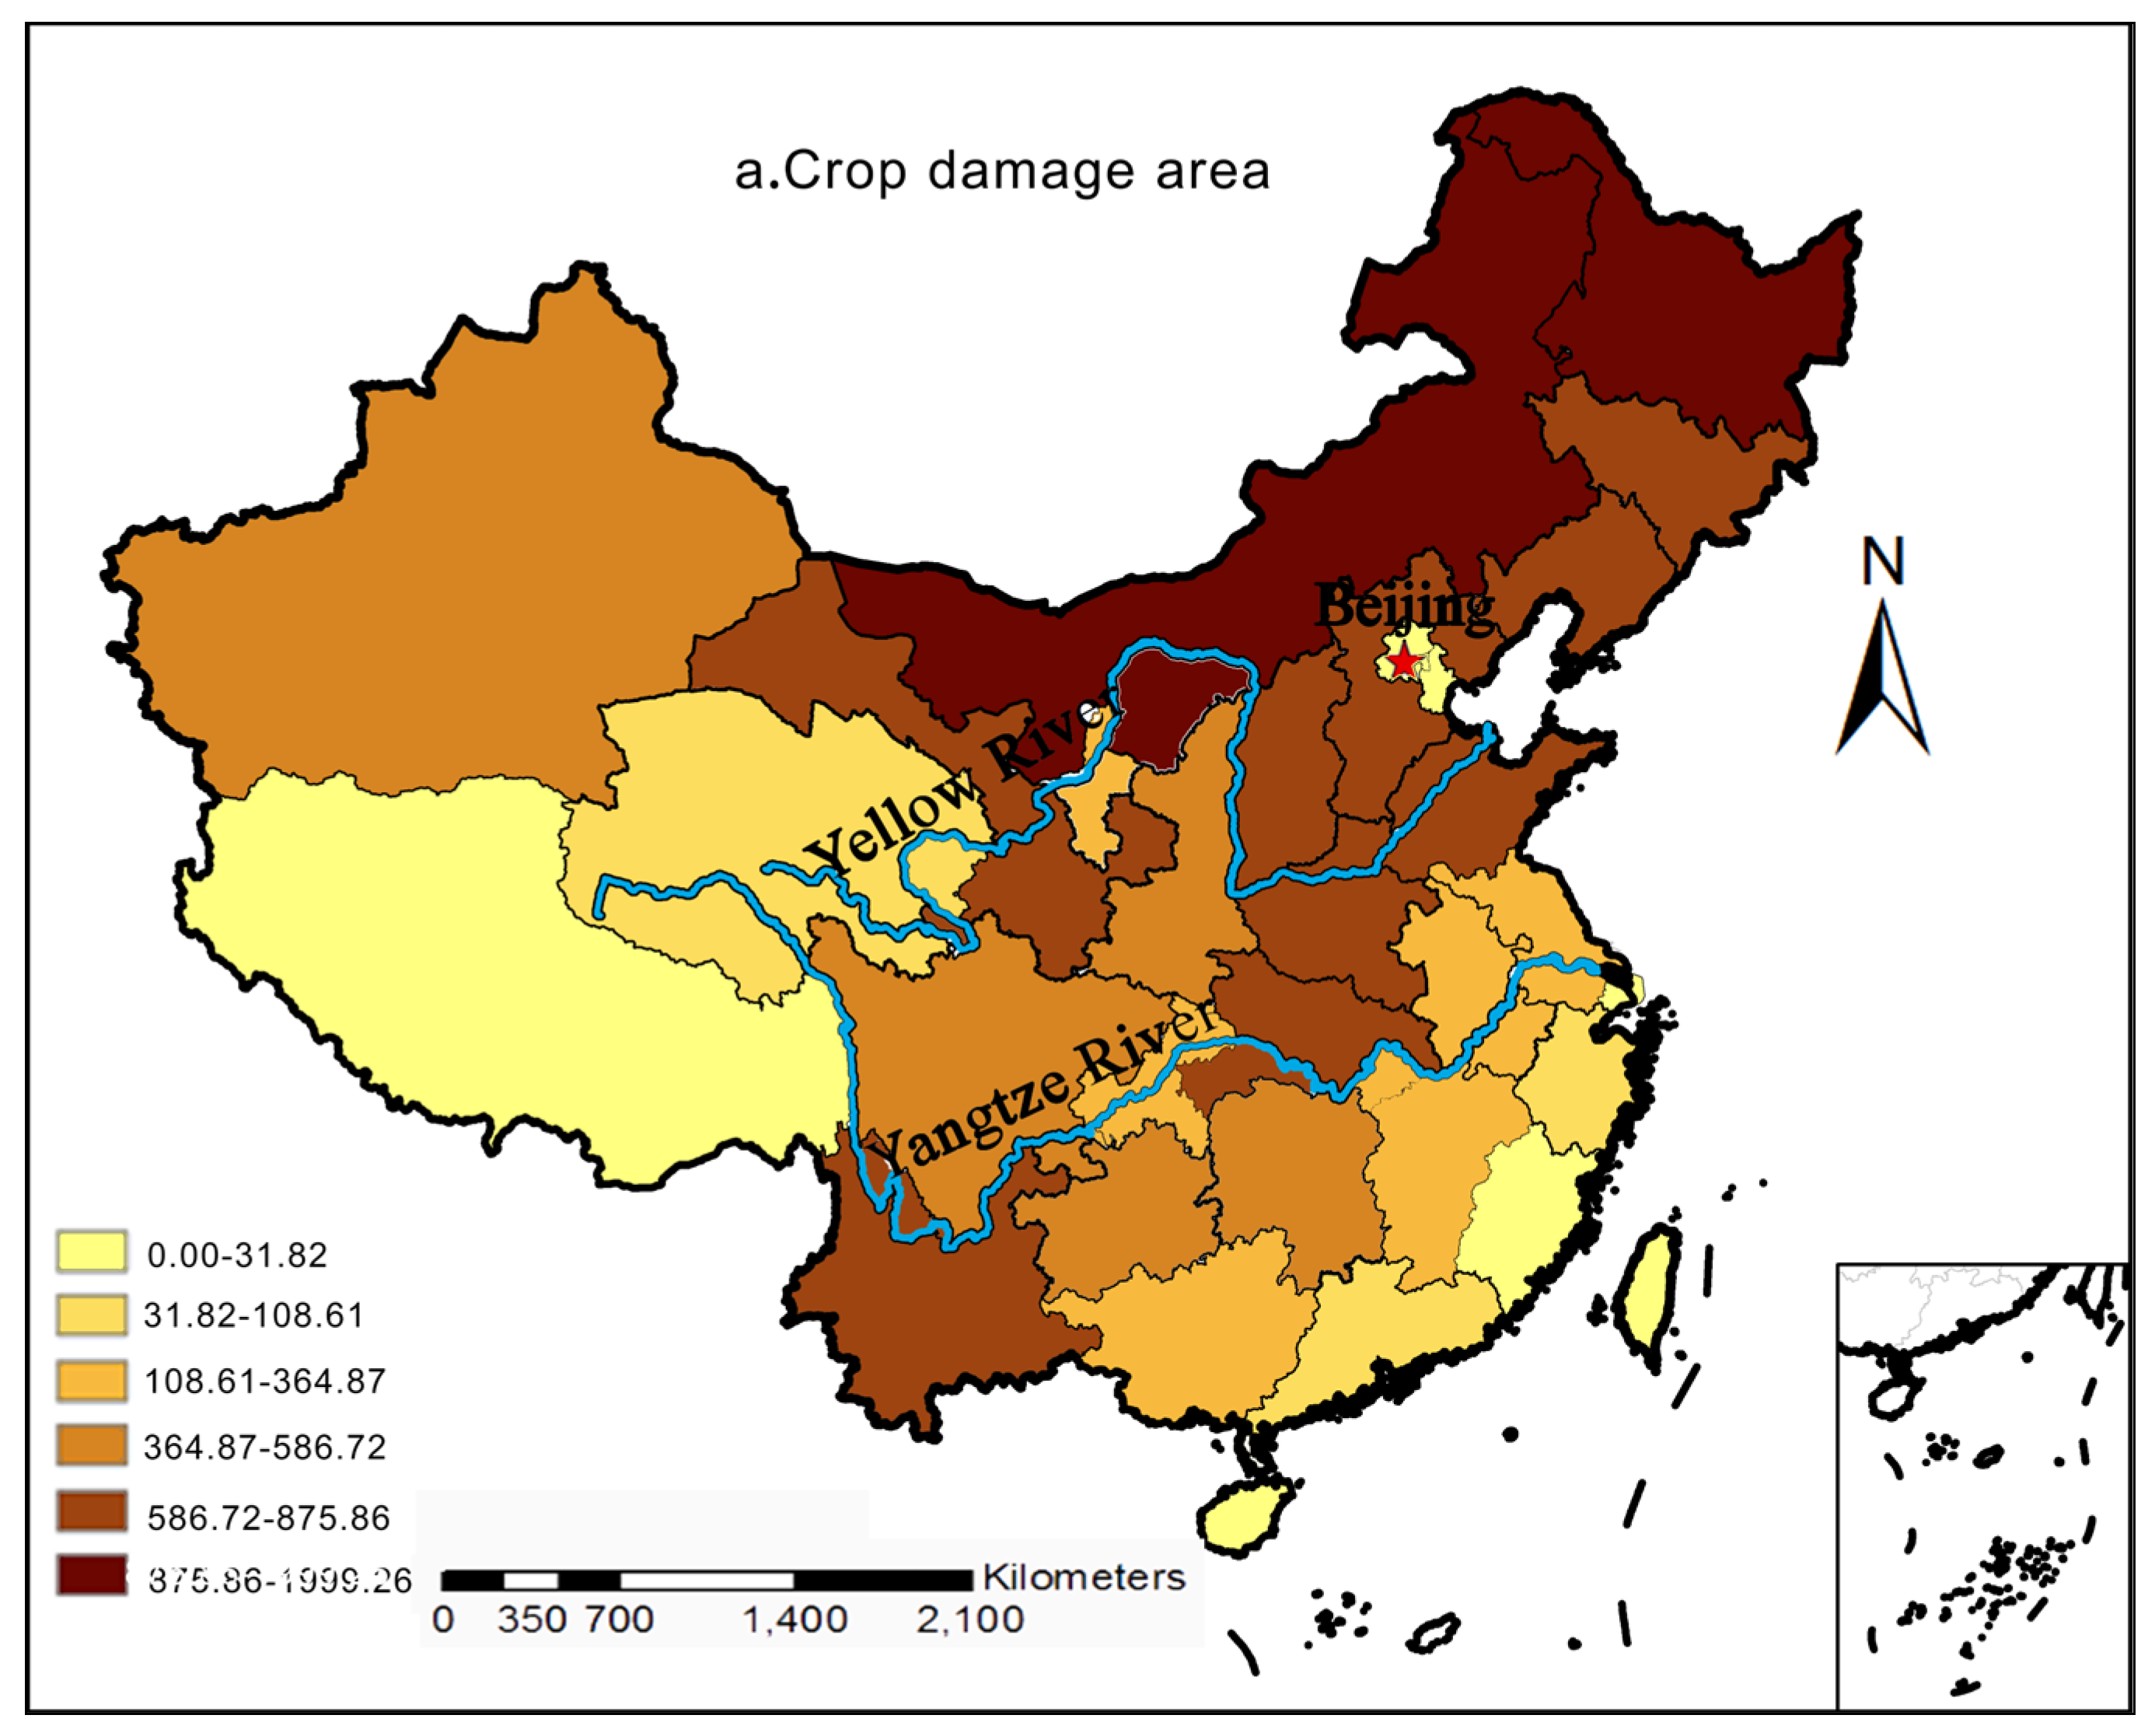
3.1. Spatial Distribution of Average Drought Disaster Data
3.1.1. Crop Damage Area
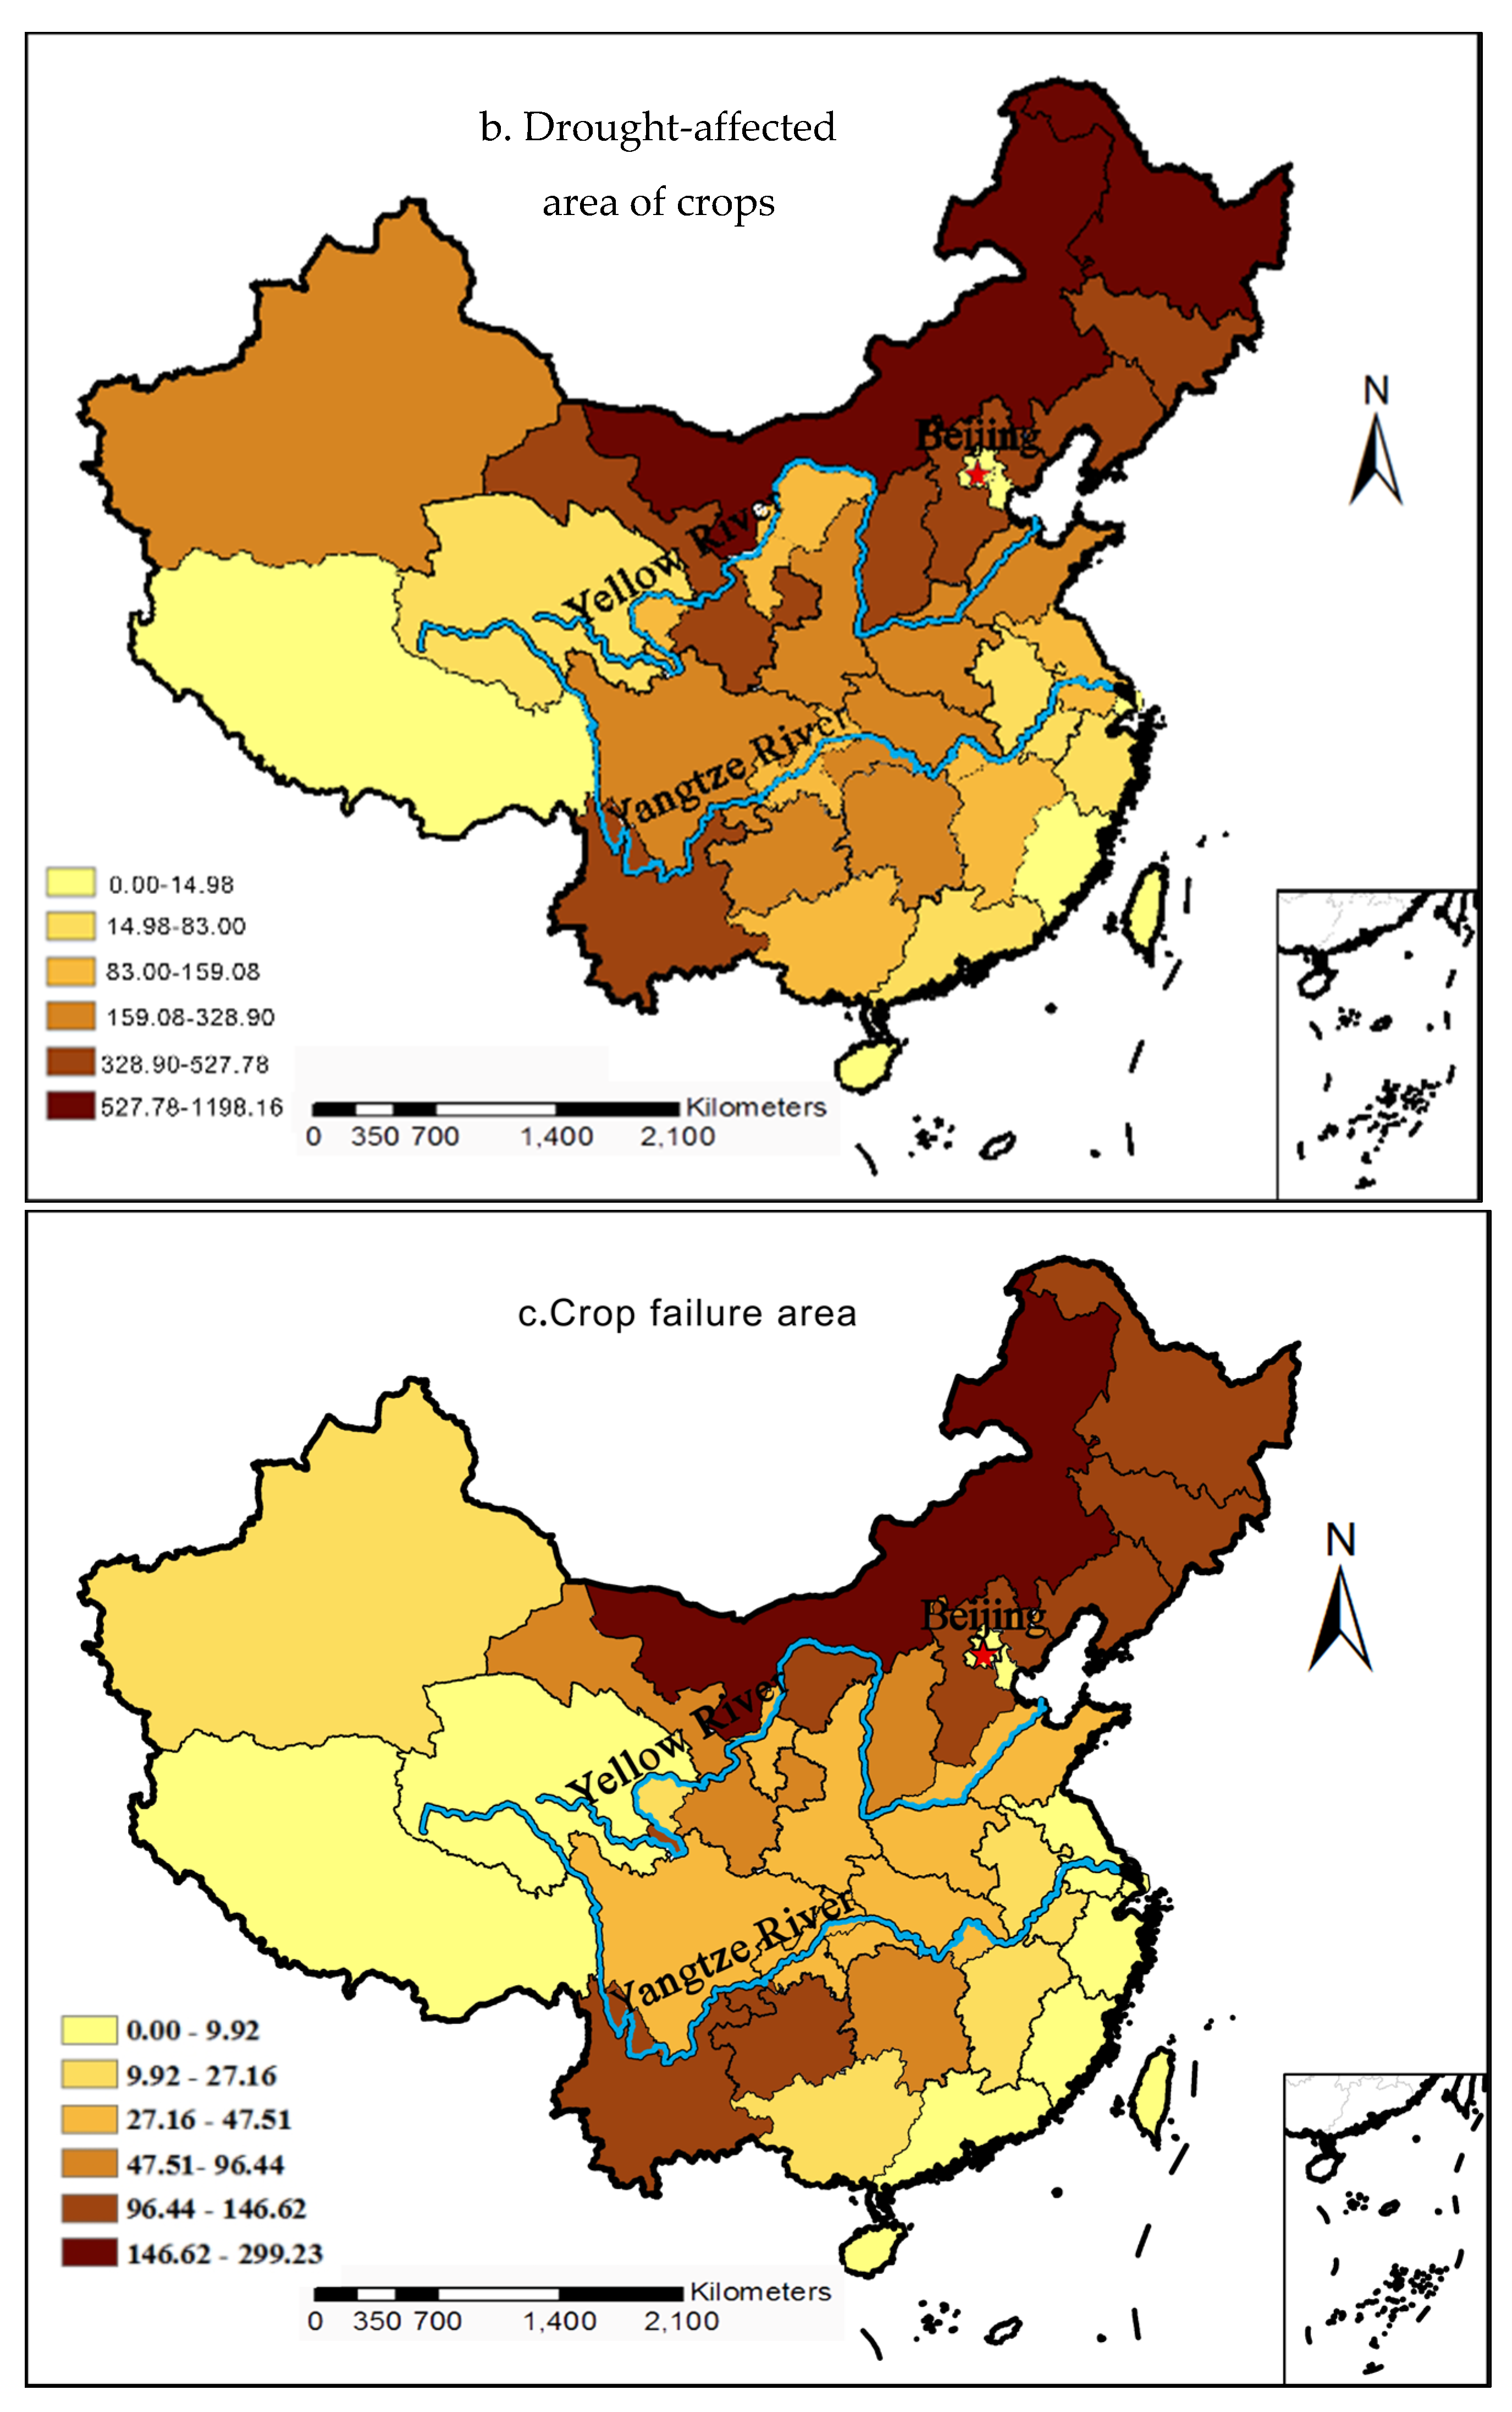
3.1.2. The Drought-Affected Area of Crops
3.1.3. Crop Failure Area
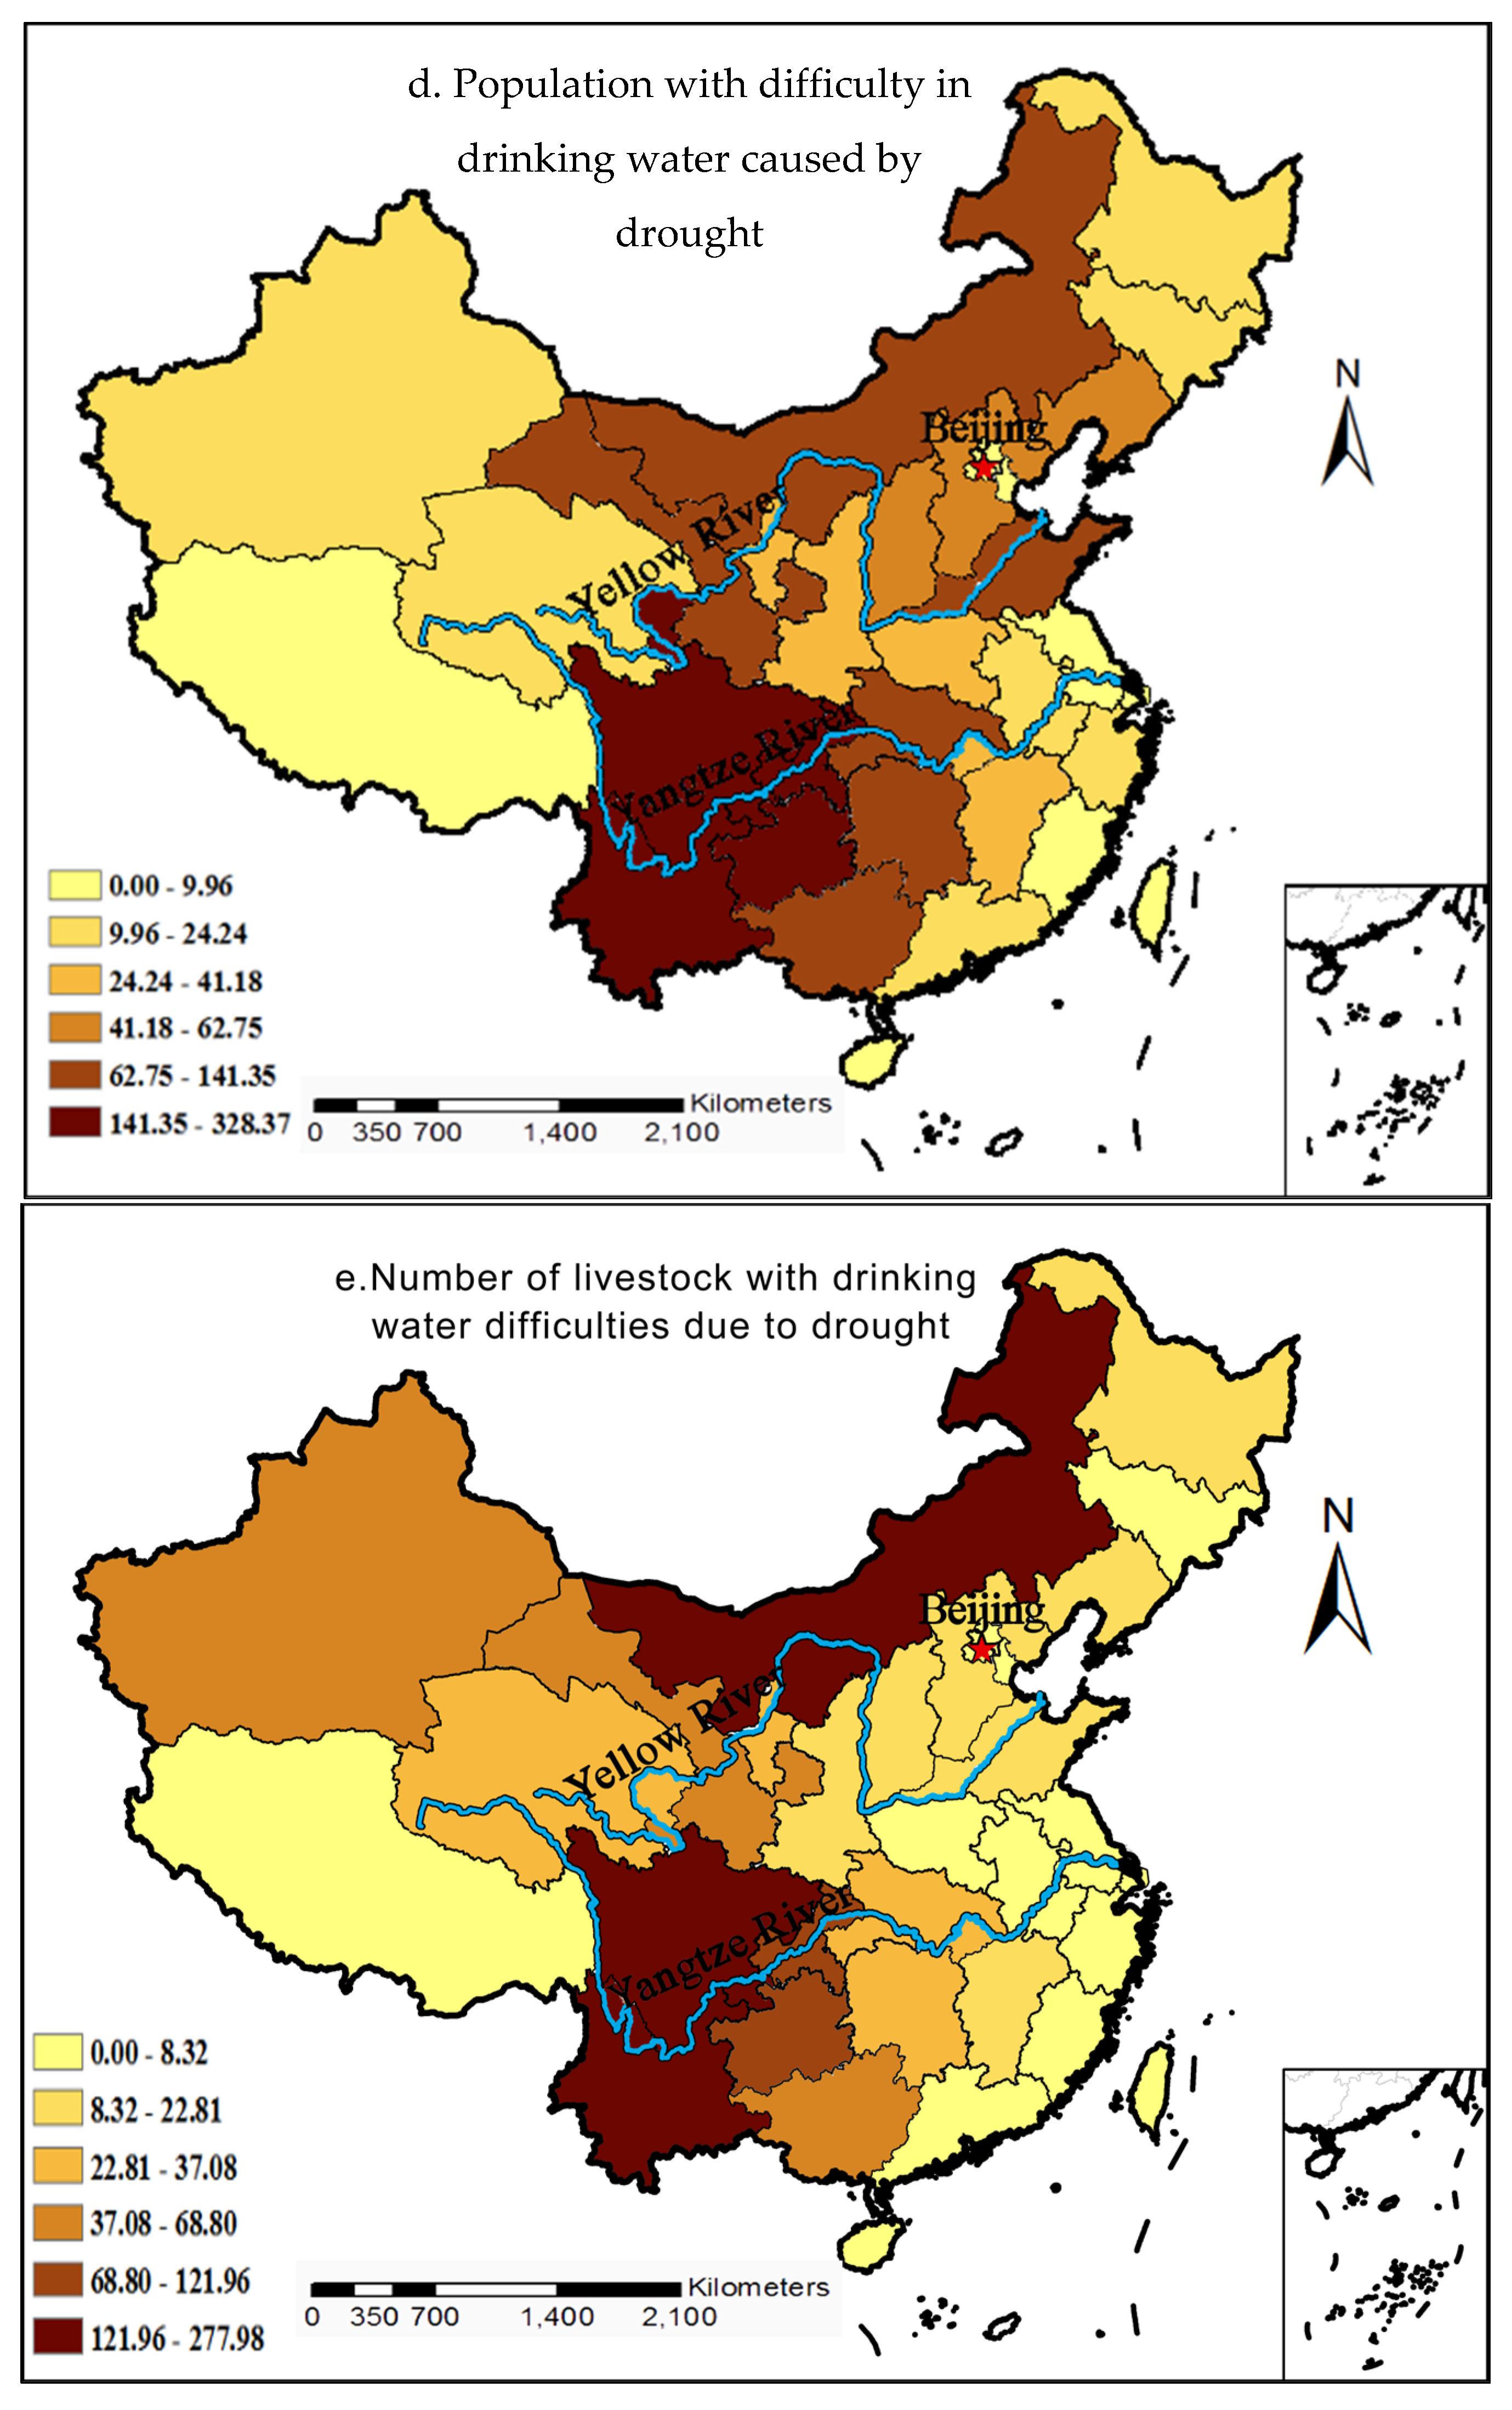
3.1.4. People and Livestock with Reduced Drinking Water Owing to Drought
3.2. Result of Z-Value
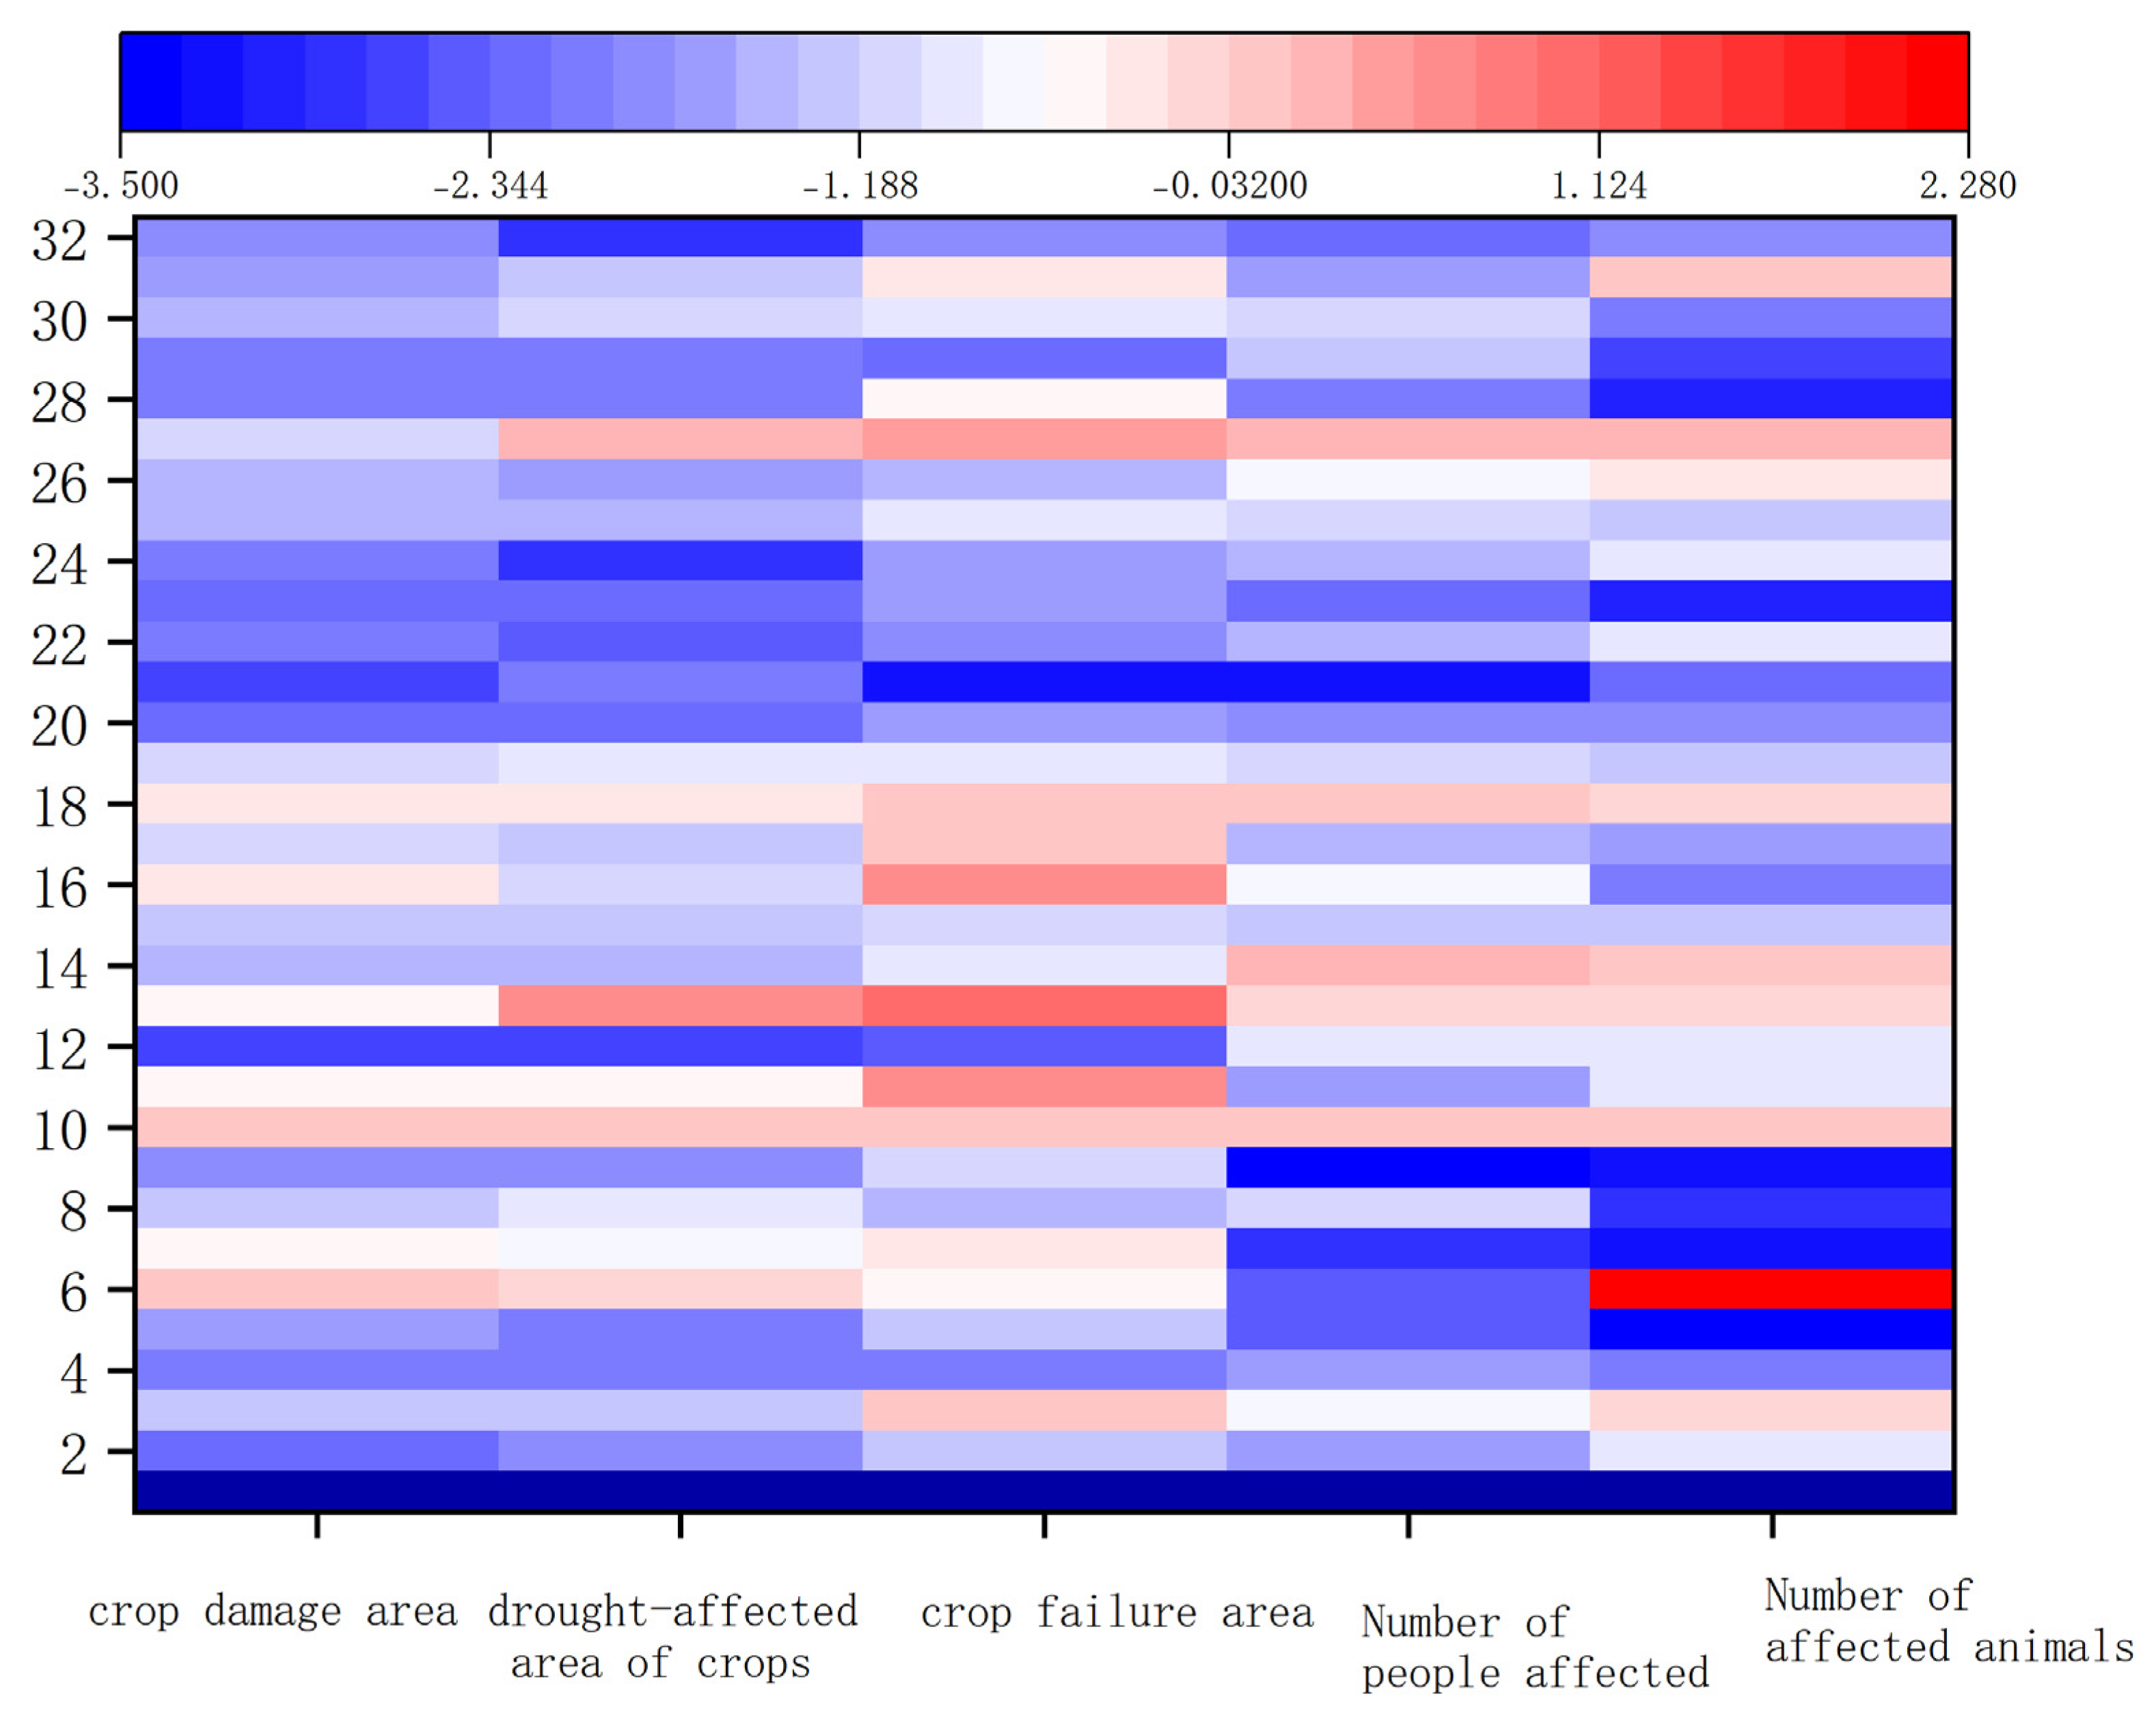
3.2.1. Z-Value Overall Analysis
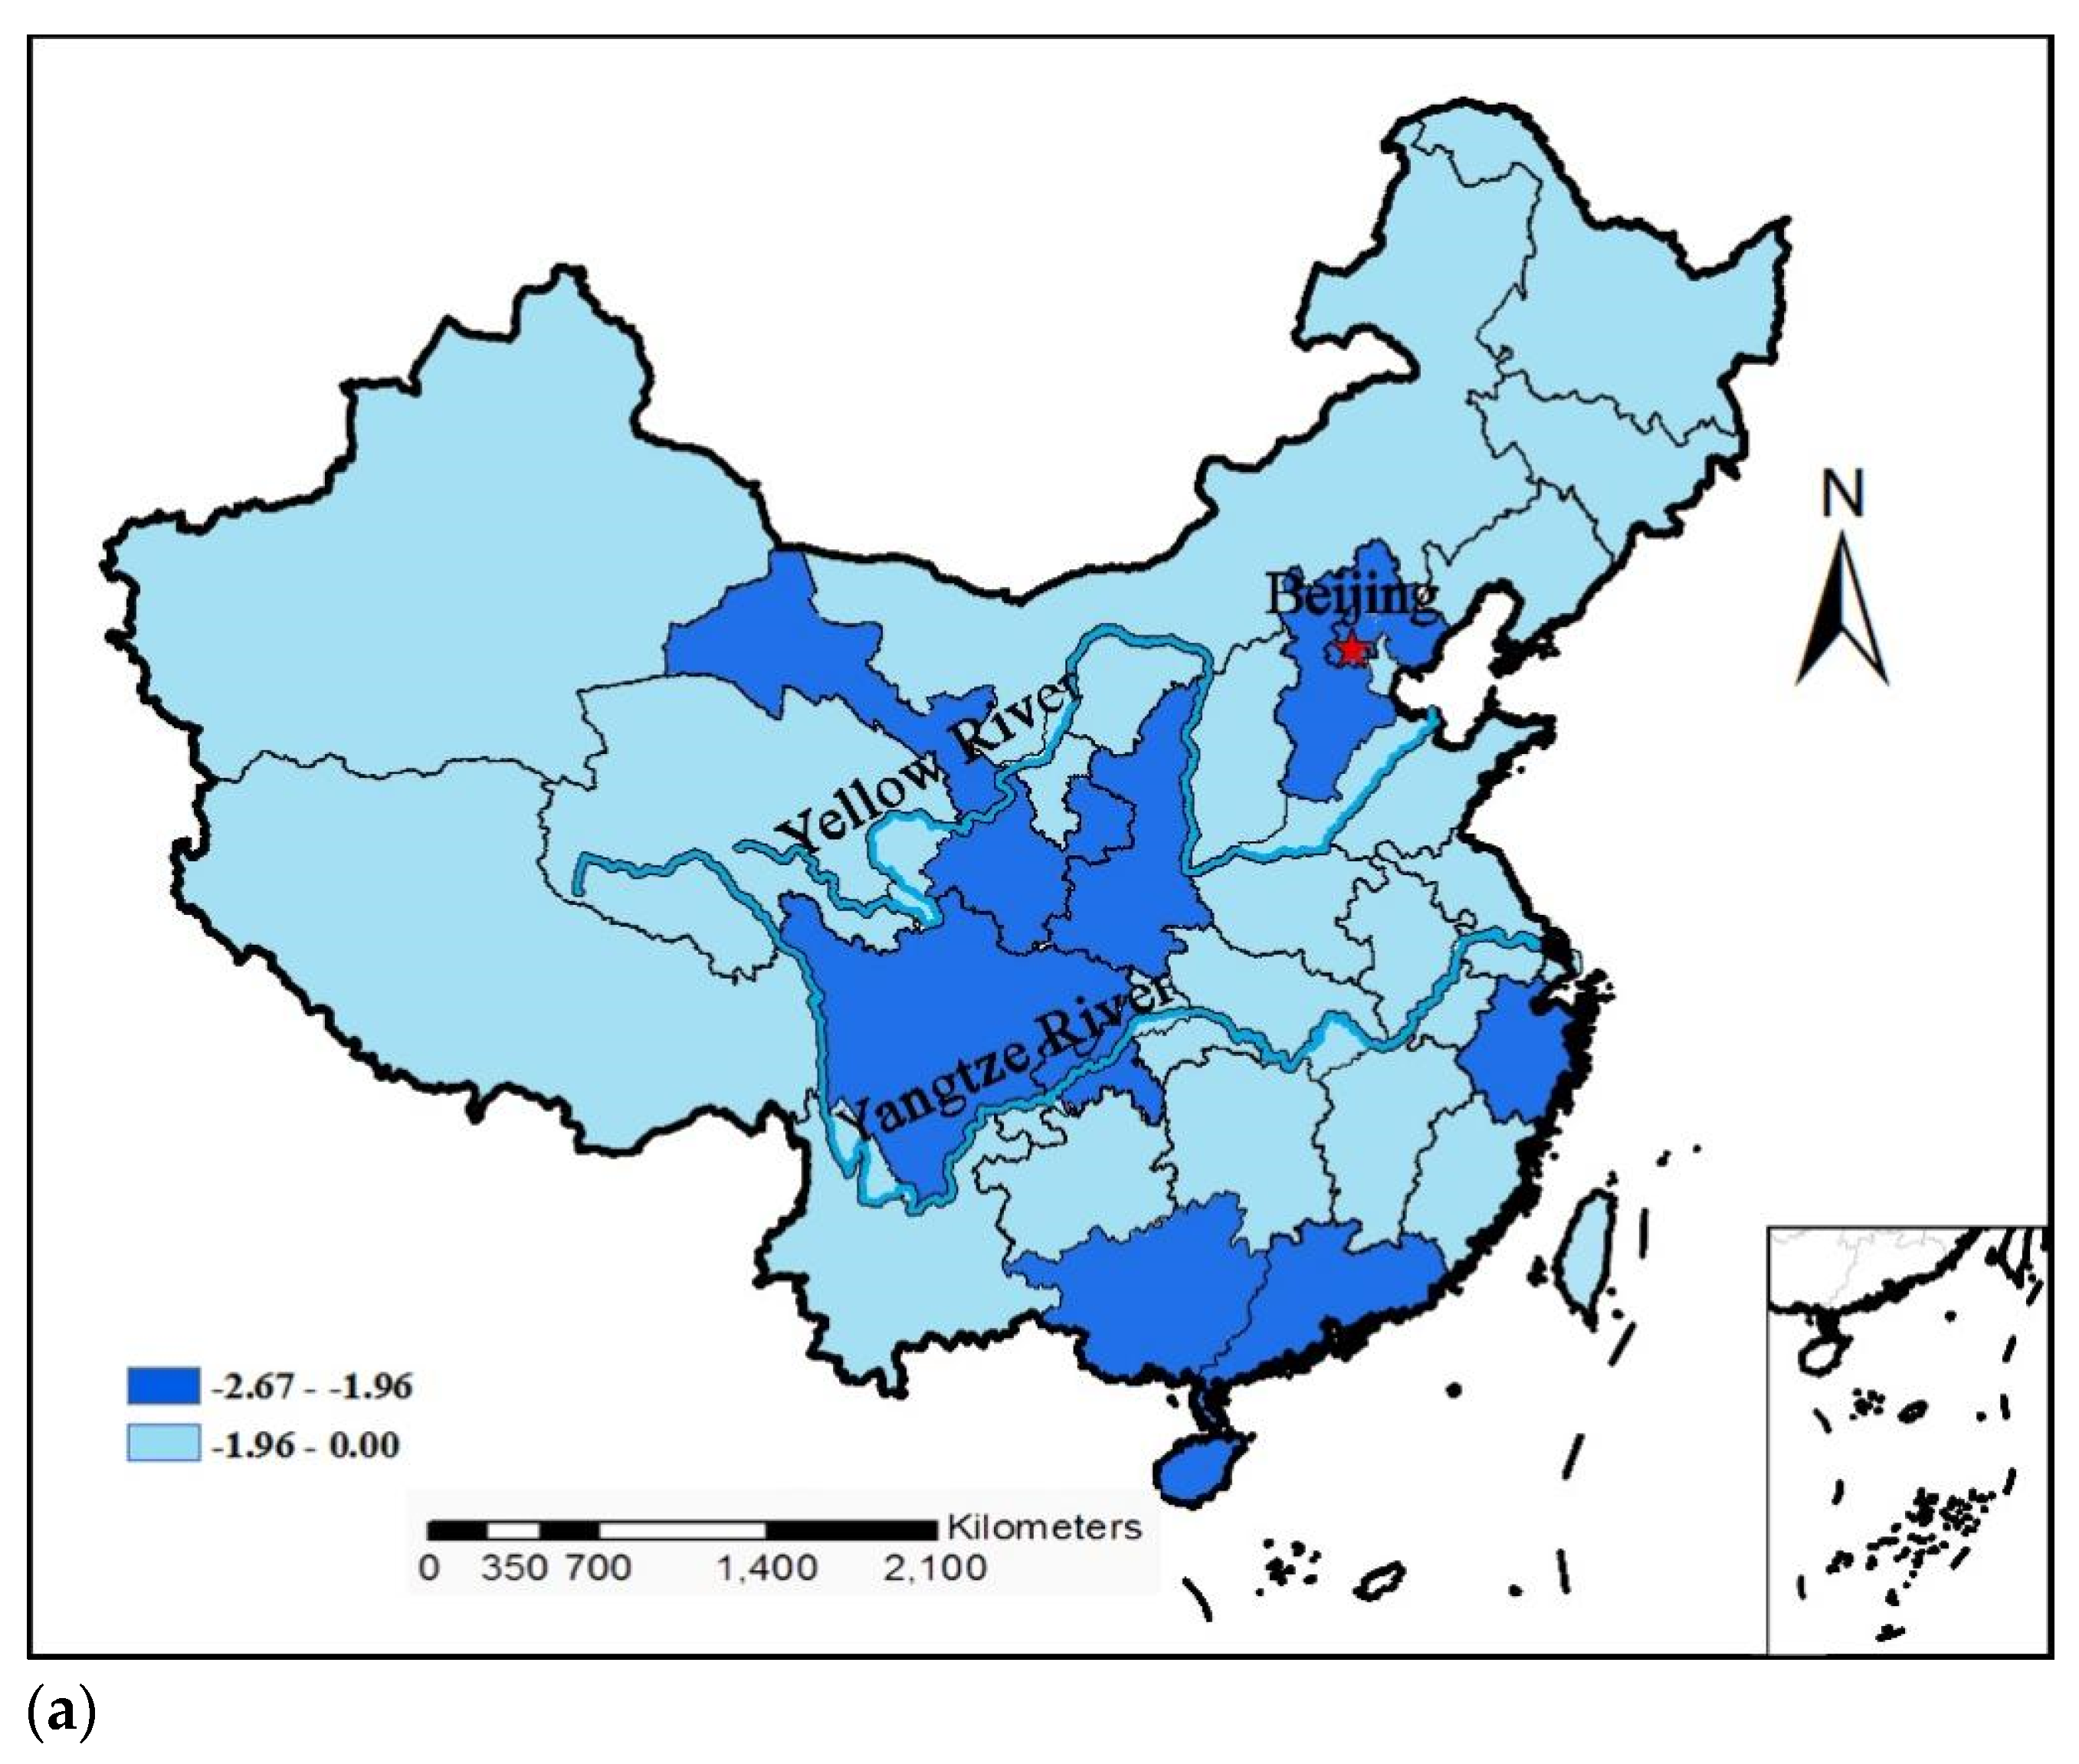
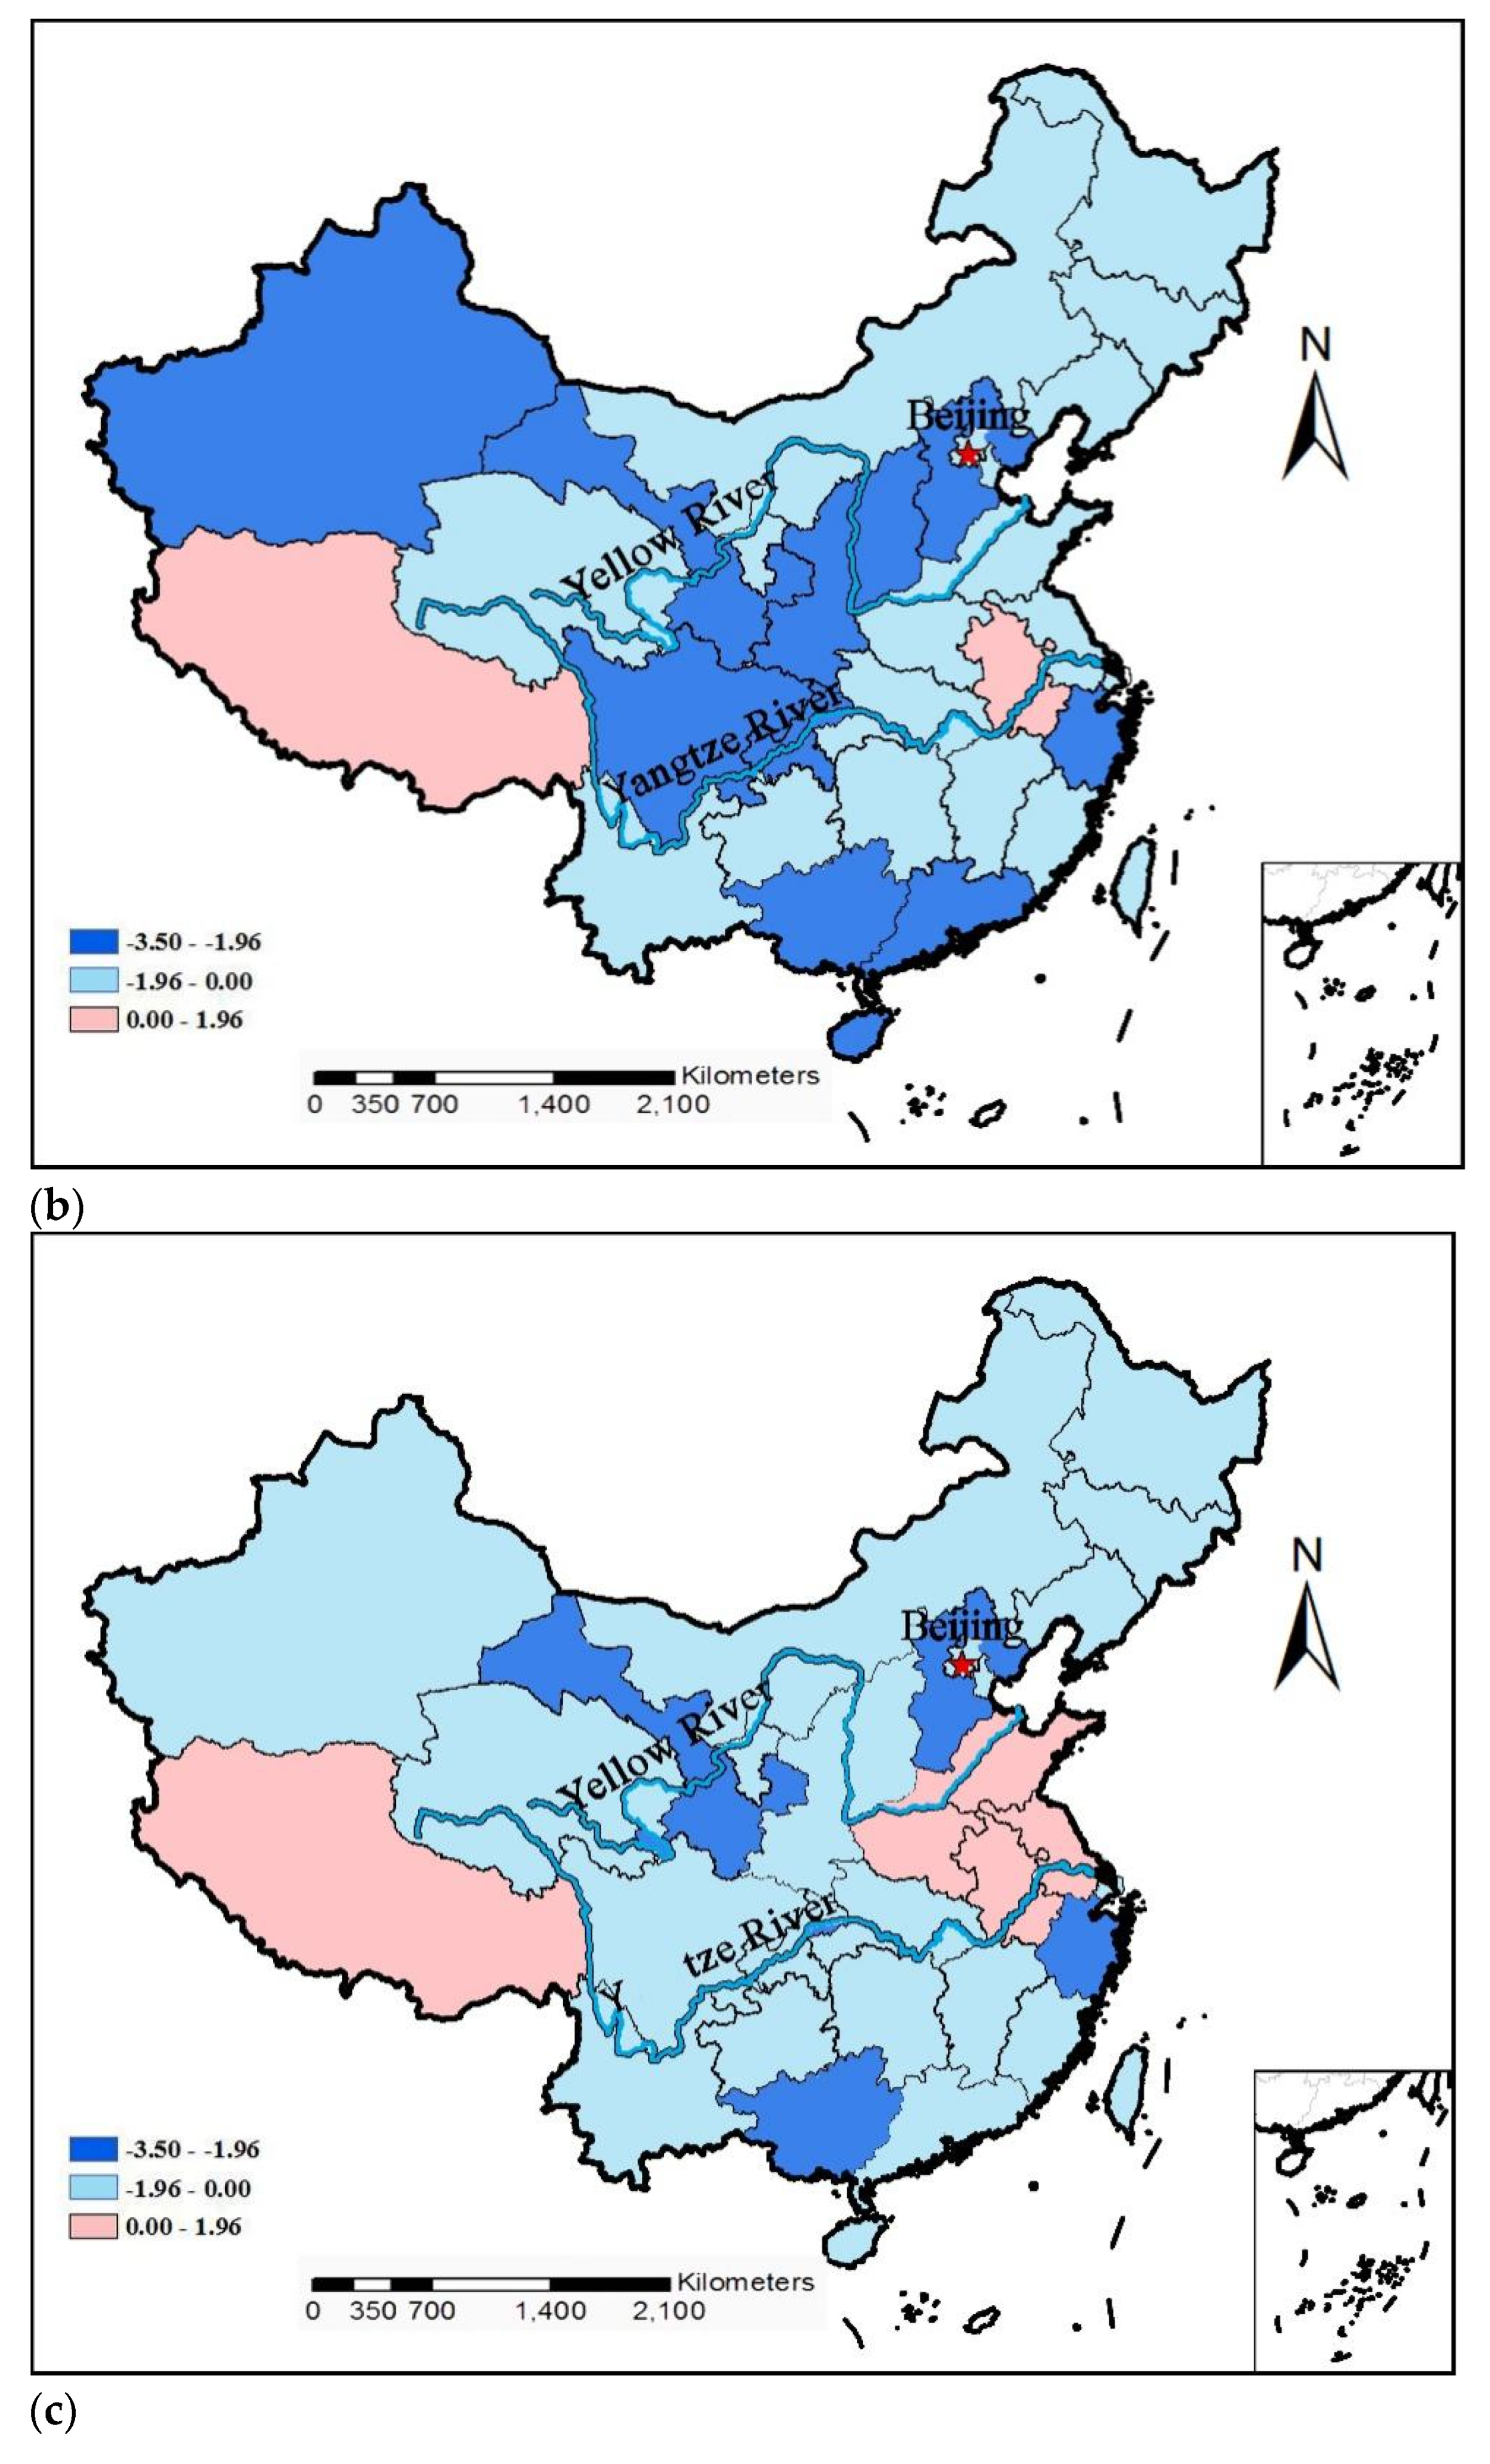
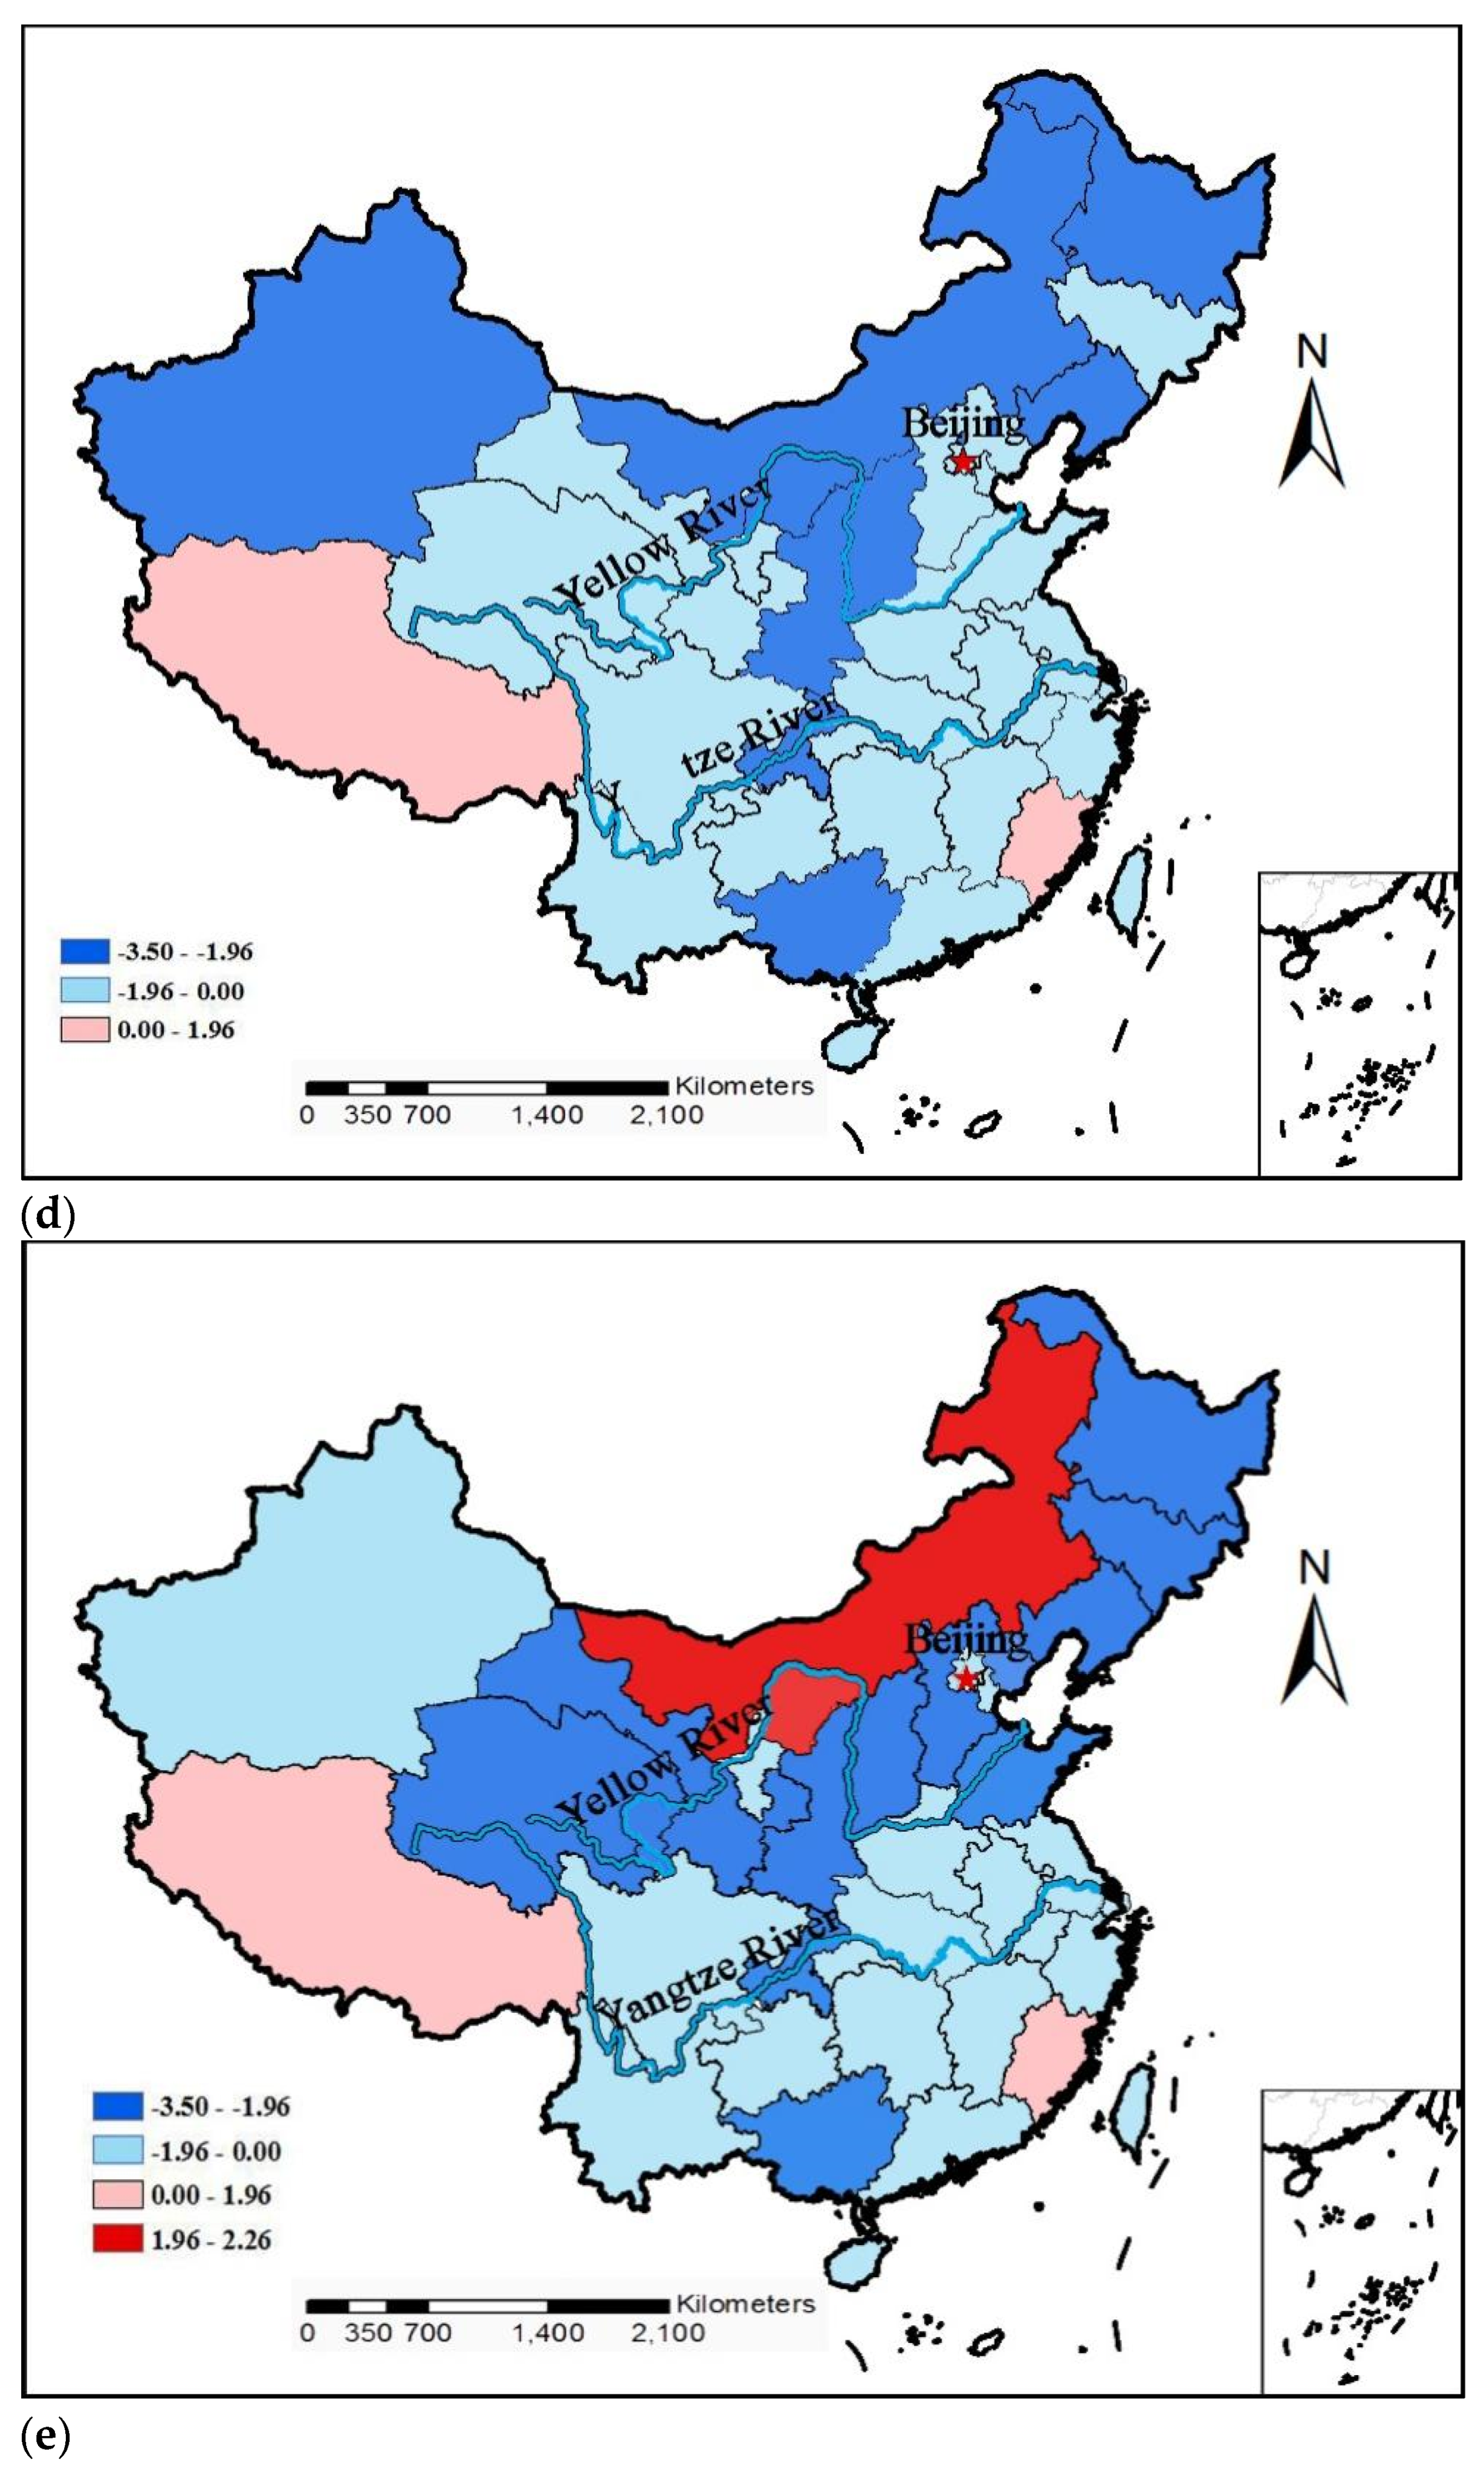
3.2.2. Z-Value Space Analysis
3.3. Wavelet Analysis
3.3.1. Crop Damage Area
3.3.2. Drought-Affected Area of Crops
3.3.3. Crop Failure Area
3.3.4. People with Reduced Drinking Water Caused by Drought
3.3.5. Domestic Animals with Reduced Drinking Water Owing to Drought
4. Discussion
4.1. Spatial and Temporal Distribution of Agricultural Weather Hazards in China and Future Outlook
4.2. Analysis of Disaster Risk Characteristics
4.3. Limitations of Drought Hazard Trends
4.4. Sustainable Management of Water Resources in Arid Areas
5. Conclusions
Author Contributions
Funding
Data Availability Statement
Acknowledgments
Conflicts of Interest
References
- Mishra, A.K.; Singh, V.P. A review of drought concepts. J. Hydrol. 2010, 391, 202–216. [Google Scholar] [CrossRef]
- Wang, J.; Yaohui, L.I.; Wang, R.; Feng, J.; Zhao, Y. Preliminary Analysis on the Demand and Review of Progress in the Field of Meteorological Drought Research. J. Arid. Meteorol. 2012, 30, 497. [Google Scholar]
- Zhang, Z.G.; Hao, W.P.; Hao-Ru, L.I.; Mao, L.L.; Gao, X. Analysis on the Drought Characteristics in Different Growth Stages of Spring Maize in Shanxi Province. Chin. J. Agrometeorol. 2015, 36. [Google Scholar] [CrossRef]
- Hao, L.; Joyeeta, G.; Pieter, V.D.M. China’s Governance Structure on Drought Disaster in Rural Areas. Disaster Adv. 2012, 5, 976–980. [Google Scholar]
- Yu, L.; Zhao, Y. Analysis of Drought-flood Disaster on Huanghuaihai Region During Summer Maize Growing Season. J. Catastrophol. 2013, 28, 71–75,80. [Google Scholar]
- Li, X.; Li, D.; Wang, J. Spatiotemporal Characteristics of Droughtover China during 1961–2009. J. Desert Res. 2012, 32, 473–483. [Google Scholar]
- Choi, M.; Jacobs, J.M.; Anderson, M.C.; Bosch, D.D. Evaluation of drought indices via remotely sensed data with hydrological variables. J. Hydrol. 2013, 476, 265–273. [Google Scholar] [CrossRef]
- Liao, Y.; Zhang, C. Spatio-Temporal Distribution Characteristics and Disaster Change of Drought in China Based on Meteorological Drought Composite Index. Meteorol. Mon. 2017, 43, 1402–1409. [Google Scholar]
- Begueria, S.; Vicente-Serrano, S.M.; Reig, F.; Latorre, B. Standardized precipitation evapotranspiration index (SPEI) revisited: Parameter fitting, evapotranspiration models, tools, datasets and drought monitoring. Int. J. Climatol. 2014, 34, 3001–3023. [Google Scholar] [CrossRef] [Green Version]
- Jiao, W.; Zhang, L.; Chang, Q.; Fu, D.; Cen, Y.; Tong, Q. Evaluating an Enhanced Vegetation Condition Index (VCI) Based on VIUPD for Drought Monitoring in the Continental United States. Remote Sens. 2016, 8, 224. [Google Scholar] [CrossRef] [Green Version]
- Moreira, E.E.; Coelho, C.A.; Paulo, A.A.; Pereira, L.S.; Mexia, J.T. SPI-based drought category prediction using loglinear models. J. Hydrol. 2008, 354, 116–130. [Google Scholar] [CrossRef] [Green Version]
- Su, H.; Li, G. Low-frequency drought variability based on SPEI in association with climate indices in Beijing. Acta Ecol. Sin. 2012, 32, 5467–5475. [Google Scholar]
- Du, H.; He, S. The Analysis on Characteristics of Precipitation and Trends in Drought and Flood Disasters in Minjiang River Basin. Res. Soil Water Conserv. 2015, 22, 153–157. [Google Scholar]
- Duan, W.; Maskey, S.; Chaffe, P.L.B.; Luo, P.; He, B.; Wu, Y.; Hou, J. Recent Advancement in Remote Sensing Technology for Hydrology Analysis and Water Resources Management. Remote Sens. 2021, 13, 1097. [Google Scholar] [CrossRef]
- Hu, G.U.O.; Ying, W.; Fang, W. Overview of Remote Sensing Approaches to Drought Monitoring. Remote Sens. Technol. Appl. 2008, 23, 111–116. [Google Scholar]
- Liu, H.; Liu, R.; Liu, S. Review of Drought Monitoring by Remote Sensing. J. Geo-Inf. Sci. 2012, 14, 232–239. [Google Scholar] [CrossRef]
- Luo, B.; Huang, W.; Shuai, X.; Xie, B.; Peng, L. Risk Division of Drought Disaster for Rice Production in Hunan Province. Chin. J. Agrometeorol. 2011, 32, 461–465. [Google Scholar]
- Wang, M.; Yan, J. Precipitation Characteristics of Flooding from 1960 to 2012 and Serious Flooding Judgment for the Southeast Coast of China. Earth Environ. 2015, 43, 667–674. [Google Scholar]
- Deng, H.; Pepin, N.C.; Chen, Y.; Guo, B.; Zhang, S.; Zhang, Y.; Chen, X.; Gao, L.; Meibing, L.; Ying, C. Dynamics of Diurnal Precipitation Differences and Their Spatial Variations in China. J. Appl. Meteorol. Climatol. 2022, 61, 1015–1027. [Google Scholar] [CrossRef]
- Qin, J.; Duan, W.; Chen, Y.; Dukhovny, V.A.; Sorokin, D.; Li, Y.; Wang, X. Comprehensive evaluation and sustainable development of water-energy-food-ecology systems in Central Asia. Renew. Sustain. Energy Rev. 2022, 157. [Google Scholar] [CrossRef]
- Tian, Z.; Li, X. Analysis on the trend of drought in main grain produCing areas in China from 1949 to 2016. J. China Agric. Univ. 2019, 24, 159–167. [Google Scholar]
- Li, Z.; Niu, C.; Xia, J. Analysis on the Change of Precipitation in Multiple Temporal Scales in North China. Arid Land Geogr. 2004, 27, 548–552. [Google Scholar]
- Duan, W.; Hanasaki, N.; Shiogama, H.; Chen, Y.; Zou, S.; Nover, D.; Zhou, B.; Wang, Y. Evaluation and Future Projection of Chinese Precipitation Extremes Using Large Ensemble High-Resolution Climate Simulations. J. Clim. 2019, 32, 2169–2183. [Google Scholar] [CrossRef]
- Kumar, M.N.; Murthy, C.S.; Sai, M.V.R.S.; Roy, P.S. Spatiotemporal analysis of meteorological drought variability in the Indian region using standardized precipitation index. Meteorol. Appl. 2012, 19, 256–264. [Google Scholar] [CrossRef] [Green Version]
- Zhiwei, W.; Panmao, Z.; Yongli, W.U. Analysis on Drought Variation over 10 Hydrological Regions in China during 1951–2005. Plateau Meteorol. 2007, 26, 874–880. [Google Scholar]
- Yao, Y.; Zhang, Q.; Li, Y.; Wang, Y.; Wang, J. Drought Risk Assessment Technological Progresses and Problems. Resour. Sci. 2013, 35, 1884–1897. [Google Scholar]
- Deng, Z.Y.; Zhang, Q.; Yin, X.Z.; Zhang, C.J.; Xin, J.W.; Liu, D.X.; Jin-Yong, P.U.; Dong, A.X. Response of Drought Damage to Arid Climate Change. J. Glaciol. Geocryol. 2007, 29, 114–118. [Google Scholar]
- Zou, X.; Ren, G.; Zhang, Q. Droughts Variations in China Based on a Compound Index of Meteorological Drought. Clim. Environ. Res. 2010, 15, 371–378. [Google Scholar]
- Zhou, Y.; Li, N.; Wu, J. Analysis of Drought and its Possible Causes in Inner Mongolia Region for Nearly 30 Years. J. Catastrophol. 2013, 28, 67–73. [Google Scholar]
- Zhang, J. Risk assessment of drought disaster in the maize-growing region of Songliao Plain, China. Agric. Ecosyst. Environ. 2004, 102, 133–153. [Google Scholar] [CrossRef]
- Ministry of Water Resources of the People’s Republic of China. Bulletin of Flood and Drought Disasters in China; Ministry of Water Resources of the People’s Republic of China: Beijing, China, 2012.
- Mu, J.; Qiu, M.; Gu, Y.; Ren, J.; Liu, Y. Applicability of five drought indices for agricultural drought evaluation in Jilin Province, China. Chin. J. Appl. Ecol. 2018, 29, 2624–2632. [Google Scholar]
- Hu, Z.; Liu, S.; Zhong, G.; Lin, H.; Zhou, Z. Modified Mann-Kendall trend test for hydrological time series under the scaling hypothesis and its application. Hydrol. Sci. J.-J. Des Sci. Hydrol. 2020, 65, 2419–2438. [Google Scholar] [CrossRef]
- Anand, B.; Karunanidhi, D. Long term spatial and temporal rainfall trend analysis using GIS and statistical methods in Lower Bhavani basin, Tamil Nadu, India. Indian J. Geo-Mar. Sci. 2020, 49, 419–427. [Google Scholar]
- Li, Q.; He, P.; He, Y.; Han, X.; Zeng, T.; Lu, G.; Wang, H. Investigation to the relation between meteorological drought and hydrological drought in the upper Shaying River Basin using wavelet analysis. Atmos. Res. 2020, 234, 104743. [Google Scholar] [CrossRef]
- Li, X.; Yang, Y.; Ren, C. Some Key Problems in Palmer Index Analysis Using Wavelet Decomposition. J. Shenyang Agric. Univ. 2013, 44, 273–277. [Google Scholar]
- Niu, C.; Zhang, L.; Xia, J. Wavelet Analysis on the Precipitation in North China. Arid Land Geogr. 2004, 27, 66–70. [Google Scholar]
- Wang, W.; Ding, J.; Xiang, H. Application and prospect of wavelet analysis in hydrology. Adv. Water Sci. 2002, 13, 515–520. [Google Scholar]
- Joshi, N.; Gupta, D.; Suryavanshi, S.; Adamowski, J.; Madramootoo, C.A. Analysis of trends and dominant periodicities in drought variables in India: A wavelet transform based approach. Atmos. Res. 2016, 182, 200–220. [Google Scholar] [CrossRef]
- Song, X.; Wang, Y.; Yan, D.; Chen, Y.; Ding, Y. Fractal and wavelet analysis on the 59 years time series of drought disaster ratio in China. Syst. Eng.-Theory Pract. 2013, 33, 2986–2992. [Google Scholar]
- Luo, P.; Liu, L.; Wang, S.; Ren, B.; He, B.; Nover, D. Influence assessment of new Inner Tube Porous Brick with absorbent concrete on urban floods control. Case Studies in Construction Materials 2022, 17, e01236.Huang, H. Characteristics and causes of drought in China from 1949 to 2007. J. Arid Land Resour. Environ. 2010, 24, 94–98. [Google Scholar]
- Zhu, Y.; Luo, P.; Zhang, S.; Sun, B. Spatiotemporal Analysis of Hydrological Variations and Their Impacts on Vegetation in Semiarid Areas from Multiple Satellite Data. Remote Sens. 2020, 12, 4177. [Google Scholar] [CrossRef]
- Luo, P.; Luo, M.; Li, F.; Qi, X.; Huo, A.; Wang, Z.; He, B.; Takara, K.; Nover, D.; Wang, Y. Urban flood numerical simulation: Research, methods and future perspectives. Environ. Model. Softw. 2022, 156. [Google Scholar] [CrossRef]
- Hu, Y.; Duan, W.; Chen, Y.; Zou, S.; Kayumba, P.M.; Qin, J. Exploring the changes and driving forces of water footprint in Central Asia: A global trade assessment. J. Clean. Prod. 2022, 375, 134062. [Google Scholar] [CrossRef]
- Wang, Z.; Luo, P.; Zha, X.; Xu, C.; Kang, S.; Zhou, M.; Nover, D.; Wang, Y. Overview assessment of risk evaluation and treatment technologies for heavy metal pollution of water and soil. J. Clean. Prod. 2022, 379, 134043. [Google Scholar] [CrossRef]
- Zhao, Y.; Shi, X.; Wang, S.; Qin, N.; Wang, Q.; Feng, S. Research on Variations of Climate and Its Aridity in the Valley of Yellow River and Huangshui River within Qinghai Province. J. Desert Res. 2006, 26, 54–59. [Google Scholar]
- Zhu, L.; Yan, J. A judgment of warming-drying climate changes and drought disaster trend of Xianyang City. J. Arid Land Resour. Environ. 2011, 25, 131–135. [Google Scholar]
- Yao, Y.; Zheng, F.; Guan, Y. The temporal and spatial characteristics of flood and drought during the recent 60 years in China. Agric. Res. Arid Areas 2017, 35, 228–232,263. [Google Scholar]
- Fang, S.; Yang, J.; Zhou, G. Change trend and distributive characteristics of agrometeorological disasters in China in recent 30 years. J. Nat. Disasters 2011, 20, 69–73. [Google Scholar]
- Jiang, L.; Cui, X. Analysis on variation tendency and cause of China’s agrometeorological hazards in the latest 20 years. Torrential Rain Disasters 2016, 35, 102–108. [Google Scholar]
- Luo, P.; Mu, Y.; Wang, S.; Zhu, W.; Mishra, B.K.; Huo, A.; Zhou, M.; Lyu, J.; Hu, M.; Duan, W. Exploring sustainable solutions for the water environment in Chinese and Southeast Asian cities. Ambio 2021, 51, 1199–1218. [Google Scholar] [CrossRef]
- Cao, Z.; Wang, S.; Luo, P.; Xie, D.; Zhu, W. Watershed Ecohydrological Processes in a Changing Environment: Opportunities and Challenges. Water 2022, 14, 1502. [Google Scholar] [CrossRef]
- Guan, Y.; Wang, B.; Zheng, F.; Zhang, P.; Qin, C. Characteristics of meteorological disasters in China during 2012. J. Nat. Disasters 2014, 23, 24–31. [Google Scholar] [CrossRef]
- Liu, Y.; Yang, Y. Spatial Distribution of Major Natural Disasters of China in Historical Period. Acta Geogr. Sin. 2012, 67, 291–300. [Google Scholar]
- Yunfeng, C.; Ge, G.A.O. An Analysis to Losses Caused by Meteorological Disasters in China During 1989–2008. Meteorol. Mon. 2010, 36, 76–80. [Google Scholar]
- Liu, Y.; Miao, Q. Prediction on Agricultural Drought Disasters in Northwest China. Arid Land Geogr. 2004, 27, 564–569. [Google Scholar]
- Ye, X.; Liu, J.; Li, X.; Zhang, Q. Effects of climate variability and human activities on runoff variation of Ganjiang River Basin. J. Hohai Univ. Nat. Sci. 2013, 41, 196–203. [Google Scholar]
- Limei, X.U.; Ying, G.U.O.; Min, L.I.U.; Qiaoli, H.U.; Fujun, C.; Shucong, Y.; Yanjun, S. Analysis of Temperature Trends and Change Points in the Haihe River Basin Over the Last 50 Years. Resour. Sci. 2011, 33, 995–1001. [Google Scholar]
- Duan, W.; Zou, S.; Chen, Y.; Nover, D.; Fang, G.; Wang, Y. Sustainable water management for cross-border resources: The Balkhash Lake Basin of Central Asia, 1931–2015. J. Clean. Prod. 2020, 263. [Google Scholar] [CrossRef]
- Bao, Y. Analysis of Urban Disaster Prevention and Mitigation. In Proceedings of the Advances in Civil Engineering, PTS 1-6, Xi’an, China, 22–24 September 2011; pp. 264–267. [Google Scholar]
- Luo, P.; Zheng, Y.; Wang, Y.; Zhang, S.; Yu, W.; Zhu, X.; Huo, A.; Wang, Z.; He, B.; Nover, D. Comparative Assessment of Sponge City Constructing in Public Awareness, Xi’an, China. Sustainability 2022, 14, 11653. [Google Scholar] [CrossRef]


Disclaimer/Publisher’s Note: The statements, opinions and data contained in all publications are solely those of the individual author(s) and contributor(s) and not of MDPI and/or the editor(s). MDPI and/or the editor(s) disclaim responsibility for any injury to people or property resulting from any ideas, methods, instructions or products referred to in the content. |
© 2023 by the authors. Licensee MDPI, Basel, Switzerland. This article is an open access article distributed under the terms and conditions of the Creative Commons Attribution (CC BY) license (https://creativecommons.org/licenses/by/4.0/).
Share and Cite
Wang, X.; Luo, P.; Zheng, Y.; Duan, W.; Wang, S.; Zhu, W.; Zhang, Y.; Nover, D. Drought Disasters in China from 1991 to 2018: Analysis of Spatiotemporal Trends and Characteristics. Remote Sens. 2023, 15, 1708. https://doi.org/10.3390/rs15061708
Wang X, Luo P, Zheng Y, Duan W, Wang S, Zhu W, Zhang Y, Nover D. Drought Disasters in China from 1991 to 2018: Analysis of Spatiotemporal Trends and Characteristics. Remote Sensing. 2023; 15(6):1708. https://doi.org/10.3390/rs15061708
Chicago/Turabian StyleWang, Xiaofeng, Pingping Luo, Yue Zheng, Weili Duan, Shuangtao Wang, Wei Zhu, Yuzhu Zhang, and Daniel Nover. 2023. "Drought Disasters in China from 1991 to 2018: Analysis of Spatiotemporal Trends and Characteristics" Remote Sensing 15, no. 6: 1708. https://doi.org/10.3390/rs15061708