Article

Assessing the Prospects of Remote Sensing Maize Leaf Area Index Using UAV-Derived Multi-Spectral Data in Smallholder Farms across the Growing Season

by
Siphiwokuhle Buthelezi
1,
Onisimo Mutanga
1,
Mbulisi Sibanda
2,*,
John Odindi
1,
Alistair D. Clulow
3,
Vimbayi G. P. Chimonyo
4,5 and
Tafadzwanashe Mabhaudhi
4,6
1
Discipline of Geography and Environmental Science, School of Agricultural Earth and Environmental Sciences, University of KwaZulu-Natal, Private Bag X01, Pietermaritzburg 3209, South Africa
2
Discipline of Geography, Environmental Studies & Tourism, Faculty of Arts, University of the Western Cape, Bellville 7535, South Africa
3
Discipline of Agrometeorology, School of Agricultural, Earth and Environmental Sciences, University of KwaZulu-Natal, Pietermaritzburg 3209, South Africa
4
Centre for Transformative Agricultural and Food Systems, School of Agricultural, Earth & Environmental Sciences, University of KwaZulu-Natal, Private Bag X01, Pietermaritzburg 3209, South Africa
5
International Maize and Wheat Improvement Center (CIMMYT)-Zimbabwe, Mt Pleasant, Harare P.O. Box 163, Zimbabwe
6
International Water Management Institute (IWMI-SA), Southern Africa Office, Pretoria 0184, South Africa
*
Author to whom correspondence should be addressed.
Remote Sens. 2023, 15(6), 1597; https://doi.org/10.3390/rs15061597
Submission received: 2 February 2023 / Revised: 5 March 2023 / Accepted: 9 March 2023 / Published: 15 March 2023
(This article belongs to the Special Issue Retrieving Leaf Area Index Using Remote Sensing)

Abstract

:
Maize (Zea Mays) is one of the most valuable food crops in sub-Saharan Africa and is a critical component of local, national and regional economies. Whereas over 50% of maize production in the region is produced by smallholder farmers, spatially explicit information on smallholder farm maize production, which is necessary for optimizing productivity, remains scarce due to a lack of appropriate technologies. Maize leaf area index (LAI) is closely related to and influences its canopy physiological processes, which closely relate to its productivity. Hence, understanding maize LAI is critical in assessing maize crop productivity. Unmanned Aerial Vehicle (UAV) imagery in concert with vegetation indices (VIs) obtained at high spatial resolution provides appropriate technologies for determining maize LAI at a farm scale. Five DJI Matrice 300 UAV images were acquired during the maize growing season, and 57 vegetation indices (VIs) were generated from the derived images. Maize LAI samples were collected across the growing season, a Random Forest (RF) regression ensemble based on UAV spectral data and the collected maize LAI samples was used to estimate maize LAI. The results showed that the optimal stage for estimating maize LAI using UAV-derived VIs in concert with the RF ensemble was during the vegetative stage (V8–V10) with an RMSE of 0.15 and an R2 of 0.91 (RRMSE = 8%). The findings also showed that UAV-derived traditional, red edge-based and new VIs could reliably predict maize LAI across the growing season with an R2 of 0.89–0.93, an RMSE of 0.15–0.65 m2/m2 and an RRMSE of 8.13–19.61%. The blue, red edge and NIR sections of the electromagnetic spectrum were critical in predicting maize LAI. Furthermore, combining traditional, red edge-based and new VIs was useful in attaining high LAI estimation accuracies. These results are a step towards achieving robust, efficient and spatially explicit monitoring frameworks for sub-Saharan African smallholder farm productivity.

1. Introduction

Smallholder agriculture is a critical sector in sub-Saharan African economies and sustains the livelihoods of most of the region’s households [1]. According to Mango et al. [2] and Kamara et al. [3], smallholder croplands support about 70% of households and contribute about 15% and 2.5% to Africa’s and South Africa’s GDPs, respectively. Maize (Zea mays L.) is the most important and widely grown grain crop in the smallholder farms of sub-Saharan Africa. In addition, the maize industry plays a significant role in the region’s economy due to its contribution to the formal and informal food systems, thus supporting national and household food security [4]. Due to the crop’s importance, regional governments closely monitor crop status to forecast productivity and food security. Often, trained extension officers perform physical crop health assessments at critical phenological stages and productivity. However, these assessments are time-consuming, expensive and at the officer’s discretion. Furthermore, due to the remoteness of smallholder farmers, the status and productivity of many maize fields are either estimated through extrapolation or not included in national assessments. Considering the importance of smallholder maize production in localized food systems and their potential to contribute to national food security, there is a dire need to explicitly generate monitoring frameworks for spatially optimizing assessments of maize. Under commercial maize production, secondary traits such as leaf area index and chlorophyll content have been used to assess crop health and productivity [5,6]. These traits could also be applied in smallholder systems.
Generally, crop productivity is evaluated based on its constituents, such as leaf area index (LAI), chlorophyll content concentration and yield. Amongst these constituents, LAI can be monitored to understand crop health status, canopy physiology and nutritional supply [7]. LAI is defined as half the area of all leaves per unit of surface area, and its estimation has long been a research focus for understanding biomass characteristics [8]. This is because LAI significantly influences the plant canopy physiological process, which is closely related to crop productivity. In addition, the total accumulation of LAI is strongly related to biomass accumulation and crop yield [9]. Therefore, monitoring maize LAI in smallholder farms could help assess crop conditions and variation across space and time for the detection of crop phenology and to model biomass and yield to optimize the productivity of smallholder farms. Furthermore, monitoring maize LAI is valuable for diagnosing and assessing crop deficiencies such as water and plant nutrition, which are necessary for optimizing smallholder productivity [10]. Hence, monitoring and estimating maize LAI is vital in enhancing productivity, combating food insecurity and addressing the sustainable development goals of reducing hunger and poverty [11,12].
Crop LAI can be monitored and estimated through traditional methods such as field surveys and point sample measurements [10]. Despite the high accuracy associated with the traditional methods, they are time-consuming, labor-intensive and lack spatial representativeness [13]. In contrast, remote sensing technologies have become increasingly popular in agricultural research as they offer fast and non-destructive ways of monitoring and estimating crop productivity parameters [14]. Remote sensing (RS) provides spatial and temporal information on crop responses to dynamic environmental conditions or information that relates directly to LAI. Such RS data have helped derive important crop parameters such as LAI, water use efficiency, chlorophyll and biomass fraction of photosynthetically active radiation [11,15,16].
There are numerous ways of using remotely sensed information to estimate LAI. The simplest is establishing an empirical relationship between the remotely sensed data products such as spectral bands, vegetation indices (VIs) and measured LAI [17]. Hence, several earth observation sensors have been used to estimate maize LAI with optimal accuracy. These include Landsat [18,19], moderate resolution imaging spectral radiometer (MODIS) [20,21] and, recently, a Sentinel-2 multispectral instrument (MSI) [7,22]. Despite the optimal accuracies associated with the data from these satellite-borne sensors in LAI estimation, the trade-off between its spatial and temporal resolution limits its use in capturing crop LAI heterogeneity and dynamics at a farm scale [13]. Yang et al. [23] noted that medium spatial resolution products, e.g., Landsat and Sentinel-2, have the potential to miss observations at critical growth stages because of their long revisit time (16 and 10 days, respectively), as well as their coarser spatial resolution, which is inadequate for smallholder fields of less than 5 Ha. In this regard, there is still a need to assess other sources of spatial data that could be cheaper and more flexible while offering very high spatial resolution data suitable for capturing crop LAI at farm-to-field scales.
The introduction of UAV remote sensing technology offers valuable remotely sensed data for estimating crop productivity constituents such as LAI [13]. UAV remote sensing technologies offer maximum flexibility in terms of temporal resolution since the flying times are user-determined. Their ability to fly at low altitudes, portability and generation of very high spatial resolution data of up to 5 cm makes them more suitable for farm-scale research than satellite remotely sensed data [17]. It is anticipated that the very high spatial resolution, combined with a multispectral resolution covering the red edge section of the electromagnetic spectrum (EMS) renowned for mapping the LAI of plants, could optimize the estimation of maize productivity in smallholder croplands. UAVs have been widely used in crop monitoring. For instance, Kanning et al. [24] successfully estimated wheat LAI with an R2 of 0.79 and an RMSE of 0.18, while Yao, Wang, Liu, Cheng, Tian, Chen and Zhu [14] estimated wheat LAI to an R2 of 0.80 and an RRMSE of 24% using UAV imagery. Guomin et al. [25] used UAV-derived VIs to estimate maize LAI to an R2 of 0.83 and an RMSE of 0.05. The proven compatibility of unmanned aerial vehicles with multi-spectral sensors enables daily LAI estimation at high resolution. However, most of these studies have been conducted based on single images in experimental plots outside of the Global South’s smallholder croplands. For an accurate estimation and outlook on a specific crop’s productivity and yield, multitemporal images are required to understand the growth trajectory of the crop for informed decision making before the harvesting. Hence, there is a need to assess the utility of UAV-derived multispectral data in assessing the productivity of staple crops such as maize in smallholder croplands of regions such as southern Africa, where hunger and poverty are rife and the need for optimizing crop production is imperative.
The literature illustrates that combining VIs with robust machine learning algorithms improves the accuracy of crop productivity models. VIs depict biophysical parameters of the plant canopy, such as biomass, greenness and LAI, and are calculated using the reflectance of two or more spectral bands [26]. VIs enhance the sensitivity to a specific crop parameter while suppressing the influence of other factors such as leaf and canopy structure [27]. Additionally, VIs counteract the impacts of soil background, atmospheric conditions, leaf pigment and inclination, among others [28]. Several VIs have been strongly correlated with maize LAI [27] and yield. These include the soil-adjusted VIs (i.e., the Soil Adjusted Vegetation Index and Optimized Soil Adjusted Vegetation Index) developed to reduce soil reflectance’s impact at low LAI. In recent years, due to the advancement in sensor technologies, VIs such as the Normalized Difference Vegetation Index (NDVI), based on the red edge (NDVIRE), the Normalized Difference Red Edge (NDRE), the Modified Simple Ratio Red Edge (MSRRE) and the red edge-based Chlorophyll Index (CIRE) have been developed and are now widely utilised [8]. These VIs have proven effective in estimating LAI, especially from moderate to high LAI, and are less influenced by canopy structures [13]. Qiao et al. [29] used UAV-acquired red edge-based VIs to estimate maize LAI to an R2 of 0.94, whilst Tao et al. [30] concluded that incorporating red edge-derived spectral features significantly improves the estimation of LAI. Nevertheless, most of these studies were conducted in irrigated and controlled experimental plots, not in smallholder rainfed croplands [29,31]. In this regard, their effectiveness in estimating rainfed maize crops with limited control in smallholder subsistence croplands across multiple growth stages remains largely unexplored [32].
Hence, this study sought to test the value of using UAV-derived VIs in estimating maize LAI across the growing season and determine its relationship with yield. A robust algorithm, Random Forest (RF) regression, was used to achieve this. This algorithm was chosen because of its high estimation accuracies, computation speed and robustness, as well as its ability to rank the prediction spectral features in order of importance [33,34]. Furthermore, RF is not affected by small sample sizes, as it employs its bootstrapping aggregation mechanism to optimize the samples while circumventing overfitting [35,36,37]. The specific objectives of this study were (1) to reliably estimate LAI using a combination of traditional, new and red edge-based VIs in conjunction with the RF algorithm and (2) to produce a model for the estimation of maize LAI at each growth stage based on UAV images and field-collected LAI measurements.

2. Materials and Methods

2.1. Study Site

This study was conducted in a maize crop field on a smallholder farm in Swayimane within the KwaZulu-Natal province, South Africa (29°31′24″S and 30°41′37″E), covering an area of 2699.005 m2 (Figure 1). The area has a sub-humid climate with hot and humid summers and warm and dry winters. According to Miya et al. [38], the area is characterized by a uni-modal rainfall pattern from November to March with an average precipitation of 900–1200 mm and an average temperature of 20 °C. Major economic activity in the area is small-scale sugarcane and maize farming.
The leaves with visible collars were used to discern the maize growth stage. Maize growth stages were divided into two sub-groups; that is, the vegetative (V) and reproductive (R) stages (Table 1) [39,40]. The V stages began with emergence, denoted VE. This stage marked the emergence of coleoptiles from the soil [40]. The following stages were subdivided numerically into V1, V2 and V3. The development of the first true leaf generally marked V2. Meanwhile, V3 was characterized by the establishment of the collar of the third leaf between 10 and 14 days after emergence. The vegetative stages could proceed to V(n) Nth leaf collar depending on the crop variety. The final V stage was the tasseling stage, typically noted by the appearance of a fully extended tassel. The plant at the tasseling stage had developed to a full height and all leaves had emerged. The next stage was the reproductive and kernel development stages, generally denoted using the letter R [40]. The first reproductive stage was R1, silking. At this stage, silks emerged outside the husks with pollen shed at a rate of 1 to 1.5 inches per day [39,40]. This was followed by the blister stage, denoted R2 at approximately 70 days after emergence. At this stage, the blisters occurred most between 10 and 14 days after silking. Small watery kernels were developed, while silks were browning and drying out [39]. The milk stage (R3) occurred between 18 and 22 days after silking. At this stage, the kernel developed a milky fluid inside. The milk stage occurred 91 days after emergence. The dough stage (R4) followed approximately 105 days after emergence. At this stage, the kernels had a pasty consistency. The dent (R5) occurred about 112 days after emergence. At this point, the cobs had been developed. This stage was identified using the milk or starch line (a line separating the solid and the liquid endosperms), which progressively gravitates towards the cob as moisture is being lost and the kernel matures [39,40]. The final stage was physiological maturity, also referred to as the black layer (R6), and occurred approximately 160 days after emergence. At the black layer stage, the milk line had progressed to the base of the kernel and a black line had developed at the kernel base [39].

2.2. LAI Measurements

A polygon map was generated in Google Earth Pro covering the maize field to estimate the maize LAI. The polygon was imported into ArcMap 10.6 as a keyhole markup language (kml) file and used to generate stratified random sampling points and determine the flight path. A total of 63 points were generated and used for this analysis. These sampling points were loaded into a Trimble handheld Global Positioning System (GPS) with an accuracy of 30 cm and used to locate the sampling points in the plot. At each sample point, a maize plant close to the sample point was marked for ease of identification and used for further sampling. Five field surveys were conducted during the vegetative (V) and reproductive (R) growth stages, i.e., V8–V10 (18 March 2021), V10–V12 (31 March 2021), VT–R1 (12 April 2021), R2–R3 (28 April 2021) and R3–R4 (14 May 2021). UAVs were acquired at each field survey.
The LAI was determined by using the LiCOR 2200C Plant Canopy Analyzer. The LiCOR 2200C has a fisheye optical sensor with five concentric rings centered at zenith angles 7°, 22°, 38°, 52° and 68° measuring radiation above and below the canopy to estimate canopy light interception and transmittance at five angles. The LAI was determined by inverting the Beer–Lambert law [41].

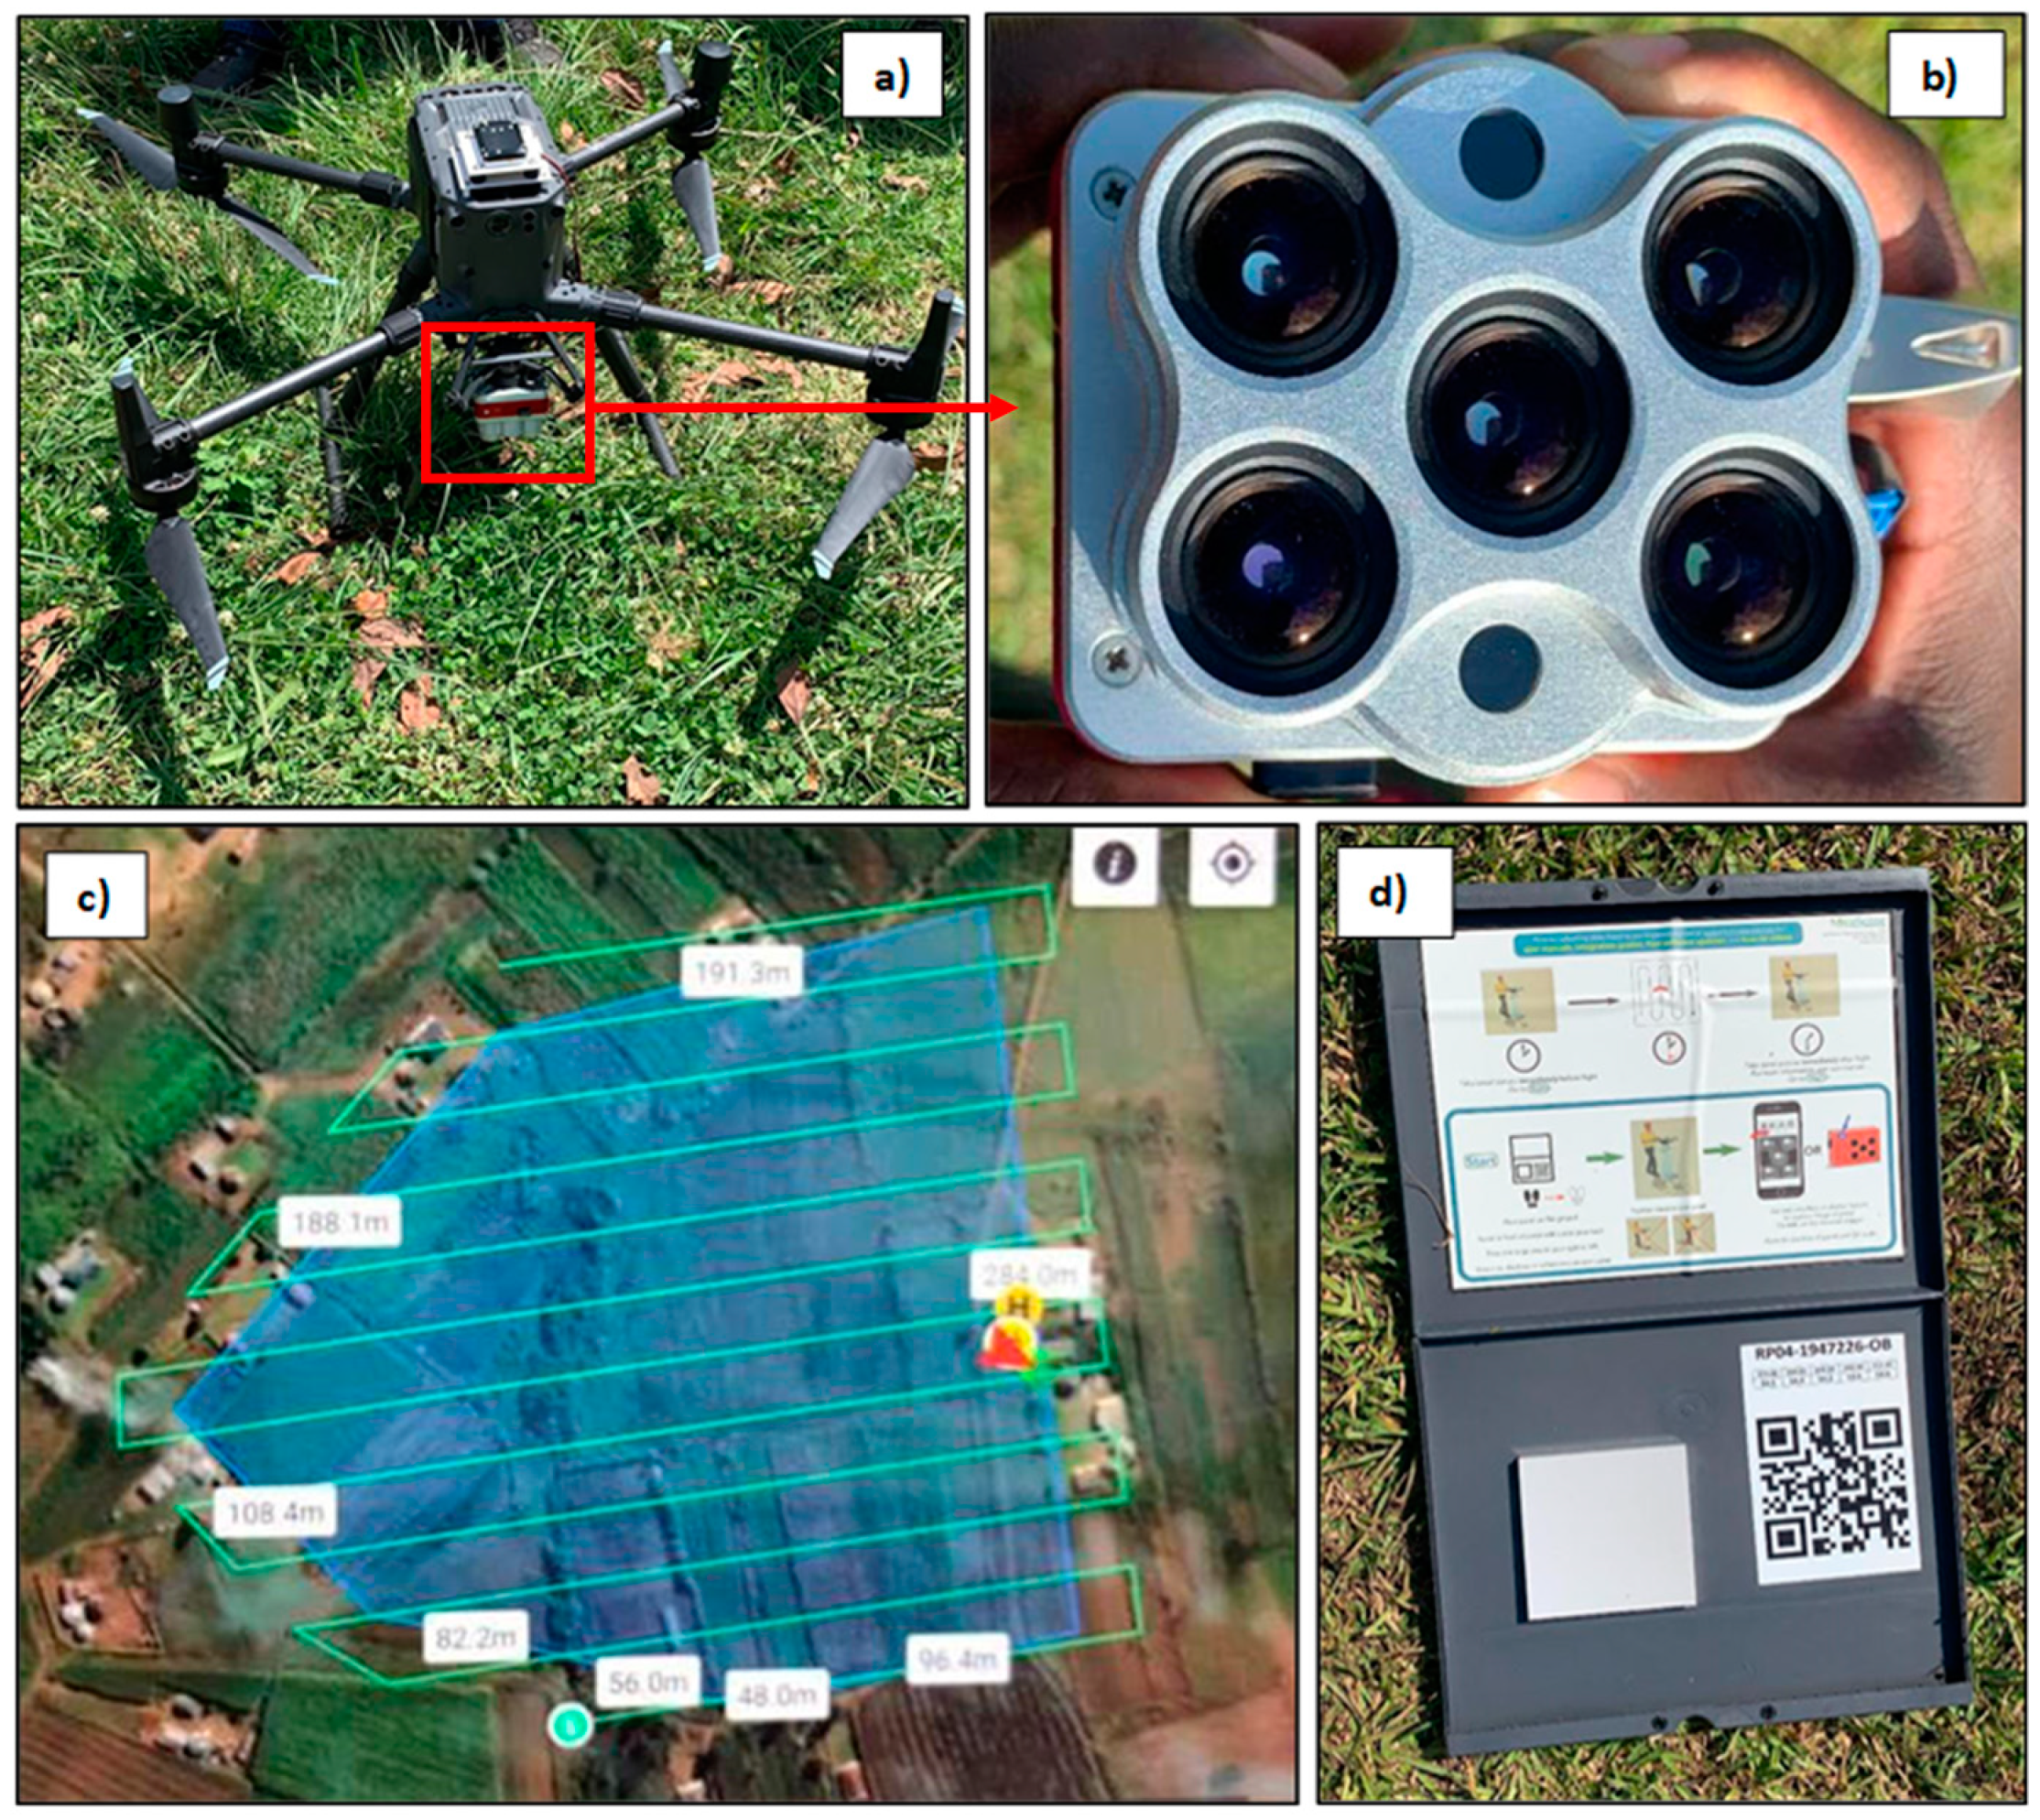
2.3. Image Acquisition and Pre-Processing

A Mica Sense multi-spectral camera (Altum) (Figure 2b) was mounted on a UAV (DJI Matrice 300) (Figure 2a) to acquire multi-spectral images of the study area. The Altum consists of five spectral bands (blue, green, red, red edge and NIR) with a radiometric thermal camera for the thermal region of the EMS, hence acquiring multispectral and thermal imagery in a single flight. More details regarding the platform and the camera are detailed in Ndlovu et al. [4] and Brewer et al. [42]. Before the flights, a flight plan (Figure 2c) was established using the polygon of the study area created in Google Earth Pro and imported as a kml file into the drone controller to generate the flight path (Figure 2c). Calibration was also conducted just before flying the UAV by acquiring images of the radiometric calibration target provided (Figure 2d), which was set to be horizontal and not covered by any shadows. This was performed to account for the illumination and atmospheric conditions prevalent during the flight. The flights were carried out on clear days between 10:00 AM and 1:00 PM local time, as it was the most optimum time of the day when the solar zenith angle was minimal and radiation from the sun was at a maximum. The flight altitude was kept 100 m above the ground, obtaining images with a spatial resolution of 5 cm.
Pix4D 4.6 software was used to pre-process the UAV images. This was conducted to account for radiometric and geometric errors. The images were imported into the Pix4D software; after that, relative calibration and radiometric correction were conducted by stitching the images to create ortho-images of the entire study area. Placemarks surveyed before the fieldwork were then employed to improve the geometric accuracy of the acquired images.

2.4. Data Analysis

The UAV bands were used to calculate 57 VIs (Table 2). Specifically, traditional, red edge-based and new VIs (nDVI) based on all possible combinations of the 6 spectral bands were calculated in geographic information systems (GIS). The new VIs were created to evaluate their potential in improving the estimation of maize LAI across the growing season. The UAV-derived VIs were then used to estimate maize LAI across the growing season. The UAV data used in this study are summarized in Table 2. All vegetation indices were loaded in the model computation to estimate LAI, and the RF selected the optimal spectral features as described in Section 2.5 below. We then correlated the LAI with the observed yield data.

2.5. Maize LAI Prediction

Before predicting the LAI using UAV-acquired remotely sensed data, we assessed the magnitude of the relationship between field-measured LAI and field-measured yield of maize based on Pearson’s product moments correlation after assessing the data for normality. We sought to evaluate whether any changes in LAI (a proxy for biomass accumulation) could be associated with a change in yield. Before conducting Person’s correlation test, the LAI estimates measured in the field at different stages were averaged to relate them with grain yield. Grain yield was destructively derived from each sampling plot and measured using a digital scale.
The RF algorithm was then used to estimate maize LAI across the growing season. RF is amongst the group of supervised ensemble regression machine learning techniques developed to advance the classification and regression trees algorithm by compiling a huge set of decision trees. RF uses a bootstrap aggregation technique popularly known as bagging. In conducting bagging, RF creates decision trees and then trains each tree using exclusive data samples from the field-measured data (LAI). Data sampling for each tree is conducted with replacements from the main pool. Its popularity is based on optimizing the regression trees (ntree) method by combining a large set of decision trees. Another hyperparameter of RF, mtry, regulates that split-variable randomization feature. This study implemented the RF machine learning technique using the R interface. In R, the doBest function was used to optimize the ntree and mtry parameters to 200 and 5, respectively, as they were the best combination of parameters after testing the ntree values in increments of 100 to 2500 and the mtry values in increments of 1 to 5. The resulting models of each growth stage were then compared to assess the best-performing model. RF conducted the optimal spectral feature selection, and these optimal features were identified using their relatively high variable importance scores.

2.6. Accuracy Assessment

To assess the performance of the models, the dataset (n = 63) was split into 70% training (n = 44) and 30% test (n = 19) datasets. The training data were used to train the model and the test data were used to evaluate the estimation models. The performance of each model in estimating LAI was evaluated using the coefficient of determination, the root mean square error (RMSE) and the relative root mean square error (RRMSE). The RMSE measures the average deviation of the estimates from the observed values or is the square root of the variance of the residuals, while R2 is the fraction of the total sum of squares explained by the regression. In this regard, a model that yielded a high R2 and low RMSE was then used to create an LAI map for the study site in ArcMap 10.6. The RMSE took precedence over the R2 in cases where the R2 was not the highest, but RMSE was the lowest.
RMSE = S S E 2 n
RRMSE   % = R M S E M E A N × 100
where the SSE symbolizes the sum of squared errors and MEAN is the average of the field-measured samples. The LAI index mathematical models and the selected optimal spectral variables were then used to create LAI maps using the raster calculator in ArcMap.

3. Results

3.1. Descriptive Statistics

The descriptive statistics of LAI measured in the field for all the growth stages (i.e., V8–V10, V10–V12, VT–R1, R2–R3 and R3–R4) are shown in Table 3. The highest average maize LAI of 3.44 was obtained from the R3–R4 growth stages, and the lowest was observed for the V8–V10 growth stages, which was 1.78. Furthermore, the R3–R4 growth stages had the highest maximum LAI of 6.29 compared with the rest. The V8–V10 stages had the lowest LAI of 0.47 compared with the rest. The mean LAI increased along with an increase in maize crop productivity. In assessing the general relationship between the maize field-measured LAI estimates and the yield, results showed a significant (α = 0.05) positive correlation. Specifically, a correlation coefficient (r) of 0.74 indicated a strong positive relationship between the yield and the LAI. This implied that an increase in average LAI estimates is associated with a significant increase in yield.

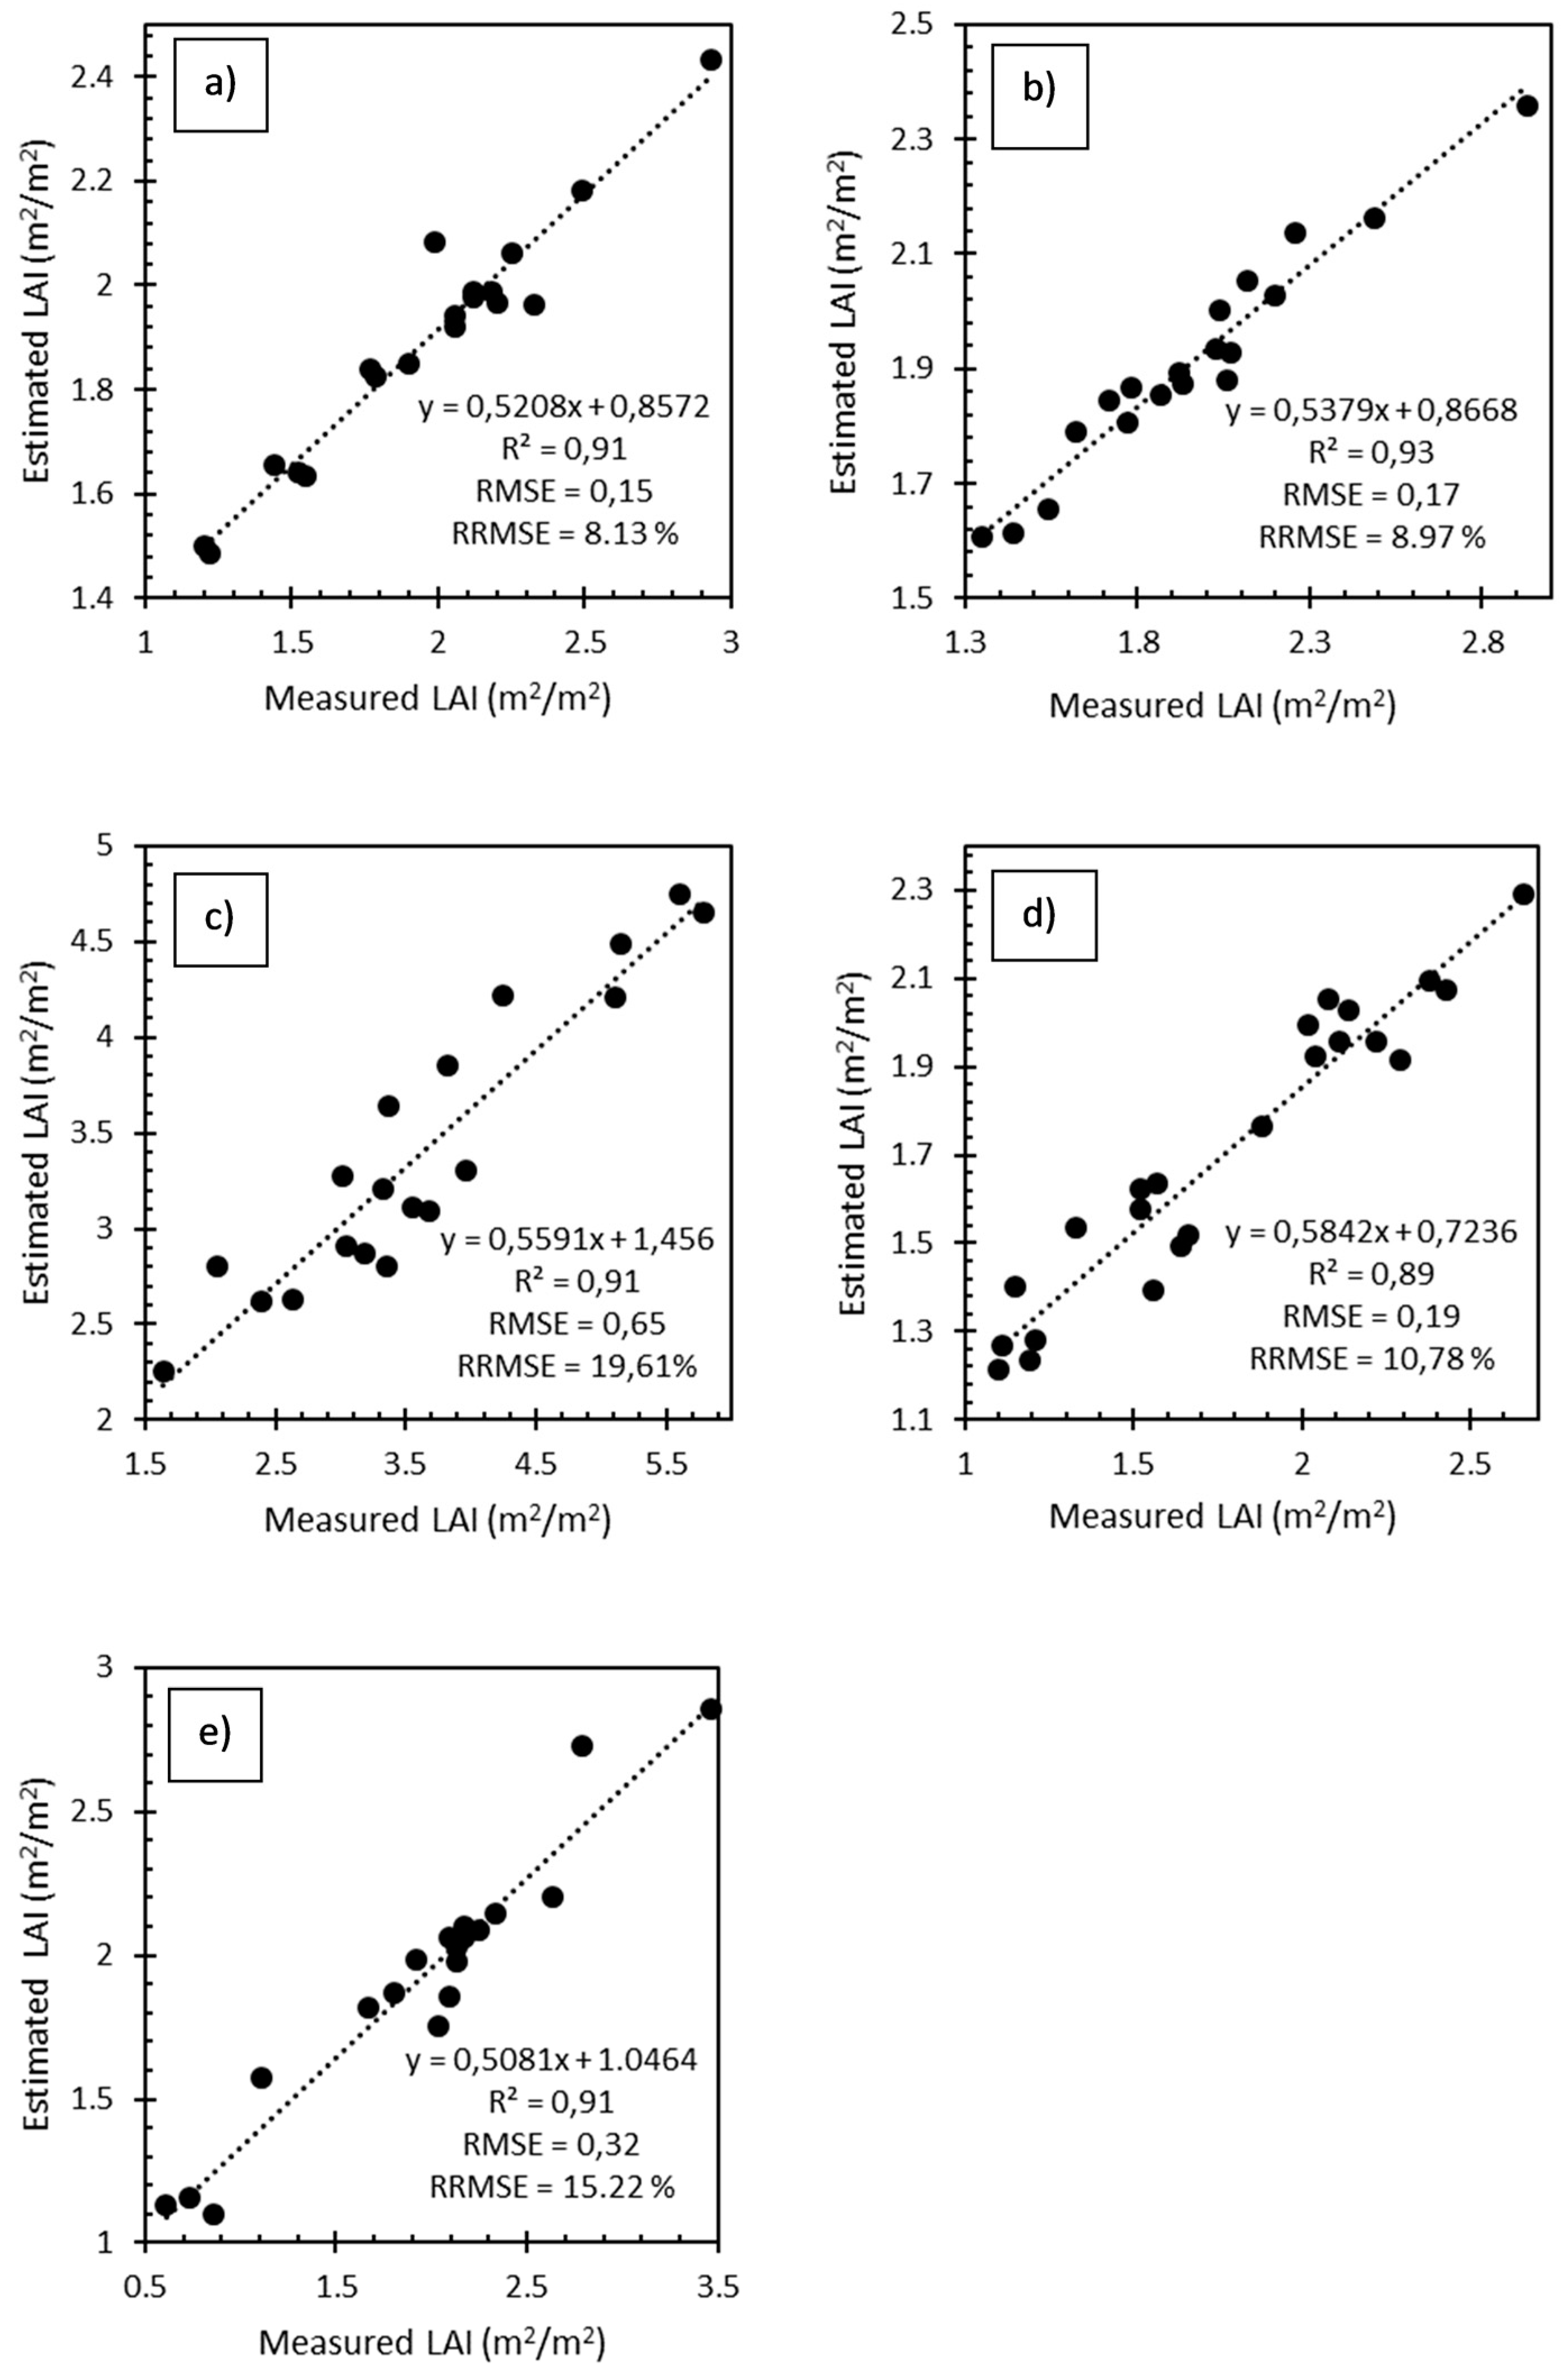
3.2. Derived Maize LAI Prediction Models and Their Accuracies

Figure 3 demonstrates a significant positive correlationbetween field-measured yield and field measured LAI estimates of maize. Figure 4 demonstrates the model accuracies obtained in estimating maize LAI based on the RF algorithm. The prediction models’ accuracy was moderate to high across the different maize growth stages. For instance, the most optimal model for predicting LAI was the V8–V10 growth stages with an R2 of 0.91, an RMSE of 0.15 m2/m2 and an RRMSE of 8.13% (Figure 4a) based on ndviB&T and ndviG&B spectral variables (Figure 5a). The V12–V14 growth stages exhibited the second-best model with a maize LAI model with an R2 of 0.93, an RMSE of 0.17 m2/m2 and an RRMSE of 8.97% (Figure 4b), with BNDVI and ndviB&NIR being more influential for the model (Figure 5b).
Meanwhile, the VT–R1 growth stages demonstrated a moderate prediction accuracy in estimating maize LAI (R2 = 0.91, RMSE = 0.65 m2/m2 and RRMSE = 19.61%) (Figure 4c). The most suitable predictor variables for this stage included ndviNIR&T and ndviR&T (Figure 5c). This was followed by a drastic improvement in the R2–R3 growth stages, with an R2 of 0.89, an RMSE of 0.19 m2/m2 and RRMSE of 10.78% (Figure 4d). The most influential variables for this prediction were CI and ndviB&RE (Figure 4d). The R3–R4 growth stages also yielded a least model with an R2 = 0.91, an RMSE = 0.32 m2/m2 and an RRMSE = 15.22% (Figure 4e). The most optimal variables for predicting maize LAI at the R3–R4 growth stages were ndviNIR&B and ndviB&NIR (Figure 5e).
Figure 6 illustrates the spatial distribution of LAI estimated using UAV remotely sensed data at different phenological stages. Following the maize development stages considered in this study, the spatial variation of LAI increased with the increase in the growing stages. Across all maps, the eastern section of the field exhibited slightly higher maize LAI estimates in relation to the western section.

4. Discussion

This study sought to test the utility of UAV-derived VIs in estimating maize LAI across the growing season based on the Altum sensor mounted on the DJI Matrice 300 UAV data. Specifically, this study sought to estimate LAI using a combination of UAV-derived traditional, new and red edge-based bands, indices and the RF algorithm across the growing season within a smallholder farm.

4.1. Predicting Maize LAI

The results of this study showed that maize LAI could be optimally estimated at the V8–V10 growth stages to an R2 of 0.91, an RMSE of 0.15 m2/m2 and an RRMSE of 8.13%, with the most influential variables being the ndviG&B and ndviB&T, derived using the green, blue and thermal spectral variables. This finding demonstrates the sensitivity of maize LAI to the blue, green and thermal regions of the EMS in the early growth stages. The literature notes that the blue section of the EMS is sensitive to green vegetation, as plants use it during photosynthesis, which results in its absorption by vegetation, hence its influence in predicting LAI [54,55]. The literature also notes that the presence of bright green vegetation on the ground during the early stages of plant growth results in a high reflectance in the green region of the EMS, which explains the sensitivity of maize LAI to the green section of the EMS at the V8–V10 stages for this study [56,57]. These findings agree with Motohka et al. [58], who noticed a decrease in green reflection when leaves changed from bright green in the early stages to dark green towards the later stages of the season. This is attributed to the end of the formation of new leaves, which was also detected using spectral variables derived from the green section of the EMS. New leaves tend to be thinner and primarily function as a source for plant assimilates. Older leaves are thicker and are actively photosynthesizing and functioning as an assimilation source for the cob. In addition, the thermal band was also amongst the most influential spectral predictor variables. This could be explained by the fact that during the V8–V10 growth stages, there is low foliage density. The literature notes that when there is low foliage density, the soil tends to absorb more heat, resulting in a high reflectance of the thermal region from the ground, which explains the sensitivity to the thermal band during this stage for this study [59].
In estimating maize LAI during the V12–V14 growth stages, UAV-derived VIs yielded an R2 of 0.93, an RMSE of 0.17 m2/m2 and an RRMSE of 8.97% based on spectral variables derived from the blue and NIR regions of the EMS (BNDVI). The results of these growth stages signify the sensitivity of maize LAI to the blue and NIR sections of the EMS to maize LAI during the V12–V14 growth stages. As mentioned earlier, the blue region of the EMS plays an important role in the daily plant photosynthetic process, hence the importance of the blue waveband at this growth stage as well [54]. In explaining the sensitivity of maize LAI to the NIR section of the EMS, the literature notes that this section is significant in vegetation monitoring, as healthy vegetation tends to reflect highly in this section, hence its influence in estimating LAI [13,44,60]. Specifically, maize plants’ presence and increased foliage density result in leaves strongly reflected in the NIR section of the EMS. Correspondingly, studies by He et al. [61] and Tunca et al. [10] successfully illustrated the use of leaf optical reflectance in the NIR section of the EMS in optimally predicting LAI with an R2 of 0.83 and 0.77, respectively. Specifically, the presence and increased foliage density due to leaf and stem elongation result in leaves strongly reflected in the NIR section of the EMS.
In predicting maize LAI at the VT–R1 growth stages, UAV-derived VIs produced a prediction model with an R2 of 0.91, an RMSE of 0.65 m2 m−2 and an RRMSE of 19.61% based on the combination of spectral variables derived from the red and NIR regions of the EMS (ndviR&T and ndviNIR&T). The EMS’s red and NIR sections were significant in vegetation monitoring. Specifically, vegetation tends to absorb in the red section strongly and, as mentioned earlier, reflects highly in the NIR section, explaining the sensitivity of maize LAI to these sections of the EMS. As in this study, Kanning et al. [24] noted that these red and NIR band-based indices presented a higher sensitivity to crop growth parameters. These sections of the EMS are of great value in explaining LAI because the level of absorption in the red section and reflection in the NIR section reflects on the amount of vegetation present on the ground; therefore, the higher the absorption and reflection in the red and NIR sections, respectively, the higher the amount of vegetation on the ground and vice versa [47].
When predicting maize LAI at the R2–R3 growth stages using UAV-derived VIs, a model with an R2 of 0.89, an RMSE of 0.19 m2 m−2 and an RRMSE of 10.78% was obtained based on the indices derived using the blue and red wavebands together with the red edge wavebands (ndviB&RE and CI). This indicates maize LAI sensitivity to the EMS’s blue, red and red edge sections in the R2–R3 growth stages. The contribution of the red edge could be attributed to the fact that chlorophyll and biomass are sensitive to the red edge [15]. Specifically, LAI is correlated to chlorophyll and biomass, hence the influence of the red edge in predicting LAI [28]. Finally, in the R3–R4 growth stages, maize LAI was sensitive to the blue and NIR sections of the EMS. These produced an optimal model with an R2 of 0.91, an RMSE of 0.32 m2 m−2 and an RRMSE of 15.22%. As previously mentioned, the influence of the blue and NIR bands in predicting maize LAI could be explained by the blue band’s role in photosynthesis and the strong reflection of vegetation in the NIR section of the EMS.

4.2. The Performance of Combining UAV-Derived Traditional, Red Edge-Based and New VIs in Predicting Maize LAI

The results of this study show that combining traditional, red edge-based and new VIs produced good LAI prediction models for all the growth stages. This could be due to the sensitivity of the red edge region of the EMS, together with the ability of VIs to enhance vegetation features to the variation in LAI changes [27]. Across the growing season, LAI changes as shown in Table 3. During the early stages (V8–V10 and V12–V14) of the growing season, leaves are small and as maize grows, so do the leaves. This results in the alteration of LAI across the phenological cycle. Therefore, the red edge section of the EMS better detects the spectral reflectance of these growth stages, which shifts with vegetation growth, expanding on the performance of VIs [62]. Additionally, the red edge region of the EMS is also sensitive to chlorophyll content variability, which increases as maize grows. This also contributes to the high accuracy of estimating maize LAI when VIs are combined with the red edge.
Meanwhile, VIs are sensitive to distinctive spectral properties of green vegetation in the image caused by the reflectance of maize at various growth stages on particular spectral bands such as the red, red edge and NIR [24]. Furthermore, VIs are highly correlated with LAI. This then boosts the robustness of VIs in estimating LAI. VIs are also sensitive to the LAI variability caused by the different stages of the phenological cycle and the accumulating chlorophyll content throughout the crop’s growing season [63]. In this regard, the high estimation accuracies of LAI are realized when the traditional, red edge-based and new VIs are combined. In addition, VIs optimize the characterization of spatial information on vegetation while increasing the range of LAI to optimal levels [61]. The results of this study are consistent with those of Fu, Yang, Wang, Song, Feng and Agriculture [60], who reported that models derived from the combination of VIs and band parameters could effectively increase the accuracy of winter wheat biomass estimation when compared with the performance of bands or VIs as stand-alone data. Another study by He, Zhang, Su, Lu, Yao, Cheng, Zhu, Cao and Tian [61] estimated rice LAI based on a new vegetation index and concluded that the combination of the NIR and red edge bands was the best in predicting rice LAI (R2 = 0.6, RMSE = 1.41 m2/m2).
Although the findings of this experimental study address the overarching objective, the caveats of UAV-derived datasets need to be stated, as they negatively impact related studies. For instance, most studies based on UAV remotely sensed data cover small spatial extents due to the battery power’s inhibited duration and weight [64]. Batteries that either have limited power or are heavy tend to inhibit the flight plan and time to a small area. This limits these earth observation technologies and associated experimental studies to farm or field scales.

4.3. Implications of the Study to Yield Prediction Using Machine Learning Methods Based on UAV Data

The findings of this study illustrate that there are high prospects of mapping and monitoring the LAI of maize in rainfed smallholder croplands at optimal accuracies based on UAV remotely sensed data in conjunction with RF regression ensemble. However, it must be acknowledged that the utility of different machine learning algorithms in different environmental settings and maize varieties may exhibit uncertainties and variations in the accuracy of the derived models. Different environmental settings and maize varieties impact the physiology of these crops, which regulates their LAI, yields and spectral responses spatially and temporally, resulting in model uncertainties. Meanwhile, different machine learning algorithms use different optimization parameters and hyperparameters, which also could compound uncertainties in models derived from different machine learning algorithms. In this regard, these aspects must be considered in interpreting the findings of similar studies. Furthermore, more research efforts are still required to strengthen crop productivity modeling based on UAV remotely sensed data, especially at a farm scale.

5. Conclusions

This study sought to test the utility of UAV-derived VIs in estimating maize LAI across the growing season based on the Altum sensor mounted on the DJI Matrice 300 UAV data in a smallholder farm. Based on the findings of this study, it can be concluded that:
  • Maize LAI can be optimally estimated using UAV-derived VIs across the growing season;
  • The blue, green, red edge and NIR sections of the EMS are influential in estimating maize LAI;
  • Combining traditional, red edge-based and new VIs is useful in attaining high LAI estimation accuracies.
Quantitative assessments of maize LAI attained in this study are a step towards developing non-destructive and cost-effective methods for routine and timely monitoring of maize LAI in smallholder farms for improved crop health and productivity estimation. The findings indirectly contribute to a better understanding of maize crop health and crop monitoring efforts for improved food security.

Author Contributions

Conceptualization, S.B., M.S., O.M, J.O. and T.M.; methodology, S.B., M.S., O.M. and J.O.; software, S.B., M.S., A.D.C. and T.M.; validation, S.B., M.S., O.M. and J.O.; formal analysis, S.B. and M.S.; investigation, S.B., M.S., O.M., J.O. and T.M.; resources, O.M. and J.O.; data curation, S.B.; writing—original draft preparation, S.B. and M.S.; writing—review and editing, S.B., M.S., J.O., O.M., T.M, V.G.P.C. and A.D.C.; supervision, O.M. and M.S.; project administration, M.S.; funding acquisition, T.M. and O.M. All authors have read and agreed to the published version of the manuscript.

Funding

This work was funded by the Water Research Commission of South Africa (WRC) through Project WRC K5/2971//4, titled “Use of drones in monitoring crop health, water stress, crop water requirements and improve on crop water productivity to enhance precision agriculture and irrigation scheduling” and in part by the National Research Foundation of South Africa (NRF) Research Chair in Land Use Planning and Management (Grant Number: 84157).

Data Availability Statement

The data presented in this study are available on request from the corresponding author. The data are not publicly available due to authorization restrictions from the funder that limit the distribution of data, as the article is part of an ongoing project where other manuscripts are still being prepared.

Acknowledgments

The authors wish to thank Vivek Naiken, Snethemba Ndlovu, Trylee Matongera, Israel Odebiri, Serge Kiala, Welcome Ngcobo, Mhlabeni Mthembu, Maclord Murenje, Lwando Royimani, Mthokozisi Buthelezi, Amanda Nyawose and Kiara Brewer for their assistance with fieldwork and laboratory logistics.

Conflicts of Interest

The authors declare no conflict of interest.

References

  1. Gollin, D. Smallholder Agriculture in Africa; International Institute for Environment and Development: London, UK, 2014. [Google Scholar]
  2. Mango, N.; Siziba, S.; Makate, C. The impact of adoption of conservation agriculture on smallholder farmers’ food security in semi-arid zones of southern Africa. Agric. Food Secur. 2017, 6, 32. [Google Scholar] [CrossRef] [Green Version]
  3. Kamara, A.; Conteh, A.; Rhodes, E.R.; Cooke, R.A. The relevance of smallholder farming to African agricultural growth and development. Afr. J. Food Agric. Nutr. Dev. 2019, 19, 14043–14065. [Google Scholar] [CrossRef]
  4. Ndlovu, H.S.; Odindi, J.; Sibanda, M.; Mutanga, O.; Clulow, A.; Chimonyo, V.G.; Mabhaudhi, T. A Comparative Estimation of Maize Leaf Water Content Using Machine Learning Techniques and Unmanned Aerial Vehicle (UAV)-Based Proximal and Remotely Sensed Data. Remote Sens. 2021, 13, 4091. [Google Scholar] [CrossRef]
  5. Guo, Y.; Chen, S.; Li, X.; Cunha, M.; Jayavelu, S.; Cammarano, D.; Fu, Y. Machine learning-based approaches for predicting SPAD values of maize using multi-spectral images. Remote Sens. 2022, 14, 1337. [Google Scholar] [CrossRef]
  6. Jay, S.; Maupas, F.; Bendoula, R.; Gorretta, N. Retrieving LAI, chlorophyll and nitrogen contents in sugar beet crops from multi-angular optical remote sensing: Comparison of vegetation indices and PROSAIL inversion for field phenotyping. Field Crops Res. 2017, 210, 33–46. [Google Scholar] [CrossRef] [Green Version]
  7. Luo, P.; Liao, J.; Shen, G. Combining spectral and texture features for estimating leaf area index and biomass of maize using Sentinel-1/2, and Landsat-8 data. IEEE Access 2020, 8, 53614–53626. [Google Scholar] [CrossRef]
  8. Dong, T.; Liu, J.; Shang, J.; Qian, B.; Ma, B.; Kovacs, J.M.; Walters, D.; Jiao, X.; Geng, X.; Shi, Y. Assessment of red-edge vegetation indices for crop leaf area index estimation. Remote Sens. Environ. 2019, 222, 133–143. [Google Scholar] [CrossRef]
  9. Gitelson, A.A.; Peng, Y.; Arkebauer, T.J.; Schepers, J. Relationships between gross primary production, green LAI, and canopy chlorophyll content in maize: Implications for remote sensing of primary production. Remote Sens. Environ. 2014, 144, 65–72. [Google Scholar] [CrossRef]
  10. Tunca, E.; Köksal, E.S.; Çetin, S.; Ekiz, N.M.; Balde, H. Yield and leaf area index estimations for sunflower plants using unmanned aerial vehicle images. Environ. Monit. Assess. 2018, 190, 682. [Google Scholar] [CrossRef]
  11. Peng, Y.; Li, Y.; Dai, C.; Fang, S.; Gong, Y.; Wu, X.; Zhu, R.; Liu, K. Remote prediction of yield based on LAI estimation in oilseed rape under different planting methods and nitrogen fertilizer applications. Agric. For. Meteorol. 2019, 271, 116–125. [Google Scholar] [CrossRef]
  12. Jin, Z.; Azzari, G.; You, C.; Di Tommaso, S.; Aston, S.; Burke, M.; Lobell, D.B. Smallholder maize area and yield mapping at national scales with Google Earth Engine. Remote Sens. Environ. 2019, 228, 115–128. [Google Scholar] [CrossRef]
  13. Martínez-Guanter, J.; Egea, G.; Pérez-Ruiz, M.; Apolo-Apolo, O. Estimation of the leaf area index in maize based on UAV imagery using deep learning techniques. In Precision Agriculture’19; Wageningen Academic Publishers: Wageningen, The Netherlands, 2019; p. 1304. [Google Scholar]
  14. Yao, X.; Wang, N.; Liu, Y.; Cheng, T.; Tian, Y.; Chen, Q.; Zhu, Y. Estimation of wheat LAI at middle to high levels using unmanned aerial vehicle narrowband multispectral imagery. Remote Sens. 2017, 9, 1304. [Google Scholar] [CrossRef] [Green Version]
  15. Tumlisan, G.Y. Monitoring Growth Development and Yield Estimation of Maize Using very High-Resolution UAV-Images in Gronau, Germany. Master’s Thesis, University of Twente, Enschede, The Netherlands, 2017. [Google Scholar]
  16. Tao, H.; Xu, S.; Tian, Y.; Li, Z.; Ge, Y.; Zhang, J.; Wang, Y.; Zhou, G.; Deng, X.; Zhang, Z. Proximal and remote sensing in plant phenomics: Twenty years of progress, challenges and perspectives. Plant Commun. 2022, 3, 100344. [Google Scholar] [PubMed]
  17. Gao, L.; Yang, G.; Li, H.; Li, Z.; Feng, H.; Wang, L.; Dong, J.; He, P. Winter wheat LAI estimation using unmanned aerial vehicle RGB-imaging. Zhongguo Shengtai Nongye Xuebao/Chin. J. Eco-Agric. 2016, 24, 1254–1264. [Google Scholar]
  18. González-Sanpedro, M.; Le Toan, T.; Moreno, J.; Kergoat, L.; Rubio, E. Seasonal variations of leaf area index of agricultural fields retrieved from Landsat data. Remote Sens. Environ. 2008, 112, 810–824. [Google Scholar] [CrossRef] [Green Version]
  19. Su, W.; Huang, J.; Liu, D.; Zhang, M. Retrieving corn canopy leaf area index from multitemporal Landsat imagery and terrestrial LiDAR data. Remote Sens. 2019, 11, 572. [Google Scholar] [CrossRef] [Green Version]
  20. Yu, H.; Yin, G.; Liu, G.; Ye, Y.; Qu, Y.; Xu, B.; Verger, A. Validation of Sentinel-2, MODIS, CGLS, SAF, GLASS and C3S Leaf Area Index Products in Maize Crops. Remote Sens. 2021, 13, 4529. [Google Scholar] [CrossRef]
  21. Kira, O.; Nguy-Robertson, A.L.; Arkebauer, T.J.; Linker, R.; Gitelson, A.A. Toward generic models for green LAI estimation in maize and soybean: Satellite observations. Remote Sens. 2017, 9, 318. [Google Scholar] [CrossRef] [Green Version]
  22. Amin, E.; Verrelst, J.; Rivera-Caicedo, J.P.; Pipia, L.; Ruiz-Verdú, A.; Moreno, J. Prototyping Sentinel-2 green LAI and brown LAI products for cropland monitoring. Remote Sens. Environ. 2021, 255, 112168. [Google Scholar] [CrossRef]
  23. Yang, K.; Gong, Y.; Fang, S.; Duan, B.; Yuan, N.; Peng, Y.; Wu, X.; Zhu, R. Combining Spectral and Texture Features of UAV Images for the Remote Estimation of Rice LAI throughout the Entire Growing Season. Remote Sens. 2021, 13, 3001. [Google Scholar] [CrossRef]
  24. Kanning, M.; Kühling, I.; Trautz, D.; Jarmer, T. High-resolution UAV-based hyperspectral imagery for LAI and chlorophyll estimations from wheat for yield prediction. Remote Sens. 2018, 10, 2000. [Google Scholar] [CrossRef] [Green Version]
  25. Guomin, S.; Yajie, W.; Wenting, H. Estimation Method of Leaf Area Index for Summer Maize Using UAV-Based Multispectral Remote Sensing. Smart Agric. 2020, 2, 118. [Google Scholar]
  26. Zhang, H.; Lan, Y.; Lacey, R.; Hoffmann, W.; Huang, Y. Analysis of vegetation indices derived from aerial multispectral and ground hyperspectral data. Int. J. Agric. Biol. Eng. 2009, 2, 33–40. [Google Scholar]
  27. Sun, Y.; Qin, Q.; Ren, H.; Zhang, T.; Chen, S. Red-edge band vegetation indices for leaf area index estimation from sentinel-2/msi imagery. IEEE Trans. Geosci. Remote Sens. 2019, 58, 826–840. [Google Scholar] [CrossRef]
  28. Ngie, A.; Ahmed, F. Estimation of Maize grain yield using multispectral satellite data sets (SPOT 5) and the random forest algorithm. S. Afr. J. Geomat. 2018, 7, 11–30. [Google Scholar] [CrossRef] [Green Version]
  29. Qiao, L.; Gao, D.; Zhao, R.; Tang, W.; An, L.; Li, M.; Sun, H. Improving estimation of LAI dynamic by fusion of morphological and vegetation indices based on UAV imagery. Comput. Electron. Agric. 2022, 192, 106603. [Google Scholar] [CrossRef]
  30. Tao, H.; Feng, H.; Xu, L.; Miao, M.; Long, H.; Yue, J.; Li, Z.; Yang, G.; Yang, X.; Fan, L. Estimation of crop growth parameters using UAV-based hyperspectral remote sensing data. Sensors 2020, 20, 1296. [Google Scholar] [CrossRef] [Green Version]
  31. Fu, Z.; Jiang, J.; Gao, Y.; Krienke, B.; Wang, M.; Zhong, K.; Cao, Q.; Tian, Y.; Zhu, Y.; Cao, W. Wheat growth monitoring and yield estimation based on multi-rotor unmanned aerial vehicle. Remote Sens. 2020, 12, 508. [Google Scholar] [CrossRef] [Green Version]
  32. Li, C.; Chimimba, E.G.; Kambombe, O.; Brown, L.A.; Chibarabada, T.P.; Lu, Y.; Anghileri, D.; Ngongondo, C.; Sheffield, J.; Dash, J. Maize yield estimation in intercropped smallholder fields using satellite data in southern Malawi. Remote Sens. 2022, 14, 2458. [Google Scholar] [CrossRef]
  33. Srinet, R.; Nandy, S.; Patel, N. Estimating leaf area index and light extinction coefficient using Random Forest regression algorithm in a tropical moist deciduous forest, India. Ecol. Inform. 2019, 52, 94–102. [Google Scholar] [CrossRef]
  34. Gao, R.; Torres-Rua, A.F.; Aboutalebi, M.; White, W.A.; Anderson, M.; Kustas, W.P.; Agam, N.; Alsina, M.M.; Alfieri, J.; Hipps, L.; et al. LAI estimation across California vineyards using sUAS multi-seasonal multi-spectral, thermal, and elevation information and machine learning. Irrig. Sci. 2022, 40, 731–759. [Google Scholar] [CrossRef]
  35. Adam, E.; Mutanga, O.; Abdel-Rahman, E.M.; Ismail, R. Estimating standing biomass in papyrus (Cyperus papyrus L.) swamp: Exploratory of in situ hyperspectral indices and random forest regression. Int. J. Remote Sens. 2014, 35, 693–714. [Google Scholar] [CrossRef]
  36. Khan, S.N.; Li, D.; Maimaitijiang, M. A Geographically Weighted Random Forest Approach to Predict Corn Yield in the US Corn Belt. Remote Sens. 2022, 14, 2843. [Google Scholar] [CrossRef]
  37. Pascucci, S.; Pignatti, S.; Casa, R.; Darvishzadeh, R.; Huang, W. Special issue “hyperspectral remote sensing of agriculture and vegetation”. Remote Sens. 2020, 12, 3665. [Google Scholar] [CrossRef]
  38. Miya, S.P.; Modi, A.T.; Tesfay, S.Z.; Mabhaudhi, T. Maize grain soluble sugar and protein contents in response to simulated hail damage. S. Afr. J. Plant Soil 2018, 35, 377–383. [Google Scholar] [CrossRef]
  39. Coelho, D.T.; Dale, R.F. An Energy-Crop Growth Variable and Temperature Function for Predicting Corn Growth and Development: Planting to Silking 1. Agron. J. 1980, 72, 503–510. [Google Scholar] [CrossRef]
  40. Ciampitti, I.A.; Elmore, R.W.; Lauer, J. Corn growth and development. Dent 2011, 5, 1–24. [Google Scholar]
  41. Tan, C.-W.; Zhang, P.-P.; Zhou, X.-X.; Wang, Z.-X.; Xu, Z.-Q.; Mao, W.; Li, W.-X.; Huo, Z.-Y.; Guo, W.-S.; Yun, F. Quantitative monitoring of leaf area index in wheat of different plant types by integrating NDVI and Beer-Lambert law. Sci. Rep. 2020, 10, 929. [Google Scholar] [CrossRef] [Green Version]
  42. Brewer, K.; Clulow, A.; Sibanda, M.; Gokool, S.; Naiken, V.; Mabhaudhi, T. Predicting the Chlorophyll Content of Maize over Phenotyping as a Proxy for Crop Health in Smallholder Farming Systems. Remote Sens. 2022, 14, 518. [Google Scholar] [CrossRef]
  43. Aboelghar, M.; Arafat, S.; Yousef, M.A.; El-Shirbeny, M.; Naeem, S.; Massoud, A.; Saleh, N. Using SPOT data and leaf area index for rice yield estimation in Egyptian Nile delta. Egypt. J. Remote Sens. Space Sci. 2011, 14, 81–89. [Google Scholar] [CrossRef] [Green Version]
  44. Liu, Y.; Liu, S.; Li, J.; Guo, X.; Wang, S.; Lu, J. Estimating biomass of winter oilseed rape using vegetation indices and texture metrics derived from UAV multispectral images. Comput. Electron. Agric. 2019, 166, 105026. [Google Scholar] [CrossRef]
  45. Li, B.; Xu, X.; Zhang, L.; Han, J.; Bian, C.; Li, G.; Liu, J.; Jin, L. Above-ground biomass estimation and yield prediction in potato by using UAV-based RGB and hyperspectral imaging. ISPRS J. Photogramm. Remote Sens. 2020, 162, 161–172. [Google Scholar] [CrossRef]
  46. Mditshwa, S. Estimating Maize Grain Yield from Crop Growth Stages Using Remote Sensing and GIS in the Free State Province, South Africa. Ph.D. Thesis, University of Fort Hare, Alice, South Africa, 2017. [Google Scholar]
  47. Ramos, A.P.M.; Osco, L.P.; Furuya, D.E.G.; Gonçalves, W.N.; Santana, D.C.; Teodoro, L.P.R.; da Silva Junior, C.A.; Capristo-Silva, G.F.; Li, J.; Baio, F.H.R.J.C.; et al. A random forest ranking approach to predict yield in maize with uav-based vegetation spectral indices. Comput. Electron. Agric. 2020, 178, 105791. [Google Scholar] [CrossRef]
  48. Stroppiana, D.; Migliazzi, M.; Chiarabini, V.; Crema, A.; Musanti, M.; Franchino, C.; Villa, P. Rice yield estimation using multispectral data from UAV: A preliminary experiment in northern Italy. In Proceedings of the 2015 IEEE International Geoscience and Remote Sensing Symposium (IGARSS), Milan, Italy, 26–31 July 2015; pp. 4664–4667. [Google Scholar]
  49. Potgieter, A.B.; Apan, A.; Dunn, P.; Hammer, G. Estimating crop area using seasonal time series of Enhanced Vegetation Index from MODIS satellite imagery. Aust. J. Agric. Res. 2007, 58, 316–325. [Google Scholar] [CrossRef] [Green Version]
  50. Zheng, H.; Cheng, T.; Zhou, M.; Li, D.; Yao, X.; Tian, Y.; Cao, W.; Zhu, Y. Improved estimation of rice aboveground biomass combining textural and spectral analysis of UAV imagery. Precis. Agric. 2019, 20, 611–629. [Google Scholar] [CrossRef]
  51. Sibanda, M.; Mutanga, O.; Rouget, M.; Kumar, L. Estimating biomass of native grass grown under complex management treatments using worldview-3 spectral derivatives. Remote Sens. 2017, 9, 55. [Google Scholar] [CrossRef] [Green Version]
  52. Zhang, X.; Zhao, J.; Yang, G.; Liu, J.; Cao, J.; Li, C.; Zhao, X.; Gai, J. Establishment of Plot-Yield Prediction Models in Soybean Breeding Programs Using UAV-Based Hyperspectral Remote Sensing. Remote Sens. 2019, 11, 2752. [Google Scholar] [CrossRef] [Green Version]
  53. Al-Gaadi, K.A.; Hassaballa, A.A.; Tola, E.; Kayad, A.G.; Madugundu, R.; Alblewi, B.; Assiri, F. Prediction of potato crop yield using precision agriculture techniques. PLoS ONE 2016, 11, e0162219. [Google Scholar] [CrossRef] [Green Version]
  54. Grajek, H.; Rydzyński, D.; Piotrowicz-Cieślak, A.; Herman, A.; Maciejczyk, M.; Wieczorek, Z. Cadmium ion-chlorophyll interaction–Examination of spectral properties and structure of the cadmium-chlorophyll complex and their relevance to photosynthesis inhibition. Chemosphere 2020, 261, 127434. [Google Scholar] [CrossRef]
  55. Dou, H.; Niu, G.; Gu, M. Photosynthesis, morphology, yield, and phytochemical accumulation in basil plants influenced by substituting green light for partial red and/or blue light. HortScience 2019, 54, 1769–1776. [Google Scholar] [CrossRef] [Green Version]
  56. Sharifi, A. Remotely sensed vegetation indices for crop nutrition mapping. J. Sci. Food Agric. 2020, 100, 5191–5196. [Google Scholar] [CrossRef] [PubMed]
  57. Ren, H.; Zhou, G. Estimating green biomass ratio with remote sensing in arid grasslands. Ecol. Indic. 2019, 98, 568–574. [Google Scholar] [CrossRef]
  58. Motohka, T.; Nasahara, K.N.; Oguma, H.; Tsuchida, S. Applicability of Green-Red Vegetation Index for Remote Sensing of Vegetation Phenology. Remote Sens. 2010, 2, 2369–2387. [Google Scholar] [CrossRef] [Green Version]
  59. Filgueiras, R.; Mantovani, E.C.; Dias, S.H.B.; Fernandes Filho, E.I.; da Cunha, F.F.; Neale, C.M.U. New approach to determining the surface temperature without thermal band of satellites. Eur. J. Agron. 2019, 106, 12–22. [Google Scholar] [CrossRef]
  60. Fu, Y.; Yang, G.; Wang, J.; Song, X.; Feng, H. Winter wheat biomass estimation based on spectral indices, band depth analysis and partial least squares regression using hyperspectral measurements. Comput. Electron. Agric. 2014, 100, 51–59. [Google Scholar] [CrossRef]
  61. He, J.; Zhang, N.; Su, X.; Lu, J.; Yao, X.; Cheng, T.; Zhu, Y.; Cao, W.; Tian, Y. Estimating leaf area index with a new vegetation index considering the influence of rice panicles. Remote Sens. 2019, 11, 1809. [Google Scholar] [CrossRef] [Green Version]
  62. Sibanda, M.; Onisimo, M.; Dube, T.; Mabhaudhi, T. Quantitative assessment of grassland foliar moisture parameters as an inference on rangeland condition in the mesic rangelands of southern Africa. Int. J. Remote Sens. 2021, 42, 1474–1491. [Google Scholar] [CrossRef]
  63. Leroux, L.; Castets, M.; Baron, C.; Escorihuela, M.-J.; Bégué, A.; Seen, D.L. Maize yield estimation in West Africa from crop process-induced combinations of multi-domain remote sensing indices. Eur. J. Agron. 2019, 108, 11–26. [Google Scholar] [CrossRef]
  64. Boukoberine, M.N.; Zhou, Z.; Benbouzid, M. A critical review on unmanned aerial vehicles power supply and energy management: Solutions, strategies, and prospects. Appl. Energy 2019, 255, 113823. [Google Scholar] [CrossRef]
Figure 1. (a) Location of study site in Swayimane, KwaZulu-Natal, South Africa and (b) the maize plot and sampling points (n = 63).
Remotesensing 15 01597 g001
Figure 2. (a) The DJI Matrice 300 UAV; (b) the Mica Sense Altum sensor utilized in this study; (c) the flight path plan for the study area image acquisition; and (d) the Altum sensor calibrated reflectance panel.
Remotesensing 15 01597 g002
Figure 3. Relationship between field-measured yield and average LAI estimates of maize (n = 63). Asterisks represents multiplication sign.
Remotesensing 15 01597 g003
Figure 4. Relationship between measured and estimated LAI based on the combination of traditional, red edge-based and new VIs using the RF Model for the (a) V8–V10, (b) V12–V14, (c) VT–R1, (d) R2–R3 and (e) R3–R4 maize growth stages (n = 19 per graph).
Remotesensing 15 01597 g004
Figure 5. The variable importance scores of selected variables that exhibited the highest scores in predicting maize LAI for the (a) V8–V10, (b) V12–V14, (c) VT–R1, (d) R2–R3 and (e) R3–R4 maize growth stages.
Remotesensing 15 01597 g005
Figure 6. The distribution of modeled maize LAI for the (a) V8–V10, (b) V12–V14, (c) VT–R1, (d) R2–R3 and (e) R3–R4 growth stages based on the RF models.
Remotesensing 15 01597 g006
Table 1. Maize growth stages.
Growth StageName of Growth StageDays after EmergenceBrief Description
Vegetative(VE)Emergence0Germination and emergence
V1First leaf collar
V2Second leaf collar7
V3Third leaf collar
V(n)Nth leaf collar21–55Plant population established, cob development, active growth: cob size determined
VTTasseling56Pollination
Reproductive R1Silking63
R2Blister70Kernel development
R3Milk91Grain filling: nutrients transported to cob
R4Dough105
R5Dent112Physiological maturity and ready for harvest
R6Maturity160
Table 2. UAV-derived VIs used in this study.
Vegetation IndexAbbreviationFormulaReference
TraditionalNormalized Difference Vegetation IndexNDVI(NIR − R)/(NIR + R)[43]
Phenological Normalized Difference Vegetation IndexPNDVI(NIR − (G + R + B))/(NIR + (G + R + B))[44]
Red–Blue Normalized Vegetation IndexRBNDVI(NIR − (R + B))/(NIR + (R + B))[45]
Enhanced Normalized Vegetation IndexENDVI((NIR + G) − (2 * B))/((NIR + G) + (2 * B))[46]
Green–Blue Normalized Vegetation IndexGBNDVI(NIR − (G + B))/(NIR + (G + B))[11]
Green–Red Normalized Vegetation IndexGRNDVI(NIR − (G + R))/(NIR + (G + R))[11]
Generalized Difference Vegetation IndexGDVINIR − G[47]
Chlorophyll Index GreenCIgreen(NIR/G) − 1[48]
Chlorophyll Vegetation IndexCVINIR * (R/(G * G))[48]
Green Leaf IndexGLI((2 * G) − R − B)/((2 * G) + R + B)[15]
Enhanced Vegetation IndexEVI2.5 * ((NIR − R)/(NIR + (6 * B) − (7.5 * B)) + 1)[49]
Enhanced Vegetation Index 2EVI22.4 * ((NIR − R)/(NIR + R + 1))[50]
Enhanced Vegetation Index 3EVI32.5 * ((NIR − R)/(NIR + (2.4 * R) + 1))[51]
Chlorophyll IndexCI(R − B)/B[14]
Infrared Percentage Vegetation IndexIPVI(NIR/NIR + R)/2 * (NDVI + 1)[52]
Soil Adjusted Vegetation IndexSAVI((NIR − R)/(NIR + R + 0.5)) * (1 + 0.5)[46]
Optimized Soil Adjusted Vegetation IndexOSAVI(NIR − R)/(NIR + R + 0.16)[11]
Simple RatioSR(NIR/R)[11]
Red Edge-BasedNormalized Difference Red EdgeNDRE(NIR − RE)/(NIR + RE)[27]
Chlorophyll Red EdgeCIRE(NIR/RE) − 1[27]
Canopy Chlorophyll Content IndexCCCI((NIR − RE)/(NIR + RE))/((NIR − R)/(NIR + R))[53]
Red Edge-Based Normalized Difference Vegetation IndexNDVIRE(RE − R)/(RE + R)[8]
New-nDVI(RYi) − (RYj)/(RYi) + (RYj) *This study
* where RYi and RYj are different Altum spectral bands, including the thermal band.
Table 3. Descriptive statistics of the actual maize LAI.
Growth StageNMeanStd. DevMinMax
V8–V10631.780.350.471.37
V12–V14631.821.371.012.93
VT–R1632.071.142.243.46
R2–R3633.291.12.665.15
R3–R4633.440.633.536.29
Disclaimer/Publisher’s Note: The statements, opinions and data contained in all publications are solely those of the individual author(s) and contributor(s) and not of MDPI and/or the editor(s). MDPI and/or the editor(s) disclaim responsibility for any injury to people or property resulting from any ideas, methods, instructions or products referred to in the content.

