Article

A Methodological Framework for Mapping Canopy Cover Using ICESat-2 in the Southern USA

1
College of Forestry, Wildlife and Environment, Auburn University, Auburn, AL 36849, USA
2
Department of Ecology and Conservation Biology, Texas A&M University, College Station, TX 77843, USA
*
Author to whom correspondence should be addressed.
Remote Sens. 2023, 15(6), 1548; https://doi.org/10.3390/rs15061548
Submission received: 4 January 2023 / Revised: 7 March 2023 / Accepted: 10 March 2023 / Published: 12 March 2023

Abstract

:
NASA’s Ice, Cloud, and land Elevation Satellite-2 (ICESat-2) provides exceptional opportunities for characterizing the structure of ecosystems through the acquisition of along-track, three-dimensional observations. Focusing on canopy cover as a fundamental parameter for assessing forest conditions, the overall goal of this study was to establish a framework for generating a gridded 30 m canopy cover product with ICESat-2. Specifically, our objectives were to (1) Determine and compare ICESat-2-derived canopy cover with airborne lidar-derived and the 2016 National Land Cover Database (NLCD) cover product estimates, and (2) Evaluate a methodology for wall-to-wall mapping of canopy cover. Using two Southern US sites, the Sam Houston National Forest (SHNF) in south-east Texas and the Solon Dixon Forestry Education Center (SDFEC) in southern Alabama, four measures of canopy cover estimated with ICESat-2′s Land-Vegetation Along-Track Product, or ATL08, were evaluated at the 30 m pixel scale. Comparisons were made using spatially coinciding NLCD pixels and airborne lidar-derived reference canopy cover. A suite of Landsat and Landsat-derived parameters were then used as predictors to model and map each measure of canopy cover with Random Forests (RF), and their accuracies were assessed and compared. Correlations (r) between ICESat-2-derived and airborne lidar canopy cover at the pixel scale ranged from 0.57 to 0.78, and R2 up to 0.81 was produced between NLCD and ICESat-2-derived canopy cover. RF models developed for extrapolating ICESat-2-derived canopy cover estimate yielded R2 values between 0.50 and 0.61 (RMSEs between 16% and 20%) when evaluated with airborne lidar-derived canopy cover. With a demonstrated capability of ICESat-2 to estimate vegetation biophysical parameters, the findings serve to support the spatially comprehensive mapping of other vegetation attributes, especially forest aboveground biomass, and contribute to the development of an up-to-date gridded canopy cover product.

1. Introduction

Canopy cover is a fundamental vegetation structural parameter that is used to support a range of vegetation applications, including habitat mapping [1], assessing forest health [2], degradation [3], and estimating aboveground biomass [4]. Spatially explicit estimates of canopy cover have been achieved through approaches that integrate remotely sensed data, particularly spectral information from satellite imagery, aerial imagery e.g., [5], and/or structural properties from airborne lidar data e.g., [6,7,8]. To exemplify: as an important source of canopy cover nationally, the National Land Cover Database (NLCD) US Forest Service tree canopy cover product provides estimates for every 30 m pixel, based on Landsat imagery and imagery-derived products, ancillary and ground reference data [5]. The NLCD 2016 Tree Canopy Cover is the most recent version of the data product, with an earlier version generated for 2011, and a tree canopy change product between 2011 and 2016. Although the generation of accurate structural estimates, including canopy cover by airborne lidar, is well-established, upscaling to broader extents may be limited [9]. One approach to achieving broad-scale coverage from structural measurements is the integration of space-based lidar data. More recently, Tang, et al. [10] demonstrated the application of space-based lidar data from the Ice, Cloud, and land Elevation Satellite (ICESat) to develop a global-scale canopy cover product. In this study, the ability to derive cover products based on lidar measurements from a space-based platform, versus optical data, was highlighted.
The capability of a spaceborne lidar system to contribute to the estimation of biophysical forest parameters was proven with ICESat, which operated from 2003 to 2009. Apart from canopy cover e.g., [10], vegetation studies with these Earth Observation (EO) data demonstrate the ability to accurately estimate a range of vegetation attributes, including canopy height [11,12], forest aboveground biomass (AGB) [13], and timber volume [14]. With the launch of its follow-on mission in 2018, which features improved spatial resolutions and coverage, NASA’s Ice, Cloud, and land Elevation Satellite-2 (ICESat-2) offers an exceptional opportunity to obtain up-to-date vegetation information. ICESat-2 has been acquiring data with its Advanced Topographic Laser Altimeter System (ATLAS) since 2018. ATLAS operates at a 532 nm wavelength and generates three pairs of beams on the Earth’s surface. Each pair consists of a strong and weak beam [15], and the results with the former highlight greater utility for vegetation studies [16], although the useability of the weak beam data for estimating canopy heights has been indicated [17]. Among ICESat-2′s data products is its Land-Vegetation Along-Track Product, or ATL08. For ATL08 generation, algorithms are applied to isolate the signal from noise returns (photons) and ultimately report canopy and terrain estimates, as described in Neuenschwander and Pitts [18]. As the mission’s dedicated vegetation product, ATL08 provides terrain and canopy parameters at fixed along-track 100 m segments, including height percentiles, photon counts (terrain, canopy, and top-of-canopy photons), and acquisition information such as daytime/nighttime flags [18].
Canopy parameters reported in ICESat-2′s ATL08 data product already demonstrate utility in characterizing vegetation attributes, such as canopy height [19,20,21,22], AGB [4,19], and leaf area index [23]. While ATL08 data are provided along tracks, synergistic approaches with other EO data have been highlighted for achieving full-coverage products. For instance, Nandy et al. [19] generated wall-to-wall maps of forest canopy heights and aboveground biomass with ATL08, through the integration of spatially comprehensive predictors from Sentinel-1 and Sentinel-2 using Random Forest. ATL08′s canopy height (h_canopy or 98th percentile height) was extrapolated with spectral, textural, and backscatter variables from Sentinel-1. Similarly, several studies highlight the application of multi-source satellite data with ICESat-2 to map forest canopy height [22,24,25], but the literature on developing other gridded vegetation products is still limited. Moreover, at the time of this writing, a gridded canopy cover product with ICESat-2 has not yet been reported. Given the importance of canopy cover, ATL08′s capability to estimate vegetation attributes, and the availability of other canopy parameters, there is a need to better understand the contribution of ICESat-2 towards a new gridded canopy cover product. Additionally, a gridded ICESat-2 land/canopy product, or ATL18, consisting of gridded canopy height and canopy cover [26] is anticipated, so such an understanding will inform ongoing efforts for product generation.
The goal of this work was to establish a framework for generating a gridded 30 m product with ICESat-2′s vegetation product data, ATL08. With a focus on Southern US vegetation conditions, specific objectives were to (1) Determine and compare ICESat-2-derived canopy cover with airborne lidar-derived and the 2016 National Land Cover Database (NLCD) cover product estimates, and (2) Evaluate a methodology for wall-to-wall mapping of canopy cover. Our earlier work with ICESat-2 over similar study sites [4] highlighted promising findings from the synergistic use with Landsat and the contribution of the 2016 NLCD canopy product for mapping AGB. The results found that the 2016 NLCD canopy cover product was the most important predictor of ICESat-2-derived AGB [4]. Additionally, our follow-up studies over Southern US sites suggest the applicability of available ATL08 parameters for deriving canopy cover [27]. Acknowledging the synergistic capabilities with Landsat and NLCD products, findings from this work are intended to contribute to a framework for producing updated canopy cover information using ICESat-2. Given the significance of canopy cover for modeling key forest parameters, like AGB, a defined methodology for mapping canopy cover will offer opportunities for further leveraging ICESat-2 for ecosystem studies.

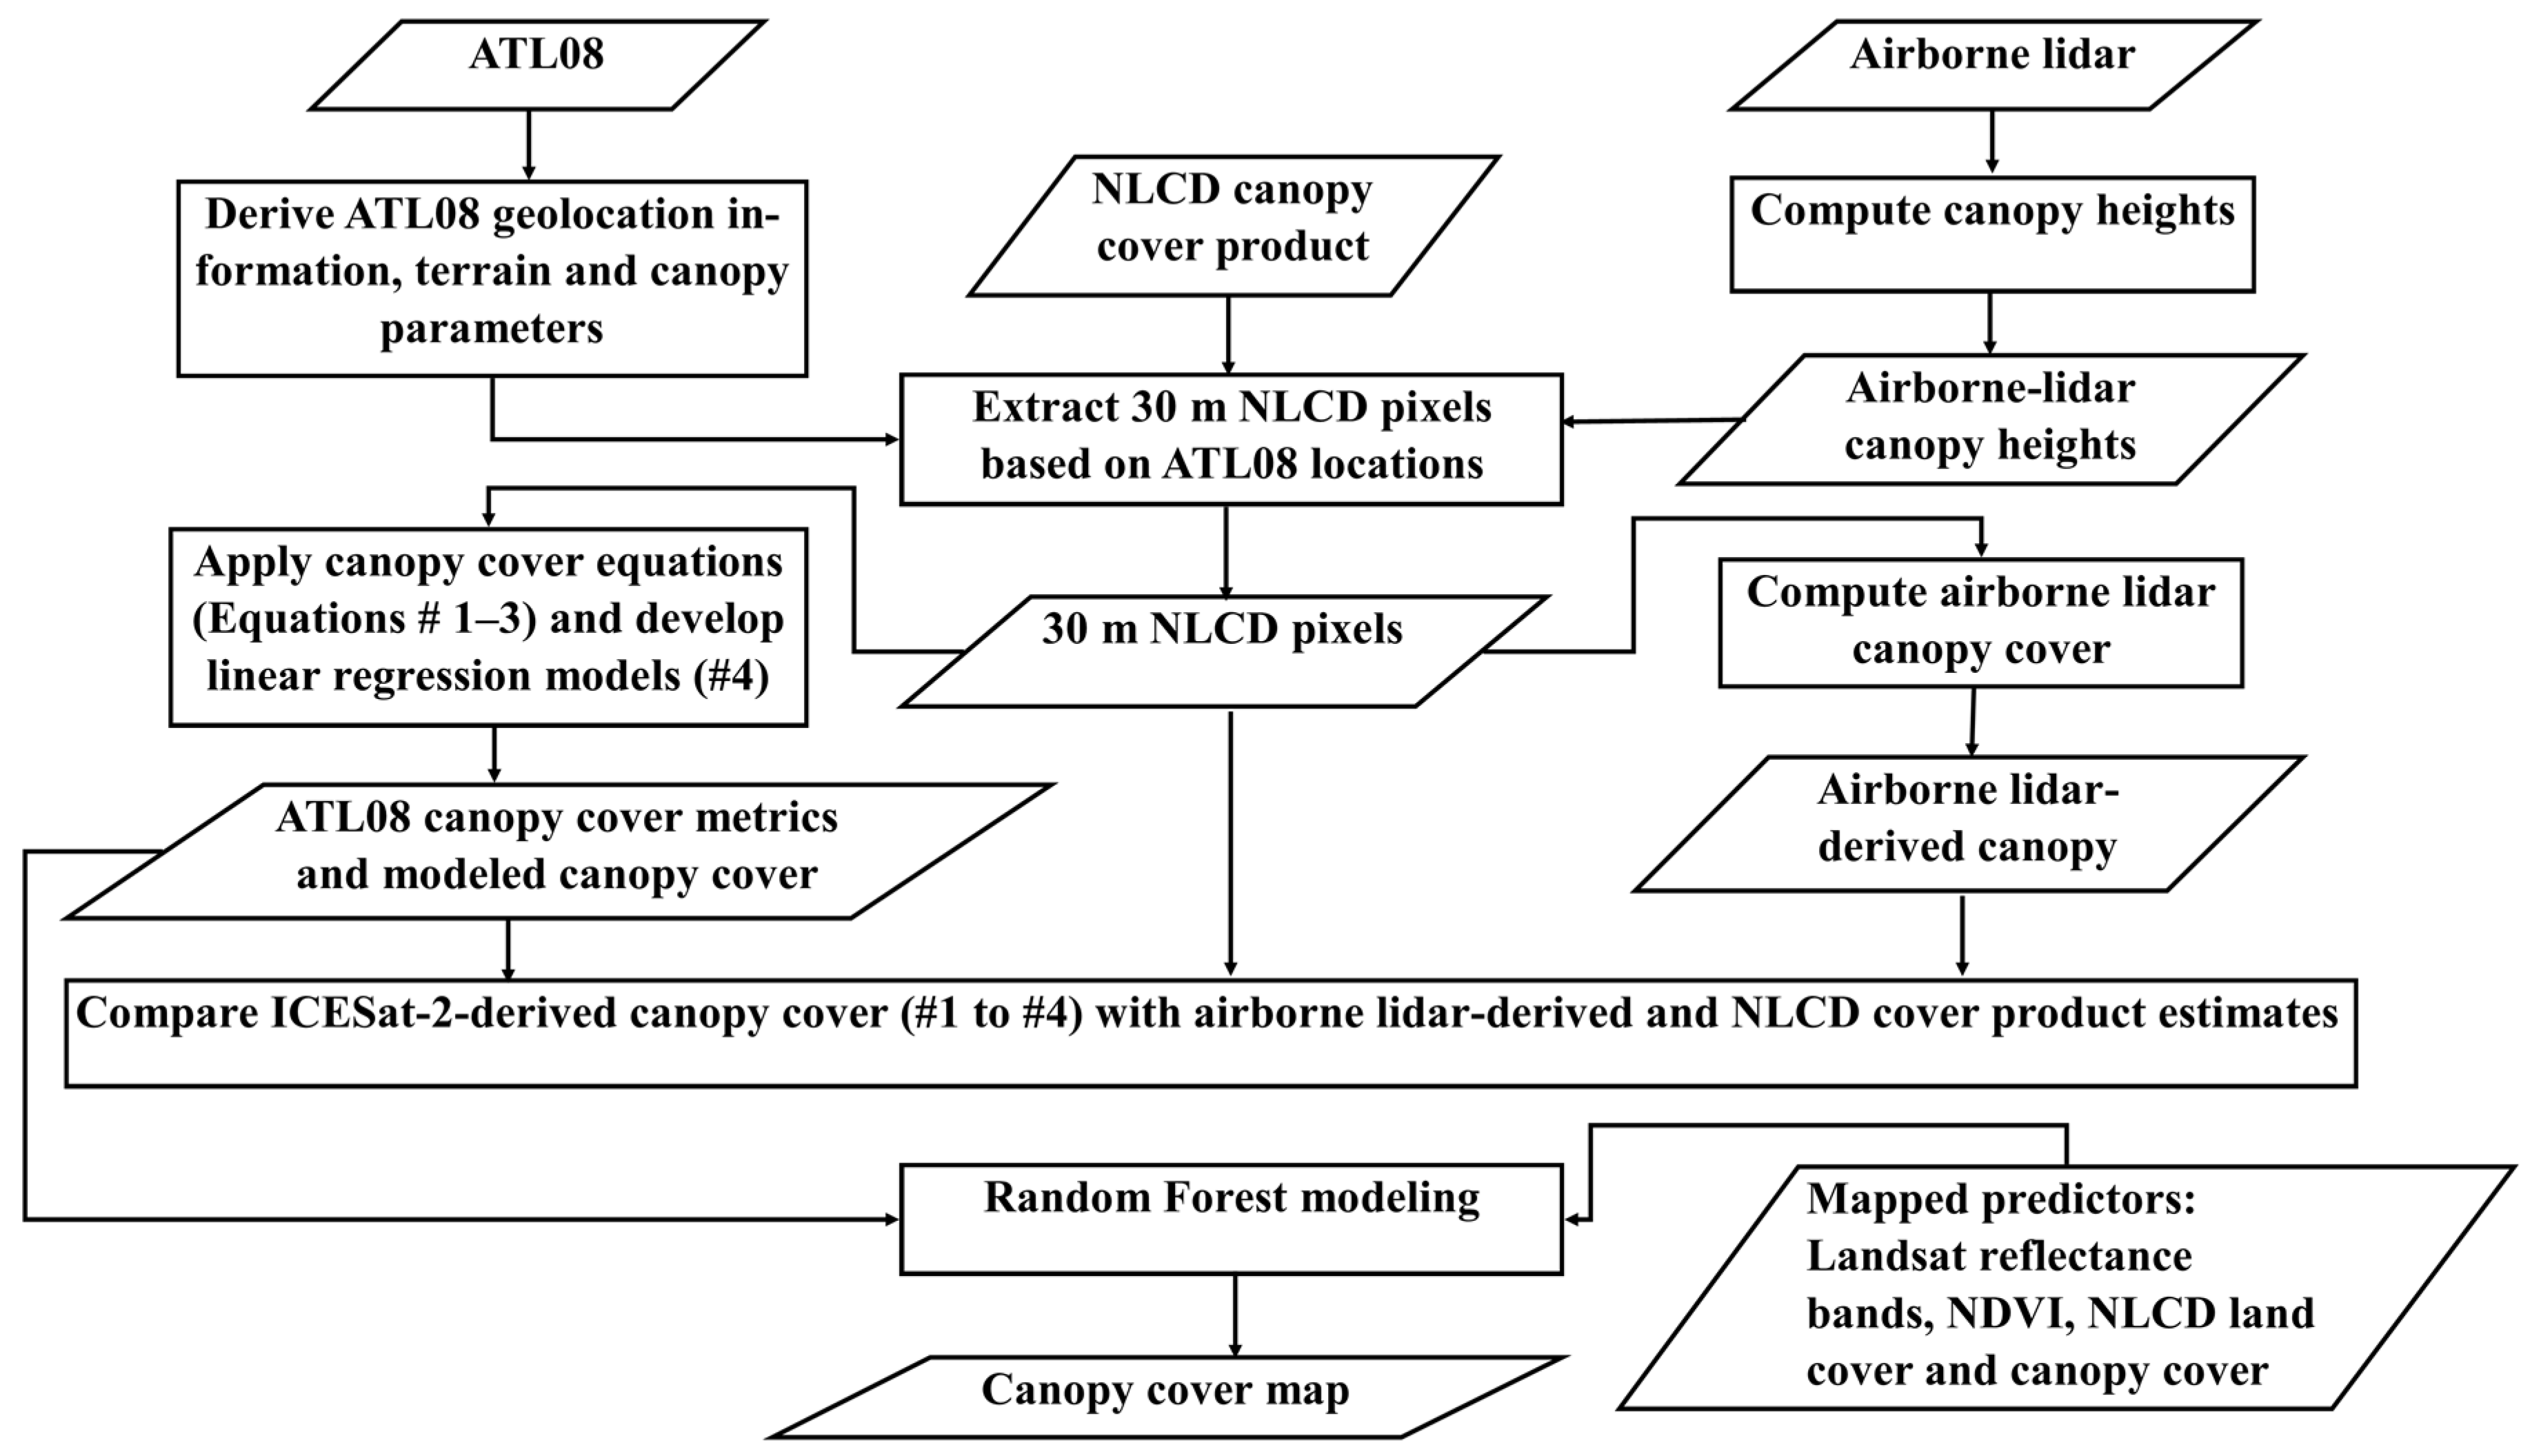
2. Materials and Methods
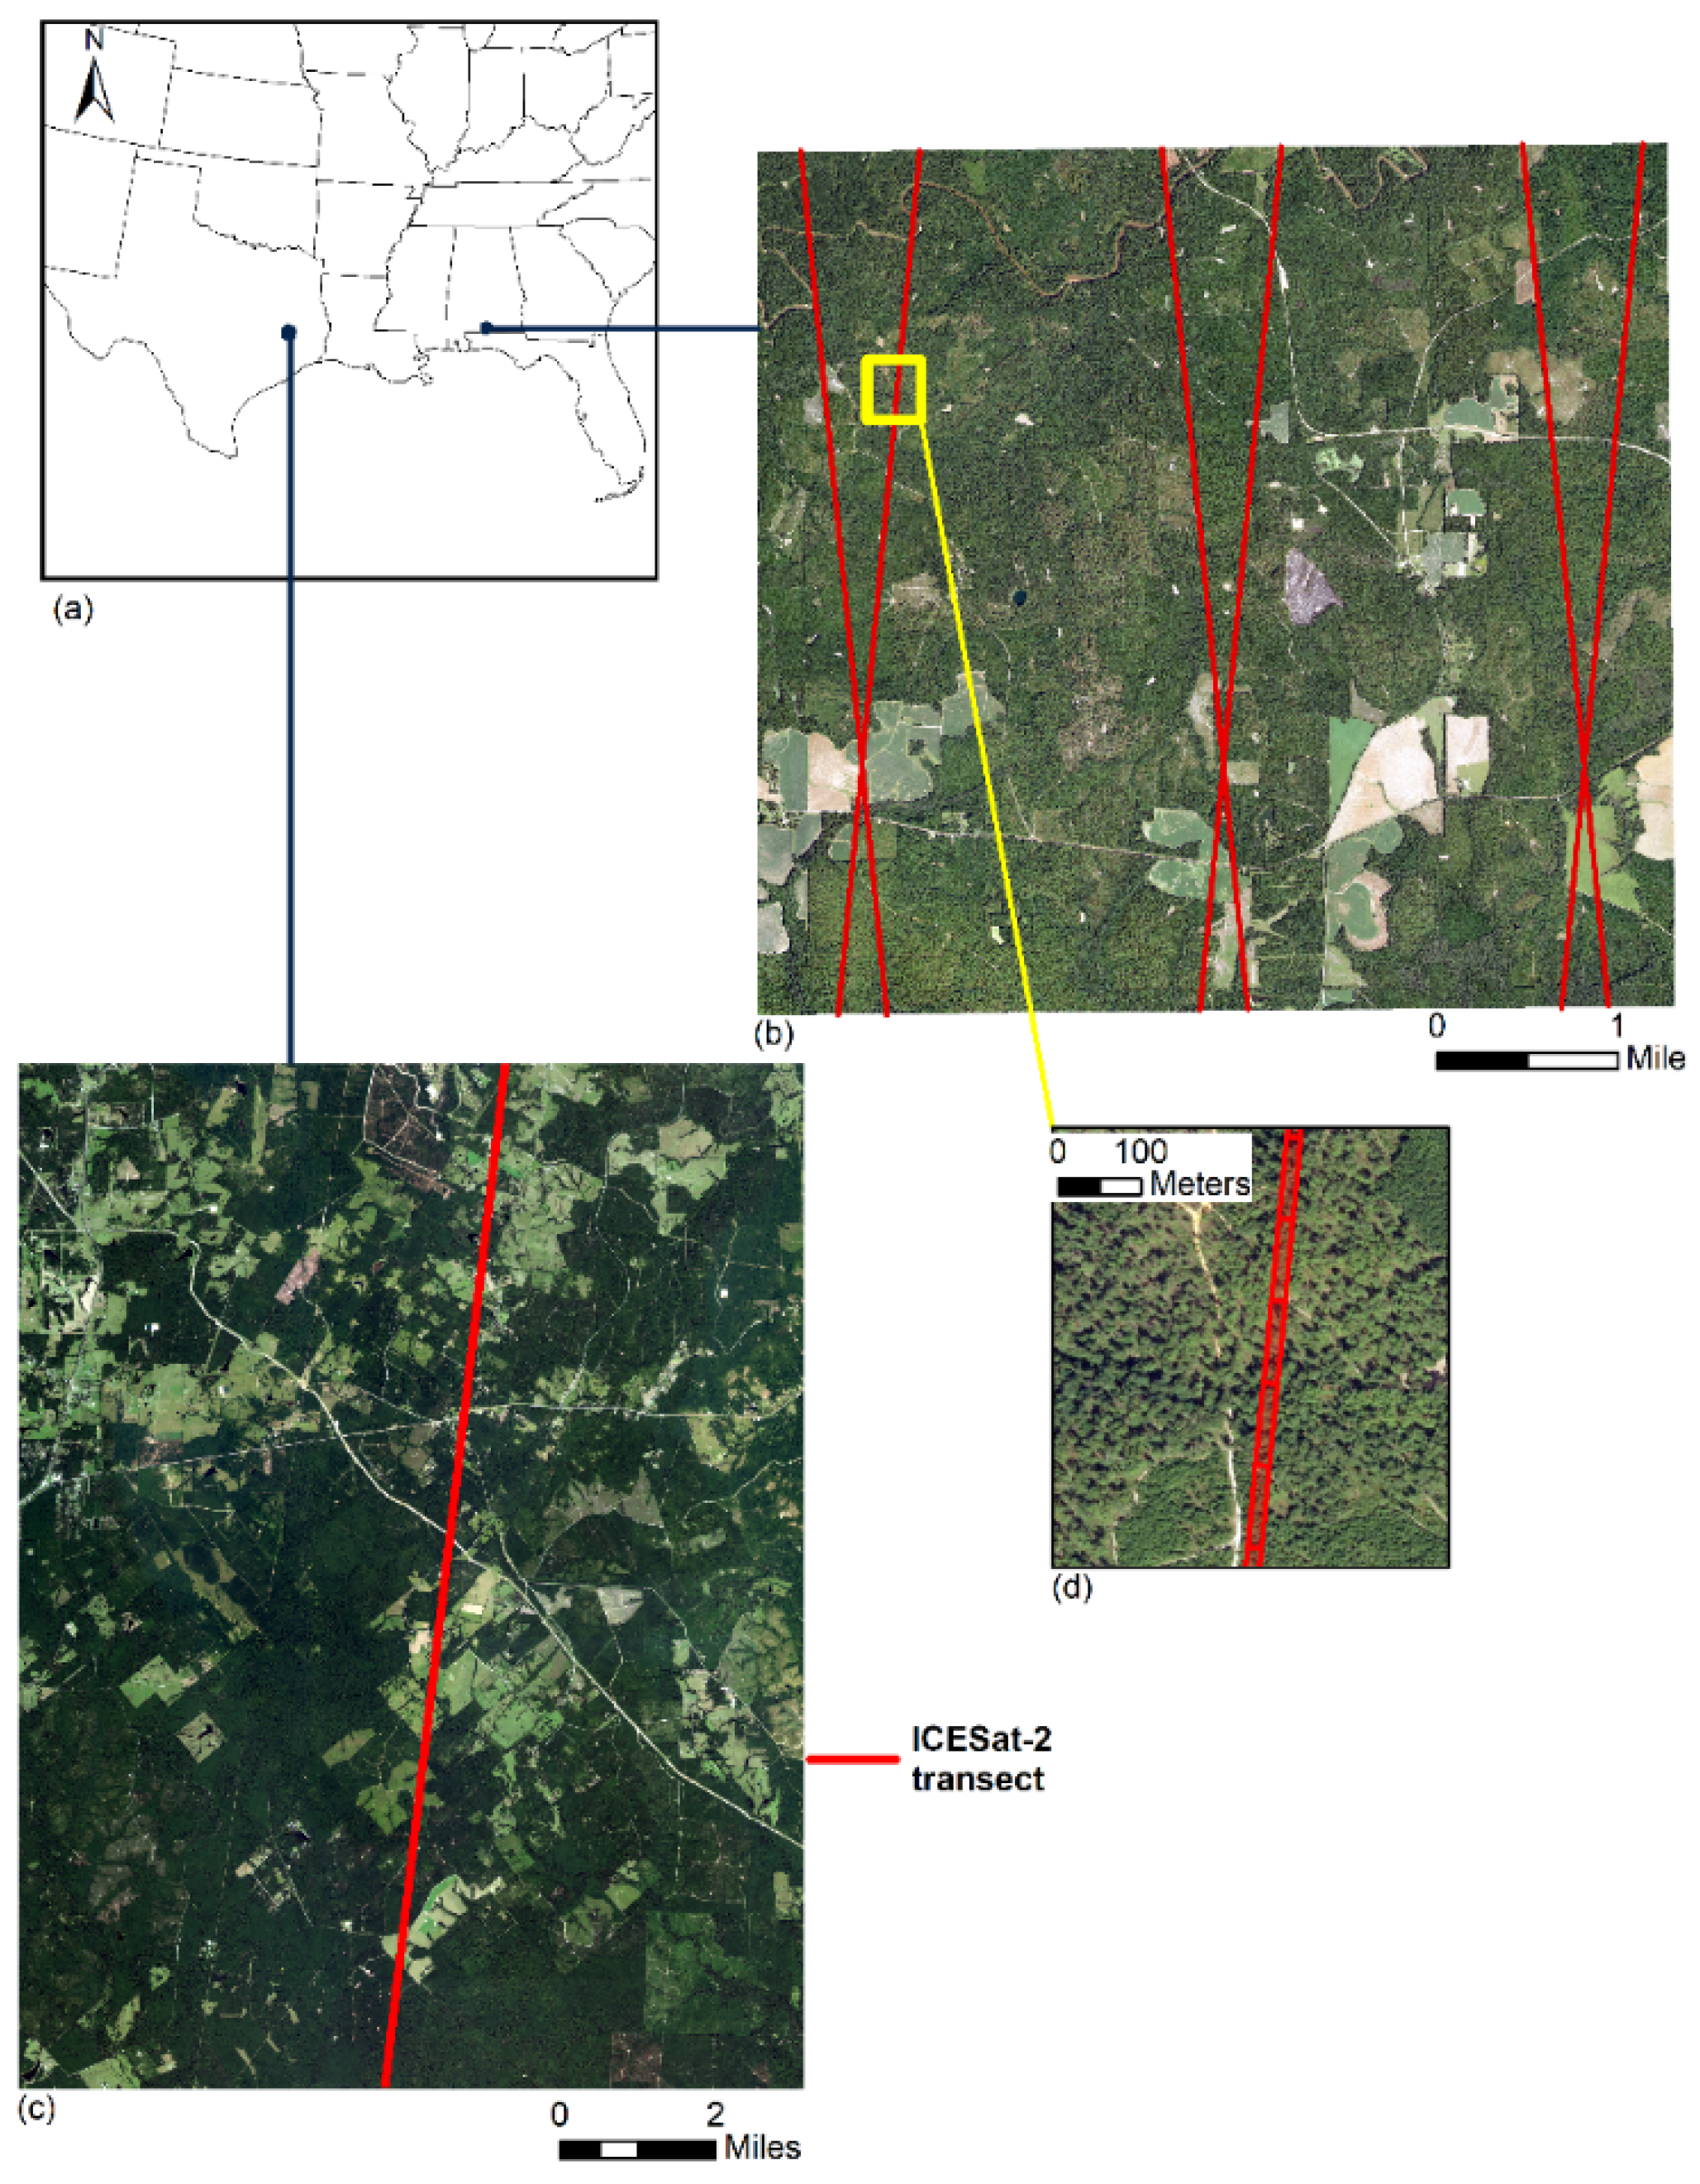
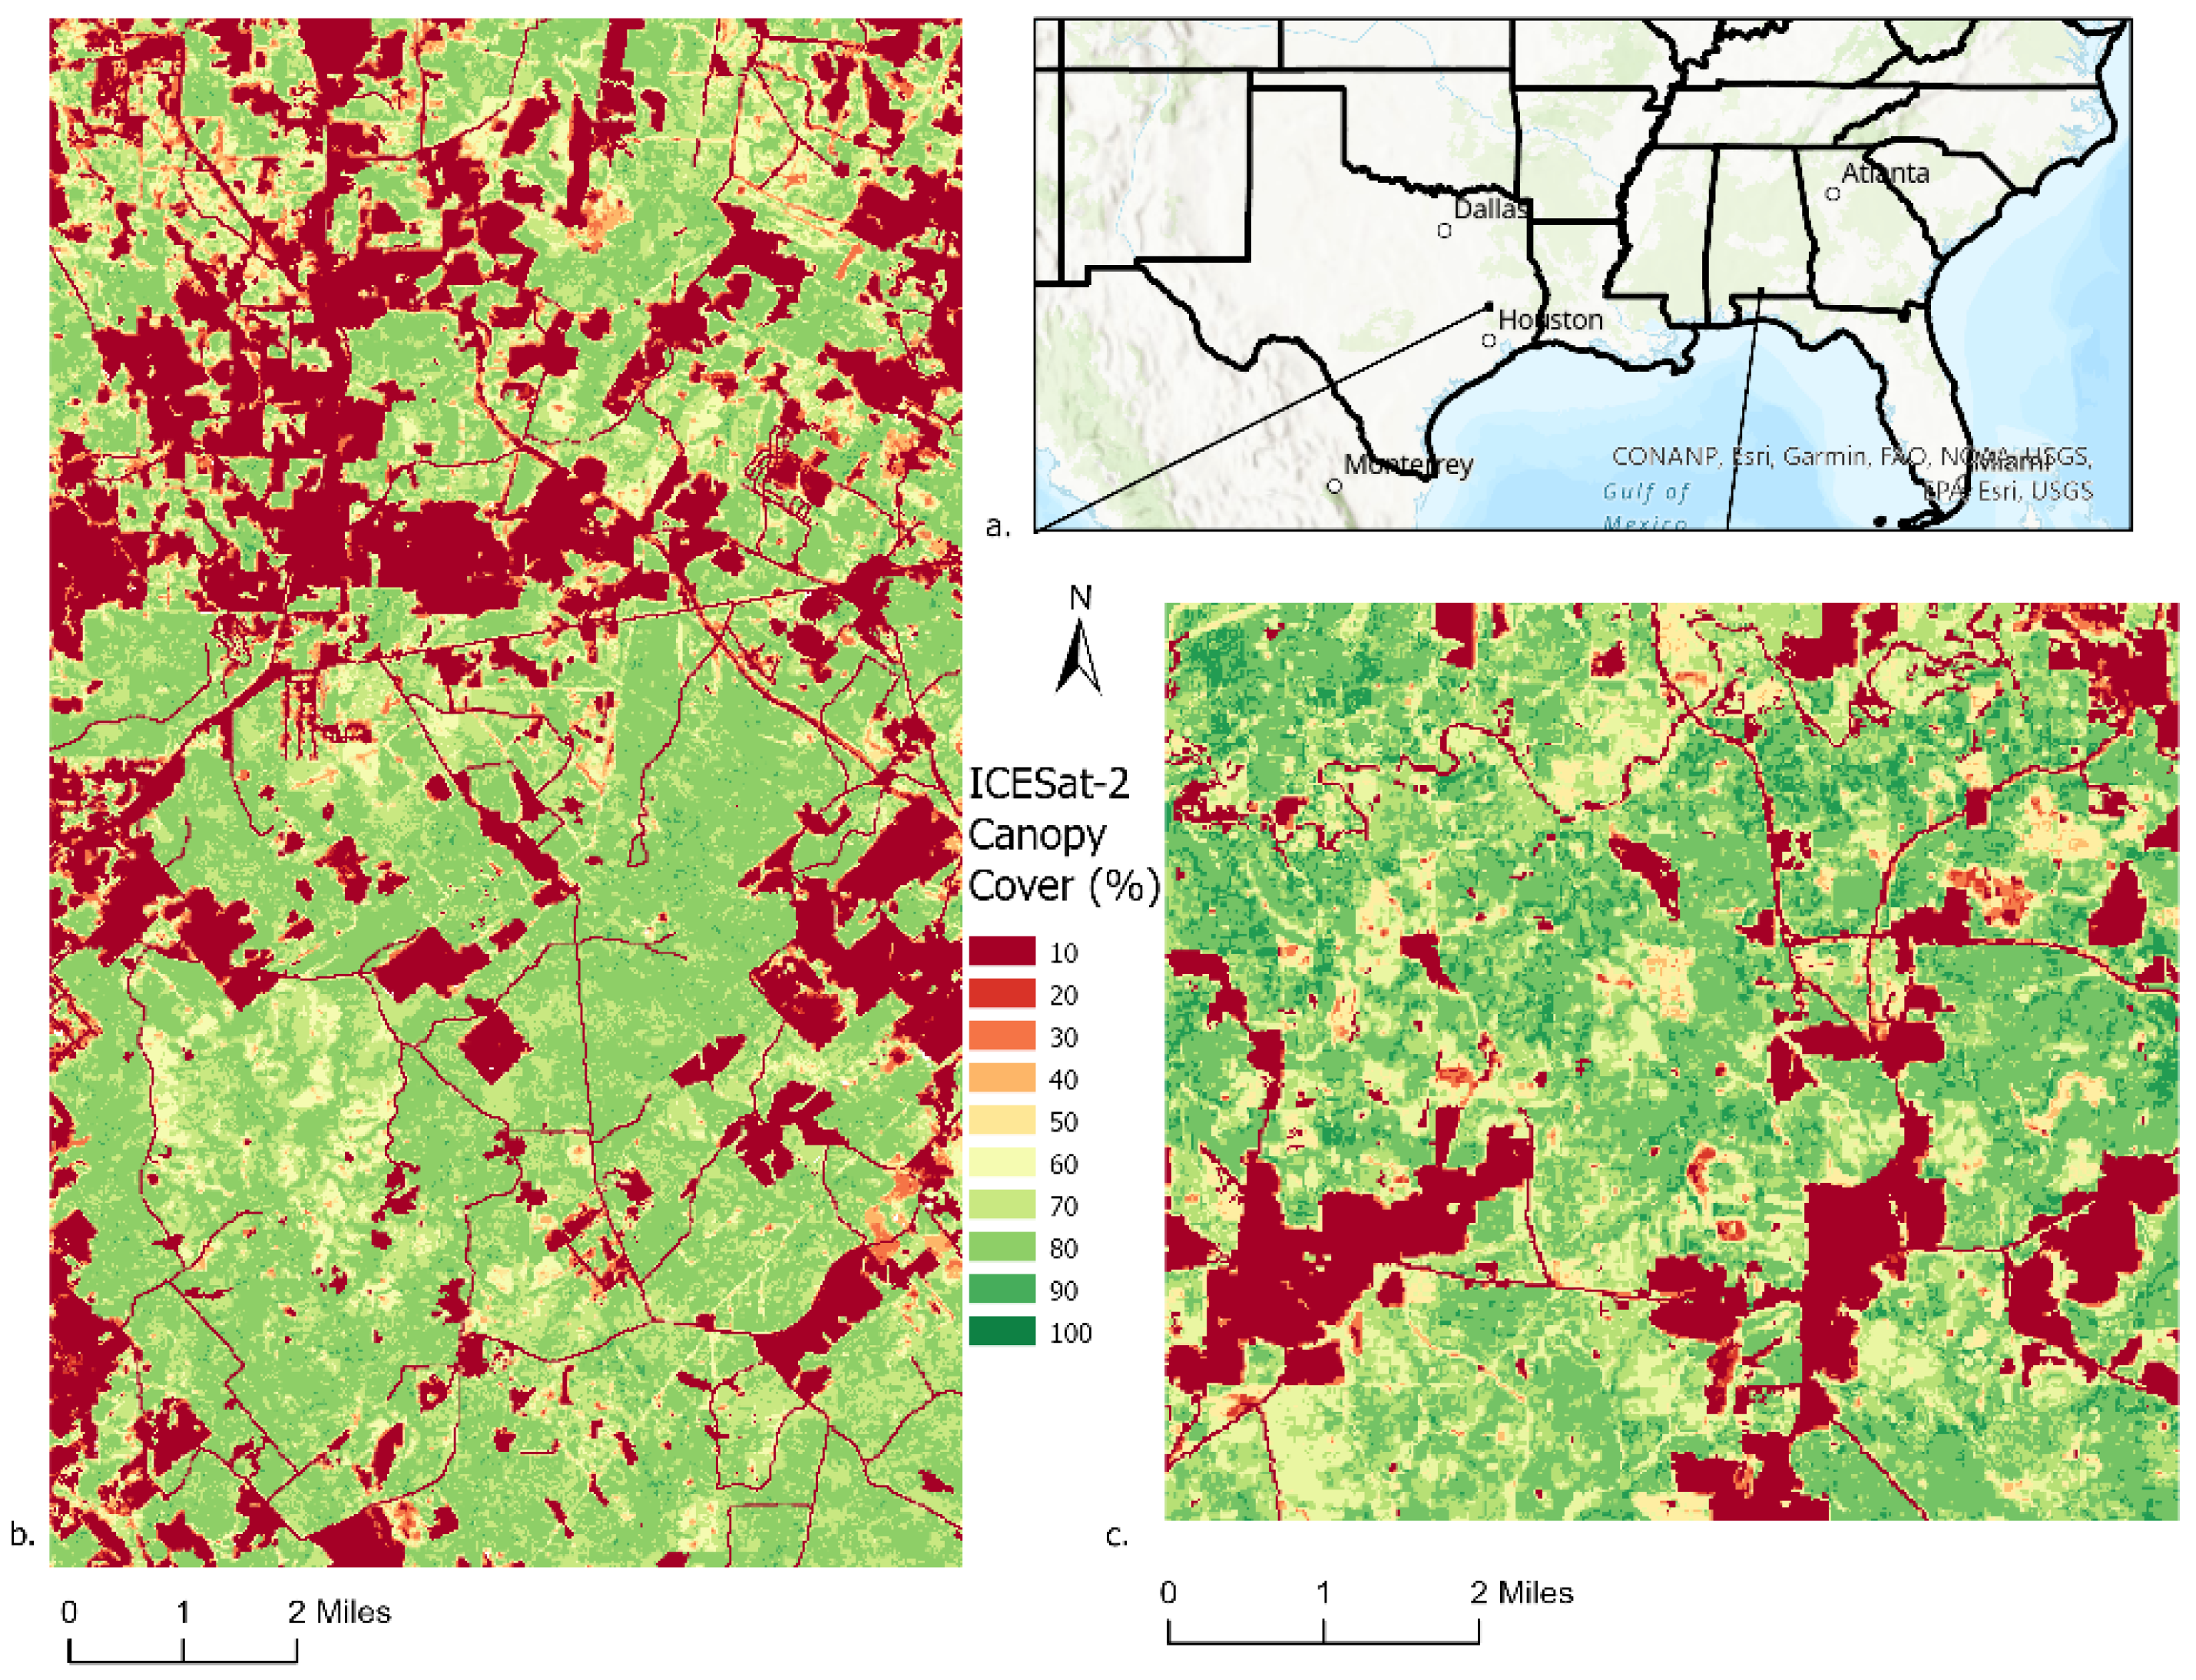
To determine a framework for generating a gridded canopy cover product with ICESat-2, methods (Figure 1) involved an investigation of four ICESat-2-derived canopy cover metrics at a 30 m pixel scale. Estimates from each ICESat-2 metric were compared with two sources of canopy cover information: (1) NLCD canopy cover product, and (2) airborne lidar-derived canopy cover. A methodology for upscaling was then examined for each ICESat-2 cover metric by leveraging Landsat and Landsat-derived predictors using RF modeling. The workflow of methods is presented in Figure 1; a list of data used is provided in Table 1 and a detailed description of methods is given in the following sections, Section 2.1, Section 2.2, Section 2.3, Section 2.4, Section 2.5 and Section 2.6

2.1. Study Areas

Data over two Southern US study sites, the Sam Houston National Forest (SHNF) (30°42′N, 95°21′W) located in southeast Texas, and the Solon Dixon Forestry Education Center (SDFEC) in southern Alabama (31°11′N, 86°41′W), were examined for this study (Figure 2). The SHNF area exhibits vegetation conditions that are typical for the southeastern United States, consisting primarily of longleaf pine (Pinus palustris) stands, stands of loblolly pine (Pinus taeda), slash pine (Pinus elliottii), bottomland hardwoods, mixed hardwoods, and pine hardwoods. This site was used for an initial AGB mapping study with ICESat-2 [4], and for pre-launch AGB and canopy cover investigations with simulated ICESat-2 data [31]. Notably, both study sites were also used for evaluating potential measures of canopy cover with ATL08 at the segment scale, given available canopy parameters and photon counts.

2.2. NLCD Tree Canopy Cover

The 2016 version of NLCD’s tree canopy cover, generated by the US Forest Service, is the most recent product for the conterminous US, following the initial 2011 version. Predictors extracted from Landsat imagery and topographical parameters were used to estimate tree canopy cover based on photo-interpretation of high-resolution imagery with Random Forest (RF) [32]. Estimates represent the percentage of tree canopy cover for each 30 m pixel across all landcover types. For this study, NLCD tree canopy pixels spatially coincident with ICESat-2 locations (ATLO8) within the study sites were selected.

2.3. Airborne Lidar-Derived Canopy Cover

The goal of US Geological Survey’s 3D Elevation program (3DEP) is to provide a nationwide baseline of high-resolution elevation data, offering free and open access to these datasets. Acquisition dates vary (2015–2021), and to facilitate temporal consistency with ICESat-2, airborne lidar data acquired in 2018–2019 were used to derive reference canopy cover estimates. Airborne lidar data with quality level QL2, which translates to a vertical accuracy of 10 cm and point density of 2 points/m2, were used. Point clouds were height normalized and clipped based on the selected NLCD pixels. Canopy cover was computed and reported as the percentage of returns above 2 m (>2 m) for each 30 m NLCD pixel [31]. The height threshold for computing reference canopy cover was selected based on minimum heights typically considered for forest vegetation [31,33,34].

2.4. ICESat-2 Data and Derived Canopy Cover

ICESat-2 ATL08 data were downloaded from the National Snow and Ice Data Center (NSIDC). Given our earlier findings for estimating AGB with ICESat-2 over SHNF [4] and ATL08 studies e.g., [35], only night acquisitions (versus day time) for strong beams from study areas were obtained. As a result, the ATL08 granules examined for this study were ATL08_20181203072948_10030106_005_01, ATL08_20191130013553_09800502_005_01, and ATL08_20200417070012_03320706_005_01. While canopy cover is not currently computed from the ATL08 product (versions 1–5), our earlier study highlighted potential for extracting this attribute at the ATL08 scale (100 m segments) [27]. In that study, approaches for estimating canopy cover involved ATL08 land and canopy parameters, specifically photon counts for canopy, top-of-canopy, and terrain. Among several canopy cover formulas developed with ATL08 segments [27], three canopy cover formulas from ATL08 data that exhibited the strongest correlations with airborne lidar estimates at the segment level were used in this study. For each ATL08 segment, estimates of canopy cover computed using Equations (1)–(3) below were applied to the corresponding 30 m pixel based on segment geolocation information:
  • Percentage of canopy and top-of-canopy photons of total canopy, top-of-canopy, and ground photons:
( n _ c a _ p h o t o n s + n _ t o c _ p h o t o n s ) ( n _ c a _ p h o t o n s + n _ t o c _ p h o t o n s + n _ t e _ p h o t o n s ) × 100
2.
Percentage of canopy of the number of canopy and ground photons:
n _ c a _ p h o t o n s ( n _ c a _ p h o t o n s + n _ t e _ p h o t o n s ) × 100
3.
Percentage of top-of-canopy photons of the number of top-of-canopy and ground photons:
n _ t o c _ p h o t o n s ( n _ t o c _ p h o t o n s + n _ t e _ p h o t o n s ) × 100 %
ATL08 canopy metrics, spatially coincident NLCD cover estimates, and airborne lidar-derived canopy cover were combined for analyses. As a fourth approach to deriving canopy cover, the three canopy cover metrics were considered as predictors for estimating pixel-scale canopy cover, using linear regression. The key benefit of this approach is the simplicity in implementation and interpretation, with the goal of improving pixel-level canopy cover before extrapolation procedures. Models were developed for each study, where the Akaike Information Criterion (AIC), root mean square error (RMSE), and Mallow’s Cp were used as model selection criteria. The RMSE, AIC, and Mallow’s Cp metrics are model selection techniques often used in regression models for estimating forest attributes with lidar data [36,37,38]. Multicollinearity was also addressed using variance inflation factors (VIFs), where values over 10 indicated presence of multicollinearity [39,40].

2.5. Wall-to-Wall Predictors

Multispectral images were derived from a gap-free Landsat 30 m reflectance product developed by Moreno-Martinez et al. [30]. The data are generated as monthly 30 m observations, with images from Landsat satellites (Landsat 5, 7, and 8) and MODIS, using a novel fusion algorithm, HIghly Scalable Temporal Adaptive Reflectance Fusion Model (HISTARFM). Validation of the gap-free monthly surface reflectance products by Moreno-Martinez et al. [30] demonstrates its feasibility for use over vegetation for the contiguous US and applicability for deriving vegetation indices, particularly the Normalized Difference Vegetation Index (NDVI). Images are available from January 2009 to December 2021 and are freely accessible via Google Earth Engine. Considering the time frame of ICESat-2 data acquisitions over the study sites, monthly composites from May 2019 were retrieved for analysis. All six Landsat spectral bands and NDVI derived from the red and near-infrared reflectance bands were combined with the 2016 NLCD canopy cover product and 2019 NLCD landcover product, and used as independent variables in RF models.

2.6. Data Analysis

Correlations (r) between canopy cover extracted from the ATL08 datasets and reference airborne lidar-derived canopy cover were examined at the 30 m pixel scale. ICESat-2 canopy cover was then compared with spatially coincident NLCD cover estimates. The pixel-level ICESat-2-derived canopy cover from each of the four approaches (Section 2.4) served as the response variable, with Landsat-derived metrics and NLCD canopy cover as independent variables. Random Forest (RF) regression was selected as the modeling approach, given demonstrated success in forest structural mapping with remote sensing data, including AGB [41], growing stock volume [42], basal area [43], canopy height [44], and canopy cover [45]. For each site, 30% of pixels were randomly set aside for model evaluation and remaining 70% of data were used to construct models. Each measure of ICESat-2 canopy cover was used as a dependent variable for building RF models for each study site. Thus, a total of four RF canopy cover models were built and evaluated over each site. The same predictors were used for each model and accuracies were assessed with the independent test set. The most accurate RF model was applied to map canopy cover across each study at the 30 m grid size. A Forest/Non-Forest mask developed from the 2019 NLCD landcover product (forest classes were forests, shrubs forested or forested wetlands or NLCD classes = 41–52, 90, and all other categories were reclassified to non-forest) was applied to the final canopy cover maps to set non-forest pixels to 0.

3. Results

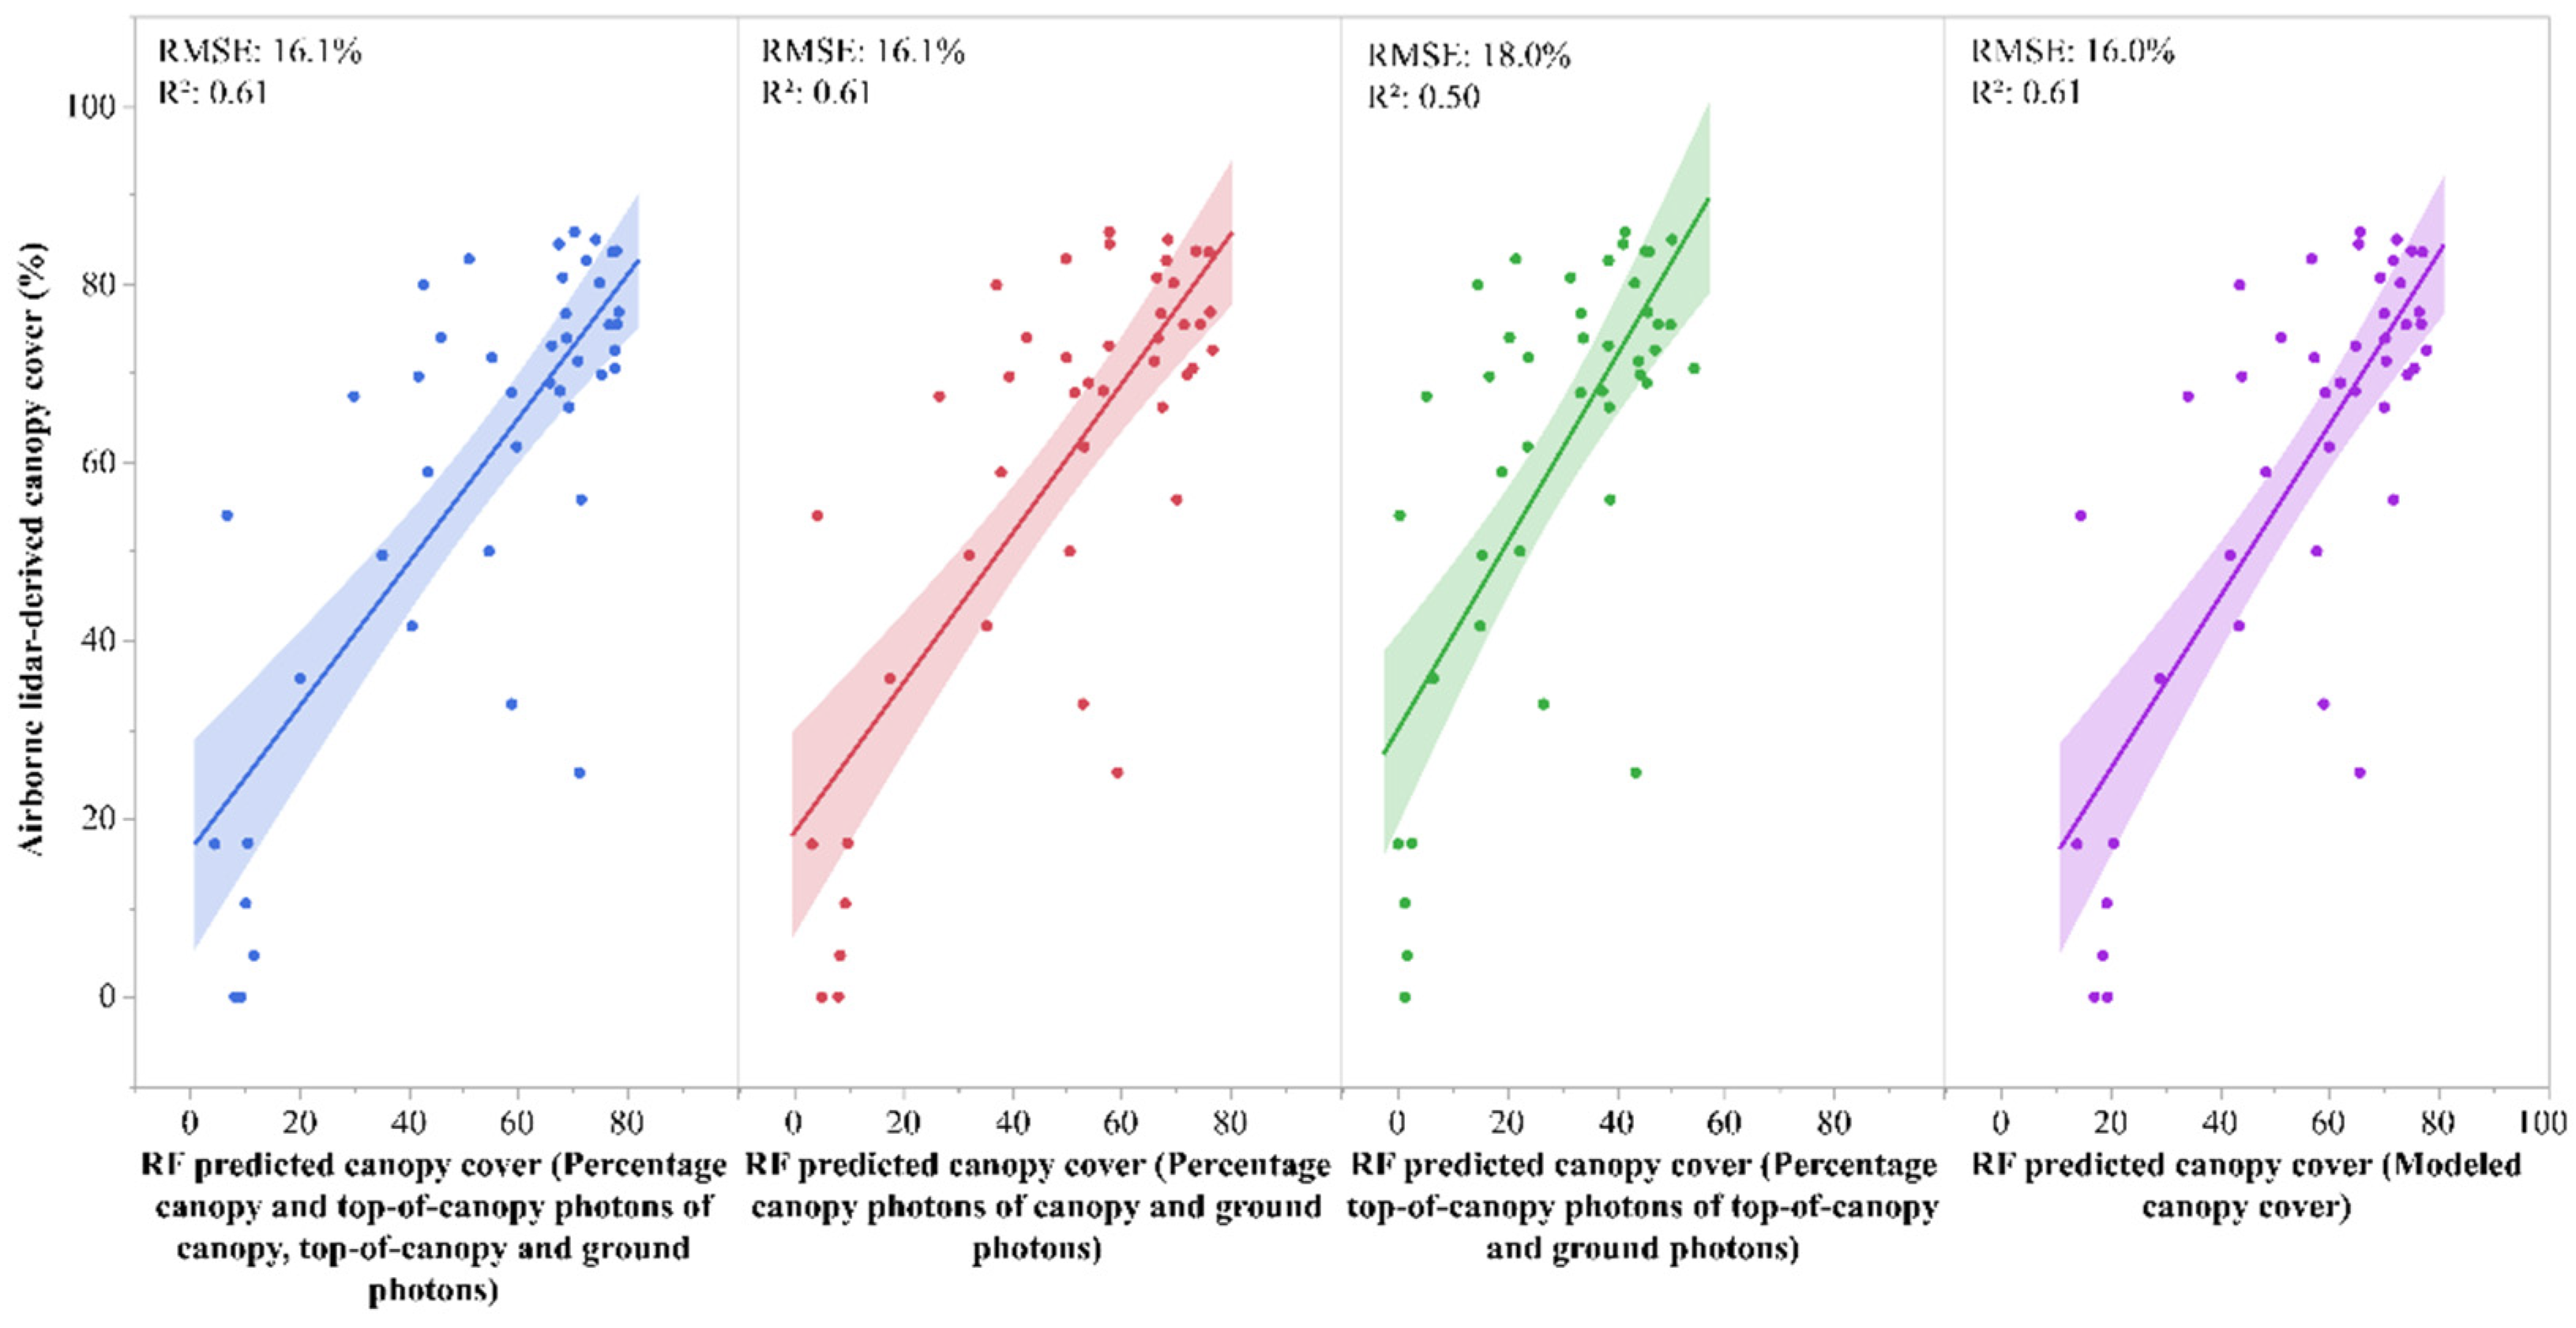
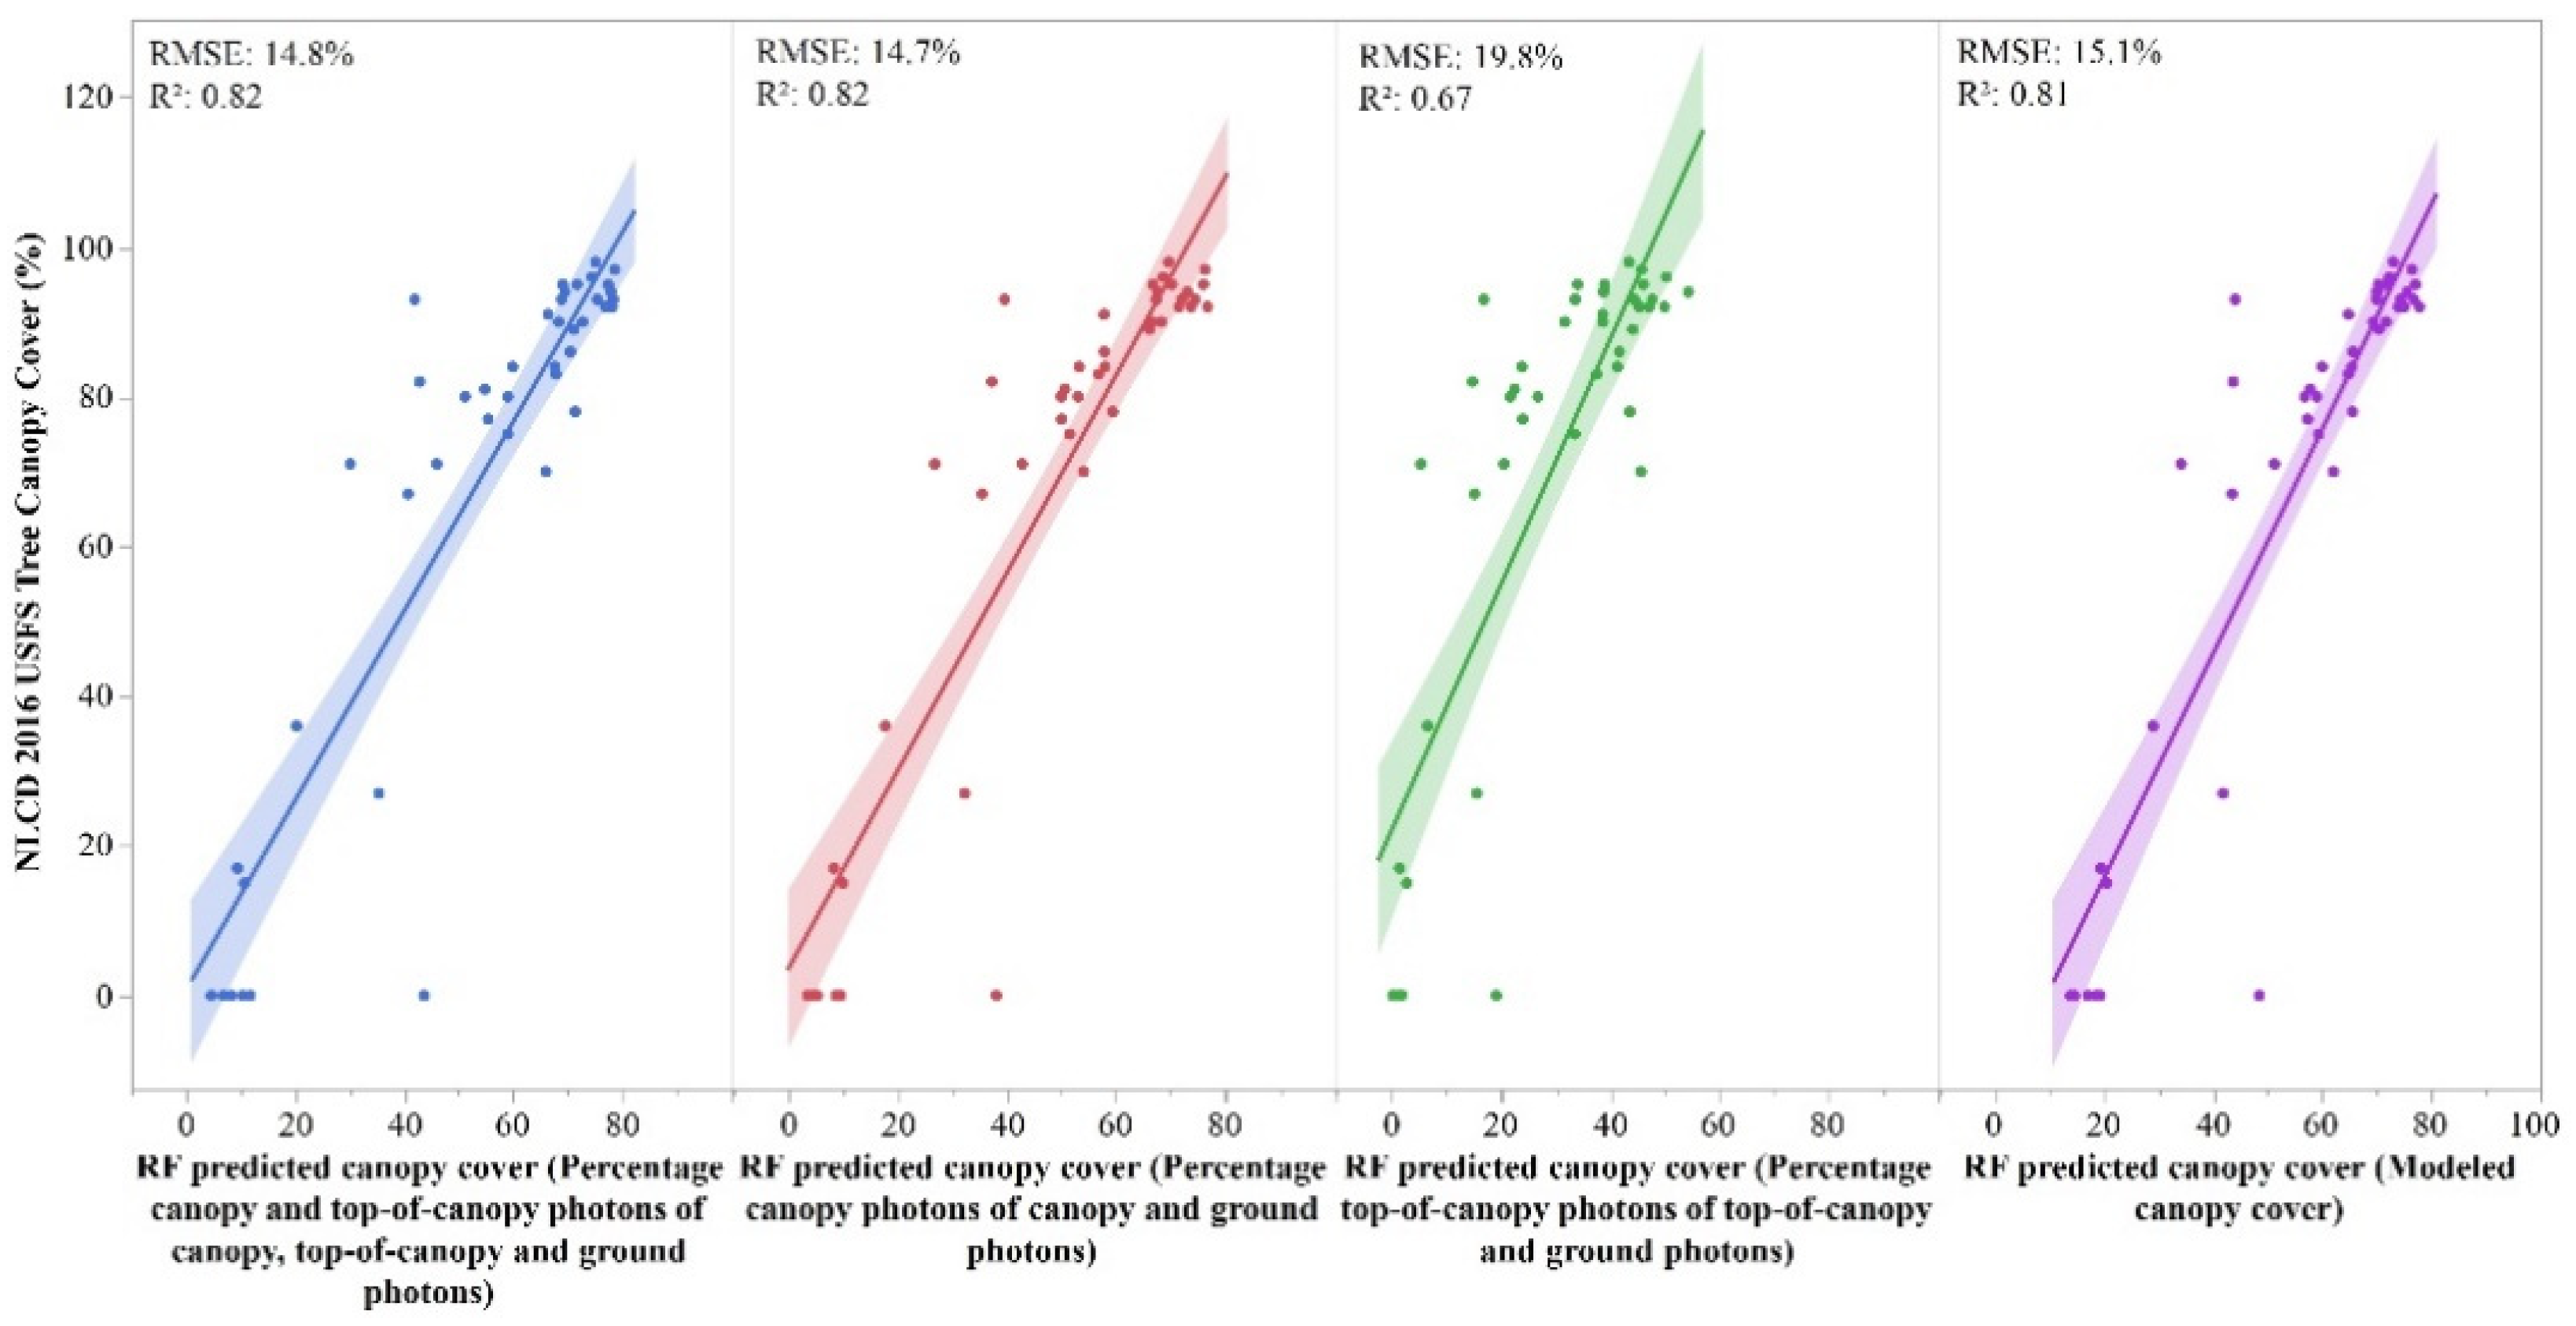
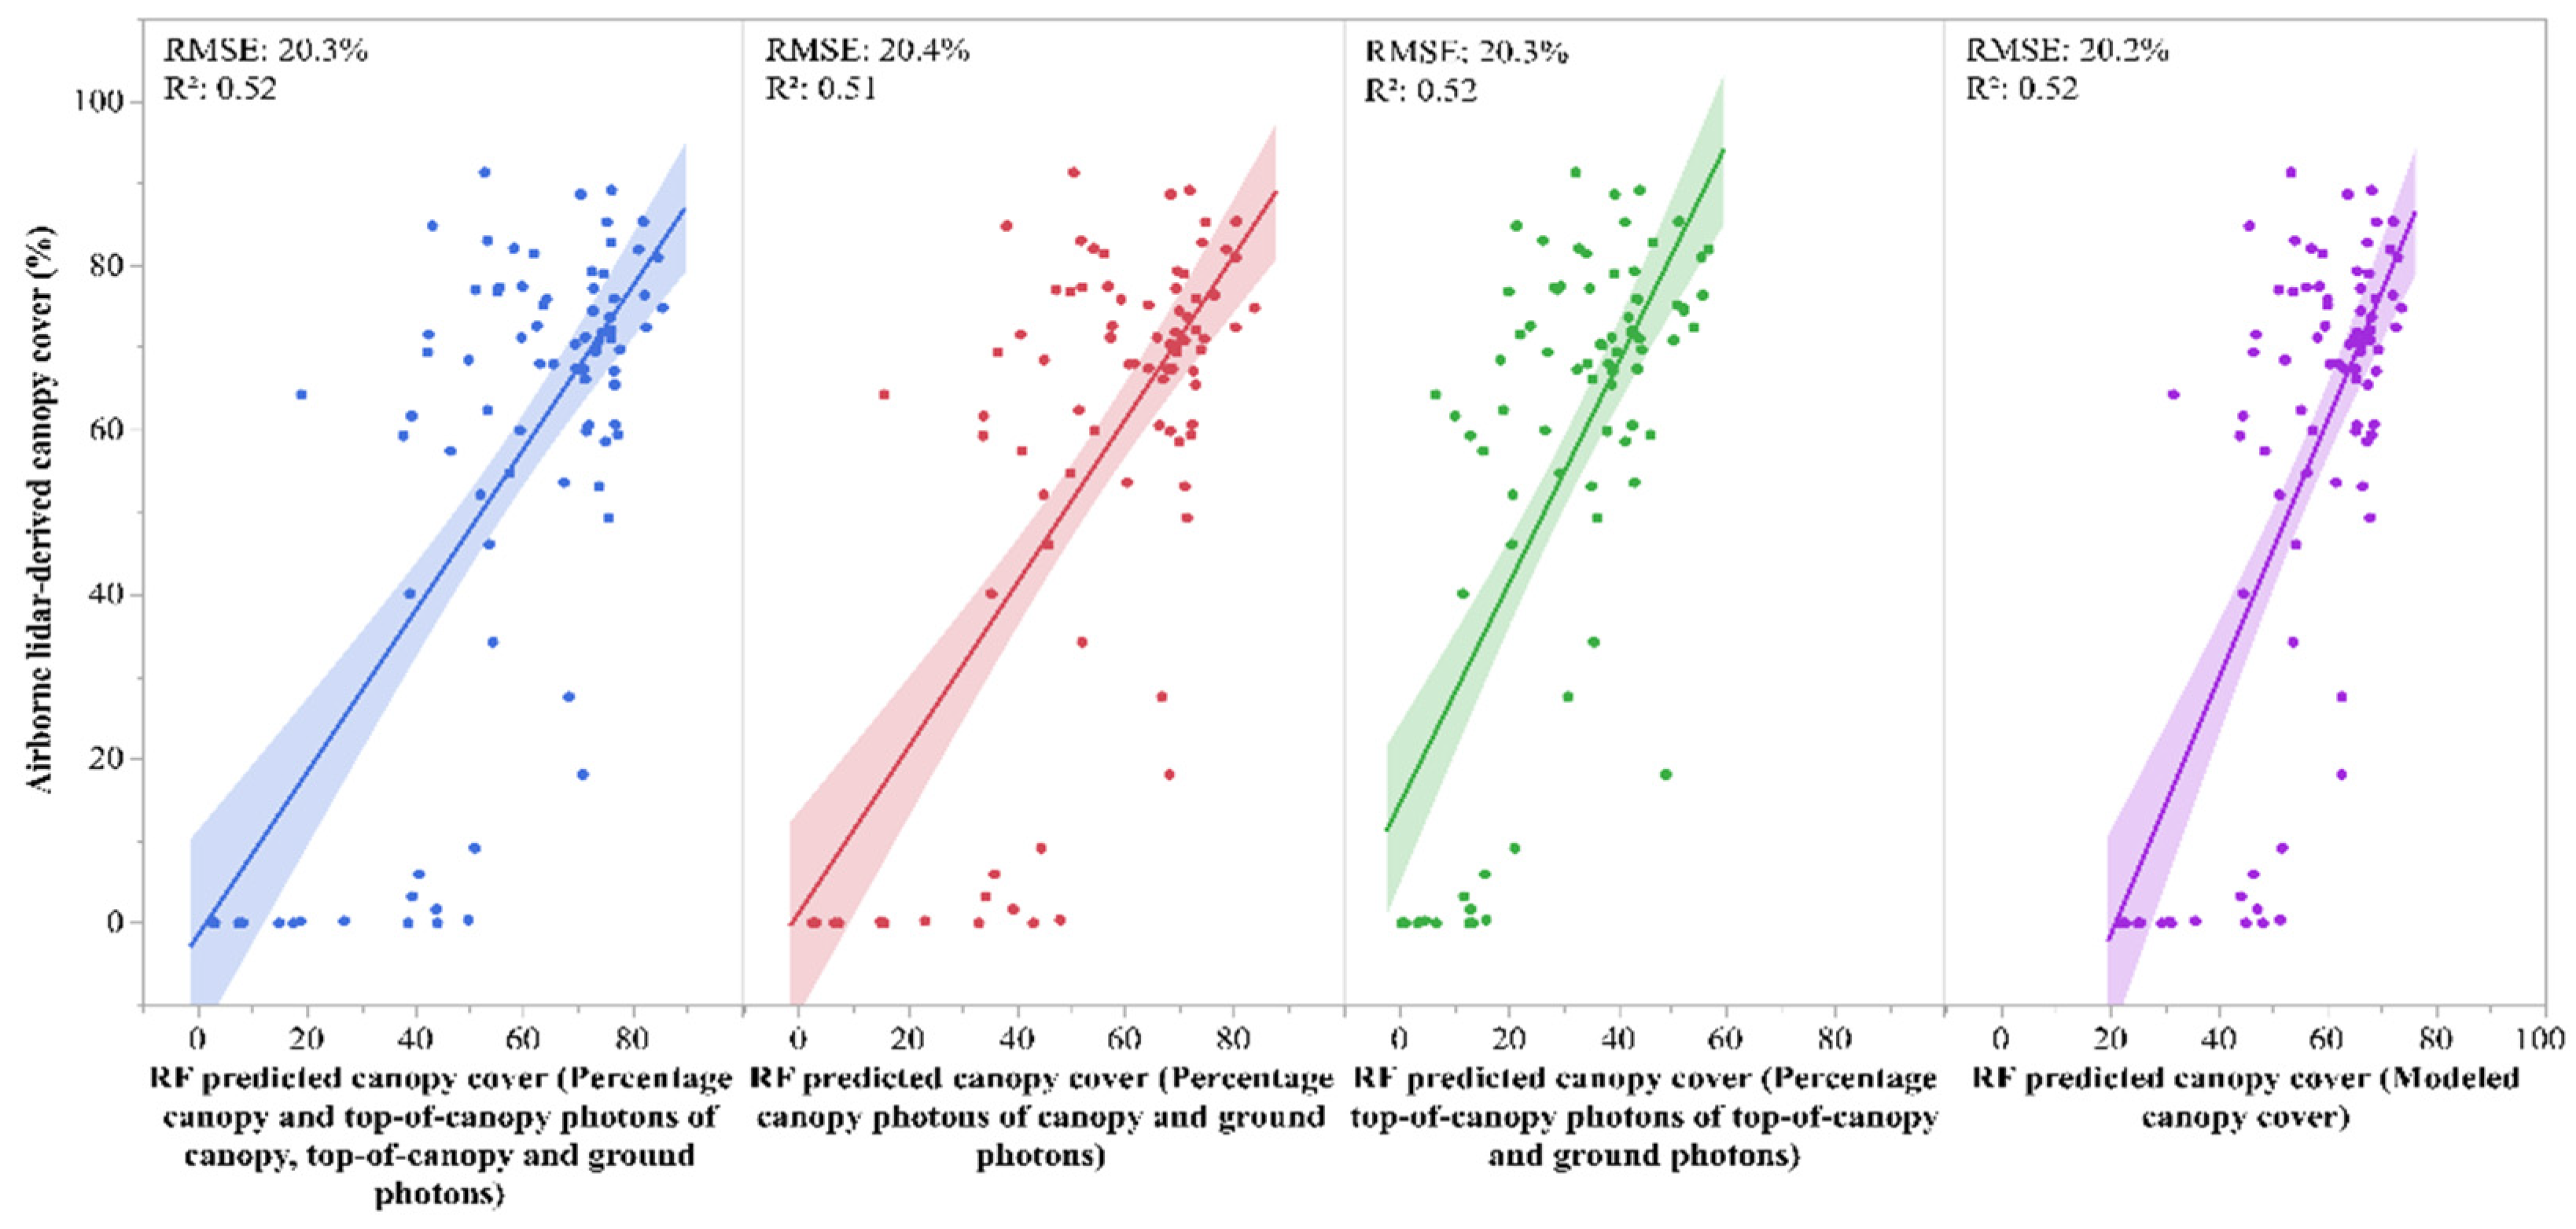
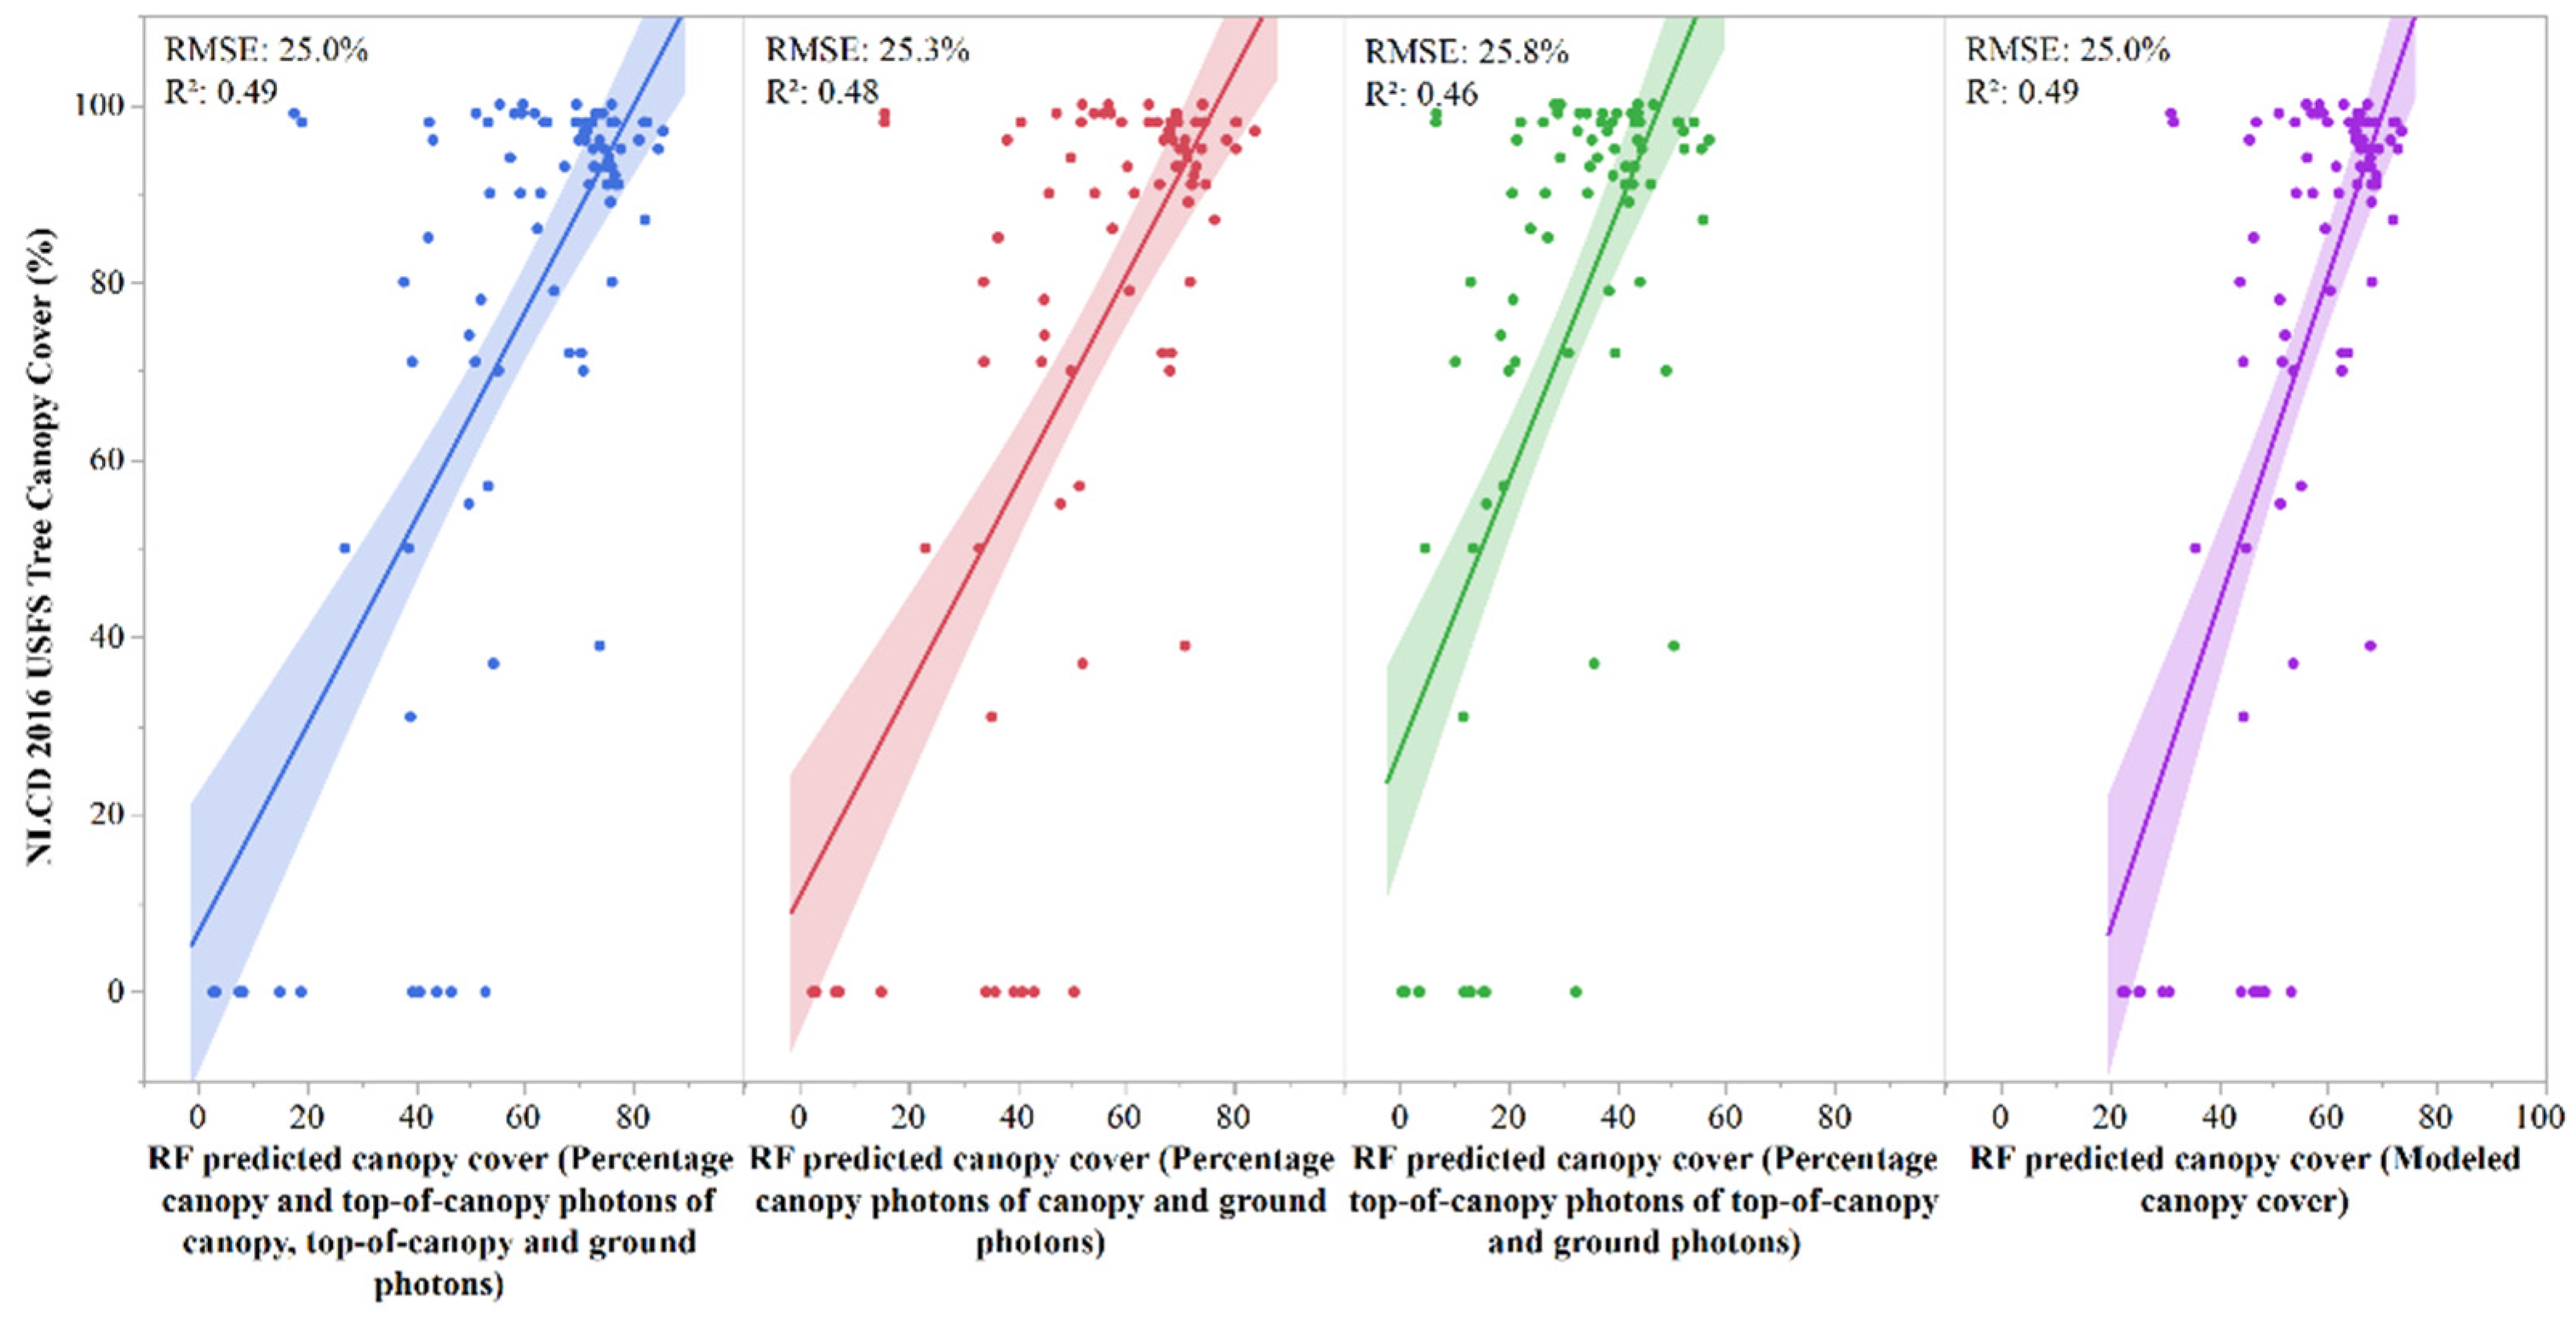
3.1. Pixel-Based ICESat-2 Canopy Cover vs. Reference Estimates

Consistent with ICESat-2 canopy height studies e.g., [16,17] and an earlier study on methods to derive canopy cover with ICESat-2 data (i.e., 100 m segment scale canopy parameters and classified photons, ATL08 data product, and ATL08 photons) [27], airborne lidar data were used as a reference set for this work. However, it is important to note that airborne lidar-derived canopy cover and the 2016 NLCD product estimates exhibit good correlations. Specifically, an initial examination of NLCD pixel estimates with spatially coincident reference airborne lidar (30 m pixel-based comparisons) produced r values of 0.72 and 0.82 for SDFEC (n = 288) and SHNF (n = 148) (based on airborne lidar-derived canopy cover >2 m).
ICESat-2 measures of canopy cover were all significantly correlated with airborne lidar-derived estimates at the 30 m pixel scale (p-values < 0.001). At the SHNF site, correlations (r) between pixel-level ATL08-derived canopy cover and ALS-derived canopy cover at the 30 m scale were 0.78, 0.78, and 0.69, based on Equations (1)–(3), respectively. At the SDFEC study area, correlation values were 0.64, 0.63, and 0.57 between the ATL08 canopy cover and airborne lidar canopy cover. Using linear regression to model canopy cover considering the three canopy cover metrics as explanatory variables, only one predictor remained in each model for SHNF and SDFEC. For SHNF and SDFEC, the models used canopy cover measured as the percentage of canopy and top-of-canopy photons of the total canopy, top-of-canopy, and ground photons (Equation (1)). However, relationships between the modeled canopy cover and airborne lidar canopy cover did not improve, with r values of 0.78 and 0.64 for SHNF and SDFEC.

3.2. RF Models and Maps of ICESat-2 Canopy Cover

A total of four RF models were constructed for each study site, using each of the four ICESat-2-derived canopy cover variables at the 30 m pixel scale as the dependent variable. With test data for the SHNF site, the mean airborne lidar-derived canopy cover was 60%, compared to the mean predictions of 54%, 49%, 29%, and 56% for each of the four models (Figure 3, left to right), respectively. RF models yielded R2 values between 0.50 and 0.61, with RMSEs between 16% and 18%. Identical results were obtained where the canopy cover calculated with Equations (1) and (2), was used as the dependent variable. Results were very similar when the modeled canopy cover was used as the dependent variable (Figure 3). For all models, either an infrared band or NLCD tree cover was the most important variable.
An examination of the relationships between the RF-predicted canopy cover and spatially coincident NLCD tree canopy estimates (mean = 69%) over the SHNF site produced R2 values between 0.67 and 0.82 (Figure 4) and RMSEs between 14% and 20%. Just as before, except for ICESat-2-predicted canopy cover based on Equation (3) (R2 = 0.67), results were very similar (R2 = 0.81–0.82), and RF-predicted canopy cover using the ICESat-2 estimates from Equation (2) produced the best results with an R2 and RMSE of 0.82 and 14.7%.
With the separate test dataset for the SDFEC, the mean airborne lidar-derived canopy cover was 56%, compared to the mean predictions of 58%, 55%, 31%, and 57% for each of the four models (Figure 5, left to right), respectively. Canopy cover models generated with the data for SDFEC yielded R2 values ranging from 0.51 to 0.52, and RMSEs of approximately 20% (Figure 5). Thus, regardless of the ICESat-2-derived measure of canopy cover used as the dependent variable, model accuracies were within the same range. Similarly, the 2019 NLCD landcover variable was the most important variable in all four RF models constructed with data for SDFEC, followed by the Landsat spectral bands. When comparing RF predictions with NLCD tree canopy estimates (mean cover = 74%) (Figure 6), R2 ranged from 0.46 to 0.49, and RMSEs from 25 to 26%. Identical metrics were produced using RF predictions with ICESat-2 canopy cover from Equation (1) as the dependent variable and where the modeled canopy cover was used.
Given the relationships between RF canopy cover predictions and airborne lidar estimates (and NLCD cover estimates), the RF model using ICESat-2 canopy cover from Equation (1) as the dependent variable (percentage canopy and top-of-canopy of terrain, canopy and top-of-canopy photons), was applied to develop 30 m canopy cover maps across the study sites (Figure 7). At the SHNF site, canopy cover ranged from 0% to 82% with an average cover of 48%, compared to the NLCD product, where values ranged from 0% to 100% with a mean of 72%. The comparison of mapped ICESat-2 canopy cover with NLCD estimates indicated a substantially lower frequency of values in the former, where NLCD cover exceeds 80% and is between 10 and 20% cover. Across the SDFEC site, mapped ICESat-2 canopy cover values ranged from 0 to 90% with an average value of 54%, while NLCD canopy cover ranged from 0 to 100% with a mean of 74%. A similar pattern of higher frequency of NLCD canopy cover values that exceed 80% with substantially lower frequency of values from ICESat-2 was evident across both study sites.

4. Discussion

ATLAS provides high spatial resolution data along tracks, and, as the mission continues to operate, will generate an expansive network of observations over the earth’s surface. Such structural data have already supported a range of applications across disciplines, including topography [46], bathymetry e.g., [47,48,49], and urban studies [50]. ICESat-2 studies highlight capabilities for characterizing canopy structure, and, with gridded canopy products anticipated in the mission’s upcoming ATL18 product, this study serves to inform upcoming wall-to-wall production with ATL08 data. Beyond ecological applications, gridded canopy cover, specifically the NLCD cover products, has supported studies across disciplines, including those focused on environmental equity [51], social vulnerability [52], and human health and mortality [52,53]. Given that the NLCD 2016 USFS tree canopy cover is the most recent product across the conterminous US, and methods for calculating canopy cover with ICESat-2’s ATL08 product have already been demonstrated [27], there is a need for producing a spatially comprehensive map of this parameter. Moreover, the combination of ICESat-2 data with optical sensor data typically used for NLCD cover products [5] allows for the integration of structural information for a more direct retrieval of vegetation’s structural attributes, like canopy cover.
The ability to map canopy cover with ICESat-2 and Landsat across all canopy cover ranges for temperate forest study sites is demonstrated, despite limitations for areas of high canopy cover. Overall, the methodology to map canopy cover with ICESat-2 was informed by earlier work over similar sites, specifically (1) the development of segment-level canopy cover equations [27], (2) comparisons of ICESat-2-derived canopy cover derived from an initial pre-processing of ICESat-2 data at the 30 m scale versus the direct application of segment-scale estimates to 30 m pixels [54], and (3) the synergistic use of ICESat-2 and Landsat data [4,55]. In this study, three measures of canopy cover computed from available ATL08 parameters [27] were applied to 30 m pixels for subsequent modeling and upscaling with RF. While an additional step to further improve pixel-scale ICESat-2 canopy cover before extrapolation was examined, findings do not suggest the implementation of this methodological approach. Except for computation based on the percentage of top-of-canopy photons of the number of top-of-canopy and ground photons, the two other equations (Equations (1) and (2)) for pixel-scale estimates yielded similar results. Both measures can be efficiently computed with available ATL08 metrics and results (e.g., correlations with airborne lidar and NLCD cover) support their application to deriving pixelwise canopy cover at a 30 m grid size.
In this study, scatterplots of reference airborne lidar canopy cover versus RF-predicted canopy cover for both study sites indicate a two-cluster pattern, at higher and lower values. ICESat-2 sampling limitations may have contributed to this observed pattern [17]. In an assessment of ICESat-2 terrain and canopy heights, Malambo and Popescu [17] indicate limitations in capturing intermediate vertical structure, with more points for top-of-canopy and ground than intermediate levels. Better agreement between ICESat-2 and reference airborne lidar estimates for higher height percentiles was attributed to better sampling of the top-of-canopy. Poor agreement for intermediate canopy heights indicates insufficient penetration in the lower canopy [17].
Results show that ICESat-2 was found to underestimate canopy cover when values (airborne lidar-derived and NLCD) exceeded 80%. With test pixels, 20% and 14% of airborne lidar-derived canopy cover pixels exceeded 80% canopy cover for SHNF and SDFEC, compared to 0% and only 7% from ICESat-2-predicted canopy cover (RF-predicted, with estimates derived from Equation (1)). However, it is notable that ICESat-2 canopy cover estimates were within similar ranges and average values when compared to the reference estimates. ICESat-2 vegetation studies have reported better results with ATL08 where, in general, canopy cover was less than 80%. To exemplify: underestimations of both the AGB and canopy height were noted in areas with high canopy cover [17,56]. Studies have also indicated that ICESat-2 overestimates heights for low-height vegetation, and an underestimation of tree canopy heights [20] and AGB in high AGB forests has also been reported [57]. Consistent with the literature, overestimations were evident at the lower ranges, particularly where canopy cover values (airborne lidar and NLCD) were less than 20%. Nevertheless, this work indicates the capability for generating spatially explicit canopy cover with ICESat-2 in combination with Landsat (e.g., R2 0.51–0.61).
At the 30 m grid size, other Earth Observation mission data may be examined for further improving canopy cover estimates. Opportunities for deriving large-area canopy structural information are greater than ever before. One of the science objectives of ICESat-2 is to capture vegetation heights, while that of another space-based lidar, the Global Ecosystem Dynamics Investigation (GEDI), was specifically designed for characterizing vegetation structure [58]. The extent to which data from both missions can be used synergistically to derive canopy cover needs to be determined. Considering accuracies provided with only ICESat-2, the combined use of ICESat-2 and GEDI samples with area-wide predictors like those from Landsat or Sentinel may be beneficial. While determining the extent to which spatially incontiguous observations from these two space-based lidars can be used for canopy cover and other forest mapping applications need to be investigated, such an approach is expected to further improve accuracies. In doing so, additional machine learning and deep learning (DL) techniques should also be examined. Alvites, et al. [59] noted the increasing use of such approaches for forest parameter estimation with lidar data. Given the ability to handle large and complex datasets, DL algorithms could be leveraged for multi-source mapping applications [60]. For instance, Zhang, et al. [61] examined a DL-based workflow for estimating AGB with airborne lidar data and Landsat imagery. The authors found that the DL model (Stacked Sparse Autoencoder network) outperformed the K-nearest neighbor, RF, Support Vector regression, and stepwise linear regression models. The synergistic use of earth observations from satellites, including ICESat-2, GEDI, and Landsat, presents opportunities for further understanding the application of DL techniques for generating spatially complete information on forest attributes.

5. Conclusions

Wall-to-wall maps of canopy cover, and more importantly, updated canopy cover information, represent an invaluable resource for a range of applications. Despite its exceptional capability to provide vertical and horizontal vegetation information, a methodology for mapping canopy cover with ICESat-2 is not yet available. This study presents a methodology to apply structural estimates from ICESat-2′s vegetation data product to generate predicted maps of canopy cover. Findings for temperate forest conditions in the Southern US suggest the capability for mapping at a 30 m grid size by utilizing segment-level measures of canopy cover and integrating Landsat predictors for upscaling. By comparing several methods of derived canopy cover at the pixel scale and subsequent extrapolation of estimates, the results support a simpler approach that does not require calibration before upscaling, and highlight complementary information provided by existing NLCD and Landsat reflectance products. Ongoing research serves to assess the transferability of this framework to other vegetated conditions, determine the potential of integrating other Earth Observation data sources, and develop a regional scale canopy cover product with ICESat-2.

Author Contributions

Conceptualization, S.C.P. and L.L.N.; methodology, L.L.N., S.C.P. and L.M.; formal analysis, L.L.N.; investigation, L.L.N. and L.M.; resources, S.C.P. and L.L.N.; writing–original draft preparation, L.L.N.; writing–review and editing, L.L.N., S.C.P. and L.M.; visualization, L.L.N. All authors have read and agreed to the published version of the manuscript.

Funding

This research was funded by NASA ICESat-2 Science Team, Studies with ICESat-2 NNH19ZDA001N grant.

Institutional Review Board Statement

Not applicable.

Informed Consent Statement

Not applicable.

Data Availability Statement

All data analyzed for this study are openly available. ICESat-2 data used for this manuscript are available from the National Snow and Ice Data Center (https://nsidc.org/data/icesat-2, accessed on 12 July 2022), Landsat data are openly available from USGS EarthExplorer (https://earthexplorer.usgs.gov/, accessed on 21 July 2022) and NLCD data, are openly available from the Multi-Resolution Land Characteristics consortium (https://www.mrlc.gov/, accessed on 1 June 2022).

Conflicts of Interest

The authors declare no conflict of interest.

References

  1. Lerman, S.B.; Nislow, K.H.; Nowak, D.J.; DeStefano, S.; King, D.I.; Jones-Farrand, D.T. Using urban forest assessment tools to model bird habitat potential. Landsc. Urban Plan. 2014, 122, 29–40. [Google Scholar] [CrossRef] [Green Version]
  2. Lausch, A.; Erasmi, S.; King, D.J.; Magdon, P.; Heurich, M. Understanding Forest Health with Remote Sensing-Part II—A Review of Approaches and Data Models. Remote Sens. 2017, 9, 129. [Google Scholar] [CrossRef] [Green Version]
  3. McCarley, T.R.; Kolden, C.A.; Vaillant, N.M.; Hudak, A.T.; Smith, A.M.S.; Kreitler, J. Landscape-scale quantification of fire-induced change in canopy cover following mountain pine beetle outbreak and timber harvest. For. Ecol. Manag. 2017, 391, 164–175. [Google Scholar] [CrossRef] [Green Version]
  4. Narine, L.L.; Popescu, S.C.; Malambo, L. Using ICESat-2 to Estimate and Map Forest Aboveground Biomass: A First Example. Remote Sens. 2020, 12, 1824. [Google Scholar] [CrossRef]
  5. Coulston, J.; Moisen, G.; Wilson, B.T.; Finco, M.; Cohen, W.; Brewer, C.K. Modeling Percent Tree Canopy Cover: A Pilot Study. Photogramm. Eng. Remote Sens. 2012, 78, 715–727. [Google Scholar] [CrossRef] [Green Version]
  6. Hopkinson, C.; Chasmer, L. Testing LiDAR models of fractional cover across multiple forest ecozones. Remote Sens. Environ. 2009, 113, 275–288. [Google Scholar] [CrossRef]
  7. O’Neil-Dunne, J. CMS: LiDAR-Derived Tree Canopy Cover for Pennsylvania, USA, 2008; ORNL Distributed Active Archive Center: Oak Ridge, TN, USA, 2016. [Google Scholar] [CrossRef]
  8. Korhonen, L.; Korpela, I.; Heiskanen, J.; Maltamo, M. Airborne discrete-return LIDAR data in the estimation of vertical canopy cover, angular canopy closure and leaf area index. Remote Sens. Environ. 2011, 115, 1065–1080. [Google Scholar] [CrossRef]
  9. Coops, N.C.; Tompalski, P.; Goodbody, T.R.H.; Queinnec, M.; Luther, J.E.; Bolton, D.K.; White, J.C.; Wulder, M.A.; van Lier, O.R.; Hermosilla, T. Modelling lidar-derived estimates of forest attributes over space and time: A review of approaches and future trends. Remote Sens. Environ. 2021, 260, 112477. [Google Scholar] [CrossRef]
  10. Tang, H.; Armston, J.; Hancock, S.; Marselis, S.; Goetz, S.; Dubayah, R. Characterizing global forest canopy cover distribution using spaceborne lidar. Remote Sens. Environ. 2019, 231, 111262. [Google Scholar] [CrossRef]
  11. Lefsky, M.A. A global forest canopy height map from the Moderate Resolution Imaging Spectroradiometer and the Geoscience Laser Altimeter System. Geophys. Res. Lett. 2010, 37, 5. [Google Scholar] [CrossRef] [Green Version]
  12. Simard, M.; Pinto, N.; Fisher, J.B.; Baccini, A. Mapping forest canopy height globally with spaceborne lidar. J. Geophys. Res.-Biogeosci. 2011, 116, 12. [Google Scholar] [CrossRef] [Green Version]
  13. Hu, T.Y.; Su, Y.J.; Xue, B.L.; Liu, J.; Zhao, X.Q.; Fang, J.Y.; Guo, Q.H. Mapping Global Forest Aboveground Biomass with Spaceborne LiDAR, Optical Imagery, and Forest Inventory Data. Remote Sens. 2016, 8, 565. [Google Scholar] [CrossRef] [Green Version]
  14. Ranson, K.; Nelson, R.; Kimes, D.; Sun, G.; Kharuk, V.; Montesano, P. Using MODIS and GLAS data to develop timber volume estimates in central Siberia. In Proceedings of the 2007 IEEE International Geoscience and Remote Sensing Symposium, Barcelona, Spain, 23–28 July 2007; pp. 2306–2309. [Google Scholar]
  15. Neumann, T.A.; Martino, A.J.; Markus, T.; Bae, S.; Bock, M.R.; Brenner, A.C.; Brunt, K.M.; Cavanaugh, J.; Fernandes, S.T.; Hancock, D.W.; et al. The Ice, Cloud, and Land Elevation Satellite–2 mission: A global geolocated photon product derived from the Advanced Topographic Laser Altimeter System. Remote Sens. Environ. 2019, 233, 111325. [Google Scholar] [CrossRef] [PubMed]
  16. Neuenschwander, A.; Guenther, E.; White, J.C.; Duncanson, L.; Montesano, P. Validation of ICESat-2 terrain and canopy heights in boreal forests. Remote Sens. Environ. 2020, 251, 112110. [Google Scholar] [CrossRef]
  17. Malambo, L.; Popescu, S.C. Assessing the agreement of ICESat-2 terrain and canopy height with airborne lidar over US ecozones. Remote Sens. Environ. 2021, 266, 112711. [Google Scholar] [CrossRef]
  18. Neuenschwander, A.; Pitts, K. The ATL08 land and vegetation product for the ICESat-2 Mission. Remote Sens. Environ. 2019, 221, 247–259. [Google Scholar] [CrossRef]
  19. Nandy, S.; Srinet, R.; Padalia, H. Mapping Forest Height and Aboveground Biomass by Integrating ICESat-2, Sentinel-1 and Sentinel-2 Data Using Random Forest Algorithm in Northwest Himalayan Foothills of India. Geophys. Res. Lett. 2021, 48, e2021GL093799. [Google Scholar] [CrossRef]
  20. Liu, A.; Cheng, X.; Chen, Z. Performance evaluation of GEDI and ICESat-2 laser altimeter data for terrain and canopy height retrievals. Remote Sens. Environ. 2021, 264, 112571. [Google Scholar] [CrossRef]
  21. Zhu, X.; Wang, C.; Nie, S.; Pan, F.; Xi, X.; Hu, Z. Mapping forest height using photon-counting LiDAR data and Landsat 8 OLI data: A case study in Virginia and North Carolina, USA. Ecol. Indic. 2020, 114, 106287. [Google Scholar] [CrossRef]
  22. Li, W.; Niu, Z.; Shang, R.; Qin, Y.; Wang, L.; Chen, H. High-resolution mapping of forest canopy height using machine learning by coupling ICESat-2 LiDAR with Sentinel-1, Sentinel-2 and Landsat-8 data. Int. J. Appl. Earth Obs. Geoinf. 2020, 92, 102163. [Google Scholar] [CrossRef]
  23. Zhang, J.; Tian, J.; Li, X.; Wang, L.; Chen, B.; Gong, H.; Ni, R.; Zhou, B.; Yang, C. Leaf area index retrieval with ICESat-2 photon counting LiDAR. Int. J. Appl. Earth Obs. Geoinf. 2021, 103, 102488. [Google Scholar] [CrossRef]
  24. Xi, Z.; Xu, H.; Xing, Y.; Gong, W.; Chen, G.; Yang, S. Forest Canopy Height Mapping by Synergizing ICESat-2, Sentinel-1, Sentinel-2 and Topographic Information Based on Machine Learning Methods. Remote Sens. 2022, 14, 364. [Google Scholar] [CrossRef]
  25. Liu, X.; Su, Y.; Hu, T.; Yang, Q.; Liu, B.; Deng, Y.; Tang, H.; Tang, Z.; Fang, J.; Guo, Q. Neural network guided interpolation for mapping canopy height of China’s forests by integrating GEDI and ICESat-2 data. Remote Sens. Environ. 2022, 269, 112844. [Google Scholar] [CrossRef]
  26. Markus, T.; Neumann, T.; Martino, A.; Abdalati, W.; Brunt, K.; Csatho, B.; Farrell, S.; Fricker, H.; Gardner, A.; Harding, D.; et al. The Ice, Cloud, and land Elevation Satellite-2 (ICESat-2): Science requirements, concept, and implementation. Remote Sens. Environ. 2017, 190, 260–273. [Google Scholar] [CrossRef]
  27. Narine, L.; Malambo, L.; Popescu, S. Characterizing canopy cover with ICESat-2: A case study of southern forests in Texas and Alabama, USA. Remote Sens. Environ. 2022, 281, 113242. [Google Scholar] [CrossRef]
  28. Homer, C.; Dewitz, J.; Yang, L.M.; Jin, S.; Danielson, P.; Xian, G.; Coulston, J.; Herold, N.; Wickham, J.; Megown, K. Completion of the 2011 National Land Cover Database for the Conterminous United States-Representing a Decade of Land Cover Change Information. Photogramm. Eng. Remote Sens. 2015, 81, 345–354. [Google Scholar] [CrossRef]
  29. USGS. What Is 3DEP? Available online: https://www.usgs.gov/core-science-systems/ngp/3dep/what-is-3dep?qt-science_support_page_related_con=0#qt-science_support_page_related_con (accessed on 10 September 2022).
  30. Moreno-Martínez, Á.; Izquierdo-Verdiguier, E.; Maneta, M.P.; Camps-Valls, G.; Robinson, N.; Muñoz-Marí, J.; Sedano, F.; Clinton, N.; Running, S.W. Multispectral high resolution sensor fusion for smoothing and gap-filling in the cloud. Remote Sens. Environ. 2020, 247, 111901. [Google Scholar] [CrossRef]
  31. Narine, L.L.; Popescu, S.; Neuenschwander, A.; Zhou, T.; Srinivasan, S.; Harbeck, K. Estimating aboveground biomass and forest canopy cover with simulated ICESat-2 data. Remote Sens. Environ. 2019, 224, 1–11. [Google Scholar] [CrossRef]
  32. Service, U.F. Tree Canopy Cover Mapping Products. Available online: https://data.fs.usda.gov/geodata/rastergateway/treecanopycover/docs/TCC_Project_Overview_Brochure-FS_2020-06-05.pdf (accessed on 4 November 2022).
  33. Li, L.; Guo, Q.H.; Tao, S.L.; Kelly, M.G.; Xu, G.C. Lidar with multi-temporal MODIS provide a means to upscale predictions of forest biomass. Isprs J. Photogramm. Remote Sens. 2015, 102, 198–208. [Google Scholar] [CrossRef]
  34. Service, U.F. Forest Inventory and Analysis National Core Field Guide Volume I: Field Data Collection Procedures for Phase 2 Plots Version 6.1. Available online: https://www.fia.fs.usda.gov/library/field-guides-methods-proc/docs/2014/Core%20FIA%20field%20guide_6-1.pdf (accessed on 7 March 2023).
  35. Neuenschwander, A.; Magruder, L.; Guenther, E.; Hancock, S.; Purslow, M. Radiometric Assessment of ICESat-2 over Vegetated Surfaces. Remote Sens. 2022, 14, 787. [Google Scholar] [CrossRef]
  36. Moser, P.; Vibrans, A.C.; McRoberts, R.E.; Næsset, E.; Gobakken, T.; Chirici, G.; Mura, M.; Marchetti, M. Methods for variable selection in LiDAR-assisted forest inventories. Forestry. An. Int. J. For. Res. 2017, 90, 112–124. [Google Scholar] [CrossRef] [Green Version]
  37. Fassnacht, F.E.; Hartig, F.; Latifi, H.; Berger, C.; Hernández, J.; Corvalán, P.; Koch, B. Importance of sample size, data type and prediction method for remote sensing-based estimations of aboveground forest biomass. Remote Sens. Environ. 2014, 154, 102–114. [Google Scholar] [CrossRef]
  38. Aardt, J.A.N.v.; Wynne, R.H.; Oderwald, R.G. Forest Volume and Biomass Estimation Using Small-Footprint Lidar-Distributional Parameters on a Per-Segment Basis. For. Sci. 2006, 52, 636–649. [Google Scholar] [CrossRef]
  39. Margolis, H.A.; Nelson, R.F.; Montesano, P.M.; Beaudoin, A.; Sun, G.; Andersen, H.-E.; Wulder, M.A. Combining satellite lidar, airborne lidar, and ground plots to estimate the amount and distribution of aboveground biomass in the boreal forest of North America1. Can. J. For. Res. 2015, 45, 838–855. [Google Scholar] [CrossRef] [Green Version]
  40. Nelson, R.; Margolis, H.; Montesano, P.; Sun, G.Q.; Cook, B.; Corp, L.; Andersen, H.E.; deJong, B.; Pellat, F.P.; Fickel, T.; et al. Lidar-based estimates of aboveground biomass in the continental US and Mexico using ground, airborne, and satellite observations. Remote Sens. Environ. 2017, 188, 127–140. [Google Scholar] [CrossRef] [Green Version]
  41. Hudak, A.T.; Fekety, P.A.; Kane, V.R.; Kennedy, R.E.; Filippelli, S.K.; Falkowski, M.J.; Tinkham, W.T.; Smith, A.M.S.; Crookston, N.L.; Domke, G.M.; et al. A carbon monitoring system for mapping regional, annual aboveground biomass across the northwestern USA. Environ. Res. Lett. 2020, 15, 095003. [Google Scholar] [CrossRef]
  42. Obata, S.; Cieszewski, C.J.; Lowe, R.C.; Bettinger, P. Random Forest Regression Model for Estimation of the Growing Stock Volumes in Georgia, USA, Using Dense Landsat Time Series and FIA Dataset. Remote Sens. 2021, 13, 218. [Google Scholar] [CrossRef]
  43. Fekety, P.A.; Falkowski, M.J.; Hudak, A.T.; Jain, T.B.; Evans, J.S. Transferability of Lidar-derived Basal Area and Stem Density Models within a Northern Idaho Ecoregion. Can. J. Remote Sens. 2018, 44, 131–143. [Google Scholar] [CrossRef]
  44. Jin, S.; Su, Y.; Gao, S.; Hu, T.; Liu, J.; Guo, Q. The Transferability of Random Forest in Canopy Height Estimation from Multi-Source Remote Sensing Data. Remote Sens. 2018, 10, 1183. [Google Scholar] [CrossRef] [Green Version]
  45. Ahmed, O.S.; Franklin, S.E.; Wulder, M.A.; White, J.C. Characterizing stand-level forest canopy cover and height using Landsat time series, samples of airborne LiDAR, and the Random Forest algorithm. Isprs J. Photogramm. Remote Sens. 2015, 101, 89–101. [Google Scholar] [CrossRef]
  46. Hooijer, A.; Vernimmen, R. Global LiDAR land elevation data reveal greatest sea-level rise vulnerability in the tropics. Nat. Commun. 2021, 12, 3592. [Google Scholar] [CrossRef] [PubMed]
  47. Chen, Y.; Zhu, Z.; Le, Y.; Qiu, Z.; Chen, G.; Wang, L. Refraction correction and coordinate displacement compensation in nearshore bathymetry using ICESat-2 lidar data and remote-sensing images. Opt. Express 2021, 29, 2411–2430. [Google Scholar] [CrossRef] [PubMed]
  48. Zhang, W.; Xu, N.; Ma, Y.; Yang, B.; Zhang, Z.; Wang, X.H.; Li, S. A maximum bathymetric depth model to simulate satellite photon-counting lidar performance. ISPRS J. Photogramm. Remote Sens. 2021, 174, 182–197. [Google Scholar] [CrossRef]
  49. Thomas, N.; Pertiwi, A.P.; Traganos, D.; Lagomasino, D.; Poursanidis, D.; Moreno, S.; Fatoyinbo, L. Space-Borne Cloud-Native Satellite-Derived Bathymetry (SDB) Models Using ICESat-2 And Sentinel-2. Geophys. Res. Lett. 2021, 48, e2020GL092170. [Google Scholar] [CrossRef]
  50. Dandabathula, G.; Sitiraju, S.R.; Jha, C.S. Retrieval of building heights from ICESat-2 photon data and evaluation with field measurements. Environ. Res. Infrastruct. Sustain. 2021, 1, 011003. [Google Scholar] [CrossRef]
  51. Koo, B.W.; Boyd, N.; Botchwey, N.; Guhathakurta, S. Environmental Equity and Spatiotemporal Patterns of Urban Tree Canopy in Atlanta. J. Plan. Educ. Res. 2019, 43, 0739456X19864149. [Google Scholar] [CrossRef]
  52. Lee, S.; Baek, J.; Kim, S.W.; Newman, G. Tree canopy, pediatric asthma, and social vulnerability: An ecological study in Connecticut. Landsc. Urban Plan. 2022, 225, 104451. [Google Scholar] [CrossRef]
  53. Sinha, P.; Coville, R.C.; Hirabayashi, S.; Lim, B.; Endreny, T.A.; Nowak, D.J. Variation in estimates of heat-related mortality reduction due to tree cover in U.S. cities. J. Environ. Manag. 2022, 301, 113751. [Google Scholar] [CrossRef]
  54. Narine, L.; Malambo, L.; Popescu, S. Estimating canopy cover from ICESat-2. In Proceedings of the SilviLaser Conference 2021, Vienna, Austria, 28–30 September 2021; pp. 157–159. [Google Scholar]
  55. Glenn, N.F.; Neuenschwander, A.; Vierling, L.A.; Spaete, L.; Li, A.H.; Shinneman, D.J.; Pilliod, D.S.; Arkle, R.S.; McIlroy, S.K. Landsat 8 and ICESat-2: Performance and potential synergies for quantifying dryland ecosystem vegetation cover and biomass. Remote Sens. Environ. 2016, 185, 233–242. [Google Scholar] [CrossRef]
  56. Duncanson, L.; Neuenschwander, A.; Hancock, S.; Thomas, N.; Fatoyinbo, T.; Simard, M.; Silva, C.A.; Armston, J.; Luthcke, S.B.; Hofton, M.; et al. Biomass estimation from simulated GEDI, ICESat-2 and NISAR across environmental gradients in Sonoma County, California. Remote Sens. Environ. 2020, 242, 111779. [Google Scholar] [CrossRef]
  57. Silva, C.A.; Duncanson, L.; Hancock, S.; Neuenschwander, A.; Thomas, N.; Hofton, M.; Fatoyinbo, L.; Simard, M.; Marshak, C.Z.; Armston, J.; et al. Fusing simulated GEDI, ICESat-2 and NISAR data for regional aboveground biomass mapping. Remote Sens. Environ. 2021, 253, 112234. [Google Scholar] [CrossRef]
  58. Dubayah, R.; Blair, J.B.; Goetz, S.; Fatoyinbo, L.; Hansen, M.; Healey, S.; Hofton, M.; Hurtt, G.; Kellner, J.; Luthcke, S.; et al. The Global Ecosystem Dynamics Investigation: High-resolution laser ranging of the Earth’s forests and topography. Sci. Remote Sens. 2020, 1, 100002. [Google Scholar] [CrossRef]
  59. Alvites, C.; Marchetti, M.; Lasserre, B.; Santopuoli, G. LiDAR as a Tool for Assessing Timber Assortments: A Systematic Literature Review. Remote Sens. 2022, 14, 4466. [Google Scholar] [CrossRef]
  60. Narine, L.L.; Popescu, S.C.; Malambo, L. Synergy of ICESat-2 and Landsat for Mapping Forest Aboveground Biomass with Deep Learning. Remote Sens. 2019, 11, 1503. [Google Scholar] [CrossRef]
  61. Zhang, L.; Shao, Z.; Liu, J.; Cheng, Q. Deep Learning Based Retrieval of Forest Aboveground Biomass from Combined LiDAR and Landsat 8 Data. Remote Sens. 2019, 11, 1459. [Google Scholar] [CrossRef] [Green Version]
Figure 1. Workflow for mapping canopy cover with ICESat-2. Slanted boxes represent data, straight boxes indicate actions, and arrows denote sequence or flow between data and actions.
Remotesensing 15 01548 g001
Figure 2. (a) Location of study sites within the Southern US, (b) ICESat-2 tracks (only strong beams) over the Solon Dixon Forestry Education Center in southern Alabama, (c) ICESat-2 tracks over the Sam Houston National Forest (SHNF) site in south-east Texas, and (d) Visual representation of a sample of ATL08 segments over SDFEC. Data are overlaid on 1 m National Agriculture Imagery Program (NAIP) imagery.
Remotesensing 15 01548 g002
Figure 3. Pixel-level (30 m) airborne lidar-derived canopy cover versus RF-predicted canopy cover for SHNF.
Remotesensing 15 01548 g003
Figure 4. NLCD tree canopy cover versus RF-predicted canopy cover for SHNF.
Remotesensing 15 01548 g004
Figure 5. Pixel-level (30 m) airborne lidar-derived canopy cover versus RF-predicted canopy cover for SDFEC.
Remotesensing 15 01548 g005
Figure 6. NLCD tree canopy cover versus RF-predicted canopy cover for SDFEC.
Remotesensing 15 01548 g006
Figure 7. ICESat-2 canopy cover maps for two Southern US sites (a); SHNF (b) and SDFEC (c).
Remotesensing 15 01548 g007
Table 1. Data used to determine a framework for producing a 30 m canopy cover product with ICESat-2.
DatasetParameterDescriptionReferences
ATL08Canopy and terrain parametersGenerated from ICESat-2′s geolocated photon data acquired by the ATLAS instrument. Canopy cover was computed from ATL08 parameters [27].[18]
NLCDLand cover and canopy coverSpatially consistent information generated across the conterminous US by a group of US federal agencies, called the Multi-Resolution Land Characteristics Consortium. The most recent 30 m NLCD products were used in this study.[28]
USGS 3D Elevation ProgramAirborne lidar canopy coverThe goal of 3DEP is to a nationwide coverage of high-resolution elevation data. Reference canopy cover was computed using discrete return point clouds from 3DEP.[29]
LandsatReflectance bands and Normalized Difference Vegetation IndexA gap-free Landsat 30 m reflectance product for six (6) Landsat spectral bands and NDVI derived from the red and near-infrared reflectance bands were used as mapped predictors.[30]
Disclaimer/Publisher’s Note: The statements, opinions and data contained in all publications are solely those of the individual author(s) and contributor(s) and not of MDPI and/or the editor(s). MDPI and/or the editor(s) disclaim responsibility for any injury to people or property resulting from any ideas, methods, instructions or products referred to in the content.

