

Persistent Scatterer Interferometry (PSI) Technique for the Identification and Monitoring of Critical Landslide Areas in a Regional and Mountainous Road Network


Abstract
:1. Introduction
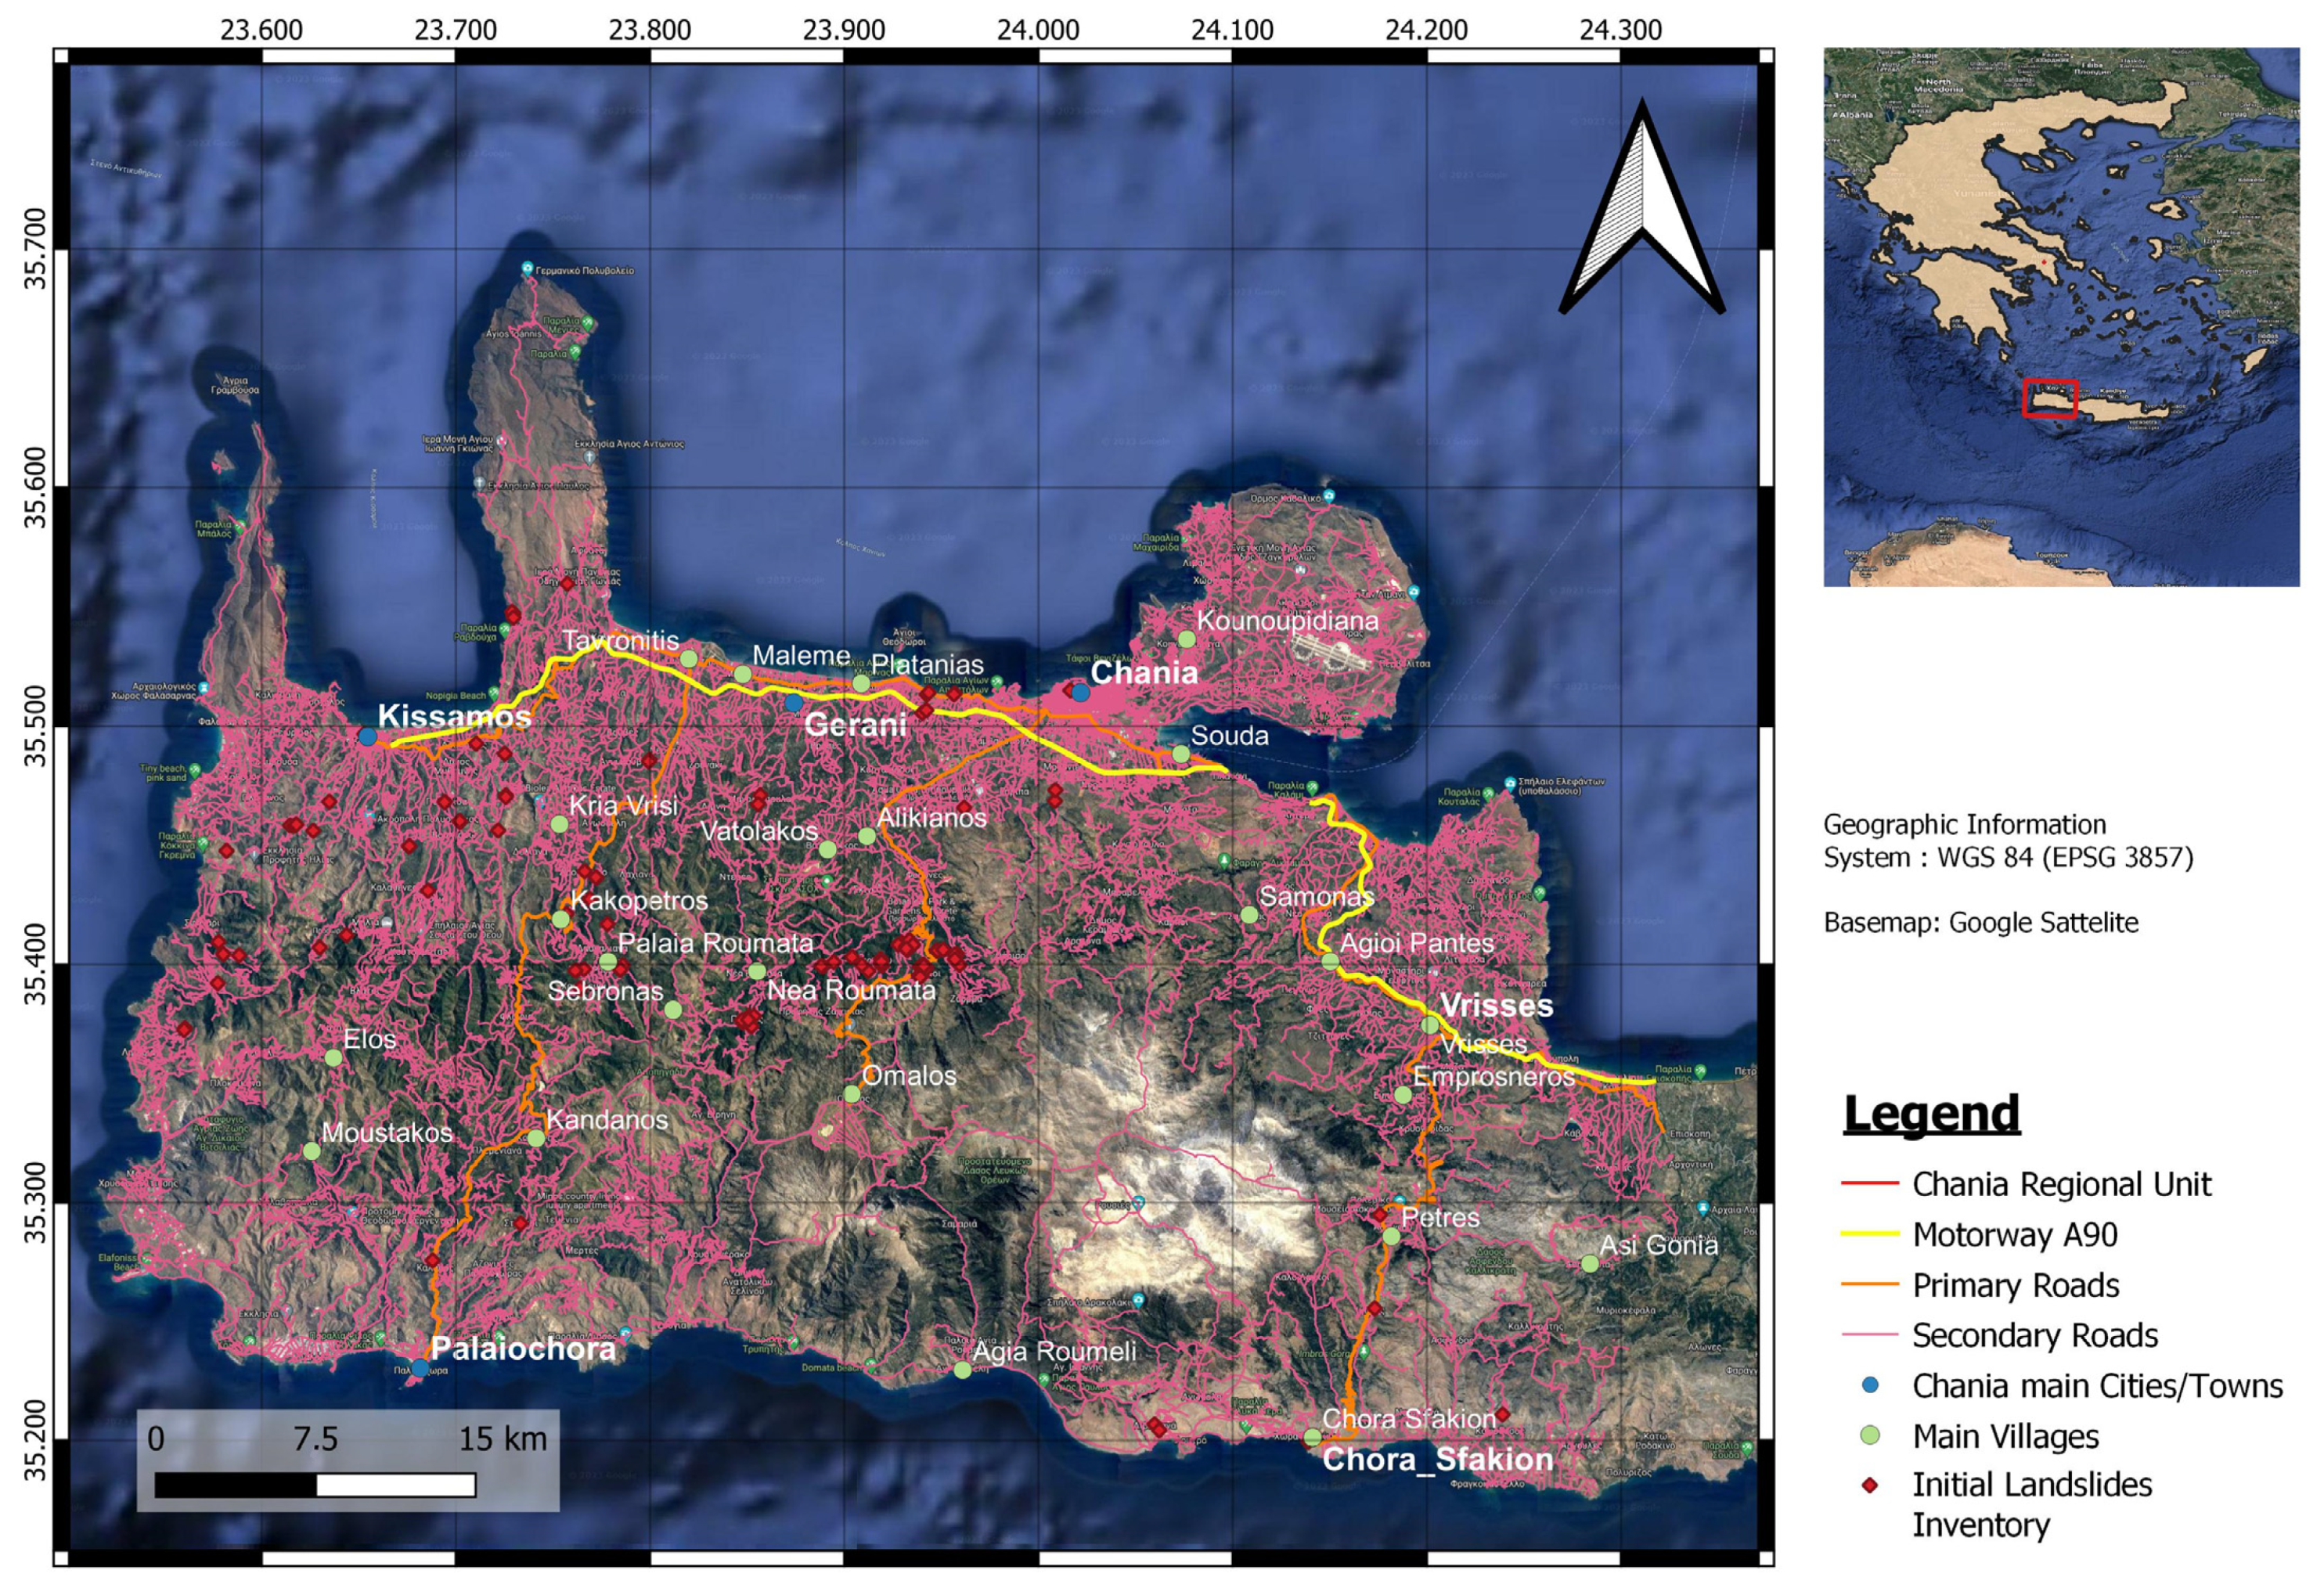
2. Study Area
3. Data and Methods
3.1. Data
3.1.1. Sentinel Data
3.1.2. Landslide Inventory Data
3.1.3. Visual Data
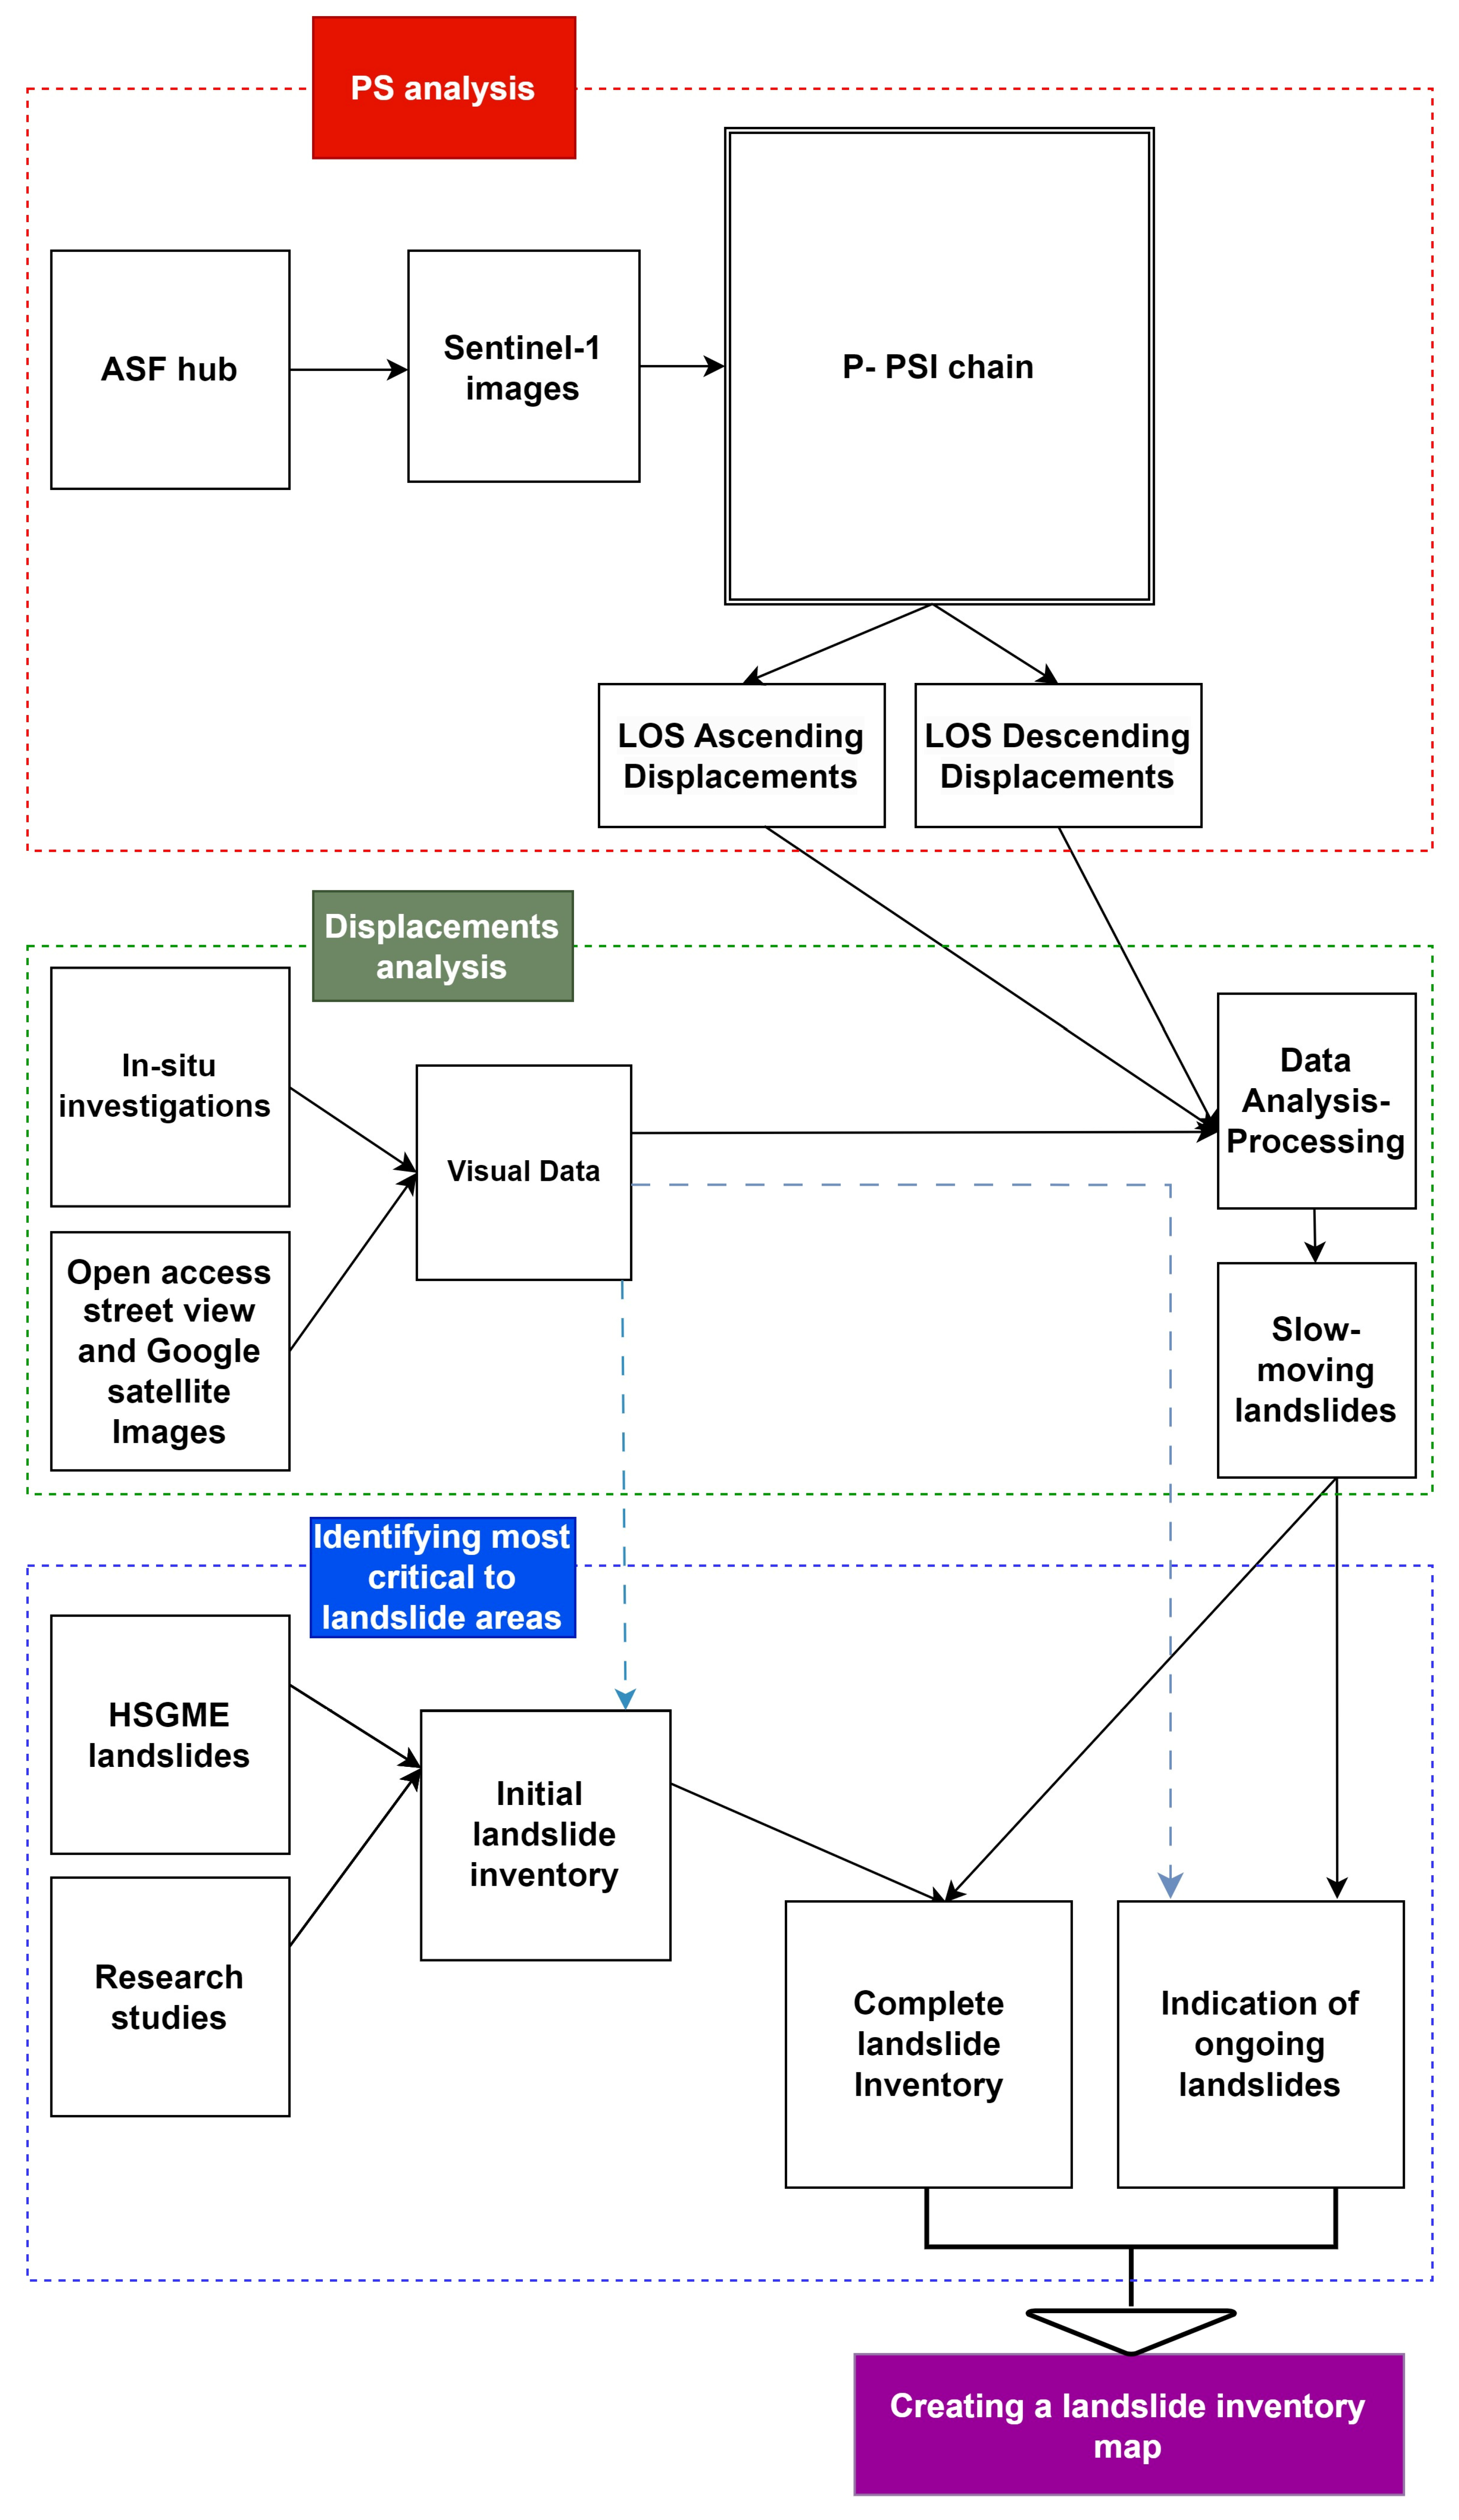
3.2. Methodology
3.2.1. Persistent Scatterers (PS) Analysis
3.2.2. Displacements Analysis
3.2.3. Identifying Areas Most Critical to Landslide
3.2.4. Landslide Inventory Map (LIM)
4. Results and Discussion
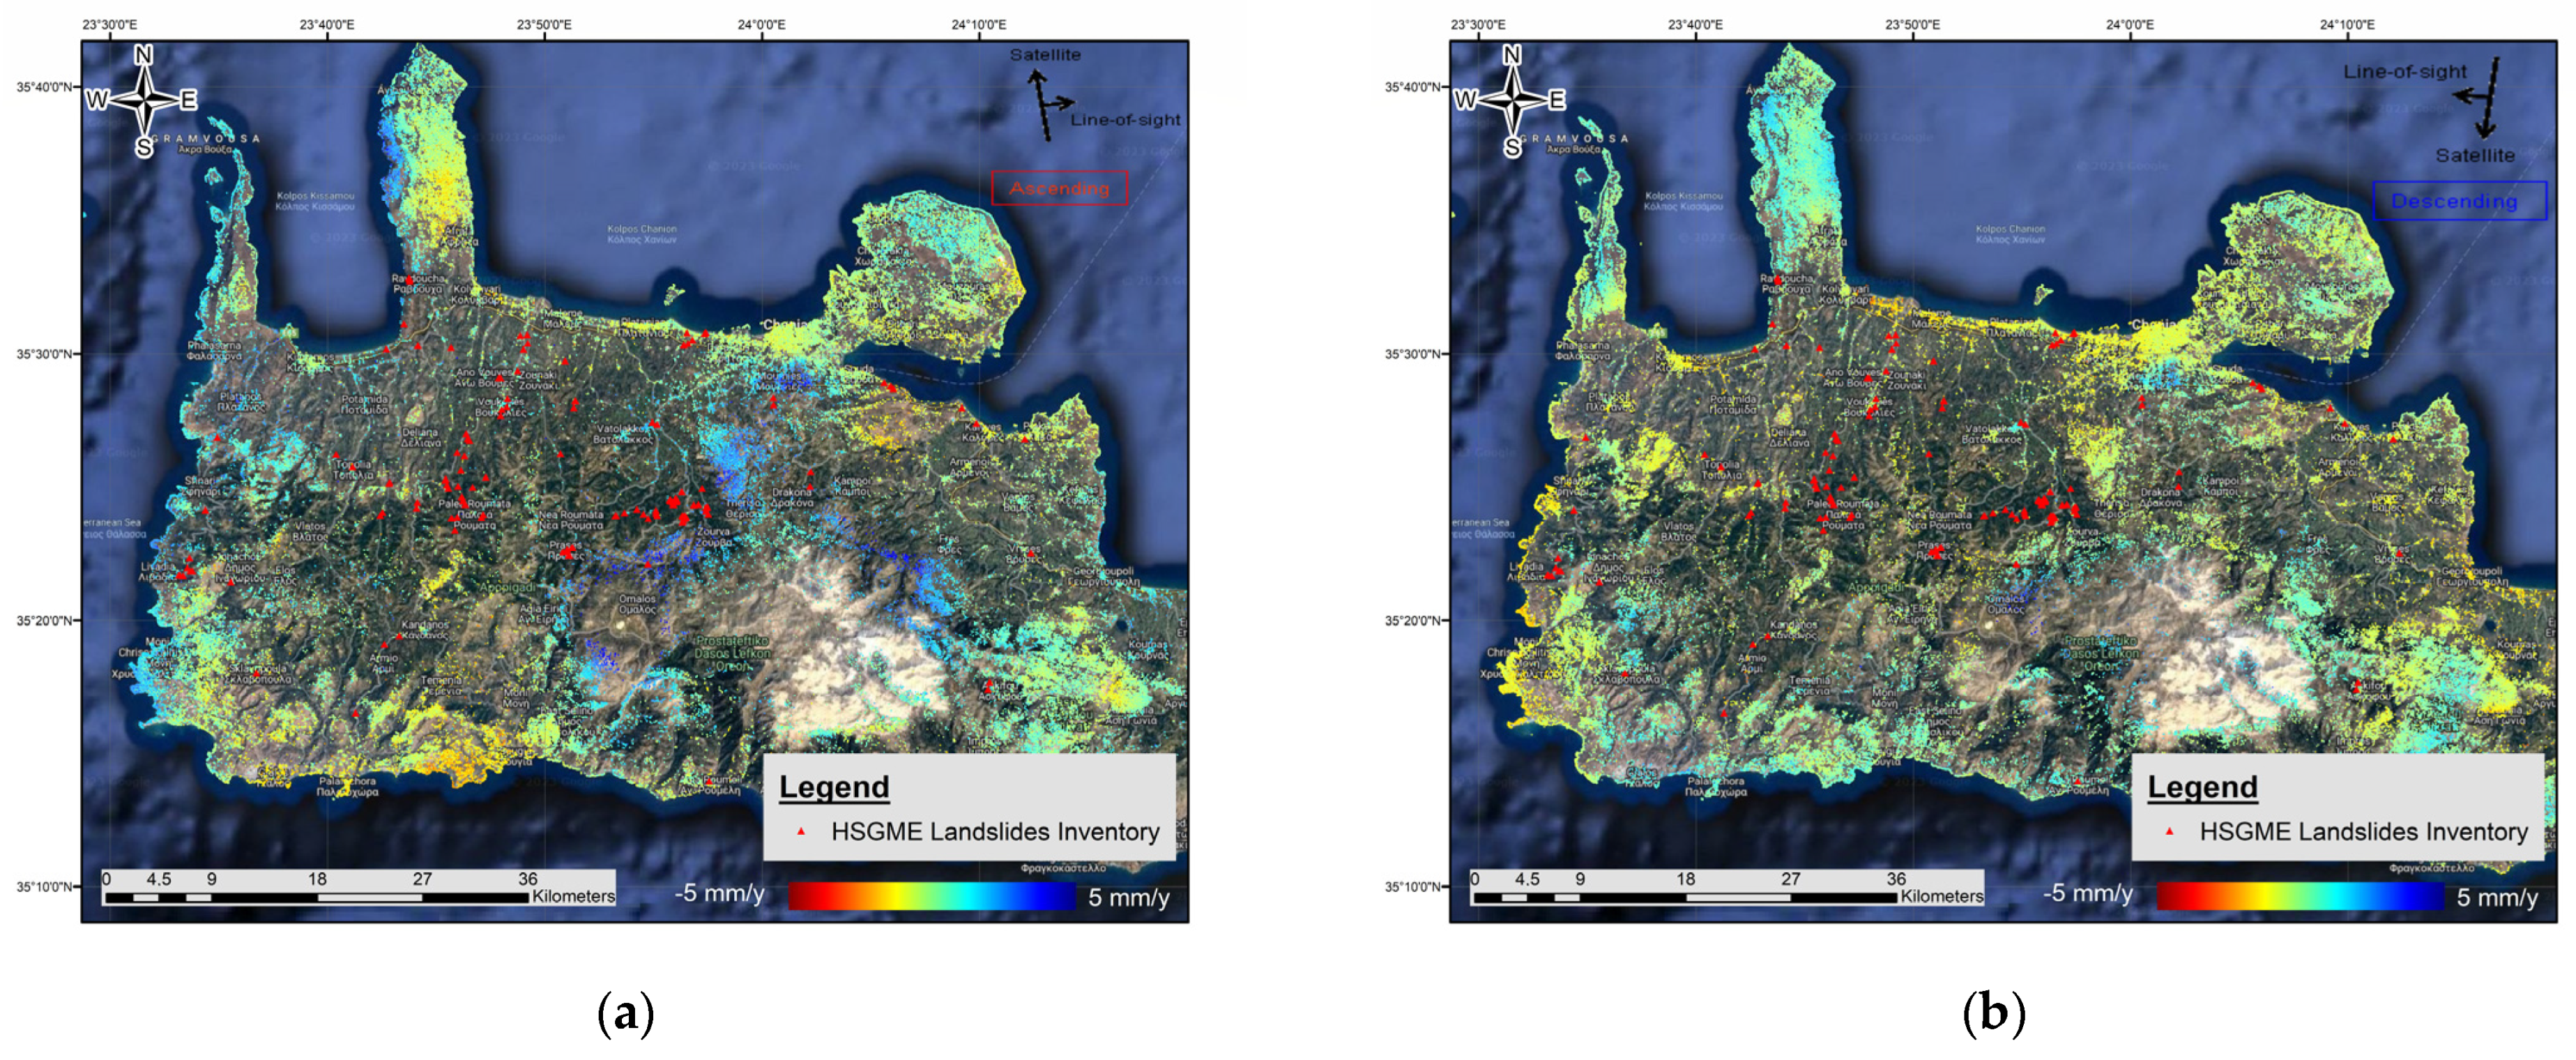
4.1. Implementing the P-PSI Chain
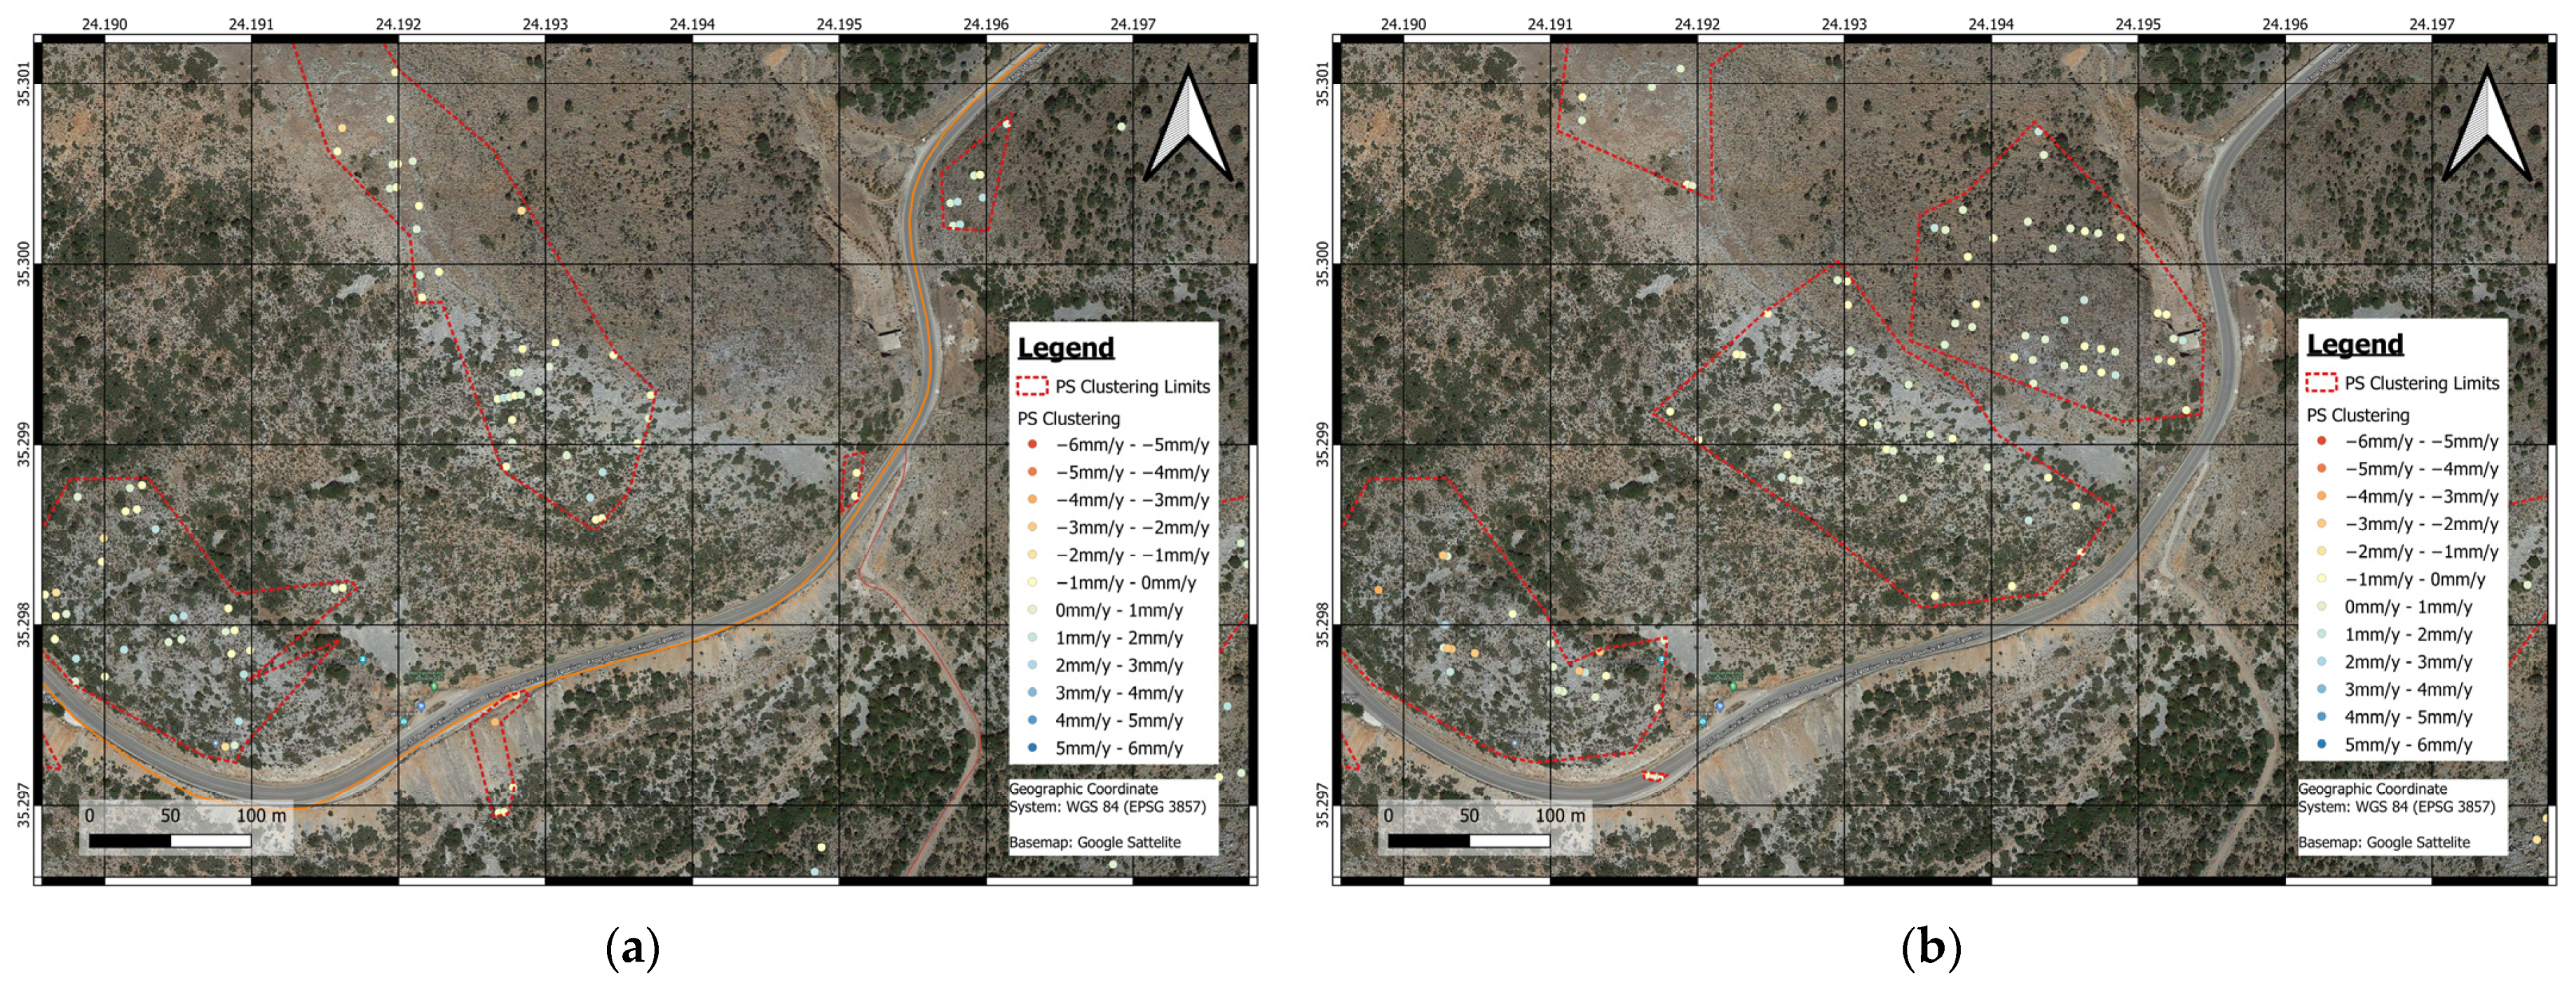
4.2. Identifying Landslides
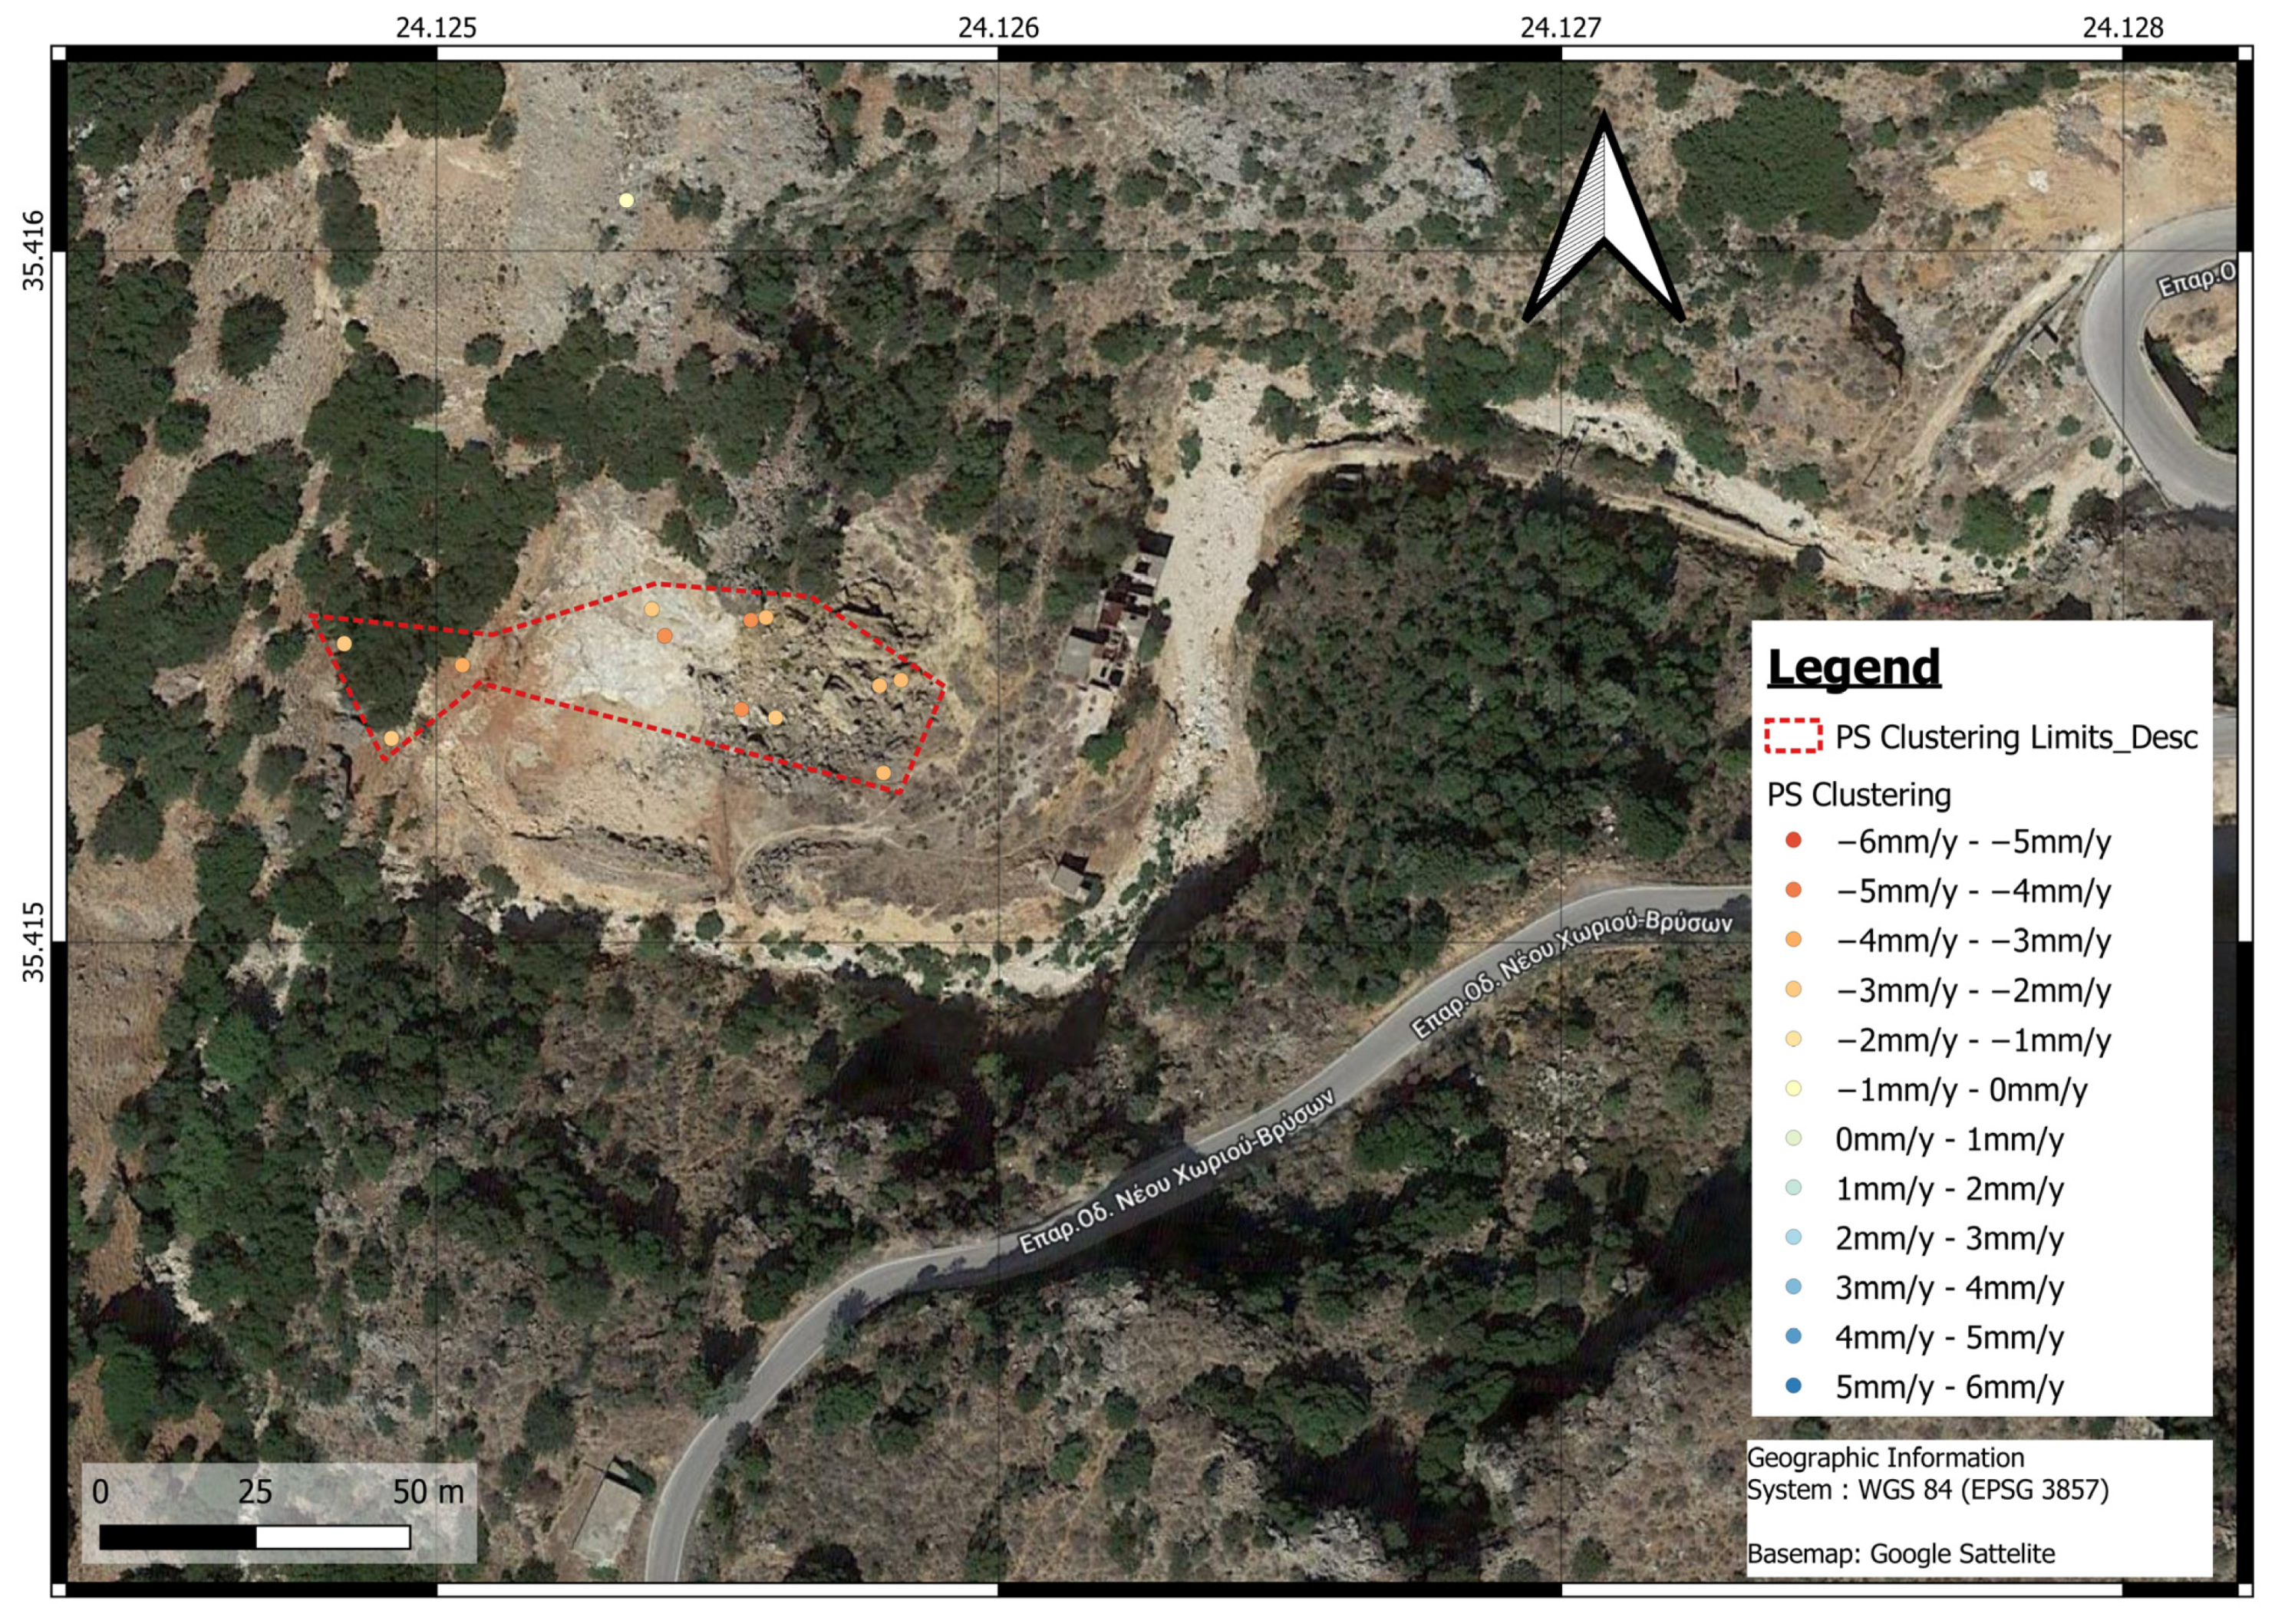
- the buffer tool to create linear surfaces in 50 m, 30 m, and 20 m at each side of the motorway’s, the primary roads’, and the secondary roads’ central line markings, respectively,
- select by location to include only the PSs that intersect with these surfaces, and
- select by expression to exclude the PS movements with a velocity smaller than the threshold of −2 mm per year.
4.3. Creating the Landslide Inventory Map
- Kissamos to Tavronitis (near Nopigia village),
- Platanias to Chania (near Stalos and Kato Galatas villages), and
- Souda to Agioi Pantes (near Platani, Megala Chorafia, Kalami, and Kalives villages).
- apply preventive measures for stabilizing the slope on that particular section of the road network, or, if this is not feasible.
- prevent citizens from using it and identify safer alternative routes in the existing road network.
5. Conclusions
Supplementary Materials
Author Contributions
Funding
Data Availability Statement
Acknowledgments
Conflicts of Interest
References
- Engström, R. The Roads’ Role in the Freight Transport System. Transp. Res. Procedia 2016, 14, 1443–1452. [Google Scholar] [CrossRef] [Green Version]
- Nikolaeva, R.V. Road Safety as a Factor in the Socio-Economic Development of the Country. IOP Conf. Ser. Mater. Sci. Eng. 2020, 786, 012070. [Google Scholar] [CrossRef]
- Ivanová, E.; Masárová, J. Importance of road infrastructure in the economic development and competitiveness. Econ. Manag. 2013, 18, 263–274. [Google Scholar] [CrossRef]
- Kongolo, M. Perceived Role of Rural Roads in Supporting and Enhancing Rural and Agricultural Development in Mwanza Region, Tanzania. Issues Soc. Sci. 2020, 8, 31. [Google Scholar] [CrossRef]
- McKinnon, A. Life without trucks: The impact of a temporary disruption of road freight transport on a national economy. J. Bus. Logist. 2006, 27, 227–250. [Google Scholar] [CrossRef]
- Psarianos, B.; Stamatiadis, N. Speed Management in Rural Roads in Greece. J. Civ. Eng. Archit. 2012, 6, 1083. [Google Scholar] [CrossRef] [Green Version]
- Valkaniotis, S.; Papathanassiou, G.; Marinos, V.; Saroglou, C.; Zekkos, D.; Kallimogiannis, V.; Karantanellis, E.; Farmakis, I.; Zalachoris, G.; Manousakis, J.; et al. Landslides Triggered by Medicane Ianos in Greece, September 2020: Rapid Satellite Mapping and Field Survey. Appl. Sci. 2022, 12, 12443. [Google Scholar] [CrossRef]
- Malamud, B.D.; Turcotte, D.L.; Guzzetti, F.; Reichenbach, P. Landslide Inventories and Their Statistical Properties. Earth Surf. Process Landf. 2004, 29, 687–711. [Google Scholar] [CrossRef]
- Samia, J.; Temme, A.; Bregt, A.K.; Wallinga, J.; Stuiver, J.; Guzzetti, F.; Ardizzone, F.; Rossi, M. Implementing Landslide Path Dependency in Landslide Susceptibility Modelling. Landslides 2018, 15, 2129–2144. [Google Scholar] [CrossRef] [Green Version]
- Nefros, C.; Loupasakis, C. Introducing a Geospatial Database and GIS Techniques as a Decision-Making Tool for Multicriteria Decision Analysis Methods in Landslides Susceptibility Assessment. Bull. Geol. Soc. Greece 2022, 59, 68–103. [Google Scholar] [CrossRef]
- van Westen, C.J.; van Asch, T.W.J.; Soeters, R. Landslide Hazard and Risk Zonation—Why Is It Still so Difficult? Bull. Eng. Geol. Environ. 2006, 65, 167–184. [Google Scholar] [CrossRef]
- Aslan, G.; Foumelis, M.; Raucoules, D.; de Michele, M.; Bernardie, S.; Cakir, Z. Landslide Mapping and Monitoring Using Persistent Scatterer Interferometry (PSI) Technique in the French Alps. Remote Sens. 2020, 12, 1305. [Google Scholar] [CrossRef] [Green Version]
- Crosetto, M.; Monserrat, O.; Cuevas-González, M.; Devanthéry, N.; Crippa, B. Persistent Scatterer Interferometry: A Review. ISPRS J. Photogramm. Remote Sens. 2016, 115, 78–89. [Google Scholar] [CrossRef] [Green Version]
- Nikos, S.; Ioannis, P.; Constantinos, L.; Paraskevas, T.; Anastasia, K.; Charalambos (Haris), K. Land Subsidence Rebound Detected via Multi-Temporal InSAR and Ground Truth Data in Kalochori and Sindos Regions, Northern Greece. Eng. Geol. 2016, 209, 175–186. [Google Scholar] [CrossRef]
- Papoutsis, I.; Kontoes, C.; Paradissis, D. Multi-Stack Persistent Scatterer Interferometry Analysis in Wider Athens, Greece. Remote Sens. 2017, 9, 276. [Google Scholar] [CrossRef] [Green Version]
- Pasquali, P.; Cantone, A.; Riccardi, P.; Defilippi, M.; Ogushi, F.; Gagliano, S.; Tamura, M. Mapping of Ground Deformations with Interferometric Stacking Techniques. In Land Applications of Radar Remote Sensing; InTech: London, UK, 2014. [Google Scholar]
- D’Aranno, P.J.V.; di Benedetto, A.; Fiani, M.; Marsella, M.; Moriero, I.; Palenzuela Baena, J.A. An Application of Persistent Scatterer Interferometry (PSI) Technique for Infrastructure Monitoring. Remote Sens. 2021, 13, 1052. [Google Scholar] [CrossRef]
- Ferretti, A.; Prati, C.; Rocca, F. Permanent Scatterers in SAR Interferometry. IEEE Trans. Geosci. Remote Sens. 2001, 39, 8–20. [Google Scholar] [CrossRef]
- Nettis, A.; Massimi, V.; Nutricato, R.; Nitti, D.O.; Samarelli, S.; Uva, G. Satellite-Based Interferometry for Monitoring Structural Deformations of Bridge Portfolios. Autom. Constr. 2023, 147, 104707. [Google Scholar] [CrossRef]
- Macchiarulo, V.; Milillo, P.; Blenkinsopp, C.; Giardina, G. Monitoring Deformations of Infrastructure Networks: A Fully Automated GIS Integration and Analysis of InSAR Time-Series. Struct. Health Monit. 2022, 21, 1849–1878. [Google Scholar] [CrossRef]
- Papoutsis, I.; Kontoes, C.; Alatza, S.; Apostolakis, A.; Loupasakis, C. InSAR Greece with Parallelized Persistent Scatterer Interferometry: A National Ground Motion Service for Big Copernicus Sentinel-1 Data. Remote Sens. 2020, 12, 3207. [Google Scholar] [CrossRef]
- Nefros, C.; Tsagkas, D.S.; Kitsara, G.; Loupasakis, C.; Giannakopoulos, C. Landslide Susceptibility Mapping under the Climate Change Impact in the Chania Regional Unit, West Crete, Greece. Land 2023, 12, 154. [Google Scholar] [CrossRef]
- Showstack, R. Sentinel Satellites Initiate New Era in Earth Observation. Eos Trans. Am. Geophys. Union 2014, 95, 239–240. [Google Scholar] [CrossRef]
- Attema, E.; Snoeij, P.; Davidson, M.; Floury, N.; Levrini, G.; Rommen, B.; Rosich, B. The European GMES Sentinel-1 Radar Mission. In Proceedings of the IGARSS 2008—2008 IEEE International Geoscience and Remote Sensing Symposium, Boston, MA, USA, 6–11 July 2008; IEEE: Piscataway, NJ, USA, 2008; pp. I–94–I–97. [Google Scholar]
- Festa, D.; Bonano, M.; Casagli, N.; Confuorto, P.; de Luca, C.; del Soldato, M.; Lanari, R.; Lu, P.; Manunta, M.; Manzo, M.; et al. Nation-Wide Mapping and Classification of Ground Deformation Phenomena through the Spatial Clustering of P-SBAS InSAR Measurements: Italy Case Study. ISPRS J. Photogramm. Remote Sens. 2022, 189, 1–22. [Google Scholar] [CrossRef]
- Psomiadis, E.; Papazachariou, A.; Soulis, K.; Alexiou, D.-S.; Charalampopoulos, I. Landslide Mapping and Susceptibility Assessment Using Geospatial Analysis and Earth Observation Data. Land 2020, 9, 133. [Google Scholar] [CrossRef]
- Papadopoulos, G.A.; Karastathis, V.; Kontoes, C.; Charalampakis, M.; Fokaefs, A.; Papoutsis, I. Crustal Deformation Associated with East Mediterranean Strike–Slip Earthquakes: The 8 June 2008 Movri (NW Peloponnese), Greece, Earthquake (Mw6.4). Tectonophysics 2010, 492, 201–212. [Google Scholar] [CrossRef]
- Kontoes, C.; Loupasakis, C.; Papoutsis, I.; Alatza, S.; Poyiadji, E.; Ganas, A.; Psychogyiou, C.; Kaskara, M.; Antoniadi, S.; Spanou, N. Landslide Susceptibility Mapping of Central and Western Greece, Combining NGI and WoE Methods, with Remote Sensing and Ground Truth Data. Land 2021, 10, 402. [Google Scholar] [CrossRef]
- Conforti, M.; Muto, F.; Rago, V.; Critelli, S. Landslide Inventory Map of North-Eastern Calabria (South Italy). J. Maps 2014, 10, 90–102. [Google Scholar] [CrossRef]
- Hooper, A.; Segall, P.; Zebker, H. Persistent Scatterer Interferometric Synthetic Aperture Radar for Crustal Deformation Analysis, with Application to Volcán Alcedo, Galápagos. J. Geophys. Res. 2007, 112, B07407. [Google Scholar] [CrossRef] [Green Version]
- Wang, T.; Zhang, H.; Yang, L.; Dempster, A.G.; Su, C.; Li, K. Landslide Monitoring System Based on Spread-Spectrum Continuous Wave Radar. In Proceedings of the 2013 IEEE International Geoscience and Remote Sensing Symposium—IGARSS, Melbourne, Australia, 21–26 July 2013; IEEE: Piscataway, NJ, USA, 2013; pp. 4546–4549. [Google Scholar]
- Alatza, S.; Papoutsis, I.; Paradissis, D.; Kontoes, C.; Papadopoulos, G.A. Multi-Temporal InSAR Analysis for Monitoring Ground Deformation in Amorgos Island, Greece. Sensors 2020, 20, 338. [Google Scholar] [CrossRef] [Green Version]
- Hu, Z.; Mallorquí, J.J. An Accurate Method to Correct Atmospheric Phase Delay for InSAR with the ERA5 Global Atmospheric Model. Remote Sens. 2019, 11, 1969. [Google Scholar] [CrossRef] [Green Version]
- Google (n.d.). [Google Earth Satellite View, Askifou Village]. Available online: https://www.shorturl.at/RTXZ1 (accessed on 27 January 2023).
- Traffic Interruption Due to Rockslides from Machairos to Ramni, Online News of Chania. 20 April 2022. Available online: https://www.haniotika-nea.gr/diakopi-kykloforias-logo-katolisthiseon-vrachon-apo-machairoys-eos-ramni/ (accessed on 31 December 2022).
- Google (n.d.). [Google Satellite View, Regional Road from Macheri to Ramni]. Available online: https://www.shorturl.at/DJNX2 (accessed on 31 December 2022).
- Google (n.d.). [Google Street View, Regional Road from Tavronitis to Paleochora, October 2014]. Available online: https://goo.gl/maps/cF76BSPmk4LHKQ9GA (accessed on 31 December 2022).
- Google (n.d.). [Google Street View, Regional Road from Tavronitis to Paleochora, May 2019]. Available online: https://goo.gl/maps/odC3V1YoBqAWMWQWA (accessed on 31 December 2022).
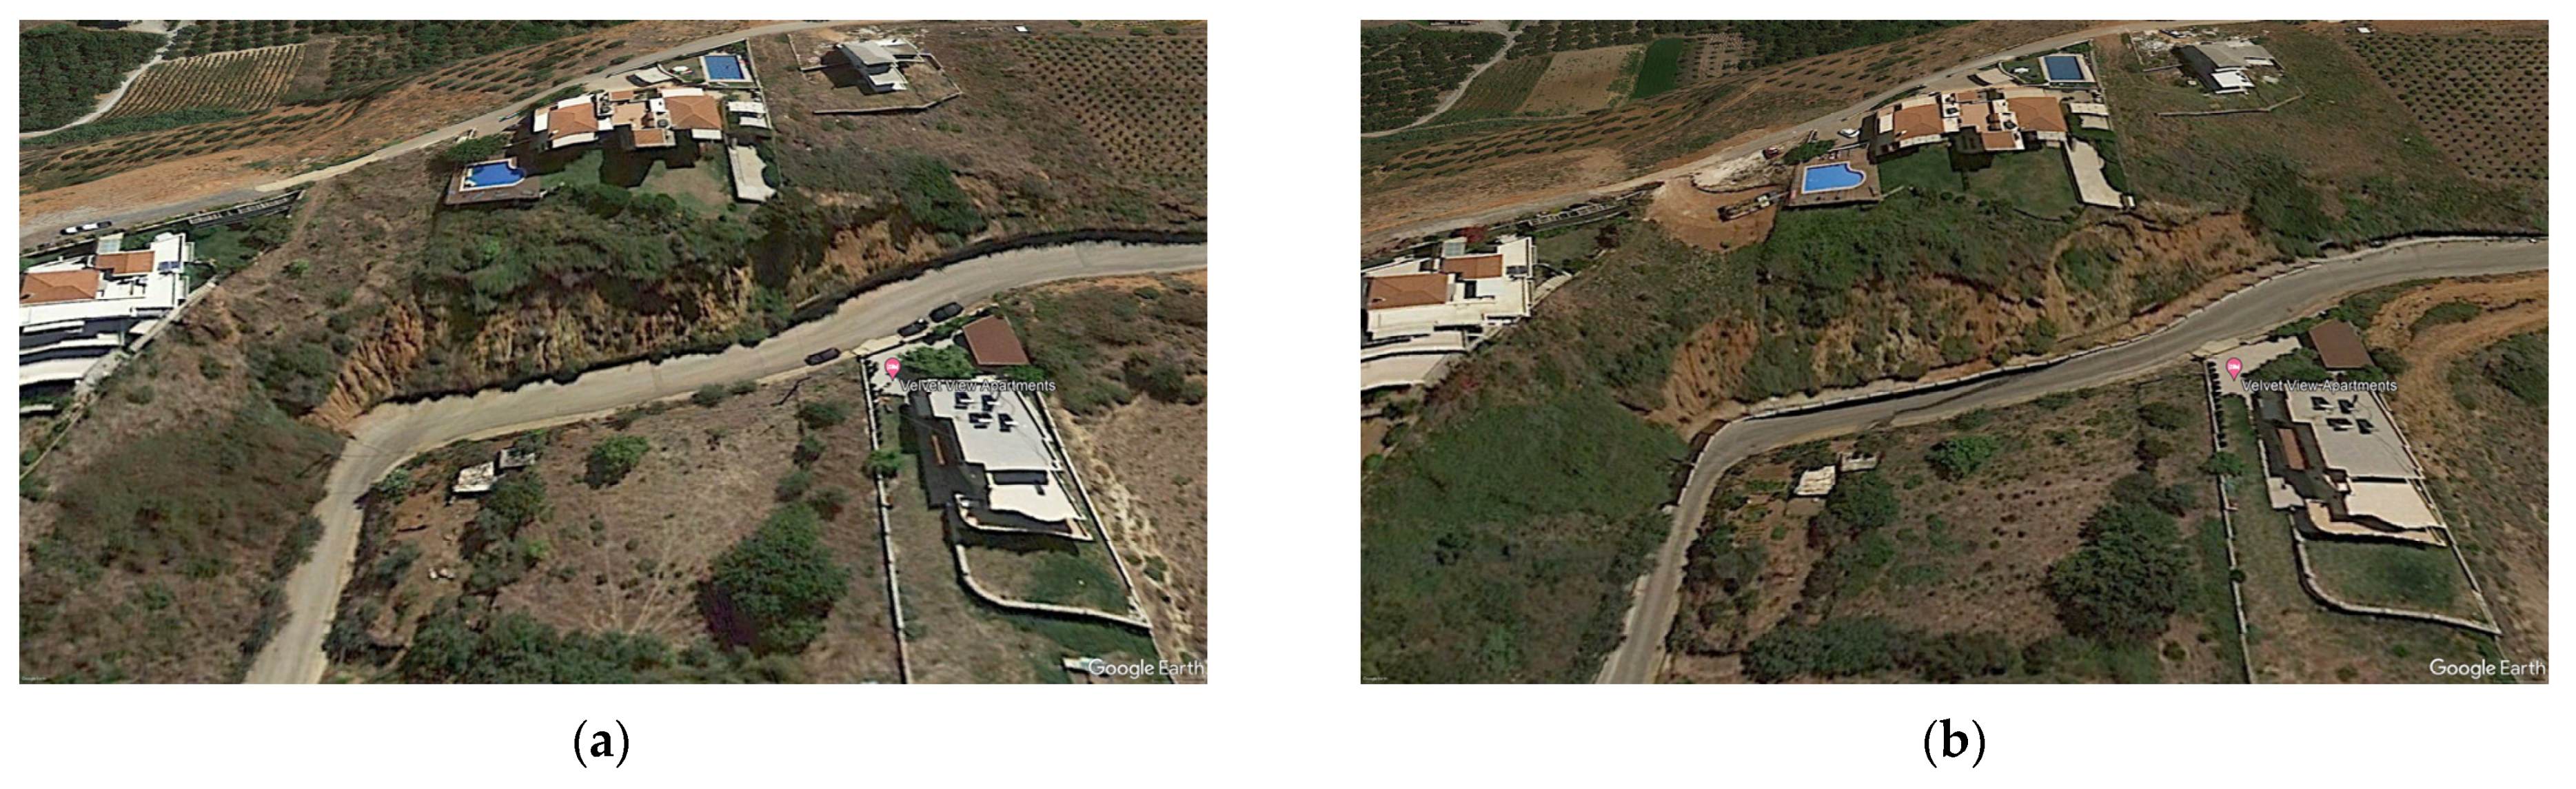
- Google (n.d.). [Google Earth Satellite View at Stalos Village Jun 2013]. Available online: https://shorturl.at/kwL34 (accessed on 31 December 2022).
- Google (n.d.). [Google Earth Satellite View at Stalos Village May 2022]. Available online: https://shorturl.at/ciBNO (accessed on 31 December 2022).
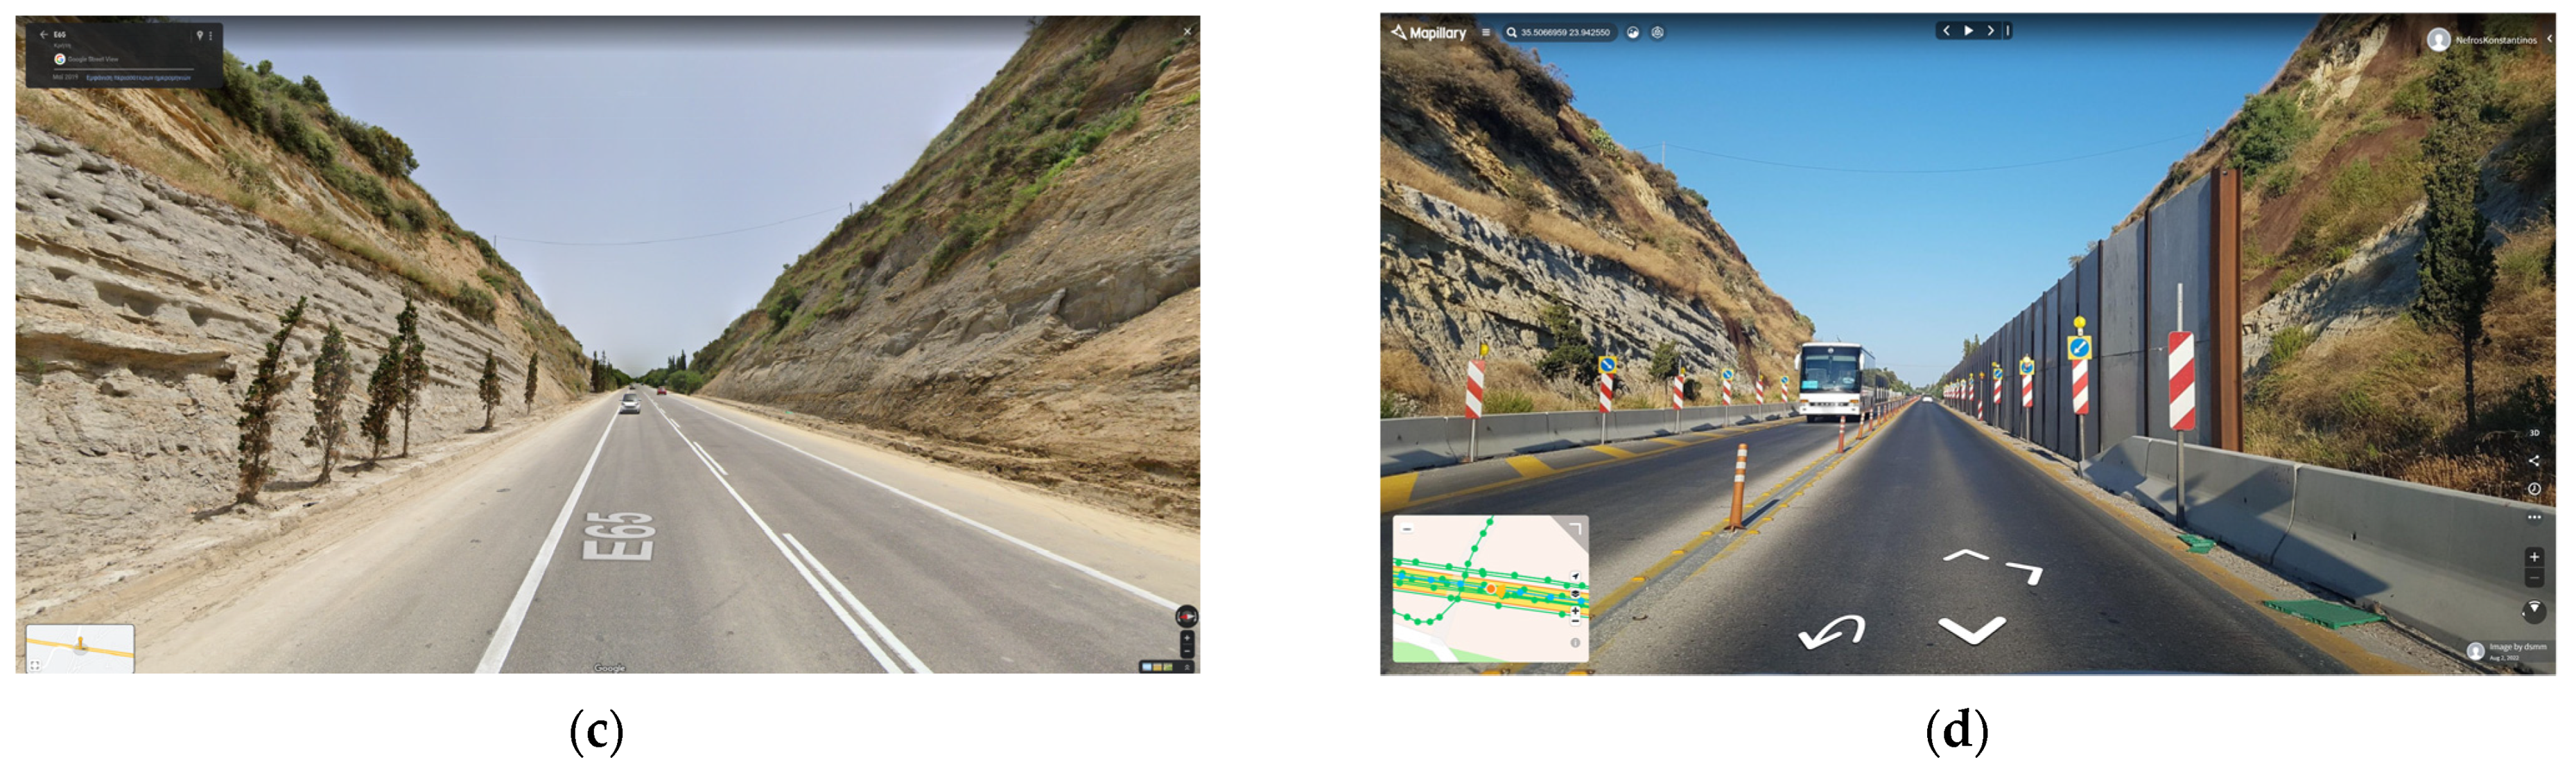
- Google (n.d.). [Google Street View, Motorway Outside Stalos Village, May 2019]. Available online: https://www.shorturl.at/GHZ17 (accessed on 31 December 2022).
- Mapillary (n.d.). [Mapillary Street View, Motorway Outside Stalos Village, Aug 2022]. Available online: https://rb.gy/ktzz0a (accessed on 31 December 2022).


| Orbit | Path | Frame | Examined Period | Number of Interferograms | Number of PS | |
|---|---|---|---|---|---|---|
| From | To | |||||
| Ascending | 102 | 113 | 19/9/2016 | 27/12/2020 | 98 | 291.234 |
| Descending | 109 | 473 | 8/10/2016 | 22/12/2020 | 90 | 382.017 |
Disclaimer/Publisher’s Note: The statements, opinions and data contained in all publications are solely those of the individual author(s) and contributor(s) and not of MDPI and/or the editor(s). MDPI and/or the editor(s) disclaim responsibility for any injury to people or property resulting from any ideas, methods, instructions or products referred to in the content. |
© 2023 by the authors. Licensee MDPI, Basel, Switzerland. This article is an open access article distributed under the terms and conditions of the Creative Commons Attribution (CC BY) license (https://creativecommons.org/licenses/by/4.0/).
Share and Cite
Nefros, C.; Alatza, S.; Loupasakis, C.; Kontoes, C. Persistent Scatterer Interferometry (PSI) Technique for the Identification and Monitoring of Critical Landslide Areas in a Regional and Mountainous Road Network. Remote Sens. 2023, 15, 1550. https://doi.org/10.3390/rs15061550
Nefros C, Alatza S, Loupasakis C, Kontoes C. Persistent Scatterer Interferometry (PSI) Technique for the Identification and Monitoring of Critical Landslide Areas in a Regional and Mountainous Road Network. Remote Sensing. 2023; 15(6):1550. https://doi.org/10.3390/rs15061550
Chicago/Turabian StyleNefros, Constantinos, Stavroula Alatza, Constantinos Loupasakis, and Charalampos Kontoes. 2023. "Persistent Scatterer Interferometry (PSI) Technique for the Identification and Monitoring of Critical Landslide Areas in a Regional and Mountainous Road Network" Remote Sensing 15, no. 6: 1550. https://doi.org/10.3390/rs15061550