
Climate Change and Anthropogenic Activity Co-Driven Vegetation Coverage Increase in the Three-North Shelter Forest Region of China
 , , , , and
Abstract
:1. Introduction
2. Materials and Methods
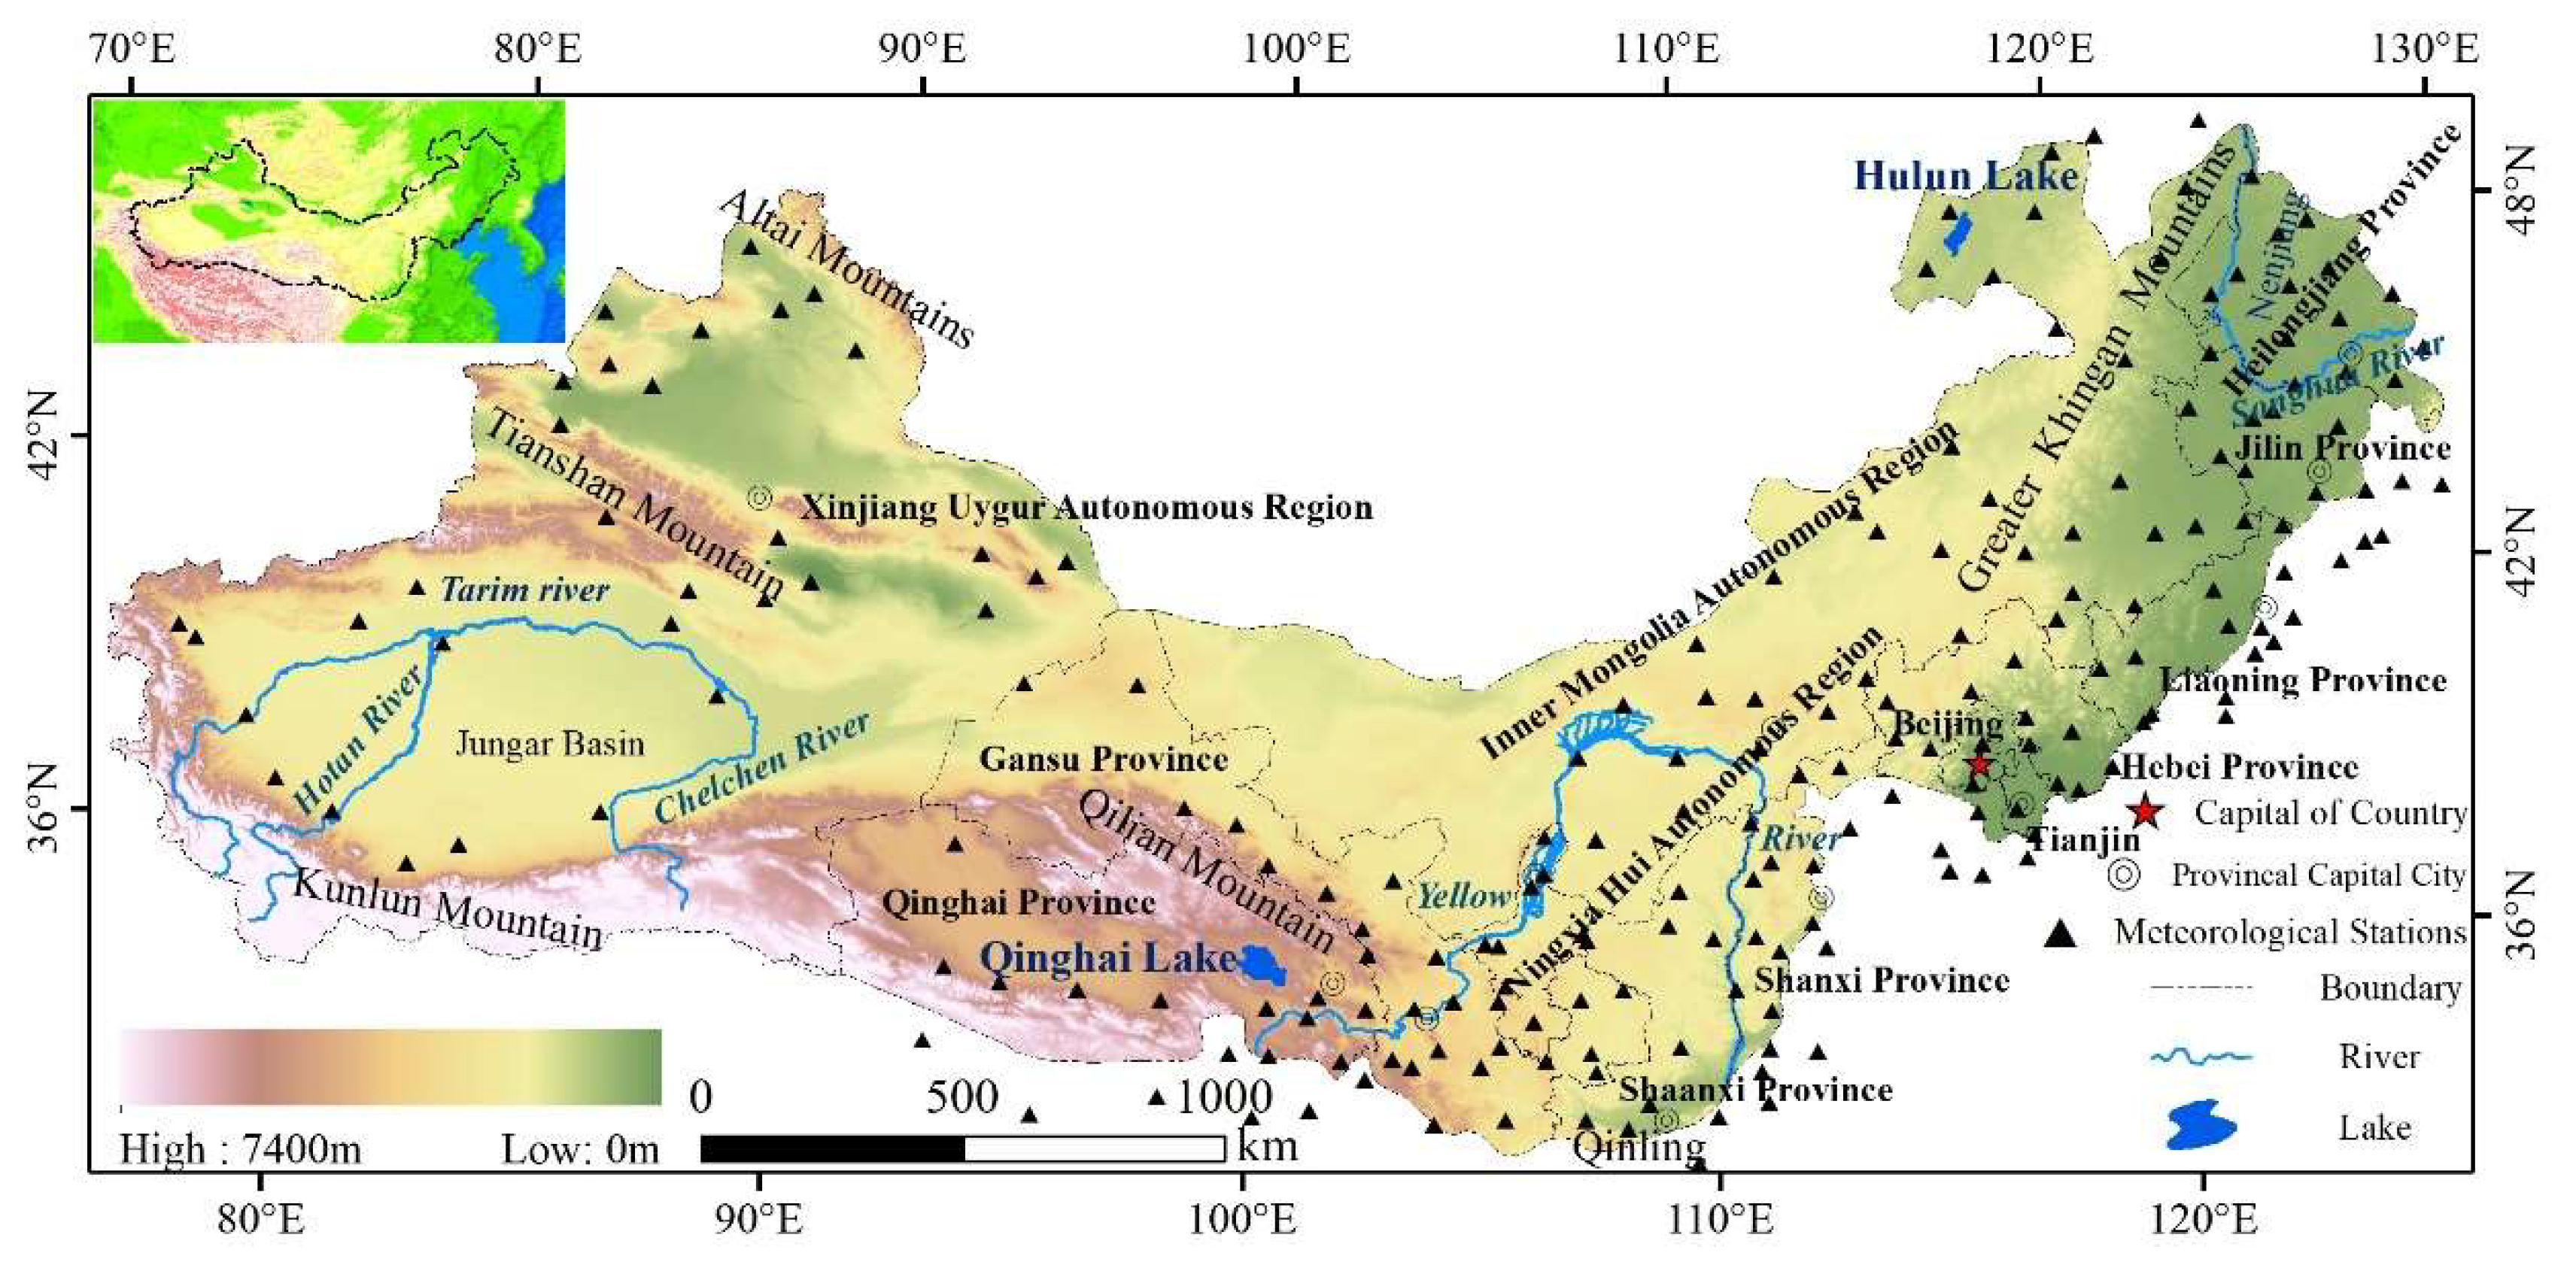
2.1. Study Area
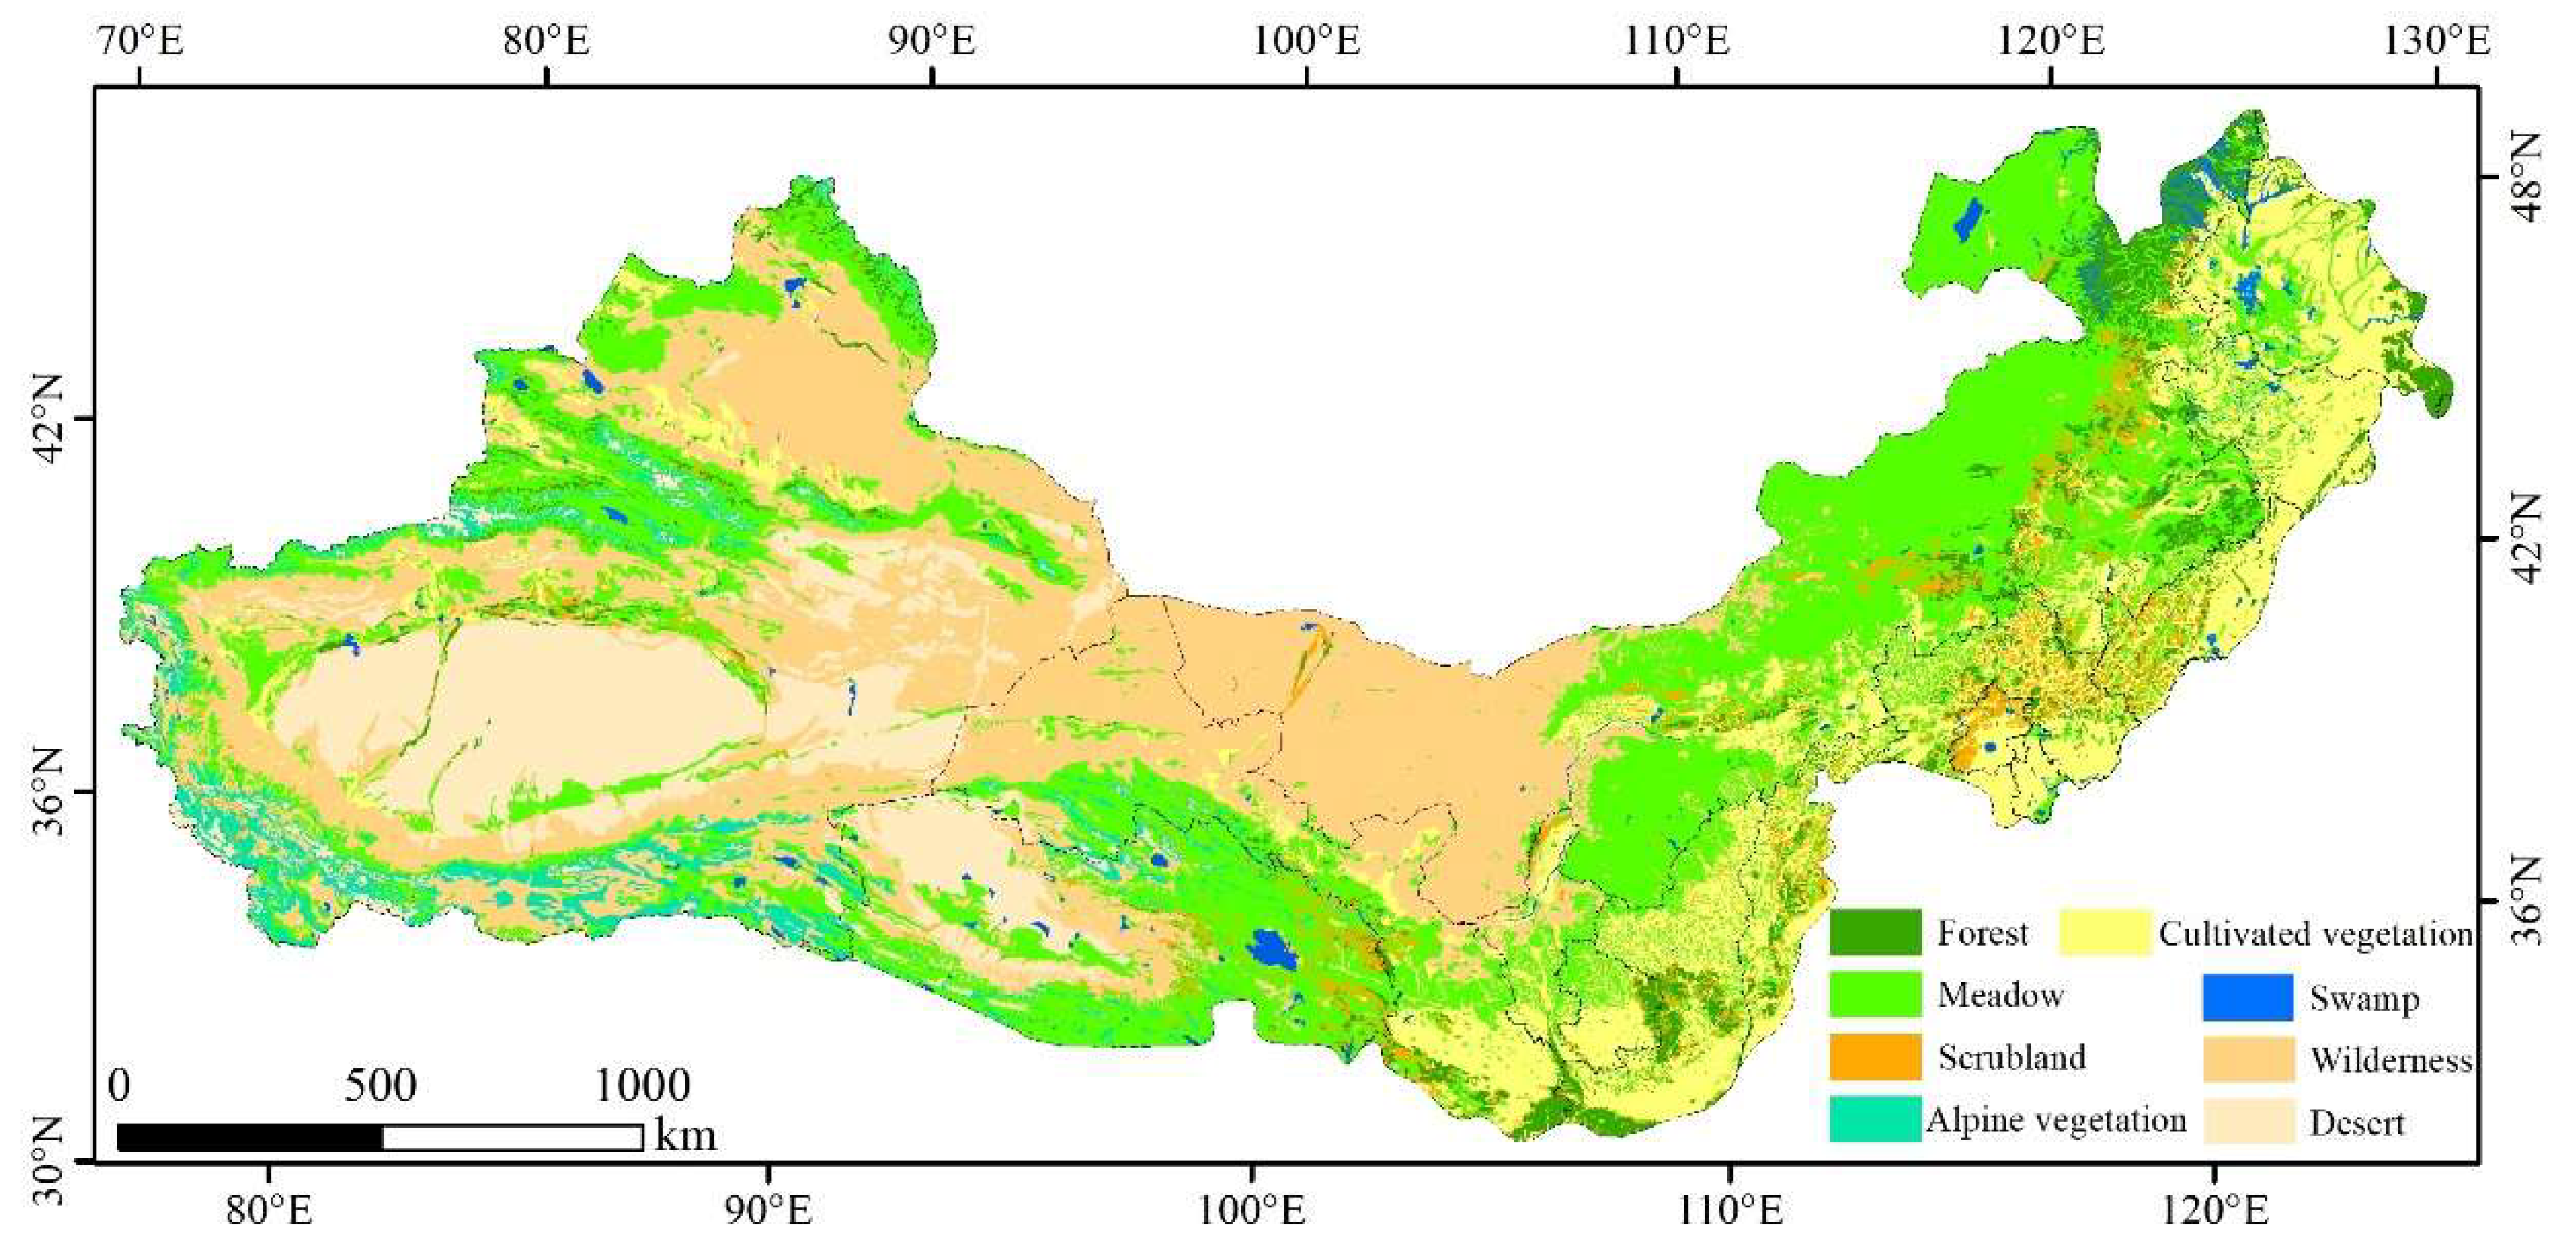
2.2. Data
2.3. Methods
2.3.1. Theil–Sen Trend Analysis and Mann–Kendall Statistical Test
2.3.2. Coefficient of Variation
2.3.3. Hurst Index
2.3.4. Correlation Analysis
2.3.5. Residual Analysis
3. Results
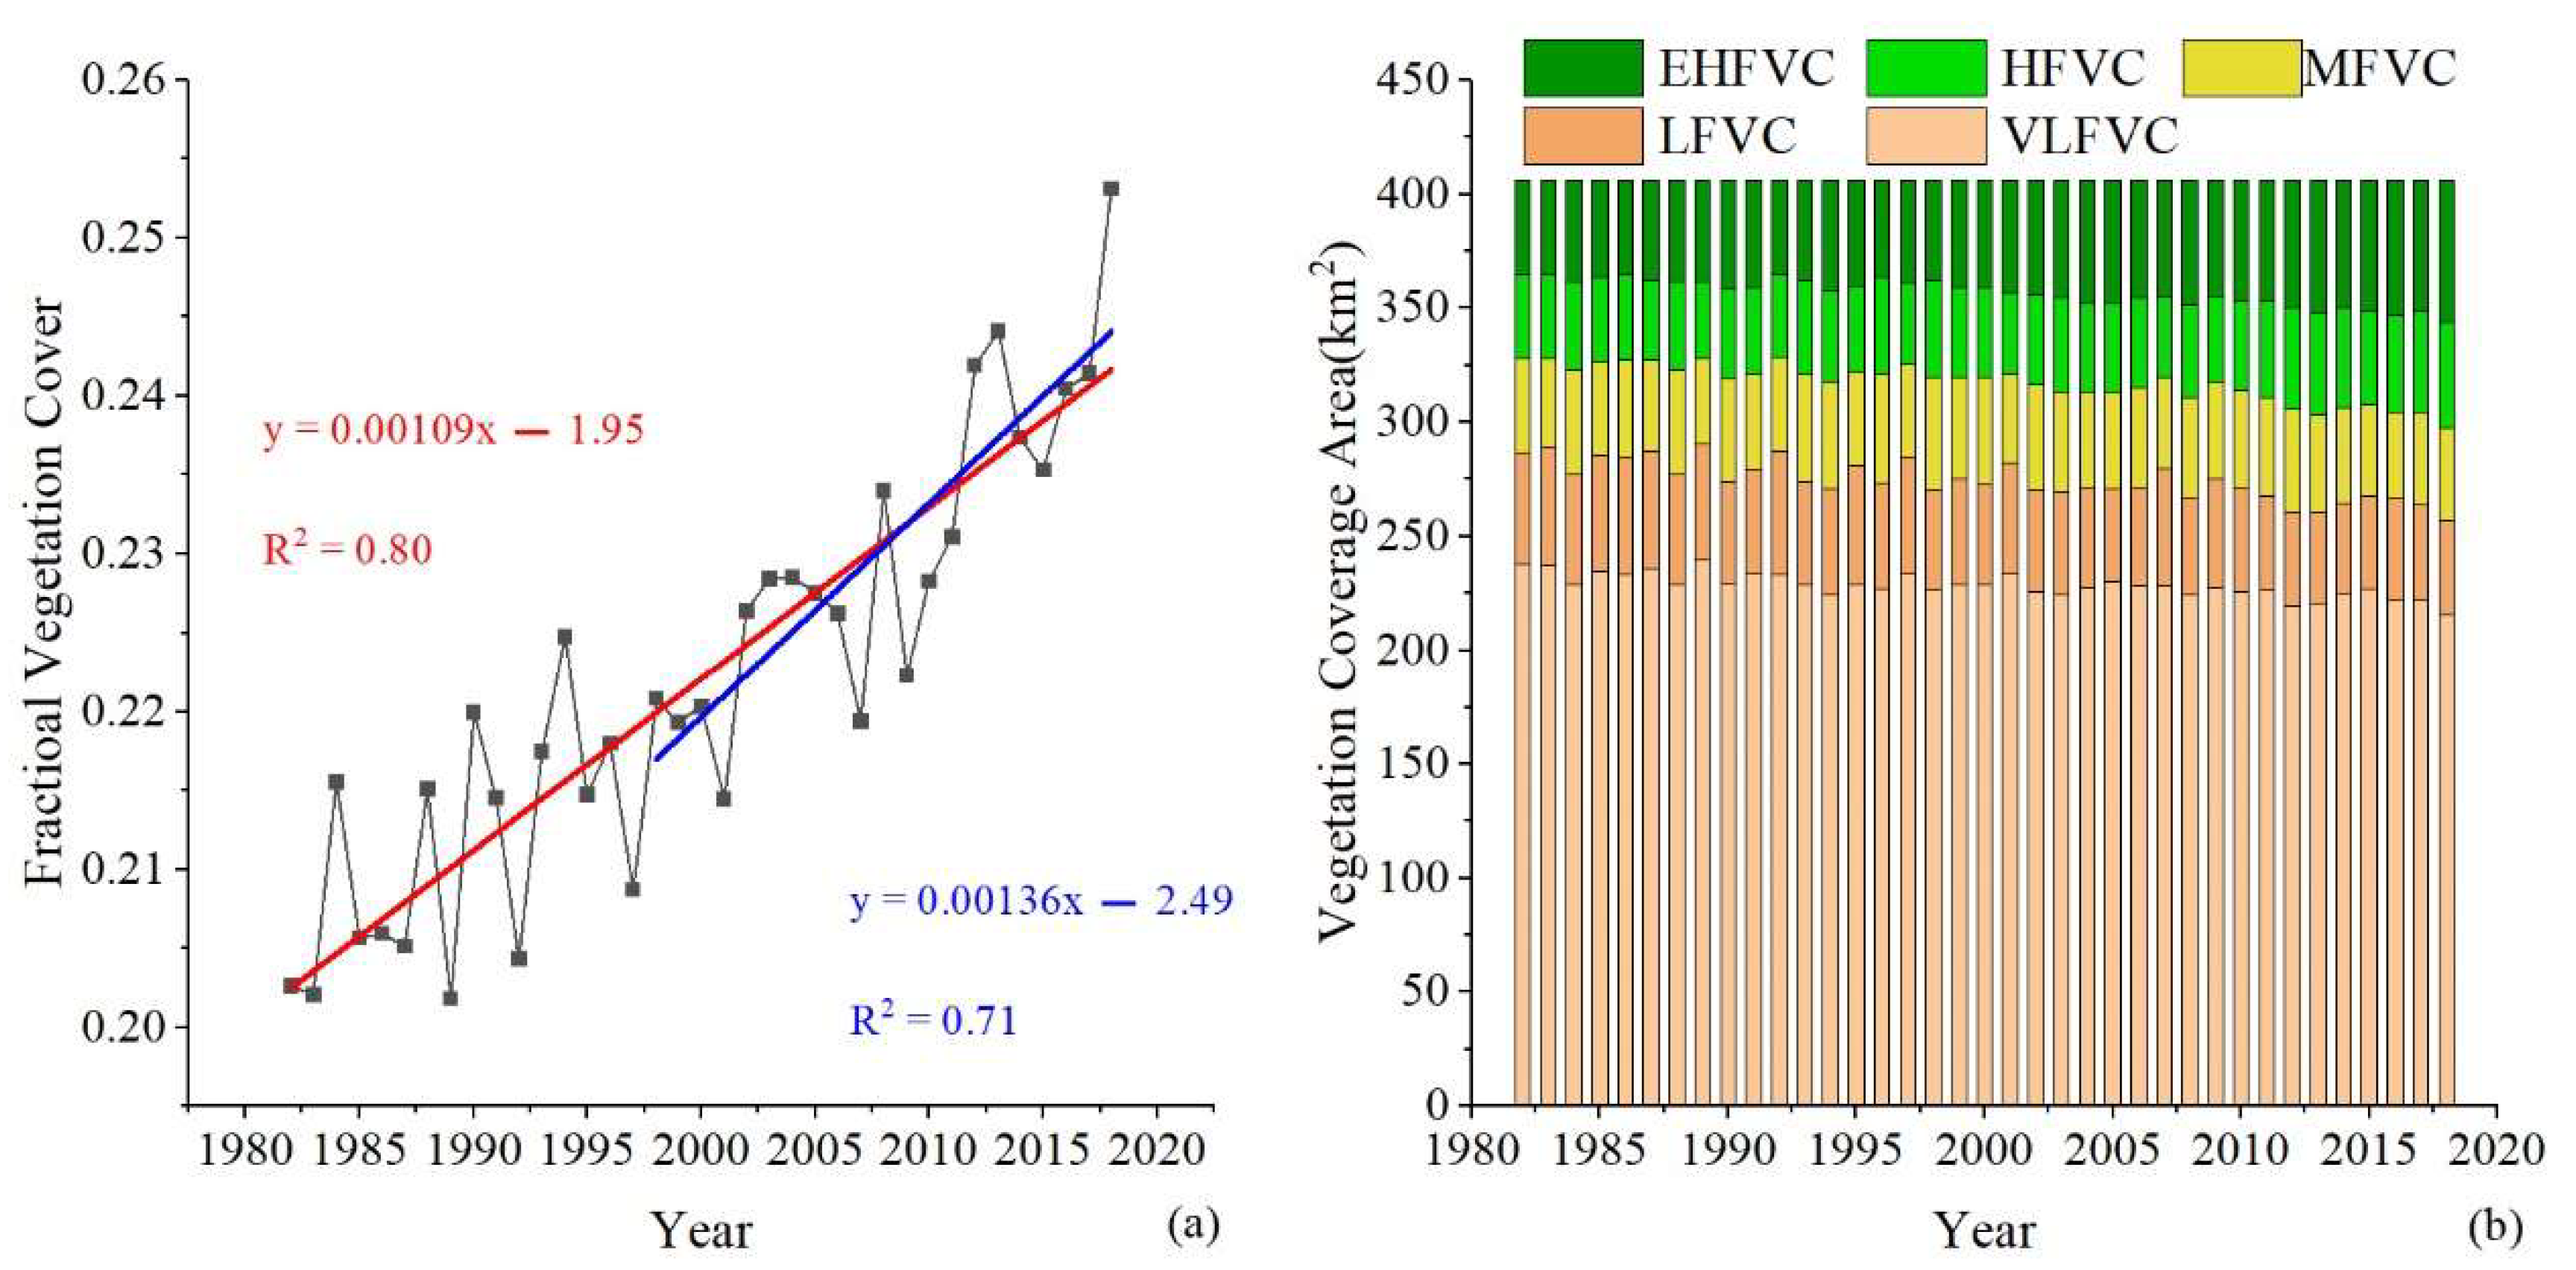
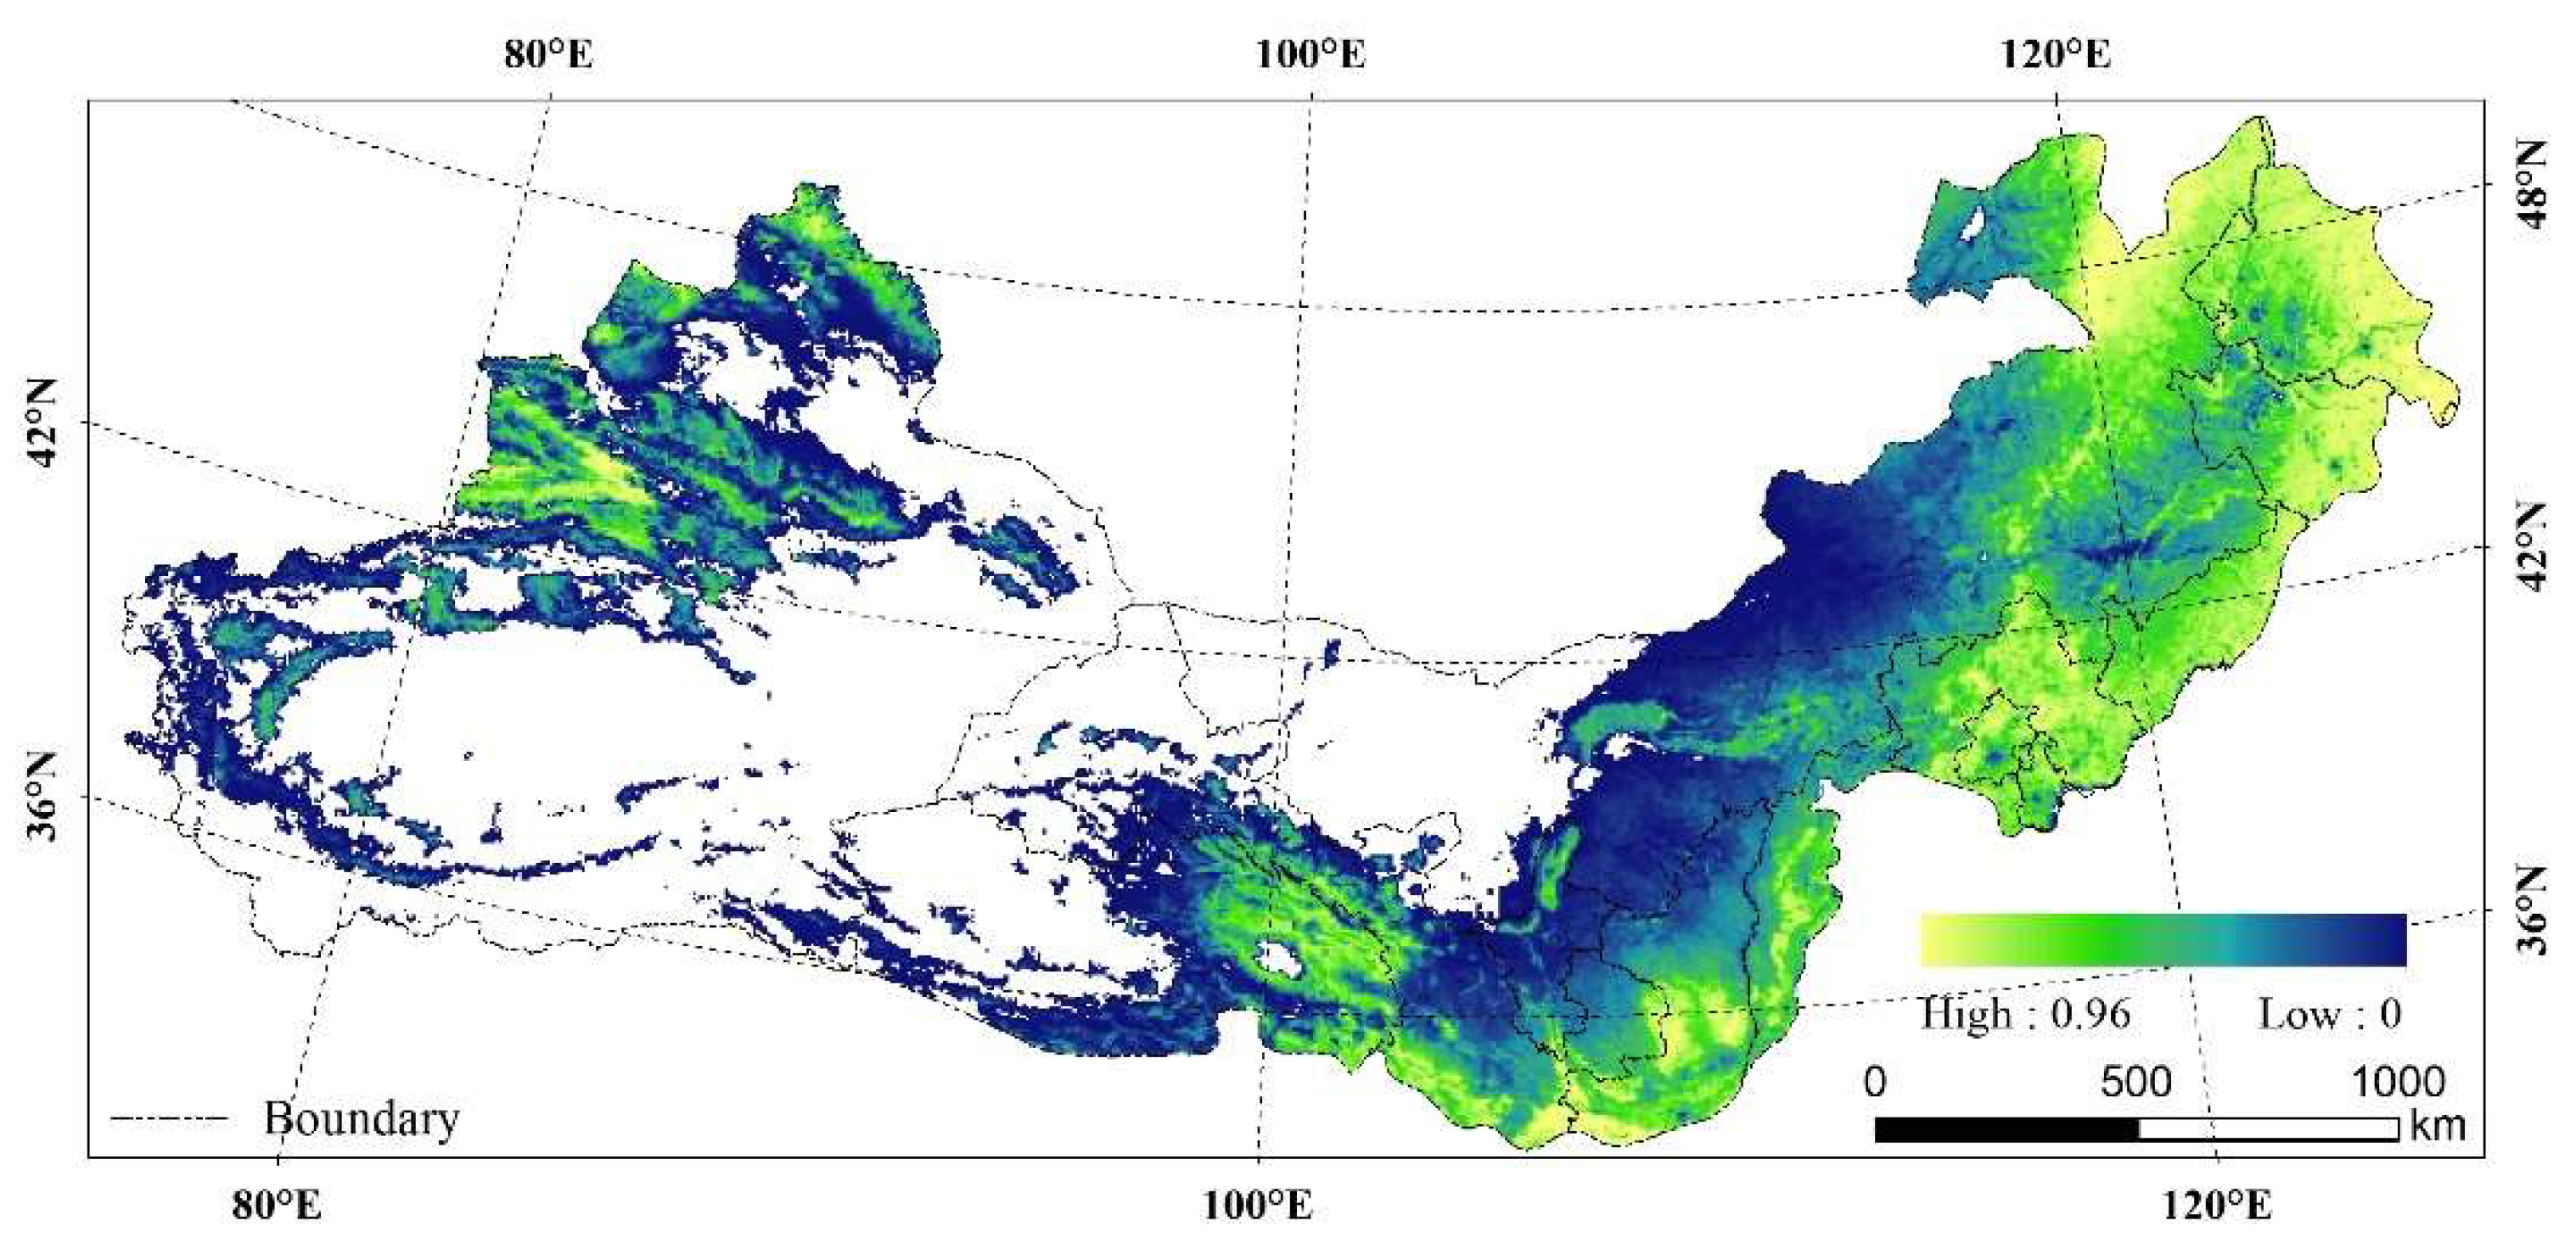
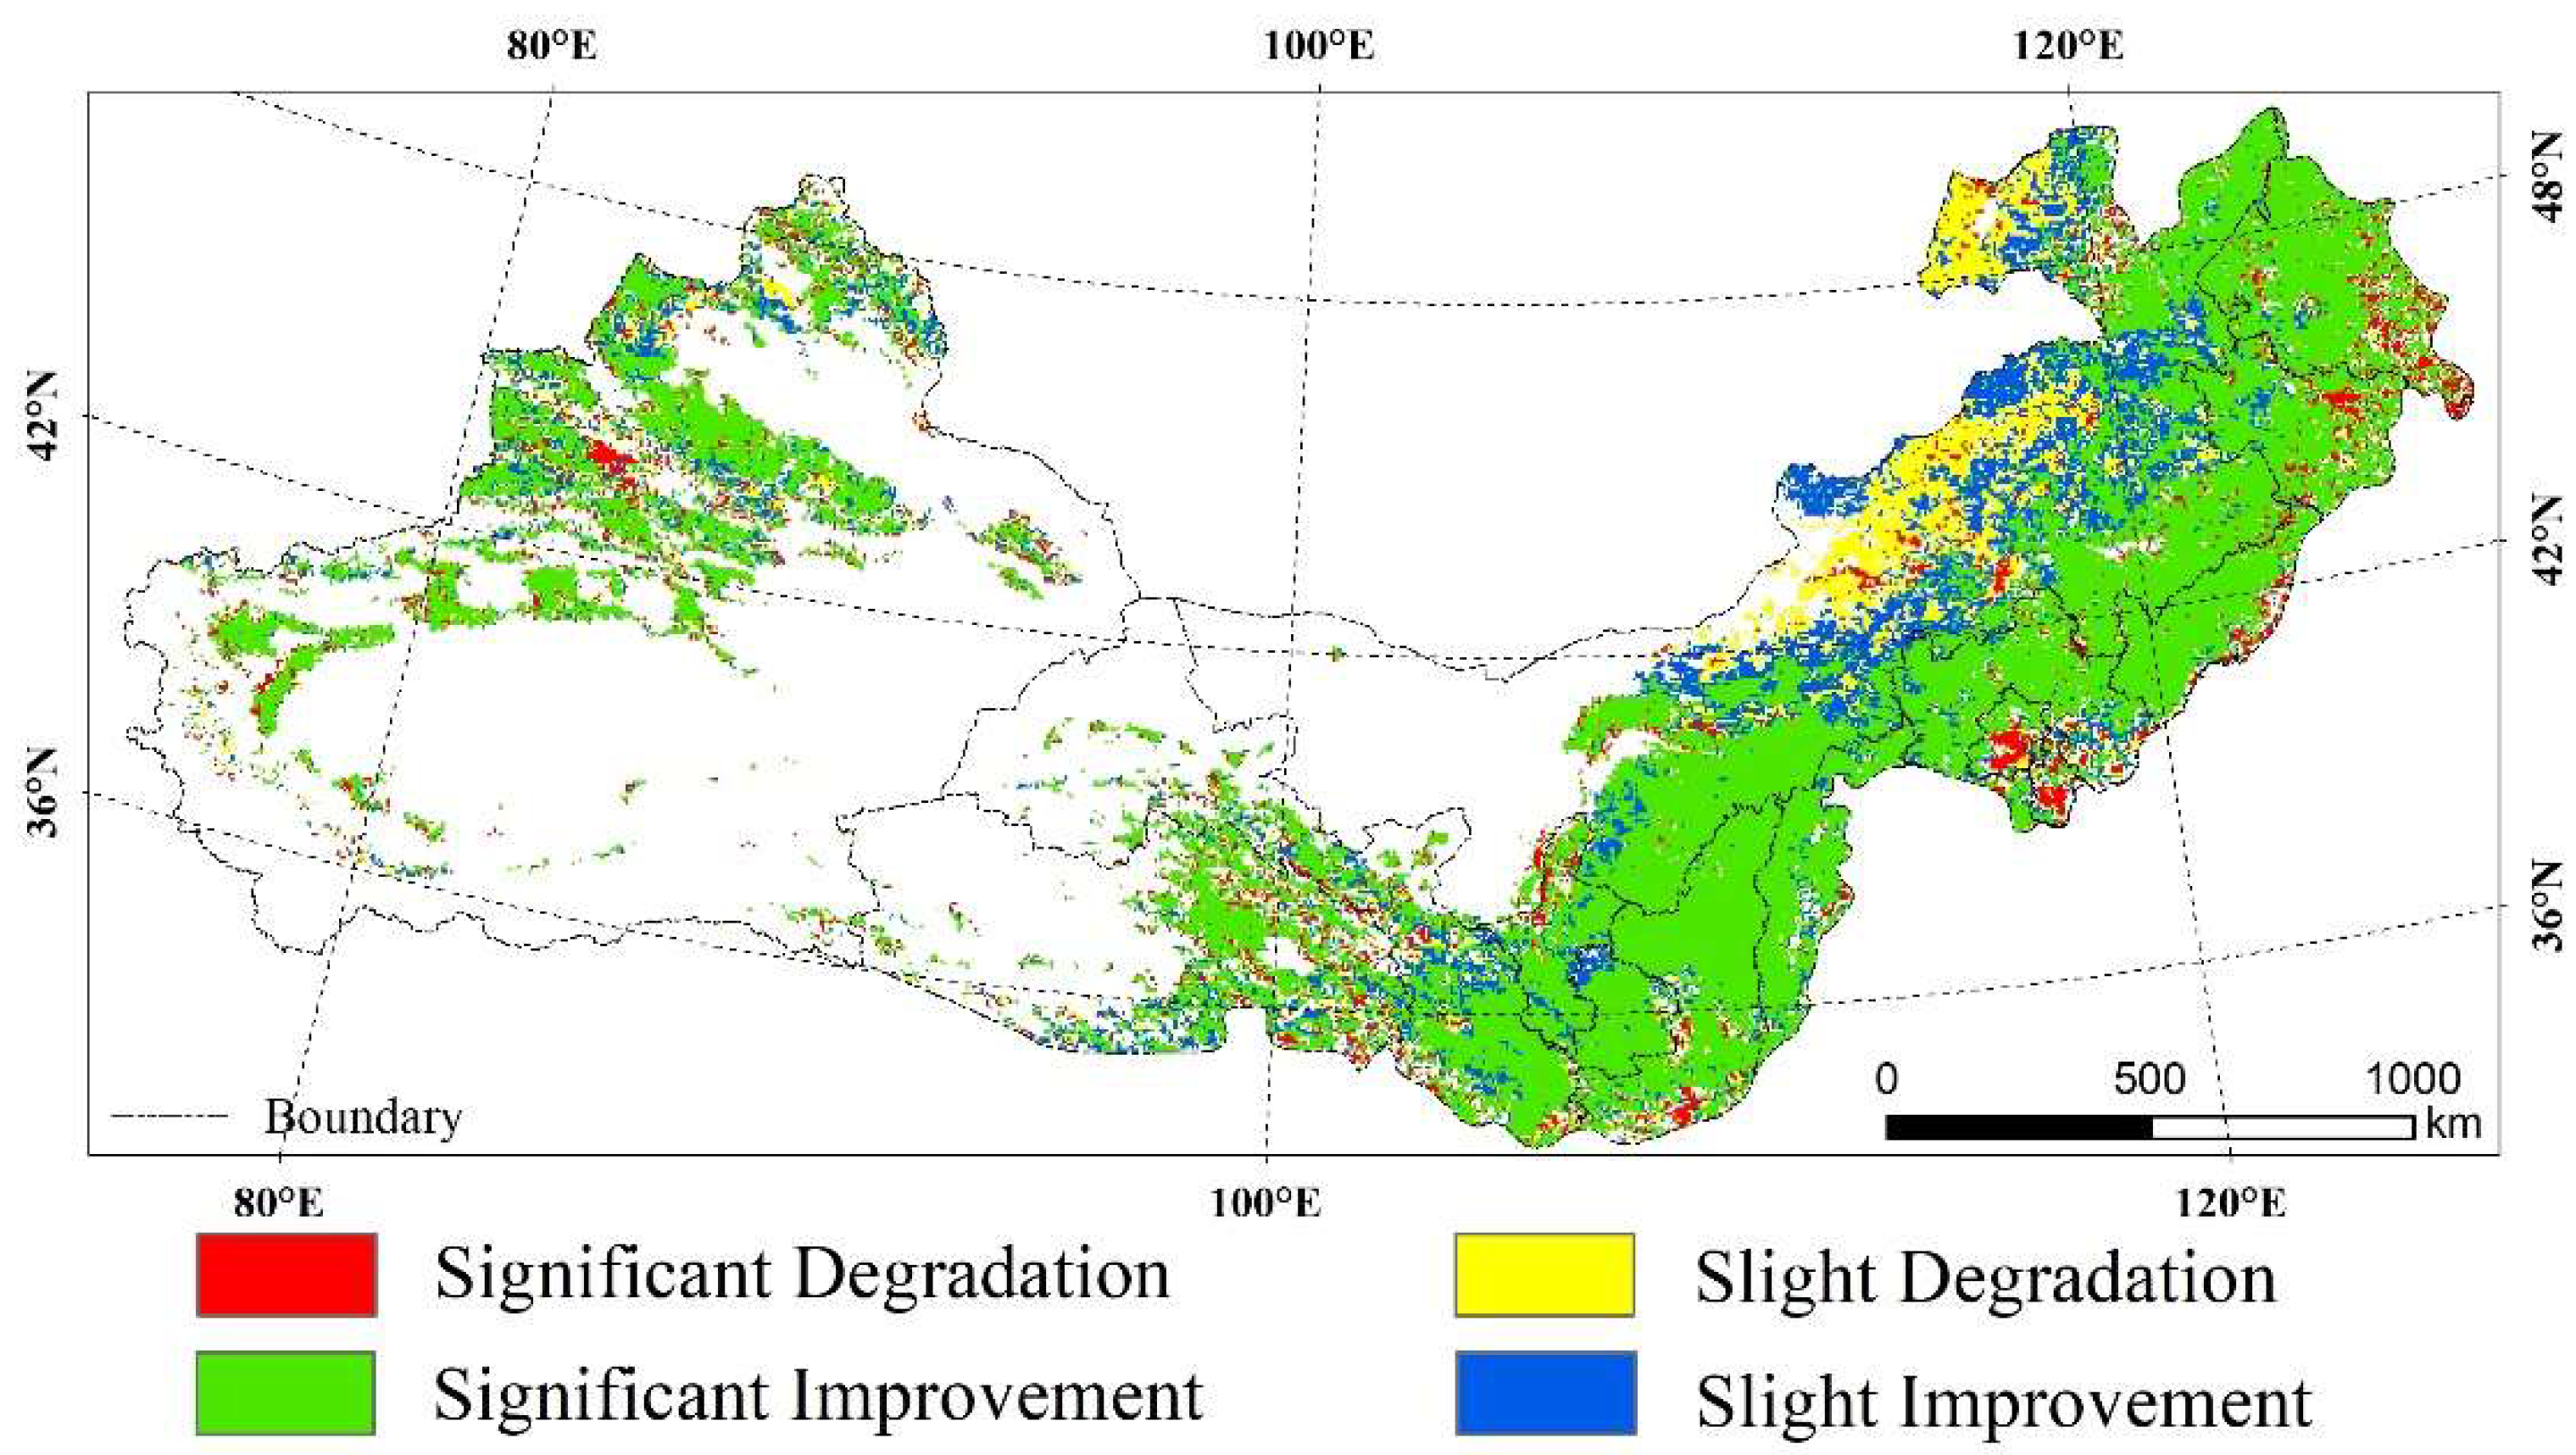
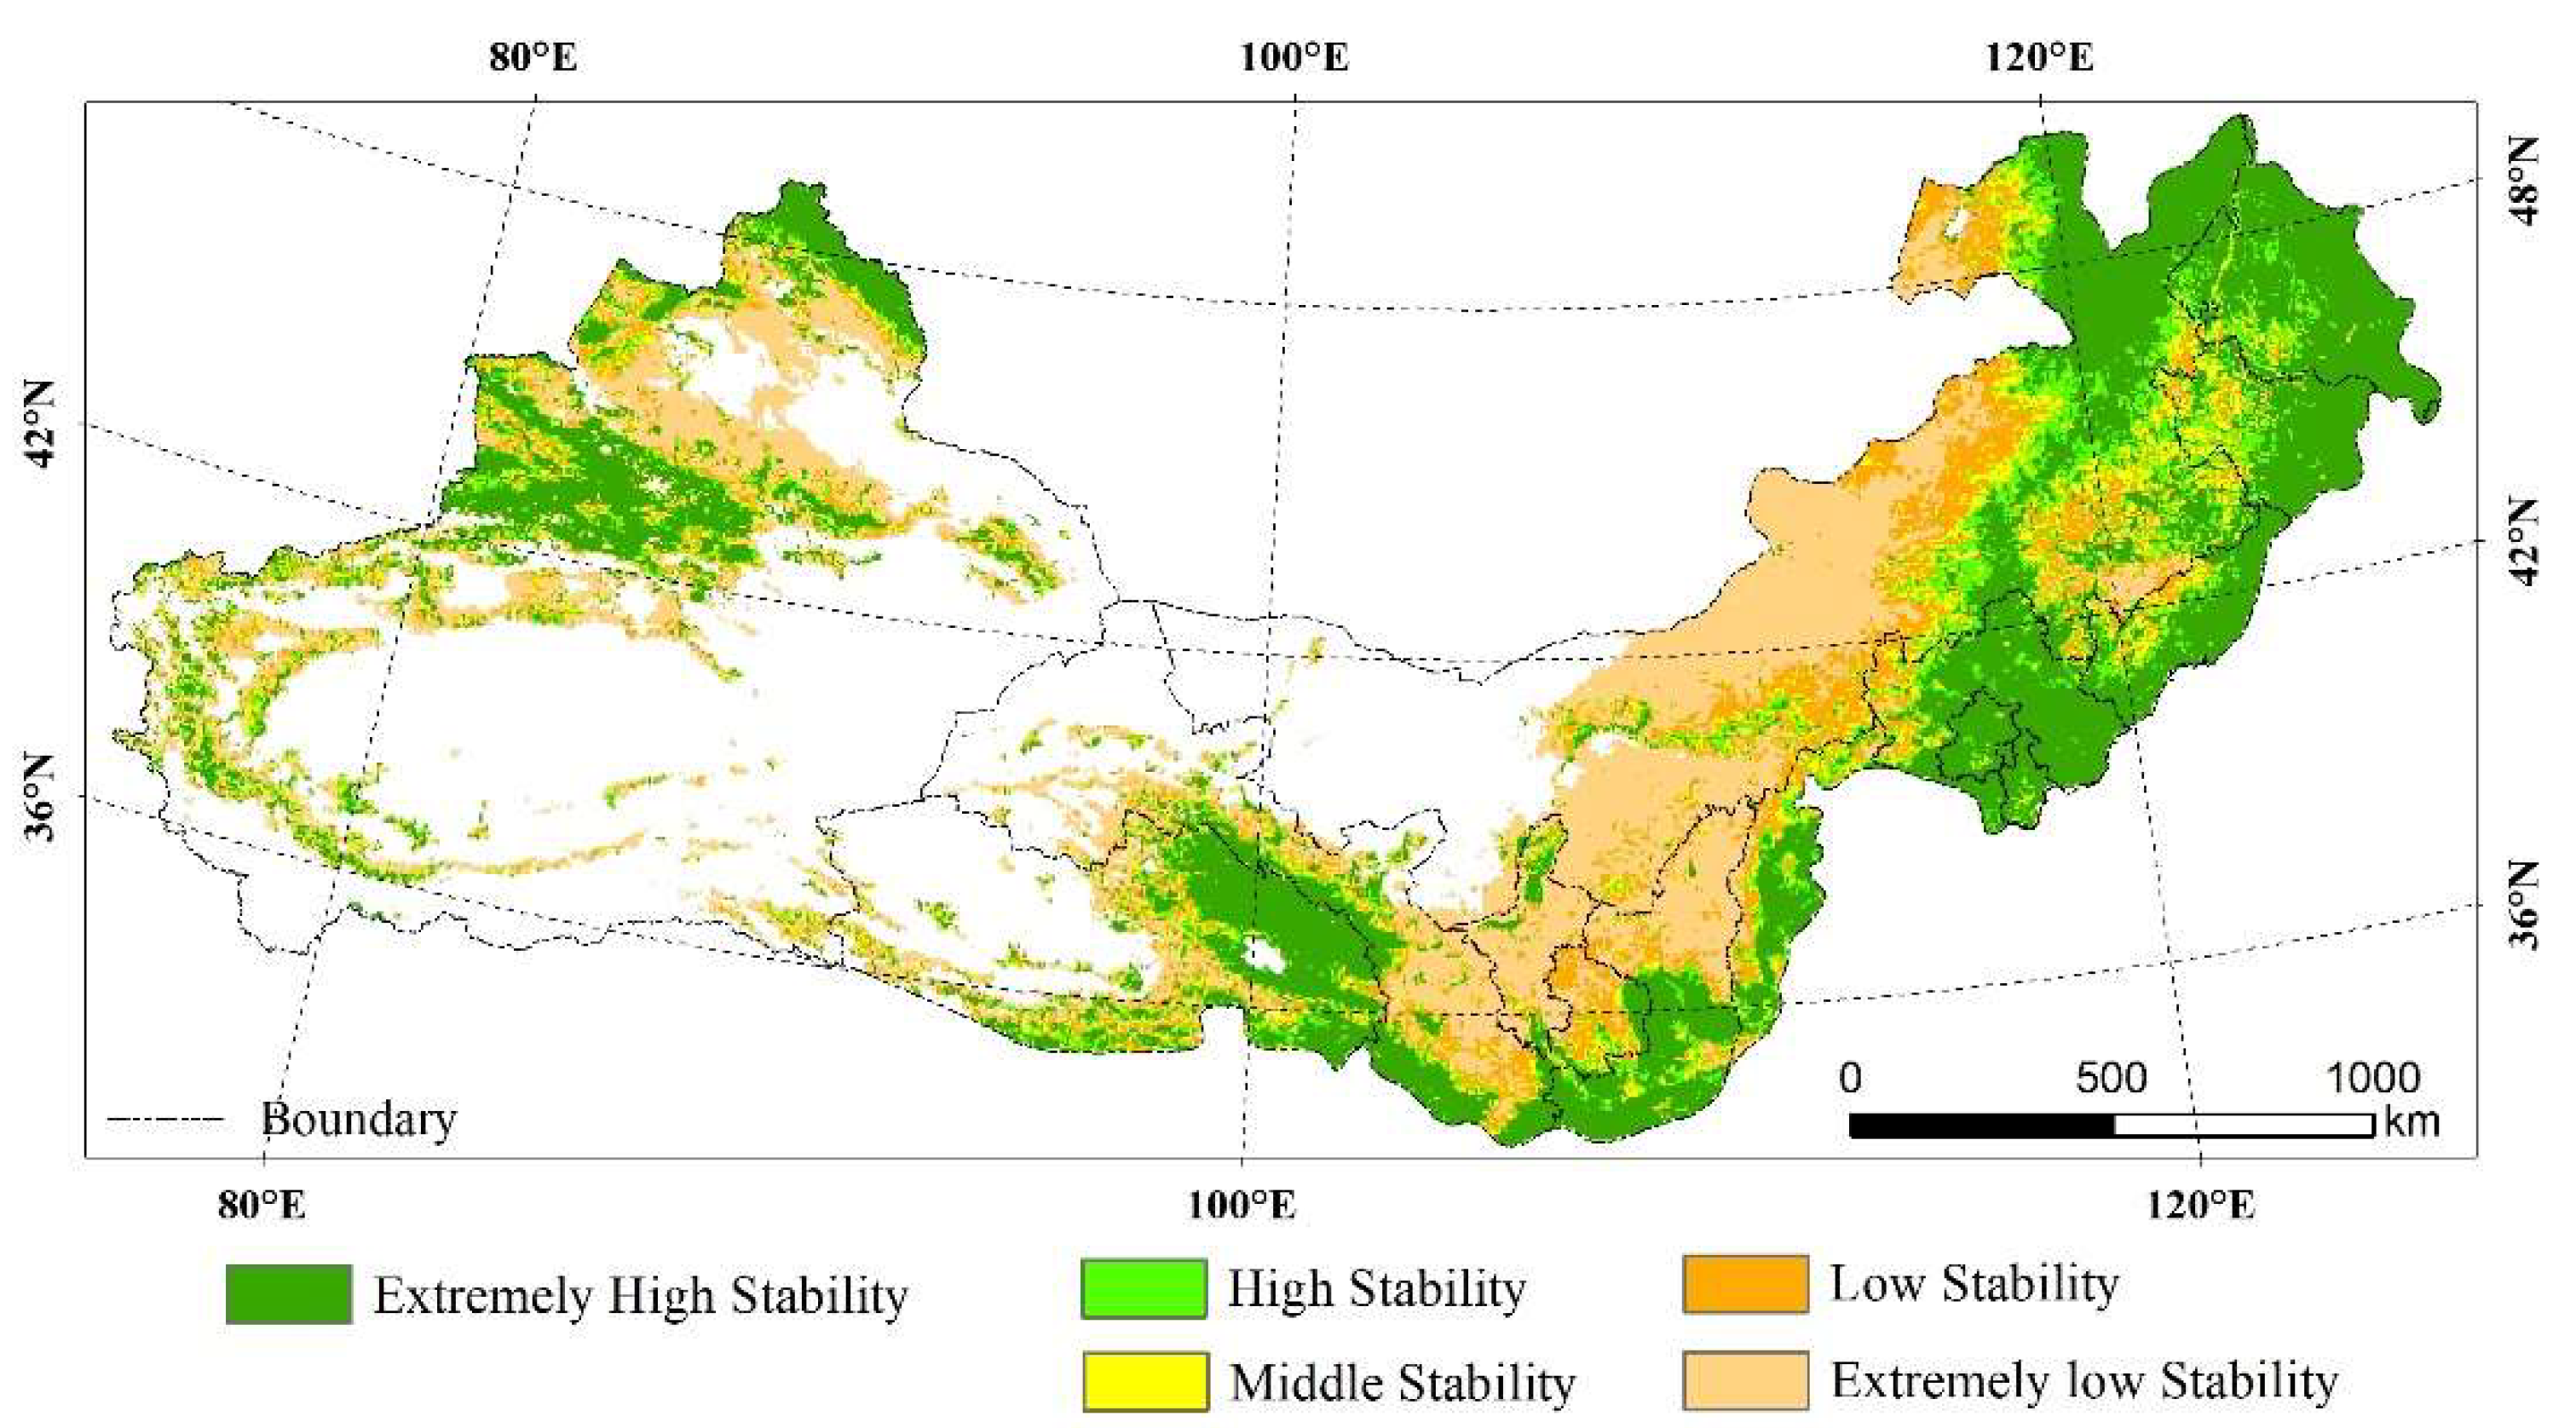
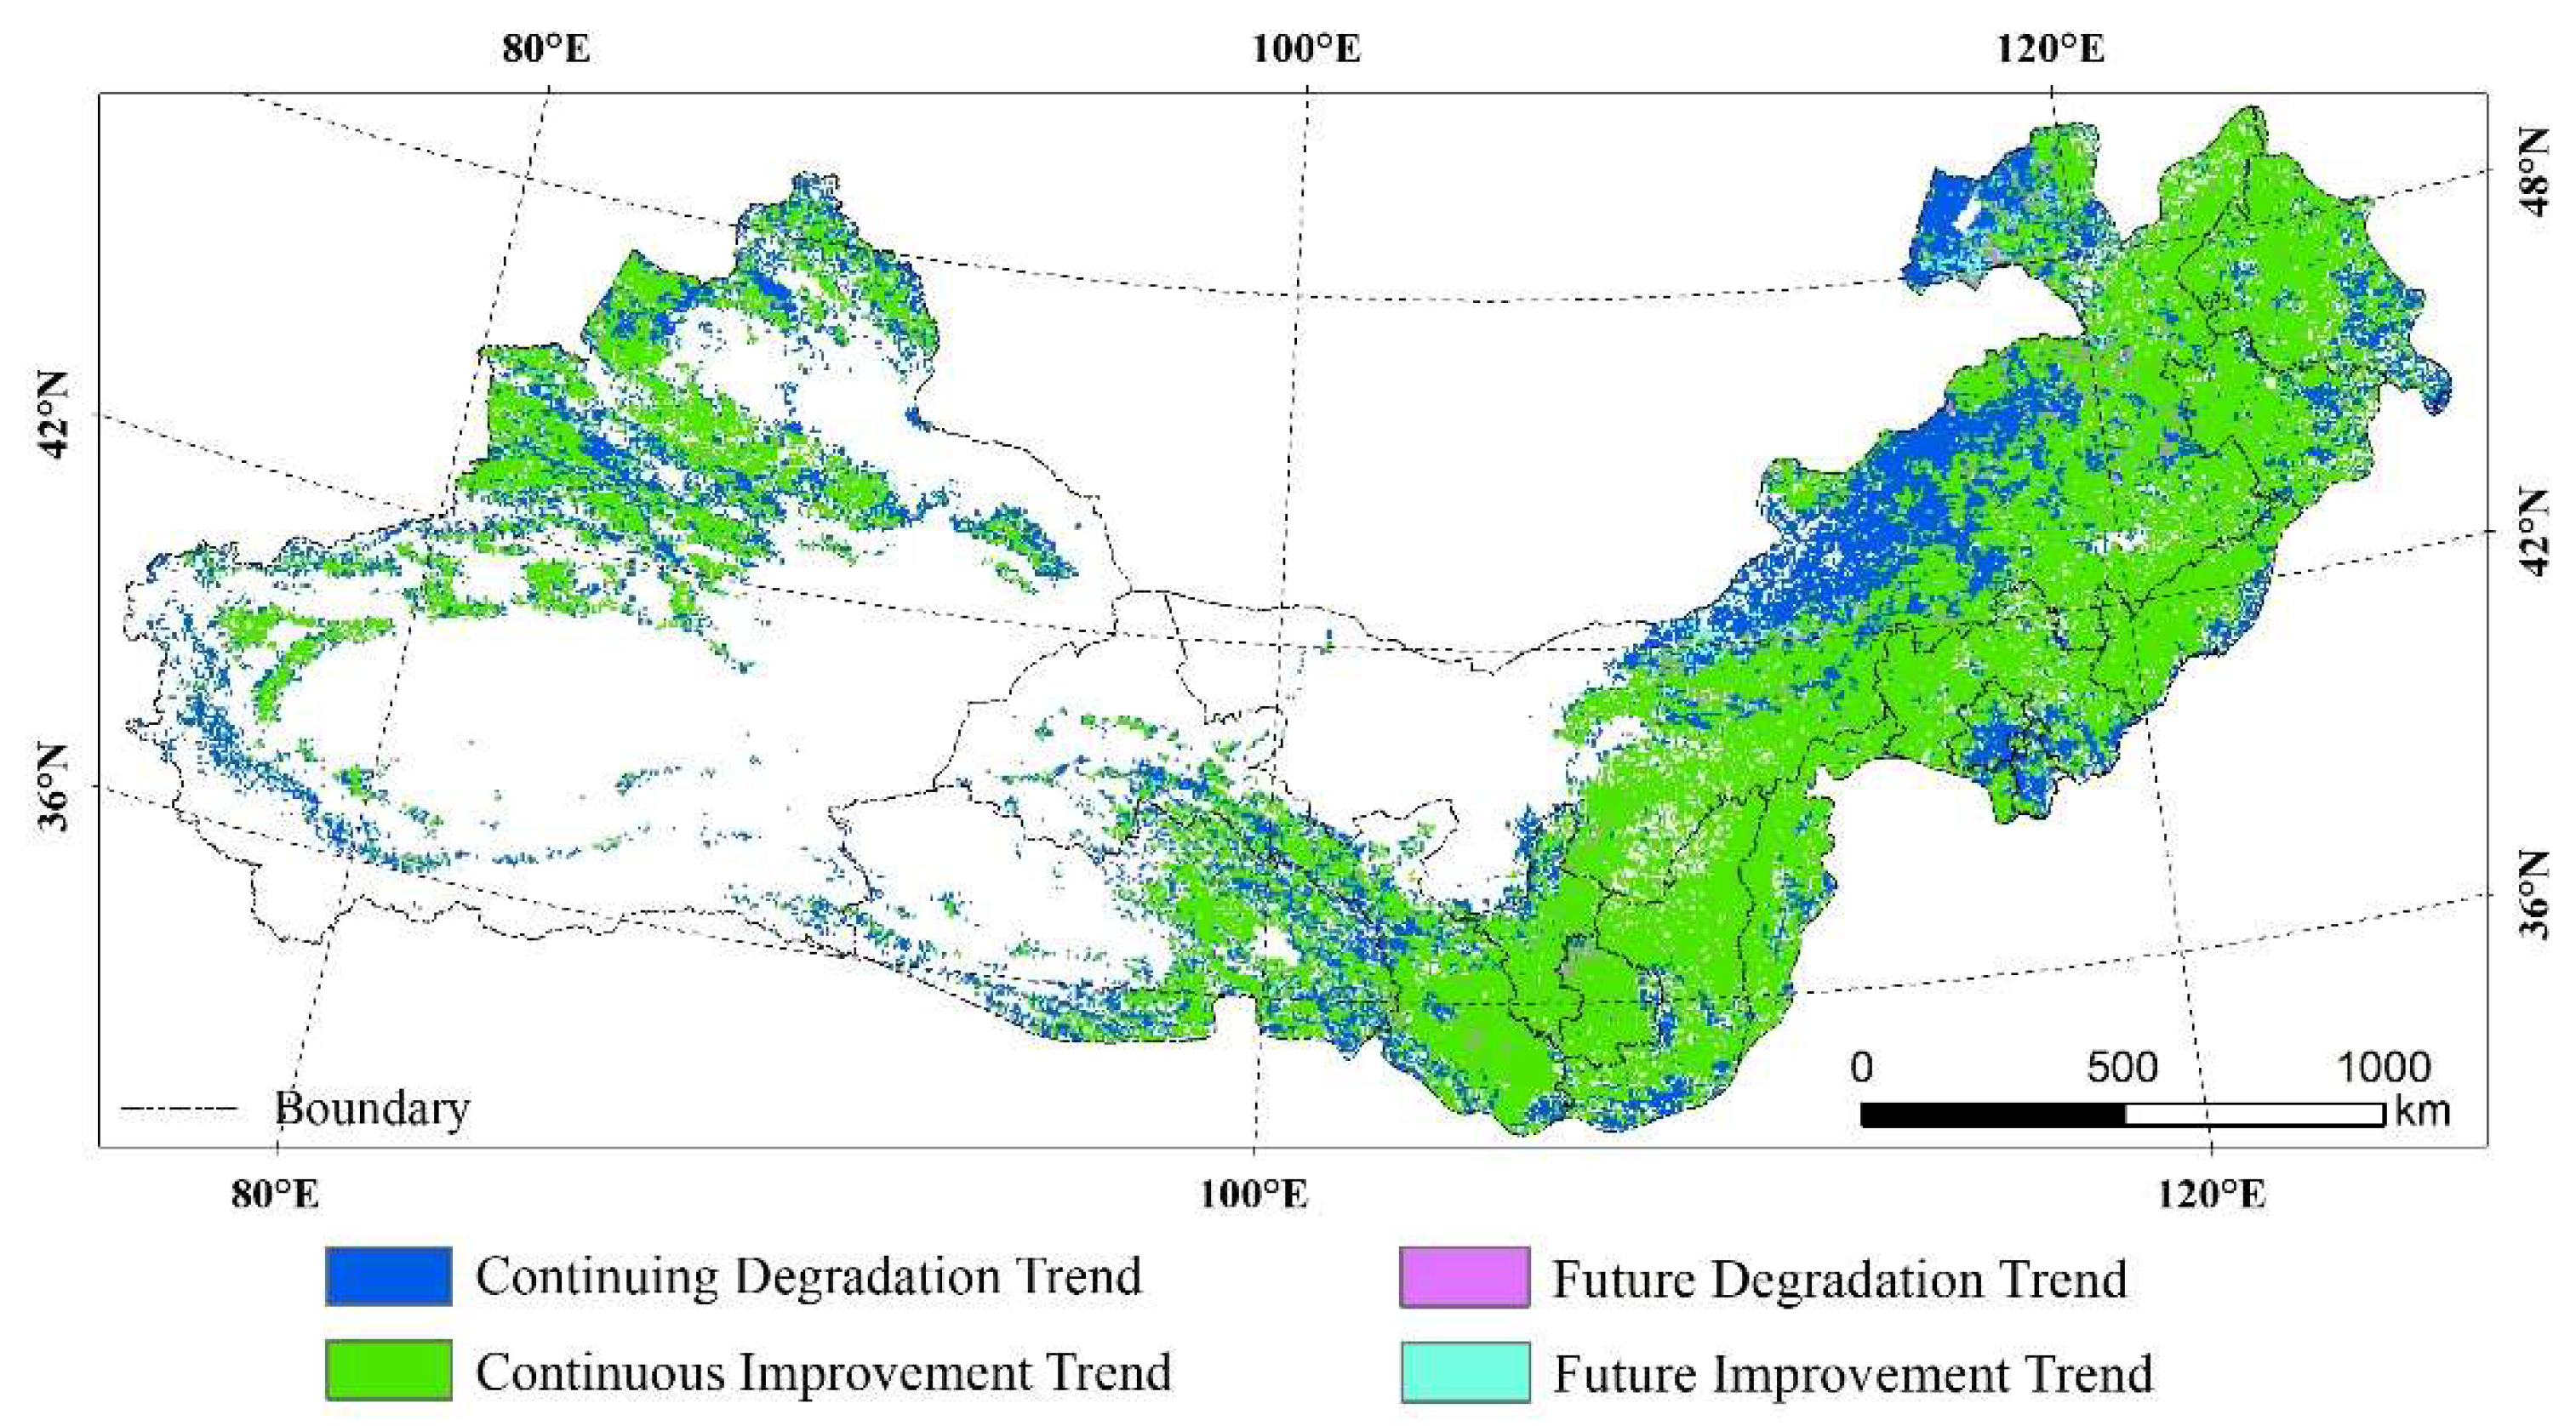
3.1. Spatial-Temporal Variation Features of FVC
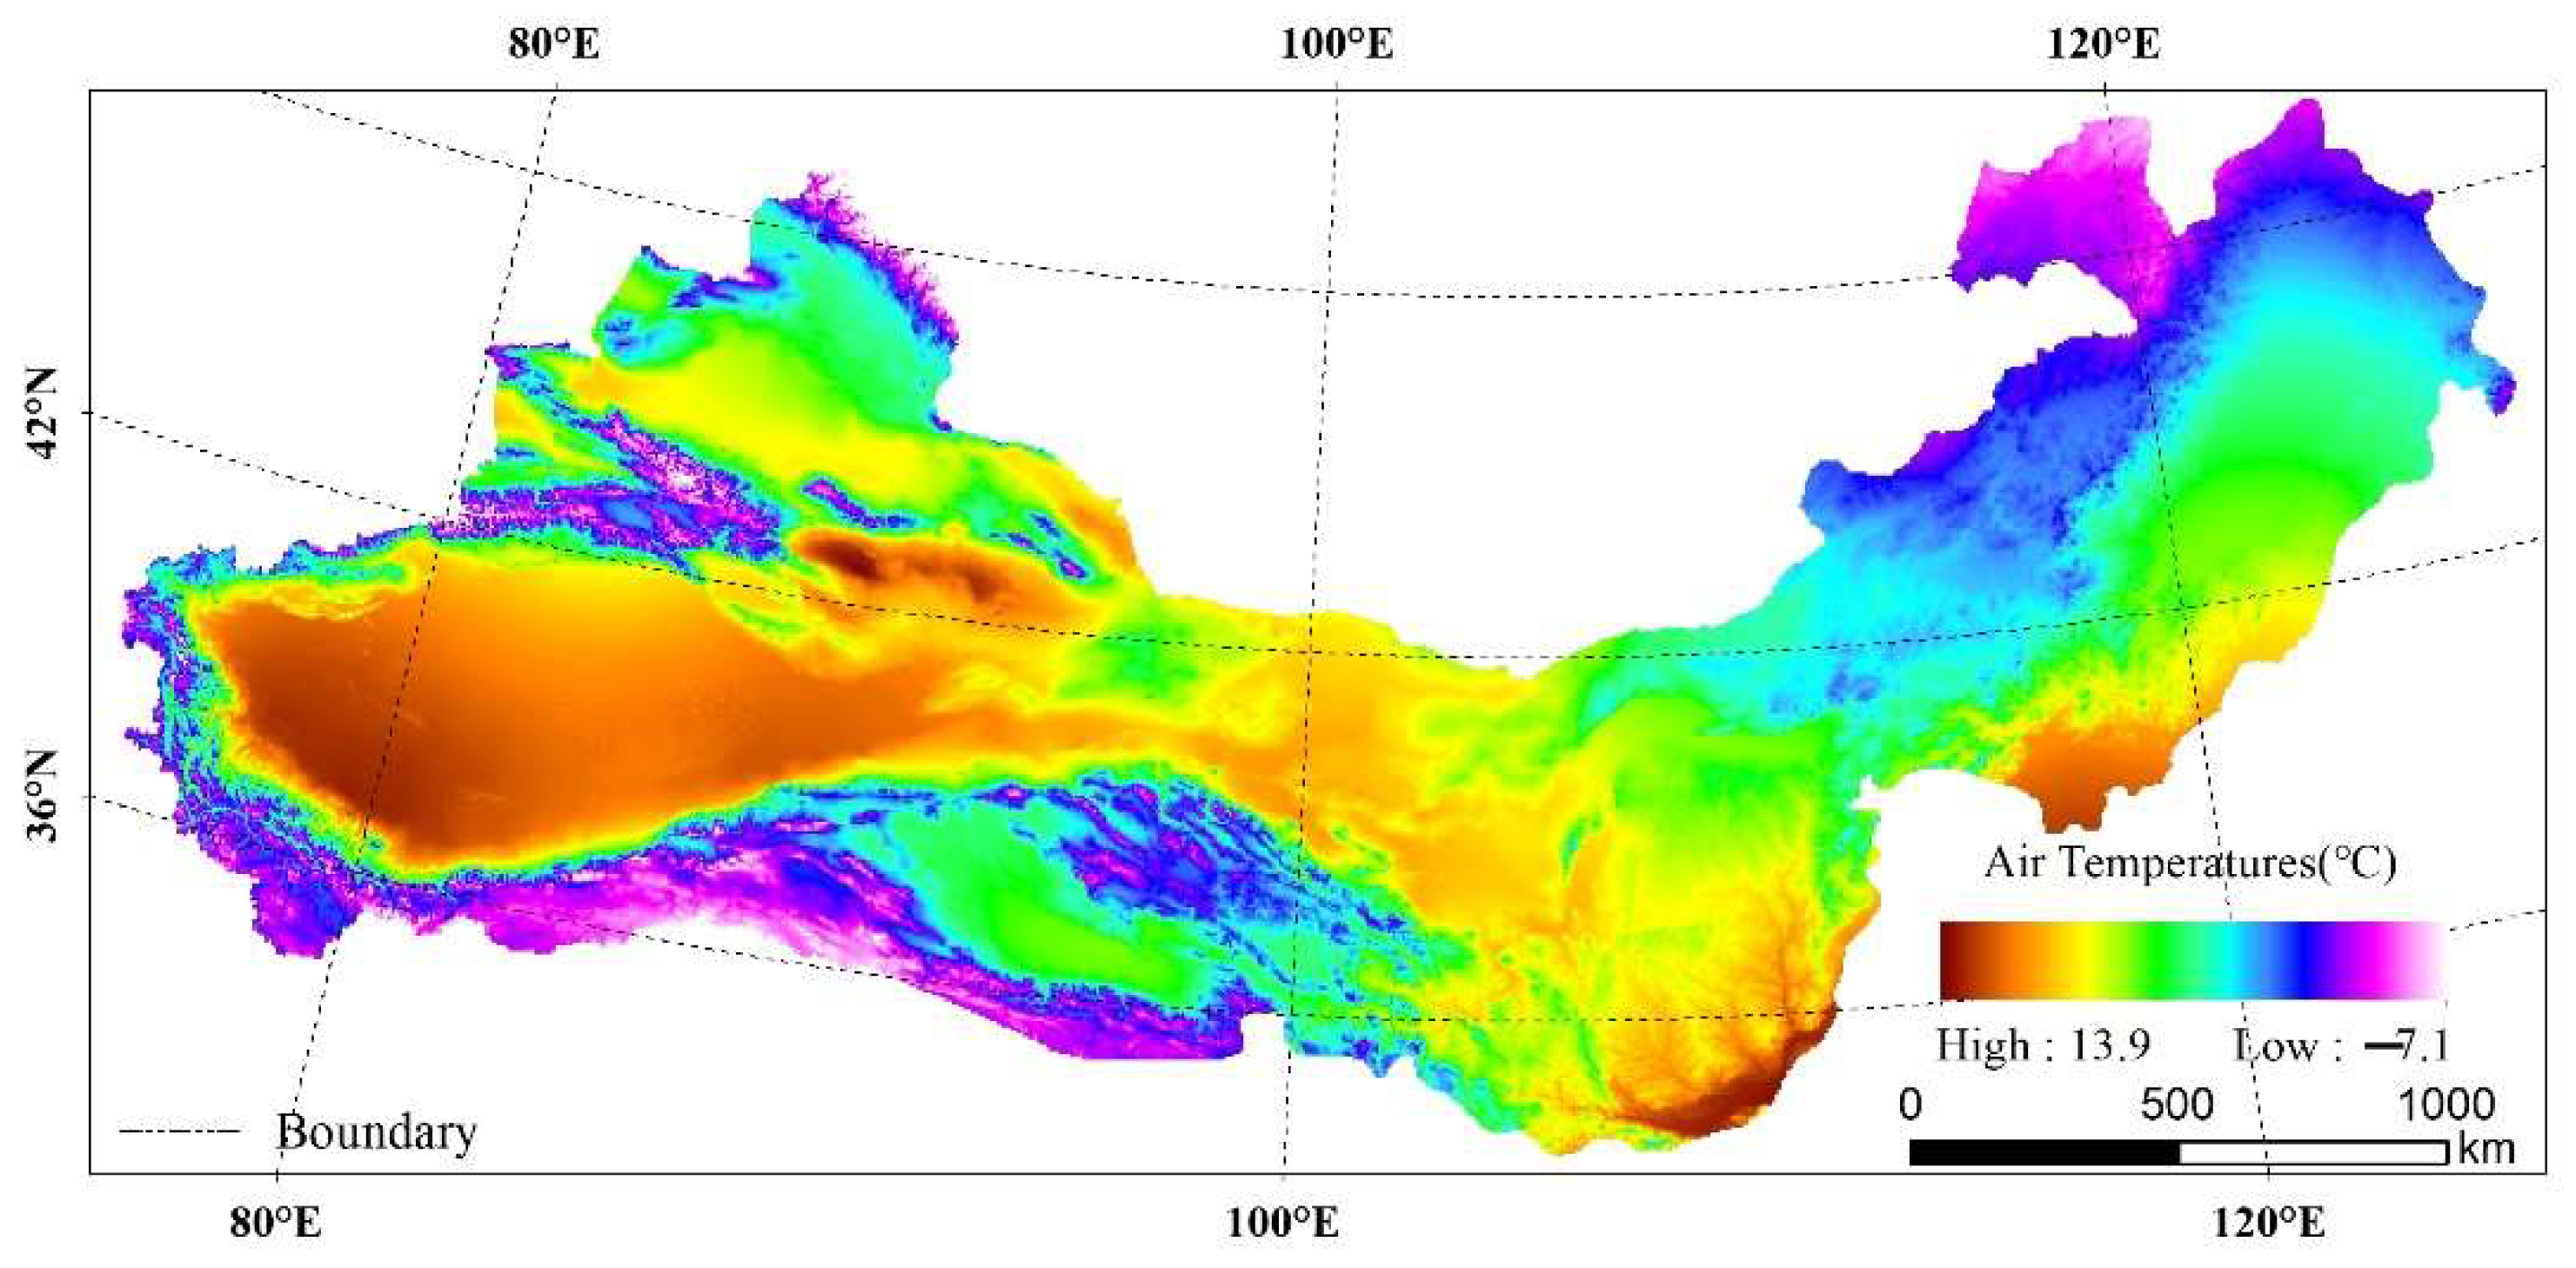
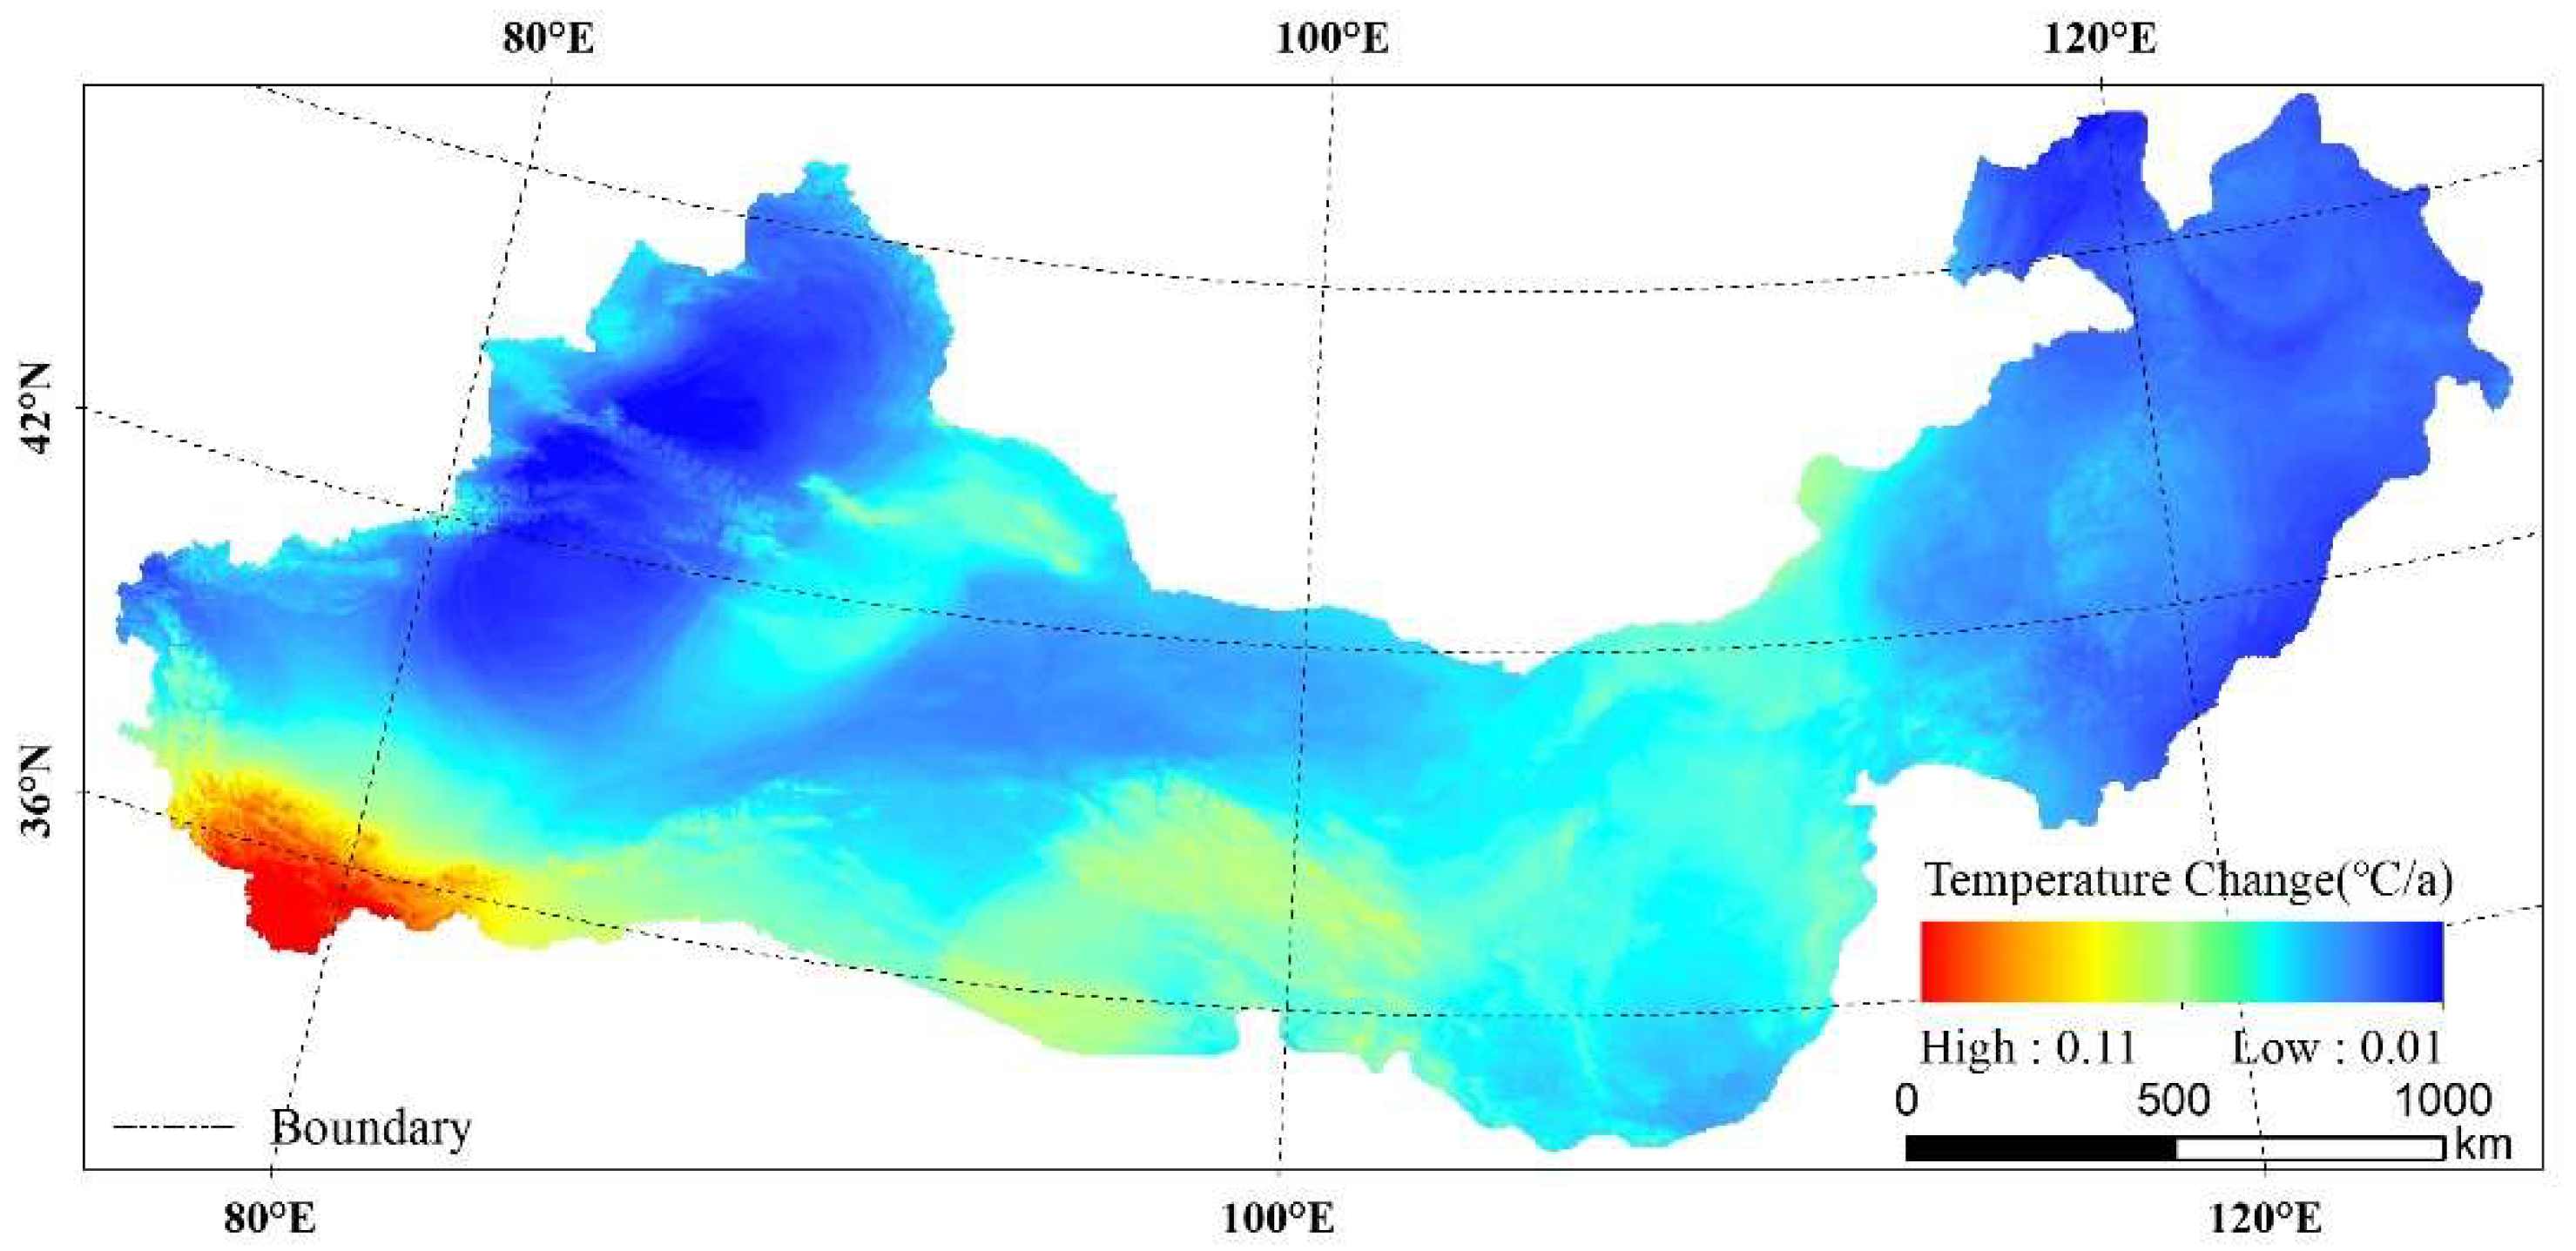
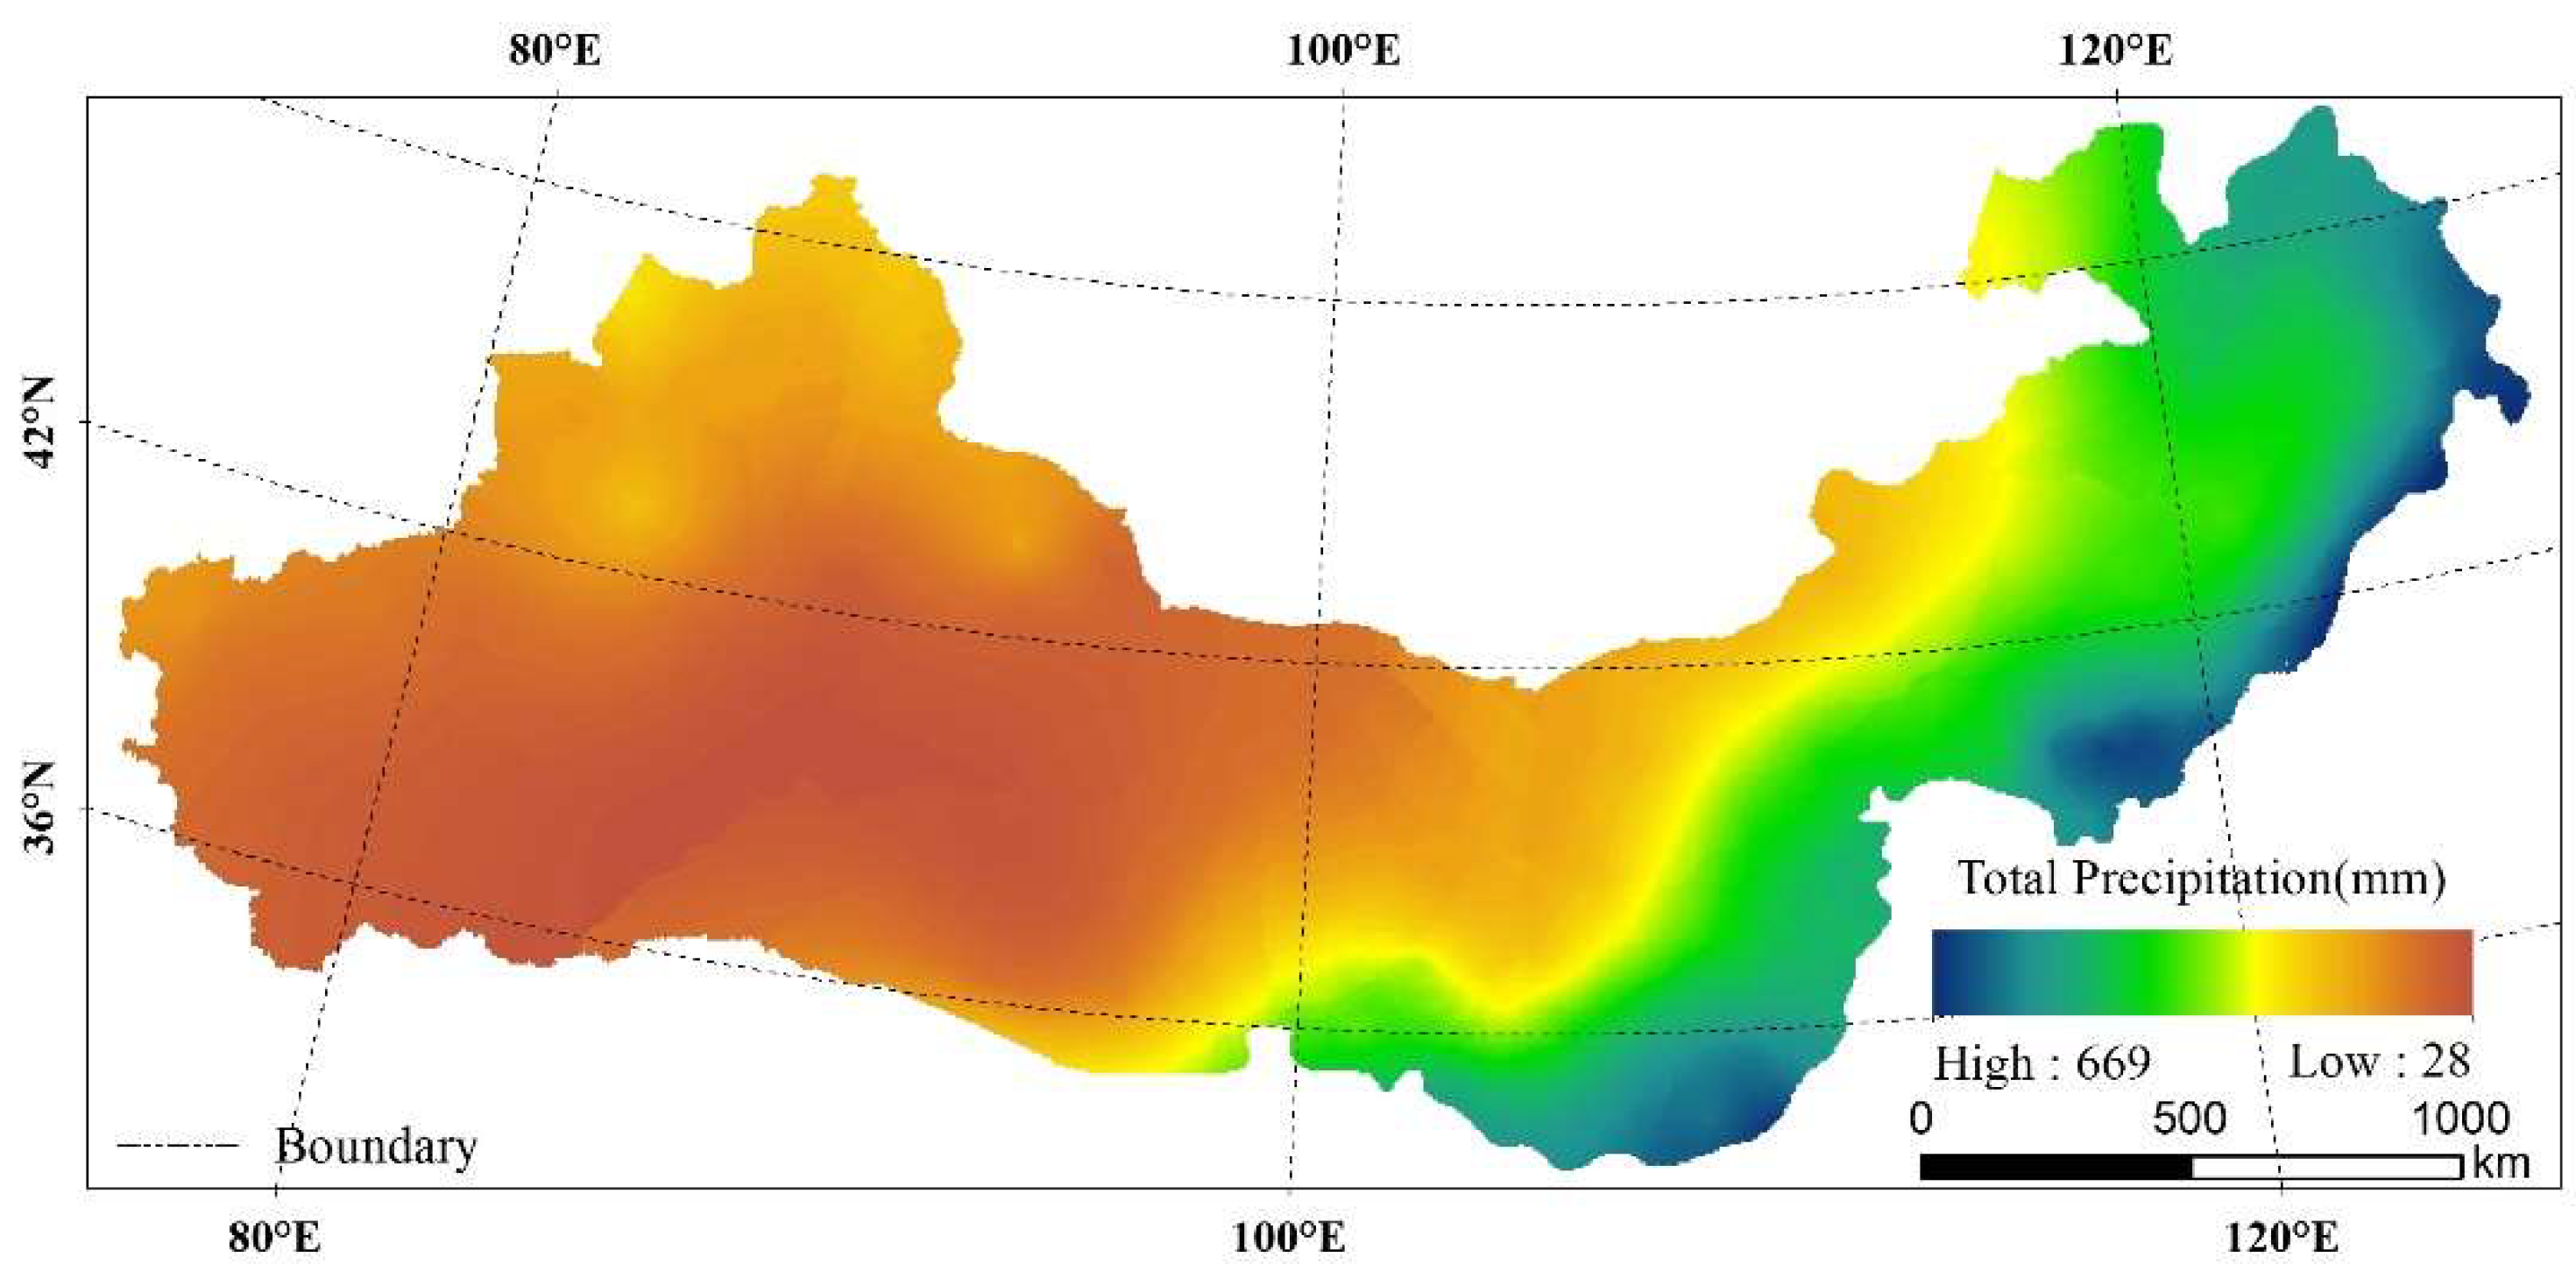
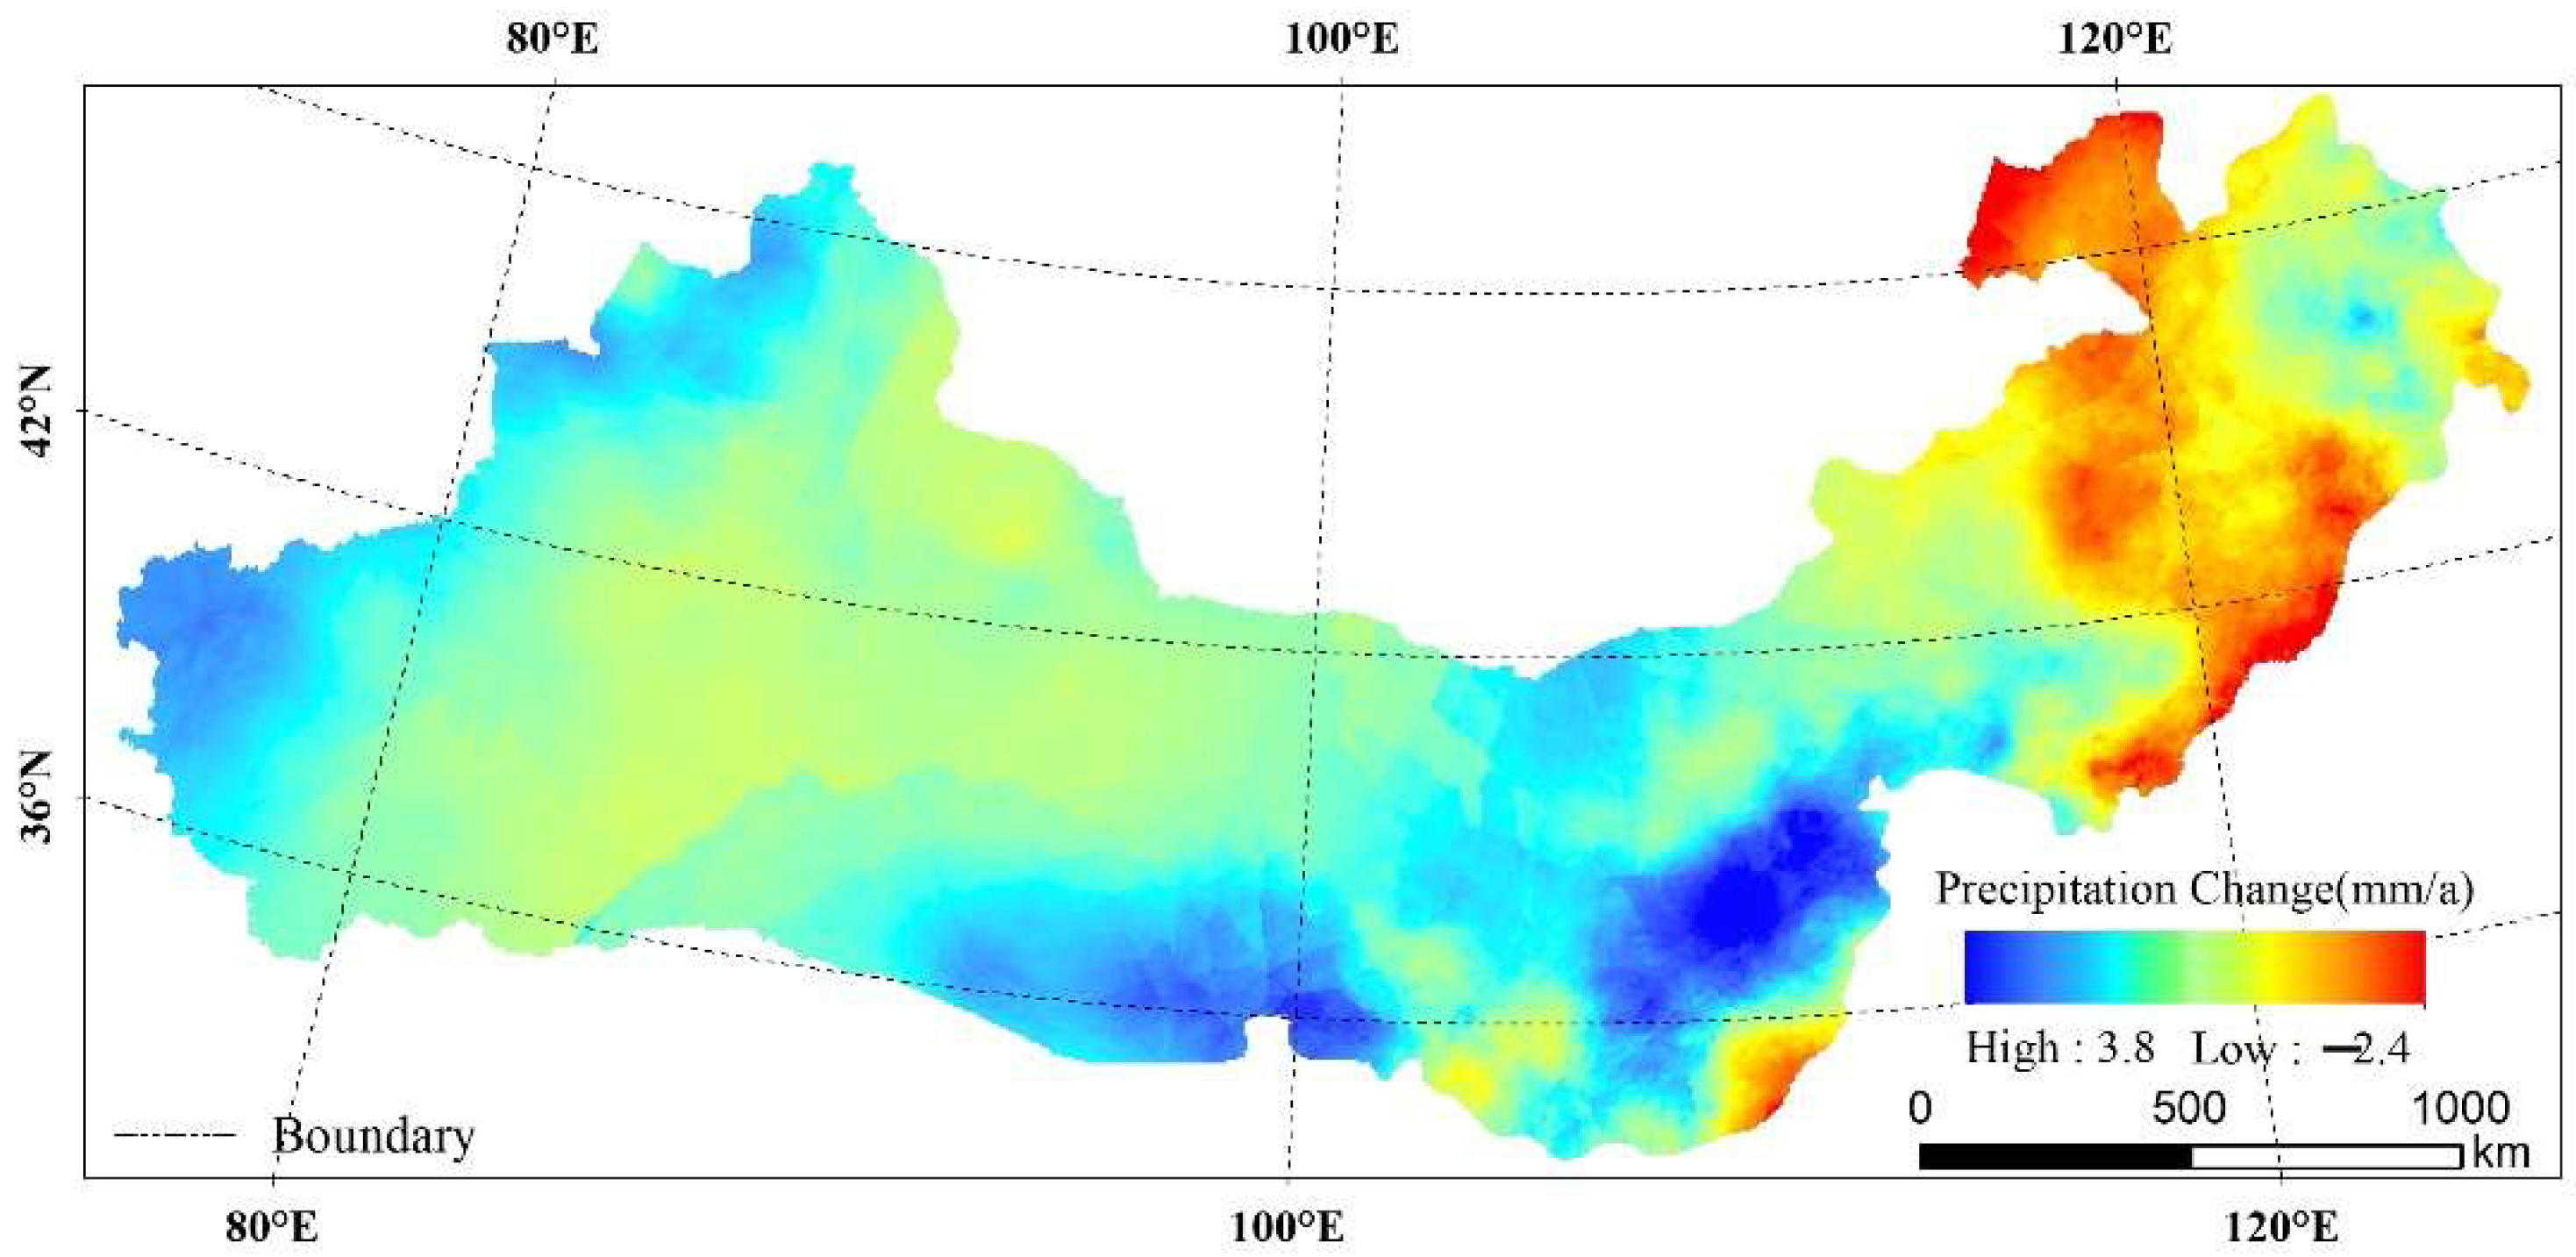
3.2. Spatial-Temporal Characteristics of Climate Change
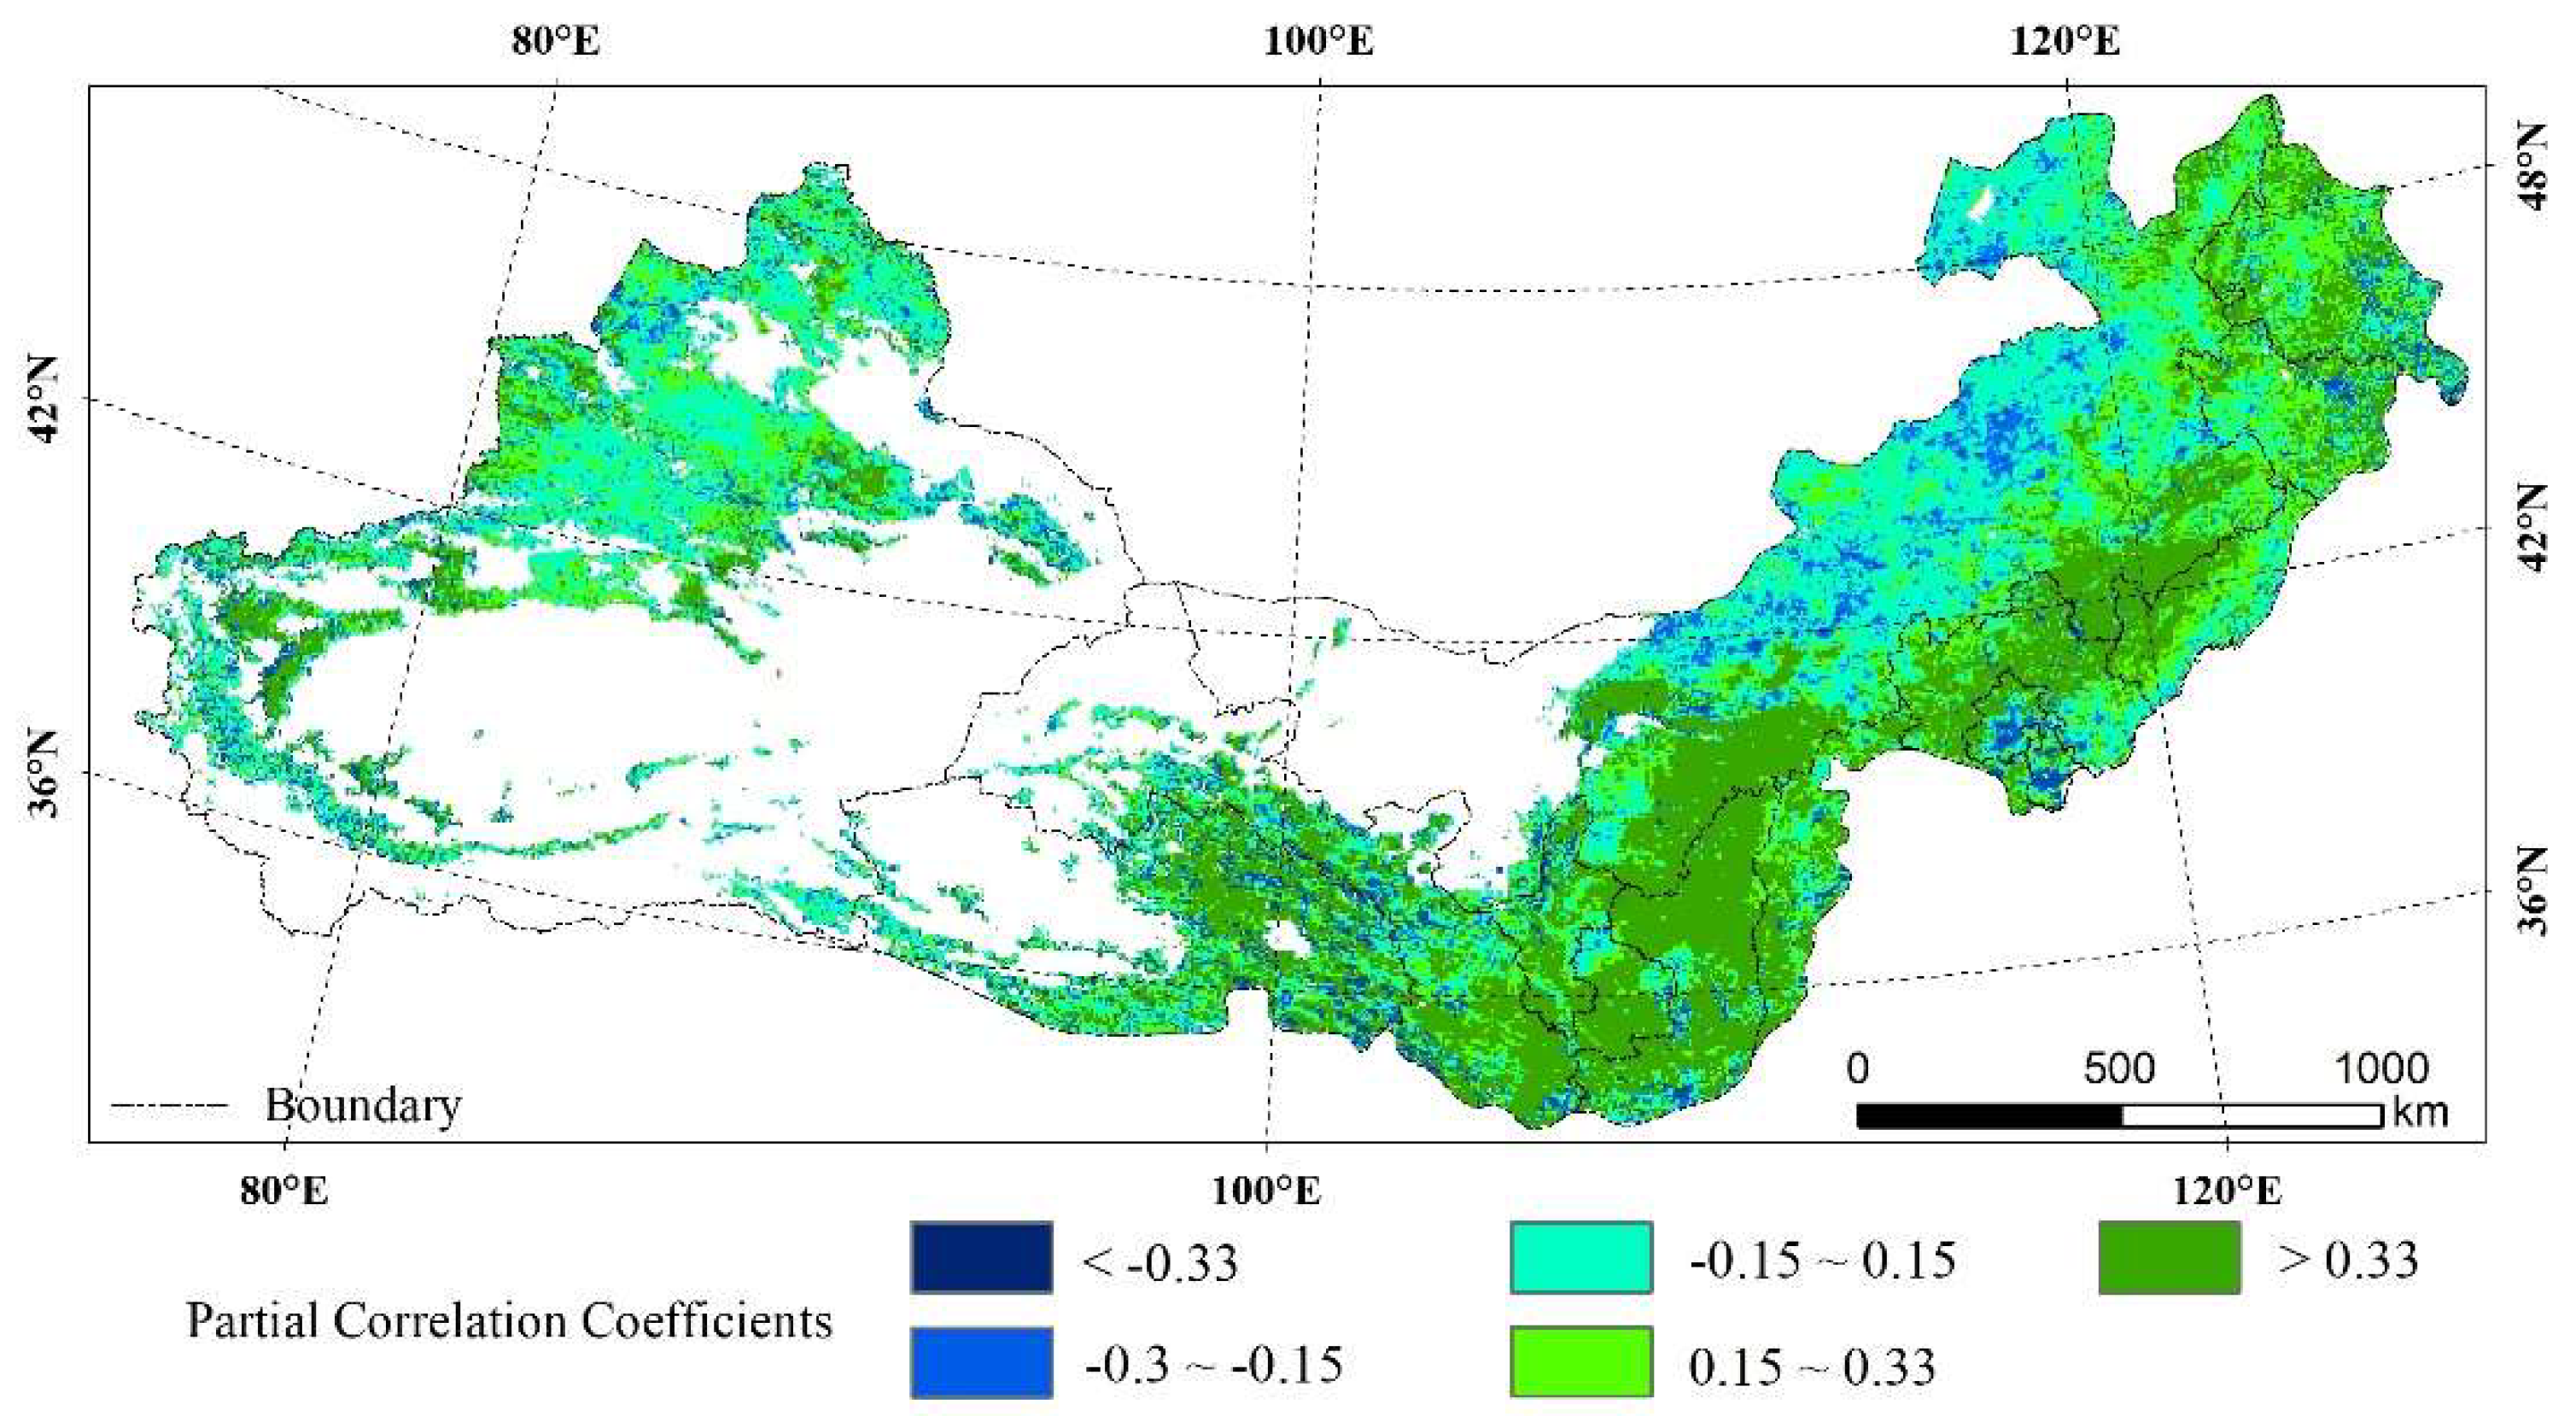
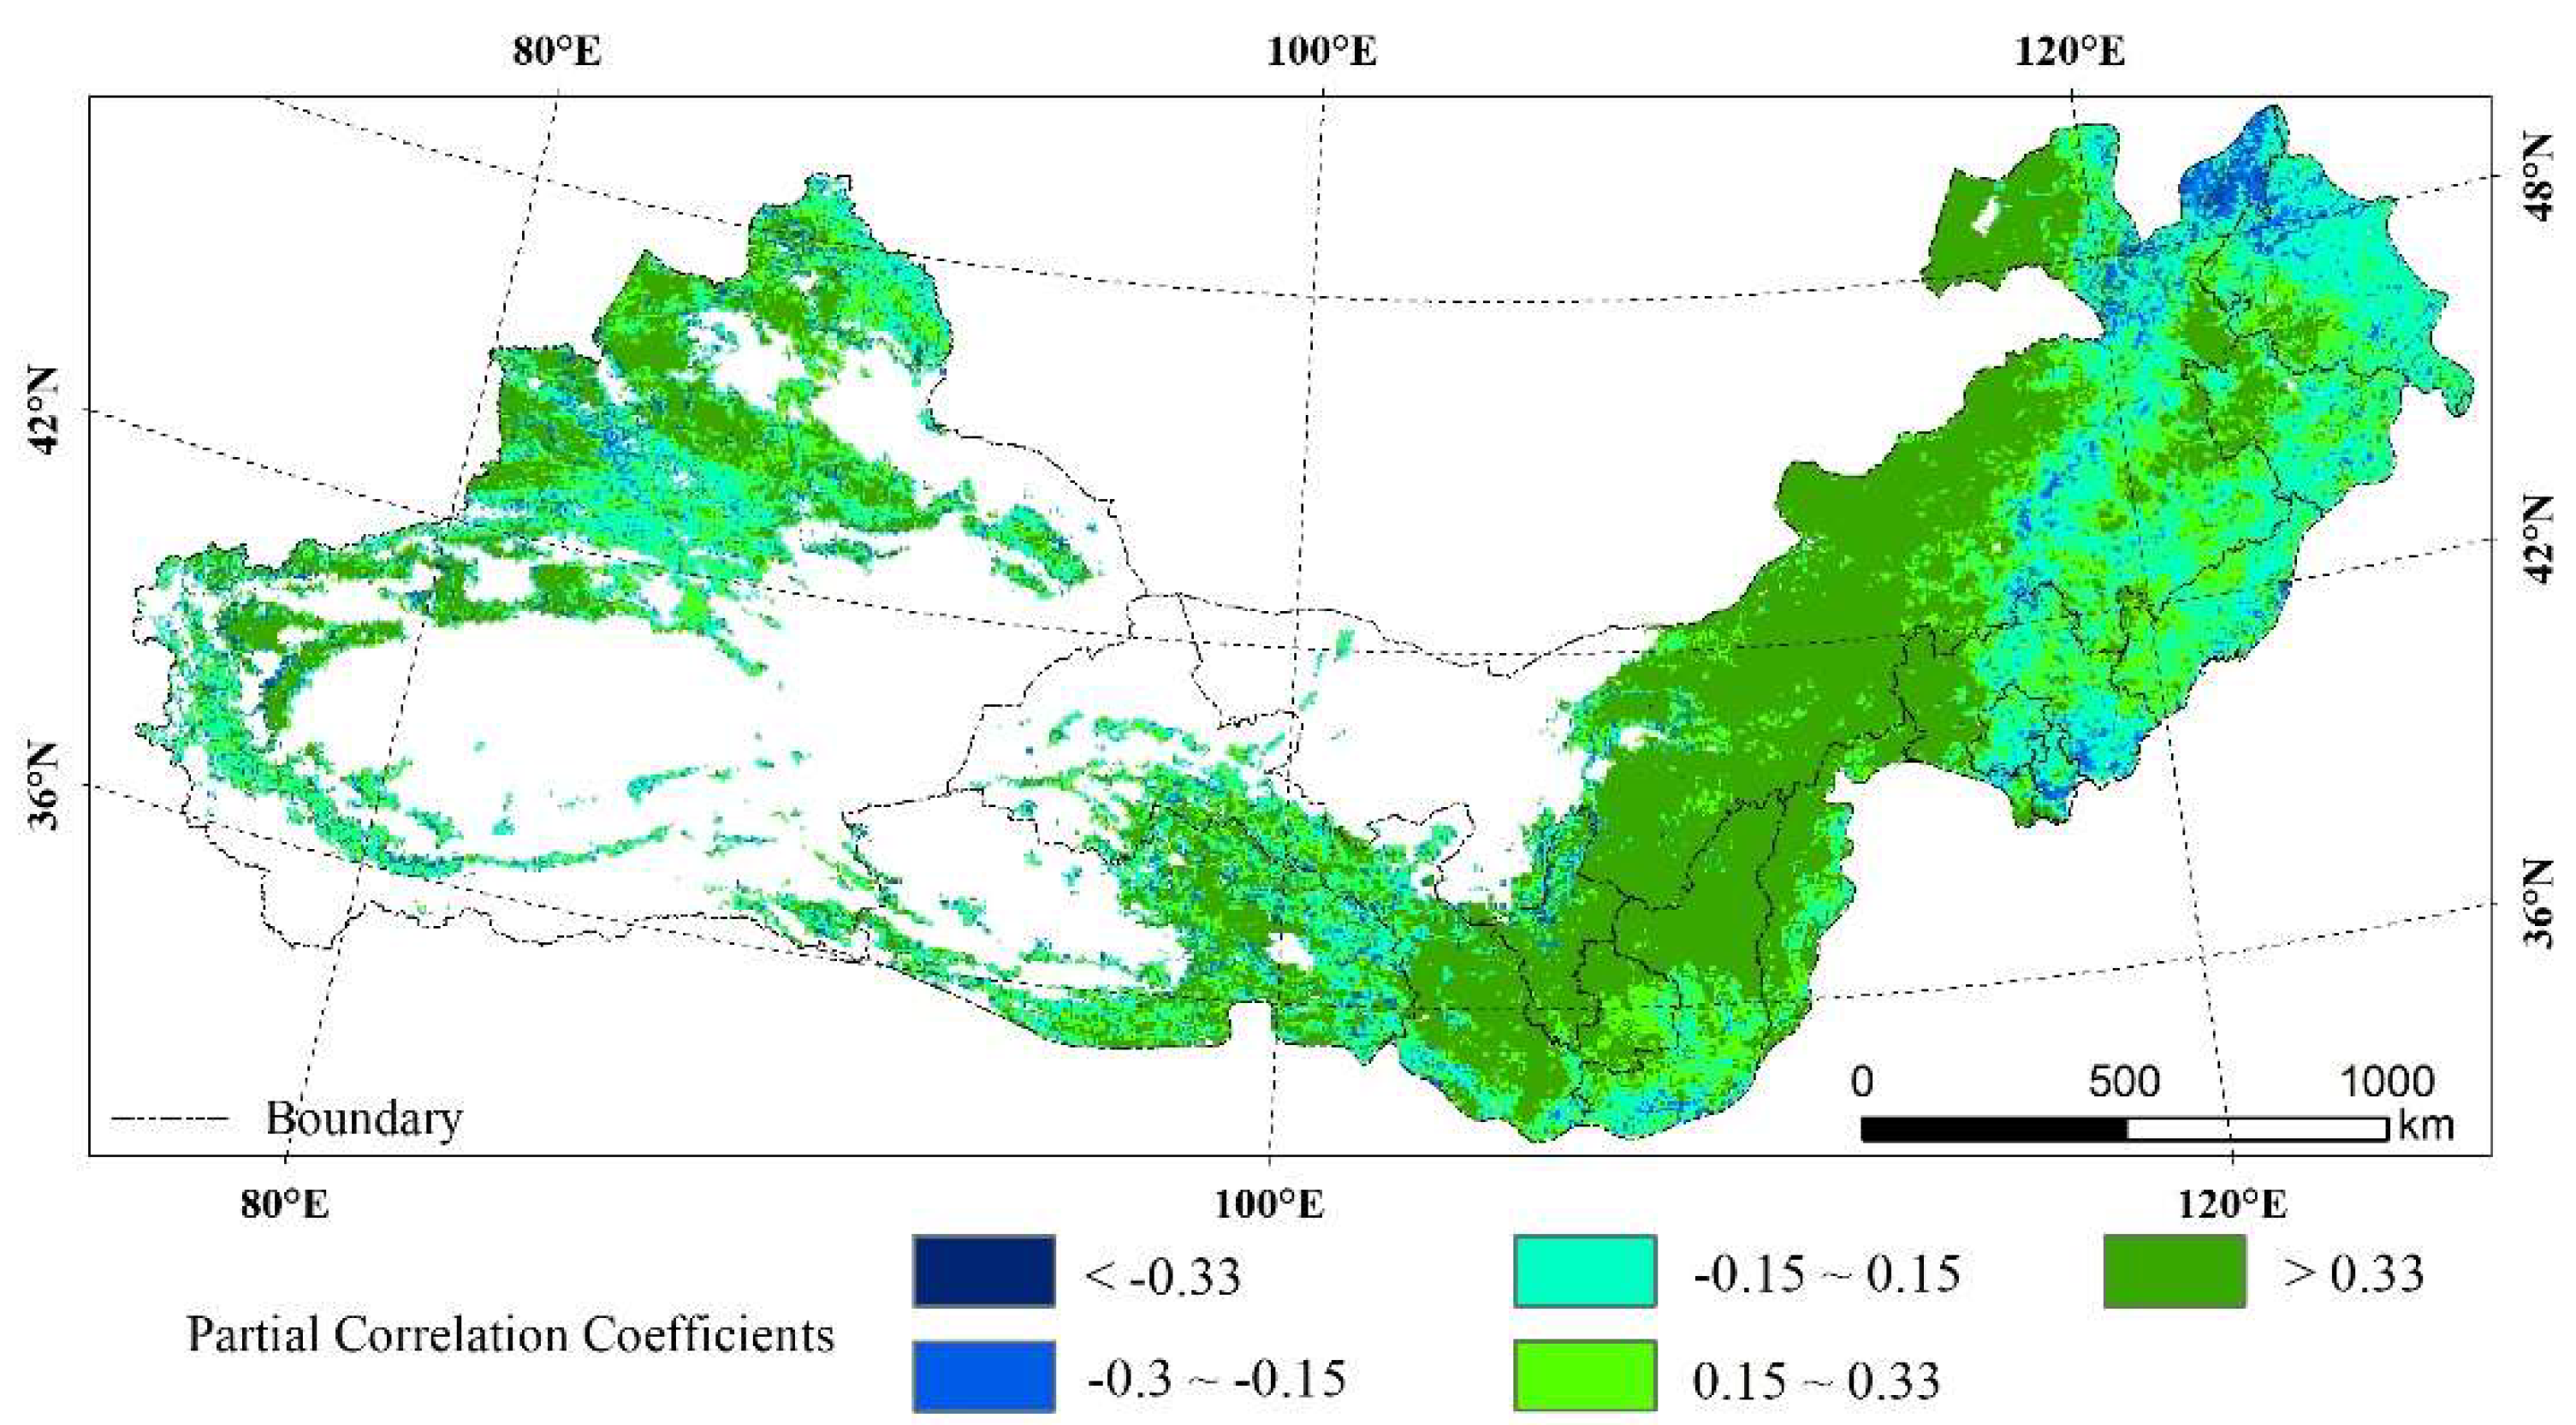
3.3. Response of FVC to Climate Change
4. Discussion
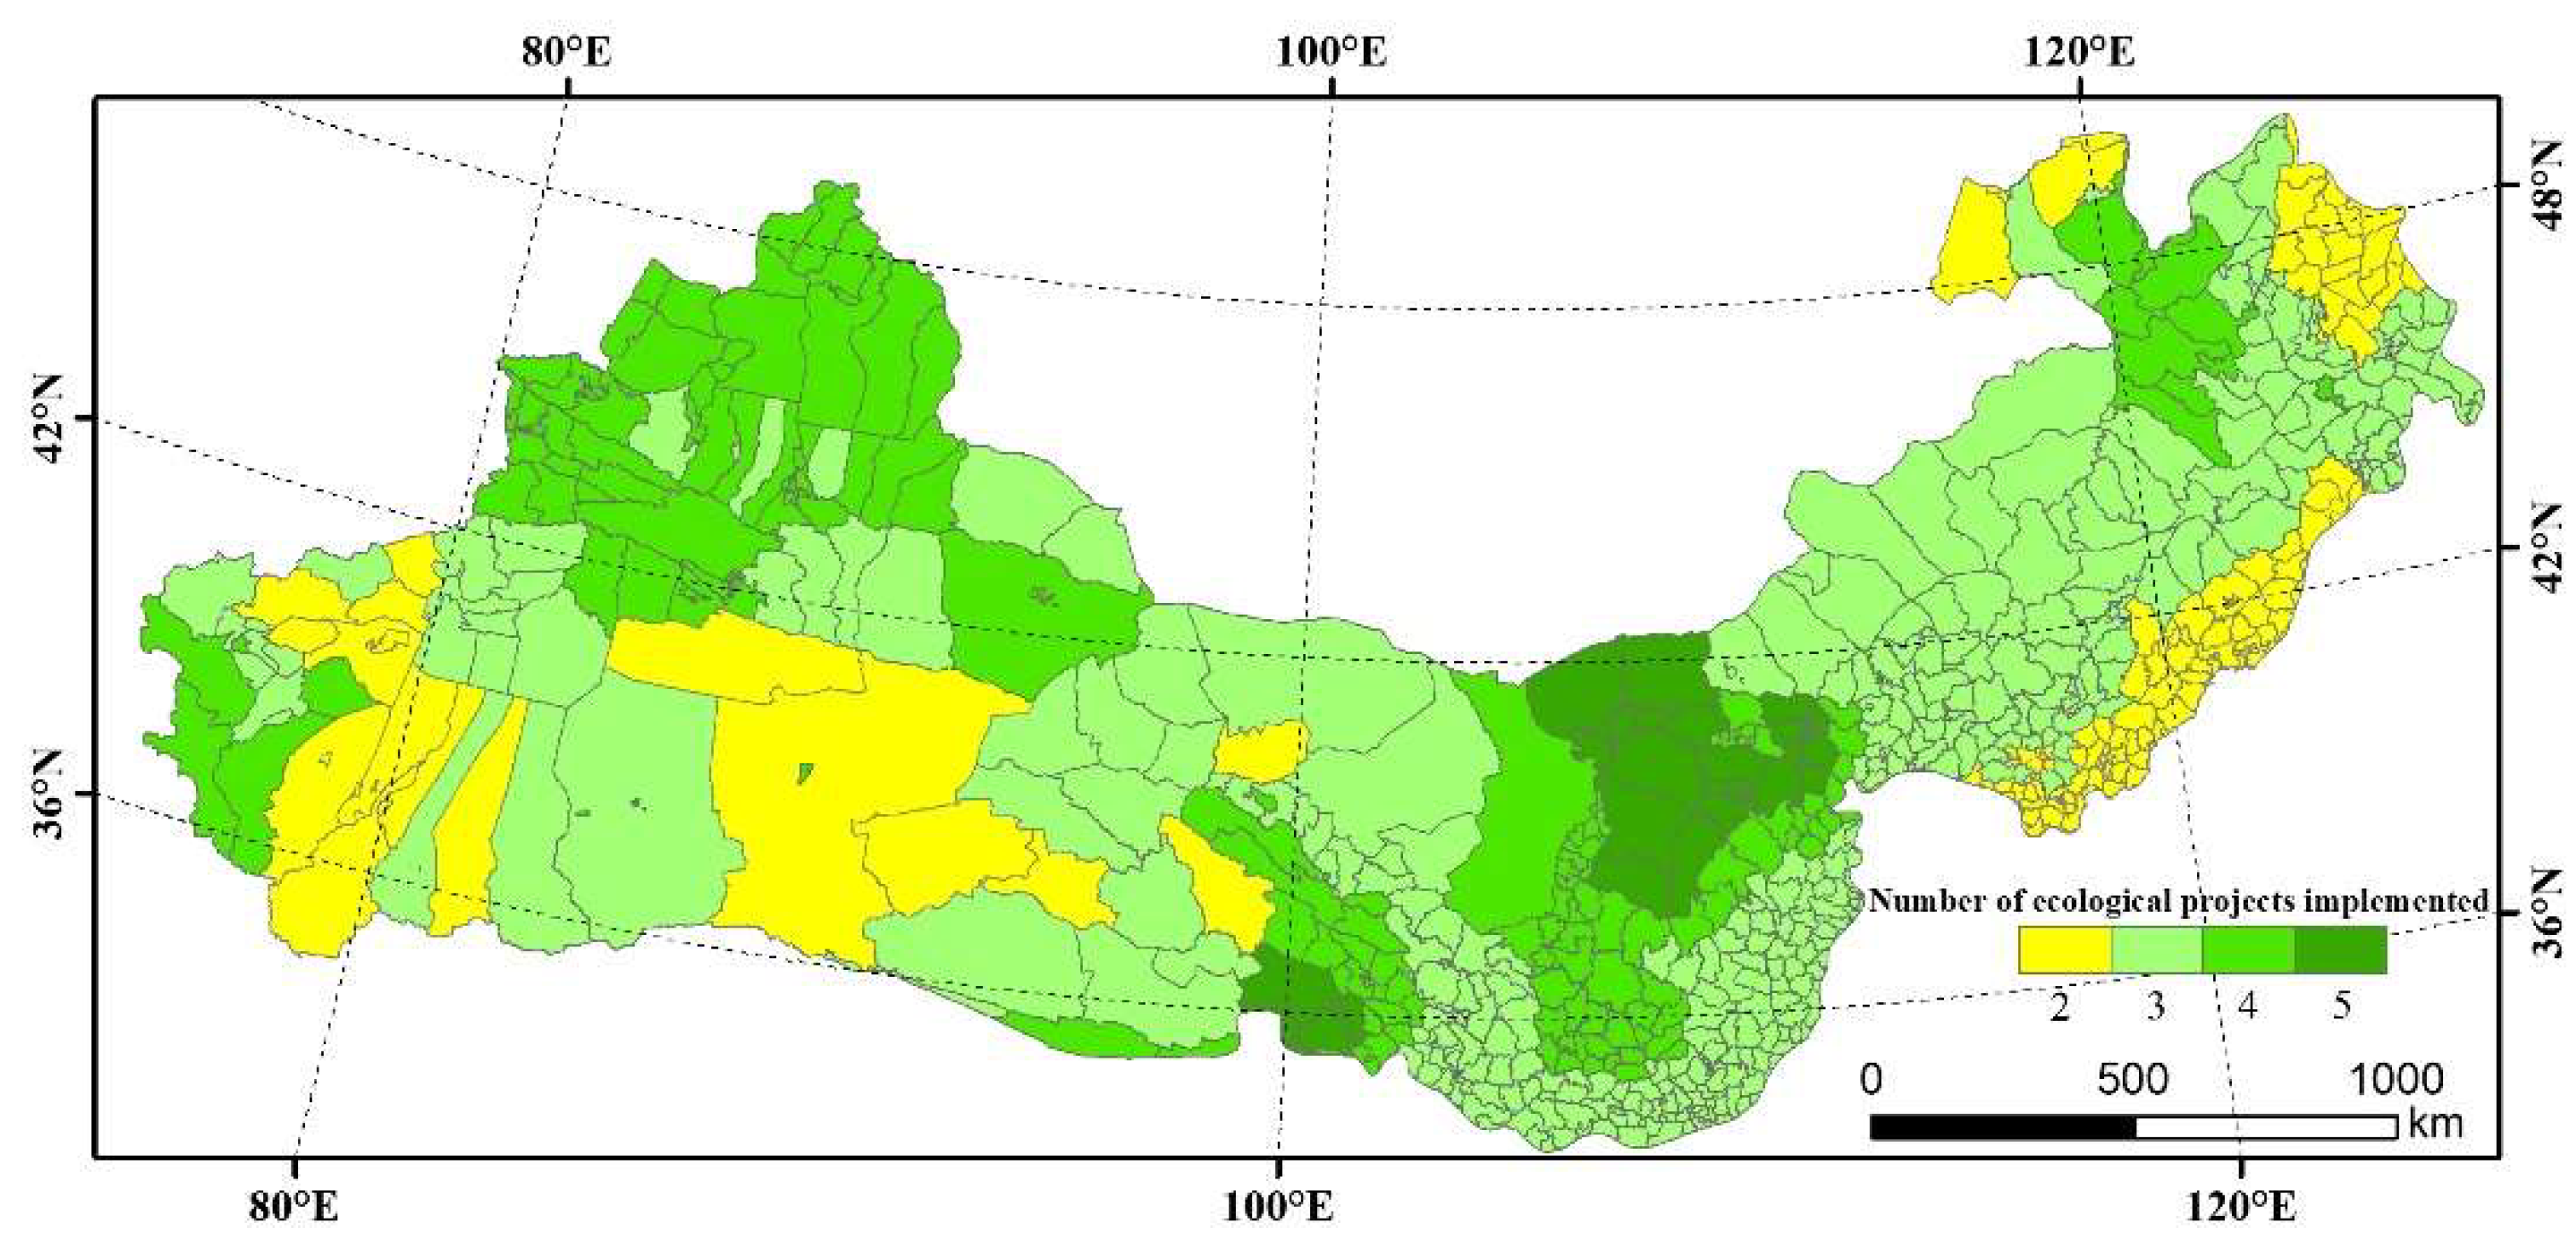
4.1. Implementation Effect of Ecological Governance
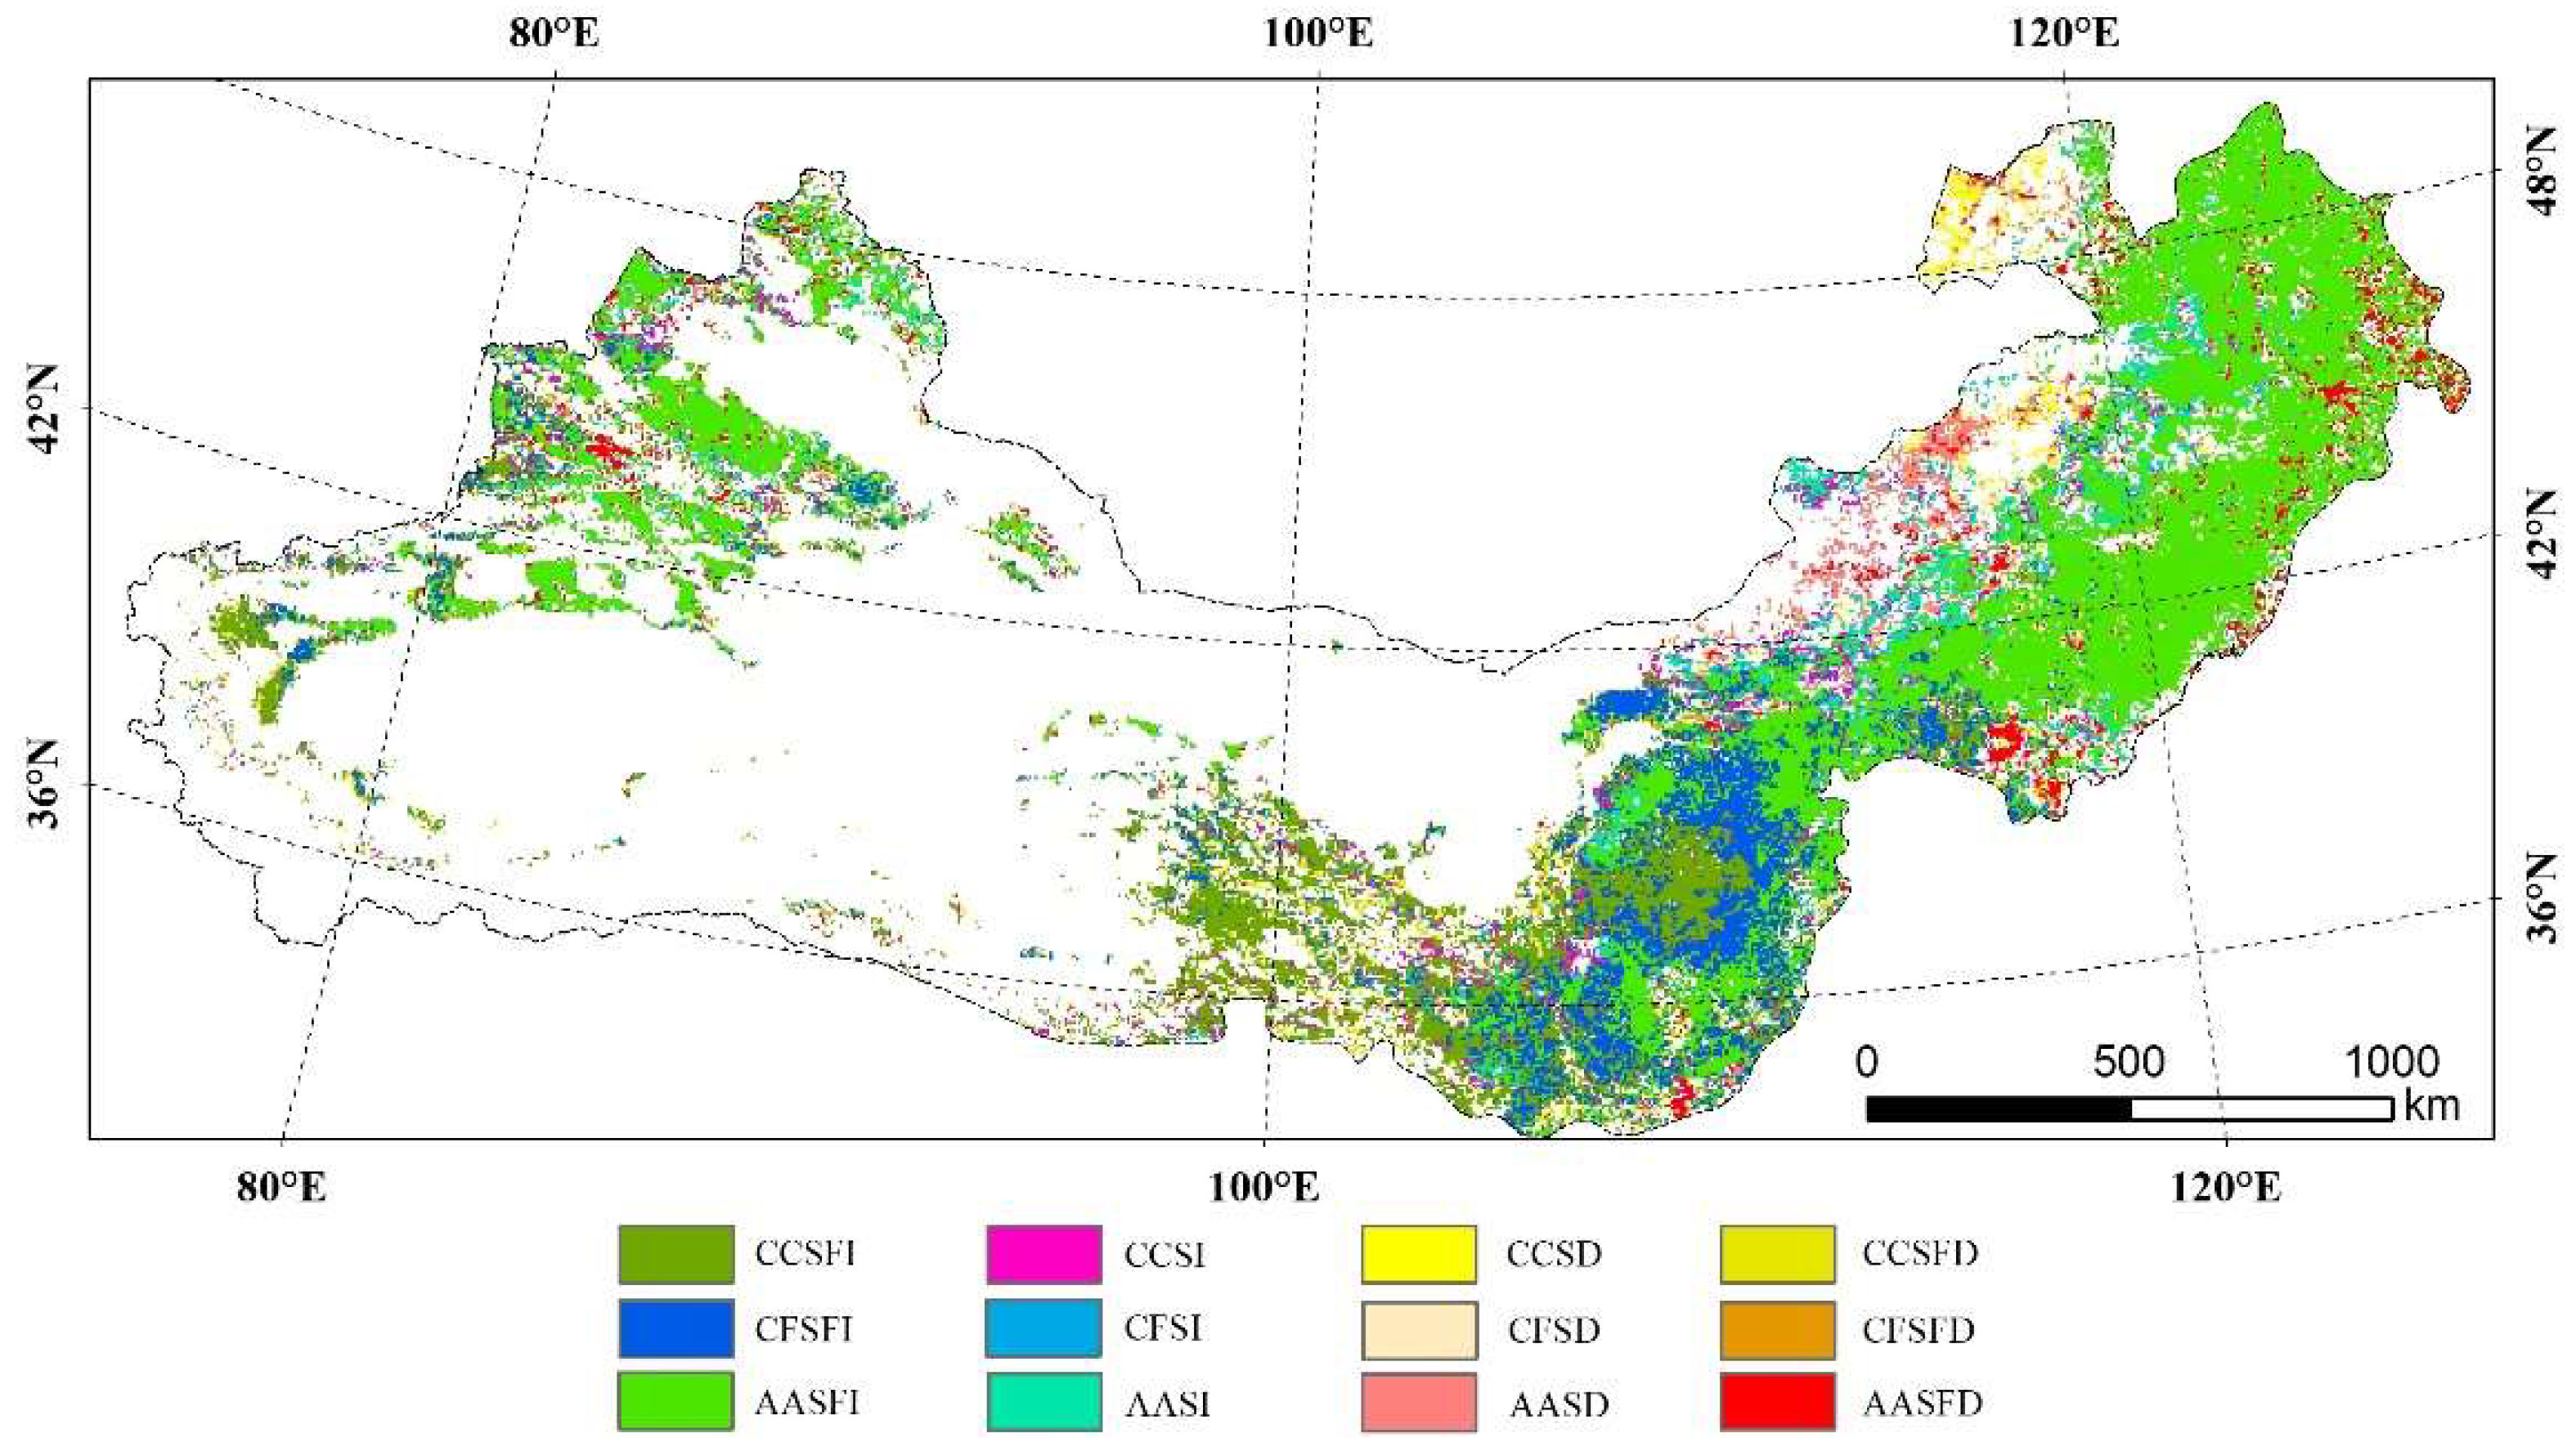
4.2. FVC Variation Drives Quantitative Analysis and Spatial Differences
5. Conclusions
Author Contributions
Funding
Data Availability Statement
Conflicts of Interest
References
- Gerten, D.; Schaphoff, S.; Haberlandt, U.; Lucht, W.; Sitch, S. Terrestrial Vegetation and Water Balance—Hydrological Evaluation of a Dynamic Global Vegetation Model. J. Hydrol. 2004, 286, 249–270. [Google Scholar] [CrossRef]
- Ahlström, A.; Xia, J.; Arneth, A.; Luo, Y.; Smith, B. Erratum: Importance of Vegetation Dynamics for Future Terrestrial Carbon Cycling. Environ. Res. Lett. 2015, 10, 054019. [Google Scholar] [CrossRef]
- Duveiller, G.; Hooker, J.; Cescatti, A. The Mark of Vegetation Change on Earth’s Surface Energy Balance. Nat. Commun. 2018, 9, 679. [Google Scholar] [CrossRef] [PubMed] [Green Version]
- Cai, Y.; Zhang, F.; Duan, P.; Yung Jim, C.; Weng Chan, N.; Shi, J.; Liu, C.; Wang, J.; Bahtebay, J.; Ma, X. Vegetation Cover Changes in China Induced by Ecological Restoration-Protection Projects and Land-Use Changes from 2000 to 2020. CATENA 2022, 217, 106530. [Google Scholar] [CrossRef]
- Jiang, L.; Jiapaer, G.; Bao, A.; Guo, H.; Ndayisaba, F. Vegetation Dynamics and Responses to Climate Change and Human Activities in Central Asia. Sci. Total Environ. 2017, 599–600, 967–980. [Google Scholar] [CrossRef]
- Jiang, W.; Yuan, L.; Wang, W.; Cao, R.; Zhang, Y.; Shen, W. Spatio-Temporal Analysis of Vegetation Variation in the Yellow River Basin. Ecol. Indic. 2015, 51, 117–126. [Google Scholar] [CrossRef]
- Hu, Y.; Li, H.; Wu, D.; Chen, W.; Zhao, X.; Hou, M.; Li, A.; Zhu, Y. LAI-Indicated Vegetation Dynamic in Ecologically Fragile Region: A Case Study in the Three-North Shelter Forest Program Region of China. Ecol. Indic. 2021, 120, 106932. [Google Scholar] [CrossRef]
- Chen, C.; Park, T.; Wang, X.; Piao, S.; Xu, B.; Chaturvedi, R.K.; Fuchs, R.; Brovkin, V.; Ciais, P.; Fensholt, R.; et al. China and India Lead in Greening of the World through Land-Use Management. Nat. Sustain. 2019, 2, 122–129. [Google Scholar] [CrossRef] [PubMed]
- He, B.; Chen, A.; Wang, H.; Wang, Q. Dynamic Response of Satellite-Derived Vegetation Growth to Climate Change in the Three North Shelter Forest Region in China. Remote Sens. 2015, 7, 9998–10016. [Google Scholar] [CrossRef] [Green Version]
- Liu, X.; Xin, L. China’s Deserts Greening and Response to Climate Variability and Human Activities. PLoS ONE 2021, 16, e0256462. [Google Scholar] [CrossRef]
- Li, H.; Xu, F.; Li, Z.; You, N.; Zhou, H.; Zhou, Y.; Chen, B.; Qin, Y.; Xiao, X.; Dong, J. Forest Changes by Precipitation Zones in Northern China after the Three-North Shelterbelt Forest Program in China. Remote Sens. 2021, 13, 543. [Google Scholar] [CrossRef]
- Song, W.; Feng, Y.; Wang, Z. Ecological Restoration Programs Dominate Vegetation Greening in China. Sci. Total Environ. 2022, 848, 157729. [Google Scholar] [CrossRef] [PubMed]
- Huang, S.; Kong, J. Assessing Land Degradation Dynamics and Distinguishing Human-Induced Changes from Climate Factors in the Three-North Shelter Forest Region of China. ISPRS Int. J. Geo-Inf. 2016, 5, 158. [Google Scholar] [CrossRef] [Green Version]
- Zhang, Y.; Peng, C.; Li, W.; Tian, L.; Zhu, Q.; Chen, H.; Fang, X.; Zhang, G.; Liu, G.; Mu, X.; et al. Multiple Afforestation Programs Accelerate the Greenness in the “Three North” Region of China from 1982 to 2013. Ecol. Indic. 2015, 61, 404–412. [Google Scholar] [CrossRef]
- Gao, H.; Huang, Y. Impacts of the Three-North Shelter Forest Program on the Main Soil Nutrients in Northern Shaanxi China: A Meta-Analysis. For. Ecol. Manag. 2020, 458, 117808. [Google Scholar] [CrossRef]
- Ji, C.; Li, X.; Jia, Y.; Wang, L. Dynamic Assessment of Soil Water Erosion in the Three-North Shelter Forest Region of China from 1980 to 2015. Eurasian Soil Sci. 2018, 51, 1533–1546. [Google Scholar] [CrossRef]
- Sun, R.; Chen, S.; Su, H. Climate Dynamics of the Spatiotemporal Changes of Vegetation Ndvi in Northern China from 1982 to 2015. Remote Sens. 2021, 13, 187. [Google Scholar] [CrossRef]
- Ding, M.J.; Zhang, Y.L.; Sun, X.M.; Liu, L.S.; Wang, Z.F.; Bai, W.Q. Spatiotemporal Variation in Alpine Grassland Phenology in the Qinghai-Tibetan Plateau from 1999 to 2009. Chin. Sci. Bull. 2013, 58, 396–405. [Google Scholar] [CrossRef] [Green Version]
- Tong, S.; Zhang, J.; Ha, S.; Lai, Q.; Ma, Q. Dynamics of Fractional Vegetation Coverage and Its Relationship with Climate and Human Activities in Inner Mongolia, China. Remote Sens. 2016, 8, 776. [Google Scholar] [CrossRef] [Green Version]
- Ukkola, A.M.; De Kauwe, M.G.; Roderick, M.L.; Burrell, A.; Lehmann, P.; Pitman, A.J. Annual Precipitation Explains Variability in Dryland Vegetation Greenness Globally but Not Locally. Glob. Chang. Biol. 2021, 27, 4367–4380. [Google Scholar] [CrossRef]
- Li, X.; Zhang, X.; Xu, X. Precipitation and Anthropogenic Activities Jointly Green the China–Mongolia–Russia Economic Corridor. Remote Sens. 2022, 14, 187. [Google Scholar] [CrossRef]
- Liu, C.; Zhang, X.; Wang, T.; Chen, G.; Zhu, K.; Wang, Q.; Wang, J. Detection of Vegetation Coverage Changes in the Yellow River Basin from 2003 to 2020. Ecol. Indic. 2022, 138, 108818. [Google Scholar] [CrossRef]
- Niu, Q.; Xiao, X.; Zhang, Y.; Qin, Y.; Dang, X.; Wang, J.; Zou, Z.; Doughty, R.B.; Brandt, M.; Tong, X.; et al. Ecological Engineering Projects Increased Vegetation Cover, Production, and Biomass in Semiarid and Subhumid Northern China. Land Degrad. Dev. 2019, 30, 1620–1631. [Google Scholar] [CrossRef] [Green Version]
- Jia, K.; Yang, L.; Liang, S.; Xiao, Z.; Zhao, X.; Yao, Y.; Zhang, X.; Jiang, B.; Liu, D. Long-Term Global Land Surface Satellite (GLASS) Fractional Vegetation Cover Product Derived From MODIS and AVHRR Data. IEEE J. Sel. Top. Appl. Earth Obs. Remote Sens. 2019, 12, 508–518. [Google Scholar] [CrossRef]
- Zhang, X.; Liu, L.; Zhang, Z.; Kang, Z.; Tian, H.; Wang, T.; Chen, H. Spatial and Temporal Variation Characteristics of Glacier Resources in Xinjiang over the Past 50 Years. Water 2022, 14, 1057. [Google Scholar] [CrossRef]
- He, D.; Yi, G.; Zhang, T.; Miao, J.; Li, J.; Bie, X. Temporal and Spatial Characteristics of EVI and Its Response to Climatic Factors in Recent 16 Years Based on Grey Relational Analysis in Inner Mongolia Autonomous Region, China. Remote Sens. 2018, 10, 961. [Google Scholar] [CrossRef] [Green Version]
- Xu, Y.; Zhao, P.; Si, D.; Cao, L.; Wu, X.; Zhao, Y.; Liu, N. Development and Preliminary Application of a Gridded Surface Air Temperature Homogenized Dataset for China. Theor. Appl. Climatol. 2020, 139, 505–516. [Google Scholar] [CrossRef] [Green Version]
- Luo, H.; Bie, X.; Yi, G.; Zhou, X.; Zhang, T.; Li, J.; Lai, P. Dominant Impacting Factors on Water-Use Efficiency Variation in Inner Mongolia from 2001 to 2018: Vegetation or Climate? Remote Sens. 2022, 14, 4541. [Google Scholar] [CrossRef]
- Ren, Z.; Tian, Z.; Wei, H.; Liu, Y.; Yu, Y. Spatiotemporal Evolution and Driving Mechanisms of Vegetation in the Yellow River Basin, China during 2000–2020. Ecol. Indic. 2022, 138, 108832. [Google Scholar] [CrossRef]
- Yuan, J.; Xu, Y.; Xiang, J.; Wu, L.; Wang, D. Spatiotemporal Variation of Vegetation Coverage and Its Associated Influence Factor Analysis in the Yangtze River Delta, Eastern China. Environ. Sci. Pollut. Res. 2019, 26, 32866–32879. [Google Scholar] [CrossRef]
- Koutsoyiannis, D. Climate Change, the Hurst Phenomenon, and Hydrological Statistics. Hydrol. Sci. J. 2003, 48, 3–24. [Google Scholar] [CrossRef]
- Li, S.; Wang, J.; Zhang, M.; Tang, Q. Characterizing and Attributing the Vegetation Coverage Changes in North Shanxi Coal Base of China from 1987 to 2020. Resour. Policy 2021, 74, 102331. [Google Scholar] [CrossRef]
- Sun, Y.L.; Shan, M.; Pei, X.R.; Zhang, X.K.; Yang, Y.L. Assessment of the Impacts of Climate Change and Human Activities on Vegetation Cover Change in the Haihe River Basin, China. Phys. Chem. Earth 2020, 115, 102834. [Google Scholar] [CrossRef]
- Chu, H.; Venevsky, S.; Wu, C.; Wang, M. NDVI-Based Vegetation Dynamics and Its Response to Climate Changes at Amur-Heilongjiang River Basin from 1982 to 2015. Sci. Total Environ. 2019, 650, 2051–2062. [Google Scholar] [CrossRef]
- Jiao, J.; Zhang, Z.; Bai, W.; Jia, Y.; Wang, N. Assessing the Ecological Success of Restoration by Afforestation on the Chinese Loess Plateau. Restor. Ecol. 2012, 20, 240–249. [Google Scholar] [CrossRef]
- Zhai, J.; Wang, L.; Liu, Y.; Wang, C.; Mao, X. Assessing the Effects of China’s Three-North Shelter Forest Program over 40 Years. Sci. Total Environ. 2023, 857, 159354. [Google Scholar] [CrossRef]
- Zhao, Y.; Chi, W.; Kuang, W.; Bao, Y.; Ding, G. Ecological and Environmental Consequences of Ecological Projects in the Beijing–Tianjin Sand Source Region. Ecol. Indic. 2020, 112, 106111. [Google Scholar] [CrossRef]
- Zhai, X.; Liang, X.; Yan, C.; Xing, X.; Jia, H.; Wei, X.; Feng, K. Vegetation Dynamic Changes and Their Response to Ecological Engineering in the Sanjiangyuan Region of China. Remote Sens. 2020, 12, 4035. [Google Scholar] [CrossRef]
- Yuan-jie, D.; Shun-bo, Y.; Meng-yang, H.; Tong-yue, Z.; Ya-nan, L.; Zhi-wen, G.; Yi-fei, W. Assessing the Effects of the Green for Grain Program on Ecosystem Carbon Storage Service by Linking the InVEST and FLUS Models: A Case Study of Zichang County in Hilly and Gully Region of Loess Plateau. J. Nat. Resour. 2020, 35, 826. [Google Scholar] [CrossRef]
- Shao, Q.; Liu, S.; Ning, J.; Liu, G.; Yang, F.; Zhang, X.; Niu, L.; Huang, H.; Fan, J.; Liu, J. Assessment of Ecological Benefits of Key National Ecological Projects in China in 2000–2019 Using Remote Sensing. Acta Geogr. Sin. 2022, 77, 2133–2153. [Google Scholar] [CrossRef]
- Zhu, J.J.; Zheng, X. The Prospects of Development of the Three-North Afforestation Program (TNAP): On the Basis of the Results of the 40-Year Construction General Assessment of the TNAP. Chin. J. Ecol. 2019, 38, 1600–1610. [Google Scholar]
- Xue, J.; Wang, Y.; Teng, H.; Wang, N.; Li, D.; Peng, J.; Biswas, A.; Shi, Z. Dynamics of Vegetation Greenness and Its Response to Climate Change in Xinjiang over the Past Two Decades. Remote Sens. 2021, 13, 4063. [Google Scholar] [CrossRef]
- Shen, Y.J.; Shen, Y.; Guo, Y.; Zhang, Y.; Pei, H.; Brenning, A. Review of Historical and Projected Future Climatic and Hydrological Changes in Mountainous Semiarid Xinjiang (Northwestern China), Central Asia. Catena 2020, 187, 104343. [Google Scholar] [CrossRef]
- Yao, J.; Mao, W.; Chen, J.; Dilinuer, T. Recent Signal and Impact of Wet-to-Dry Climatic Shift in Xinjiang, China. J. Geogr. Sci. 2021, 31, 1283–1298. [Google Scholar] [CrossRef]
- Yu, H.; Bian, Z.; Mu, S.; Yuan, J.; Chen, F. Effects of Climate Change on Land Cover Change and Vegetation Dynamics in Xinjiang, China. Int. J. Environ. Res. Public Health 2020, 17, 4865. [Google Scholar] [CrossRef]
- Li, Z.; Ma, W.; Liang, C.; Liu, Z.; Wang, W.; Wang, L. Long-Term Vegetation Dynamics Driven by Climatic Variations in the Inner Mongolia Grassland: Findings from 30-Year Monitoring. Landsc. Ecol. 2015, 30, 1701–1711. [Google Scholar] [CrossRef]
- Li, C.; Wang, J.; Hu, R.; Yin, S.; Bao, Y.; Ayal, D.Y. Relationship between Vegetation Change and Extreme Climate Indices on the Inner Mongolia Plateau, China, from 1982 to 2013. Ecol. Indic. 2018, 89, 101–109. [Google Scholar] [CrossRef]
- Guo, C.; Zhao, D.; Zheng, D.; Zhu, Y. Effects of Grazing on the Grassland Vegetation Community Characteristics in Inner Mongolia. J. Resour. Ecol. 2021, 12, 319–331. [Google Scholar] [CrossRef]
- Li, M.Y.; Fang, L.D.; Duan, C.Y.; Cao, Y.; Yin, H.; Ning, Q.R.; Hao, G.Y. Greater Risk of Hydraulic Failure Due to Increased Drought Threatens Pine Plantations in Horqin Sandy Land of Northern China. For. Ecol. Manag. 2020, 461, 117980. [Google Scholar] [CrossRef]
- Jiang, C.; Liu, J.; Zhang, H.; Zhang, Z.; Wang, D. China ’s Progress towards Sustainable Land Degradation Control: Insights from the Northwest Arid Regions. Ecol. Eng. 2019, 127, 75–87. [Google Scholar] [CrossRef]
- Zhao, R.; Liu, X.; Dong, J.; Zhao, G.; Manevski, K.; Andersen, M.N.; Tang, Q. Human Activities Modulate Greening Patterns: A Case Study for Southern Xinjiang in China Based on Long Time Series Analysis. Environ. Res. Lett. 2022, 17, 044012. [Google Scholar] [CrossRef]


| Spatial Pattern Types | Two Programs | Three Programs | Four Programs | Five Programs |
|---|---|---|---|---|
| CCSFD | 2.07% | 1.50% | 2.45% | 1.84% |
| CFSFD | 0.75% | 0.51% | 0.71% | 0.78% |
| AASFD | 6.67% | 4.70% | 4.28% | 0.52% |
| CCSD | 4.74% | 2.41% | 1.06% | 0.80% |
| CFSD | 1.07% | 0.92% | 0.36% | 0.33% |
| AASD | 1.99% | 5.26% | 2.30% | 0.97% |
| AASI | 2.82% | 7.24% | 7.00% | 4.84% |
| CFSI | 0.59% | 1.38% | 1.46% | 1.18% |
| CCSI | 1.26% | 3.88% | 5.02% | 3.85% |
| AASFI | 63.55% | 47.99% | 41.75% | 29.57% |
| CFSFI | 4.57% | 10.88% | 14.30% | 29.33% |
| CCSFI | 9.92% | 13.32% | 19.32% | 26.00% |
| Types of Driving Factors | Proportion (%) | Types of Driving Factors | Proportion (%) |
|---|---|---|---|
| Climate Change-lnduced Significant Increase (CCSFI) | 15.58 | Climate Change-Induced Significant Decrease (CCSFD) | 1.88 |
| Comprehensive Factor-Induced Significant Increase (CFSFI) | 12.47 | Comprehensive Factor-Induced Significant Decrease (CFSFD) | 0.62 |
| Anthropogenic Activity-Induced Significant Increase (AASFI) | 46.81 | Anthropogenic Activity-Induced Significant Decrease (AASFD) | 4.53 |
| Climate Change-lnduced Slight Increase (CCSI) | 3.85 | Climate Change-Induced Slight Decrease (CCSD) | 2.20 |
| Comprehensive Factor-Induced Slight Increase (CFSI) | 1.29 | Comprehensive Factor-Induced Slight Decrease (CFSD) | 0.73 |
| Anthropogenic Activity-Induced Slight Increase (AASI) | 6.40 | Anthropogenic Activity-Induced Slight Decrease (AASD) | 3.64 |
Disclaimer/Publisher’s Note: The statements, opinions and data contained in all publications are solely those of the individual author(s) and contributor(s) and not of MDPI and/or the editor(s). MDPI and/or the editor(s) disclaim responsibility for any injury to people or property resulting from any ideas, methods, instructions or products referred to in the content. |
© 2023 by the authors. Licensee MDPI, Basel, Switzerland. This article is an open access article distributed under the terms and conditions of the Creative Commons Attribution (CC BY) license (https://creativecommons.org/licenses/by/4.0/).
Share and Cite
Li, M.; Qin, Y.; Zhang, T.; Zhou, X.; Yi, G.; Bie, X.; Li, J.; Gao, Y. Climate Change and Anthropogenic Activity Co-Driven Vegetation Coverage Increase in the Three-North Shelter Forest Region of China. Remote Sens. 2023, 15, 1509. https://doi.org/10.3390/rs15061509
Li M, Qin Y, Zhang T, Zhou X, Yi G, Bie X, Li J, Gao Y. Climate Change and Anthropogenic Activity Co-Driven Vegetation Coverage Increase in the Three-North Shelter Forest Region of China. Remote Sensing. 2023; 15(6):1509. https://doi.org/10.3390/rs15061509
Chicago/Turabian StyleLi, Menglin, Yanbin Qin, Tingbin Zhang, Xiaobing Zhou, Guihua Yi, Xiaojuan Bie, Jingji Li, and Yibo Gao. 2023. "Climate Change and Anthropogenic Activity Co-Driven Vegetation Coverage Increase in the Three-North Shelter Forest Region of China" Remote Sensing 15, no. 6: 1509. https://doi.org/10.3390/rs15061509