Article

Spatial and Temporal Evolution Characteristics of the Salween River Delta from 1973 to 2021

1
Institute of International Rivers and Eco-Security, Yunnan University, Kunming 650500, China
2
School of Engineering, Yunnan University, Kunming 650500, China
3
School of Earth Sciences, Yunnan University, Kunming 650500, China
*
Author to whom correspondence should be addressed.
Remote Sens. 2023, 15(5), 1467; https://doi.org/10.3390/rs15051467
Submission received: 9 February 2023 / Revised: 3 March 2023 / Accepted: 4 March 2023 / Published: 6 March 2023
(This article belongs to the Special Issue Earth Observation of Study on Coastal Geomorphic Evolution)

Abstract

:
We obtained sixteen clear-sky remote sensing images of Landsat series data from 1973 to 2021 and extracted continental and island coastlines of the Salween River Delta based on the Modified Normalized Difference Water Index (MNDWI) and visual interpretation correction. We determined the overall evolution of coastlines with statistical and superposition analysis and applied the Digital Shoreline Analysis System (DSAS) to summarize the spatial and temporal evolution process and characteristics in the past 50 years. Experimental results show that (1) the overall change of the coastline was more rapid on the island than on the continent, and on the Indian Ocean side than on the continental side, (2) the total area of the island increased by 91.16 km2 from 1973 to 2021, the area of Bilu Island increased by 50.38 km2, the length of the continental coastline decreased by 0.39 km, and the length of the coastline of the Bilu Island increased by 6.43 km, (3) the Linear Regression Rate (LRR) were: 4.69 m/yr for the total coastline, 1.06 and −2.07 m/yr, respectively, for the western and southern branches of the continental coastline, and 0.83 and 21.52 m/yr, respectively, for the continental and Indian Ocean sides of Bilu Island, and (4) the dominant process in the Salween River Delta was accretion, with an overall accretion area of about 10 km2, and an unstable accretion rate.

Graphical Abstract

1. Introduction

River deltas are zones where land, ocean, and atmosphere interact. Their morphologies are constantly changing under the multiple effects of natural and human factors. They are important channels that maintain a material balance between land and sea, and areas of frequent and intense human activities [1,2]. Human activity is increasing environmental pressures in river deltas, posing a significant threat to biodiversity, marine resources, and shipping [3,4,5]. The Salween River is one of the most important international rivers in Asia and one of the few free-flowing rivers in a densely populated region; it supports a globally diverse and dynamic ecosystem, providing important social and economic services [6]. It has a typical bifurcated estuary and a braided river channel, where the Moulmein was once the largest seaport in Myanmar, supporting the development of the local economy. The Salween River Delta region belongs to the Indian Ocean region, where the amplitude of tidal fluctuations in sea level reaches 5~7 m. In this case, the mechanism of accretion or erosion on marshes and mangrove forests of the delta is determined by the inequality of current velocities during high and low tides. In addition, storm surges have a serious impact on this process. The Indian Ocean region is one of the six major cyclone-prone regions in the world with an annual average of about five to six cyclones, and it experiences a large number of cyclone strikes with a high risk of exposure to storm surge and inundation [7]. Moreover, extreme weather events caused by storm surges can occur at any time and have a significant impact on the coastline [8].
Land-ocean interactions are at the forefront of research on the evolution of river deltas and coastlines [9,10]. Global warming and sea-level rise are expected to result in coastline erosion, while strong monsoon and vegetation degradation in the upper reaches of rivers results in the mobilization of large amounts of sediment eventually deposited in estuaries, expanding coastlines into the sea. Coastlines are instantaneous and dynamic, and theoretically, their outlines cannot be extracted from clear-sky remote sensing images which are static [11]. In practice, indicated coastlines are often used as a substitute, mainly including the average high-tide line, dry-wet boundary, vegetation line, and debris line [12]. It is feasible to use a unified remote sensing image data, and pre-processing and extraction method to obtain a long-term sequence of coastlines and to monitor their dynamic changes [13].
Recent research on the Salween River focused on the upstream areas and included climate change effects, biodiversity protection, and hydropower development [14,15]. Landsat images were widely used in quantitative remote sensing monitoring because of the long archiving time, stable radiation performance, and free access [16]. Other methods used to understand the spatial and temporal evolution of river deltas in the Mekong River, Nile River, Pearl River, and Yellow River [17,18,19,20] included statistical analysis, DSAS, and coastline fractal analysis. These methods allow quantitative analysis of the length and morphology of delta coastlines and increase the understanding of delta evolution and characteristics. Analysis of the evolution of the Salween River coastline with DSAS is valuable. However, the calculation index in DSAS is insufficient, and, while the coastline moving distance and rate can be well-described, coastal erosion, accretion area, and change rates cannot [21,22]. In addition, knowledge of the evolution of the river delta based on remote sensing images is lacking. There is insufficient research on the spatial and temporal evolution of the Salween River Delta based on multi-spectral remote sensing images.
Therefore, we used Landsat clear-sky remote sensing images to determine continental and island coastlines of the Salween River Delta and to explore evolution characteristics with statistical and superposition analyses. Further, we used DSAS to calculate the Linear Regression Rate (LRR), End Point Rate (EPR), Area of Shoreline Change (ASC), and Area Change Rate (ACR) of the continental coastline and Bilu Island. We quantitatively analyzed coastal erosion and accretion in different areas of the Salween River Delta at multiple time scales, focusing on the spatial and temporal evolution characteristics in the past 50 years.

2. Materials and Methods

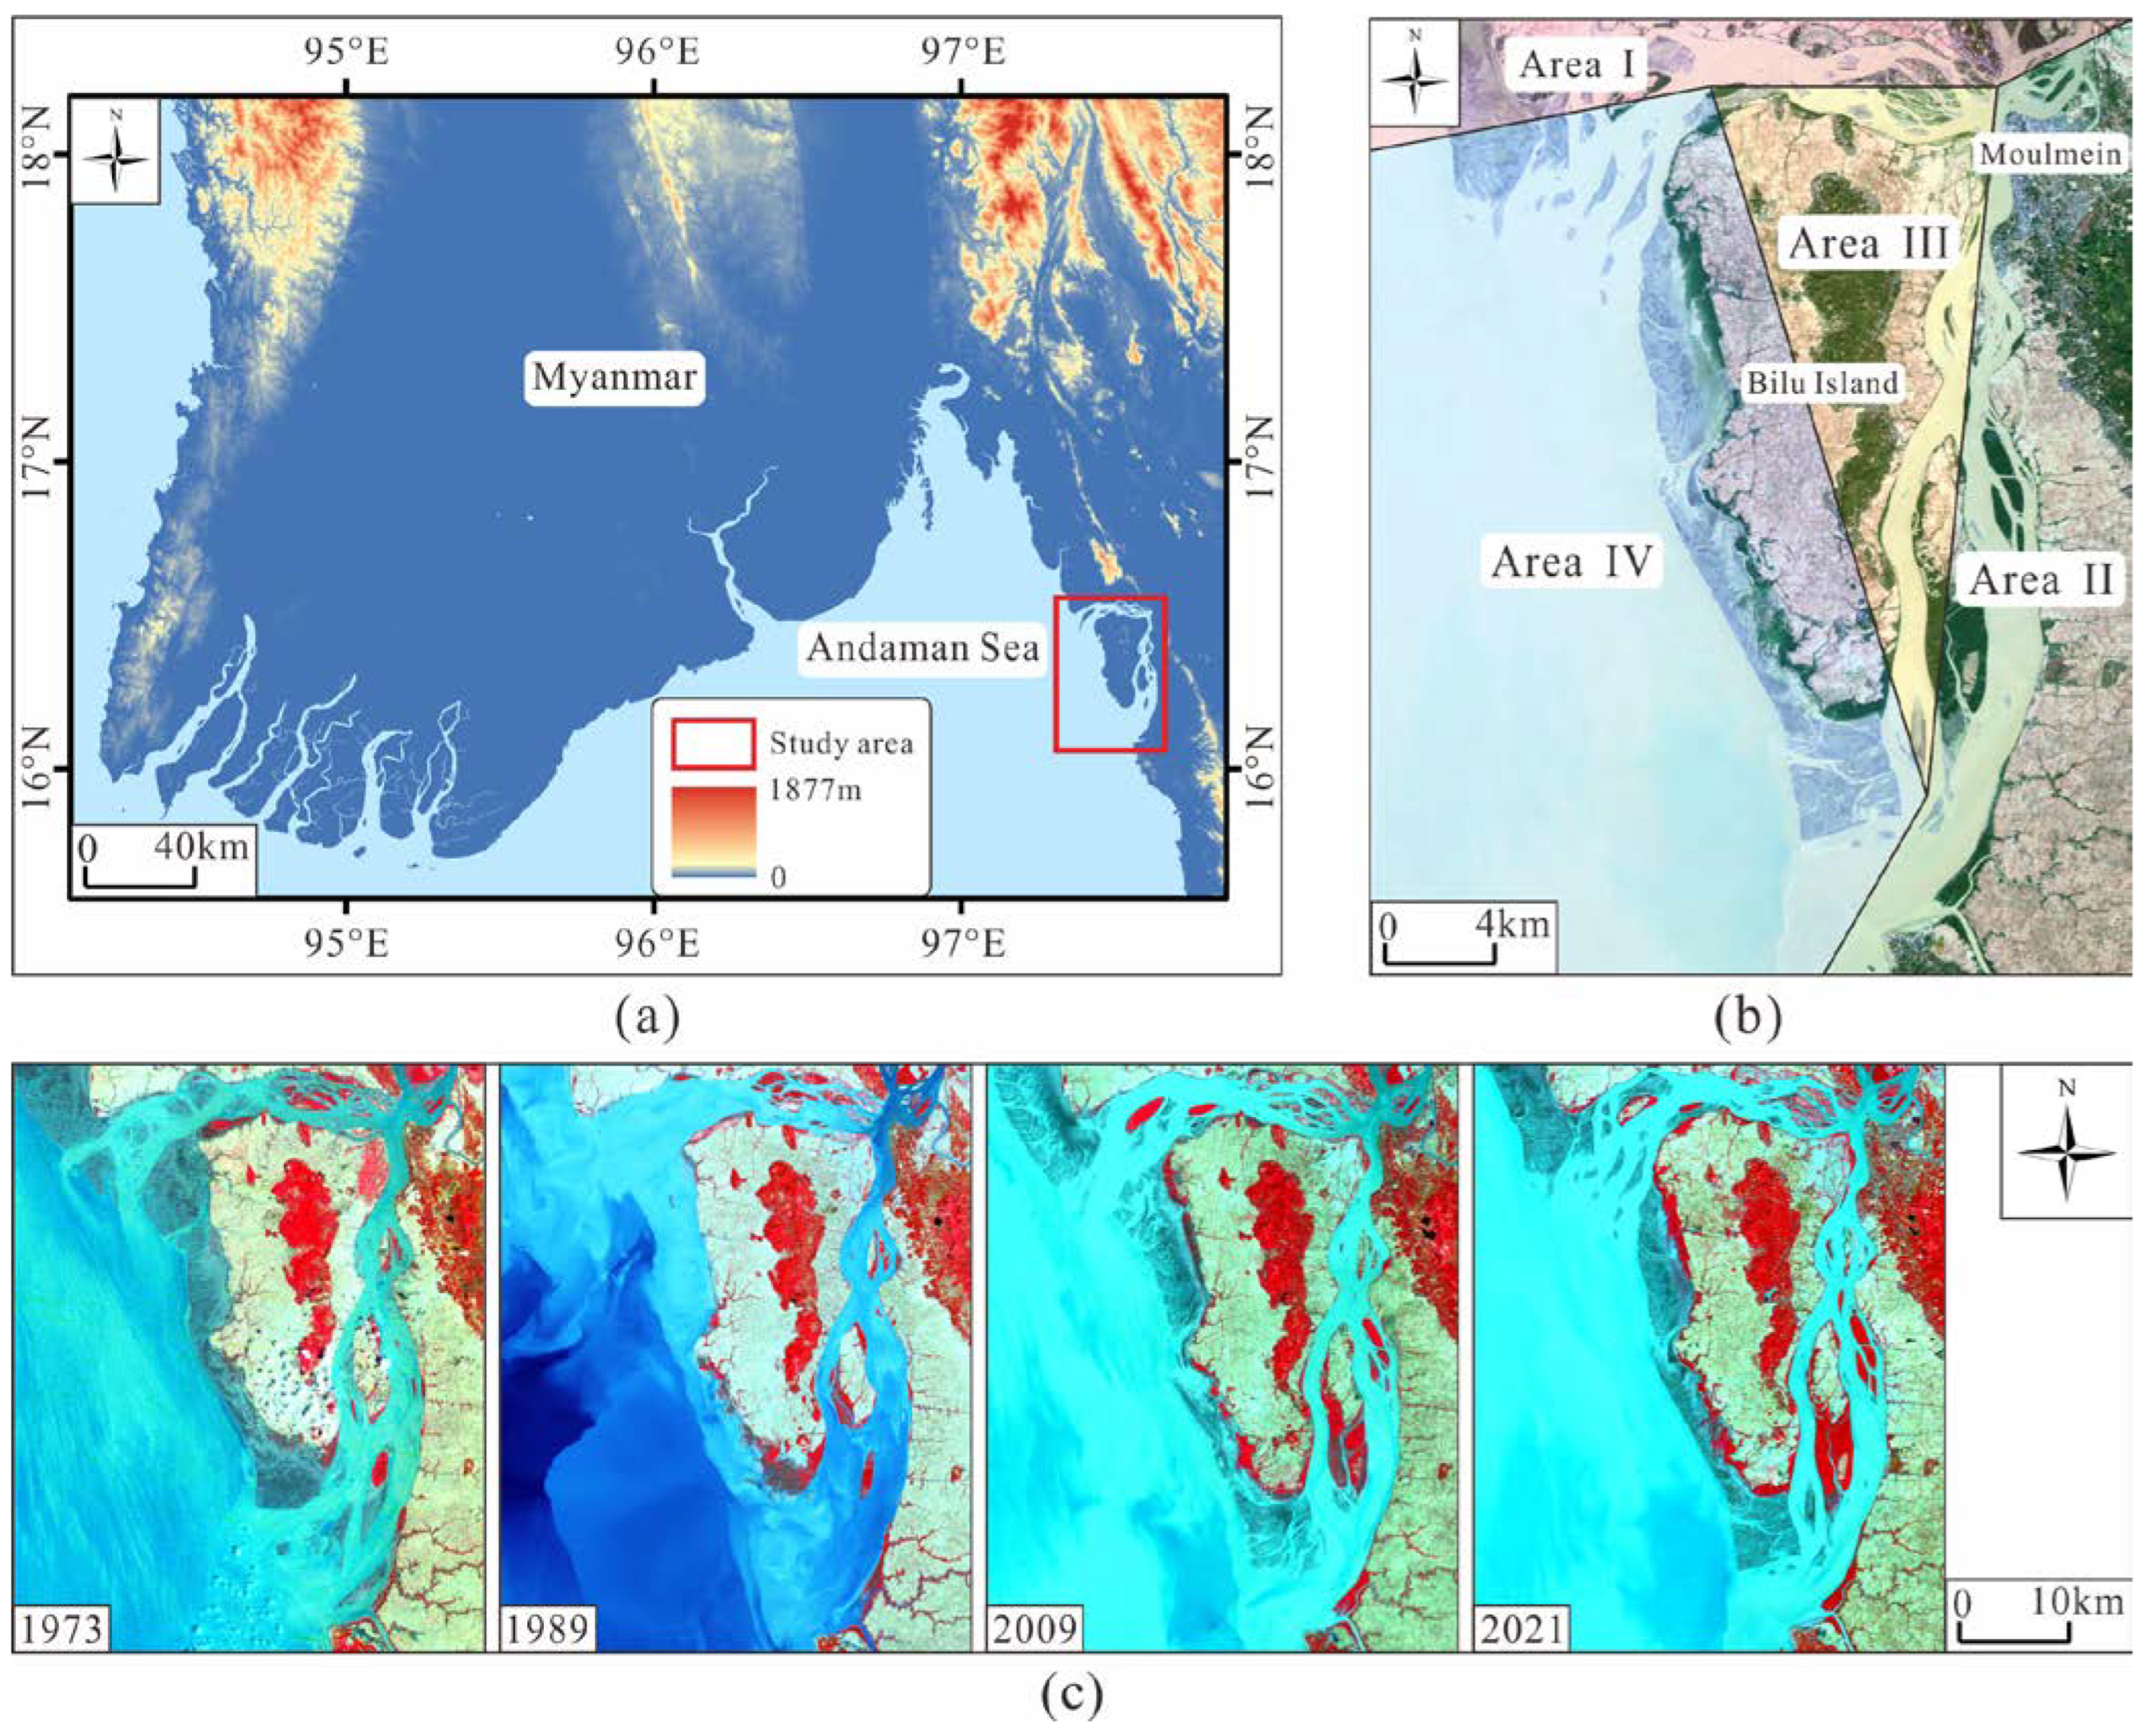
2.1. Study Area and Data Collection

The Salween River is known as the Nujiang River in China. It originates in Anduo County, Tibet Autonomous Region, at the southern edge of the Tanggula Mountain in the Tibetan Plateau and flows through China and Thailand into the Andaman Sea near Moulmein, Myanmar. In China, the Salween River Basin covers an area of 13.78 million km2 with a total length of 2013 km, while in other countries, the river basin covers an area of 20.5 million km2 with a total length of 1660 km. The Salween River Delta is an area where many tributaries of the Salween River and other rivers converge. The Salween River flows into the estuary from the north, and the Hanna River flows from the east, forming braided distribution. The Salween River in China has a low latitude plateau monsoon climate, and the delta area has a subtropical monsoon climate, with significant differences in climate characteristics such as precipitation and temperature [23,24]. Precipitation and temperature in the basin gradually increase from upstream to downstream. The Salween and the Irrawaddy Rivers continuously carry a large amount of sediment to the bay of Andaman Sea, providing the material source for the spatial and temporal evolution of the Salween River Delta [25]. The study area (Figure 1a) is located near Moulmein, and it includes the west and south river branches, Bilu Island, and other small islands between the two branches. According to the locations of the islands and the mainland coastline in the study area, we divided the study area into four regions: Area I, the western branch of the continental coastline; Area II, the southern branch of the continental coastline; Area III, the continental side of the Bilu Island coastline; and Area IV, the Indian Ocean side of Bilu Island coastline (Figure 1b).
For this study, we obtained 16 sets of Landsat clear-sky remote sensing images (Figure 1c) for the years 1973 to 2021 (https://earthexplorer.usgs.gov/, accessed on 17 September 2022). Due to the poor remote sensing technology of the early satellites, there are few images that can be used for coastline extraction. Coastline extraction adheres to a uniform standard and the acquisition time of selected images is concentrated in the dry season with a low cloud cover over the study area. Since coastline evolution is slow and the available clear-sky images in the study area are limited, we have selected 16 sets of clear-sky remote sensing images from the Landsat series between 1973 and 2021; the details of the images are shown in Table 1.

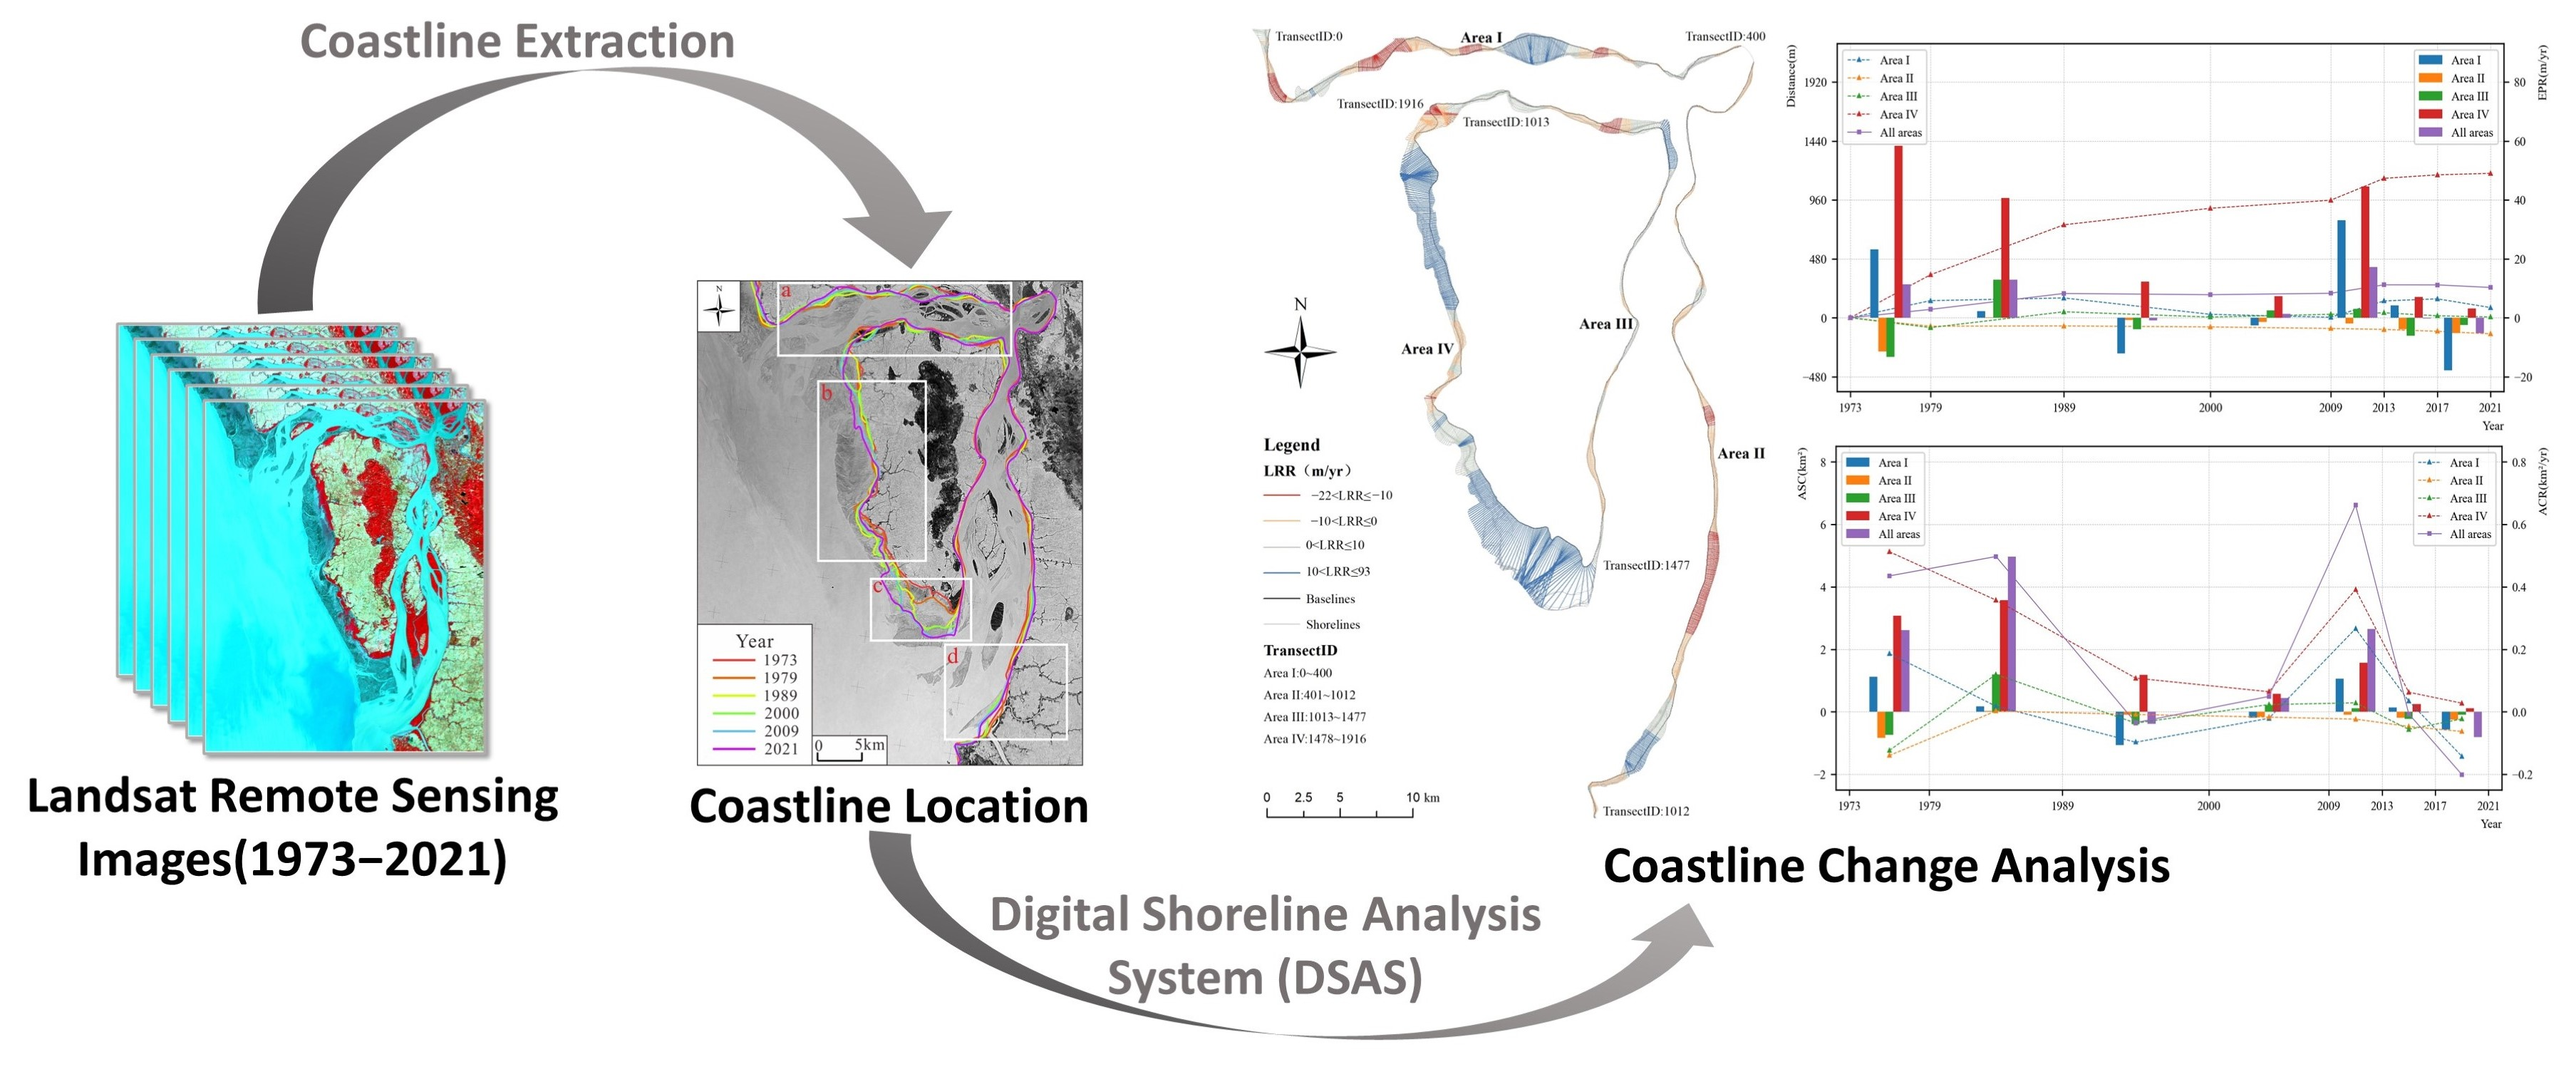
2.2. Extraction of Coastlines

The Landsat clear-sky remote sensing images were preprocessed, and the FLAASH (Fast Line of sight Atmospheric Analysis of Spectral Hypercubes) tool of ENVI software was used for radiometric calibration and atmospheric correction. The extraction of the dry-wet boundary which is one of the indicated coastlines was completed in two steps; first, by extracting the water boundary information from the multi-spectral images based on the Modified Normalized Difference Water Index (MNDWI), and second, by correcting the boundary with visual interpretation.
The MNDWI can enhance open water features while efficiently suppressing and even removing built-up land noise and vegetation and soil noise [26]; it has the calculation formula:
M N D W I = ( G r e e n M I R ) ( G r e e n + M I R )
where Green is the reflectance in the green band and MIR is the reflectance in the mid-infrared band. In addition, visual interpretation was performed directly due to the absence of the mid-infrared band in the 1973 and 1979 remote sensing images.
The instantaneous water boundary extracted with the MNDWI often needs further correction due to the influence of the background of the coastal zone and of weather factors [27]. The types of coastlines are identified based on the typical spectral features in multi-spectral remote sensing images. On the standard false-color images, bedrock coastlines are the dividing lines that change from dark blue to bright white, gravelly coastlines are the dividing lines that turn from bright white to dark, and silty coastlines are the dividing lines where red color fades or changes to gray, whilst artificial coastlines are relatively straight and easy to identify.

2.3. Digital Shoreline Analysis System

We calculated the length of the shoreline of Bilu Island and the continental coastline, the total area of the island, and the area of Bilu Island based on the extracted and interpreted coastline and island vector data of the Salween River Delta. The overall temporal and spatial changes in the coastline of the Salween River Delta were analyzed with a map overlay. Based on this, DSAS developed by the United States Geological Survey (USGS) was used to calculate the changing distance of the coastline, so as to quantify the spatial and temporal evolution. This is a powerful and widely-used tool for detecting coastline changes [28,29,30].
The LRR and EPR were used to evaluate the rate of coastline change. The earliest coastline was used as the baseline, transects were generated at a sampling interval (L) on the baseline, and the distance from the coastline to the baseline along the transect was calculated. A linear fit between the distance and time was performed and LRR was calculated to reflect the overall rate of coastline change. The coastlines at two of the times were selected to calculate the EPR, reflecting the partial rate of coastline change during this period. Negative values indicated coastline movement toward the continent, while positive values indicated movement toward the ocean. The formula for calculating the EPR was:
E P R i , j = D j D i Y j Y i
where i and j represent years; Di and Dj are the distances from the coastline to the baseline; Yi and Yj are years.
The ASC and ACR were further calculated to identify coastline erosion and accretion segments. The ASC represents the difference in the area of the polygon between the coastline and the baseline. The ACR represents the rate of area change, with negative values indicating erosion and positive values indicating accretion. The formulas are expressed as follows:
A S C i , j = L t = 0 T ( D j t D i t )
A C R i , j = L t = 0 T ( D j t D i t ) Y j Y i
where i and j represent years; L is the sampling interval of the coastline transects; t is the number of the coastline transects; Dit and Djt are the distances from the coastline to the baseline; Yj and Yi are years.

3. Results

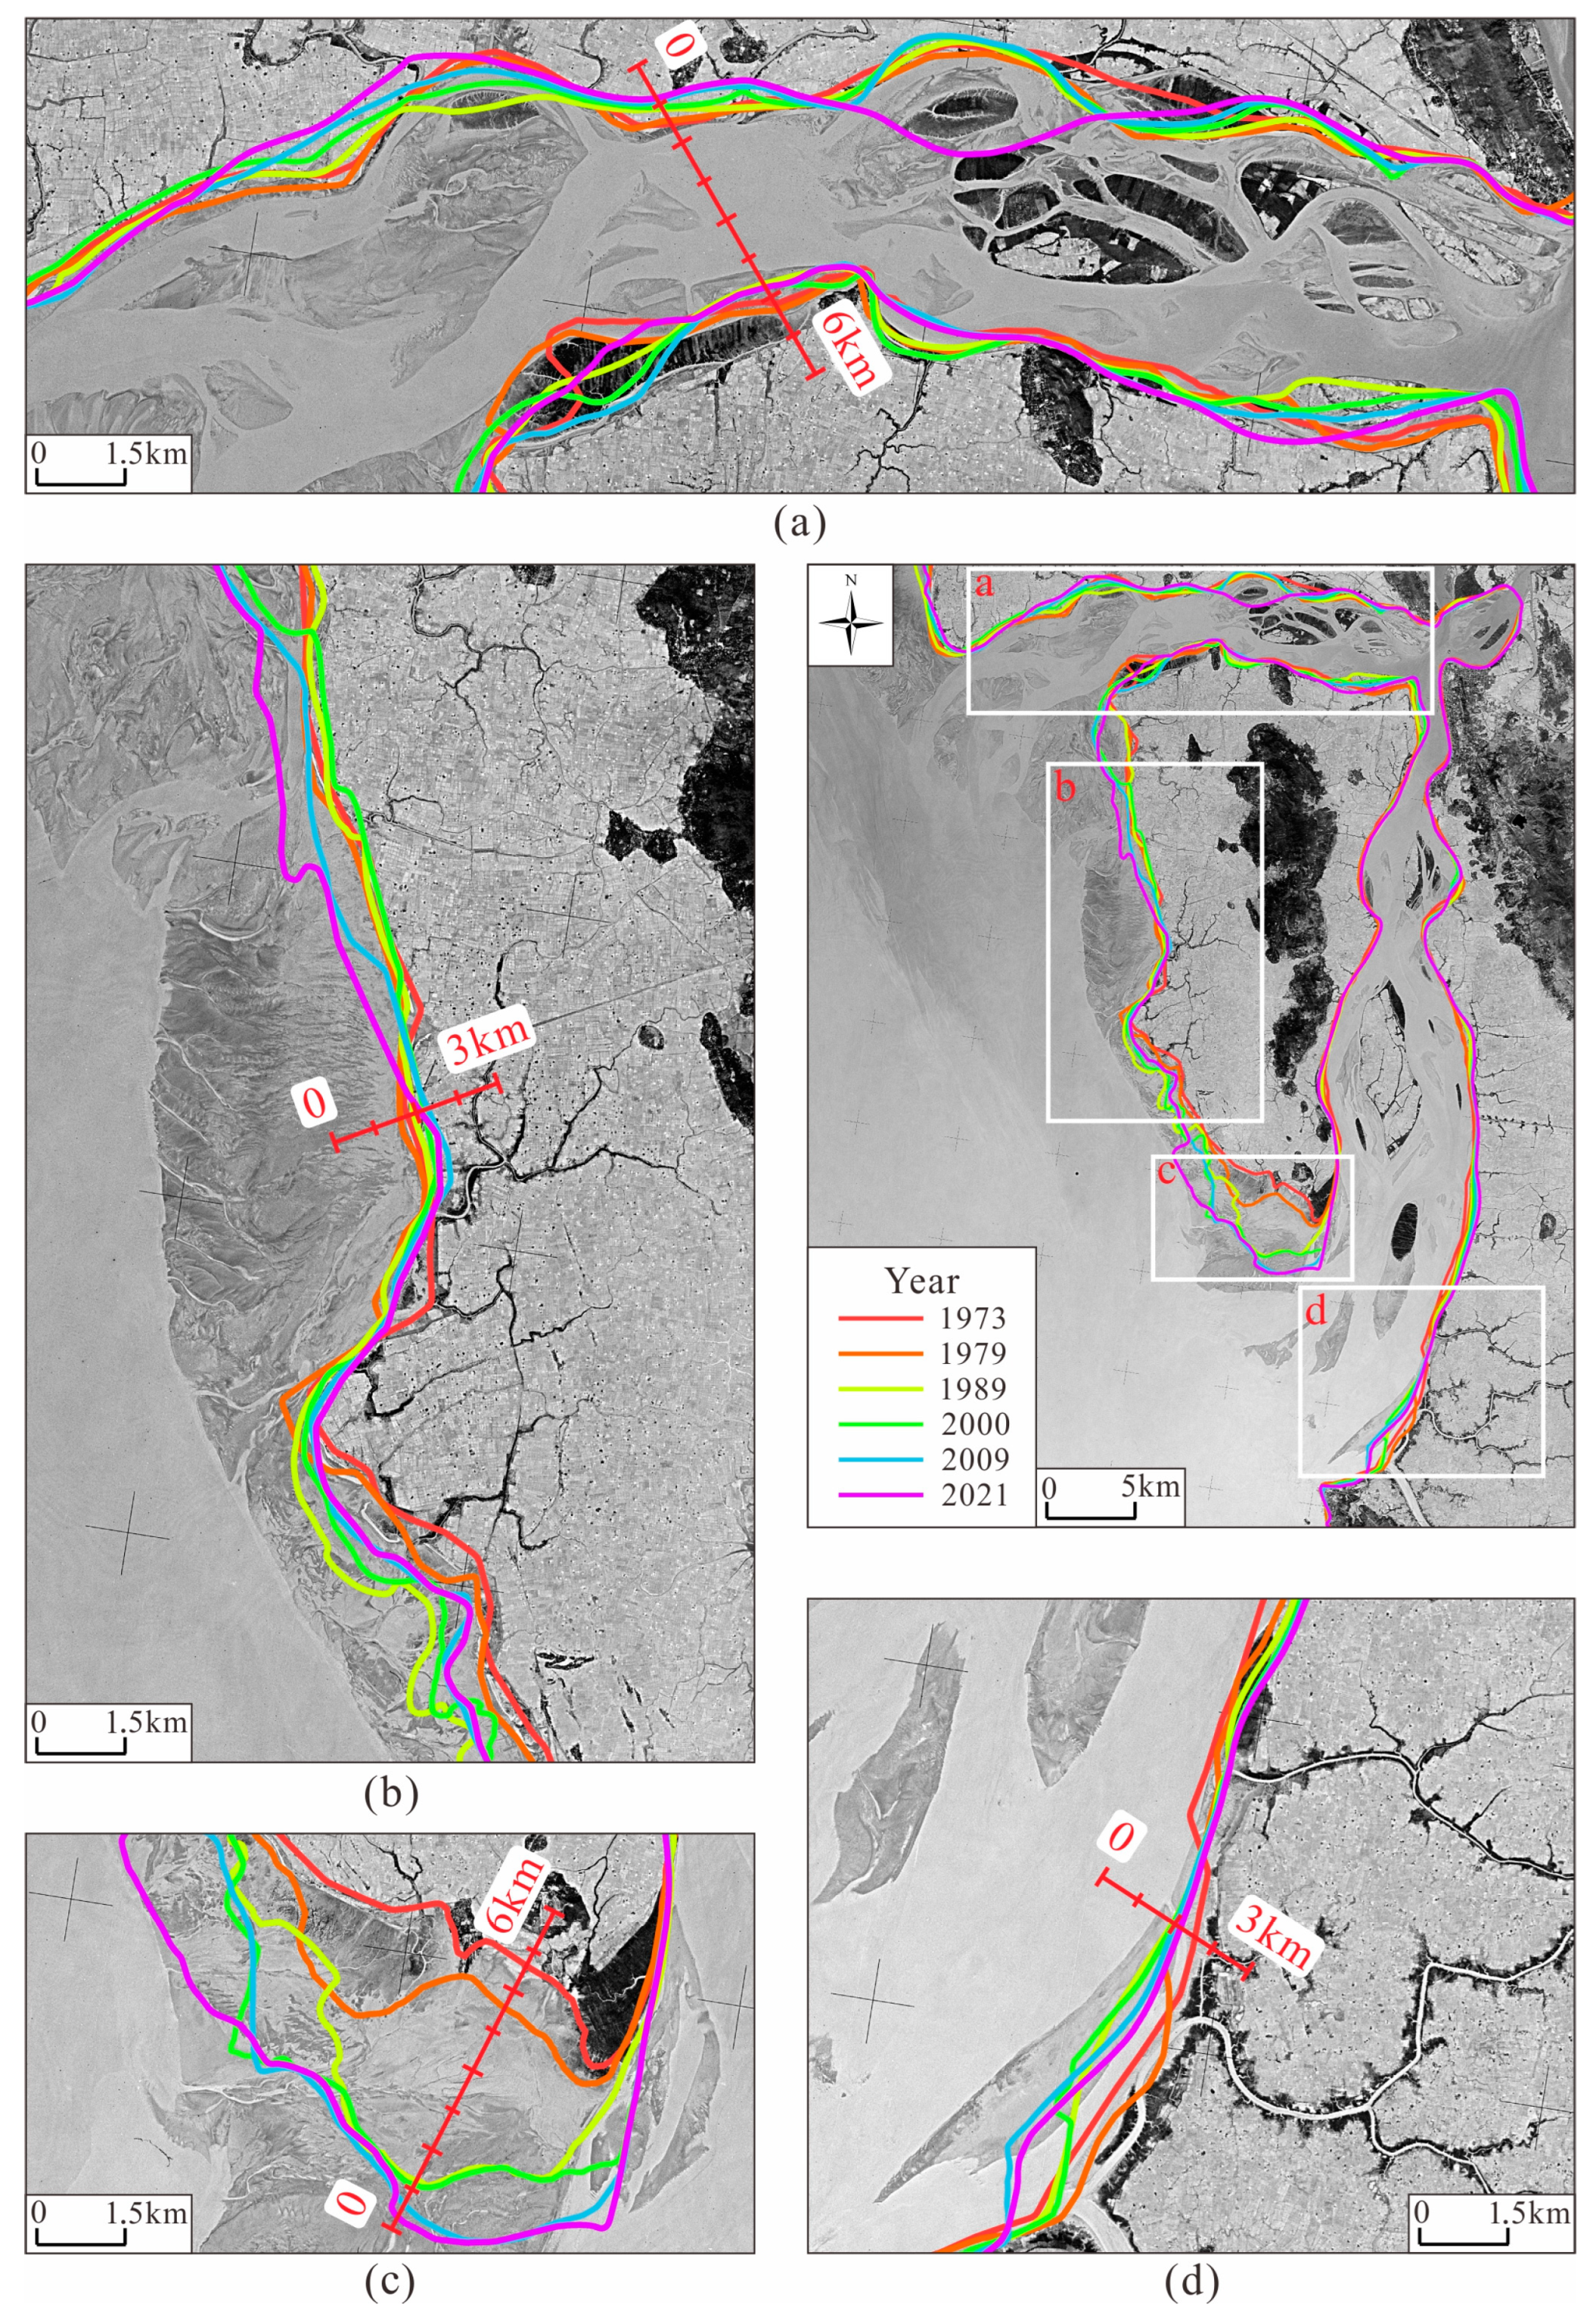
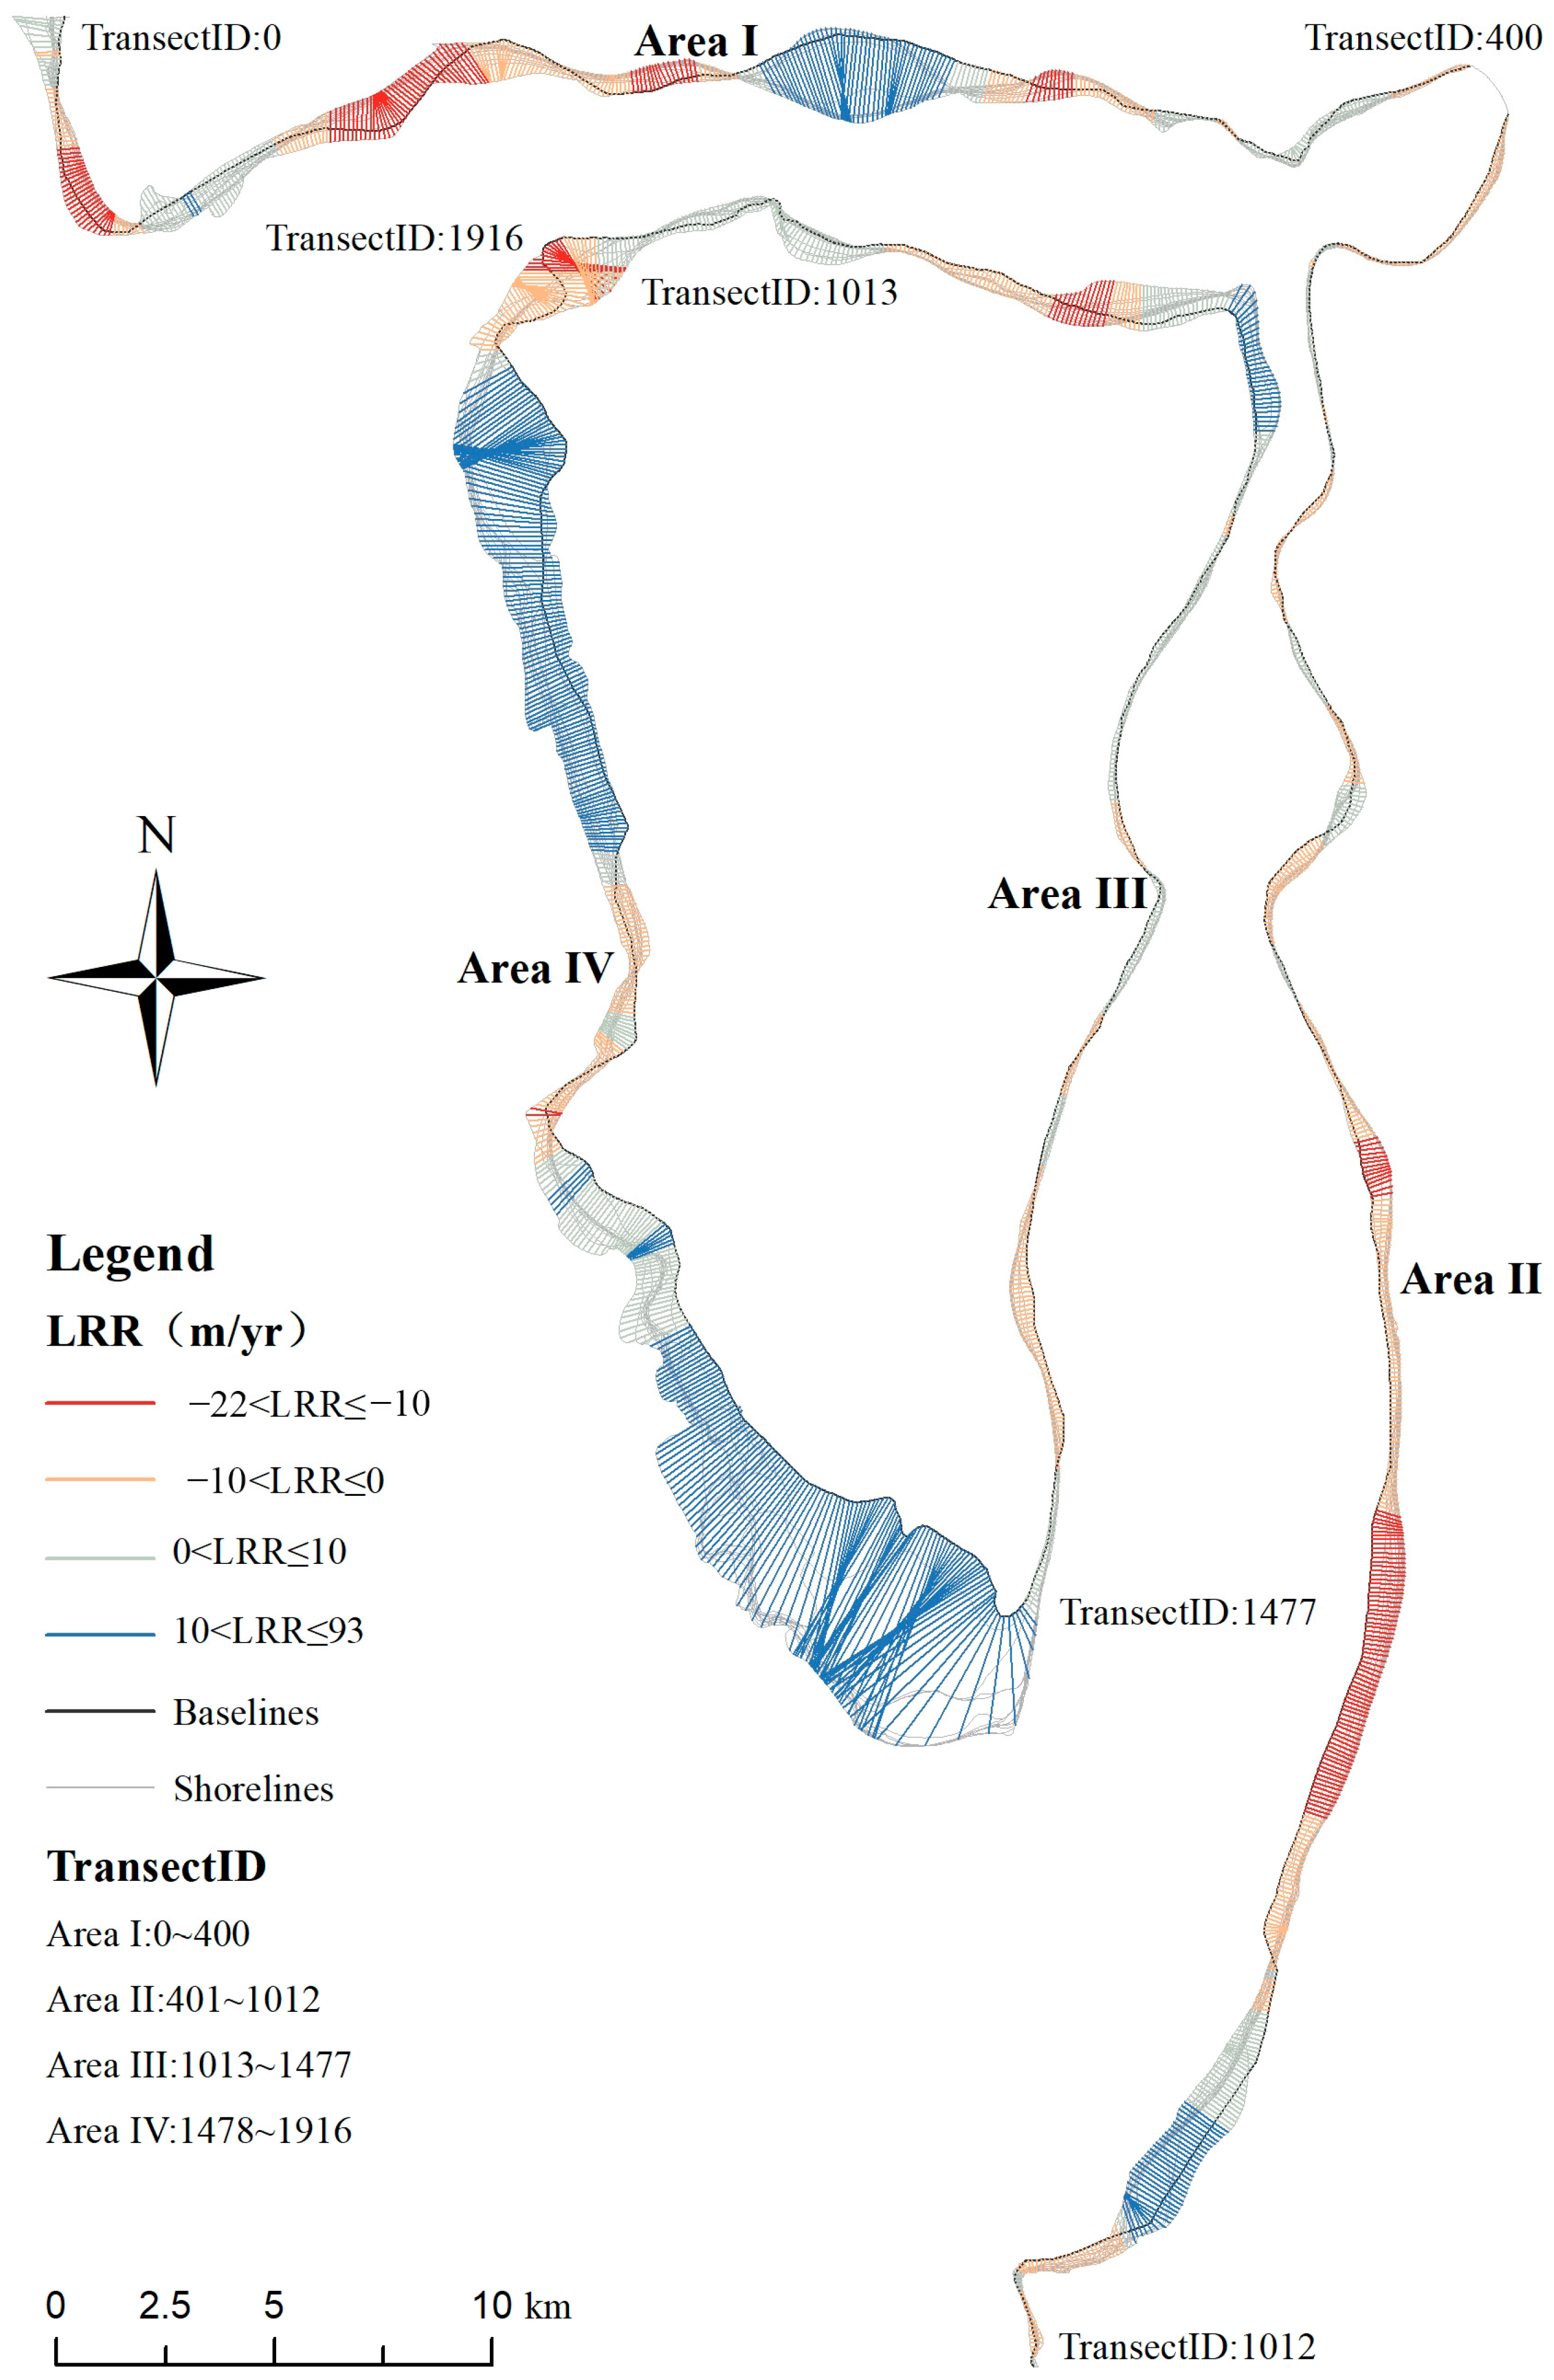
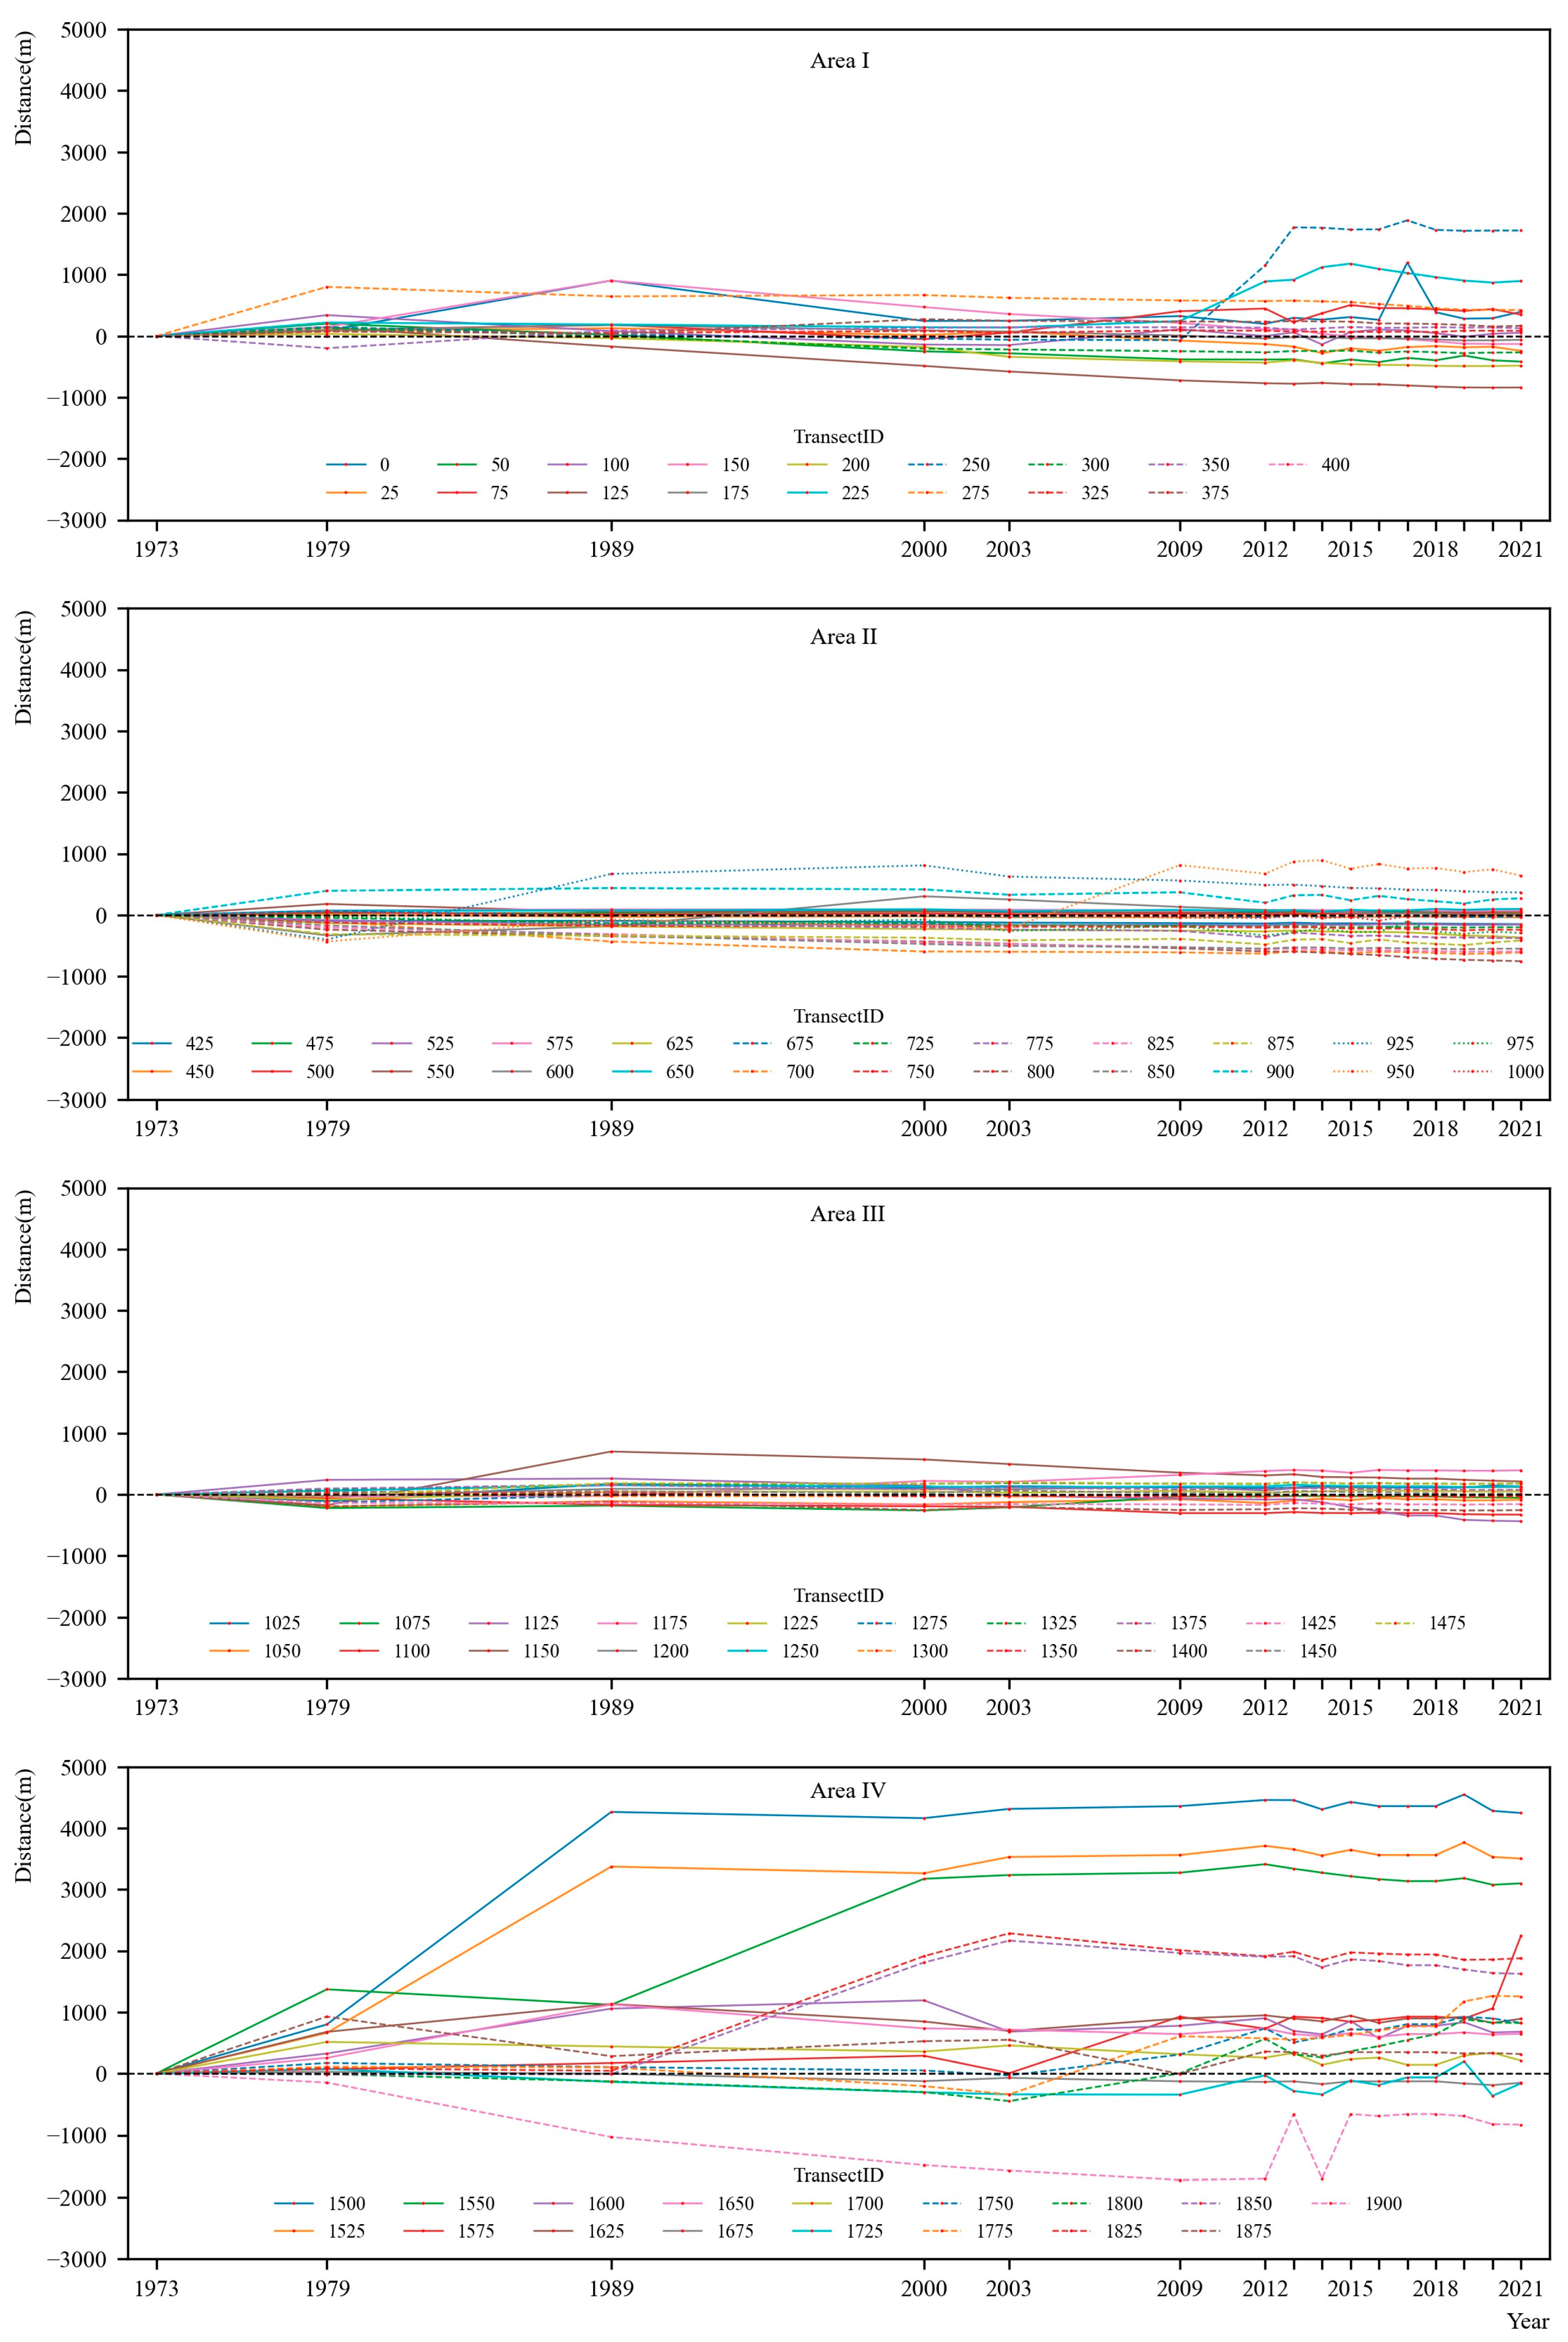
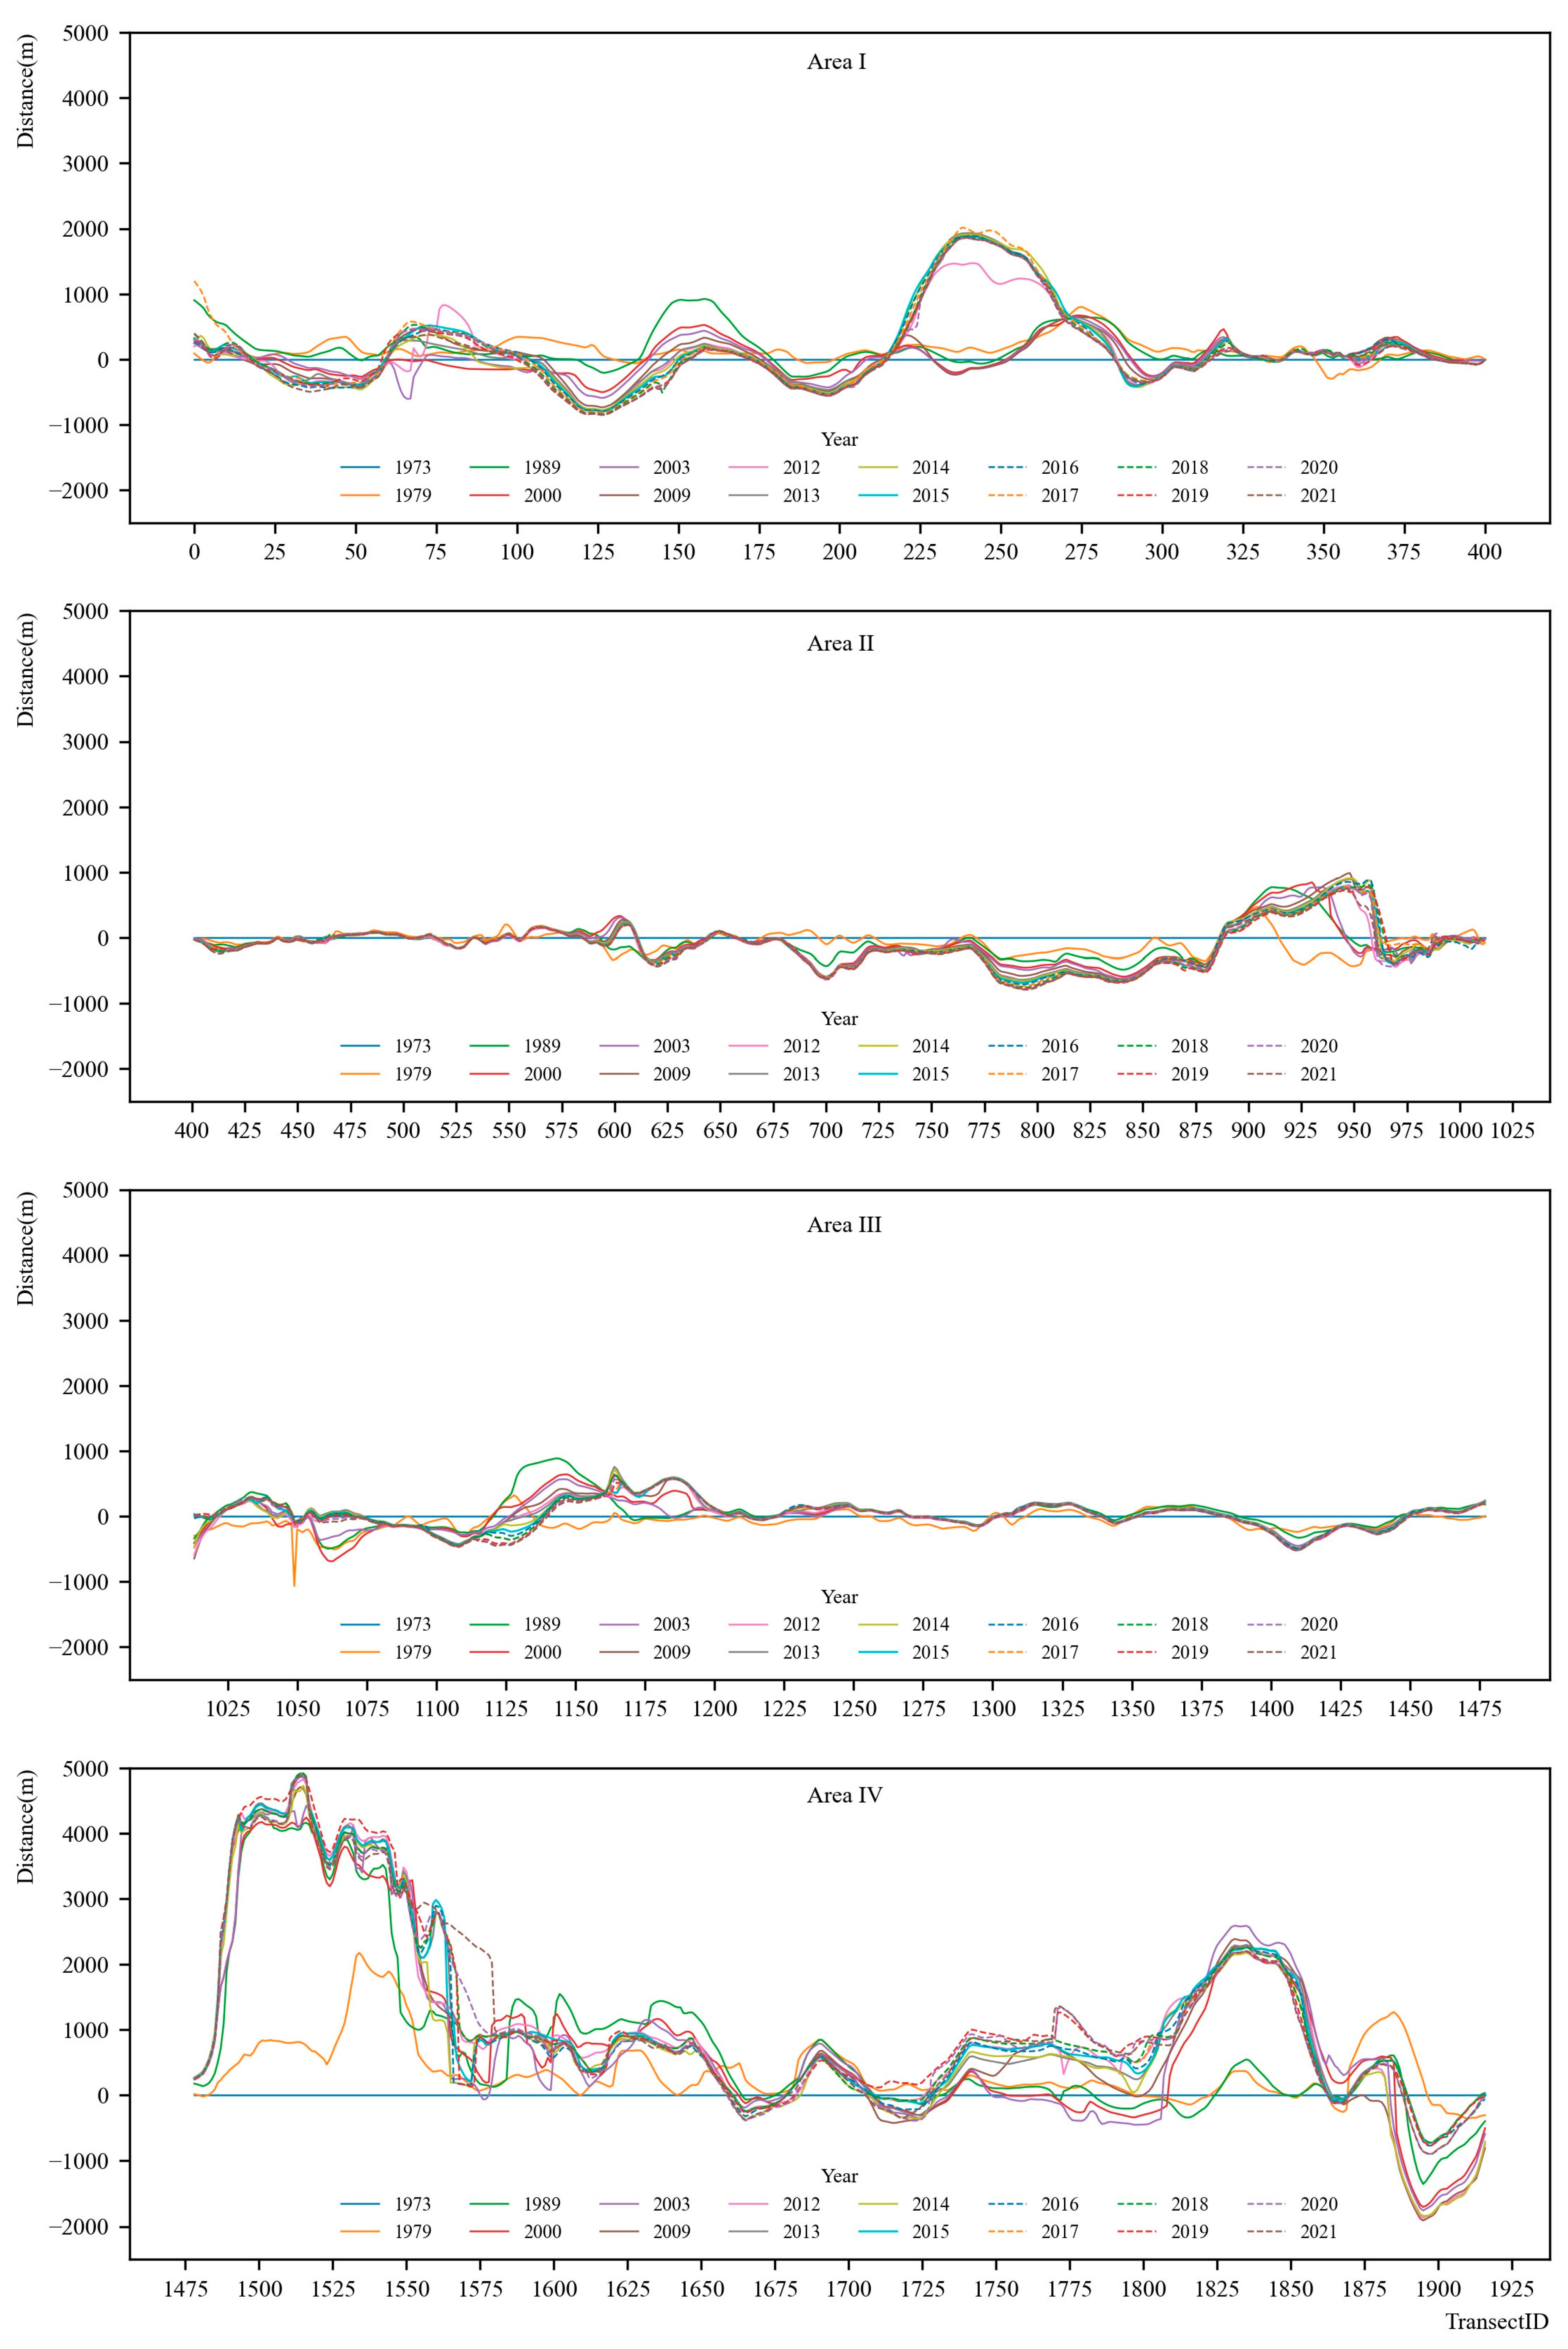
3.1. Coastline Changes

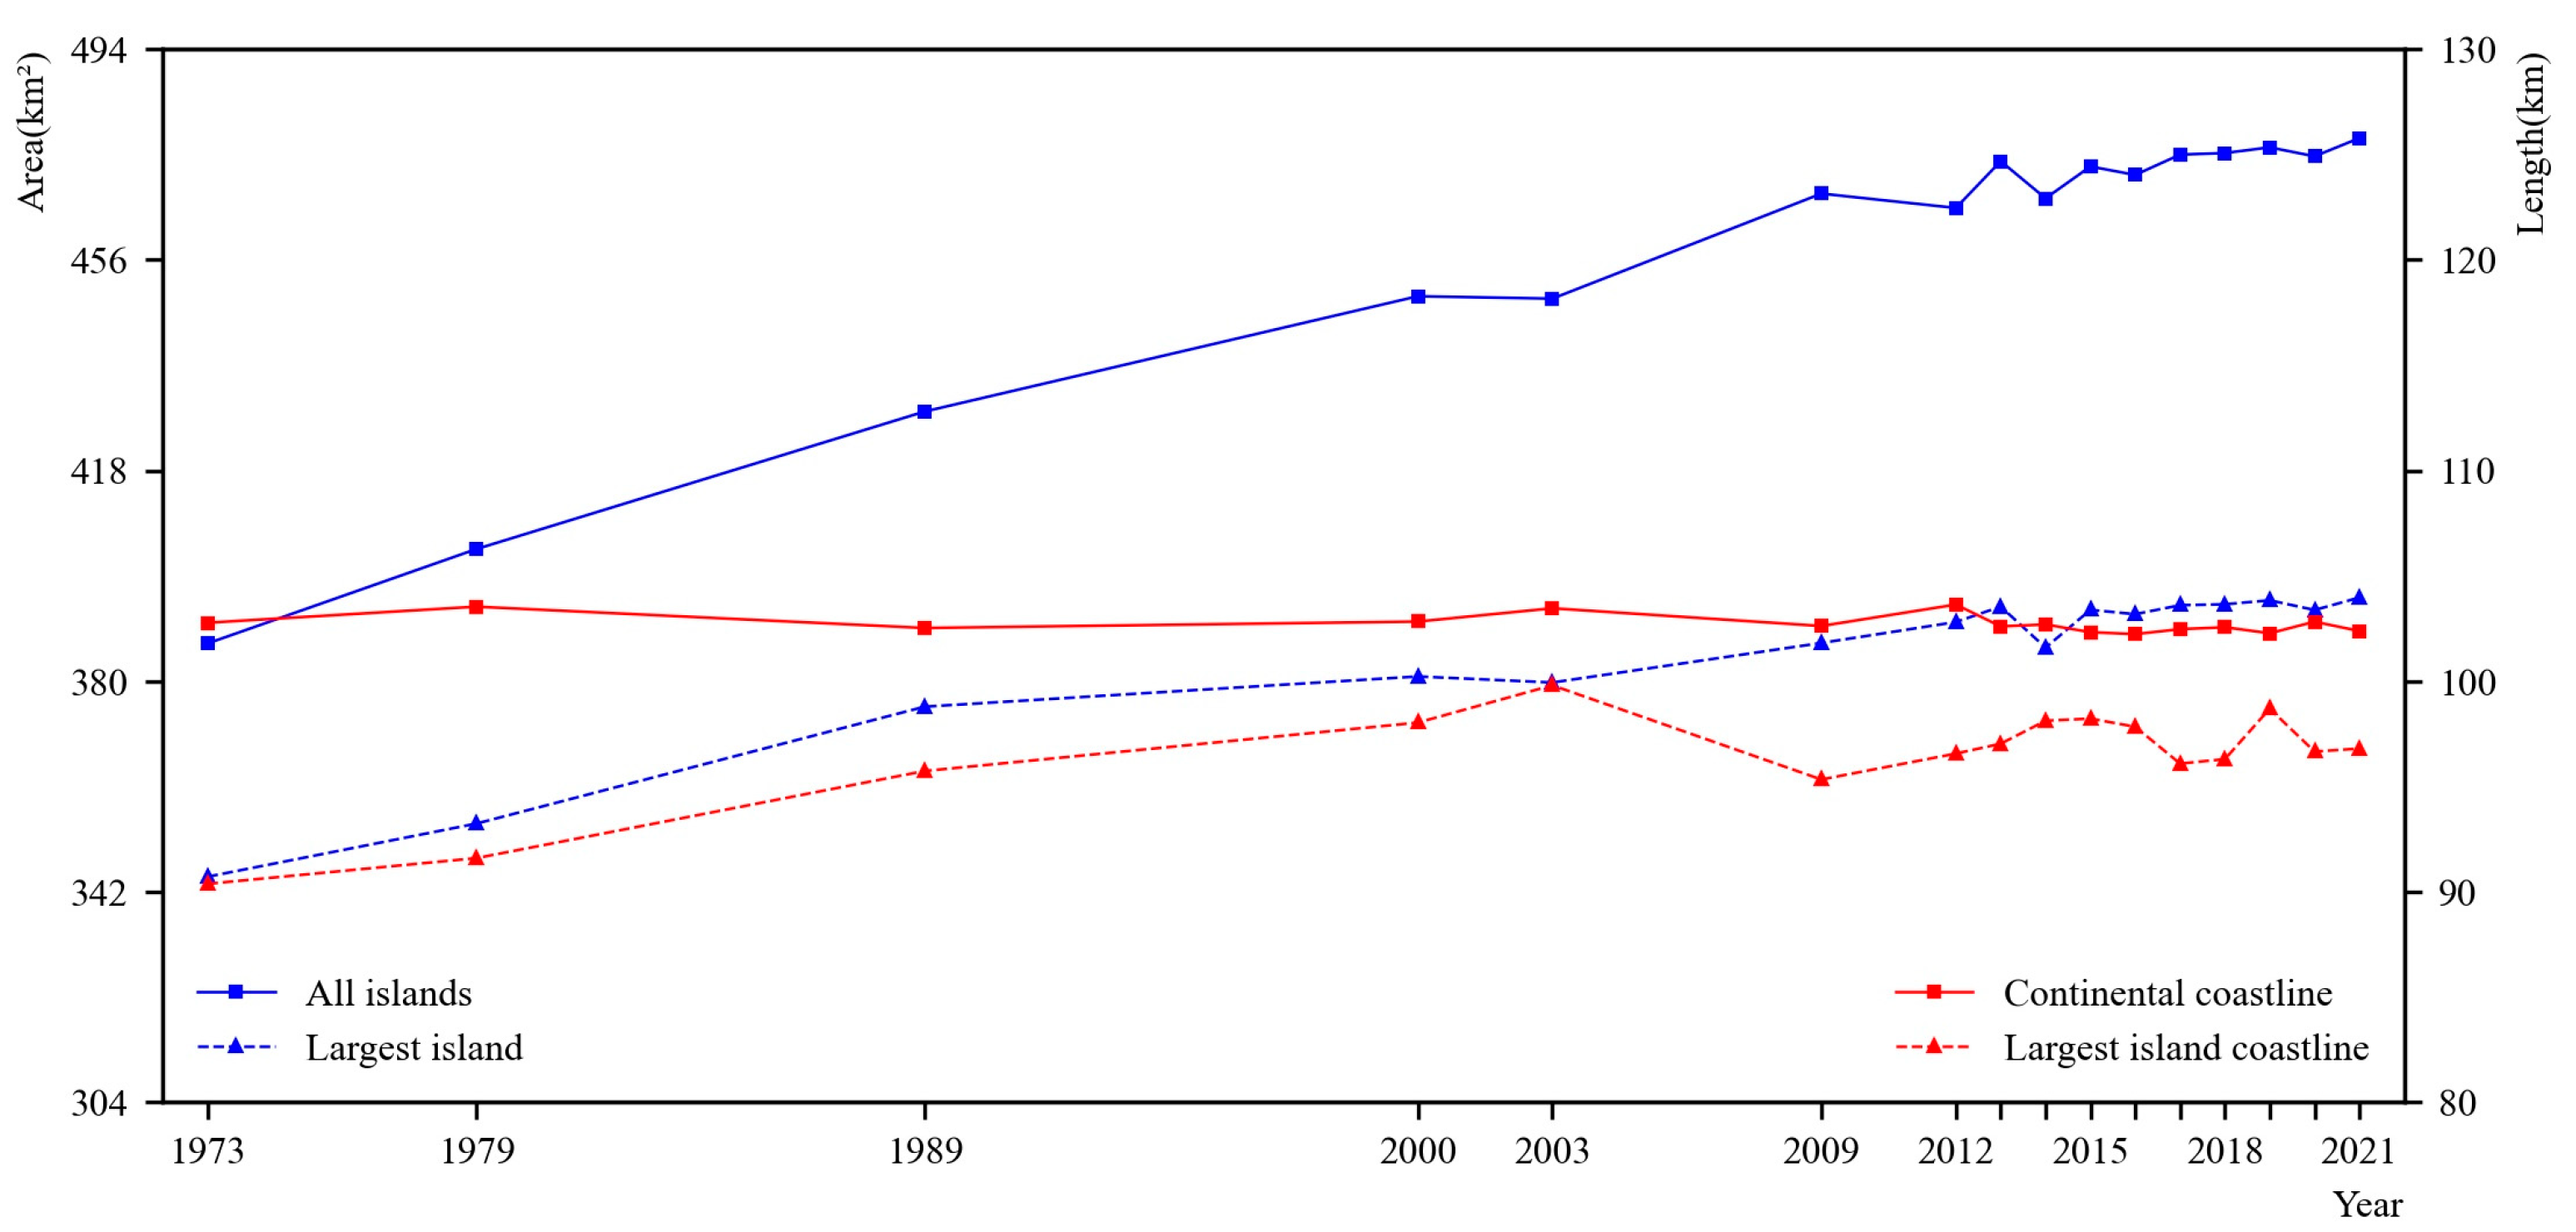
3.1.1. Overall Changes in the Coast

The length of the continental coastline decreased between 1973 and 2021 by 0.392 km, while the length of the Bilu Island coastline increased during that time by 6.426 km (Figure 2). Both, the area of all islands and the area of Bilu Island exhibited significant increases of 91.156 km and 50.377 km, respectively, indicating that Bilu Island had one of the fastest-changing coastlines in the Salween River Delta. The overall distance of the coastline movement between 1973 and 2021 was about 1~5 km (Figure 3a–d), and the movement distance on the south side of Bilu Island was up to 5 km. The Bilu Island coastline experienced a greater change than the continental coastline, especially on the south side of the island. The south branch of the continental coastline was more stable than the west branch, which moved a greater distance. The coastline on the Indian Ocean side of Bilu Island moved a greater distance than the continental side, and the coastline on the southwestern side of Bilu Island expanded significantly toward the ocean. The overall coastline change was characterized by a greater intensity on island than on continental coastlines, the Indian Ocean side than on the continental side, and a dominant direction of expansion towards the ocean.

3.1.2. Changes in Continental Coastlines and Bilu Island

Among the extracted coastlines of the Salween River Delta, the coastline in 1973 was used as the baseline, and the sampling interval (L) of the coastline transects was 200 m. There were a total of 1917 transects (Figure 4), including 401 transects in Area I with transect numbers from 0 to 400, 612 transects in Area III with transect numbers from 401 to 1012, 465 transects in Area I with transect numbers from 1013 to 1477, and 439 transects in Area IV with transect numbers from 1478 to 1916. In order to visualize the changes in the coastlines, we selected one transect as the characteristic transect every 25 transects from the 1917 transects.
The LRR, reflecting the overall rate of coastline change, ranged from −21.98 to 92.34 m/yr, with an average linear regression rate of 4.69 m/yr (Figure 4). The regional LRR in Area I ranged from −21.98 to 51.11 m/yr, with an average linear regression rate of 1.06 m/yr; in Area II, it ranged from −14.59 to 26.15 m/yr, with an average linear regression rate of −2.07 m/yr; in Area III, it ranged from −14.43 to 15.98 m/yr, with an average linear regression rate of 0.83 m/yr; and in Area IV, it ranged from −13.12 to 92.34 m/yr, with an average linear regression rate of 21.52 m/yr. The average linear regression rates for Area I, Area III, and Area IV were positive, and the coastline moved toward the ocean, while that for Area II was negative, and the coastline moved toward the continent. The average linear regression rate for Area IV was much larger than that for Areas I and III, and the coastline movement in these areas was the most dynamic of all areas. We identified different geomorphological coastlines: Area I and Area II are partly the sand and gravel with the coastline retreating toward the continent; Area III is the bedrock with coastline stable; Area IV is a typical distribution of mangroves with coastline expanding toward the ocean.
As shown in Figure 5, characteristic transects indicate the coastline change of the area where the characteristic transects are located. First, Area IV had the largest distance of coastline change, followed by Area I, Area II, and Area III. Second, Area IV exhibited the largest coastline movement of about 5 km, and the Indian Ocean side of Bilu Island's coastline was expanding into the ocean. However, the coastlines in Areas II and III moved moderately, and the southern edge of the continental coastline and the continental edge of Bilu Island moved for a distance of 1 km. Finally, the lengths of transects 225 and 250 in Area I greatly increased between 2009 and 2012, indicating that a western portion of the continental coastline segment of nearly 5 km rapidly expanded into the ocean. In fact, the spatial and temporal changes of the continental and Bilu Island coastlines (Figure 3), and the remote sensing images for 2009 and 2012 showed that a continuous movement of the island toward the continent and a connection to the continent has occurred. The spatial and temporal distribution of the coastline in the four areas (Figure 6) shows that the coastline change in Areas II and III was smaller than in Areas I and IV. Area IV exhibited the most dynamic changes of −2~5 km, and the direction of coastline expansion was generally toward the ocean.
The overall and regional changes in coastline length and the End Point Rate (EPR) indicate the trend and rate of coastline change in different periods (Figure 7). On one hand, the average EPR of the overall coastline was largest during 2009~2013, followed by 1979~1989, 1973~1979, 1989~2000, 2000~2009, 2013~2017, and 2017~2021. The overall coastline moved rapidly toward the ocean during 1973~1989, slowly toward the continent during 1989~2000, slowly toward the ocean during 2000~2009, swiftly toward the ocean during 2009~2013, and slowly toward the continent during 2013~2021. On the other hand, the coastline of Area I was generally expanding toward the ocean, and the direction of coastline movement changed frequently in different periods. EPR in Area II was low where the coastline moved toward the continent. The coastline movement in Area III was rapid before 1989 and moderate after that. The average distance of coastline movement in Area IV was greatest at EPR of 40~60 m/yr in 1973~1979, 1979~1989, and 2009~2013, and an overall expansion of about 1 km into the ocean.

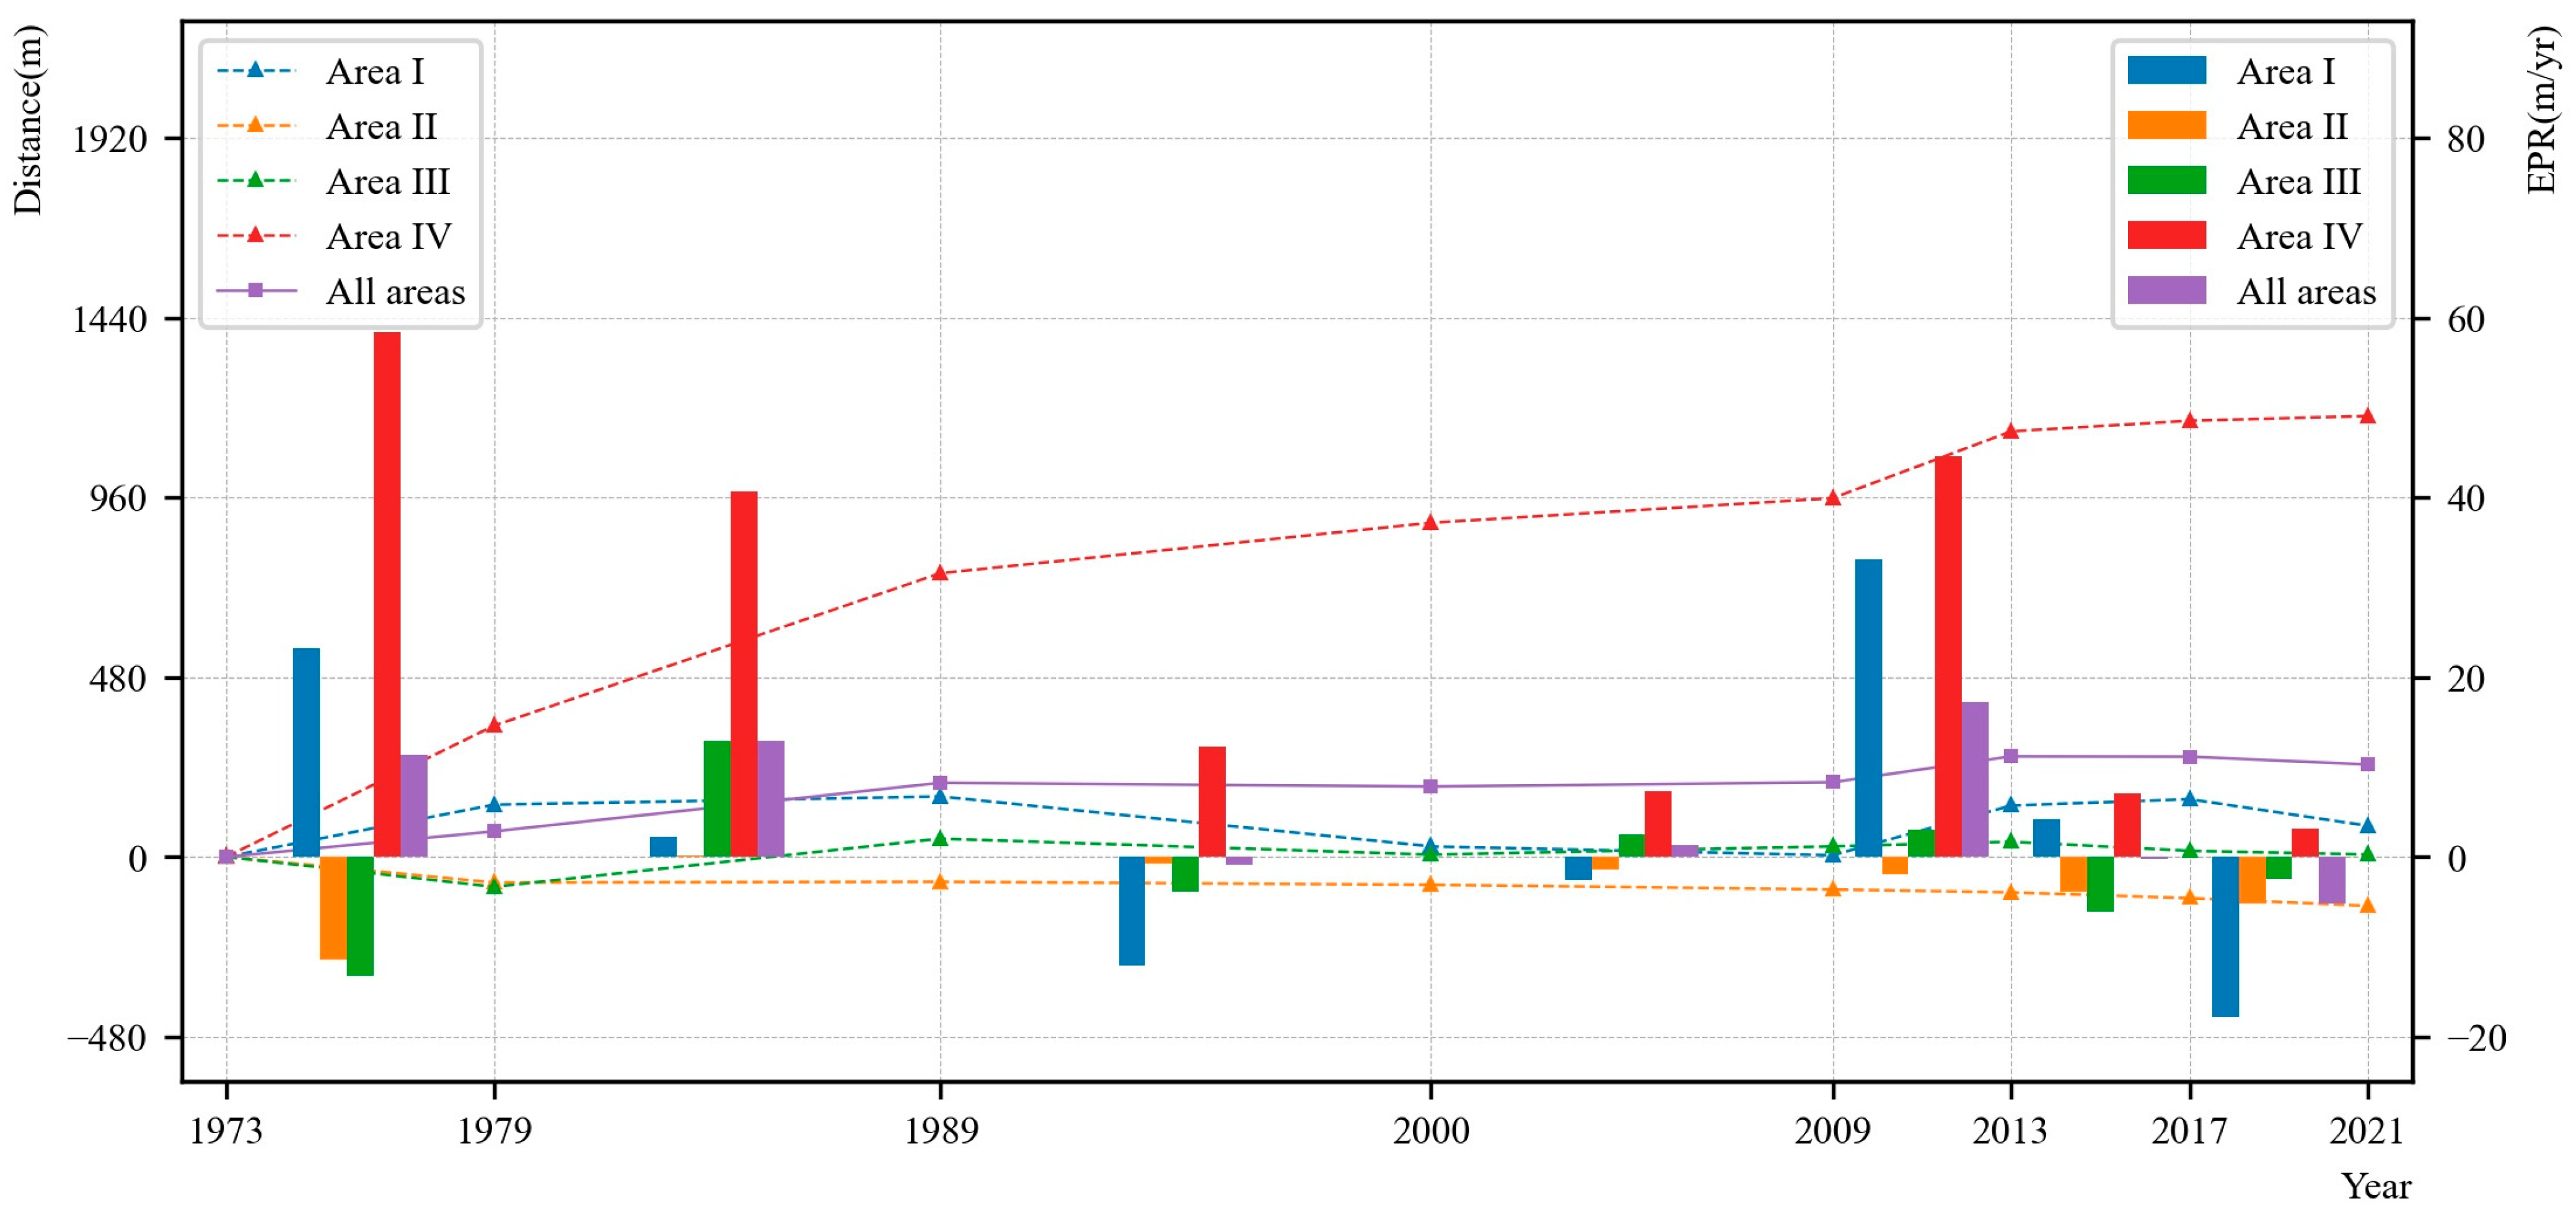
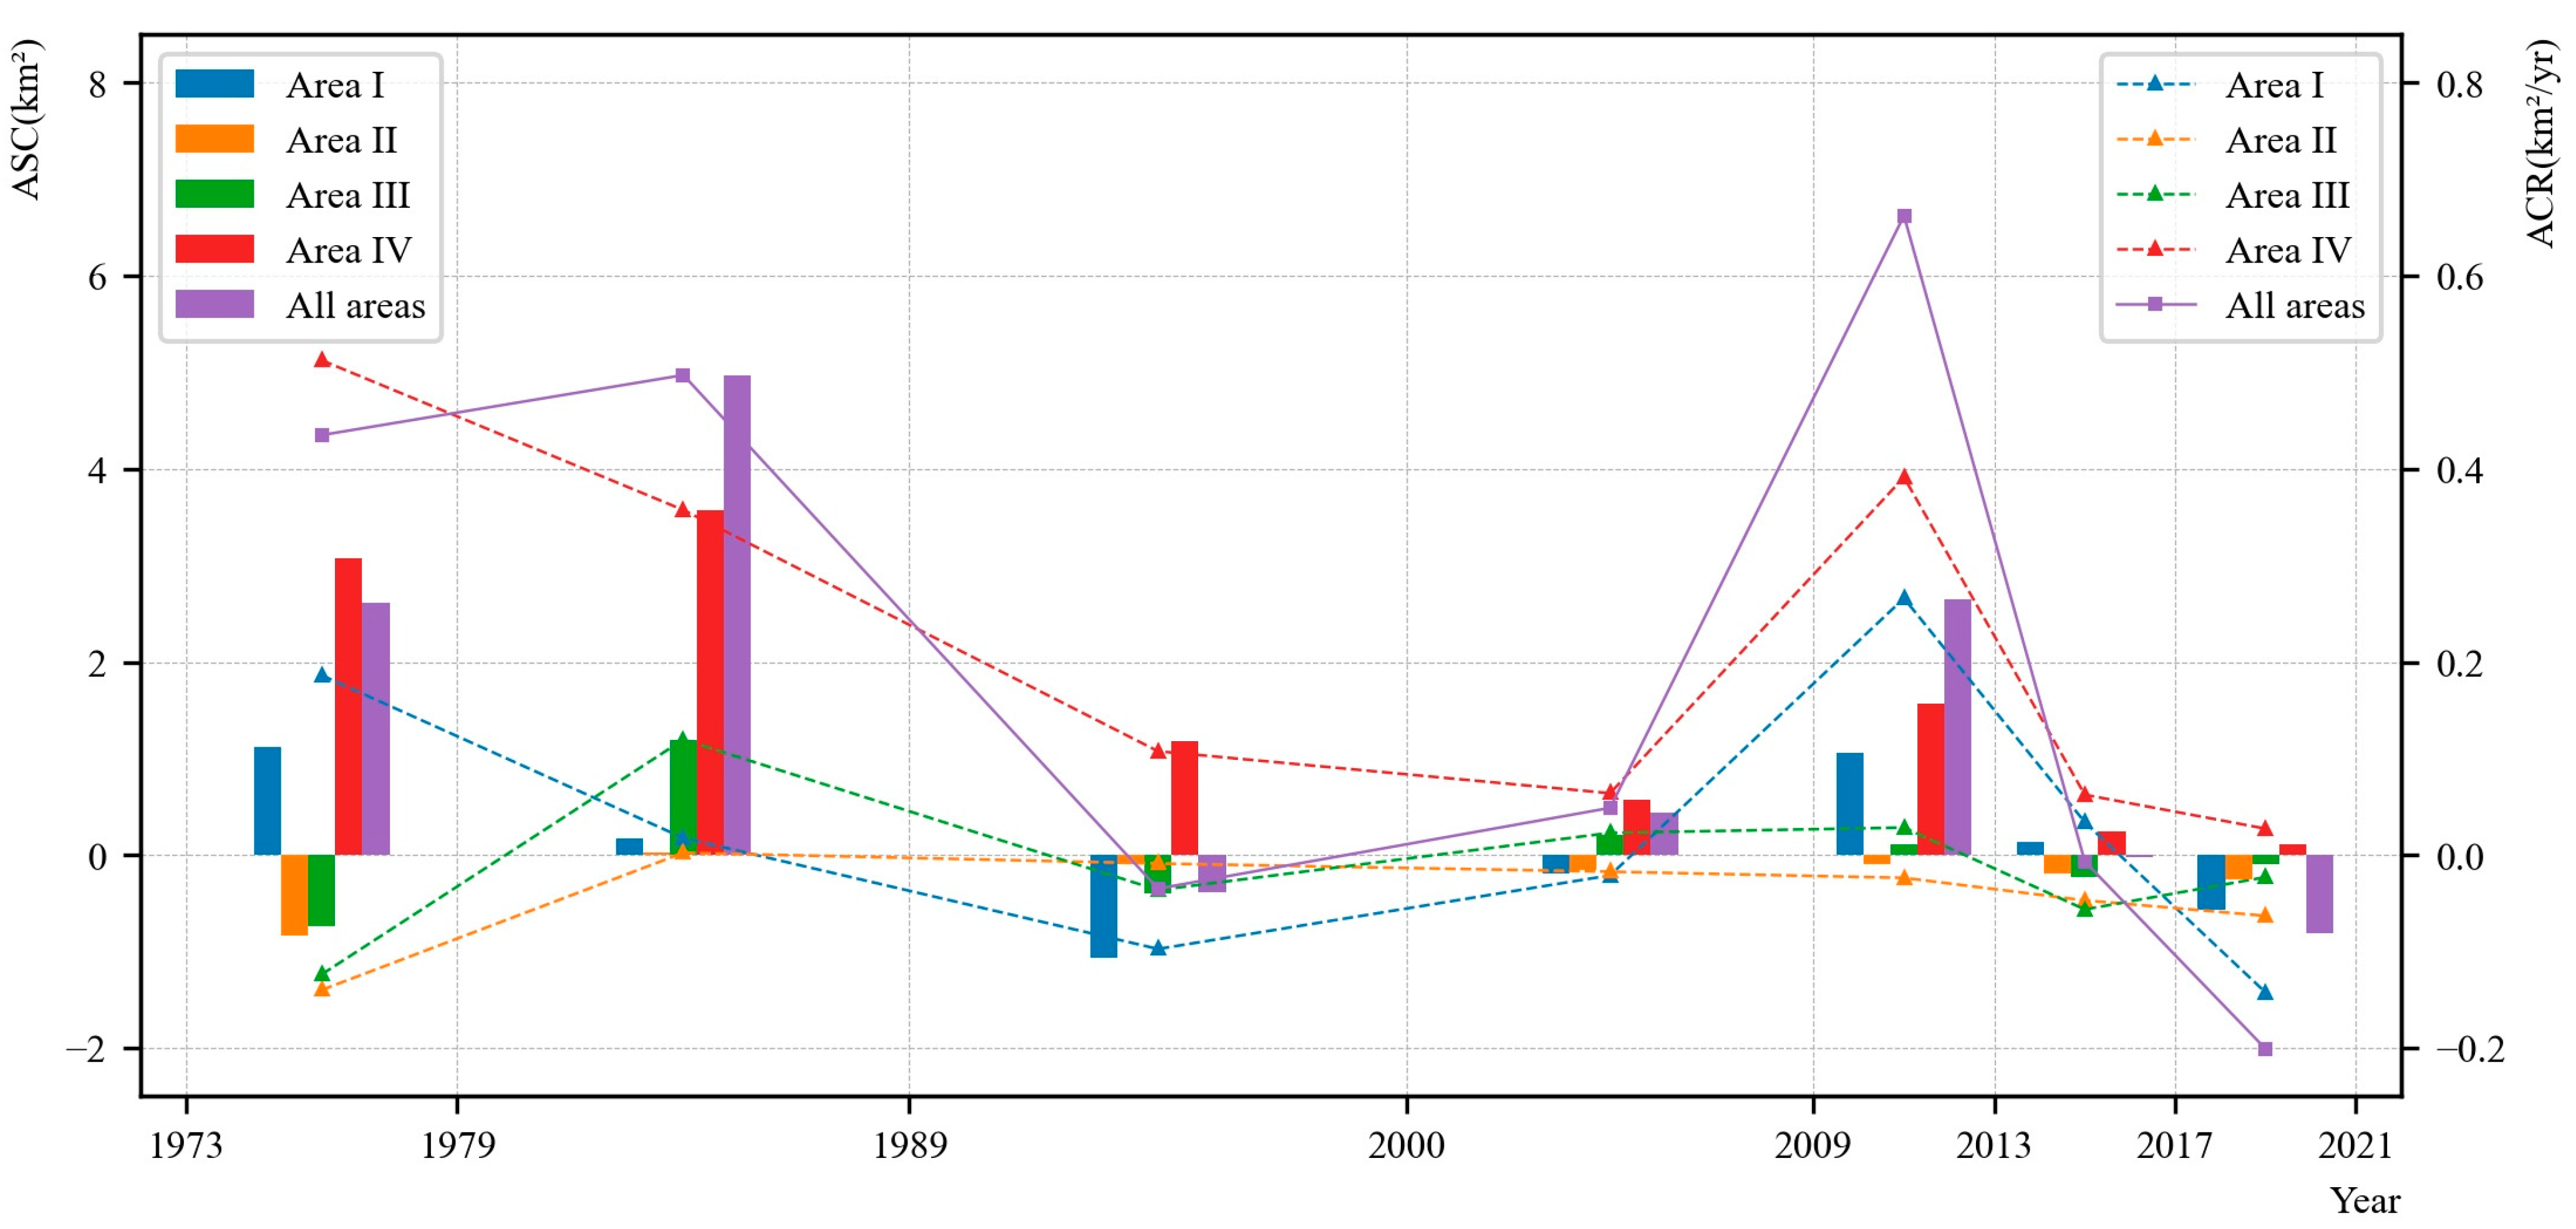
3.2. Coastal Erosion and Accretion

The two observed directions of coastline change were toward the continent and toward the ocean, corresponding to coastal erosion and accretion, respectively. Figure 8 shows the Area of Shoreline Change (ASC) and Area Change Rate (ACR) of the coast and Bilu Island for different periods, with positive values indicating coastal accretion and negative values indicating coastal erosion. The overall change in the Salween River Delta was accretion, with an overall accretion area of about 10 km2 (Figure 8). The rate of accretion in the Salween River Delta was not stable; with rapid accretion before 1989 and the largest accretion rate during 2009~2013, the overall accretion area was about 8 km2 during 1973~1989, with slow changes during 1989~2009, and an accretion area of about 3 km2 during 2009~2013, followed by an erosion area of about 1 km2 during 2013~2021. The ASC was largest in Area IV, followed by Areas I, III, and II. The change in the ASC was large in 1989, 2009, and 2013, and the change in Areas I and IV was consistent with the whole region.

4. Discussion

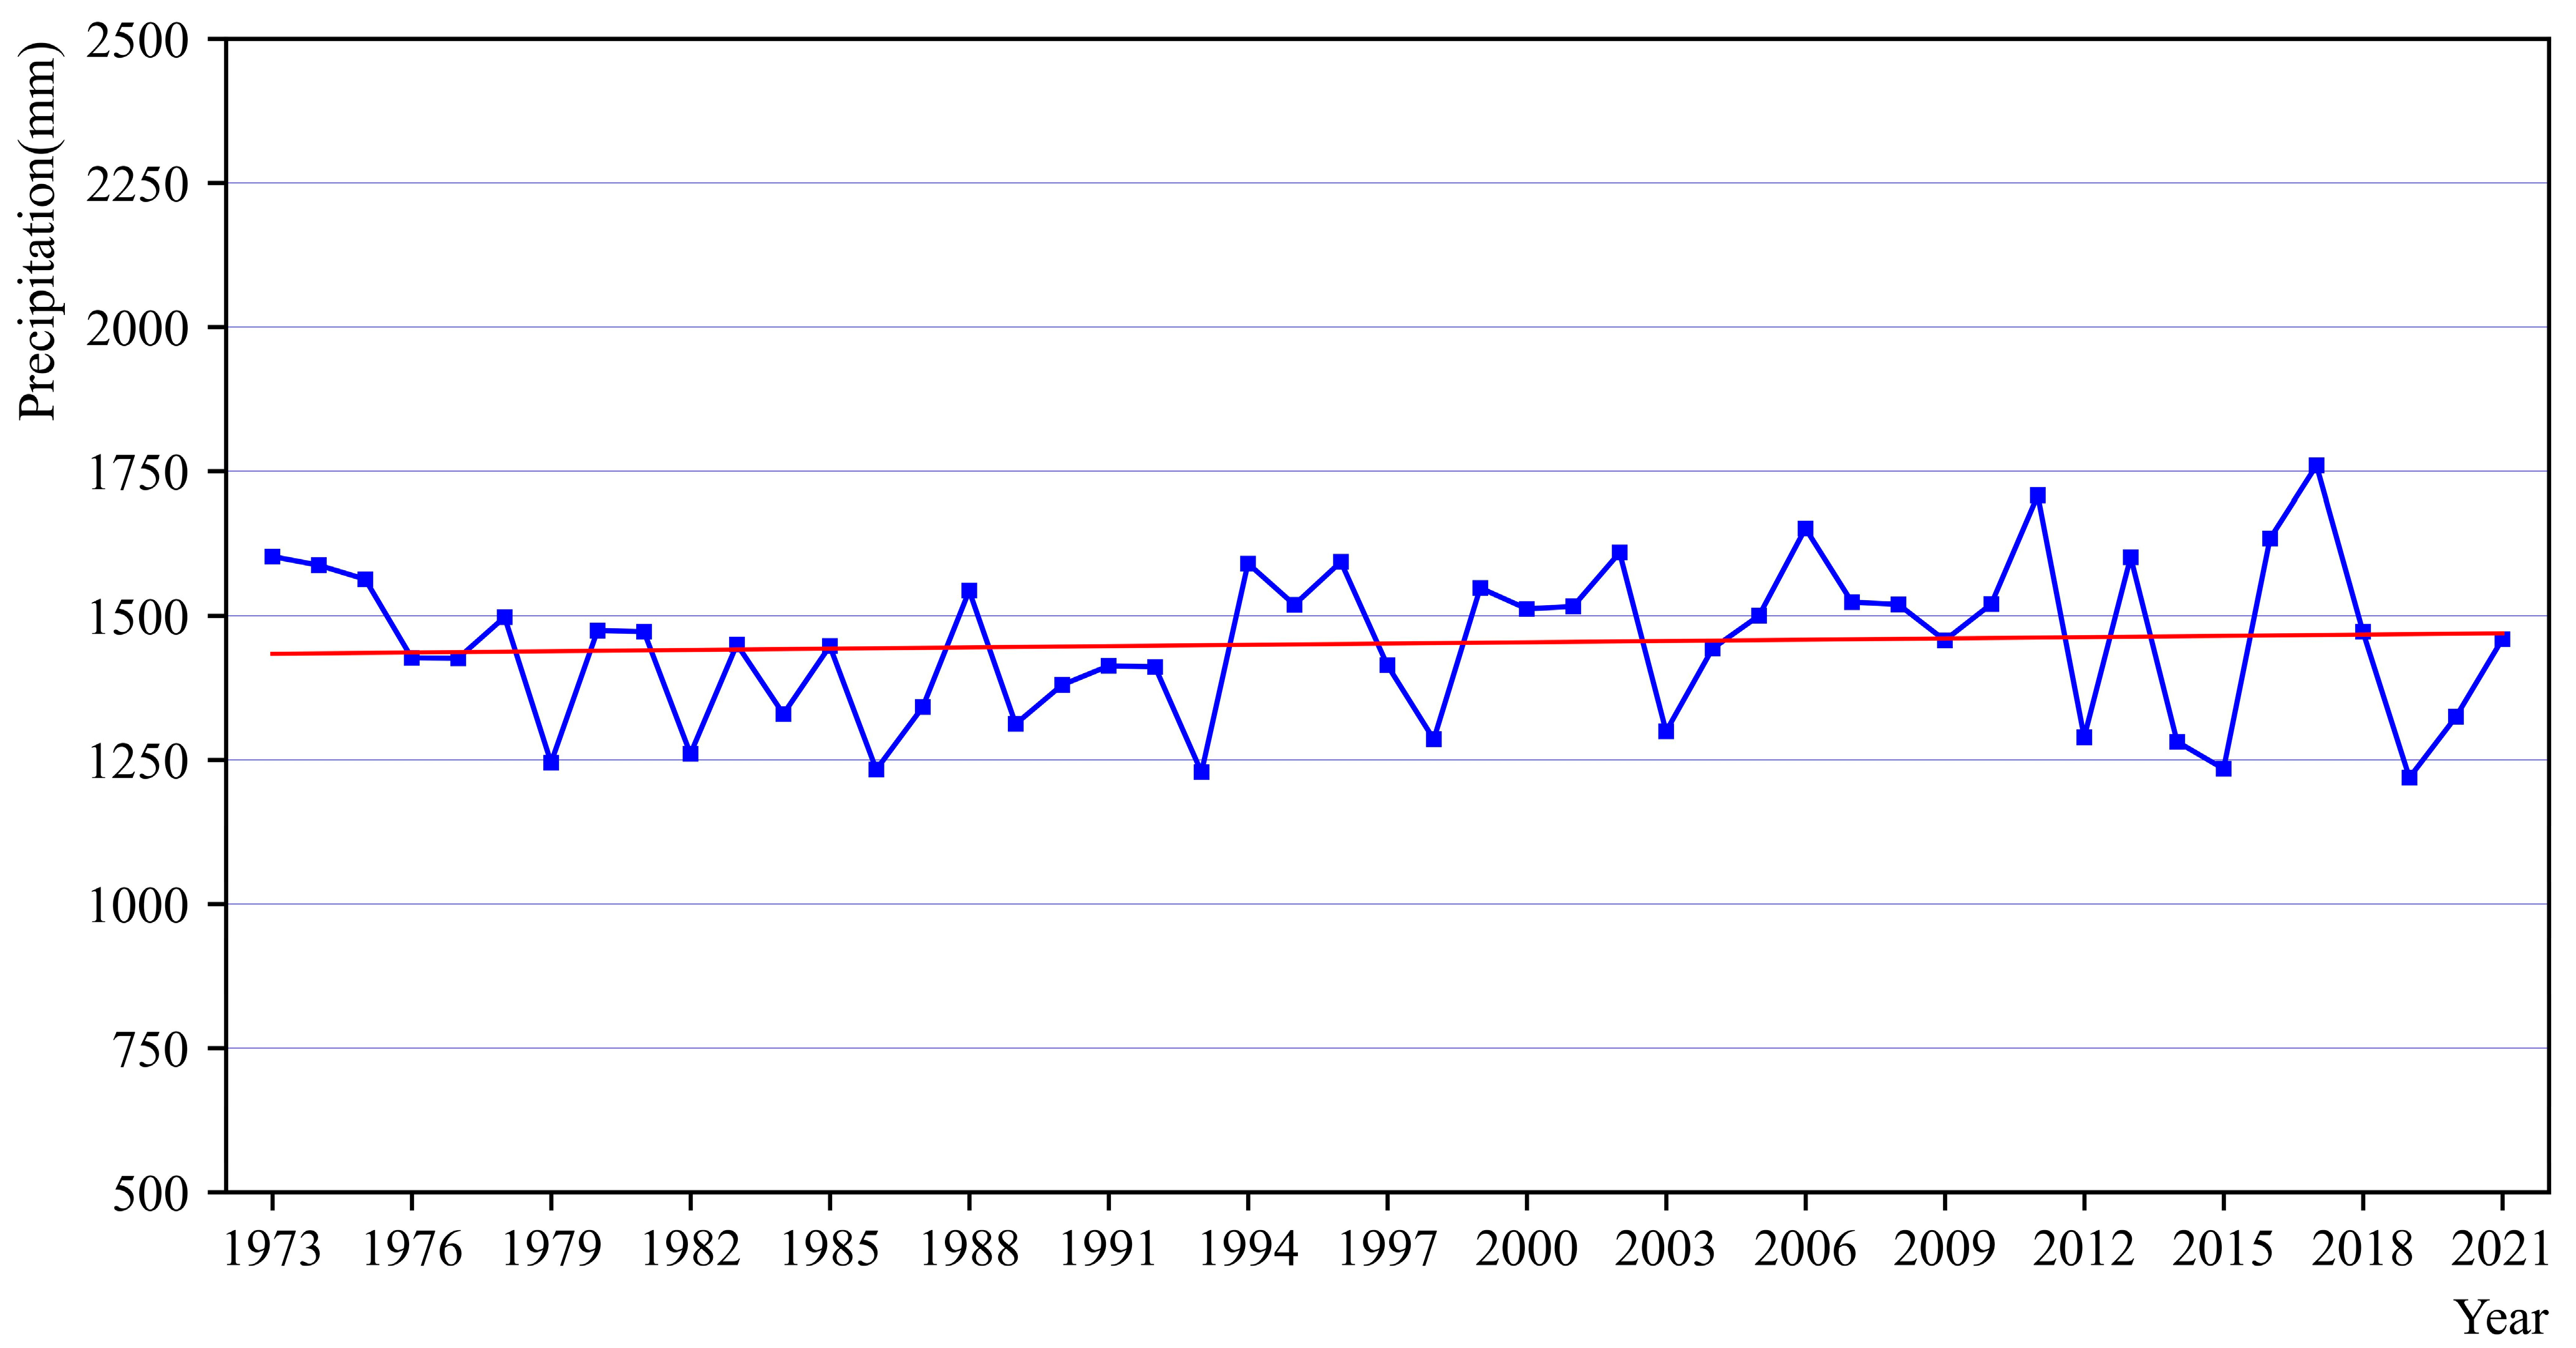
4.1. Reasons for the Evolution of the Salween River Delta

The spatial and temporal changes of the coastline of the Salween River Delta revealed that the processes were dominated by accretion, with rapid accretion on the ocean side and more gradual on the continental side. The Salween River, one of the few free-flowing rivers in the world, has no dams in its main channel, and its waterways are complete [6]. The river constantly carries large amounts of sediment from the upper reaches to the estuary deltas, where it is deposited. Therefore, the stability of the sediment supply and the integrity of the main channel is responsible for the accretion of the Salween River Delta.
Sediment transport is considered an essential factor that leads to coastal accretion or erosion [31]. The change in the solid runoff is the most important factor determining the influx of sediments into the delta. For the Salween River, given that no dams have yet been built on the river, the liquid runoff will reliably reflect the solid runoff of the river. National Centre for Atmospheric Sciences (NCAS) provides global monthly precipitation data covering the land surface from 1901 to 2021 (https://crudata.uea.ac.uk/cru/data/hrg/, accessed on 23 January 2023), on the basis of which to analyze the interannual variability of precipitation in the Salween River Basin (Figure 9). Annual precipitation increased by 0.74 mm/yr based on monthly precipitation data from 1973 to 2021 in the Salween River Basin. The increase in precipitation in the basin increases the sediment transported to the Salween River Delta, which contributes to its accretion. However, Figure 9 presents that the increase of precipitation is stable and slow, revealing its effect on runoff recharge and sediment transport capacity is also stable and general in the past 50 years.
The difference between the rapid accretion on the Indian Ocean side and the stability on the continental side of Bilu Island is underlying due to coastal sediment dynamics, in particular, a result of sediment back to the coastline under the influence of monsoon climate. Earlier research has shown that sediments in the northern Andaman Sea are mainly derived from the Irrawaddy River [32]; they are imported to the continental shelf with floods during the southwestern monsoon and high river flows [33], providing a material source for coastal accretion. The Andaman Sea in the north of the Indian Ocean is characterized by the seasonally-reversing Asian monsoon [34]. Due to the southwestern monsoon between May and September and the northeastern monsoon between December and February, the sediments in the Andaman Sea bays are resuspended under the powerful cyclonic and anti-cyclonic flows [35]. Subsequently, the sediments are deposited down the coast, leading to rapid accretion on the Indian Ocean side of Bilu Island.
The Salween River Delta was dominated by accretion. The combined Irrawaddy and Salween system is regarded as contributing 20% of the total flux of material from the Himalayan-Tibetan orogen [36], and these two rivers discharge about 600 Mt of sediment annually to the sea [36,37]. Recent research presents that there is an annual sediment flux of 326 Mt from the Irrawaddy and 159 Mt from the Salween River [38]. In addition, sediments delivered from the Ayeyarwady distributary mouths are mainly transported eastward to the Gulf of Martaban by waves and currents [39], so the coastline on the Indian Ocean side exhibited the largest change with rapid accretion. However, the rate of accretion was not stable. Accretion before 1989 was rapid, and during 1989~2009, it was very slow, and that may be related to the instability in sea level rise. Studies have shown that the global sea level has been rising on average since 1990, and the rate of rising increased after that [40]. The rate of sea level rise in the northern Indian Ocean was 0.68 ± 0.03 mm/yr between 1958 and 2015, and it accelerated to 2.3 ± 0.09 mm/yr between 1993 and 2015 [41]. Anomalous warming events detected during 1994~1995 and 1997~1998 have changed the upper Indian Ocean circulation [42]. Time series of sea level change in the Indian Ocean showed that the acceleration of sea level rise during 1994~1995 and 1997~1998 was significantly correlated with the El Nino-Southern Oscillation (ENSO) [43]. The accretion rate of the Salween River Delta during 1989~2009 was balanced with the rate of sea level rise [44], resulting in the overall slow change of the coastline changed.

4.2. A Comparison with Other River Deltas in Indochina

The Mekong River is an important international river in the Indochina Peninsula. It is similar to the Salween River in terms of geographical location, river direction, and climate. However, the difference between the Mekong and the Salween Rivers is damming of the Mekong River since the 1990s, with a decrease in the water level gradient and in sediment transport [45]. The drastic human intervention in the river system resulted in a continuous decrease in sediment flux into the ocean, which is one of the major reasons for the shrinkage of the Mekong River Delta [46].
Both, the Irrawaddy and the Salween River are among the few large rivers without dams in the main channel [6], and relatively scarce other human activities. The Irrawaddy and Salween Rivers now rank third in the world in total sediment transport [47]. However, large-scale agricultural expansion and mangrove deforestation in the delta have disturbed the balance of the delta [48]. Human activities reduce the supply of coarse sediment into the coastal plain, leading to further erosion of the delta. At the same time, deforestation and mining in the Irrawaddy Basin provide ultrafine sediments, a fraction of which is driven eastward to the northern Andaman Sea eventually becoming a source of material for accretion in the Salween River Delta [47].

4.3. Research Limitations and Future Needs

In this study, we used Landsat clear-sky remote sensing images to extract coastline parameters; Landsat images have the advantage of long time scale, convenience of data acquisition, and unified data processing, but the accuracy of coastline extraction is influenced by the poor spatial resolution of the early Landsat satellites. Initially, we wanted to extract coastline information from an acquired 1976 Keyhole image with higher spatial resolution and compare it to the Landsat image. However, the accuracy of the absolute location of the extracted coastline cannot be guaranteed because the Keyhole image does not contain location information. Therefore, the Keyhole image was only used as a reference for the base map in Figure 3.
The state of the tide can influence the position of the coastline, and we try to determine the state of the tide. However, all remote sensing images were acquired at around ten o’clock in the morning, but the tidal periodicity is close to a day but not a day, so the tidal state at the time of image acquisition is inconsistent and uncertain due to the unavailability of the tidal data at the time of image acquisition. We corrected the boundary with visual interpretation during the process of coastline extraction, but it did not give some consideration to the influence of tides. Therefore, we roughly calculated the maximum tidal impact on the coastline location based on the maximum tidal range of the Salween River Delta and the average coastal slope [49]. The Salween River delta is located in the eastern part of the Gulf of Martaban, which has a maximum tidal range of 4 m [35]. We calculated the average coastal slope (α) which is 3.19° according to the DEM with a resolution of 30 m. Then, we calculated the maximum tidal impact on the coastline location which is 72 m according to the formula:
T = R / sin α
where R represents the maximum tidal range and T represents the maximum tidal impact on the coastline location.
Determination of baseline and transect interval (L) in DSAS influences the ability to describe coastline changes and coastal erosion and accretion [45], especially for curved coastlines. Too large L will not accurately describe the shoreline variation, and a too small L will result in the intersection of coastline transects and increase the computational complexity. We compared multiple values of L, with L as small as possible in the condition that the coastline transects do not intersect as much as possible. One of the better solutions is to separate the coastline based on its curvature and set a dynamic sampling interval. Since the coastline in this study was generally straight, this had little influence on our results; it is, however, worthwhile to conduct further studies in other study areas.
We summarized the spatial and temporal evolution and discussed the natural and human influences on the Salween River Delta, and compared it to the evolutionary characteristics of other river deltas in Indochina. However, empirical evidence is still needed to fully describe the dynamic evolution mechanisms of the Salween Delta. For example, storms and typhoons may have a serious impact on the coast, which will be an important part of our future work.

5. Conclusions

In the Salween River Delta, the overall change of the coastline was more rapid on the island than on the continent, and on the Indian Ocean side more than on the continental side. The length of the continental coastline decreased, and the area of islands and the length of the Bilu Island coastline increased from 1973 to 2021.
The average LRR of the overall coastline was 4.69 m/yr. The coastline on the Indian Ocean side exhibited the largest change with an LRR of 21.52 m/yr, while the coastline on the continental side of Bilu Island exhibited the smallest change. The southern branch of the continental coastline shifted toward the continent, while the western branch of the continental coastline, the continental side of Bilu Island, and the Indian Ocean side expanded toward the ocean.
The Salween River Delta was dominated by accretion, with an overall accretion area of about 10 km2 from 1973 to 2021. However, the accretion rate was not stable, with rapid accretion before 1989, very slow accretion between 1989 and 2009, a maximum accretion rate between 2009 and 2013, and slow erosion between 2013 and 2021.

Author Contributions

Conceptualization, Z.S. and A.H.; methodology, A.H.; validation, A.H., J.H. and J.Z.; formal analysis, A.H.; investigation, Z.S.; resources, Z.S., C.Y. and J.Z.; data curation, C.Y. and A.H.; writing—original draft preparation, A.H.; writing—review and editing, Z.S. and J.H.; visualization, C.Y. and J.Z.; supervision, Z.S. and J.H.; project administration, Z.S.; funding acquisition, Z.S. and J.H. All authors have read and agreed to the published version of the manuscript.

Funding

This research was funded by National Natural Science Foundation of China (NSFC), grant number 41906148 and 42271086.

Data Availability Statement

Landsat remote sensing images come from USGS Earth Explorer (https://earthexplorer.usgs.gov/, accessed on 17 September 2022). Precipitation data come from National Centre for Atmospheric Sciences (https://crudata.uea.ac.uk/cru/data/hrg/, accessed on 23 January 2023).

Acknowledgments

The authors are grateful to the United States Geological Survey (USGS) for developing the Digital Shoreline Analysis System.

Conflicts of Interest

The authors declare no conflict of interest.

References

  1. Jordan, C.; Visscher, J.; Dung, N.V.; Apel, H.; Schlurmann, T. Impacts of human activity and global changes on future morphodynamics within the Tien River, Vietnamese Mekong Delta. Water 2020, 12, 2204. [Google Scholar] [CrossRef]
  2. Zhang, W.; Xu, Y.J.; Guo, L.; Lam, N.S.; Xu, K.; Yang, S.; Yao, Q.; Liu, K. Comparing the Yangtze and Mississippi River Deltas in the light of coupled natural-human dynamics: Lessons learned and implications for management. Geomorphology 2022, 399, 108075. [Google Scholar] [CrossRef]
  3. Giosan, L.; Syvitski, J.; Constantinescu, S.; Day, J. Climate change: Protect the world’s deltas. Nature 2014, 516, 31–33. [Google Scholar] [CrossRef] [PubMed] [Green Version]
  4. Wu, Z.; Milliman, J.D.; Zhao, D.; Cao, Z.; Zhou, J.; Zhou, C. Geomorphologic changes in the lower Pearl River Delta, 1850–2015, largely due to human activity. Geomorphology 2018, 314, 42–54. [Google Scholar] [CrossRef]
  5. Roy, S.; Robeson, S.M.; Ortiz, A.C.; Edmonds, D.A. Spatial and temporal patterns of land loss in the Lower Mississippi River Delta from 1983 to 2016. Remote Sens. Environ. 2020, 250, 112046. [Google Scholar] [CrossRef]
  6. Grill, G.; Lehner, B.; Thieme, M.; Geenen, B.; Tickner, D.; Antonelli, F.; Babu, S.; Borrelli, P.; Cheng, L.; Crochetiere, H.; et al. Mapping the World’s Free-flowing Rivers. Nature 2019, 569, 215–221. [Google Scholar] [CrossRef]
  7. Sahoo, B.; Bhaskaran, P.K. A comprehensive data set for tropical cyclone storm surge-induced inundation for the east coast of India. Int. J. Climatol. 2018, 38, 403–419. [Google Scholar] [CrossRef]
  8. Sreeraj, P.; Swapna, P.; Krishnan, R.; Nidheesh, A.G.; Sandeep, N. Extreme sea level rise along the Indian Ocean coastline: Observations and 21st century projections. Environ. Res. Lett. 2022, 17, 114016. [Google Scholar] [CrossRef]
  9. Li, J.; Ye, M.; Pu, R.; Liu, Y.; Guo, Q.; Feng, B.; Huang, R.; He, G. Spatiotemporal change patterns of coastlines in Zhejiang Province, China, over the last twenty-five years. Sustainability 2018, 10, 477. [Google Scholar] [CrossRef] [Green Version]
  10. Song, Y.; Li, D.; Hou, X. Characteristics of mainland coastline changes in Southeast Asia during the 21st century. J. Coast. Res. 2019, 36, 261–275. [Google Scholar] [CrossRef]
  11. Wang, C.; Yang, J.; Li, J.; Chu, J. Deriving natural coastlines using multiple satellite remote sensing images. J. Coast. Res. 2020, 102, 296–302. [Google Scholar] [CrossRef]
  12. Boak, E.H.; Turner, I.L. Shoreline definition and detection: A review. J. Coast. Res. 2005, 21, 688–703. [Google Scholar] [CrossRef] [Green Version]
  13. Ding, Y.; Yang, X.; Jin, H.; Wang, Z.; Liu, Y.; Liu, B.; Zhang, J.; Liu, X.; Gao, K.; Meng, D. Monitoring coastline changes of the Malay Islands based on Google Earth Engine and dense time-series remote sensing images. Remote Sens. 2021, 13, 3842. [Google Scholar] [CrossRef]
  14. Zerrouk, E. Water grabbing/ land grabbing in shared water basins the case of Salween River Hatgyi Dam. J. Water Resour. Ocean Sci. 2013, 2, 68–78. [Google Scholar] [CrossRef] [Green Version]
  15. Yang, Y.; Tian, Y.; He, C.; Huang, Z.; Dong, S.; Wang, B.; Li, G.; Xiang, Z.; Long, Y.; Xiao, W. The Critically Endangered Myanmar snub-nosed monkey Rhinopithecus strykeri found in the Salween River Basin, China. Oryx 2016, 52, 134–136. [Google Scholar] [CrossRef] [Green Version]
  16. Rokni, K.; Ahmad, A.; Selamat, A.; Hazini, S. Water feature extraction and change detection using multitemporal Landsat imagery. Remote Sens. 2014, 6, 4173–4189. [Google Scholar] [CrossRef] [Green Version]
  17. Anthony, E.J.; Brunier, G.; Besset, M.; Goichot, M.; Dussouillez, P.; Nguyen, V.L. Linking rapid erosion of the Mekong River delta to human activities. Sci. Rep. 2015, 5, 14745. [Google Scholar] [CrossRef] [PubMed] [Green Version]
  18. Hu, X.; Wang, Y. Coastline fractal dimension of mainland, island, and estuaries using multi-temporal Landsat remote sensing data from 1978 to 2018: A case study of the Pearl River estuary area. Remote Sens. 2020, 12, 2482. [Google Scholar] [CrossRef]
  19. Dewidar, K.; Bayoumi, S. Forecasting shoreline changes along the Egyptian Nile Delta coast using Landsat image series and Geographic Information System. Environ. Monit. Assess. 2021, 193, 429. [Google Scholar] [CrossRef] [PubMed]
  20. Li, C.; Zhu, L.; Dai, Z.; Wu, Z. Study on spatiotemporal evolution of the Yellow River Delta coastline from 1976 to 2020. Remote Sens. 2021, 13, 4789. [Google Scholar] [CrossRef]
  21. Moussaid, J.; Fora, A.A.; Zourarah, B.; Maanan, M.; Maanan, M. Using automatic computation to analyze the rate of shoreline change on the Kenitra coast, Morocco. Ocean Eng. 2015, 102, 71–77. [Google Scholar] [CrossRef]
  22. Kale, M.M.; Ataol, M.; Tekkanat, I.S. Assessment of shoreline alterations using a Digital Shoreline Analysis System: A case study of changes in the Yeşilırmak Delta in northern Turkey from 1953 to 2017. Environ. Monit. Assess. 2019, 191, 398. [Google Scholar] [CrossRef] [PubMed]
  23. Wang, H.; Chen, F. Increased stream flow in the Nu River (Salween) Basin of China, due to climatic warming and increased precipitation. Geogr. Ann. A 2017, 99, 327–337. [Google Scholar] [CrossRef]
  24. Chen, Y.; Gagen, M.H.; Chen, F.; Zhang, H.; Shang, H.; Xu, H. Precipitation variations recorded in tree rings from the upper Salween and Brahmaputra River valleys, China. Ecol. Indic. 2020, 113, 106189. [Google Scholar] [CrossRef]
  25. Shimozono, T.; Tajima, Y.; Akamatsu, S.; Matsuba, Y.; Kawasaki, A. Large-scale channel migration in the Sittang River estuary. Sci. Rep. 2019, 9, 9862. [Google Scholar] [CrossRef] [Green Version]
  26. Xu, H. Modification of normalised difference water index (NDWI) to enhance open water features in remotely sensed imagery. Int. J. Remote Sens. 2006, 27, 3025–3033. [Google Scholar] [CrossRef]
  27. Sunder, S.; Ramsankaran, R.; Ramakrishnan, B. Inter-comparison of remote sensing sensing-based shoreline mapping techniques at different coastal stretches of India. Environ. Monit. Assess. 2017, 189, 290. [Google Scholar] [CrossRef]
  28. Kuleli, T.; Guneroglu, A.; Karsli, F.; Dihkan, M. Automatic detection of shoreline change on coastal Ramsar wetlands of Turkey. Ocean Eng. 2011, 38, 1141–1149. [Google Scholar] [CrossRef]
  29. Darwish, K.; Smith, S.E.; Torab, M.; Monsef, H.; Hussein, O. Geomorphological changes along the Nile Delta coastline between 1945 and 2015 detected using satellite remote sensing and GIS. J. Coast. Res. 2017, 33, 786–794. [Google Scholar] [CrossRef]
  30. Nassar, K.; Mahmod, W.E.; Fath, H.; Masria, A.; Nadaoka, K.; Negm, A. Shoreline change detection using DSAS technique: Case of North Sinai coast, Egypt. Mar. Georesour. Geotec. 2019, 37, 81–95. [Google Scholar] [CrossRef]
  31. Hua, L.L.; Ding, P.X.; Yang, S.L.; Wang, Z.B. Accretion-erosion conversion in the subaqueous Yangtze Delta in response to fluvial sediment decline. Geomorphology 2021, 382, 107680. [Google Scholar]
  32. Sarun Lal, M.A.; Sijinkumar, A.V.; Nath, B.N.; Sandeep, K.; Badesab, F. Environmental magnetic records of the sediments from the Andaman Sea: Evidence for late Quaternary changes in provenance and monsoon. OCEANS 2022-Chennai 2022, 1–9. [Google Scholar] [CrossRef]
  33. Huang, Q.; Long, D.; Han, Z.; Han, P. High-resolution satellite images combined with hydrological modeling derive river discharge for headwaters: A step toward discharge estimation in ungauged basins. Remote Sens. Environ. 2022, 277, 113030. [Google Scholar] [CrossRef]
  34. Wyrtki, K. Physical Oceanography of the Indian Ocean. In The Biology of the Indian Ocean; Zeitschel, B., Gerlach, S.A., Eds.; Springer: Berlin/Heidelberg, Germany, 1973; pp. 18–36. [Google Scholar]
  35. Ramaswamy, V.; Rao, P.S.; Rao, K.H.; Thwin, S.; Rao, N.S.; Raiker, V. Tidal influence on suspended sediment distribution and dispersal in the northern Andaman Sea and Gulf of Martaban. Mar. Geol. 2004, 208, 33–42. [Google Scholar] [CrossRef]
  36. Robinson, R.A.J.; Bird, M.I.; Oo, N.W.; Hoey, T.B.; Aye, M.M.; Higgitt, D.L.; Lu, X.X.; Swe, A.; Tun, T.; Win, S.L. The Irrawaddy River sediment flux to the Indian Ocean: The original nineteenth-century data revisited. J. Geol. 2007, 115, 629–640. [Google Scholar] [CrossRef] [Green Version]
  37. Liu, J.P.; Kuehl, S.A.; Pierce, A.C.; Williams, J.; Blair, N.E.; Harris, C.; Aung, D.W.; Aye, Y.Y. Fate of Ayeyarwady and Thanlwin Rivers Sediments in the Andaman Sea and Bay of Bengal. Mar. Geol. 2020, 423, 106137. [Google Scholar] [CrossRef]
  38. Baronas, J.J.; Stevenson, E.I.; Hackney, C.R.; Darby, S.E.; Bickle, M.J.; Hilton, R.G. Integrating suspended sediment flux in large alluvial river channels: Application of a synoptic Rouse-based model to the Irrawaddy and Salween rivers. J. Geophys. Res.-Earth. 2020, 125, e2020JF005554. [Google Scholar] [CrossRef]
  39. Anthony, E.J.; Besset, M.; Dussouillez, P.; Goichot, M.; Loisel, H. Overview of the Monsoon-influenced Ayeyarwady River delta, and delta shoreline mobility in response to changing fluvial sediment supply. Mar. Geol. 2019, 417, 106038. [Google Scholar] [CrossRef]
  40. Church, J.A.; White, N.J. A 20th century acceleration in global sea-level rise. Geophys. Res. Lett. 2006, 33, L01602. [Google Scholar] [CrossRef]
  41. Swapna, P.; Jyoti, J.; Krishnan, R.; Sandeep, N.; Griffies, S.M. Multidecadal weakening of Indian summer monsoon circulation induces an increasing northern Indian Ocean sea level. Geophys. Res. Lett. 2017, 44, 10560–10572. [Google Scholar] [CrossRef]
  42. Chambers, D.P.; Tapley, B.D.; Stewart, R.H. Anomalous warming in the Indian Ocean coincident with El Nino. J. Geophys. Res. 1999, 104, 3035–3047. [Google Scholar] [CrossRef]
  43. Tiwari, V.M.; Cabanes, C.; DoMinh, K.; Cazenave, A. Correlation of interannual sea level variations in the Indian Ocean from Topex/Poseidon altimetry, temperature data and tide gauges with ENSO. Glob. Planet Chang. 2004, 43, 183–196. [Google Scholar] [CrossRef]
  44. Hedley, P.J.; Bird, M.I.; Robinson, R.A.J. Evolution of the Irrawaddy delta region since 1850. Geogr. J. 2010, 176, 138–149. [Google Scholar] [CrossRef]
  45. Li, X.; Liu, J.P.; Saito, Y.; Nguyen, V.L. Recent evolution of the Mekong Delta and the impacts of dams. Earth-Sci. Rev. 2017, 175, 1–17. [Google Scholar] [CrossRef]
  46. Wang, H.; Saito, Y.; Zhang, Y.; Bi, N.; Sun, X.; Yang, Z. Recent changes of sediment flux to the western Pacific Ocean from major rivers in East and Southeast Asia. Earth-Sci. Rev. 2011, 108, 80–100. [Google Scholar] [CrossRef]
  47. Chen, D.; Li, X.; Saito, Y.; Liu, J.P.; Duan, Y.; Liu, S.; Zhang, L. Recent evolution of the Irrawaddy (Ayeyarwady) Delta and the impacts of anthropogenic activities: A review and remote sensing survey. Geomorphology 2020, 365, 107231. [Google Scholar] [CrossRef]
  48. Webb, E.L.; Jachowski, N.R.A.; Phelps, J.; Friess, D.A.; Than, M.M.; Ziegler, A.D. Deforestation in the Ayeyarwady Delta and the conservation implications of an internationally-engaged Myanmar. Glob. Environ. Chang. 2014, 24, 321–333. [Google Scholar] [CrossRef]
  49. Hu, X.Y.; Wang, Y.P. Monitoring coastline variations in the Pearl River Estuary from 1978 to 2018 by integrating Canny edge detection and Otsu methods using long time series Landsat dataset. CATENA 2022, 209, 105840. [Google Scholar] [CrossRef]
Figure 1. Location of the Salween River Delta with the red frame (a), division of the study area (b), and multi-spectral clear-sky remote sensing images of Landsat series data (c).
Remotesensing 15 01467 g001
Figure 2. The length of coastlines and the area of islands. The blue solid line represents the total area of all islands, the blue dashed line represents the area of Bilu Island, the red solid line represents the length of the continental coastline, and the red dashed line represents the length of the Bilu Island coastline.
Remotesensing 15 01467 g002
Figure 3. Location of the continental and Bilu Island coastlines in 1973, 1979, 1989, 2000, 2009, and 2021; the areas with intense changes in (ad), the base map is the Keyhole image of the Salween River Delta in 1976.
Remotesensing 15 01467 g003
Figure 4. The Linear Regression Rate (LRR) of continental Bilu Island coastlines; red indicates coastline movement towards the continent (receding coastline); blue indicates coastline expansion toward the ocean.
Remotesensing 15 01467 g004
Figure 5. Time series change in characteristic transects length along the coastline. Characteristic transects were defined as one per 25 transects selected from among 1917 transects to describe the spatial and temporal evolution of the coastline.
Remotesensing 15 01467 g005
Figure 6. Spatial and temporal change in the coastline. The horizontal axis shows the number of coastline transects, and the vertical axis is the distance between the baseline and coastline for different periods of the transect. The 0 indicates baseline; lines below the baseline indicate that the coastline is receding toward the continent; lines above the baseline indicate expansion of the coastline toward the ocean.
Remotesensing 15 01467 g006
Figure 7. Coastline change distance and the End Point Rate (EPR) for Area I, Area II, Area III, Area IV, and the whole region.
Remotesensing 15 01467 g007
Figure 8. The Area of Shoreline Change (ASC) and Area Change Rate (ACR) for Area I, Area II, Area III, Area IV, and the whole region.
Remotesensing 15 01467 g008
Figure 9. The interannual variability of precipitation in the Salween River Basin from 1973 to 2021.
Remotesensing 15 01467 g009
Table 1. Information table of clear-sky remote sensing images.
YearSatelliteSensorBandsWRS (Path/Row)Cloud Cover (%)Spatial Resolution (m)
1973Landsat-1MSS4131/490.0080 × 80
1979Landsat-3MSS4141/492.0080 × 80
1989Landsat-4TM7131/490.0080 × 80
2000Landsat-7ETM+8131/490.0030 × 30
2003Landsat-7ETM+8131/493.0030 × 30
2009Landsat-5TM7131/490.0030 × 30
2012Landsat-5TM7131/496.0030 × 30
2013Landsat-8OLI, TIRS11131/496.7230 × 30
2014Landsat-8OLI, TIRS11131/490.0330 × 30
2015Landsat-8OLI, TIRS11131/492.0530 × 30
2016Landsat-8OLI, TIRS11131/493.6530 × 30
2017Landsat-8OLI, TIRS11131/490.0430 × 30
2018Landsat-8OLI, TIRS11131/490.1930 × 30
2019Landsat-8OLI, TIRS11131/490.0030 × 30
2020Landsat-8OLI, TIRS11131/490.8230 × 30
2021Landsat-8OLI, TIRS11131/490.9030 × 30
Disclaimer/Publisher’s Note: The statements, opinions and data contained in all publications are solely those of the individual author(s) and contributor(s) and not of MDPI and/or the editor(s). MDPI and/or the editor(s) disclaim responsibility for any injury to people or property resulting from any ideas, methods, instructions or products referred to in the content.

