
Fuzzy Assessment of Ecological Security on the Qinghai–Tibet Plateau Based on Pressure–State–Response Framework

Abstract
:
1. Introduction
2. Materials and Methods
2.1. Study Area
2.2. Methods
2.2.1. PSR Framework Construction
2.2.2. The Fuzzy Evaluation Model
- (i)
- A Mamdani FIS model (Figure 3) was constructed for each indicator through the fuzzy inference system toolbox in MATLAB software (version R2018b). The core part of fuzzification of the input index was establishment of fuzzy membership functions and fuzzy rules, which determines whether an index value belongs to a label of the fuzzy set (Equation (1)),where A represents the subfuzzy set, x indicates the actual value of a single index, X represents the domain of a certain index, μA (x) represents the membership degree of an index on the sub-fuzzy set and has a value between [0,1].
- (ii)
- The fuzzy evaluation scores for each indicator were calculated by using a linear trigonometric function. The median value of the interval was the vertex of the triangle with a membership degree of 1.0, and the membership degree of the value at the intersection of the two intervals was set as 0.5. A defuzzification program was used to convert fuzzy membership degrees into fuzzy evaluation scores.
- (iii)
- With regard to the determination of weights, the dimensionality and magnitude of the original data were significantly different. Data were preprocessed and normalized to eliminate this influence. Different indicators have different positive and negative tendency toward the index layer, and thus they were treated separately. We havewhere represents the original value of the raster I on the index layer j, , and represent the maximum and minimum value in the grid of index layer j. The standardized values were used to calculate the information entropy of the index and determine the final weight wj,where represents the weight of the grid i under the index layer j. A new function rule was defined as follows: When = 0, it was specified = 0. Please refer to Table 2 for detailed calculation results.
- (iv)
- The comprehensive evaluation score of ecological security was determined based on the multiplication principle [5]:
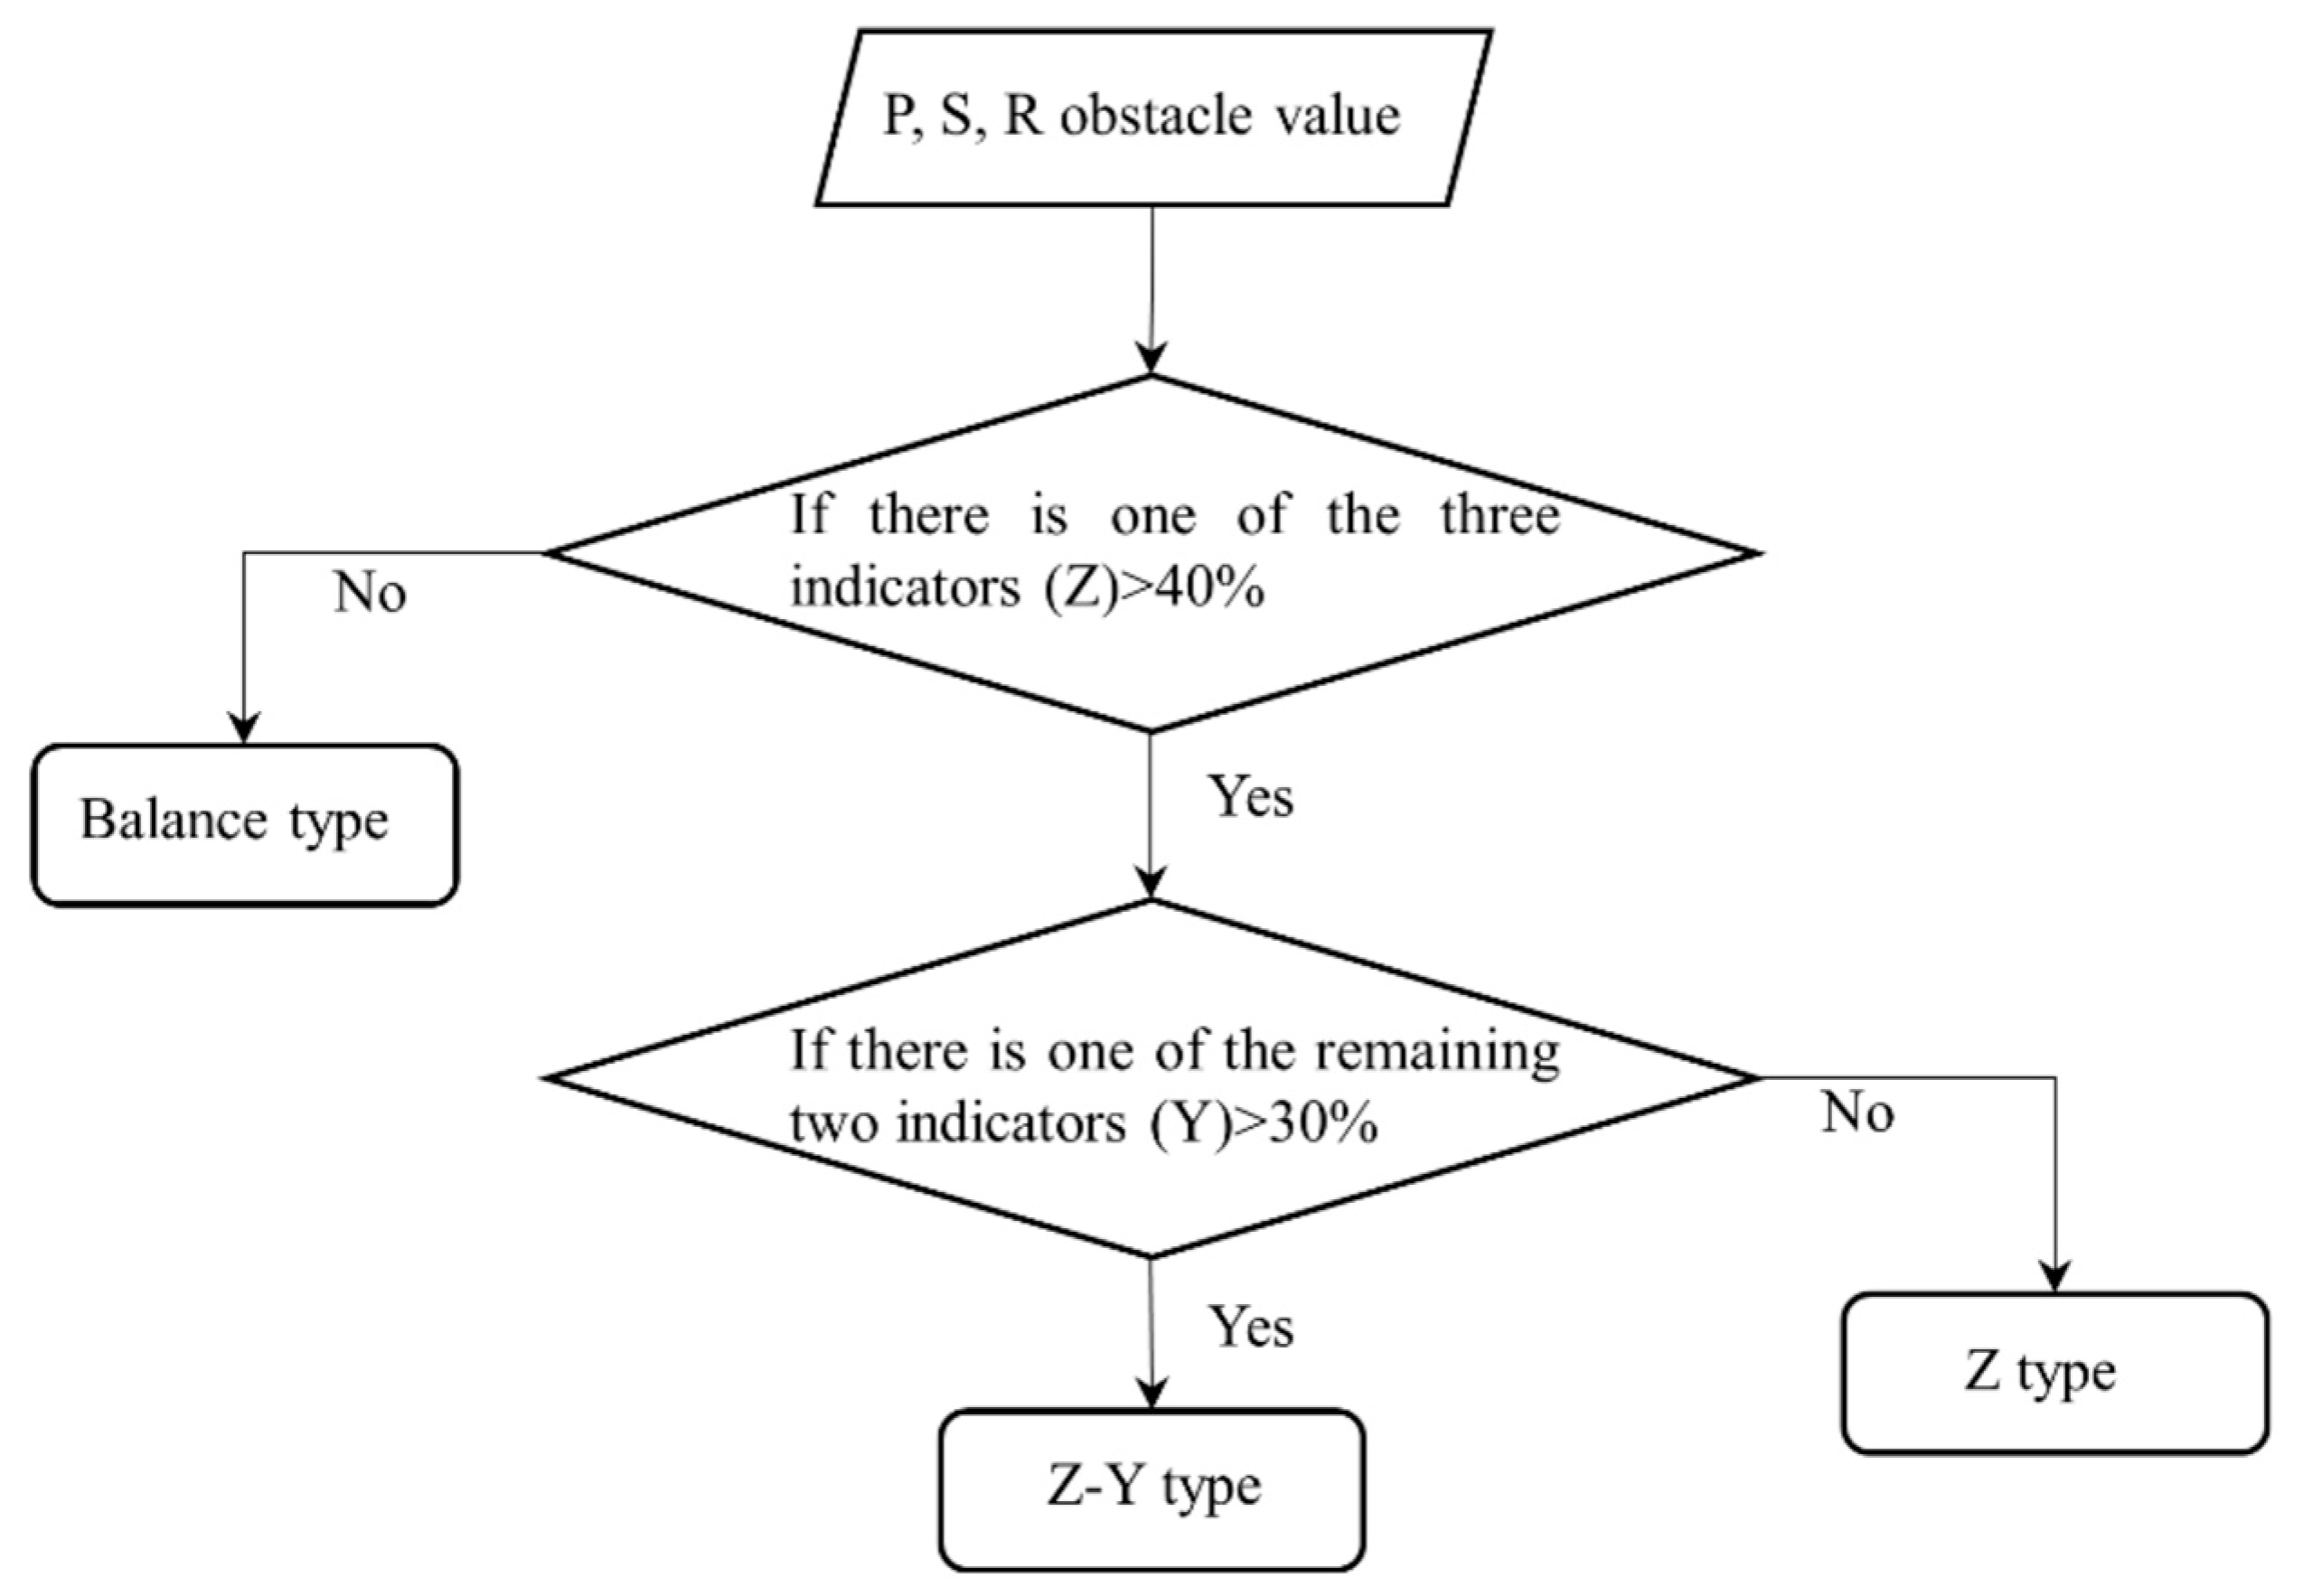
2.2.3. Determinations of Obstacle Factors of Ecological Security
3. Results
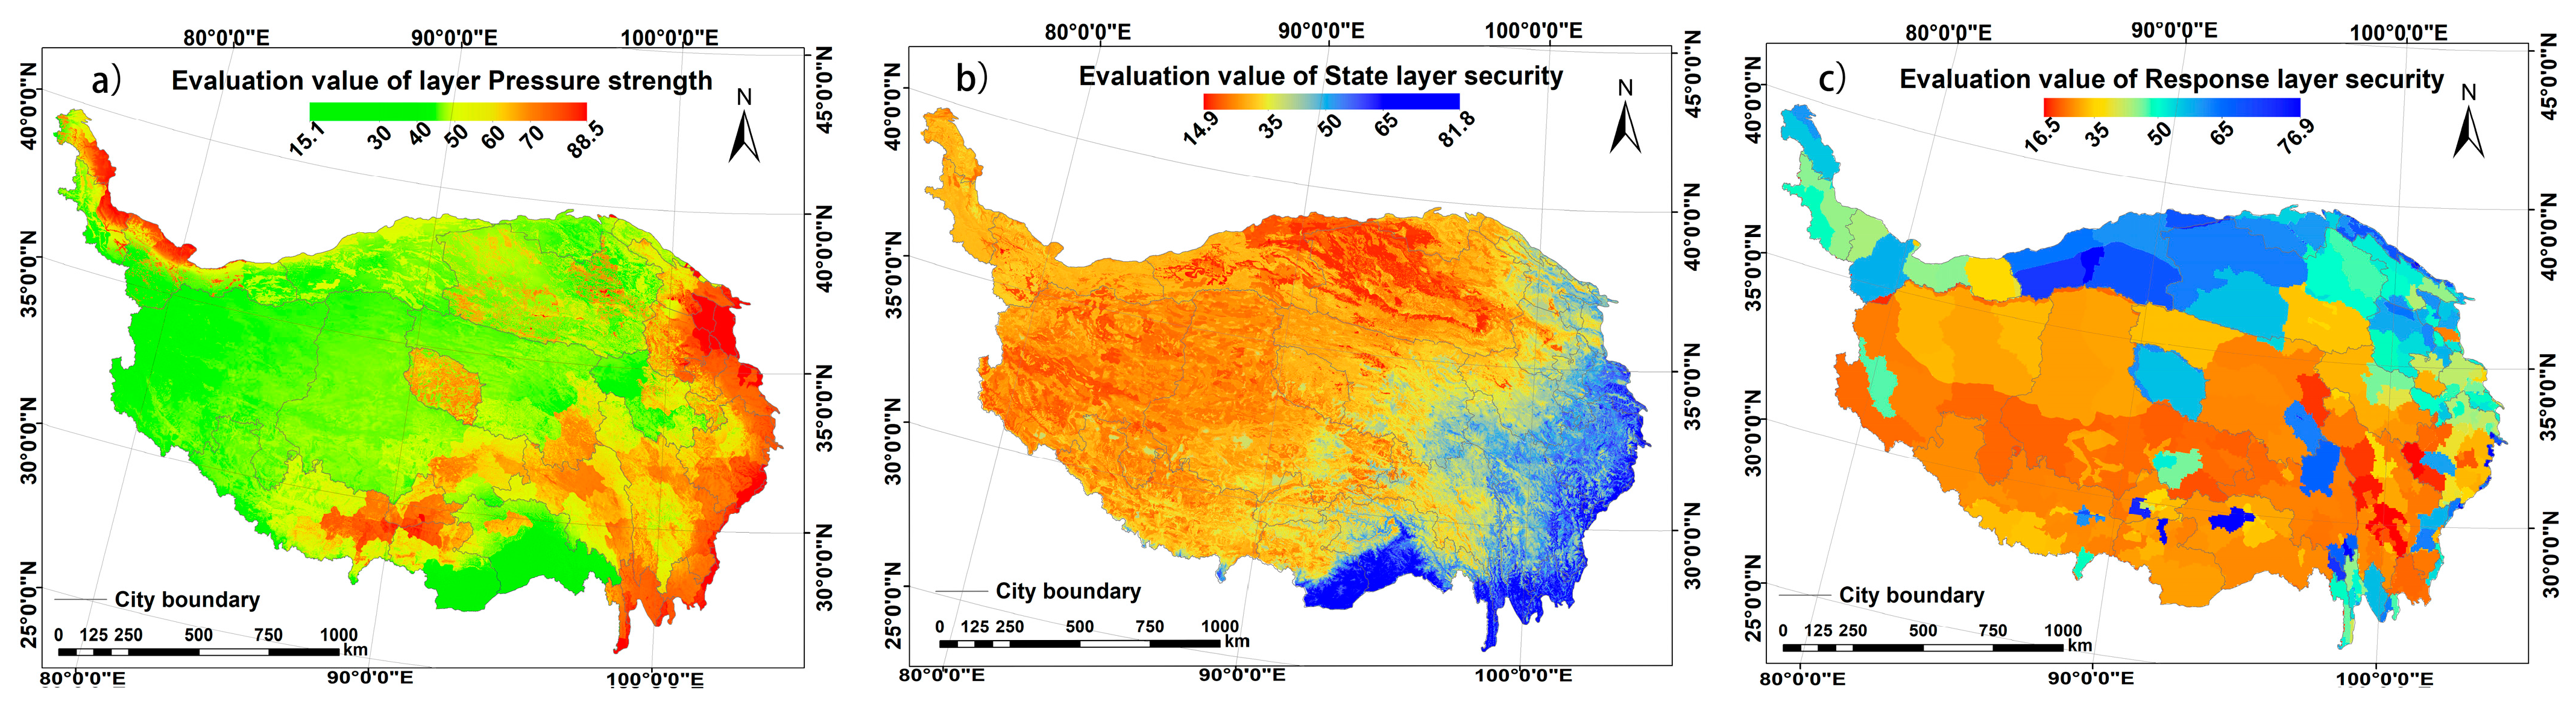
3.1. Evaluation of Spatial Pattern on PSR
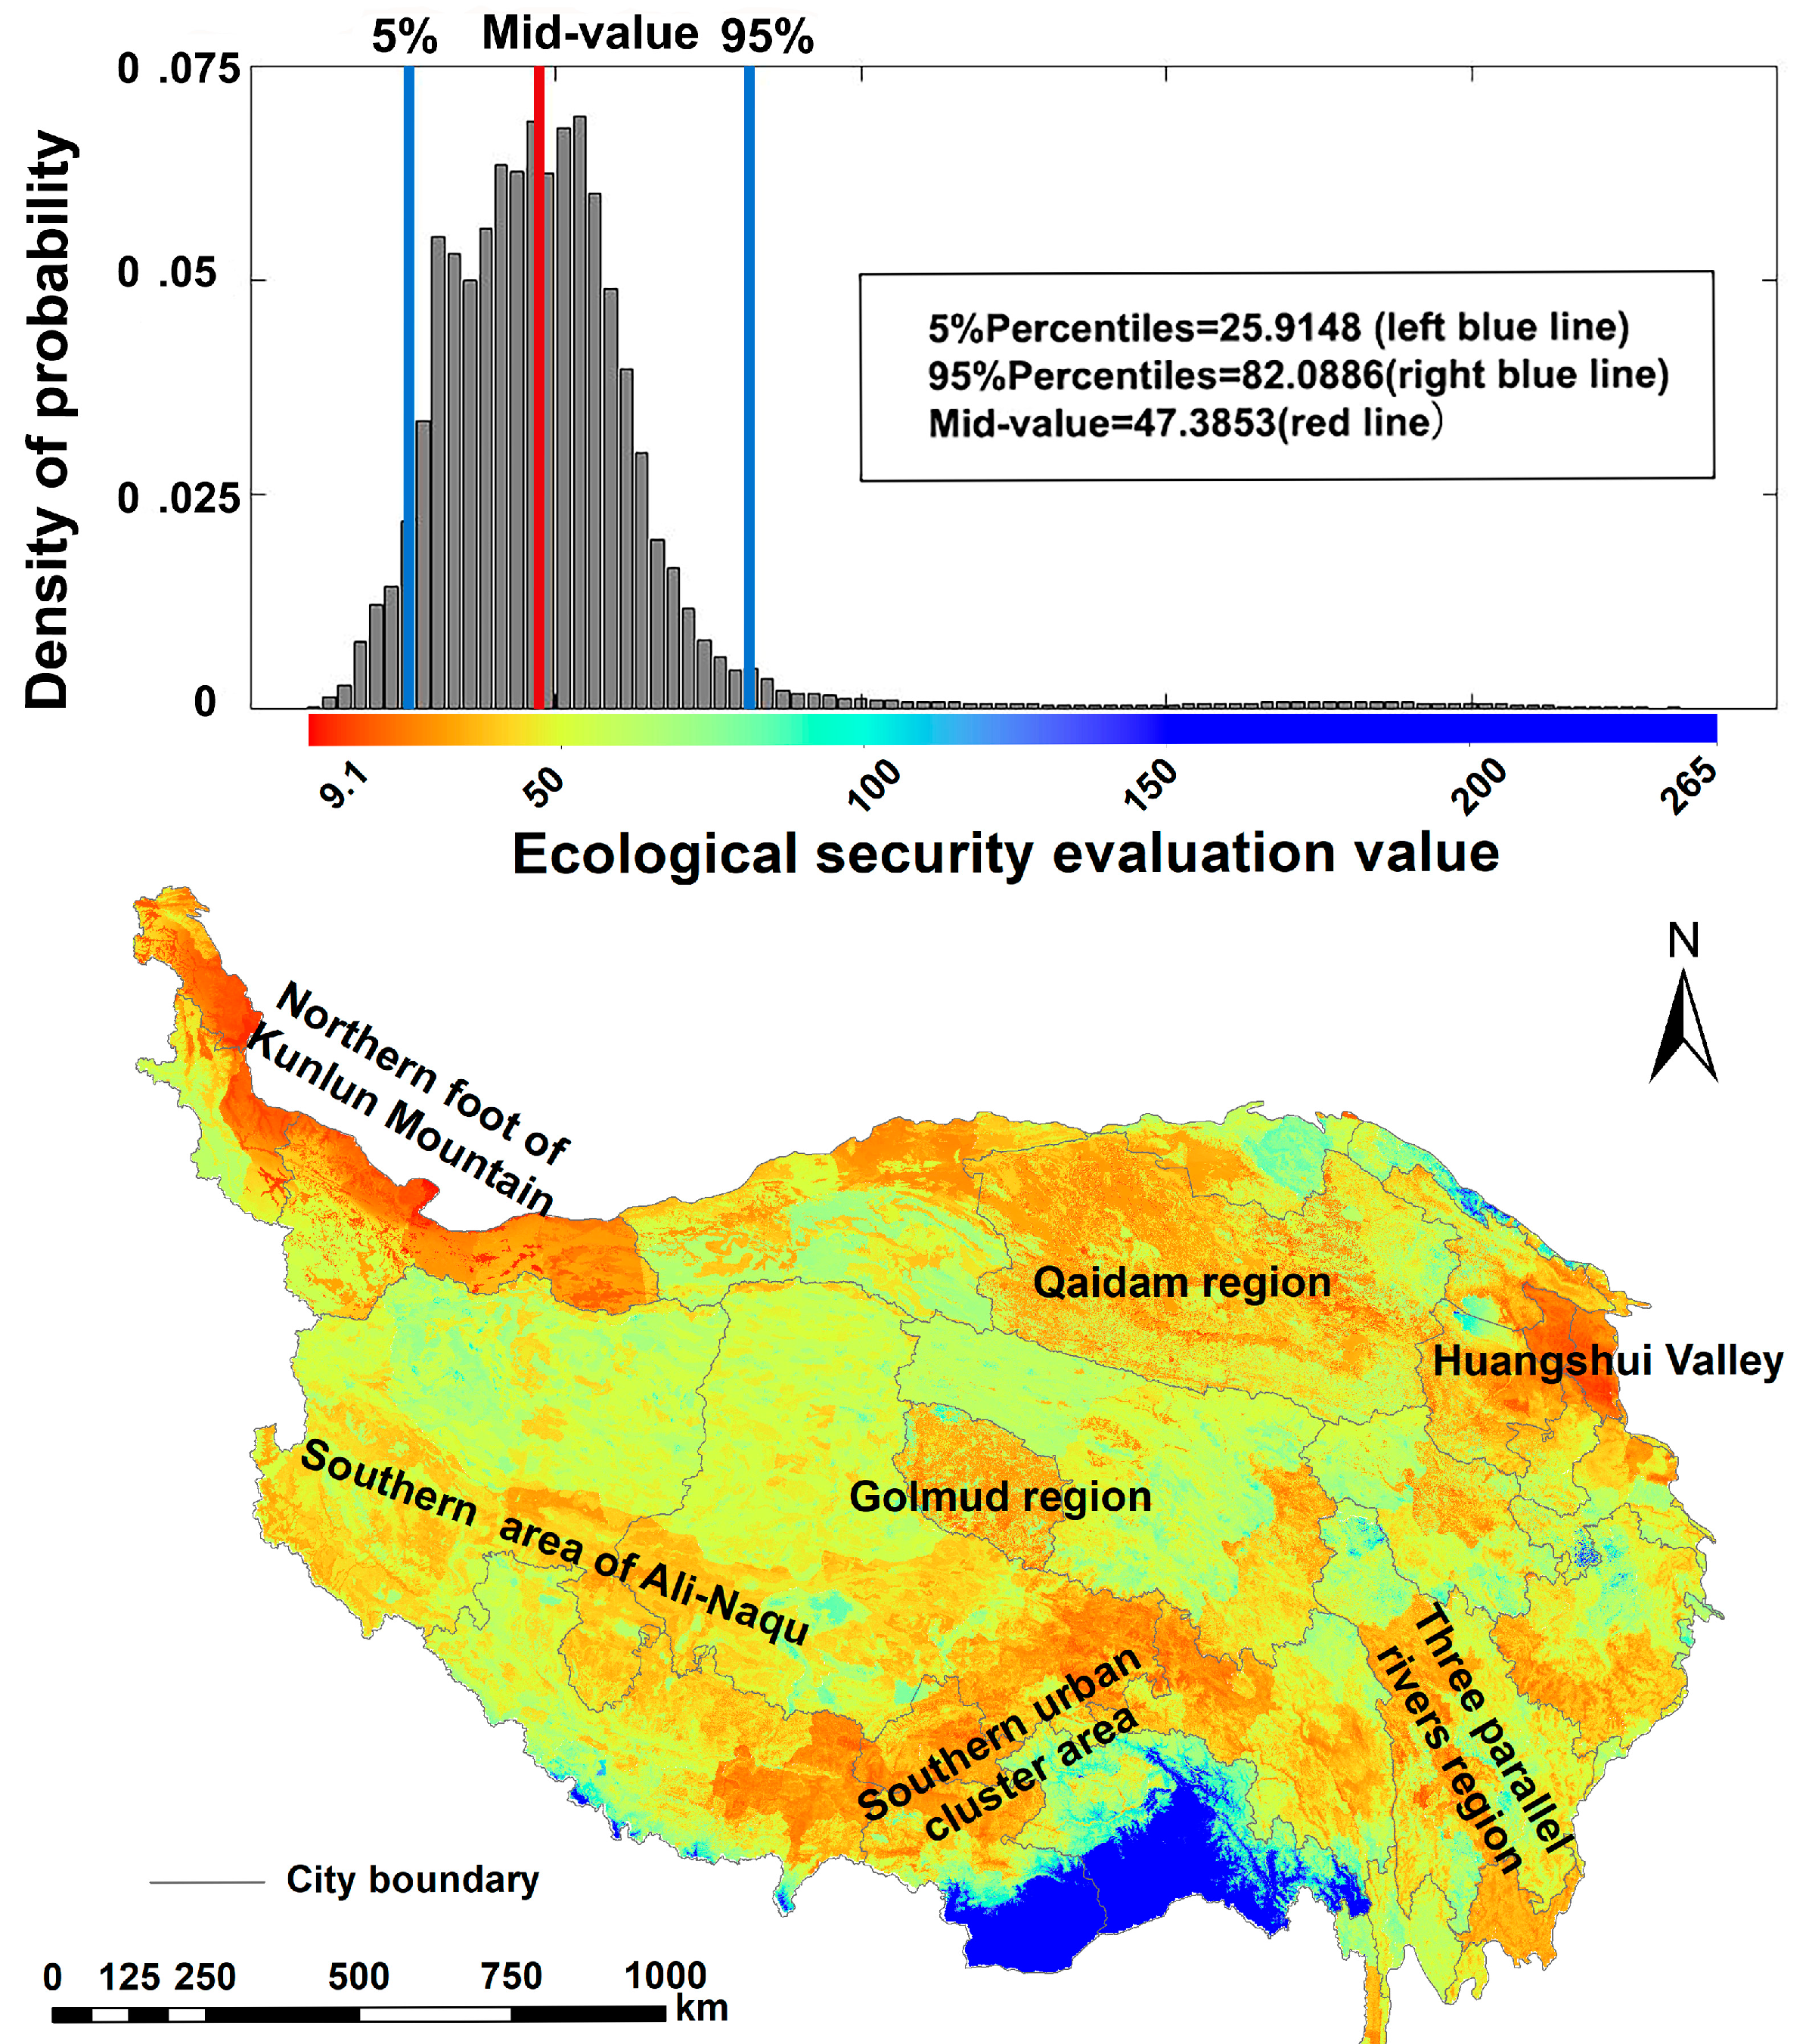
3.2. Overall Spatial Pattern of Ecological Security
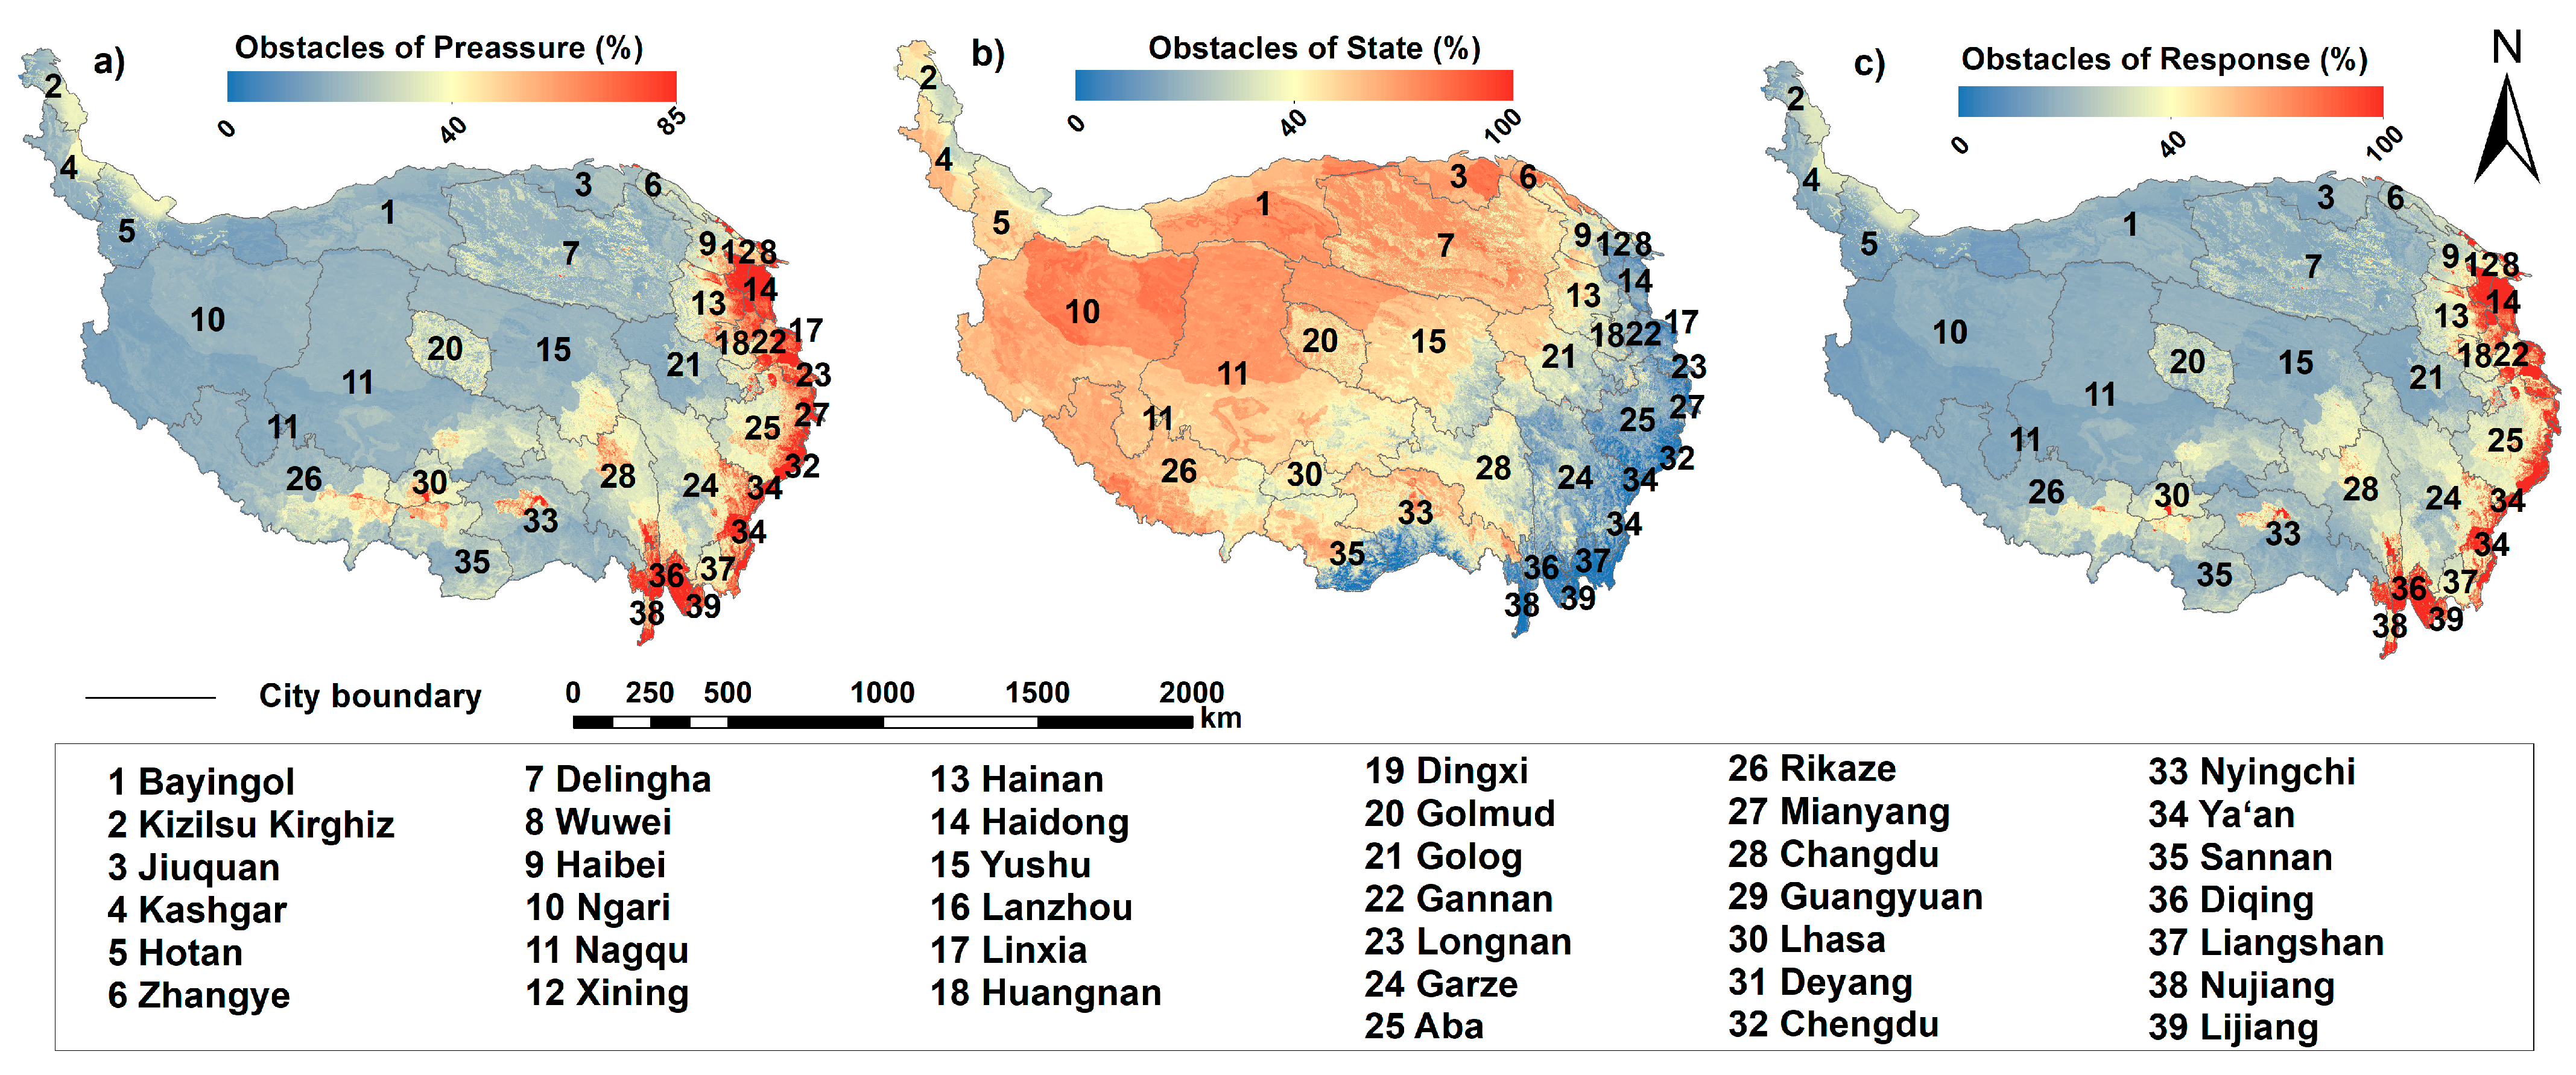
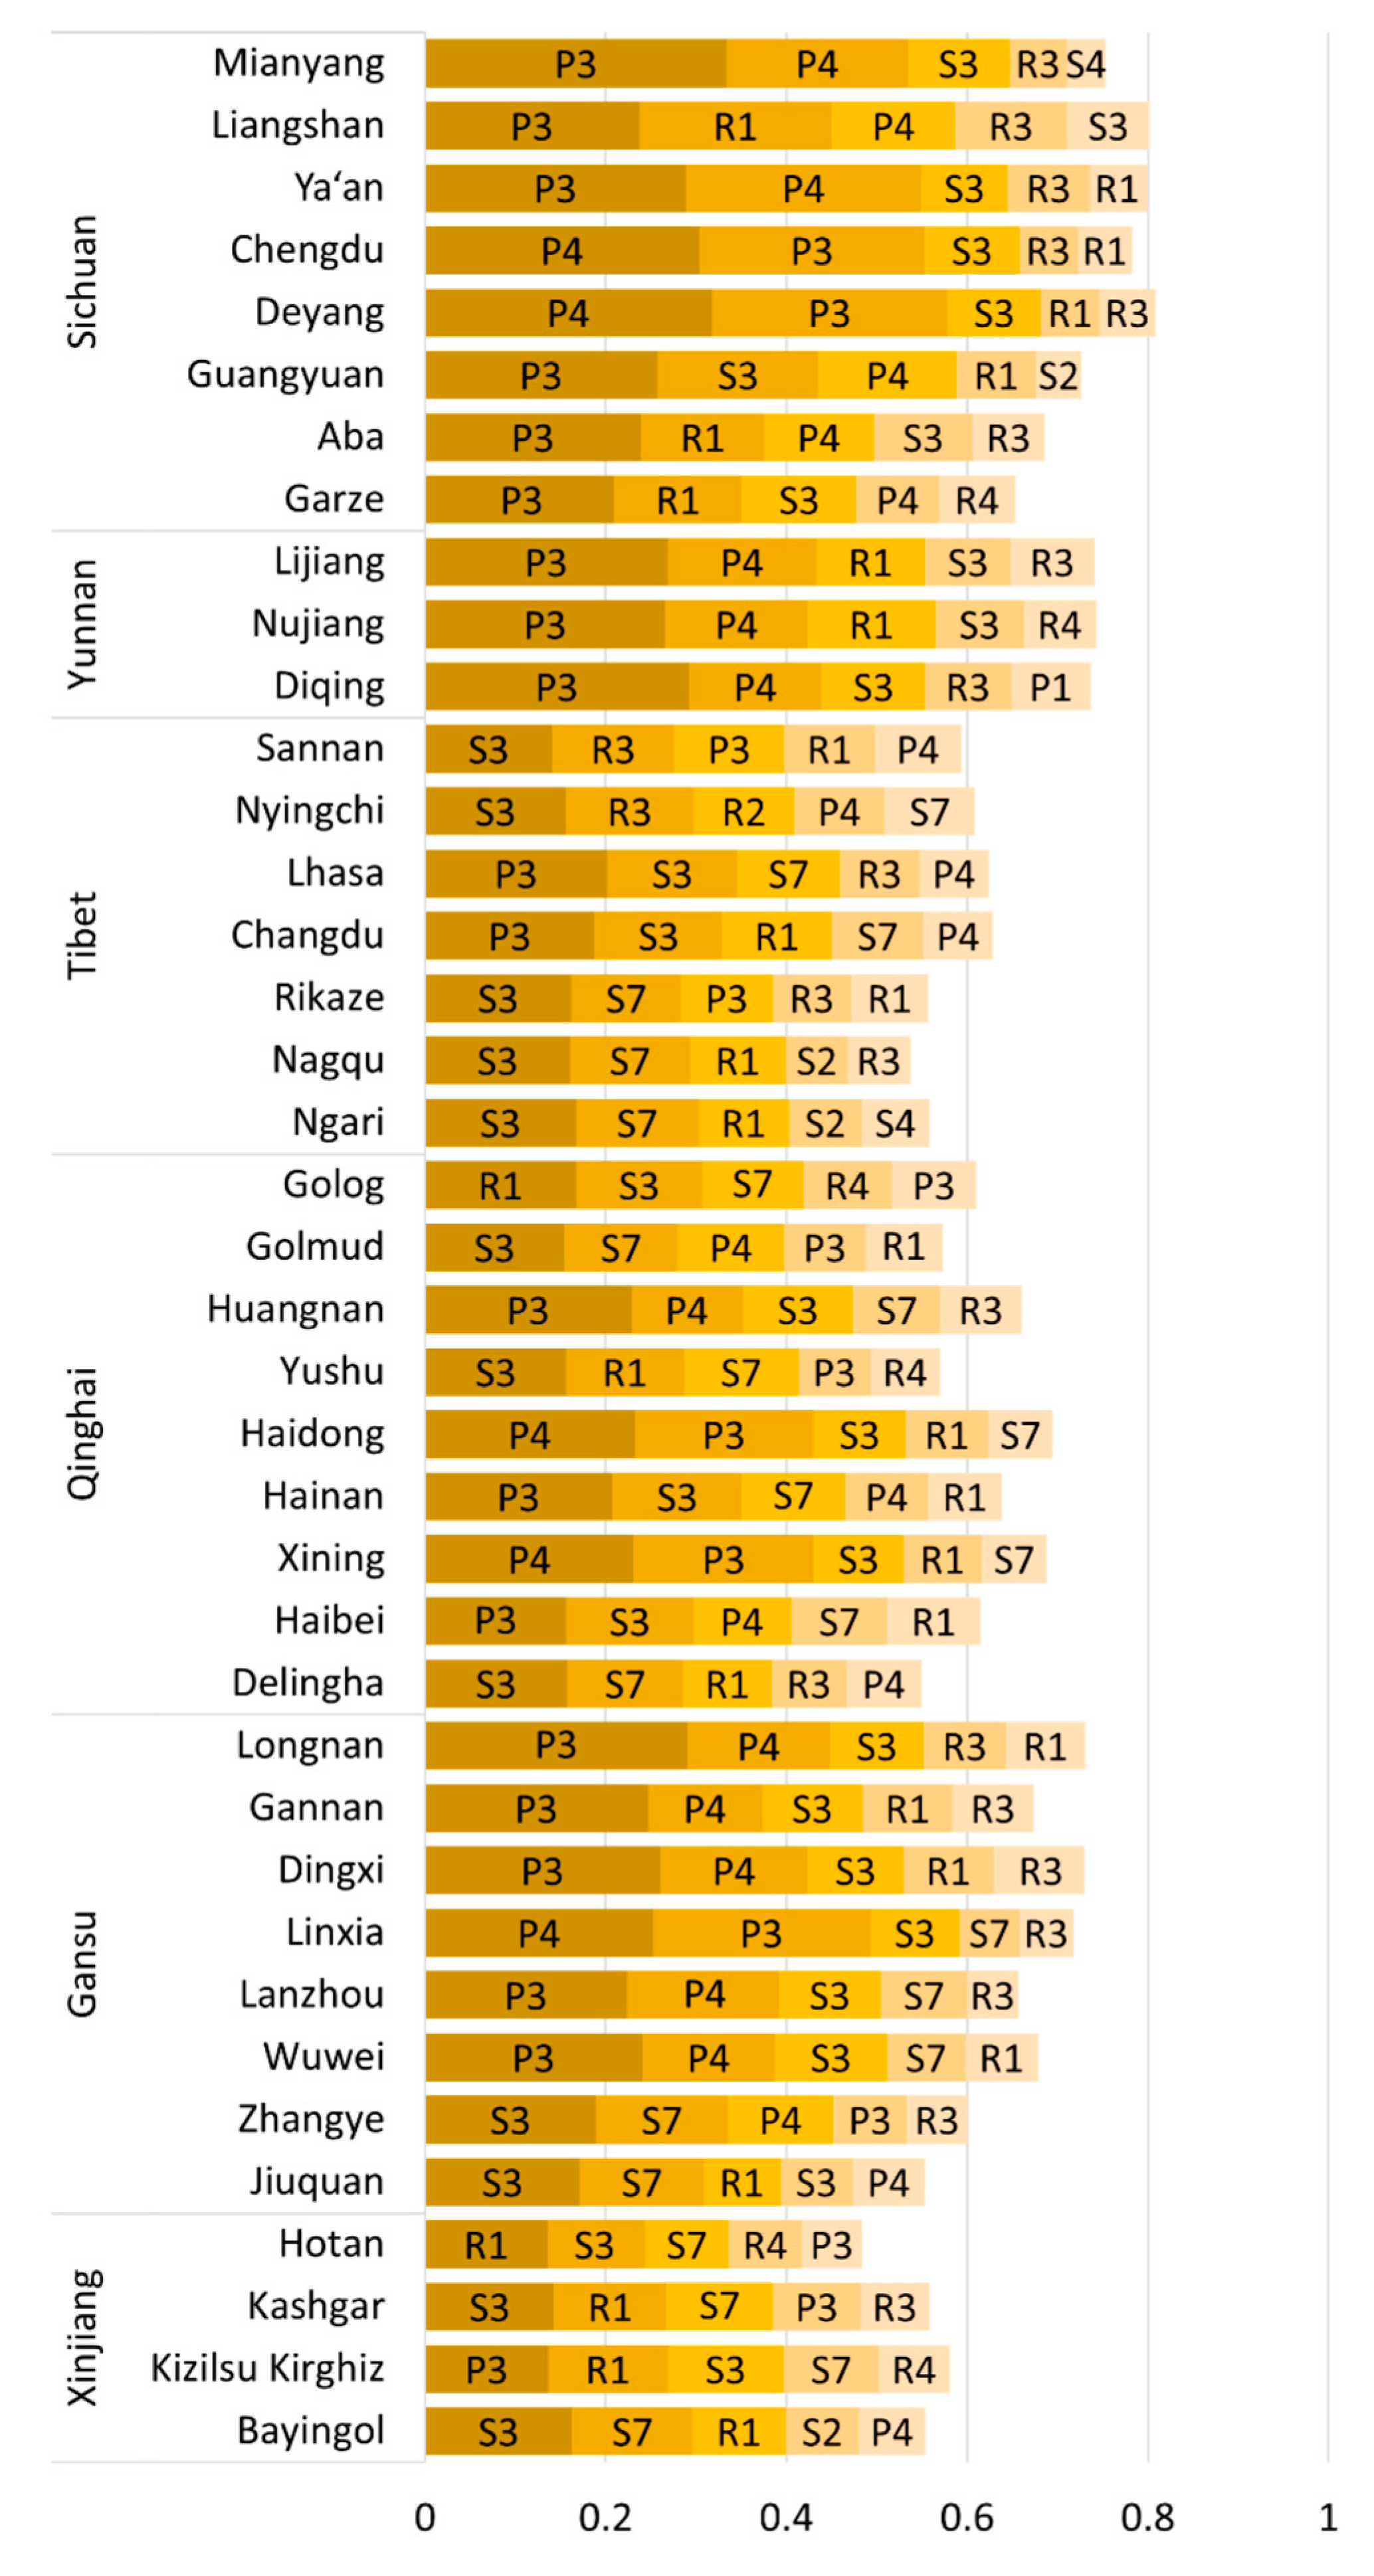
3.3. Spatial Pattern of Obstacle Factors
3.4. Relative Importance of Obstacle Indicators
4. Discussion
4.1. The PSR on the QTP
4.2. Ecological Security on the QTP
4.3. Major Obstacle Factors of Ecological Security on the QTP
4.4. Implications
5. Conclusions
Author Contributions
Funding
Data Availability Statement
Conflicts of Interest
References
- Steffen, W.; Richardson, K.; Rockström, J.; Cornell, S.E.; Fetzer, I.; Bennett, E.M.; Biggs, R.; Carpenter, S.R.; De Vries, W.; De Wit, C.A. Planetary boundaries: Guiding human development on a changing planet. Science 2015, 347, 1259855. [Google Scholar] [CrossRef] [PubMed] [Green Version]
- Liu, C.; Li, W.; Xu, J.; Zhou, H.; Li, C.; Wang, W. Global trends and characteristics of ecological security research in the early 21st century: A literature review and bibliometric analysis. Ecol. Indic. 2022, 137, 108734. [Google Scholar] [CrossRef]
- Amirgaliev, N.A.; Askarova, M.; Opp, C.; Medeu, A.; Kulbekova, R.; Medeu, A.R. Water quality problems analysis and assessment of the ecological security level of the Transboundary Ural-Caspian Basin of the Republic of Kazakhstan. Appl. Sci. 2022, 12, 2059. [Google Scholar] [CrossRef]
- Arkhipova, N.; Kozhukhova, V. Environmental performance index as an assessment method of the country’s ecological security. In Economic Systems in the New Era: Stable Systems in an Unstable World; Springer: Berlin/Heidelberg, Germany, 2021; pp. 25–32. [Google Scholar]
- Cheng, H.; Zhu, L.; Meng, J. Fuzzy evaluation of the ecological security of land resources in mainland China based on the Pressure-State-Response framework. Sci. Total Environ. 2022, 804, 150053. [Google Scholar] [CrossRef] [PubMed]
- Wen, J.; Hou, K. Research on the progress of regional ecological security evaluation and optimization of its common limitations. Ecol. Indic. 2021, 127, 107797. [Google Scholar] [CrossRef]
- Ma, L.; Bo, J.; Li, X.; Fang, F.; Cheng, W. Identifying key landscape pattern indices influencing the ecological security of inland river basin: The middle and lower reaches of Shule River Basin as an example. Sci. Total Environ. 2019, 674, 424–438. [Google Scholar] [CrossRef] [PubMed]
- Hu, M.; Li, Z.; Yuan, M.; Fan, C.; Xia, B. Spatial differentiation of ecological security and differentiated management of ecological conservation in the Pearl River Delta, China. Ecol. Indic. 2019, 104, 439–448. [Google Scholar] [CrossRef]
- Han, B.; Liu, H.; Wang, R. Urban ecological security assessment for cities in the Beijing–Tianjin–Hebei metropolitan region based on fuzzy and entropy methods. Ecol. Model. 2015, 318, 217–225. [Google Scholar] [CrossRef]
- Hazbavi, Z.; Sadeghi, S.H.; Gholamalifard, M.; Davudirad, A.A. Watershed health assessment using the pressure–state–response (PSR) framework. Land Degrad. Dev. 2020, 31, 3–19. [Google Scholar] [CrossRef]
- Zhang, F.; Wang, Y.; Ma, X.; Wang, Y.; Yang, G.; Zhu, L. Evaluation of resources and environmental carrying capacity of 36 large cities in China based on a support-pressure coupling mechanism. Sci. Total Environ. 2019, 688, 838–854. [Google Scholar] [CrossRef]
- Sun, J.; Li, Y.; Gao, P.; Xia, B. A Mamdani fuzzy inference approach for assessing ecological security in the Pearl River Delta urban agglomeration, China. Ecol. Indic. 2018, 94, 386–396. [Google Scholar] [CrossRef]
- Logan, M.; Hu, Z.; Brinkman, R.; Sun, S.; Sun, X.; Schaffelke, B. Ecosystem health report cards: An overview of frameworks and analytical methodologies. Ecol. Indic. 2020, 113, 105834. [Google Scholar] [CrossRef]
- Zhang, H.; Xu, E. An evaluation of the ecological and environmental security on China’s terrestrial ecosystems. Sci. Rep. 2017, 7, 811. [Google Scholar] [CrossRef] [PubMed] [Green Version]
- Grimm, N.B.; Faeth, S.H.; Golubiewski, N.E.; Redman, C.L.; Wu, J.; Bai, X.; Briggs, J.M. Global change and the ecology of cities. Science 2008, 319, 756–760. [Google Scholar] [CrossRef] [Green Version]
- Li, Z.-T.; Yuan, M.-J.; Hu, M.-M.; Wang, Y.-F.; Xia, B.-C. Evaluation of ecological security and influencing factors analysis based on robustness analysis and the BP-DEMALTE model: A case study of the Pearl River Delta urban agglomeration. Ecol. Indic. 2019, 101, 595–602. [Google Scholar] [CrossRef]
- Guo, D.; Wang, D.; Zhong, X.; Yang, Y.; Jiang, L. Spatiotemporal changes of land ecological security and its obstacle indicators diagnosis in the Beijing–Tianjin–Hebei Region. Land 2021, 10, 706. [Google Scholar] [CrossRef]
- Ou, Z.-r.; Zhu, Q.-k.; Sun, Y.-y. Regional ecological security and diagnosis of obstacle factors in underdeveloped regions: A case study in Yunnan Province, China. J. Mt. Sci. 2017, 14, 870–884. [Google Scholar] [CrossRef]
- Fan, Y.; Fang, C. Evolution process and obstacle factors of ecological security in western China, a case study of Qinghai province. Ecol. Indic. 2020, 117, 106659. [Google Scholar] [CrossRef]
- Yao, T.; Wu, F.; Ding, L.; Sun, J.; Zhu, L.; Piao, S.; Deng, T.; Ni, X.; Zheng, H.; Ouyang, H. Multispherical interactions and their effects on the Tibetan Plateau’s earth system: A review of the recent researches. Natl. Sci. Rev. 2015, 2, 468–488. [Google Scholar] [CrossRef] [Green Version]
- Gao, J.; Wang, Y.; Zou, C.; Xu, D.; Lin, N.; Wang, L.; Zhang, K. China’s ecological conservation redline: A solution for future nature conservation. Ambio 2020, 49, 1519–1529. [Google Scholar] [CrossRef]
- FU, B.; OUYANG, Z.; SHI, P.; FAN, J.; WANG, X.; ZHENG, H.; ZHAO, W.; WU, F. Current Condition and Protection Strategies of Qinghai-Tibet Plateau Ecological Security Barrier. Bull. Chin. Acad. Sci. 2021, 36, 1298–1306. [Google Scholar]
- Dong, S.; Shang, Z.; Gao, J.; Boone, R.B. Enhancing sustainability of grassland ecosystems through ecological restoration and grazing management in an era of climate change on Qinghai-Tibetan Plateau. Agric. Ecosyst. Environ. 2020, 287, 106684. [Google Scholar] [CrossRef]
- Yasunari, T.; Niles, D.; Taniguchi, M.; Chen, D. Asia: Proving ground for global sustainability. Curr. Opin. Environ. Sustain. 2013, 5, 288–292. [Google Scholar] [CrossRef]
- Yao, T. Tackling on environmental changes in Tibetan Plateau with focus on water, ecosystem and adaptation. Sci. Bull. 2019, 64, 417. [Google Scholar] [CrossRef] [Green Version]
- You, Q.; Cai, Z.; Pepin, N.; Chen, D.; Ahrens, B.; Jiang, Z.; Wu, F.; Kang, S.; Zhang, R.; Wu, T. Warming amplification over the Arctic Pole and Third Pole: Trends, mechanisms and consequences. Earth-Sci. Rev. 2021, 217, 103625. [Google Scholar] [CrossRef]
- Yao, T.; Xue, Y.; Chen, D.; Chen, F.; Thompson, L.; Cui, P.; Koike, T.; Lau, W.K.-M.; Lettenmaier, D.; Mosbrugger, V. Recent third pole’s rapid warming accompanies cryospheric melt and water cycle intensification and interactions between monsoon and environment: Multidisciplinary approach with observations, modeling, and analysis. Bull. Am. Meteorol. Soc. 2019, 100, 423–444. [Google Scholar] [CrossRef]
- Zhang, J.; Liu, J.; Jin, J.; Ma, T.; Wang, G.; Liu, H.; Min, X.; Wang, H.; Lin, J.; Bao, Z.; et al. Evolution and Trend Analysis of Water Resources in Qinghai-Tibet Plateau. Bull. Chin. Acad. Sci. 2019, 34, 1264–1273. [Google Scholar]
- Liang, L.; Wang, Z.; Li, J. The effect of urbanization on environmental pollution in rapidly developing urban agglomerations. J. Clean. Prod. 2019, 237, 117649. [Google Scholar] [CrossRef]
- Liu, W.-h.; Zheng, J.-w.; Wang, Z.-r.; Li, R.; Wu, T.-h. A bibliometric review of ecological research on the Qinghai–Tibet Plateau, 1990–2019. Ecol. Inform. 2021, 64, 101337. [Google Scholar] [CrossRef]
- Wang, H.; Long, H.; Li, X.; Yu, F. Evaluation of changes in ecological security in China’s Qinghai Lake Basin from 2000 to 2013 and the relationship to land use and climate change. Environ. Earth Sci. 2014, 72, 341–354. [Google Scholar] [CrossRef]
- He, L.; Shen, J.; Zhang, Y. Ecological vulnerability assessment for ecological conservation and environmental management. J. Environ. Manag. 2018, 206, 1115–1125. [Google Scholar] [CrossRef]
- Fan, F.; Liu, Y.; Chen, J.; Dong, J. Scenario-based ecological security patterns to indicate landscape sustainability: A case study on the Qinghai-Tibet Plateau. Landsc. Ecol. 2021, 36, 2175–2188. [Google Scholar] [CrossRef]
- Xia, M.; Jia, K.; Zhao, W.; Liu, S.; Wei, X.; Wang, B. Spatio-temporal changes of ecological vulnerability across the Qinghai-Tibetan Plateau. Ecol. Indic. 2021, 123, 107274. [Google Scholar] [CrossRef]
- Jiang, Y.; Shi, B.; Su, G.; Lu, Y.; Li, Q.; Meng, J.; Ding, Y.; Song, S.; Dai, L. Spatiotemporal analysis of ecological vulnerability in the Tibet Autonomous Region based on a pressure-state-response-management framework. Ecol. Indic. 2021, 130, 108054. [Google Scholar] [CrossRef]
- Lin, Z.-y.; Xiao, Y.; Ouyang, Z.-y. Assessment of ecological importance of the Qinghai-Tibet Plateau based on ecosystem service flows. J. Mt. Sci. 2021, 18, 1725–1736. [Google Scholar] [CrossRef]
- Zhao, Y.-Z.; Zou, X.-Y.; Cheng, H.; Jia, H.-K.; Wu, Y.-Q.; Wang, G.-Y.; Zhang, C.-L.; Gao, S.-Y. Assessing the ecological security of the Tibetan plateau: Methodology and a case study for Lhaze County. J. Environ. Manag. 2006, 80, 120–131. [Google Scholar] [CrossRef] [PubMed]
- Gao, Y.; Huang, J.; Li, S.; Li, S. Spatial pattern of non-stationarity and scale-dependent relationships between NDVI and climatic factors—A case study in Qinghai-Tibet Plateau, China. Ecol. Indic. 2012, 20, 170–176. [Google Scholar] [CrossRef]
- Liu, J.; Milne, R.I.; Cadotte, M.W.; Wu, Z.-Y.; Provan, J.; Zhu, G.-F.; Gao, L.-M.; Li, D.-Z. Protect Third Pole’s fragile ecosystem. Science 2018, 362, 1368. [Google Scholar] [CrossRef]
- Immerzeel, W.W.; Lutz, A.; Andrade, M.; Bahl, A.; Biemans, H.; Bolch, T.; Hyde, S.; Brumby, S.; Davies, B.; Elmore, A. Importance and vulnerability of the world’s water towers. Nature 2020, 577, 364–369. [Google Scholar] [CrossRef]
- Yan, Y.; You, Q.; Wu, F.; Pepin, N.; Kang, S. Surface mean temperature from the observational stations and multiple reanalyses over the Tibetan Plateau. Climate Dynamics 2020, 55, 2405–2419. [Google Scholar] [CrossRef]
- Yao, T.; Thompson, L.; Yang, W.; Yu, W.; Gao, Y.; Guo, X.; Yang, X.; Duan, K.; Zhao, H.; Xu, B. Different glacier status with atmospheric circulations in Tibetan Plateau and surroundings. Nat. Clim. Chang. 2012, 2, 663–667. [Google Scholar] [CrossRef]
- Yao, T.; Bolch, T.; Chen, D.; Gao, J.; Immerzeel, W.; Piao, S.; Su, F.; Thompson, L.; Wada, Y.; Wang, L. The imbalance of the Asian water tower. Nat. Rev. Earth Environ. 2022, 3, 618–632. [Google Scholar] [CrossRef]
- Wang, Y.; Lv, W.; Xue, K.; Wang, S.; Zhang, L.; Hu, R.; Zeng, H.; Xu, X.; Li, Y.; Jiang, L. Grassland changes and adaptive management on the Qinghai–Tibetan Plateau. Nat. Rev. Earth Environ. 2022, 3, 668–683. [Google Scholar] [CrossRef]
- Li, C.; Fu, B.; Wang, S.; Stringer, L.C.; Wang, Y.; Li, Z.; Liu, Y.; Zhou, W. Drivers and impacts of changes in China’s drylands. Nat. Rev. Earth Environ. 2021, 2, 858–873. [Google Scholar] [CrossRef]
- Wu, X.; Hu, F. Analysis of ecological carrying capacity using a fuzzy comprehensive evaluation method. Ecol. Indic. 2020, 113, 106243. [Google Scholar] [CrossRef]
- Feng, Y.; Yang, Q.; Tong, X.; Chen, L. Evaluating land ecological security and examining its relationships with driving factors using GIS and generalized additive model. Sci. Total Environ. 2018, 633, 1469–1479. [Google Scholar] [CrossRef] [PubMed]
- Pai, S.J.; Carter, T.S.; Heald, C.L.; Kroll, J.H. Updated World Health Organization Air Quality Guidelines Highlight the Importance of Non-anthropogenic PM2. 5. Environ. Sci. Technol. Lett. 2022, 9, 501–506. [Google Scholar] [CrossRef] [PubMed]
- Clark, D.A.; Brown, S.; Kicklighter, D.W.; Chambers, J.Q.; Thomlinson, J.R.; Ni, J. Measuring net primary production in forests: Concepts and field methods. Ecol. Appl. 2001, 11, 356–370. [Google Scholar] [CrossRef]
- Knapp, A.K.; Carroll, C.J.; Fahey, T.J. Patterns and controls of terrestrial primary production in a changing world. Ecol. Environ. 2014, 8, 205–246. [Google Scholar]
- Shangguan, W.; Dai, Y.; Liu, B.; Zhu, A.; Duan, Q.; Wu, L.; Ji, D.; Ye, A.; Yuan, H.; Zhang, Q. A China data set of soil properties for land surface modeling. J. Adv. Model. Earth Syst. 2013, 5, 212–224. [Google Scholar] [CrossRef]
- Meyar-Naimi, H.; Vaez-Zadeh, S. Sustainable development based energy policy making frameworks, a critical review. Energy Policy 2012, 43, 351–361. [Google Scholar] [CrossRef]
- Li, C.; Wu, Y.; Gao, B.; Zheng, K.; Wu, Y.; Li, C. Multi-scenario simulation of ecosystem service value for optimization of land use in the Sichuan-Yunnan ecological barrier, China. Ecol. Indic. 2021, 132, 108328. [Google Scholar] [CrossRef]
- Honglie, S.; Du, Z.; Tandong, Y.; Lithium, Y. Protection and Construction of National Ecological Security Barrier in Qinghai-Tibet Plateau. J. Geogr. Sci. 2012, 67, 3–12. [Google Scholar]
- Chao, W.; Ke, K.; Yelong, Z.; Li, G.; Min, W.; Tsering. Population distribution pattern and influencing factors in Tibet based on random forest model. J. Geogr. Sci. 2019, 74, 664–680. [Google Scholar]
- Jia, H.; Yan, C.; Xing, X. Evaluation of Eco-Environmental Quality in Qaidam Basin Based on the Ecological Index (MRSEI) and GEE. Remote Sens. 2021, 13, 4543. [Google Scholar] [CrossRef]
- Zeng, B.; Yang, T.-B. Impacts of climate warming on vegetation in Qaidam Area from 1990 to 2003. Environ. Monit. Assess. 2008, 144, 403–417. [Google Scholar] [CrossRef]
- Wang, Z.; Li, J.; Liang, L. Ecological risk in the Tibetan Plateau and influencing urbanization factors. Environ. Chall. 2022, 6, 100445. [Google Scholar] [CrossRef]
- Qi, W.; Liu, S.; Zhou, L. The Law of Population Regional Differentiation in Qinghai-Tibet Plateau and the Application of “Hu Huanyong Line”. J. Geogr. Sci. 2020, 75, 255–267. [Google Scholar]
- Li, L.; Ni, W.; Li, T.; Zhou, B.; Qu, Y.; Yuan, K. Influences of anthropogenic factors on lakes area in the Golmud Basin, China, from 1980 to 2015. Environ. Earth Sci. 2020, 79, 20. [Google Scholar] [CrossRef]
- Xiu, L.; Yao, X.; Chen, M.; Yan, C. Effect of ecological construction engineering on vegetation restoration: A case study of the loess plateau. Remote Sens. 2021, 13, 1407. [Google Scholar] [CrossRef]
- Ebert, U.; Welsch, H. Meaningful environmental indices: A social choice approach. J. Environ. Econ. Manag. 2004, 47, 270–283. [Google Scholar] [CrossRef]


| Dimensions | Index Layer | Scale | Time | Original Data Source |
|---|---|---|---|---|
| Pressure (P) | P1: Annual precipitation (0.1 mm) | 1 km | 2015 | Resources and Environmental Science and Data Center (https://www.resdc.cn/ (accessed on 12 March 2022)) |
| P2: Annual average temperature (0.1 °C) | 1 km | 2015 | Resources and Environmental Science and Data Center (https://www.resdc.cn/ (accessed on 12 March 2022)) | |
| P3: Population density (people/km2) | 1 km | 2015 | Resources and Environmental Science and Data Center (https://www.resdc.cn/ (accessed on 12 March 2022)) | |
| P4: GDP (1480 dollars/km2) | 1 km | 2015 | Resources and Environmental Science and Data Center (https://www.resdc.cn/ (accessed on 12 March 2022)) | |
| P5: PM2.5 Concentration (10 μg/m3) | 1 km | 2020 | Zenodo (https://zenodo.org/ (accessed on 15 March 2022)) | |
| Status (S) | S1: Terrain (Slope G) | 1 km | 2000 | GS Cloud (http://www.gscloud.cn/home (accessed on 13 March 2022)) |
| S2: Normalized differential vegetation index (NDVI) | 1 km | 2019 | Resources and Environmental Science and Data Center (https://www.resdc.cn/ (accessed on 16 March 2022)) | |
| S3: Net primary productivity of vegetation (NPP) | 1 km | 2010 | Resources and Environmental Science and Data Center (https://www.resdc.cn/ (accessed on 16 March 2022)) | |
| S4: Soil organic matter content (%) | 1 km | 2015 | Qinghai-Tibet Plateau Scientific Data Center (http://www.tpdc.ac.cn/zh-hans/ (accessed on 18 March 2022)) | |
| S5: Severity of soil erosion | 1 km | 2015 | Resources and Environmental Science and Data Center (https://www.resdc.cn/ (accessed on 18 March 2022)) | |
| S6: Biodiversity of mammals | 1 km | 2015 | NASA-SEDAC (https://sedac.ciesin.columbia.edu/ (accessed on 12 December 2021)) | |
| S7: Biodiversity of amphibious animals | 1 km | 2015 | NASA-SEDAC (https://sedac.ciesin.columbia.edu/ (accessed on 12 December 2021)) | |
| S8: Patch density (PD) | 1 km | 2020 | ||
| Response (R) | R1: Type of natural reserves | Vector | 2016 | |
| R2: Tertiary industry (%) | City | 2017 | China’s economic and social big data research platform (https://data.cnki.net/ (accessed on 20 March 2022)) | |
| R3: Disposal rate of domestic garbage (%) | County | 2017 | China’s economic and social big data research platform (https://data.cnki.net/ (accessed on 20 March 2022)) | |
| R4: Green development index | City | 2016 | Bulletin of the Annual Assessment of Ecological Progress of various provinces and cities |
| Indicators | Interval Division: High Pressure → Low Pressure | Weight | ||||
|---|---|---|---|---|---|---|
| Press Indicators | V | IV | III | II | I | |
| P1: Annual precipitation (0.1 mm) | (0,200] | (200,400] | (400,600] | (600–800] | (800,+∞) | 0.0803 |
| P2: Annual average temperature (0.1 °C) | (−∞,−20] | (−20,−10] | (−10,0] | (0,5] | (5,+∞) | 0.0011 |
| P3: Population density (people/km2) | (8,+∞) | (6,8] | (4,6] | (2,4] | (0,2] | 0.3743 |
| P4: GDP (1480 dollars/km2) | (150,+∞) | (100,150] | (50,100] | (10,50] | (0,10] | 0.4556 |
| P5: PM2.5 (10 μg/m3) | (40,+∞) | (30,40] | (20,30] | (10,20] | (0,10] | 0.1185 |
| Interval division: No security—security | ||||||
| State indicators | I | II | II | IV | V | |
| S1: Terrain (Slope G) | (25,90] | (15,25] | (6,15] | (2,6] | (−∞,2] | 0.0016 |
| S2: NDVI | (−∞,0.25] | (0.25,0.5] | (0.5,0.75] | (0.75,0.9] | (0.90,+∞) | 0.1455 |
| S2: NPP | (−∞,100] | (100,500] | (500,1000] | (1000,1500] | (1500,+∞) | 0.2938 |
| S4: Soil organic matter content (%) | (−∞,4] | (4,8] | (8,12] | (12,16] | (16,+∞) | 0.1261 |
| S5: Severity of soil erosion | Very strong, intense | Strongly | Moderate | Low | Tiny | 0.1549 |
| S6: Biodiversity of mammals | (−∞,25] | (25,50] | (50,75] | (75,100] | (100,+∞) | 0.0838 |
| S7: Biodiversity of amphibious animals | (-∞,2] | (2,5] | (5,10] | (10,20] | (20,+∞) | 0.2286 |
| S8: Patch density PD (×10−4) | (73,+∞) | (28,73] | (14,28] | (6,14] | (−∞,6] | 0.0296 |
| Interval division: Poor response → Good response | ||||||
| Response indicators | I | II | III | IV | V | |
| R1: Type of natural reserves | No protected zone | State, City, county-level | Province-level | 0.2713 | ||
| R2: Tertiary industry (%) | [60,100] | (50,60] | (40,50] | (30,40] | (0,30] | 0.1051 |
| R3: disposal rate of domestic garbage (%) | [0,50] | (50,85] | (85,90] | (90,95] | (95,100] | 0.3244 |
| R4: Green development index | [0,76] | (76,80] | (80,85] | (85,90] | (90,100] | 0.2992 |
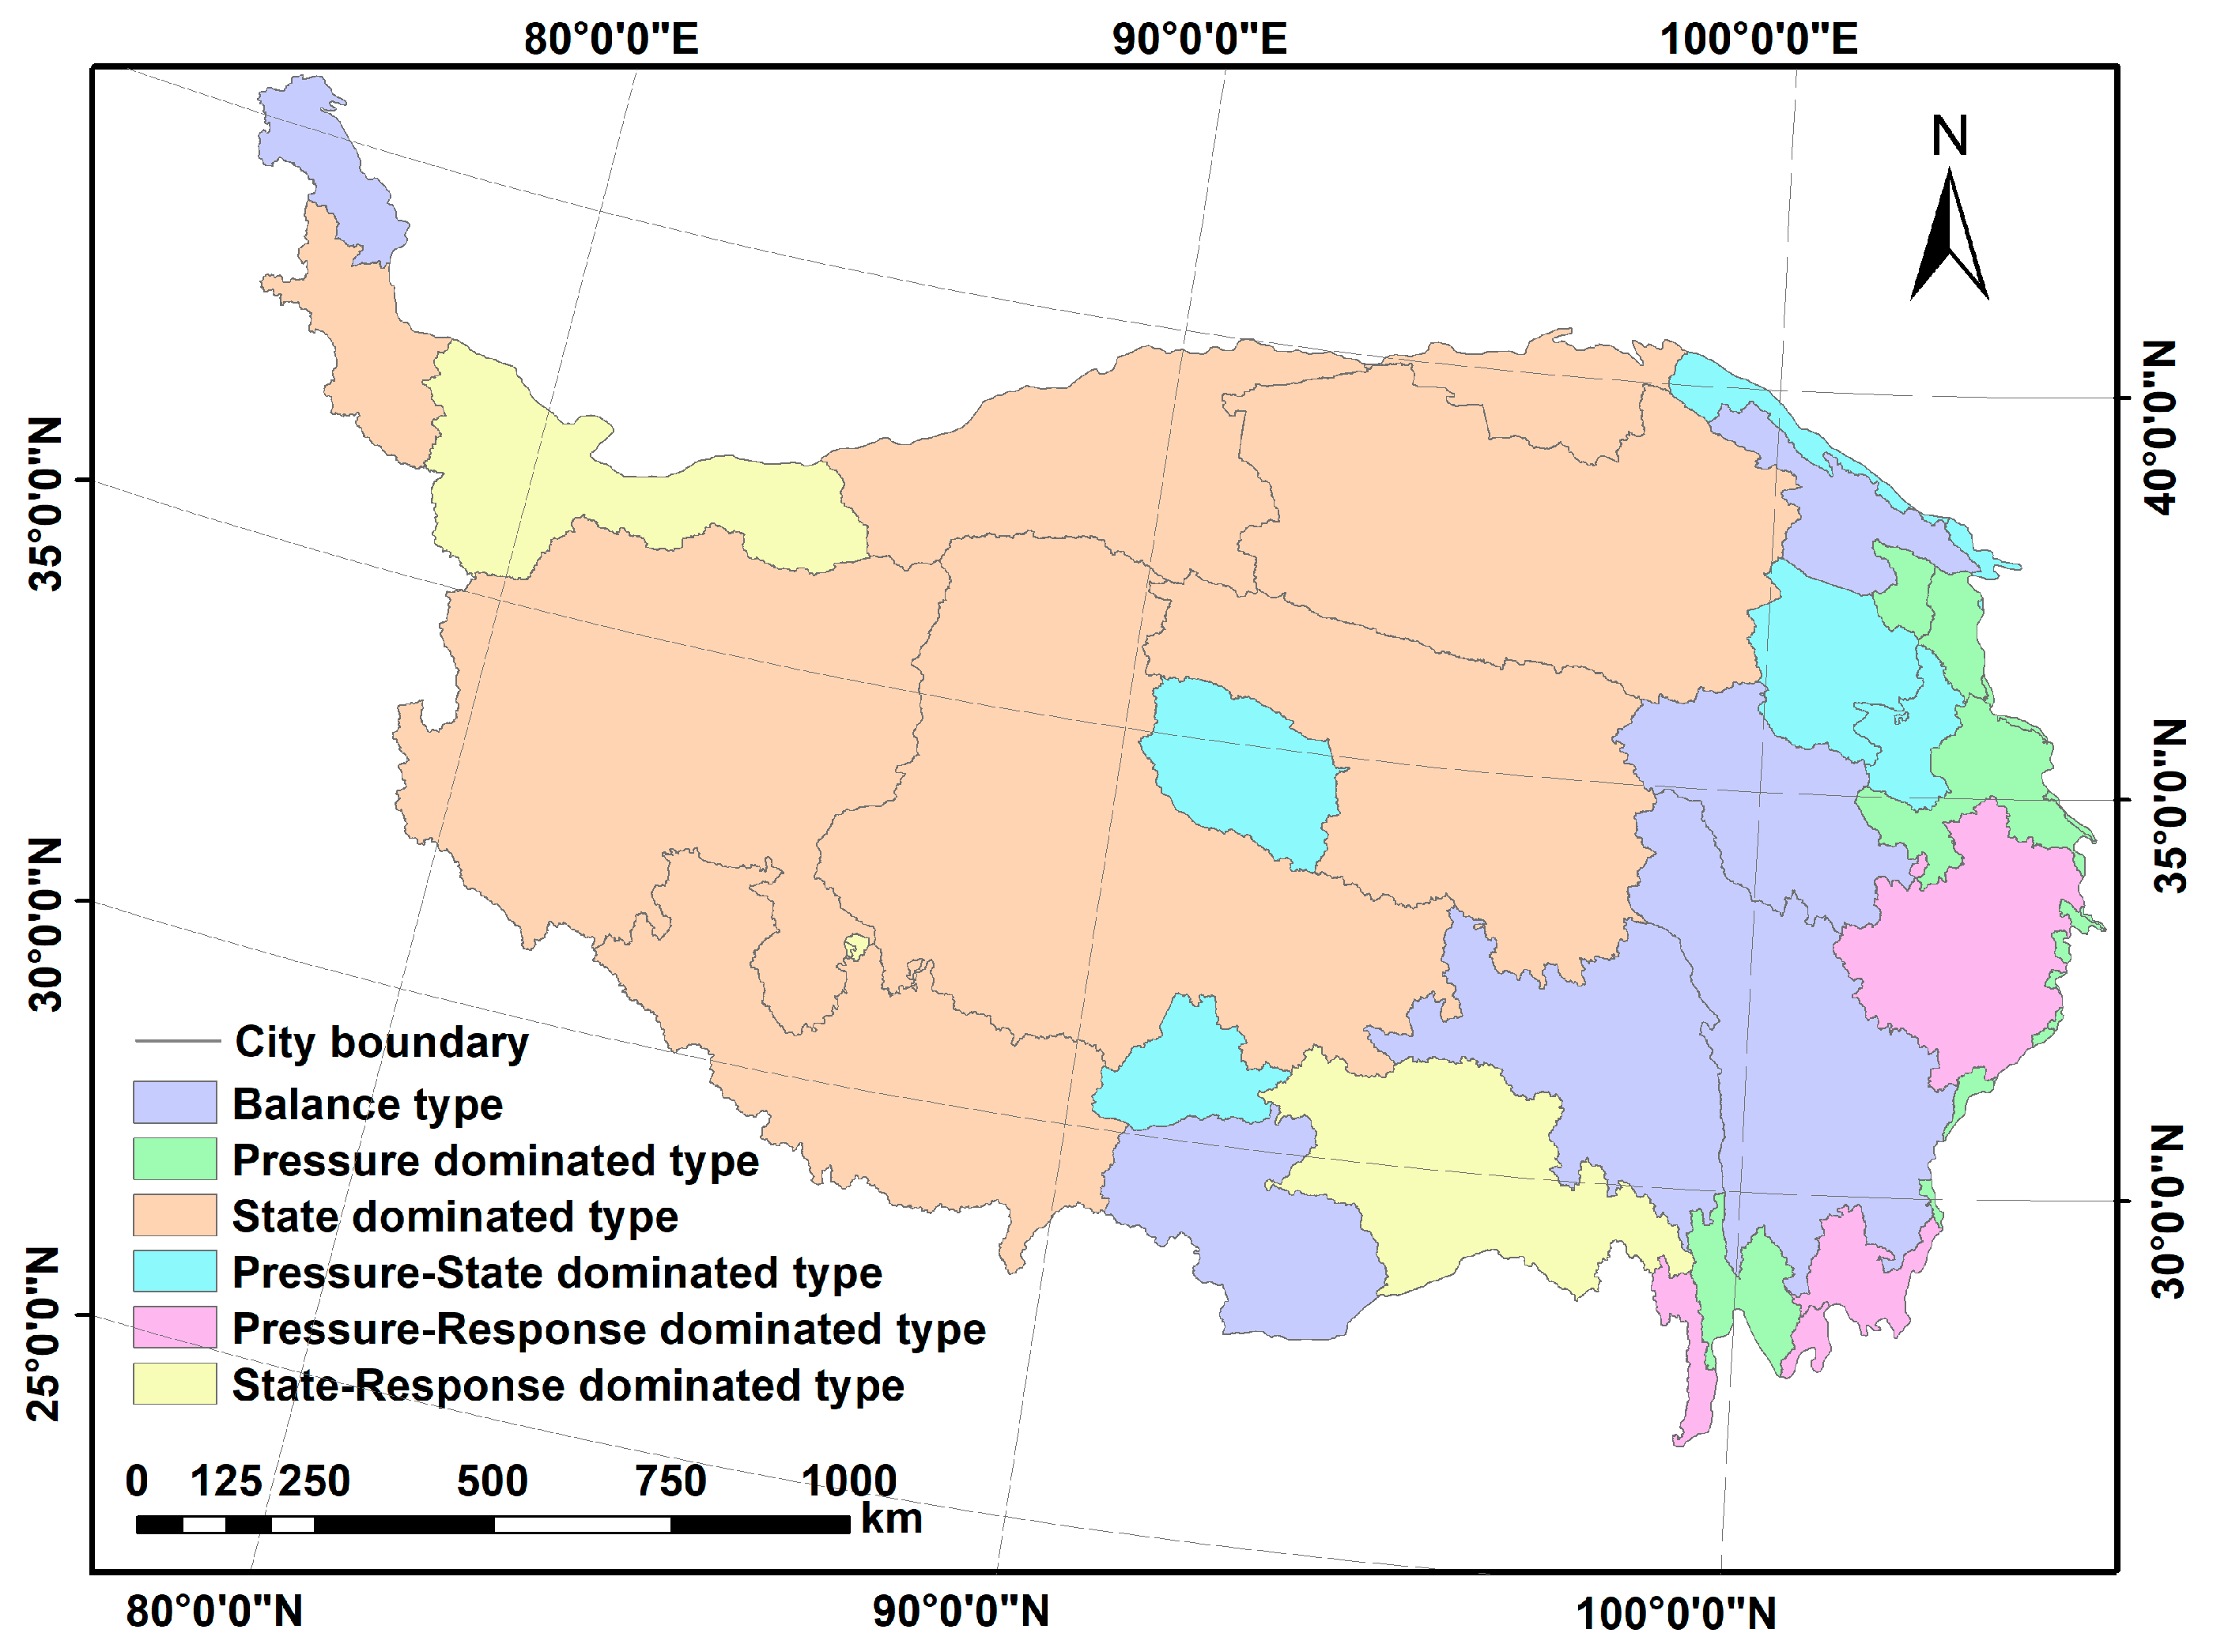
| Obstacle Degree Type | Region | Area (104 km2) | Area Ratio (%) | Population Ratio (%) |
|---|---|---|---|---|
| 1. Balance type | Kizilsu Kirghiz, Haibei, Golog, Garze, Changdu, Sannan | 47.10 | 18.24 | 20.08 |
| 2. Pressure-dominated type | Xining, Haidong, Linxia, Dingxi, Gannan, Longnan, Mianyang, Deyang, Chengdu, Ya’an, Diqing | 8.13 | 3.15 | 34.95 |
| 3. State-dominated type | Bayingol, Jiuquan, Kashgar, Delingha, Ngari, Nagqu, Yushu, Rikaze | 154.77 | 59.94 | 17.04 |
| 4. Pressure–state-dominated type | Zhangye, Wuwei, Hainan, Lanzhou, Huangnan, Golmud, Guangyuan, Lhasa | 15.56 | 6.03 | 11.20 |
| 5. Pressure–response-dominated type | Aba, Liangshan, Liangshan, Lijiang | 11.31 | 4.38 | 12.18 |
| 6. Response–state-dominated type | Hotan, Nyingchi | 21.44 | 8.30 | 4.55 |
Disclaimer/Publisher’s Note: The statements, opinions and data contained in all publications are solely those of the individual author(s) and contributor(s) and not of MDPI and/or the editor(s). MDPI and/or the editor(s) disclaim responsibility for any injury to people or property resulting from any ideas, methods, instructions or products referred to in the content. |
© 2023 by the authors. Licensee MDPI, Basel, Switzerland. This article is an open access article distributed under the terms and conditions of the Creative Commons Attribution (CC BY) license (https://creativecommons.org/licenses/by/4.0/).
Share and Cite
Lu, T.; Li, C.; Zhou, W.; Liu, Y. Fuzzy Assessment of Ecological Security on the Qinghai–Tibet Plateau Based on Pressure–State–Response Framework. Remote Sens. 2023, 15, 1293. https://doi.org/10.3390/rs15051293
Lu T, Li C, Zhou W, Liu Y. Fuzzy Assessment of Ecological Security on the Qinghai–Tibet Plateau Based on Pressure–State–Response Framework. Remote Sensing. 2023; 15(5):1293. https://doi.org/10.3390/rs15051293
Chicago/Turabian StyleLu, Tong, Changjia Li, Wenxin Zhou, and Yanxu Liu. 2023. "Fuzzy Assessment of Ecological Security on the Qinghai–Tibet Plateau Based on Pressure–State–Response Framework" Remote Sensing 15, no. 5: 1293. https://doi.org/10.3390/rs15051293