Article

A Reflection Symmetric Target Extraction Method Based on Hypothesis Testing for PolSAR Calibration

1
Key Laboratory of Land Environment and Disaster Monitoring, Ministry of Natural Resources, China University of Mining and Technology, Xuzhou 221116, China
2
Chinese Academy of Surveying & Mapping, Beijing 100036, China
3
Department of Land Surveying and Mapping, Ministry of Natural Resources, Beijing 100812, China
*
Author to whom correspondence should be addressed.
Remote Sens. 2023, 15(5), 1252; https://doi.org/10.3390/rs15051252
Submission received: 18 January 2023 / Revised: 21 February 2023 / Accepted: 22 February 2023 / Published: 24 February 2023

Abstract

:
Polarimetric calibration is indispensable to quantitatively apply and analyze the polarimetric synthetic aperture radar (PolSAR) image. At present, the polarimetric calibration methods relying on the assumption of reflection symmetry have been widely used, which need to extract the reference targets that meet the assumptions before calibration and then calculate the cross-pol channel imbalance and crosstalk errors. However, the distortion in the uncalibrated image will affect the calculation of polarization features, resulting in inaccurate target extraction results. Consequently, we proposed a reflection symmetric target extraction method that combines with spatial statistics information. The method first takes the initial extraction result based on the polarization power total Span and introduces the hypothesis testing to judge the homogeneous samples. Finally, we automatically calculate the threshold by the Otsu algorithm to achieve high-precision extraction of the reflection symmetric targets. Meanwhile, we carried out the polarimetric calibration experiments based on real C- and X-band airborne PolSAR data and conducted qualitative and quantitative evaluation and analysis of the experimental results. The studies demonstrated that, compared with classical approaches, the proposed approach further improved the accuracy of polarimetric calibration by extracting more accurate reference samples.

Graphical Abstract

1. Introduction

Polarimetric synthetic aperture radar (PolSAR) uses the acquired more abundant information on target parameters to greatly enhance the earth observation capability via satellite [1]. Consequently, this technique has been widely applied to disaster monitoring [2,3], land object classification [4,5], and vegetation monitoring [6]. PolSAR is usually described by a complex Sinclair matrix [7]. However, due to the distortion caused by the measurement process, polarimetric calibration (PolCal) becomes an important procedure for quantitative analysis of PolSAR images [8], which can restore the distorted measurements as featured in the Sinclair matrix by solving the parameters in error model, thus ensuring the repeatability of measurement data [9].
The most classical calibration methods [10,11] completely rely on artificially arranged corner reflectors (CRs). This kind of method has the advantages of accuracy and objectivity, but they need a lot of CRs, especially over a large-scale area.
The subsequent improved PolCal methods [12,13] calculate crosstalk errors and cross-pol channel imbalance based on distributed targets [14], which can reduce the dependence on artificial CRs and the workload of PolCal, so it is used widely as a PolCal scheme. For the current PolSAR system, the commonly used scattering assumptions of the distributed ground objects mainly include reciprocity and reflection symmetry. Reciprocity is the most commonly used assumption in this kind of calibration method. For example, the Ainsworth method [15] is based on this assumption to implement PolCal. Yet, in the currently mainly used SAR system of the single-based station, except for some special grounds such as stealth aircraft, other ground objects are easy to meet this assumption, so it is unnecessary to specifically extract relevant samples [16]. However, according to the polarization decomposition theory of the target, the reflection symmetric scattering exists in some distributed ground objects, such as bare soil, rainforest, road, etc. [17], which is difficult to accurately extract from uncalibrated images. Therefore, for the Quegan method [18] based on the assumption, the extraction of samples is crucial to the accuracy of its result.
At present, the widely used reflection symmetric target method in PolCal is mainly based on polarization characteristics [19], but the polarization distortion will affect the calculation of these parameters in uncalibrated images, thus resulting in low accuracy of target extraction results. To avoid this problem, we proposed to use a hypothesis testing method to determine samples for PolCal from the perspective of spatial statistics, according to most samples conforming to reflection symmetry belonging to the characteristics of surface objects. This idea was only applied in interferometric SAR (InSAR) at present, which is mainly based on the assumption that adjacent pixels near the reference sample are more probable to be selected as homogeneous points [20]. The statistically homogeneous pixels (SHP) selection methods based on hypothesis testing can be mainly divided into non-parametric and parametric testing methods.
The cumulative distribution of the non-parametric testing methods needs to be calculated pixel by pixel, with low calculation efficiencies, such as the Baumgartner–Wei–Schindler (BWS) [21] and Kolmogorov–Smirnov (KS) [22] tests. The parametric testing methods compare the overall distribution of the two sample data sets and use the difference between them to determine whether the pixel belongs to SHP, which has high calculation efficiency. The hypothesis testing of confidence interval (HTCI) method was proposed by Jiang et al. [23]. This approach first obtains the initial SHP set through the likelihood ratio test (LRT), uses its unbiased properties to control the type I errors, and then iteratively uses the Gamma test to reduce the type II errors to obtain more accurate results and further reduce heterogeneity.
In this study, we have combined the advantages of polarization features and spatial statistical information and proposed a new reflection symmetric targets extraction method (Span-PCHTCI). The proposed method, based on the preliminary extraction of Span [15], and for better application to PolCal, also extends and improves the advanced HTCI method in hypothesis testing (named PCHTCI). The PCHTCI method takes the intensity images of the cyclic polarization channels as the input and utilizes the threshold of SHP results automatically calculated by Otsu [24] to extract more accurate reflection symmetric targets. Additionally, the Quegan method with reflection symmetric assumptions is used to calculate and correct the PolCal errors. In the experimental part, the airborne C-band and X-band PolSAR images were used to compare the proposed approach with other extraction methods from qualitative and quantitative perspectives. The results demonstrated that the proposed method can further improve the precision of PolCal by improving the extraction accuracy of reflection symmetric targets.

2. PolCal Error Model

In the process of PolSAR imaging, the measured Sinclair matrix will be distorted due to the influence of noise and propagation environment. The errors need to be corrected to obtain the scattering matrix in the ideal situation [9,25]:
M h h M h v M v h M v v = R h h R h v R v h R v v × S h h S h v S v h S v v × T h h T h v T v h T v v + N h h N h v N v h N v v
where [M] and [S] are the distorted and true Sinclair matrices in an ideal state, respectively. [R] and [T] mean the distortion components in the process of receiving and transmitting. [N] represents the additive thermal noise in SAR.
The crosstalk and the channel imbalance error have different meanings and characteristics. The calibration model can undergo conversion to facilitate the description and calculation of the algorithm [13]:
M = Q S + N
where Q is the complex cross-pol channel imbalance matrix, and Q = R T T . Superscript T means the transpose. Q can be further represented by crosstalk, co-pol, and cross-pol channel imbalance.
M h h M h v M v h M v v = A k 2 α v k w k α v w z k 2 α k w z k α w u k 2 α u v k k α v u z k 2 α u k z k α 1 × S h h S h v S v h S v v + N h h N h v N v h N v v
u = R v h R h h , v = T v h T v v , w = R h v R v v , z = T h v T h h k = R h h R v v , α = ( R v v T h h ) ( R h h T v v ) , A = R v v T v v
In (3) and (4), the crosstalk u, v, w, z, co-pol, and cross-pol channel imbalance k, α all belong to complex numbers. A denotes the absolute factor, which is generally considered to not impair the relationship of the polarization channel [26]. For distributed targets, they cannot be accurately described using only the Sinclair matrix, so polarization covariance matrix C is often used in PolCal.
C = M M H = Q C s Q H
C s = S S H
where CS represents the true polarization covariance matrix, and superscript H means the conjugate transpose.

3. Method

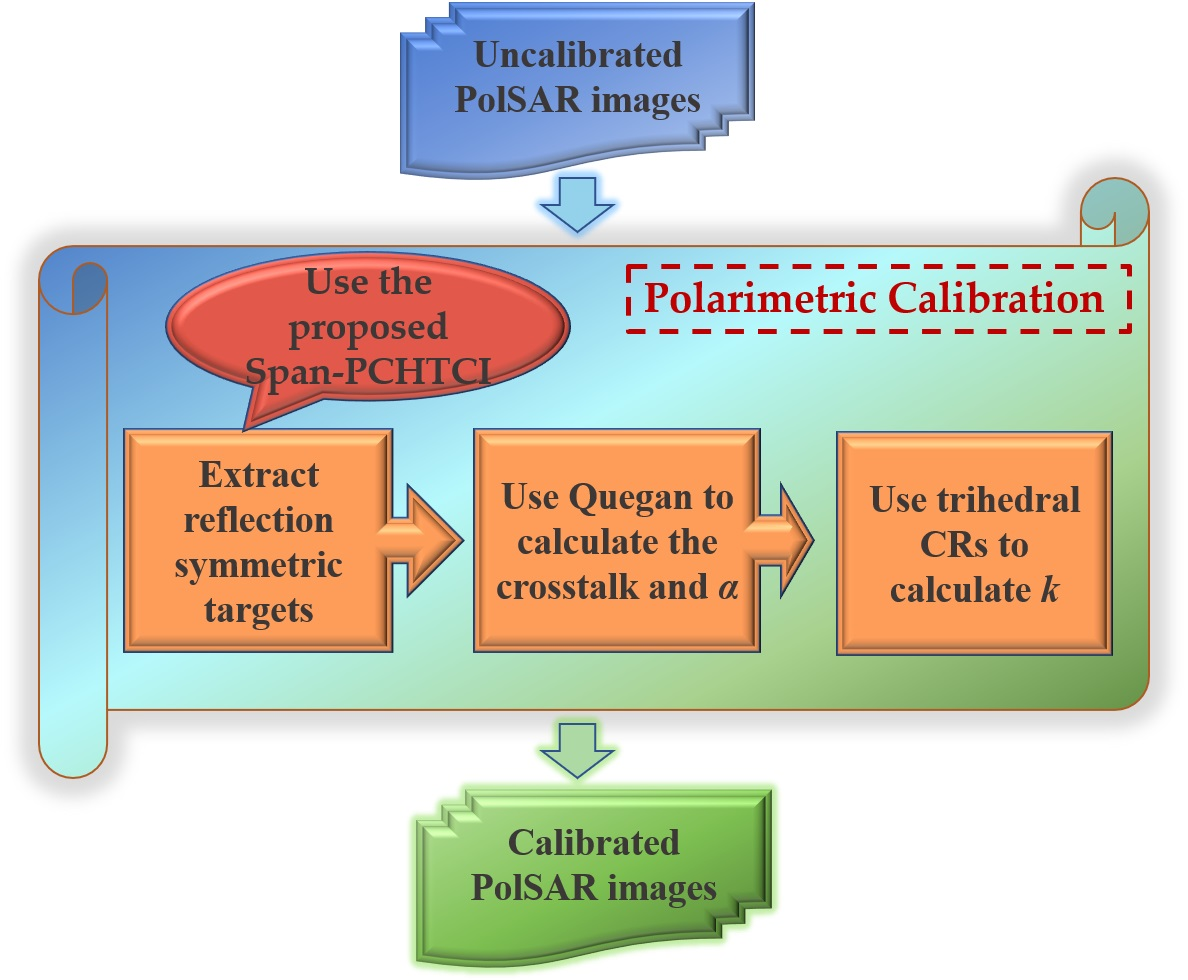
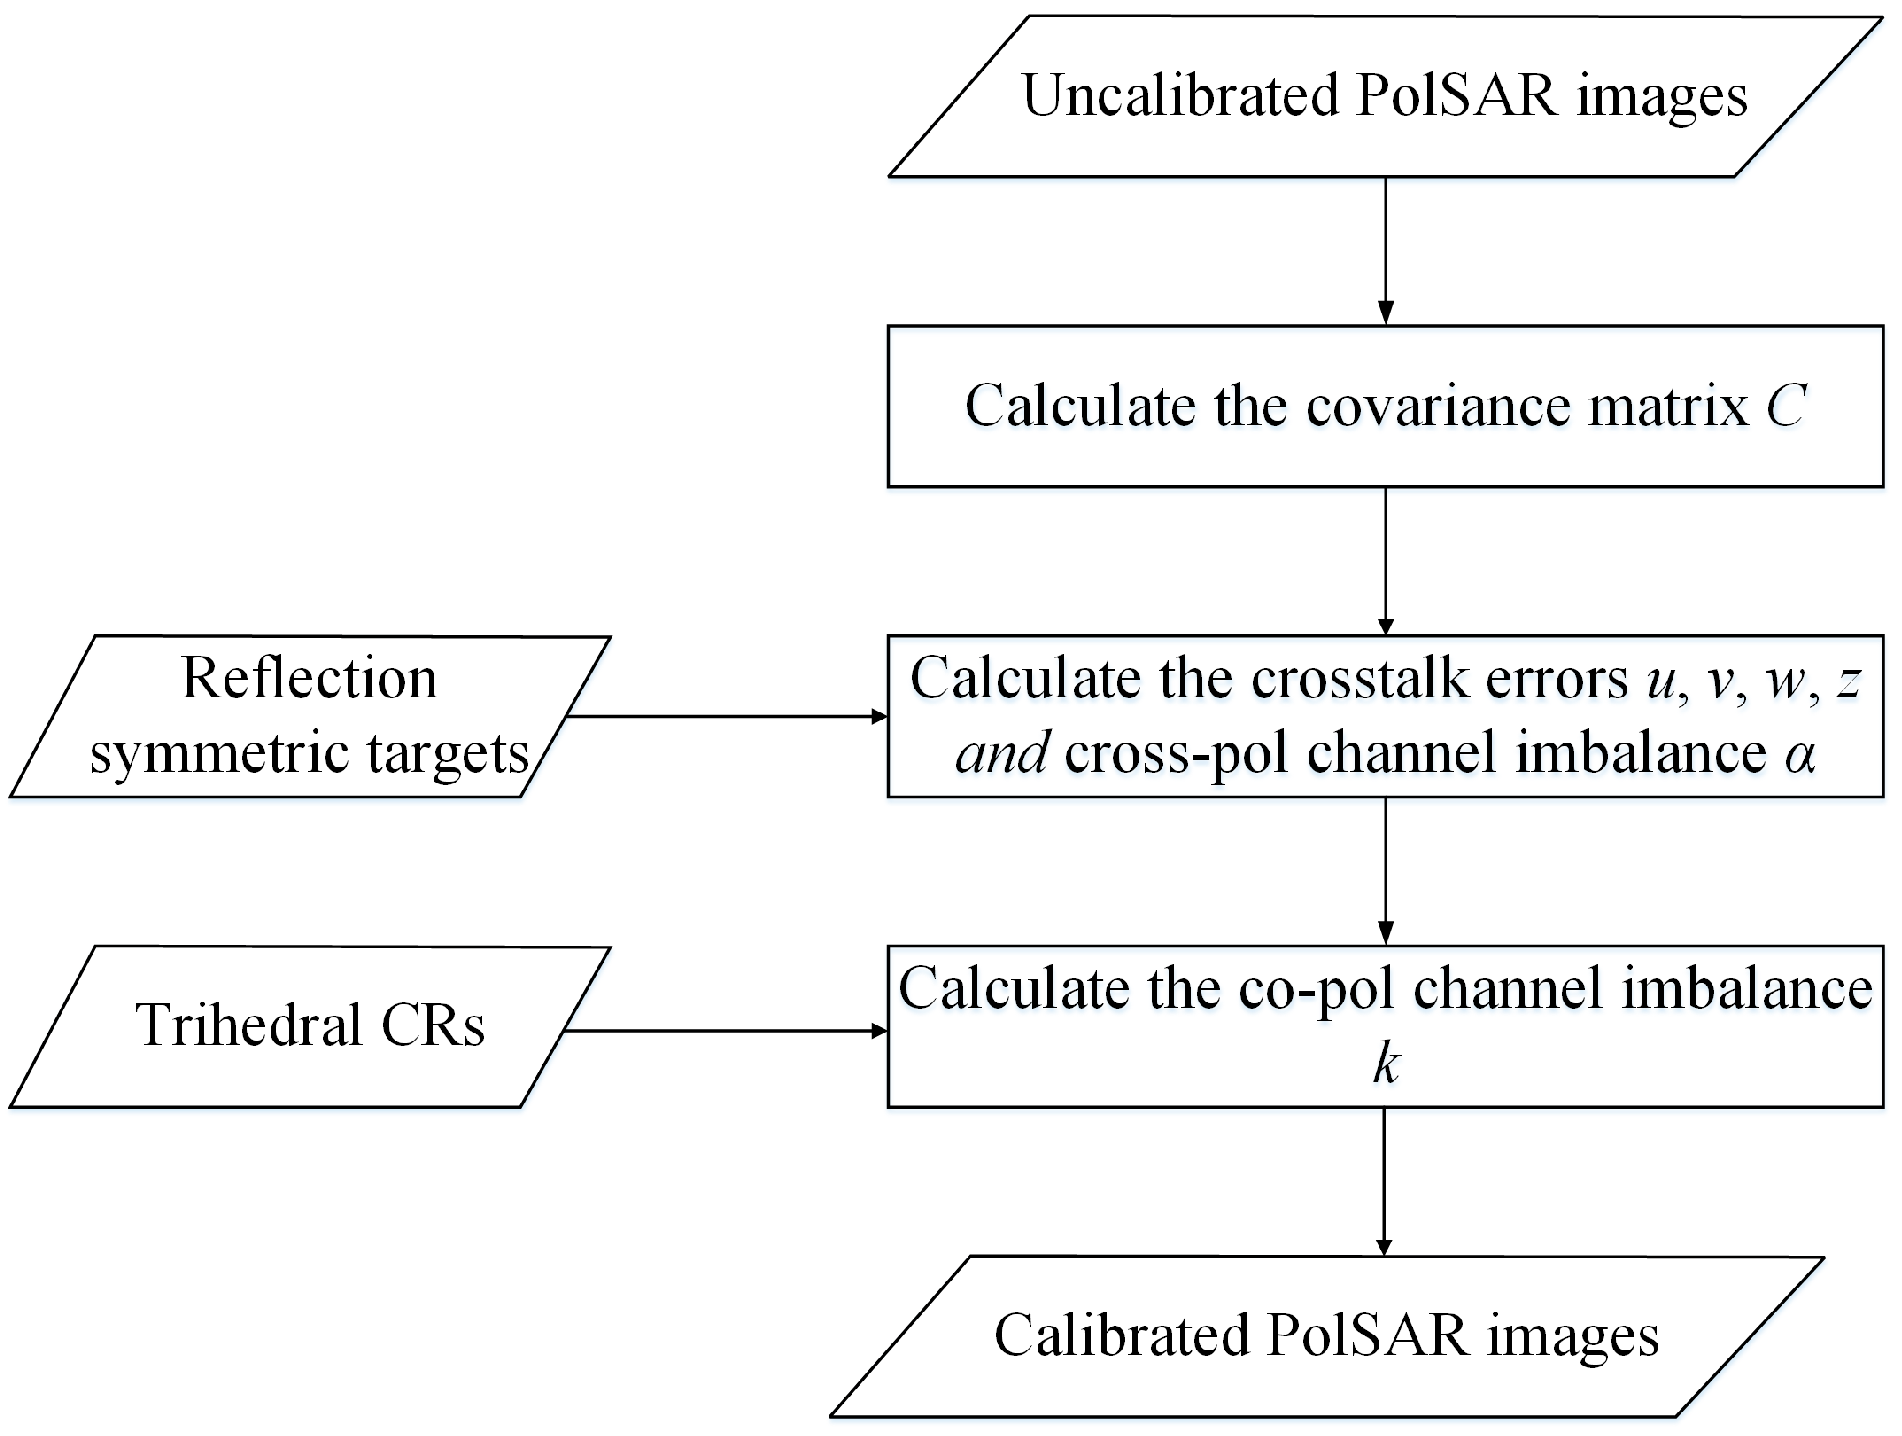
3.1. Calibration Methods

In this paper, the classical Quegan approach according to the hypothesis of reflection symmetry is chosen for the PolCal process. The Quegan method [18] can calculate the crosstalk errors and α without CRs, and only requires at least one trihedral CR to correct k. The solved parameters are as follows:
u = ( C 44 C 31 C 41 C 34 ) Δ
v = ( C 11 C 34 C 31 C 14 ) Δ
w = ( C 11 C 24 C 21 C 14 ) Δ
z = ( C 44 C 21 C 41 C 24 ) Δ
Δ = C 11 C 44 C 14 2
The solution of α can be calculated by the following formula:
α 1 = ( C 22 u C 12 v C 42 ) X
α 2 = X ( C 33 z C 31 w C 34 )
X = C 32 z C 12 w C 42
The estimate of α can be obtained by Expression (15):
α = α 1 α 2 1 + ( α 1 α 2 1 ) 2 + 4 α 2 2 2 α 2
This method can achieve the correction of the scattering matrix non-iteratively, hence it has become a common calibration method for spaceborne and airborne PolSAR systems [27]. Consequently, on the basis of the proposed extraction method for reflection symmetric samples, this study will utilize this method to complete PolCal. Meanwhile, the results will further verify the calibration accuracy of different extraction methods. The process of the Quegan method can be seen in Figure 1.

3.2. Optimized HTCI Approach

At present, most of the methods of extracting reflection symmetric samples based on polarization characteristics are widely used in PolCal. Although they are more intuitive, they are also easily affected by distortion matrices, resulting in low accuracy of target extraction results. Therefore, this paper proposed a method of using hypothesis testing to determine the reference samples in PolCal. This method is based on the statistical characteristics that the reflection symmetric samples (such as bare land and farmland, etc.), belong to the planar region, and uses the hypothesis testing method that adjacent samples close to the reference target are more probable to be selected as SHP, so as to judge the SHP within a certain window range.
In the selection of SHP in InSAR, researchers have proposed a strategy for processing SAR data according to statistical principles using the intensity information of images in temporal dimension. However, there are no time series samples in the field of PolCal, thus we improved the algorithm and used the cyclic input of different polarization channels to replace the third-dimensional time sample information. This paper mainly introduces and improves the HTCI test method with better SHP extraction effect in InSAR [28], and further applies it to PolCal (PCHTCI).
The HTCI test [23] belongs to parametric testing, which assumes that each single-channel complex image in SAR conforms to the complex circular Gaussian distribution. As a consequence, the intensity image obeys the exponential distribution. On this basis, using hypothesis testing, the similarity between the center sample and the pixels in its neighborhood is compared one by one:
f ( x ) = 1 θ e x θ , x 0
In HTCI test method, the unbiased nature of a small window LRT is used to obtain an initial set of SHP values to control the type I and II errors. When the method is practically applied, F test is usually adopted to improve the computational efficiency instead of the LRT [29]. The intensity of each pixel is independent and random, and they satisfy the exponential distribution, I p E ( 1 σ p 2 ) , I q E ( 1 σ q 2 ) . The null and alternative hypotheses H0 and H1 can be expressed as:
H 0 : σ p 2 = σ q 2 = σ 2 H 1 : σ p 2 σ q 2
Later, using the relationship between exponential and chi-square distribution, it will be further deduced that:
σ p 2 I ¯ p σ q 2 I ¯ q F 2 N , 2 N I ¯ p I ¯ q H 0 F 2 N , 2 N
where N means the number of samples. Under the assumption that H0 is established, the ratio of the reference sample and other pixels in the neighborhood obeys the F distribution, therefore, the expression for the interval estimation can be of the form:
P f a / 2 ; 2 N < I ¯ a I ¯ b < f 1 a / 2 ; 2 N = 1 a
The initial set of SHP values can be averaged to estimate the value of the reference pixel μ ^ ref . In case of small samples, the cumulative sum of the intensity image conforms to the Gamma distribution, and the interval of the HTCI test can be more precise, thereby reducing the type II errors.
P g a / 2 ; N θ / N < μ ^ < g 1 a / 2 ; N θ / N = 1 a
In (20), ga/2;N represents the Gamma distribution quantile, θ is substituted by the estimated μ ^ ref , and μ ^ is the mean intensity of other samples in its neighborhood. On the whole, according to the idea of iteration, HTCI test further controls the two types of errors using likelihood estimates and more precise intervals based on the Gamma distribution.
It is worth noting that the proposed PCHTCI improves the HTCI method for better application to PolCal:
1. It is different from the HTCI test that takes the time series InSAR intensity images as input. In this paper, the intensity images of the cyclic polarization channels are used as the input of the PCHTCI method to adapt the PolSAR characteristics, so N should be a multiple of 4. This paper chooses to set N to 20 through experimental comparisons in Section 5.
2. In this paper, the PCHTCI method further processes the SHP result obtained by the HTCI method to obtain the extraction mask diagram required by PolCal. Its main purpose is to use the results of SHP to extract the reflection symmetric targets such as farmland and eliminate some artificial buildings with strong scattering that do not satisfy the assumption of reflection symmetry, so as to improve the discrimination of different ground objects. Therefore, this paper uses the classic Otsu [24] algorithm to perform threshold segmentation on the SHP results to avoid the reduced applicability of the method caused by the empirical threshold.

3.3. Improved Reflection Symmetric Target Extraction Method

The PCHTCI algorithm compared the homogeneity between the reference sample and the rest of the samples in its neighborhood according to statistical principles and obtains the number of SHP of the reference sample. This method uses the acquired SHP to obtain areas that conform to the assumption of reflection symmetry, such as bare land and farmland, so as to further improve the extraction precision. However, it is worth noting that some pixels with weakly scattered features, such as calm water surfaces and roads are dominated by the system noise, and the scattering matrix distortion is serious. It is necessary to remove these regions from the PolCal reference samples to ensure the accuracy of the polarization error parameters, but the PCHTCI test may extract them due to their homogeneity. Therefore, this paper combines polarization characteristics and spatial statistical characteristics and proposes the extraction method that combines Span and the PCHTCI test (Span-PCHTCI). It uses the classical Span method to remove the pixels that do not meet the requirements from the perspective of polarization scattering characteristics and utilizes stable spatial statistical information to further improve the accuracy of extracting reflection symmetric samples through hypothesis testing methods. The process of the Span-PCHTCI method can be seen in Figure 2. And the main steps of our method in this paper are as follows:
  • Use the observed Sinclair matrix to obtain the Span of each pixel in the image and calculate the threshold SpanT corresponding to each column.
  • Compare the Span of each pixel with 4 times and 0.02 times the SpanT corresponding to the column, save and record the position of the pixel that meets the conditions of expression (20) as (XS, YS), and the position of the pixel that does not meet the condition as (XS′, YS′).
  • In the mask image maskS, set the saved pixel position maskS (XS, YS) to 1, and set the removed pixel position maskS (XS′, YS′) to 0.
  • Take the average value of the intensity images of the four polarization channels, and this is set as the true intensity image of the PolSAR image of the scene.
  • For the true intensity image, use the 7 × 7 small window LRT to obtain the initial value of the homogeneous points for the HTCI test.
  • For the initial value set, use the Gamma test iteratively to obtain the image for the results of the homogeneous points in the 15 × 15 window.
  • Normalize the results and use Otsu to calculate automatically the threshold TH for the image of the SHPS result and judge the normalized result of each pixel with TH; save and record the pixel position greater than TH as (XH, YH), and the pixel position less than TH as (XH′, YH′).
  • In the mask image maskH, set the recorded pixel position maskH (XH, YH) to 1, and set the removed pixel position maskH (XH′, YH′) to 0.
  • Calculate the mask image maskS and maskH, by an operator to obtain the final mask image maskF; that is, for each pixel, if one of the two is 0, the result is 0, and if both are 1, the result is 1.

4. Experiment

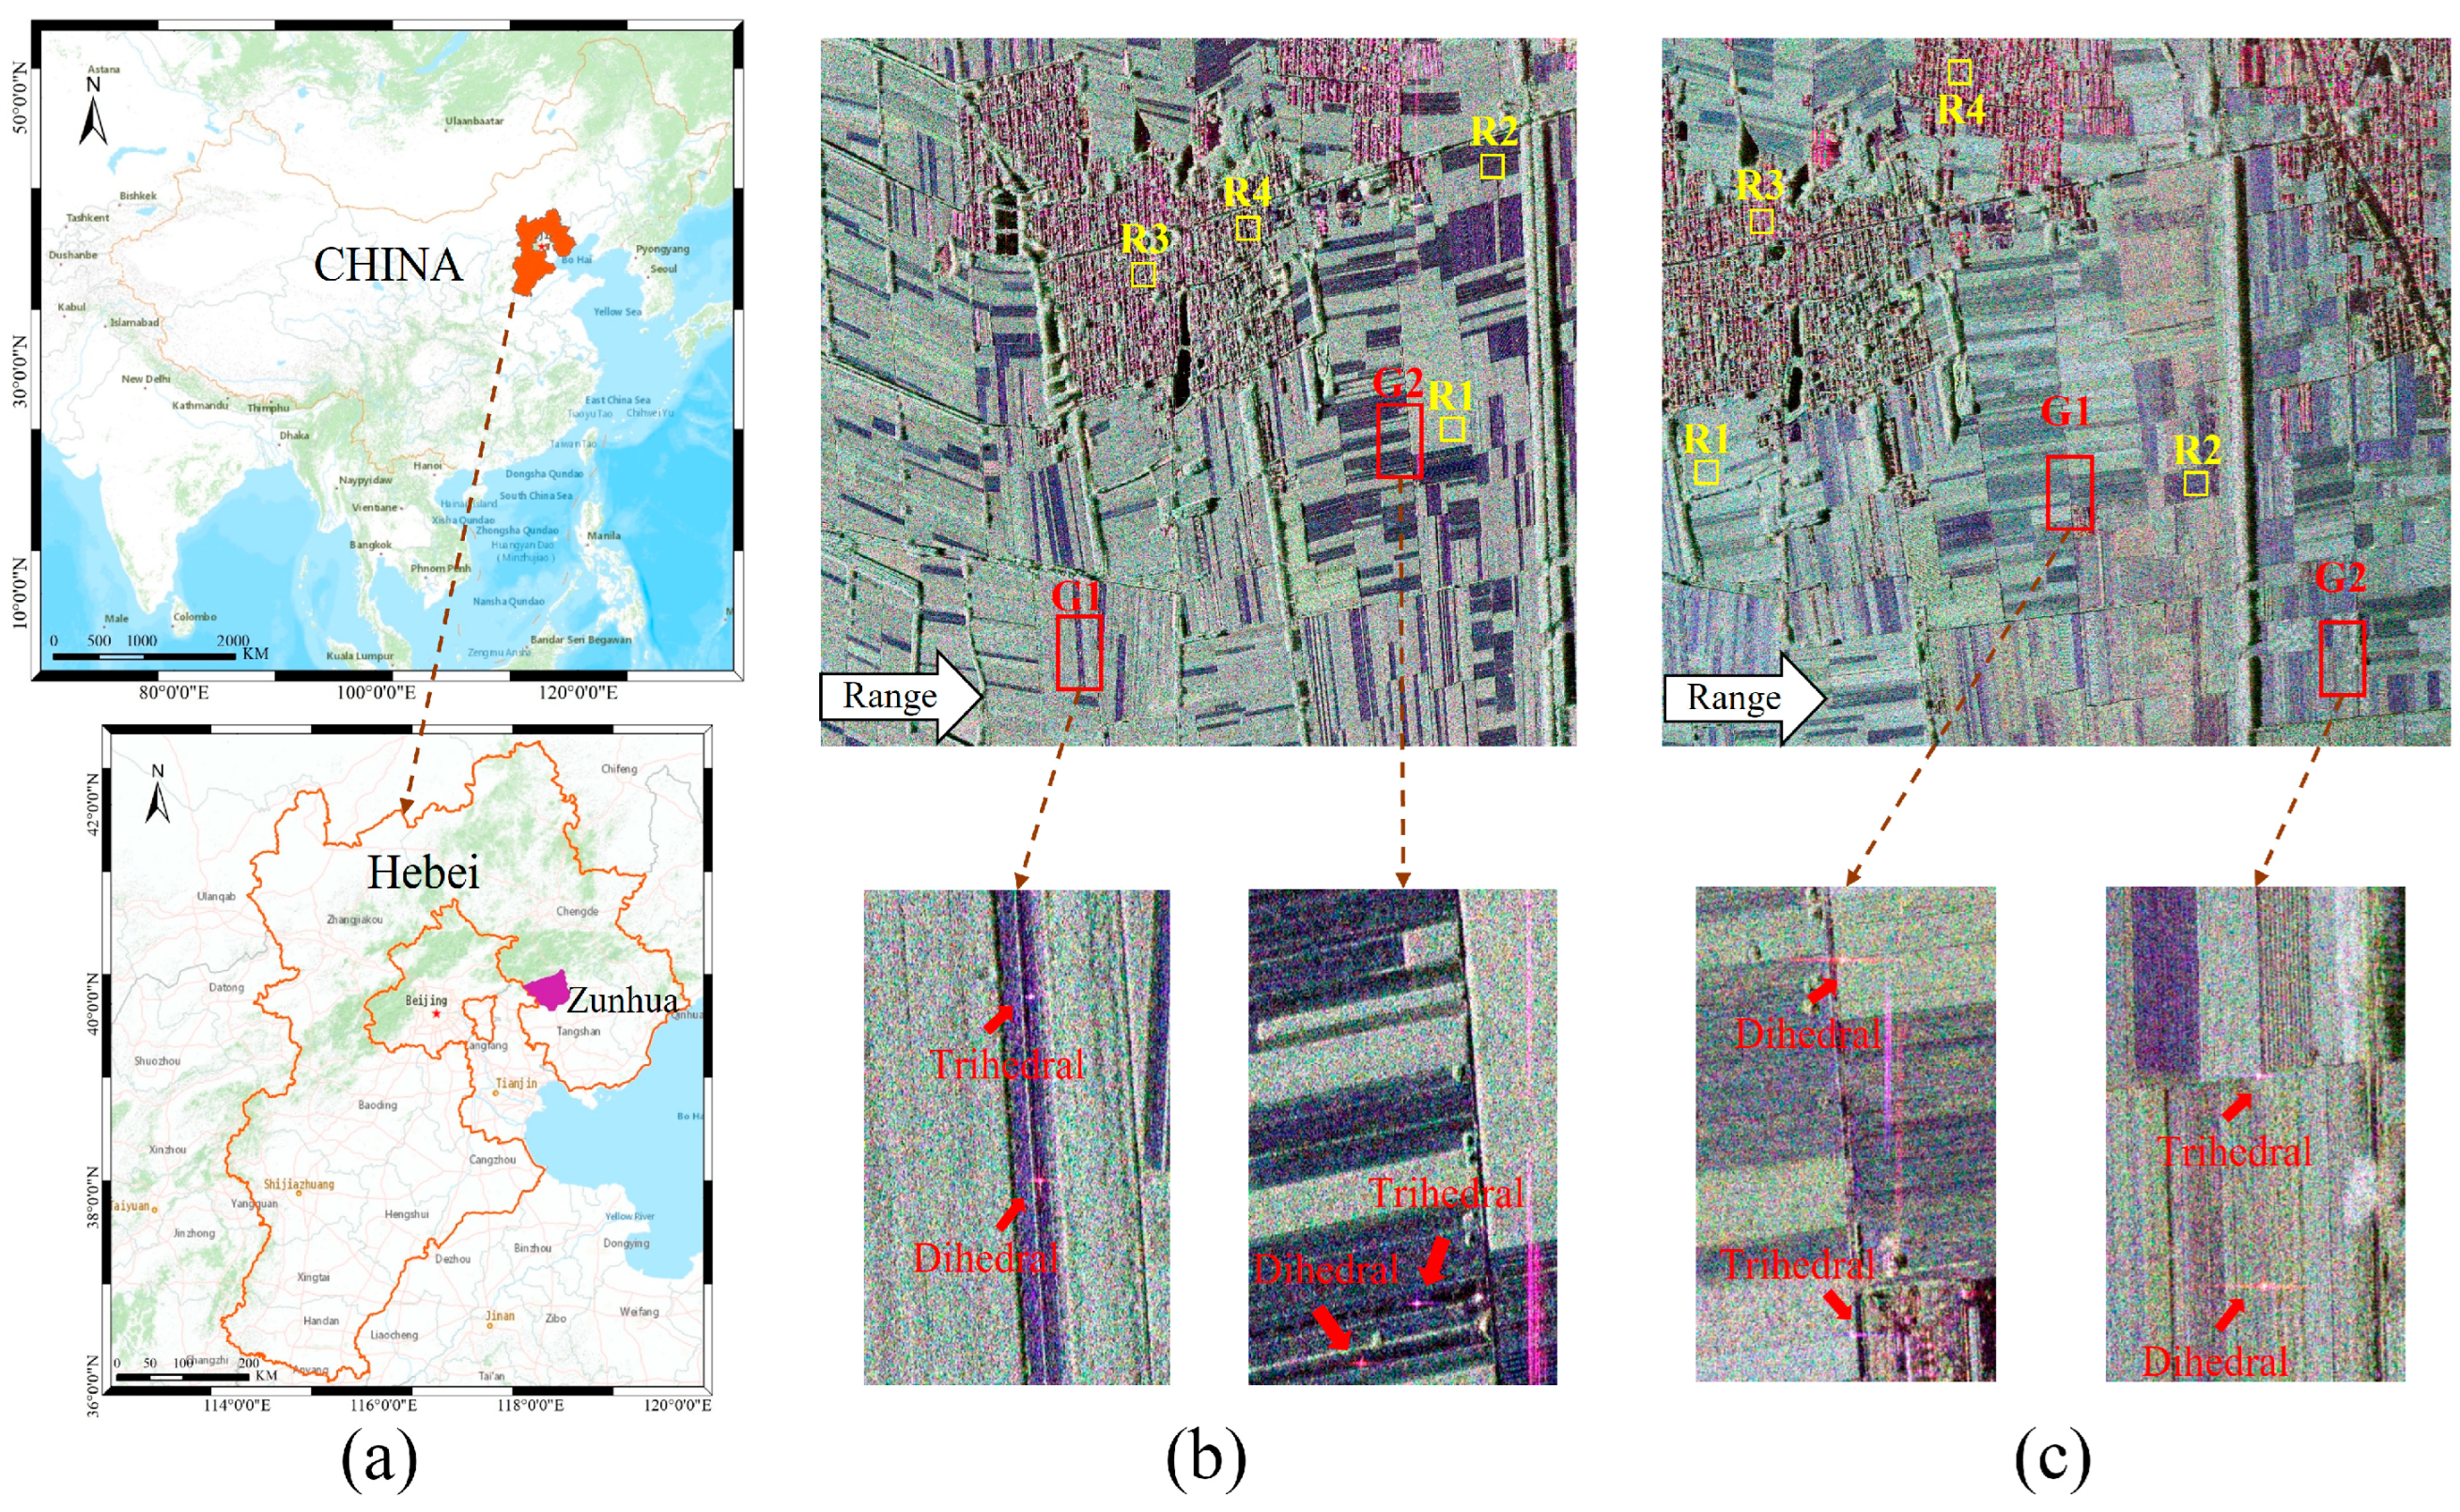
4.1. Overview of Experimental Area

In the experimental part of this paper, the C- and X-band PolSAR images were produced by the Chinese Academy of Sciences (IECAS), whose geographical location is shown in Figure 3a. The 10,705 × 11,757 pixels Pauli RGB image of PolSAR in C-band is in Figure 3b, and its corresponding pixel resolution of azimuth and range directions is 0.13 m and 0.2 m. The 8370 × 9584 pixels Pauli RGB image of PolSAR in the X-band is shown in Figure 3c, and its corresponding pixel resolution of azimuth and range directions is 0.17 m and 0.19 m. This region has many types of ground objects and clear differentiation, including farmland, bare land, and urban areas, which can well illustrate the extraction effect of different methods. The IECAS researchers deployed multiple trihedral and dihedral CRs in ground survey campaigns to calibrate the images and assess the polarization quality. There is one trihedral and dihedral CR along the azimuth in the red rectangles, which are specifically magnified for clear visualization below the Pauli RGB maps. In the experiment part, we used the trihedral CR in G1 located in the center of the image to calculate k and verified results with all annotated CRs. Furthermore, four 300 × 300 areas in the image were selected to further compare the methods: R1 represents a farmland region, R2 represents a bare land region, and R3 and R4 both contain more artificial buildings. R1 and R2 represent the regions that meet the reflection symmetric assumption and should be reserved, while R3 and R4 represent the regions where most points do not meet the assumption.

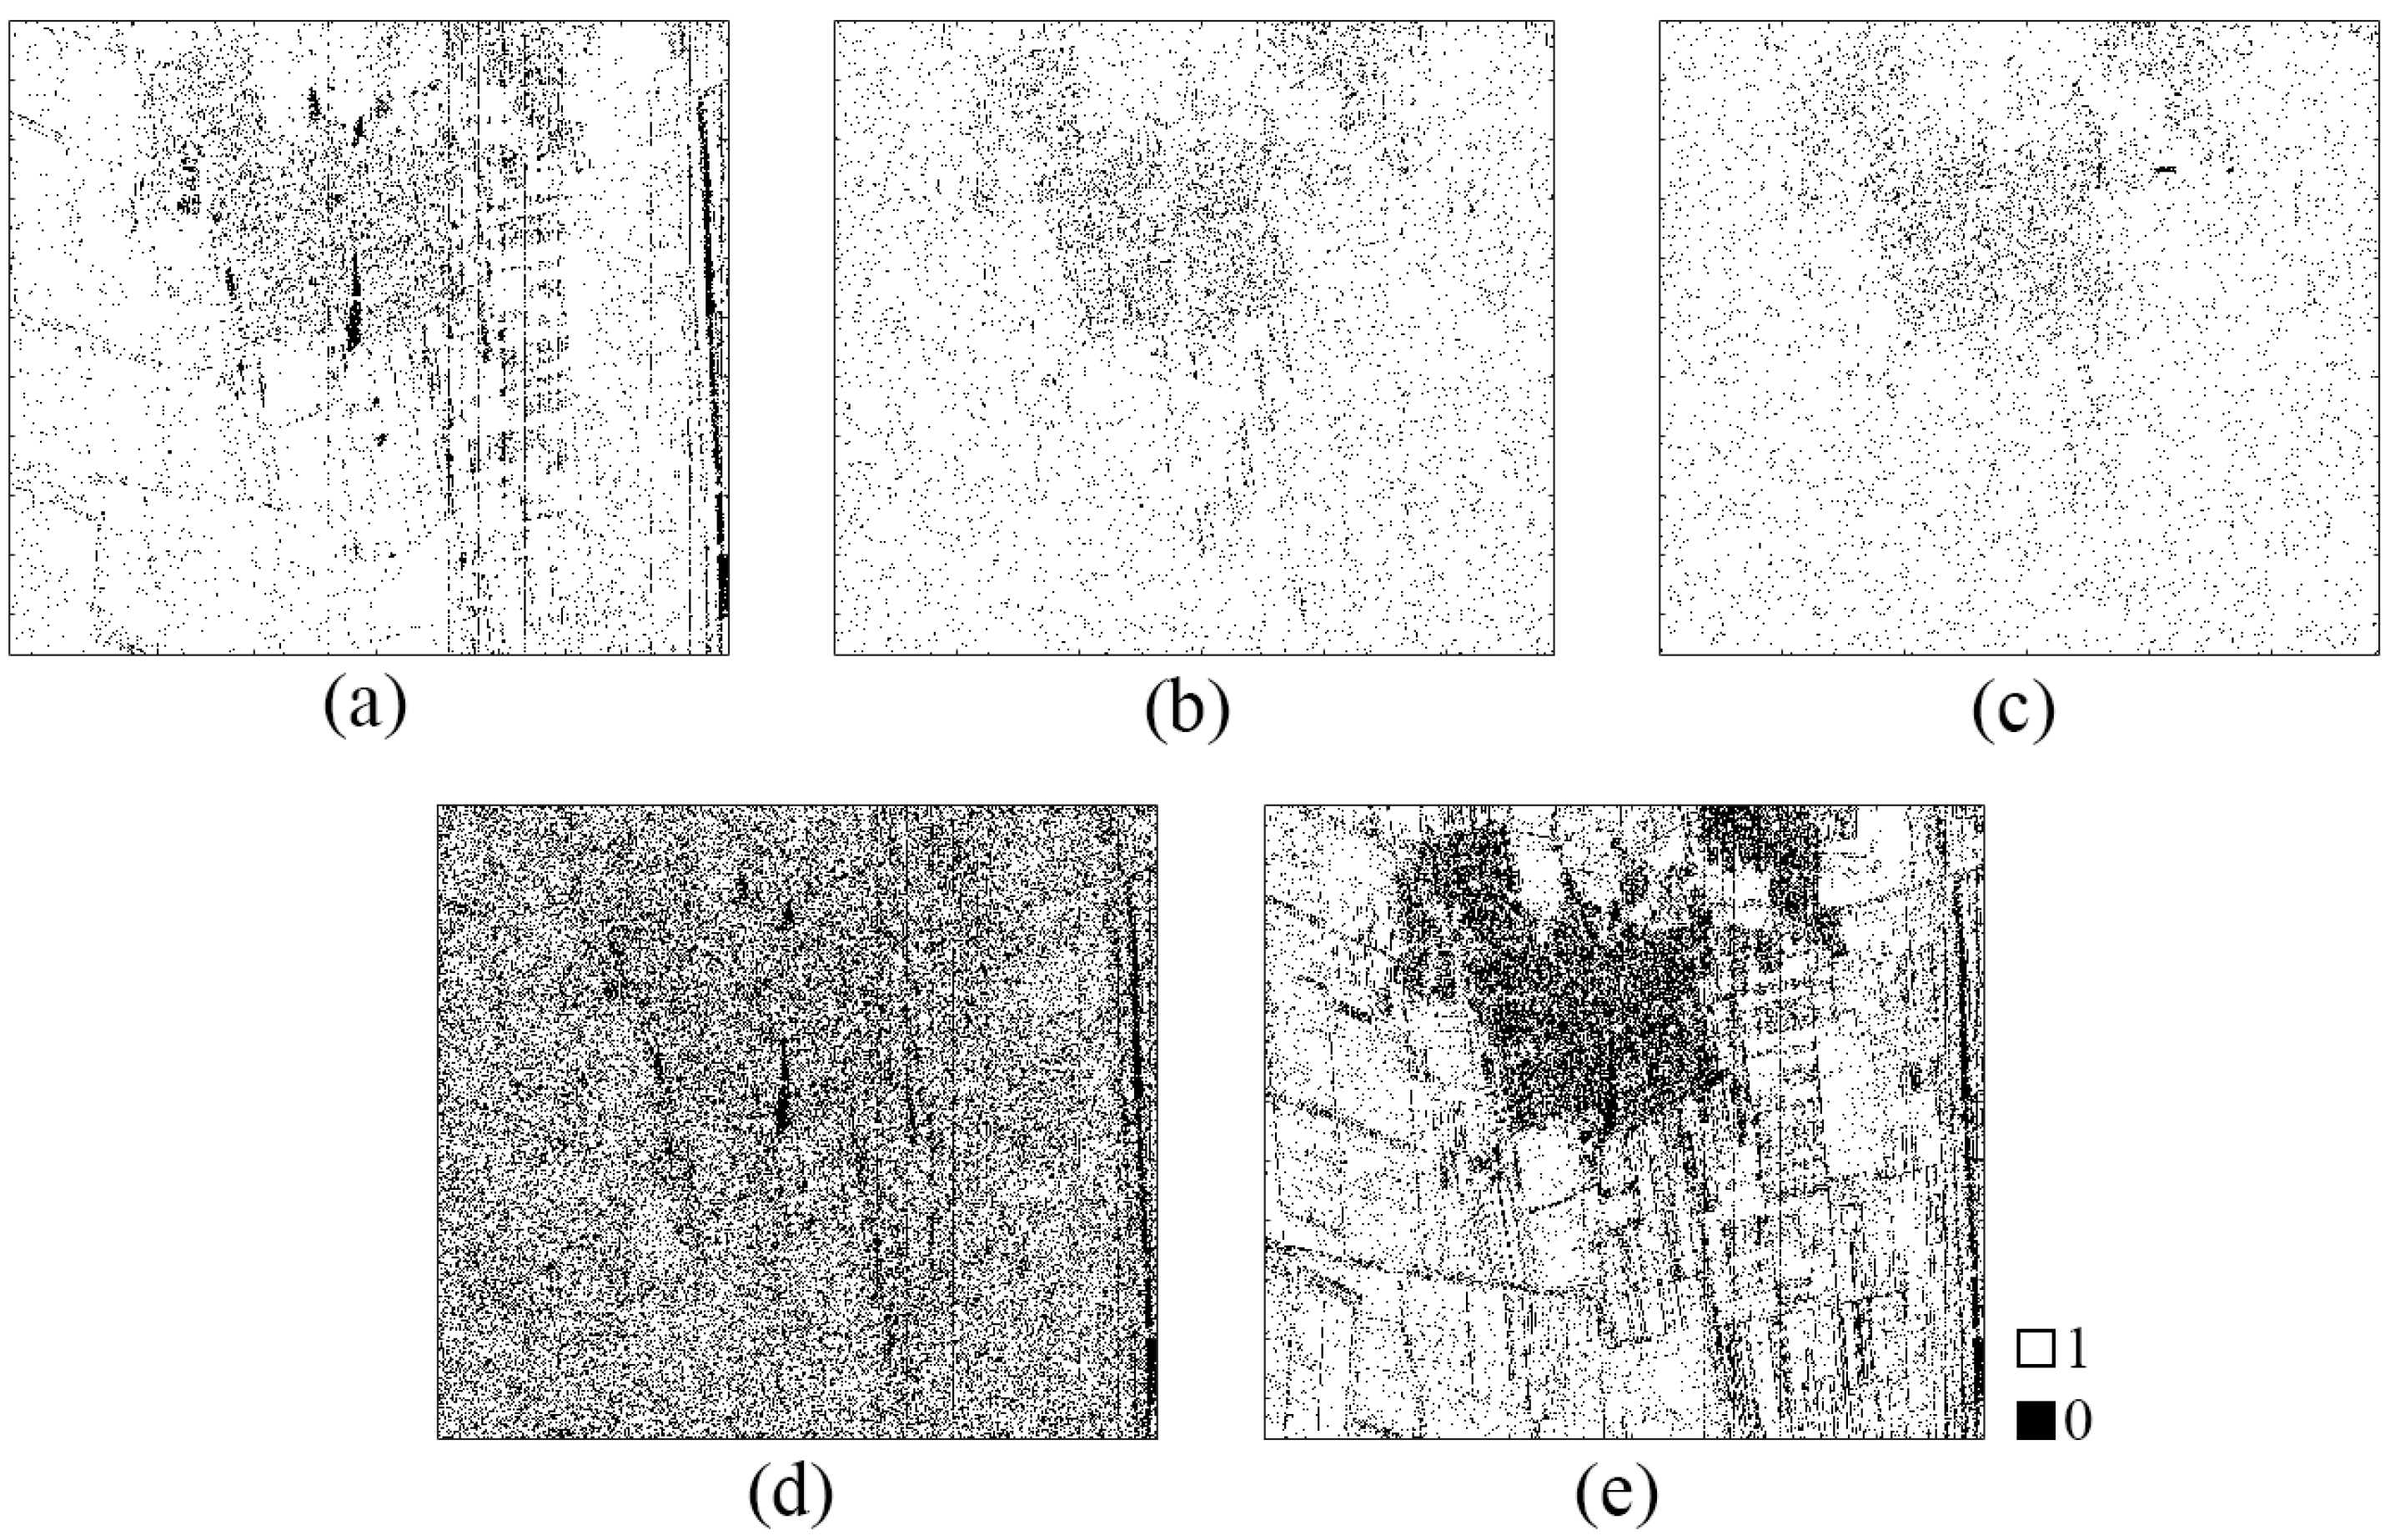
4.2. Extraction of Reflection Symmetric by PCHTCI

The PCHTCI method used the common 15 × 15 window, the significance level a was 0.05, and the sample number N was 20. Firstly, we extract SHP, and then normalize the results. Finally, based on this, the Otsu method is used to calculate the threshold automatically. The extraction results are represented by mask images, in which the value of the position greater than the threshold is set to 1 and retained, and the value of the position less than the threshold is set to 0, that is, the point is eliminated when applying the Quegan method. The extraction results of SHP and their mask images are in Figure 4.
From the qualitative analysis of Figure 4, the image of the SHP selection result is smooth, and the features of the mask image obtained by the PCHTCI method have a clear frame and classification. The PCHTCI can clearly extract a large number of reference features that conform to reflection symmetry, such as farmland and bare land, and also has a good eliminating effect on artificial buildings with strong scattering.

4.3. Extraction of Reflection Symmetric Targets

We compare four commonly used extraction algorithms to estimate the performance of the Span-PCHTCI approach in this section. The results for the different extraction methods are given in Figure 5 and Figure 6, and where the mask result is also a binary image. In Figure 5 and Figure 6, (a) are the results based on Span [15], which removes the pixels that greater than 4 or less than 0.02 times the mean Span of its column (SpanT); (b) and (c) are the extraction methods based on the polarization correlation coefficients r(MHH, MVH), r(MVV, MHV) [19], respectively, which retain the part of the polarization correlation coefficient less than 0.5; (d) are the results using the Helix [8] as the extraction index, based on Otsu to obtain thresholds.
It can be seen from both Figure 5 and Figure 6 that three traditional approaches Span, r(MHH, MVH), and r(MVV, MHV) can extract large regions of land that satisfy reflection symmetric assumption but also extract more points in residential areas including artificial buildings, so the accuracy of the results is low. Figure 5 and Figure 6d indicated that Helix retains fewer targets with indistinct distinction except for bare soil. Figure 5 and Figure 6e show the results of the proposed Span-PCHTCI method, which clearly distinguishes the different objects compared with other algorithms. It can not only effectively extract the reflection symmetric targets such as bare land and farmland in the image, but also eliminate more pixels in building areas with strong scattering that do not conform to the reflection symmetric assumption. The Span-PCHTCI method combines spatial statistical information and polarization features. While removing saturated pixels and low-power pixels through Span, it uses the PCHTCI to obtain automatically the extraction results of reflection symmetric samples, which can improve the precision of extraction and ensure the stability of subsequent PolCal.
Table 1 and Table 2 further confirm the above conclusion. In the classical polarization extraction methods, the Span approach has a certain difference between the different regions in C- and X- band images, with about 15%. The polarization correlation coefficient methods have little differences in X-band images, and the extraction rates of different types of regions are relatively close. The total extraction proportions of the Helix method are lower, but the difference is significant in bare land, which is consistent with the experimental conclusion of its original paper. In addition, it can be seen from Table 1 and Table 2 that the extraction ratios of the proposed method in different types of regions have the largest difference, with at least 60%. It shows that our method in this paper can not only extract a large number of points in bare land and farmland areas that conform to the reflection symmetric assumption but also remove more points in the location of artificial buildings, with more obvious discrimination and clear extraction results. Therefore, compared with other methods, the proposed method has certain advantages in high-precision extraction.

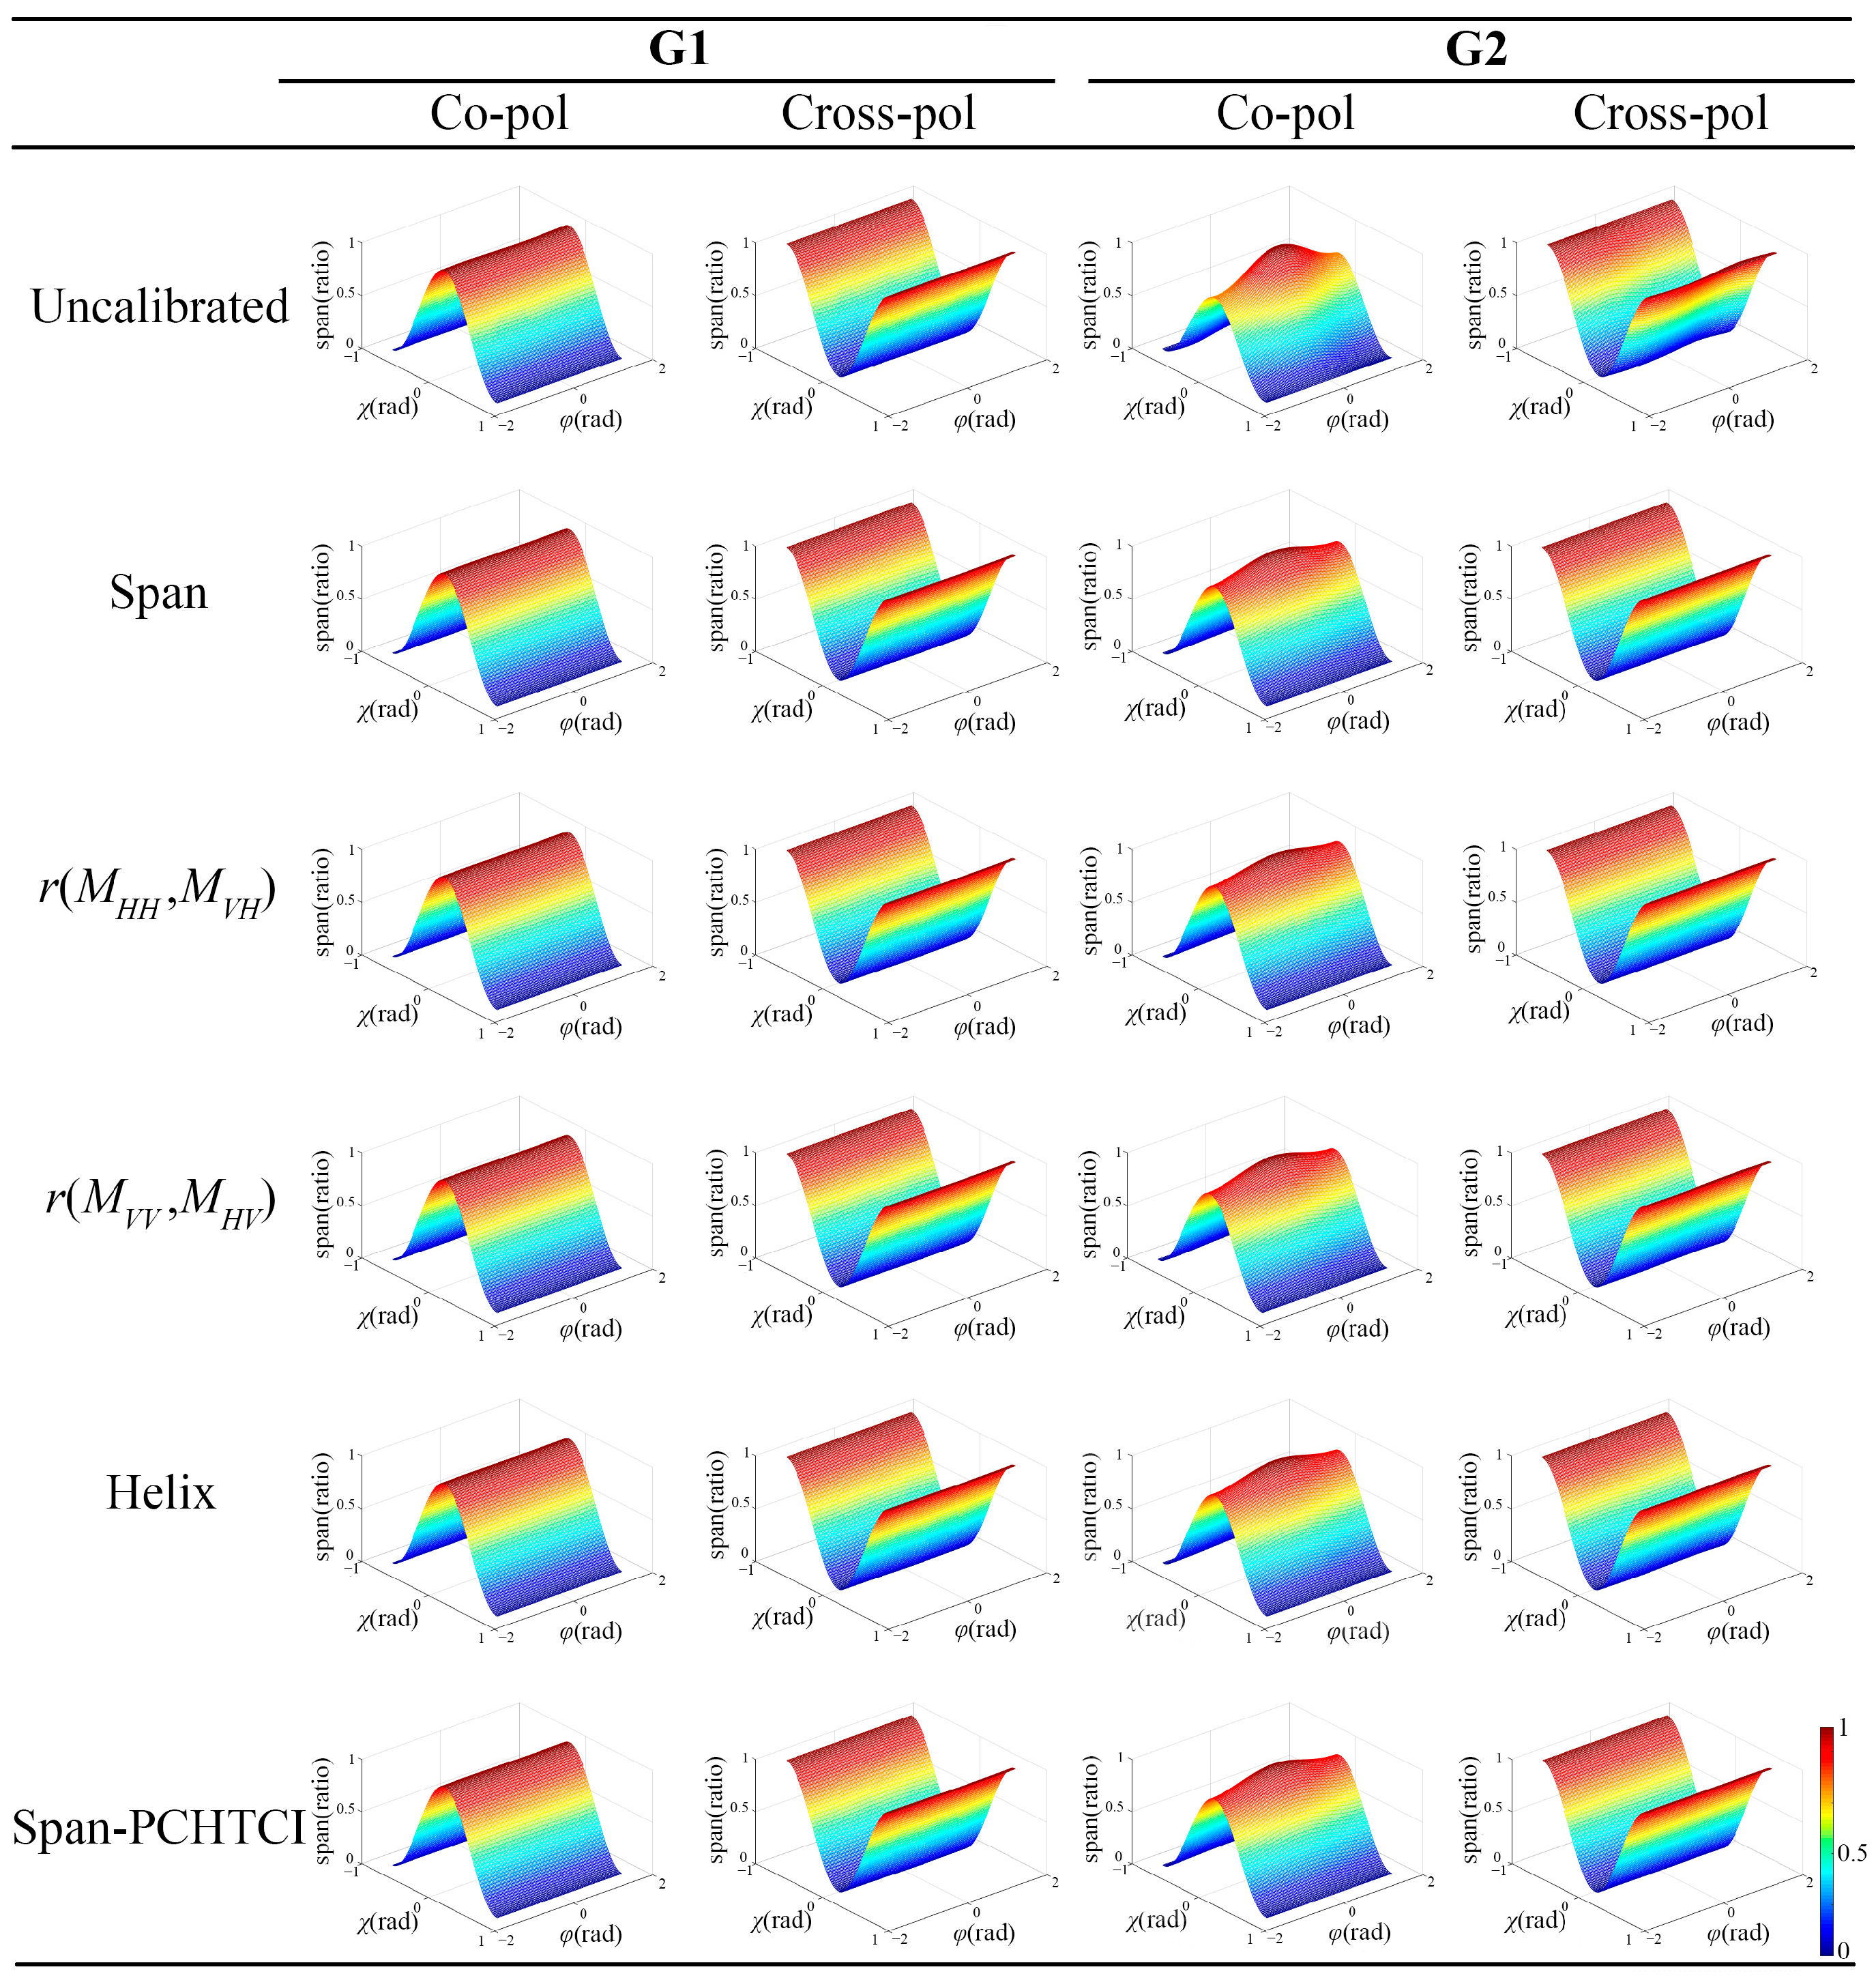
4.4. Verification of PolCal Effect

To further estimate the effectiveness, the Quegan method was utilized to correct the distorted PolSAR data after extracting the reflection symmetric samples based on the different algorithms.
Figure 7 and Figure 8 are the co-pol and cross-pol responses of the trihedral CRs, which is an intuitive method to observe whether the characteristics of PolSAR images are correct. The χ and φ represent the ellipticity angle and azimuth angle, respectively, their units are radian (rad); span means receiving power, and it is a ratio. The co-pol responses of the unpolarized calibration images have obvious deformations, indicating that the original PolSAR images have distortions, hence it is necessary to perform calibration processing to ensure the accuracy of subsequent applications. The polarization responses in G1 are more similar to the responses corresponding to the ideal trihedral CR. However, it occurred a trough or peak in the corresponding graph of the co-pol in G2, which demonstrates that the crosstalk errors have been well calibrated, but residual errors still need to be corrected. The possible reason is that along the range direction, channel imbalance errors change. Therefore, it is usually necessary to arrange multiple trihedral CRs along the range direction and use them to calculate the k in practice. While in the Section 4, to control the interference of the CRs on the accuracy of the experimental results as much as possible, we only used the trihedral CR of G1 to calibrate errors. In addition, the ranges of G1 and G2 are quite different, which may lead to some residual errors in G2. However, compared with other algorithms, the proposed method has more standard polarization responses, especially in the X-band, the fluctuations in G1 and G2 are weaker, indicating that the proposed method can obtain more accurate PolCal results and further demonstrate the effectiveness of our method.
The quantitative evaluation of PolCal accuracy is shown in Table 3 and Table 4, including trihedral CRs and dihedral CRs of G1 and G2, respectively. The specific indicators are co-pol channel imbalance amplitude (CIA), phase (CIP) and crosstalk. The CIA unit is dB, the CIP unit is °, and the crosstalk unit is dB. Ideally, the CIA should be infinitely close to 0, the crosstalk should be negative infinite, and the CIP of trihedral and dihedral CR should be close to 0° and 180°, respectively. Generally, CIP accuracy of PolCal requires a difference of less than 10° from the ideal case, CIA accuracy at least requires less than 1 dB.
Table 3 shows that the distortion of the C-band original image is small, especially in G1, but most methods can further reduce the error. However, CIP of r(MVV, MHV) (−178.49°) and Helix (−178.04°) in G1 dihedral CR are slightly worse, and CIA of r(MVV, MHV) (−0.57 dB) in G2 dihedral CR is also worse, which indicates the effects of these methods are not stable. Table 4 shows that the X-band indicators have more obvious differences. In the original case, the crosstalk of G1 is less than −30 dB, which does not meet the requirements, and most methods can effectively reduce these errors. However, in the CIP results of G1, the Span and Helix of trihedral CR, and Span, r(MHH, MVH) and Helix of dihedral CR all differ from the ideal value by more than 10°. In addition, the CIA corresponding to Span, r(MHH, MVH), and Helix in dihedral CR are all more than 1 dB. In contrast, all indexes of the proposed method in C- and X-bands are within the accuracy requirements, indicating that it is more stable. Additionally, most indexes can obtain better values, which further illustrates that our proposed method can improve the accuracy of PolCal by extracting more accurate reflection symmetric targets. In summary, the different extraction approaches affect the calibration results, which shows that accurate target extraction has a positive effect on calibration. Therefore, our proposed method is meaningful and effective.

5. Discussion

The performance of the PCHTCI method and the setting of the sample number N is discussed in detail in this section.

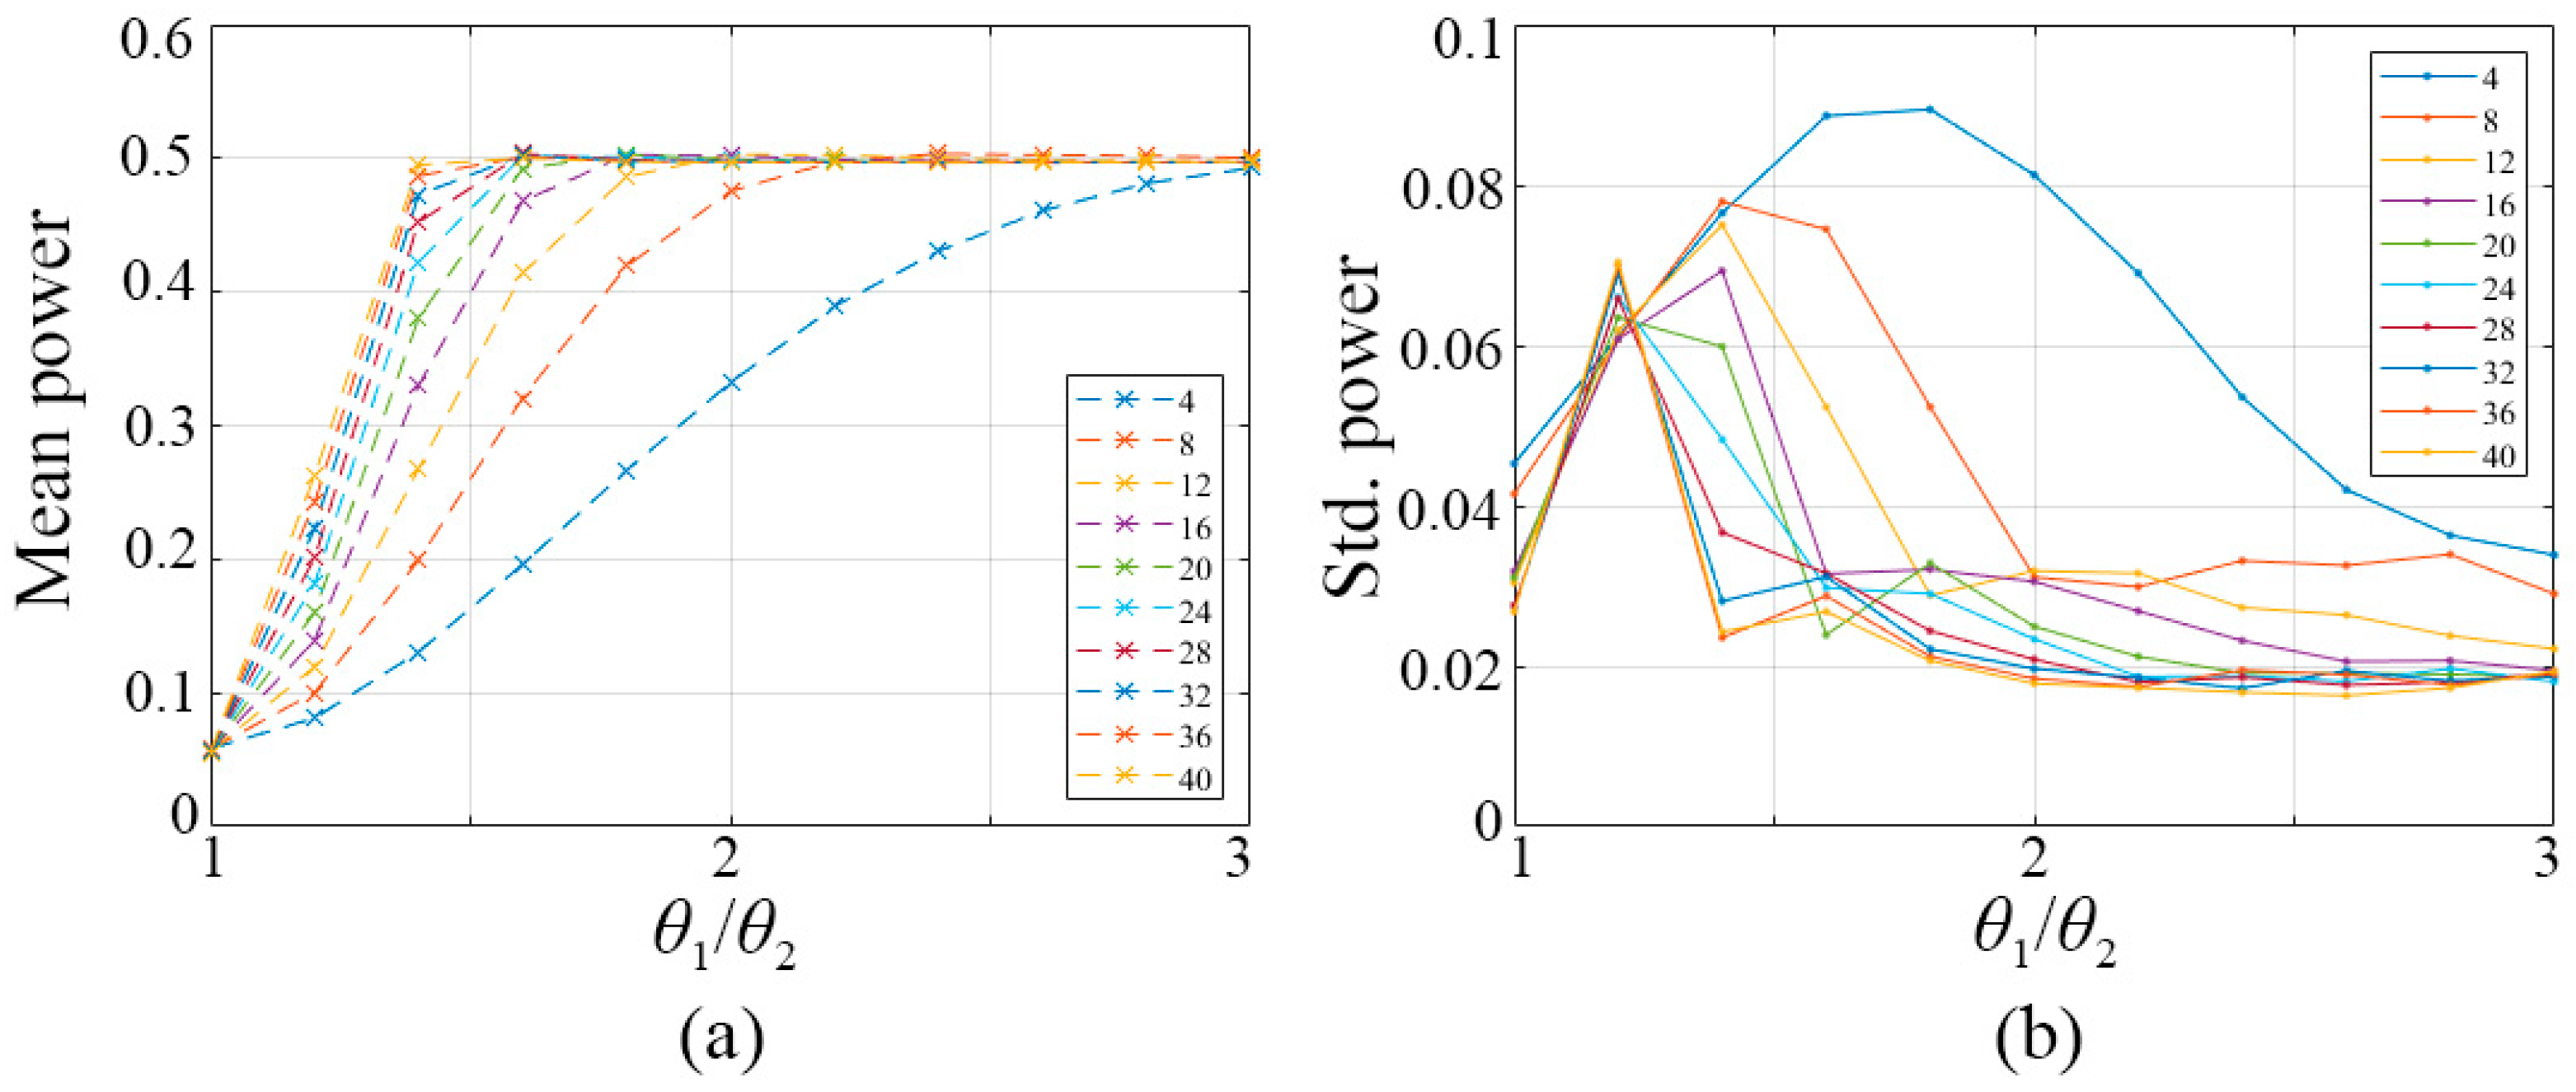
5.1. Selection of Parameter N

This paper uses N as a variable to obtain the best choice for the number of samples N, which is set as a multiple of 4 from 4 to 40, so a total of 10 groups of experiments were carried out by Monte Carlo randomized trials. Under the assumption of complex circular Gaussian distribution, firstly, the window size is given as 15 × 15, the true value of 15 × 8 grid pixels is θ1, and the true value of the rest 15 × 7 grid pixels is θ2. The reference pixel is set as the window center position [8], and the remaining 224 pixels are used as the pixels to be estimated. Meanwhile, the amplitude values with added noise in the Rayleigh distribution of parameters θ1 and θ2 are simulated, respectively. The experiment was repeated 10,000 times, then the mean and standard deviation of every estimator were obtained statistically. As the ratio of θ1/θ2 increases, the ideal true power should eventually converge to 49.55%.
As can be seen from Figure 9a, when θ1/θ2 = 1, the type I errors are maintained at a = 0.05. Additionally, no matter what N is set to, the PCHTCI test will eventually converge, but the speed of the convergence is different. The larger the N, the faster the speed. When N ≥ 20, the convergence speed gradually approaches, and the gap gradually decreases. Additionally, Figure 9b shows that when N ≤ 16, the standard deviation is relatively different, and the maximum standard deviation gradually decreases with the increase in N. When N ≥ 24, the standard deviation polylines are close, but the maximum standard deviation increases gradually with the increase in N. Combining the two figures in Figure 9, when N ≥ 20, the mean and standard deviation curves of power gradually approached, and when N ≥ 36, the curves almost overlapped. Meanwhile, when N = 20, the overall trend is better, the mean convergence speed is faster, the final convergence value of the standard deviation is small, and the maximum standard deviation is the smallest, and this value also conforms to the situation of small and medium samples. Therefore, we set the number of samples N of the PCHTCI test to twenty, that is the intensity images of four polarization channels are cycled five times in turn, which replaces the third-dimensional time series as the input of the HTCI method.

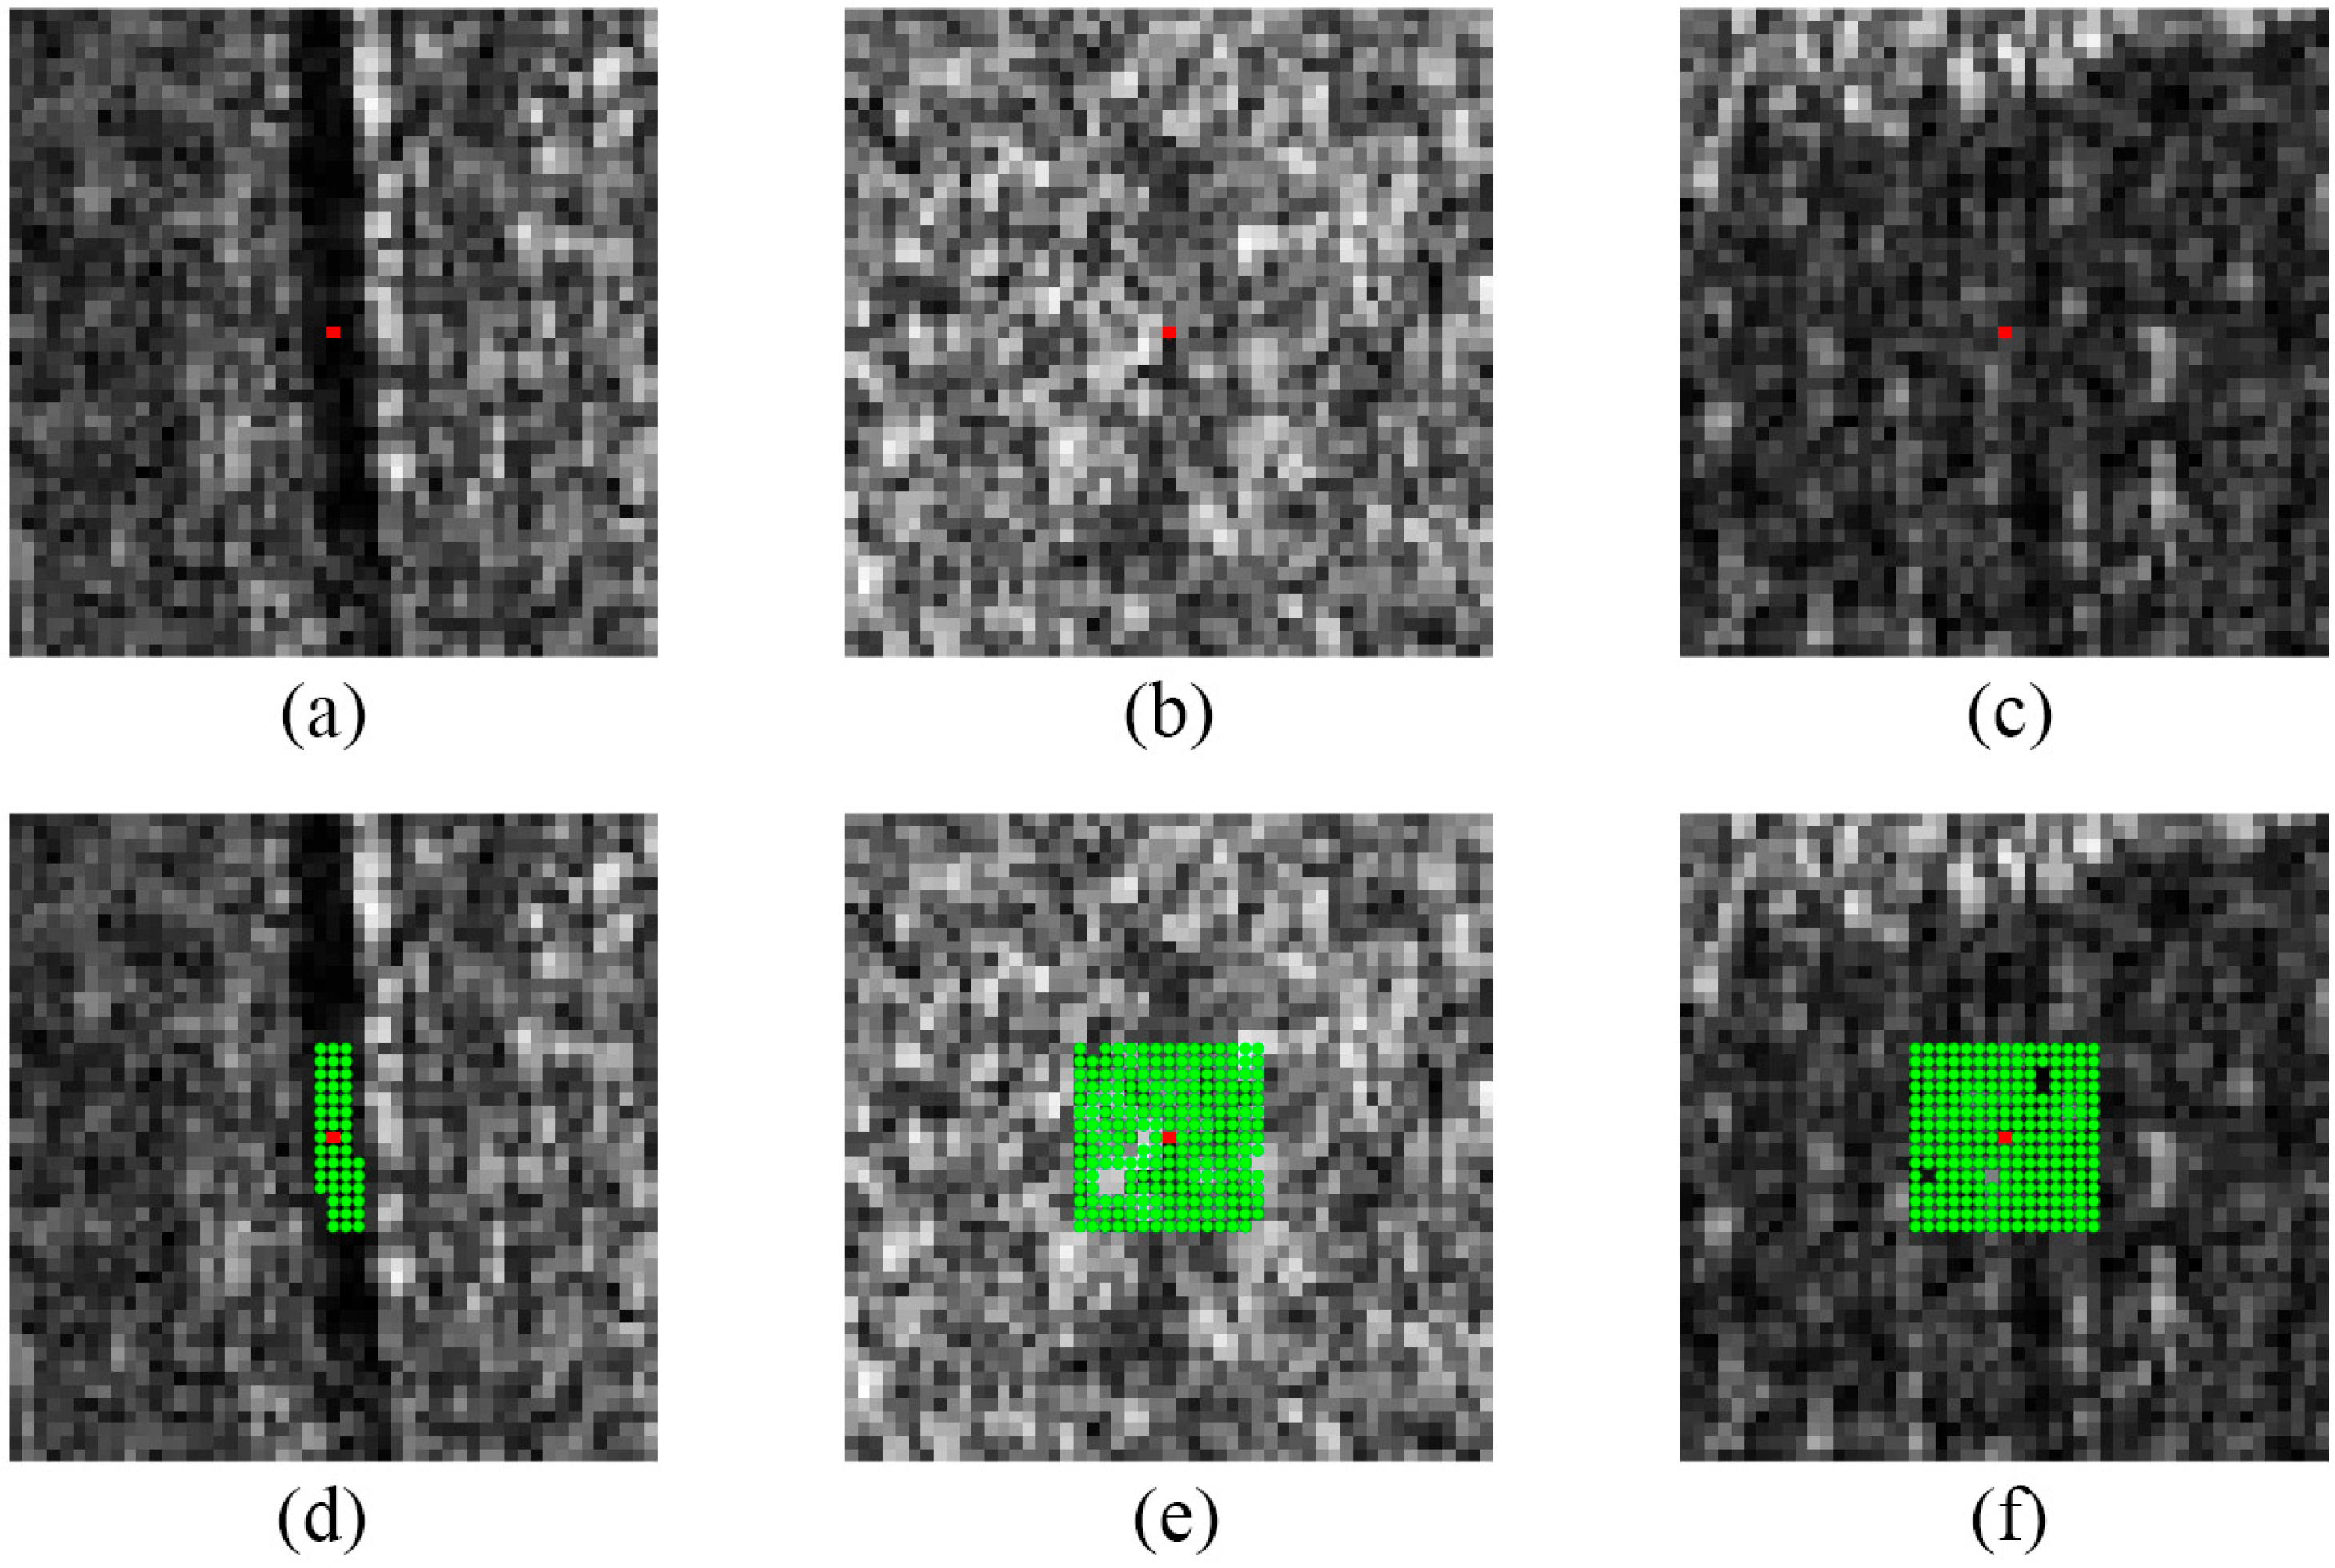
5.2. Examples with Different Reference Points in PCHTCI

In view of the greater difference in X-band calibration results, and the reference points (red dots) of different types of regions in Figure 4c are selected to evaluate the number of samples (green dots) selected by the PCHTCI test to analyze the effect of the PCHTCI algorithm more intuitively. The red dots represent the center of each window, and the green dots represent the selected SHP in the window. The window size is defined as 15 × 15, and the pixel coordinates of the road area [6826, 5393] are selected as the heterogeneous sample examples; the pixel coordinates [5200, 530] and [5175, 6135] in the R1 farmland and R2 bare soil regions are selected as the homogeneous sample examples, respectively.
For areas with complex features in Figure 10d, the PCHTCI algorithm can effectively exclude heterogeneous samples, and the results are relatively accurate. For the study area that contains only one class of samples in the window, the proposed method can select a large number of SHPs in Figure 10e,f, and the detection probability reaches 95.98% and 98.21%, respectively, with a small error. This further proves that the PCHTCI method can effectually distinguish the reflection symmetric targets, which can be seen as planar areas, showing the feasibility of applying it to extract the targets such as bare land and farmland in PolCal.

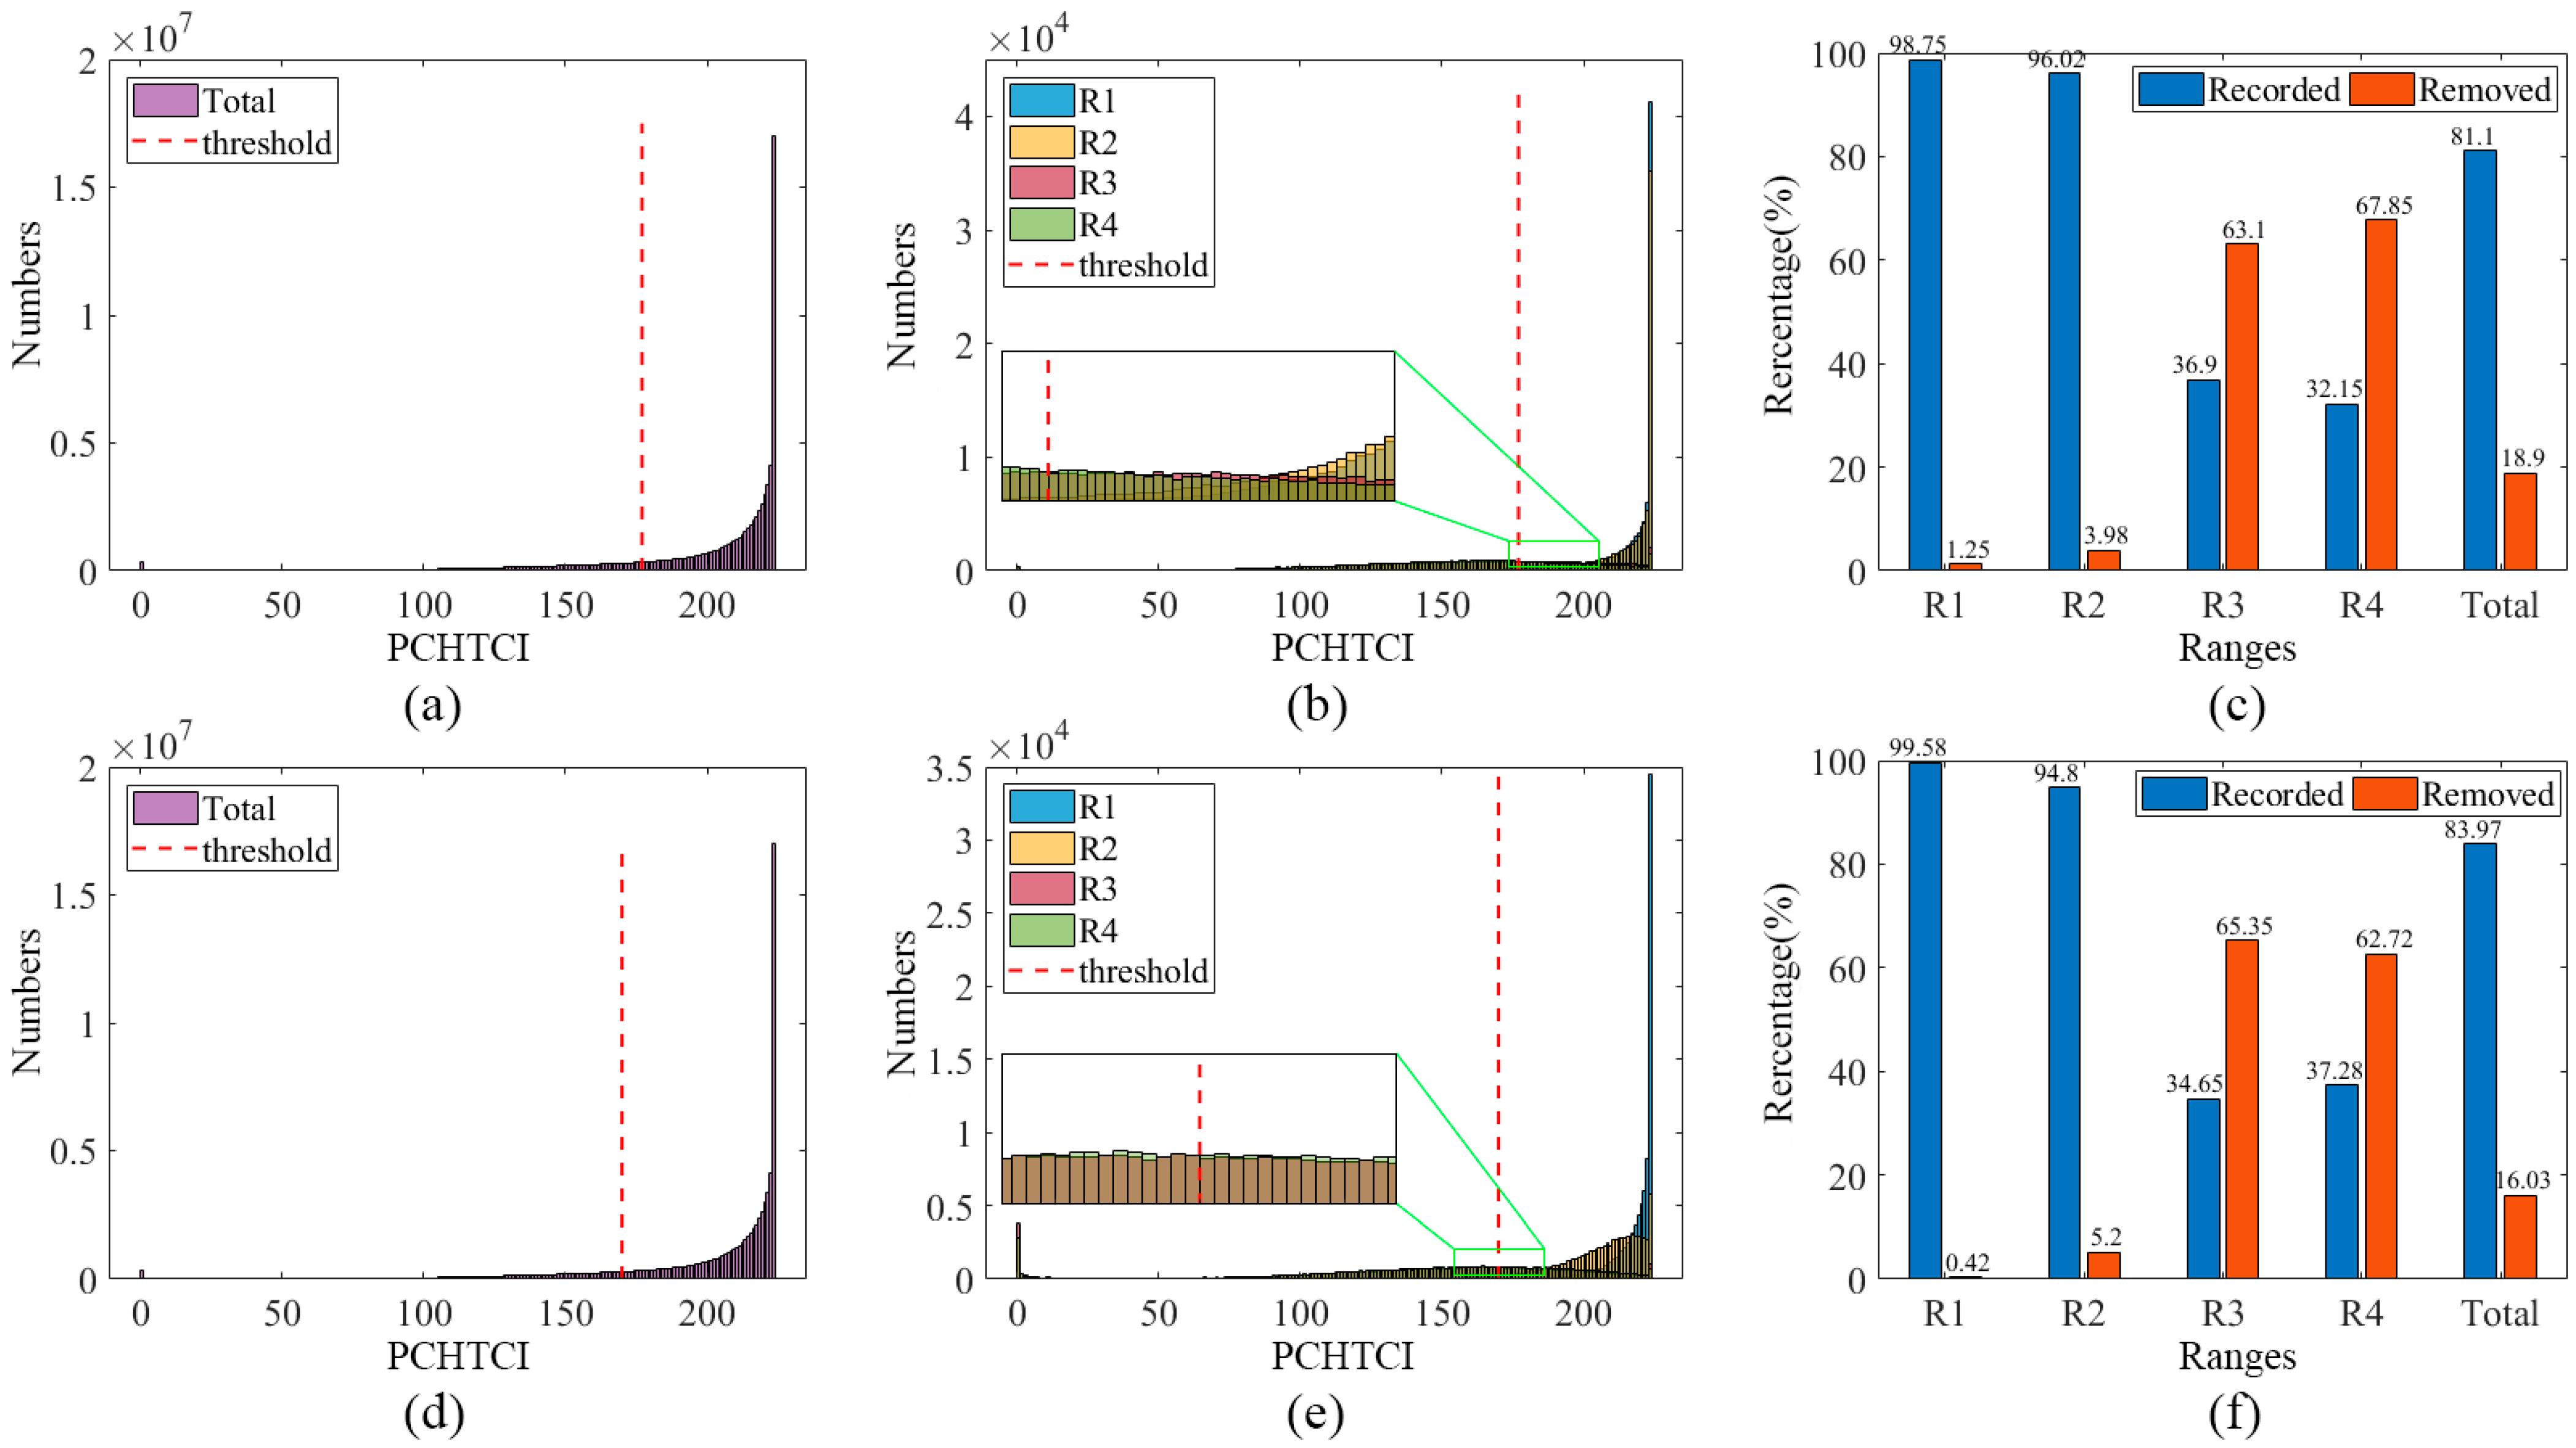
5.3. Statistical Analysis of PCHTCI

Figure 11 plot the red dotted line represents the threshold value 177 of C-band and the threshold value 170 of X-band, which were calculated by Otsu and rounded up to obtain. The statistical histogram in Figure 11a,d shows that the SHP selection results have certain bimodal trends, so it is suitable to use the Otsu algorithm to calculate the thresholds to distinguish the foreground and background of the SHP selection results. In Figure 11b,e, most of the histograms of the R1 and R2 regions fall to the right side of the red dotted line, indicating that the PCHTCI method can extract considerable reflection symmetric targets in the bare land and other planar regions. The extraction rates of R1 are 98.75% and 99.58%, and the extraction rates of R2 are 96.02% and 94.8%, respectively, as shown in Figure 11c,f. While R3 and R4 are highly coincident and unified as the histograms of urban areas including a large number of artificial buildings, we give an enlarged image to show the difference in detail. This shows that the extraction results in heterogeneous areas such as cities and towns are similar, and the removal rates are all more than 60%. Figure 11c,f more intuitively show that the PCHTCI method has an obvious effect on distinguishing homogeneous and heterogeneous regions.
On the whole, the PCHTCI method can not only retain more points in natural feature areas that conform to the assumption of reflection symmetry, such as farmland and bare land, but also better eliminate heterogeneous points of artificial buildings areas with strong scattering. The proposed method can extract samples required by Quegan method from spatial information level with high precision, with clear results and explicit feature classification framework, which illustrates the effectiveness of our method. By combining it with the Span, we can further eliminate areas with weak scattering characteristics, such as water surface, to ensure the accuracy of PolCal.

6. Conclusions

For the widely used PolCal methods based on reflection symmetric scattering assumption, the selection of reference ground objects that conform to the scattering characteristics is an important prerequisite for this type of calibration method. In this study, based on the traditional extraction methods using polarization features, we combined spatial statistical information to further improve the extraction accuracy through hypothesis testing methods. We improved the HTCI method (named PCHTCI) according to the applicability of the PolCal, and then proposed the Span-PCHTCI method to extract the reflection symmetric targets. This method uses Span to obtain the initial value result, and then uses the PCHTCI to extract the SHP result and compares it with the threshold automatically calculated by Otsu to obtain the final mask image. The proposed method can extract a large number of reflection symmetric targets in areas such as farmland and bare land and eliminate a large number of samples in urban areas with strong scattering. The extraction discriminations of different types of ground objects are all greater than 60%, which is far higher than other classical extraction methods. To further compare the performance in PolCal, the C- and X-band PolSAR images were used for qualitative and quantitative verification. The experimental results illustrated that most methods can correct the distorted PolSAR image. However, compared with other methods, the results of the Span-PCHTCI method are all within the accuracy requirements of the various indexes in two group experiments with stable effects, and it can obtain better results in most indexes. Therefore, the proposed method can extract more accurate reflection symmetric samples and improve the precision of PolCal, which further demonstrates the advancement and effectiveness of our new extraction approach in PolCal.

Author Contributions

B.C., J.Z., L.L., S.Y. and G.H. jointly conceived this paper. L.L. found data for the experiment; B.C. performed experiments and analysis; B.C. wrote the manuscript; S.Y. and X.G. revised the manuscript; J.Z. and G.H. supervised and provided comments on this paper. All authors have read and agreed to the published version of the manuscript.

Funding

National Key Research and Development Project (2022YFB3901604), the National Natural Science Foundation of China (42171442), Chinese Academy of Surveying and Mapping Fundamental Research Project (No.AR2206), and High-Resolution Earth Observation Major Special Aerial Observation System (30-H30C01-9004-19/21).

Data Availability Statement

Data sharing is not applicable.

Acknowledgments

The authors thank the Chinese Academy of Sciences for their support with the data.

Conflicts of Interest

The authors declare no conflict of interest.

References

  1. Han, B.; Ding, C.; Zhong, L.; Liu, J.; Qiu, X.; Hu, Y.; Lei, B. The GF-3 SAR Data Processor. Sensors 2018, 18, 835. [Google Scholar] [CrossRef] [PubMed] [Green Version]
  2. Niu, C.; Zhang, H.; Liu, W.; Li, R.; Hu, T. Using a fully polarimetric SAR to detect landslide in complex surroundings: Case study of 2015 Shenzhen landslide. ISPRS J. Photogramm. Remote Sens. 2021, 174, 56–67. [Google Scholar] [CrossRef]
  3. Park, S.E.; Lee, S.G. On the Use of Single-, Dual-, and Quad-Polarimetric SAR Observation for Landslide Detection. ISPRS Int. J. Geo-Inf. 2019, 8, 384. [Google Scholar] [CrossRef] [Green Version]
  4. Imani, M. A random patches based edge preserving network for land cover classification using Polarimetric Synthetic Aperture Radar images. Int. J. Remote Sens. 2021, 42, 4942–4960. [Google Scholar] [CrossRef]
  5. Ni, J.; Zhang, F.; Yin, Q.; Zhou, Y.; Li, H.-C.; Hong, W. Random Neighbor Pixel-Block-Based Deep Recurrent Learning for Polarimetric SAR Image Classification. IEEE Trans. Geosci. Remote Sens. 2021, 59, 7557–7569. [Google Scholar] [CrossRef]
  6. Sajjad, E.Z.; Yasser, M.; Seyed Ali, S. Assessing the performance of indicators resulting from three-component Freeman–Durden polarimetric SAR interferometry decomposition at P-and L-band in estimating tropical forest aboveground biomass. Int. J. Remote Sens. 2019, 41, 433–454. [Google Scholar] [CrossRef]
  7. Sinclair, G. The Transmission and Reception of Elliptically Polarized Waves. Proc. IRE 1950, 38, 148–151. [Google Scholar] [CrossRef]
  8. Chang, Y.; Zhao, L.; Shi, L.; Nie, Y.; Hui, Z.; Xiong, Q.; Li, P. Polarimetric calibration of SAR images using reflection symmetric targets with low helix scattering. Int. J. Appl. Earth Obs. Geoinf. 2021, 104, 102559. [Google Scholar] [CrossRef]
  9. Freeman, A. SAR calibration: An overview. IEEE Trans. Geosci. Remote Sens. 1992, 30, 1107–1121. [Google Scholar] [CrossRef]
  10. Whitt, M.W.; Ulaby, F.T.; Polatin, P.; Liepa, V.V. A general polarimetric radar calibration technique. IEEE Trans. Antennas Propag. 1991, 39, 62–67. [Google Scholar] [CrossRef]
  11. Freeman, A.; van Zyl, J.J.; Klein, J.D.; Zebker, H.A.; Shen, Y. Calibration of Stokes and scattering matrix format polarimetric SAR data. IEEE Trans. Geosci. Remote Sens. 1992, 30, 531–539. [Google Scholar] [CrossRef]
  12. van Zyl, J.J. Calibration of polarimetric radar images using only image parameters and trihedral corner reflector responses. IEEE Trans. Geosci. Remote Sens. 1990, 28, 337–348. [Google Scholar] [CrossRef]
  13. Klein, J.D. Calibration of complex polarimetric SAR imagery using backscatter correlations. IEEE Trans. Aerosp. Electron. Syst. 1992, 28, 183–194. [Google Scholar] [CrossRef]
  14. Villa, A.; Iannini, L.; Giudici, D.; Monti-Guarnieri, A.; Tebaldini, S. Calibration of SAR Polarimetric Images by Means of a Covariance Matching Approach. IEEE Trans. Geosci. Remote Sens. 2015, 53, 674–686. [Google Scholar] [CrossRef]
  15. Ainsworth, T.L.; Ferro-Famil, L.; Lee, J.-S. Orientation angle preserving a posteriori polarimetric SAR calibration. IEEE Trans. Geosci. Remote Sens. 2006, 44, 994–1003. [Google Scholar] [CrossRef]
  16. Yang, J.; Chang, Y.; Li, P.; Zhao, L.; Shi, L. Distributed Targets Extraction for SAR Polarimetric Calibration Using Helix Scattering. Geomat. Inf. Sci. Wuhan Univ. 2018, 43, 2023–2029. [Google Scholar] [CrossRef]
  17. Yamaguchi, Y.; Moriyama, T.; Ishido, M.; Yamada, H. Four-component scattering model for polarimetric SAR image decomposition. IEEE Trans. Geosci. Remote Sens. 2005, 43, 1699–1706. [Google Scholar] [CrossRef]
  18. Quegan, S. A unified algorithm for phase and cross-talk calibration of polarimetric data-theory and observations. IEEE Trans. Geosci. Remote Sens. 1994, 32, 89–99. [Google Scholar] [CrossRef]
  19. Kimura, H.; Mizuno, T.; Papathanassiou, K.P.; Hajnsek, I. Improvement of polarimetric SAR calibration based on the Quegan algorithm. In Proceedings of the IEEE International Geoscience & Remote Sensing Symposium, Anchorage, AK, USA, 20–24 September 2004. [Google Scholar]
  20. Wang, Y.; Deng, Y.; Fei, W.; Wang, R.; Song, H.; Wang, J.; Li, N. Modified Statistically Homogeneous Pixels’ Selection with Multitemporal SAR Images. IEEE Geosci. Remote Sens. Lett. 2016, 13, 1930–1934. [Google Scholar] [CrossRef]
  21. Baumgartner, W.; Schindlerl, H. A Nonparametric Test for the General Two-Sample Problem. Int. Biom. Soc. 1998, 54, 1129–1135. [Google Scholar] [CrossRef]
  22. Ferretti, A.; Fumagalli, A.; Novali, F.; Prati, C.; Rocca, F.; Rucci, A. A New Algorithm for Processing Interferometric Data-Stacks: SqueeSAR. IEEE Trans. Geosci. Remote Sens. 2011, 49, 3460–3470. [Google Scholar] [CrossRef]
  23. Jiang, M.; Ding, X.; Li, Z. Homogeneous pixel selection algorithm for multitemporal InSAR. Chin. J. Geophys. 2018, 61, 4767–4776. [Google Scholar]
  24. Otsu, N. A Threshold Selection Method from Gray-Level Histograms. IEEE Trans. Syst. Man Cybern. 2007, 9, 62–66. [Google Scholar] [CrossRef] [Green Version]
  25. Touzi, R.; Shimada, M. Polarimetric PALSAR Calibration. IEEE Trans. Geosci. Remote Sens. 2009, 47, 3951–3959. [Google Scholar] [CrossRef]
  26. Shi, L.; Li, P.; Yang, J.; Zhang, L.; Ding, X.; Zhao, L. Polarimetric SAR Calibration and Residual Error Estimation When Corner Reflectors Are Unavailable. IEEE Trans. Geosci. Remote Sens. 2020, 58, 4454–4471. [Google Scholar] [CrossRef]
  27. Quegan, S.; Lomas, M.; Papatha Na Ssiou, K.P.; Kim, J.S.; Paillou, P. Calibration Challenges for the Biomass P-Band SAR Instrument. In Proceedings of the IGARSS 2018—2018 IEEE International Geoscience and Remote Sensing Symposium, Valencia, Spain, 22–27 July 2018. [Google Scholar]
  28. Chi, B.; Fan, H.; Gao, Y.; Zhao, L.; Zhuang, H. A distributed scatterers InSAR method based on adaptive window with statistically homogeneous pixel selection for mining subsidence monitoring. Geocarto Int. 2021, 37, 7819–7842. [Google Scholar] [CrossRef]
  29. Jiang, M.; Guarnieri, A.M. Distributed Scatterer Interferometry with the Refinement of Spatiotemporal Coherence. IEEE Trans. Geosci. Remote Sens. 2020, 58, 3977–3987. [Google Scholar] [CrossRef]
Figure 1. The process of the Quegan method.
Remotesensing 15 01252 g001
Figure 2. Flow chart of our proposed Span-PCHTCI method.
Remotesensing 15 01252 g002
Figure 3. Study area information, (a) the location of study area, (b) C-band image and the location of CRs, (c) X-band image and the location of CRs.
Remotesensing 15 01252 g003
Figure 4. The results of SHP and reflection symmetric target extraction based on the PCHTCI method, (a) SHP result image of C-band image, (b) the mask image of C-band image, (c) SHP result image of X-band image, (d) the mask image of X-band image.
Remotesensing 15 01252 g004
Figure 5. Results of C-band PolSAR image for the different extraction algorithms: (a) Span, (b) r(MHH, MVH), (c) r(MVV, MHV), (d) Helix, (e) Span-PCHTCI.
Remotesensing 15 01252 g005
Figure 6. Results of X-band PolSAR image for the different extraction algorithms: (a) Span, (b) r(MHH, MVH), (c) r(MVV, MHV), (d) Helix, (e) Span-PCHTCI.
Remotesensing 15 01252 g006
Figure 7. Co-pol and cross-pol responses of C-band.
Remotesensing 15 01252 g007
Figure 8. Co-pol and cross-pol responses of X-band.
Remotesensing 15 01252 g008
Figure 9. A simulation-based verification method for SHP selection algorithm in the PCHTCI method, (a) the mean of power, (b) the standard deviation of power. The sample number N represents the number of input images.
Remotesensing 15 01252 g009
Figure 10. Examples of SHP in PCHTCI, the first row is the selected reference pixel (red dot), where the red point in (a) is the reference point in the road area, and the red points in (b,c) are the reference point in the farmland and bare soil areas, respectively, (df) are the SHP results (green dots) corresponding to the first row.
Remotesensing 15 01252 g010
Figure 11. Statistical histogram of SHP results and extraction ratio bar chart of mask images based on the PCHTCI method, the first row is the C-band result, and the second row is the X-band result, specifically, (a,d) represent statistical histogram of the whole scene image, (b,e) represent statistical histogram of R1-R4 areas, (c,f) are extraction ratio bar charts of whole scene image and R1-R4 areas.
Remotesensing 15 01252 g011
Table 1. Extraction ratios of four regions in C-band image by different methods.
MethodsR1R2R3R4Total
Span97.04%96.95%82.86%81.75%91.05%
r(MHH, MVH)97.74%96.54%83.93%79.32%94.53%
r(MVV, MHV)98.68%98.14%86.64%83.36%95.46%
Helix66.40%77.24%60.42%57.97%65.13%
Span-PCHTCI95.83%93.18%29.96%26.56%74.90%
Table 2. Extraction ratios of four regions in X-band image by different methods.
MethodsR1R2R3R4Total
Span95.80%98.53%84.61%81.65%93.62%
r(MHH, MVH)99.98%99.52%85.63%93.36%96.79%
r(MVV, MHV)99.99%99.94%86.79%92.78%98.29%
Helix71.98%83.49%70.68%68.28%72.32%
Span-PCHTCI95.41%93.56%31.57%31.69%79.90%
Table 3. PolCal accuracy of different extraction methods in C-band image.
OriginalSpanr(MHH, MVH)r(MVV, MHV)HelixSpan-PCHTCI
G1Trihedral CRCIA (dB)−0.0200000
CIP (°)1.0700000
Crosstalk (dB)−53.48−55.79−54.90−53.84−55.08−57.61
Dihedral CRCIA (dB)0.710.480.510.200.460.43
CIP (°)−178.94179.84−179.78−178.49−178.04−179.83
Crosstalk (dB)−47.64−56.24−46.75−56.14−51.19−54.27
G2Trihedral CRCIA (dB)0.650.310.210.290.260.28
CIP (°)−7.86−1.47−0.24−1.84−1.98−0.19
Crosstalk (dB)−39.52−58.21−59.02−55.14−63.98−58.59
Dihedral CRCIA (dB)0.34−0.29−0.33−0.57−0.29−0.28
CIP (°)171.55177.28174.92178.36174.45174.38
Crosstalk (dB)−33.51−40.86−40.31−40.98−41.11−41.09
Table 4. PolCal accuracy of different extraction methods in X-band image.
OriginalSpanr(MHH, MVH)r(MVV, MHV)HelixSpan-PCHTCI
G1Trihedral CRCIA (dB)−0.89−0.22−0.180.10.720.44
CIP (°)13.1710.011.056.7912.30.73
Crosstalk (dB)−27.59−45.07−48.28−41.31−44.18−51.63
Dihedral CRCIA (dB)−1.16−1.08−1.10−0.39−1.04−0.17
CIP (°)−163.38−168.46−169.4−177.40−167.59−176.69
Crosstalk (dB)−29.43−32.67−32.85−34.42−32.48−33.67
G2Trihedral CRCIA (dB)−0.60−0.18−0.18−0.26−0.12−0.05
CIP (°)9.52−1.531.49−0.31−1.970.84
Crosstalk (dB)−31.02−43.31−41.93−41.95−43.97−42.36
Dihedral CRCIA (dB)−1.28−0.59−0.68−0.63−0.60−0.30
CIP (°)−168.31−176.44179.19179.51−176.09−179.57
Crosstalk (dB)−33.99−37.78−35.22−35.44−34.36−34.73
Disclaimer/Publisher’s Note: The statements, opinions and data contained in all publications are solely those of the individual author(s) and contributor(s) and not of MDPI and/or the editor(s). MDPI and/or the editor(s) disclaim responsibility for any injury to people or property resulting from any ideas, methods, instructions or products referred to in the content.

