1. Introduction
The current generation of polar-orbiting environmental satellites has now eclipsed 10 years since the launch of the Suomi National Polar Orbiting Partnership (S-NPP) in October 2011. Currently, S-NPP is accompanied by two other Joint Polar orbiting Satellite System (JPSS) satellites, JPSS-1 (now NOAA-20) launched in November 2017, and JPSS-2 (now NOAA-21) launched in November 2022. The main imaging instrument common to all three satellites is the Visible Infrared Imaging Radiometer Suite (VIIRS), which provides the highest resolution operational Earth imagery at up to 375 m spatial resolution, as well as spectral coverage from 22 visible and infrared wavelengths as well as a Day/Night Band (DNB) that is not available on any geostationary platform.
Previous publications have covered various aspects of the VIIRS over the past 10 years. Notable articles [
1] which presented first-light imagery from the VIIRS at the point that the VIIRS had been validated for operational use. References [
2,
3,
4] covered in particular the DNB capabilities of the VIIRS. Numerous other publications covered more-specific VIIRS products and applications, some of which will be covered by example in this article. A recent publication [
5] covered the major activities of the VIIRS Imagery Team over the past 10 years, including validation efforts for VIIRS imagery products, as they worked to fix several problems with the VIIRS ground system software and make improvements that would benefit end users of the VIIRS.
This paper provides a sample cross-section of many of the user-oriented products that have been developed from the multispectral VIIRS, primarily at the Cooperative Institute for Research in the Atmosphere (CIRA.) While many of these applications involve red—green—blue (RGB) combinations of spectral bands or band-differences, others range in complexity from simple as two-band differences to involvement of numerous bands or layers for information to convey information. Such applications are useful for analysis and forecasting purposes, including the National Weather Service (NWS) in particular. Many of the user products are first made available as part of near real-time displays of VIIRS imagery, provided at the lowest latency possible. Whereas this paper does not offer a comprehensive review of all possible VIIRS end-user products, cases, and/or validation and analysis of these products, it communicates a representative sample of the many compelling and perhaps unique anecdotal cases of VIIRS’ use, spanning a broad range of research and forecasting topics.
VIIRS data collected globally are generally available via the internet at low latency (e.g., within 60 min of collection) from the JPSS Program through their ground system, but the VIIRS is also available even closer to real-time by direct broadcast from the VIIRS spacecraft. NOAA’s CLASS ended up being the data archive for VIIRS, whose data volume is so large that most users store VIIRS data for only a limited time. One such advantageous use for a shorter-term archive is the near real-time display of VIIRS imagery via such platforms as the Satellite Loop Interactive Data Explorer in Real-Time (SLIDER) product [
6].
2. The JPSS Proving Ground and Training for VIIRS Observers
In order to better prepare forecasters for VIIRS products, the JPSS Program initiated the JPSS Proving Ground, modeled after the successful GOES-R Proving Ground [
7]. The goals of Proving Ground efforts are to work with local Weather Forecast Offices (WFOs) and the National Centers to demonstrate potential products and new imagery. Lessons learned from the earlier GOES-R Proving Ground effort were useful for the JPSS effort, including identifying key personnel within the various WFOs or National Centers to collaborate with, and inserting new products into the Advanced Weather Interactive Processing System (AWIPS).
Although forecasters were most likely to use a new product if it were displayed on their conventional AWIPS workstation, they would also resort to accessing it through the web if it were useful enough to them. Challenges of the JPSS Proving Ground included the higher latency of imagery and products from polar orbiting satellites, and, perhaps more significantly, the inherently coarser temporal frequency of polar-orbiter observations at the lower latitudes. For users within the Continental United States (CONUS), there may be only one or two new images over a 12-h period, for example. The issue is less significant at high latitudes (e.g., Alaska) where there are more frequent satellite passes with overlapping imagery swaths. A benefit for these high-latitude locations is the increased spatial resolution and low latency (e.g., ~30-min via Direct Broadcast antennas) data that can offer a distinct advantage over GOES imagery for the analysis of mesoscale weather and surface features.
While operational forecasters within the U.S. are the focus of the Proving Ground efforts, there are other users to consider, including international users, academia, researchers, students, and military. The best method to address the needs of all users is a multi-pronged approach using different forms of training. Again, modeled after the GOES-R program, a Satellite Foundational Course was developed for JPSS (SatFC-J). Experts from different institutions, including CIRA, COMET, NASA, and other NOAA Cooperative Institutes (CIs) and offices worked on this course. The SatFC-J course is aimed at NWS forecasters and is generally considered as optional training (as opposed to the mandatory GOES-R course), but local WFOs may assign it differently. The course is, however, available to anyone via the internet:
https://rammb2.cira.colostate.edu/training/shymet/satfc-j_intro/, accessed on 7 February 2023.
Experience with GOES-R forecaster training found that short reference materials were useful for the different satellite channels and products. Two types of training were developed, Quick Guides and Quick Briefs, and these have been replicated for the VIIRS. Quick Guides are one- to two-page documents that succinctly describe the channel or imagery product, along with an example. They can be easily accessed online, but sometimes WFOs will print hard copies to have them readily available for forecasters. Quick Guides are 3–5 min videos that go into more detail and are narrated by a subject matter expert.
Another joint training effort utilized by the VISIT team is a collection of online modules that go into more detail on how specific imagery and products can be applied, typically using a relevant weather forecast problem. These are narrated by a subject matter expert (SME) and recorded for replay at any time. To increase visibility and forecaster interaction, selected modules will be offered each month and presented in real-time. It is not unusual for a number of WFOs to attend a given session, which allows the forecasters to directly interact with the SME. A variation of this idea is the Forecast Decision Training Division (FDTD) Satellite Application Webinars, except that often these discussions are led by a forecaster or forecasters. This peer-to-peer type training can be particularly effective in increasing interest and understanding of a satellite product or type of imagery.
Of course, formal presentations (talks or posters) at relevant American Meteorological Society (AMS), National Weather Association (NWA), and NOAA Satellite conferences are also important. It is especially useful to target meetings where operational forecasters are also likely to be in attendance, such as the NWA Annual Meeting. More formal presentations such as short courses are also occasionally available at some of these meetings, offering even more comprehensive training and familiarization opportunities.
For many of the forecast examples it is most relevant to use products and imagery displayed on the AWIPS workstation that NWS forecasters use. Sometimes, however, it is important to highlight newer products not yet on AWIPS. For this purpose, a versatile display system such as the Regional and Mesoscale Meteorology Branch (RAMMB) SLIDER [
6] is very useful to display a range of imagery and products from different satellites and across various regions and has been employed extensively since its development.
3. Forecast Benefits of VIIRS Observations for the NWS
There are many forecaster applications of VIIRS imagery and products given the unique spectral and spatial characteristics of the instruments. Day-to-day, VIIRS observations are leveraged to detect and track clouds and differentiate cloud layers and phases. These capabilities are important for many applications, most notably forecast grid editing and aviation forecasts. Situationally, there are many additional applications. The development and movement of sea ice in the high latitudes can be tracked using VIIRS imagery and derived products. Land characteristics such as vegetation changes and snow cover character are gleaned from VIIRS data. From a fire weather perspective, forecasters take advantage of VIIRS to detect wildfire hot spots, track associated smoke plumes, and map resulting burn scars. Similarly, volcanic eruptions and associated ash and SO2 plumes are analyzed in VIIRS imagery and products. Additional aerosols for which forecasters use VIIRS data to detect and track include blowing dust, blowing snow, and sea spray.
The advantages of VIIRS are best realized at higher latitudes, including over Alaska, where swath overlap affords more numerous imageries compared to at lower latitudes. Further forecasters over Alaska are able to benefit from the low-latency Direct Broadcast VIIRS data. Regardless of location, using the relatively high spatial resolution VIIRS data in conjunction with the relatively high temporal resolution geostationary satellite data, where available, is ideal in order for forecasters to take advantage of the unique characteristics of both. This section highlights a few selected operational forecast applications that exemplify the benefits of VIIRS imagery.
3.1. VIIRS Snowmelt RGB
Strong winds developing across a relatively fresh snowpack can result in blowing snow, including ground blizzard conditions, where visibility is reduced to less than ¼ mile (~0.4 km.) Such conditions are hazardous to motorists and pilots alike. In order to predict such events, forecasters are concerned with the state of the snowpack, specifically its blowability. A fresh snowpack is more likely to be lofted and cause visibility restrictions, whereas snow cover that has crusted due to age or liquid precipitation is less likely to blow.
To help make assessments about the state of the snowpack, forecasters have leveraged an experimental VIIRS Snowmelt RGB product. The RGB imagery combines two near-infrared channels (M-8/1.24 μm and M-10/1.61 μm) with a visible channel (M-5/0.67 μm) in order to provide context about a snowpack. The RGB takes advantage of the near-IR channel characteristics that an older or crusted-over snowpack is made up of larger snow grain size, and therefore will absorb more energy compared to a fresh snowpack which is characterized by a smaller snow grain size [
8]. Band M-8, available with the VIIRS but not ABI, is exceptionally sensitive to differences in snow grain size. By combining the three channels, forecasters have an imagery product that is easy to interpret for snow lofting assessments.
By late January 2021, recent snow events had brought fresh snow cover to eastern North Dakota and western Minnesota. On 30–31 January, a freezing drizzle fell across parts of eastern North Dakota, hardening the outer layer of the snowpack, and causing the average grain size to be larger. This change in snowpack is apparent in a comparison of VIIRS Snowmelt RGB images from the 29th and from the 1st (
Figure 1). The background fresher snow appears as a relatively light blue in this RGB imagery product, while the region of most crusted-over snow-oriented north-to-south over eastern North Dakota appears as a relatively darker blue.
Strong winds developing across the broader region on 1 February resulted in widespread blowing snow. While blowing snow was observed over the crusted snowpack, satellite imagery suggested it had originated from the uncrusted upstream areas and was advected over the crusted area. On 3 February, forecasters noted marginal environmental conditions that would potentially result in blowing snow. As a result of their analysis of the imagery, NWS/FGF forecasters wrote in their Area Forecast Discussion, “Latest VIIRS Snowmelt RGB reveals a ripened or crusted over snowpack in much of central ND (North Dakota) extending into the Devils Lake basin and northeast North Dakota west of the Red River Valley. This may be evidence of limited ‘blowability’ by the snowpack in these locations and could limit the amount of blowing snow impacts and/or coverage.” Blowing snow was not observed on the 3rd, likely primarily due to weaker wind speeds and continued aging of the broader snowpack. Stronger winds developing on 4 February resulted in blowing snow just east, but not over, the crusted snowpack as identified in the Snowmelt RGB.
3.2. VIIRS Sea Spray RGB
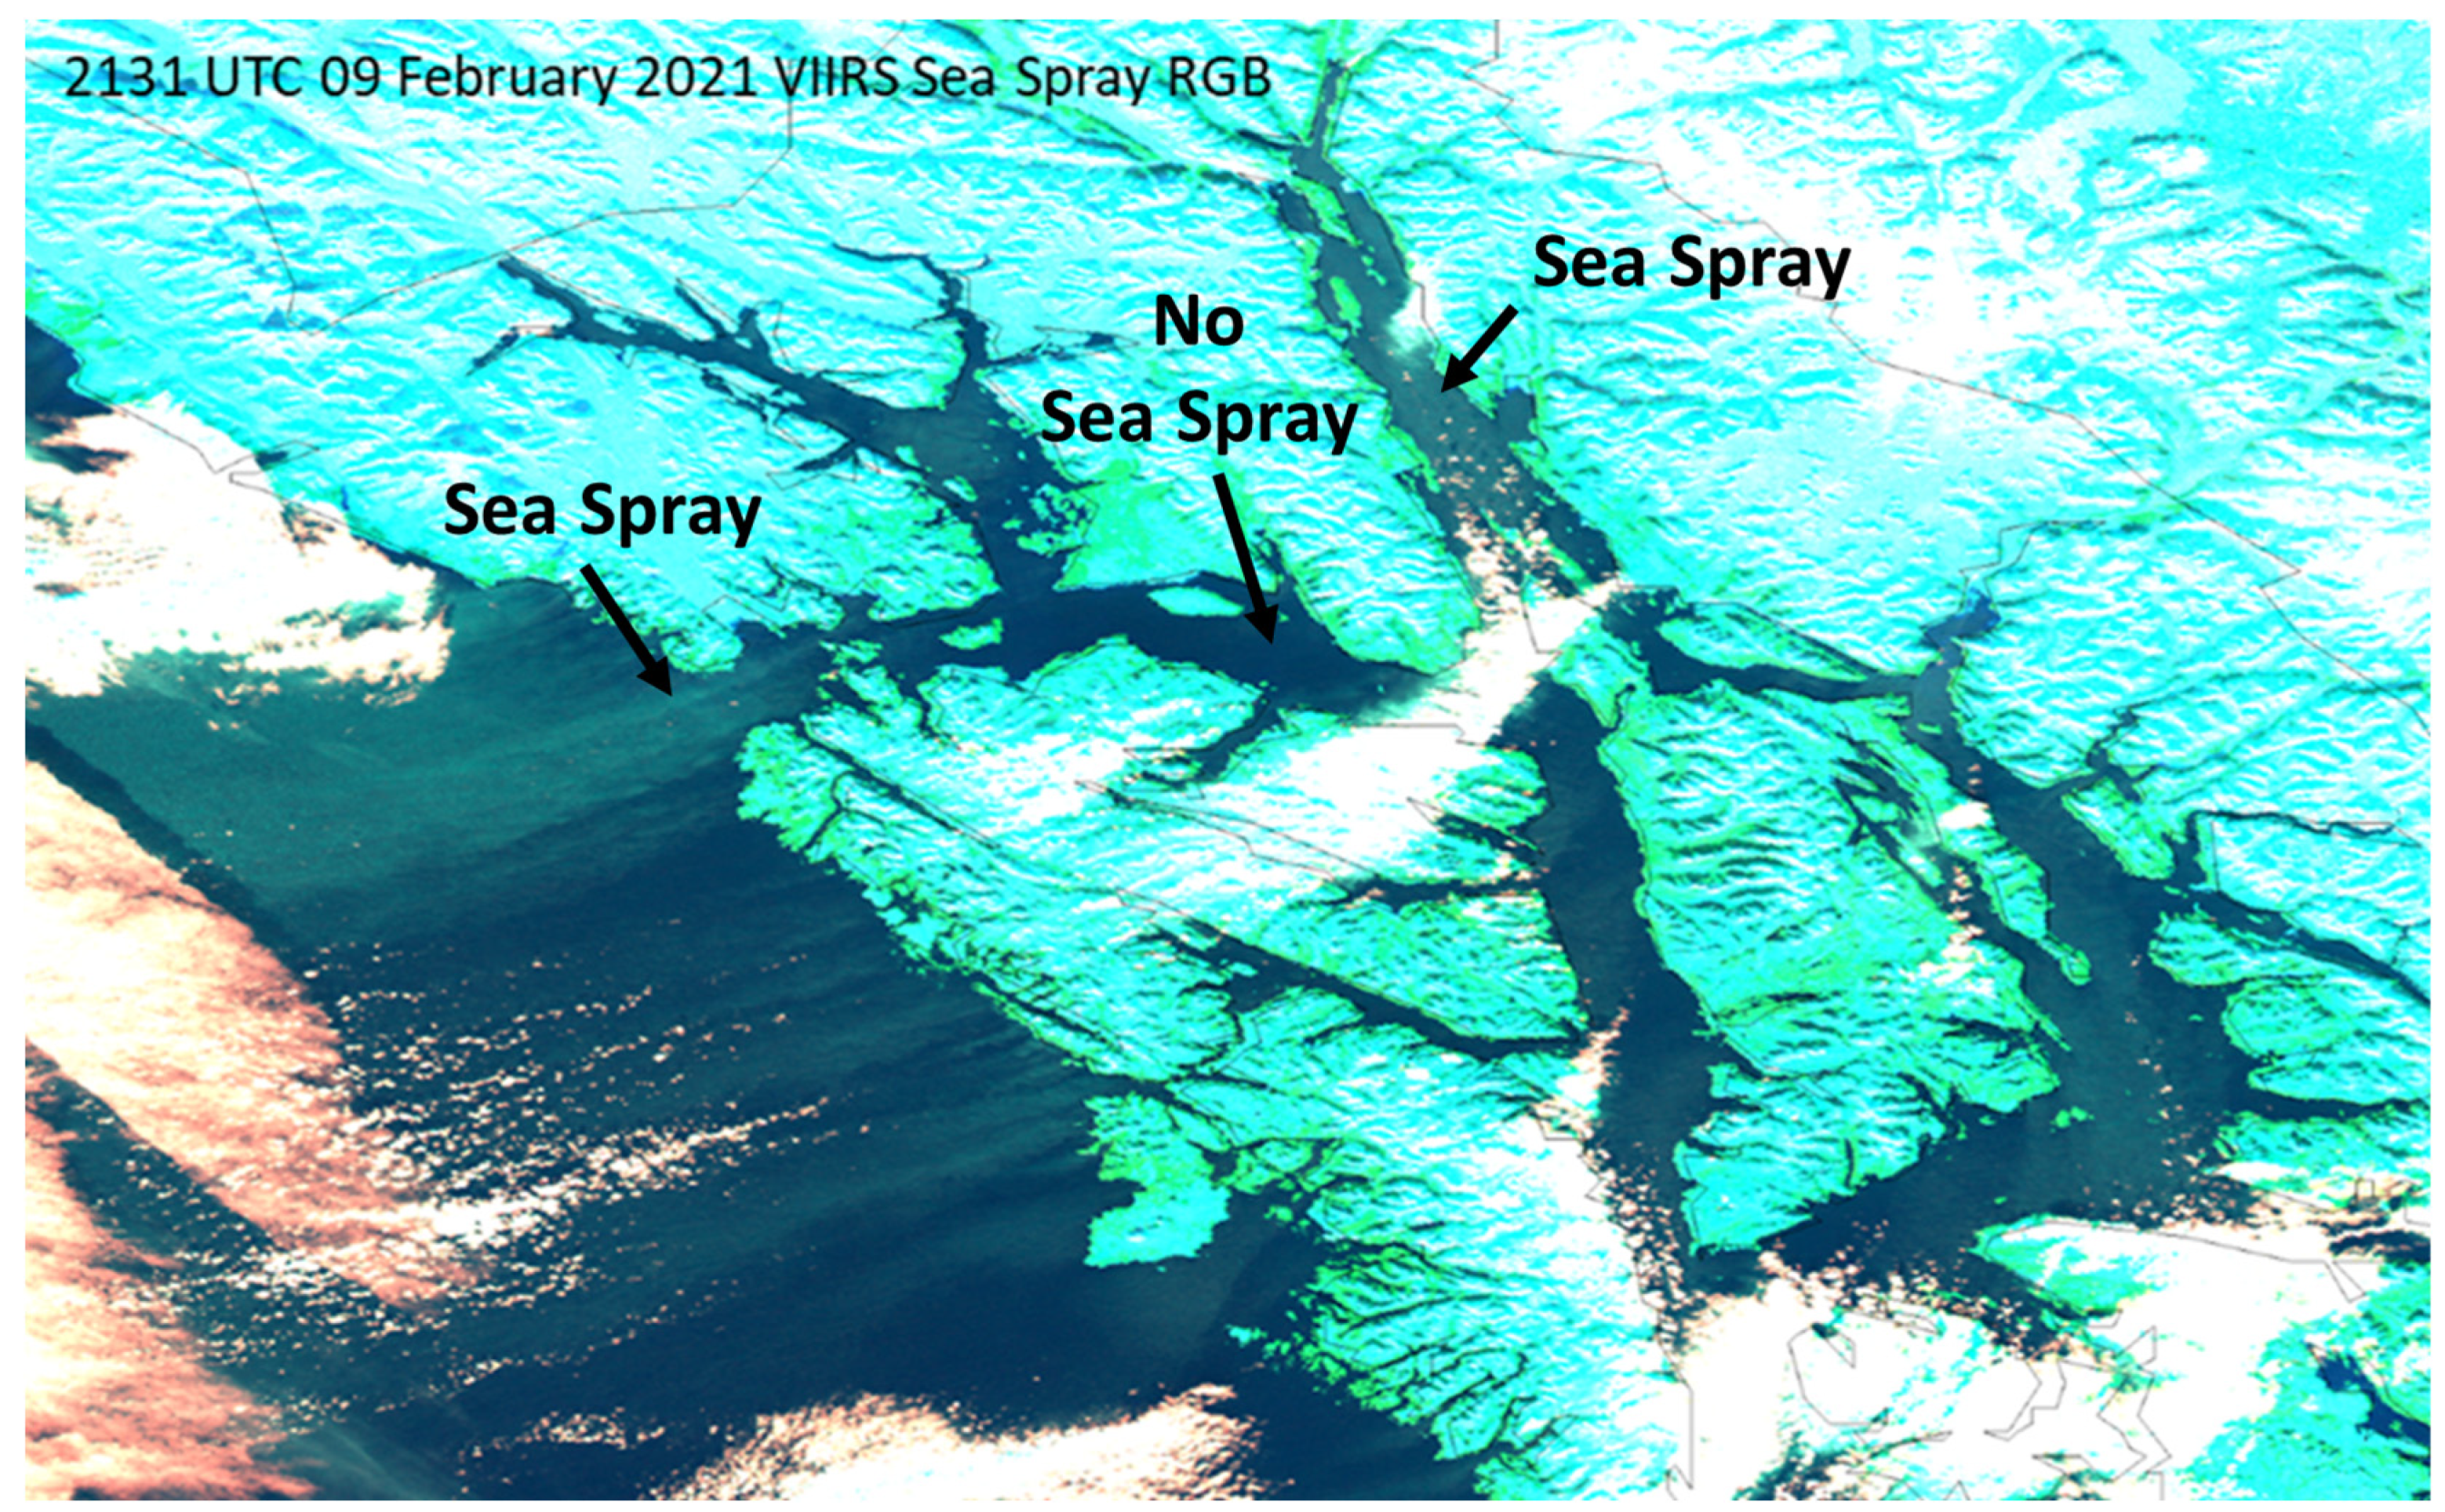
Freezing sea spray is a hazard to marine vessels as it can result in the accumulation of ice, dangerous on-board conditions (e.g., a slippery deck), and sometimes the sinking of ships. NWS offices issue Freezing Spray and Heavy Freezing Spray Warnings when environmental conditions are expected to be conducive to freezing spray. These forecasts are based primarily off of model data, and typically have little verification due to a lack of observations over water. Therefore, a VIIRS Sea Spray RGB has been developed in order to aid forecasters in the observation of sea spray [
9]. The RGB has been installed in AWIPS at the NWS Alaska Region forecast office and is used operationally to confirm the presence of sea spray. As described in Line et al. 2022, the RGB product utilizes a combination of 3.7 µm (I4) and 11.45 µm (I5) in the red band, 0.86 µm in the green band, and 0.64 µm in the blue band to take advantage of the unique solar reflectance sensitivities of those channels to sea spray while also discriminating cloud droplets and land surfaces. Strong winds and temperatures well below zero resulted in freezing spray across the inner channels of southeast Alaska on 9–10 February 2021. During the afternoon of 9 February, forecasters at NWS/AJK were monitoring the Sea Spray RGB, noting in the afternoon forecast discussion, “Heavy freezing spray looks a solid bet through Wednesday evening. Satellite confirms freezing spray through portions of the Inner Channels and in outflow plumes across the gulf. Near constant northerly gradients should support consistent gales through Lynn Canal and small crafts in other northern Inner Channels and Sumner Street.” Not only did the satellite imagery confirm ongoing sea spray, but it also aided in their confidence that similar environmental conditions the next day would result in similar coverage of the freezing spray. The VIIRS Sea Spray RGB imagery from 9 February is shown
Figure 2, confirming the presence of sea spray as relatively medium shades of cyan against the darker blue of the clear seas, and next to the whites of clouds and pure cyan of snow-covered land.
3.3. Cloud Microphysics RGBs
Forecasters in the high latitudes have grown used to leveraging multispectral VIIRS imagery products, which we have referred to as RGB products, for routine cloud analysis during both the day and night. Specifically, the Day Cloud Phase Distinction RGB is leveraged during the day, and the Nighttime Microphysics RGB is used at night. Both RGBs are available with ABI, but the VIIRS provides lower parallax and much better spatial resolution over polar regions (including Alaska) than the GOES-based ABI, especially when considering ABI pixel size at this location so far from the satellite subpoint. The Day Cloud Phase Distinction RGB utilizes 11.5 (I5) µm data in the red channel, 0.64 µm (I1) data in the green channel, and 1.6 µm (I3) data in the blue channel, whereas the Nighttime Microphysics RGB enhances the standard 10.4–3.9 µm “Fog Difference” product by combining the difference between 12.013 (M16) and 10.763 (M15) bands in the red channel, the 10.763 µm (M15) and 3.7 (M12) bands in the green, and the 10.763 (M15) band in the blue.
The Nighttime Microphysics RGB and Day Cloud Phase Distinction RGB were both used by forecasters at NWS Juneau, AK on 16 March 2020 in order to track the evolution of low clouds and a potentially associated drizzle threat at the surface beneath the stratus. Both GOES and VIIRS RGBs were used by forecasters in decisions of whether or not to include lower ceilings (CIGS) or visibility (VIS) conditions in the 18Z terminal aerodrome forecasts (TAFs). These decisions impacted local pilots whose ability to fly depended on the extent of the lower cloud bases.
Forecasters also used both the GOES and VIIRS RGB imagery in combination with other datasets to provide decision-support services to core partners regarding low cloud evolution. For example, the Forest Service called the NWS office inquiring about if and when the low clouds were going to lift in a certain area as they needed to take a helicopter to a mountain top to service infrastructure. Forecasters were able to provide them with some guidance regarding if the low clouds would lift, and what the ceiling might be if it did lift, by using a combination of area cameras, recent trends in satellite data, and model data. For these examples, low clouds and fog appear as a light green in the Nighttime Microphysics RGB, and light blue to cyan in the Day Cloud Phase Distinction RGB (
Figure 3).
4. NWS Perspectives on the Benefits of the Day/Night Band
It may come as a surprise that low-light sensing technology has existed on low-earth orbiting (LEO) satellites since nearly the advent of the meteorological satellite era. The Defense Meteorological Satellite Program (DMSP), initiated by the United States Air Force, has carried an Operational Linescan System (OLS) since the early 1970s with such capabilities. Designed for visible imaging under moonlit/twilight illumination, the OLS amplified available light by way of a photomultiplier tube, yielding a qualitative depiction of clouds and an unplanned but very useful side-benefit of sensing anthropogenic lights [
10] Largely unavailable to civilian-side weather analysts, the OLS operated in relative obscurity to the National Weather Service (NWS) until its successor, the Day/Night Band (DNB) on the VIIRS [
11] made its debut on Suomi NPP. With modern-era technology advances, the DNB advances OLS capabilities in spatial resolution, sensitivity, and radiometric quality. Over the past decade, NWS forecasters and the science community at large have gained familiarity with this novel new measurement and begun to take advantage of it in operational applications.
For this study, we solicited feedback from current and former members of the operational forecasting community. NWS forecasters from Weather Forecast Offices (WFOs) across the nation were asked to recount their user experiences with and perspectives on the utility of DNB observations. These responses, captured as personal communications, offer a cross section of the benefits low-light visible has provided, but may not capture the full scope of uses. We summarize their feedback below.
4.1. Nighttime Smoke
“Biomass smoke from wildfires impacts visibility, air quality, and human respiratory health. Forecasters give mention to smoke and adjust their forecasts based on the detection of smoke in text forecast discussions, aviation forecasts (TAFs), the gridded forecast, in social media posts, and in communication to local partners via Impact-based Decisions Support Systems (IDSS). Observations of smoke are also used as a check on Numerical Weather Prediction (NWP) guidance (e.g., from the High-Resolution Rapid Refresh Smoke model [
12], During the day, smoke is relatively easy to diagnose utilizing daytime visible/near-infrared imagery and multispectral products such as GeoColor [
11]. At night, except for the thickest of smoke plumes, smoke is much more difficult to detect using IR imagery. The DNB Near Constant Contrast (NCC) product from VIIRS provides forecasters with a look at smoke across the area (example shown in
Figure 4) during the evening, allowing them to make necessary adjustments to forecasts”.
- -
Former NWS Forecaster at WFO-Pueblo, CO
“There have been proven applications of VIIRS DNB to assess smoke at night, in anticipation of daytime influences to sensible weather and potential air quality impacts. This is an area where IR imagery cannot assist. Additionally, visible imagery at night can provide a tool towards active fire assessments, in which high illumination in addition to thermal signatures can give confidence in fire perimeter spacing and behavior”.
- -
Forecaster, WFO-Grand Forks, ND
4.2. Nighttime Fog
“Fog at night is a hazard to both motorists and visual flight rules (VFR) aviation due to sudden and significant reductions in visibility. As with smoke, forecasters give mention to fog and adjust their forecasts based on the detection of fog in text forecast discussions, TAFs, the gridded forecast, in social media posts, and IDSS. Traditionally, forecasters leverage satellite infrared-based methods to detect and track fog, but very thin and narrow fog layers, such as that found in river valleys (
Figure 5), as well as fog below thin cirrus (which can mask the IR signatures of fog) can be more difficult to diagnose with confidence”.
- -
Former NWS Forecaster at WFO-Pueblo, CO
4.3. Nighttime Convection
“Just like daytime visible-based analysis, analyzing cloud structure of potential or ongoing hazardous nighttime convective weather has the potential to bring large operational value, especially in a period where convection may have a tendency to develop or strengthen unexpectedly. This may range from assessing early development of nighttime cumulus leading up to convective initiation, to post-initiation storm top analysis. While IR alone can aid in these analyses, adding visible to supplement IR information may add the needed boost of confidence in convective processes to influence a forecasters’ decision, whether it be in messaging, IDSS, or warning decisions. Both assessments of hazardous convection before and after initiation have direct ties to mesoanalysis and warning decisions”.
- -
Forecaster, WFO-Grand Forks, ND
4.4. Nighttime Aviation Operations
“The DNB allows for much more accurate detection of low clouds and fog, both of which are crucial to aviation forecasts, assessment of smoke that has impacts both to air quality and sensible weather and allows for enhanced analysis of convection including initiation of elevated thunderstorms which can be notoriously difficult to anticipate. In the northern latitudes, the nighttime lasts a long time during the winter, and it’s during that time period that fog and stratus are especially prevalent, proving challenging to aviation forecasting including TAFs”.
- -
Forecaster, WFO-Bismarck, ND
4.5. Nighttime Tropical Weather
“The DNB capability has been a game changer for us in support of weather forecast operations [in the Caribbean Basin and South America], as we now have a better capability to monitor tropical waves, perturbations in the easterly trades, outflow boundaries and feeder band convection in association with tropical cyclones. Before the DNB, we had to wait for enough daylight to properly visualize these features, as the regular IR images were often obscured by high clouds. Now, we don’t have to wait. So, this capability is essential for our lives-saving mission”.
- -
Forecaster, NOAA/Weather Prediction Center
4.6. Nighttime Winter Weather
“As far as wintertime applications, we at [WFO Grand Forks] are very interested in the possibility of assessing blowing snow impacts through the use of visible imagery at nighttime, namely observing the presence and coverage of horizontal convective rolls associated with blowing snow. Blowing snow can occur any time of day, although reports can be hard to come by during nighttime hours (perhaps due in part to a drastically reduced ability to see anything at night). With little to no help from IR imagery and radar, most of our assessment to gauge impacts of blowing snow at night comes from METARs, in which a lot of interpolation has to be done. Visible detection of blowing snow has been shown via the daytime VIIRS Snow Cloud Discriminator”.
- -
Forecaster, WFO Grand Forks, ND
4.7. Benefits Specific to the Alaska-Region
“The first step in the forecast process is understanding the current state of the weather. To accomplish this goal, data from a variety of observing systems are required. Alaska suffers the disadvantage of sparse radar, radiosonde, and surface observation networks over the state itself and even more so over its surrounding upstream areas. Additionally, Alaska’s wonderfully complex topography limits the spatial representativeness of these already meager resources. For Alaska, satellite imagery is the great equalizer. The recent upgrade of America’s polar satellites has given Alaskan forecasters more and better data to work with, and I for one am hungry to see additional improvements in the coming years”.
- -
Former SOO at WFO-Fairbanks, AK
5. Non-NWS End-User Cases of VIIRS Observations
VIIRS observations enjoy a wide spectrum of use outside of the forecast and operational domain. To better capture the diversity of these observations, a workshop wherein VIIRS products developed for end-use cases (e.g., for commercial, governmental, or research use outside of the forecasting paradigm) was held virtually in June of 2022, hosted jointly by the JPSS program at NESDIS and CIRA. Twenty-three presentations on use cases for VIIRS data, ranging from DNB observation of fishing vessels to economic analyses of developing nations using DNB observations of streetlights, sea ice for maritime navigation, and wildfires among others. Data collection for these end-user cases are in the process of an economic analysis with an aim to quantify the socioeconomic impact of VIIRS observations across a broad range of relevant topics, with a report for the Office of Management and Budget (OMB) to justify further development of VIIRS and VIIRS-like LEO observations. Alongside the many examples of the utility of VIIRS observations for the NWS and other Federal operational use, these diverse and unique end-user demonstrations showcase the versatility of VIIRS.
Examples of some of the non-NWS products discussed at the workshop include the following topics.
5.1. Gas Flaring Using VIIRS Observations
The Global Gas Flaring Reduction Partnership [
13] is a program of the World Bank with an aim to eliminate routine gas flaring at oil and gas production sites globally. Among the tools the GGFR uses to monitor gas flaring activity, VIIRS observations correlated to the Planck curve of gas flare signatures are used to detect and quantify gas flaring activity. Using VIIRS observations during 2021, the GGFR monitored gas flaring activity, including large flaring incidences in Iraq, Iran, Russia, and Mexico. The United States, which ranks fourth among nations internationally in gas flaring, exhibited much smaller, but more frequent gas flares compared to large flaring seen in other gas-producing nations.
Efforts by the GGFR include temporal monitoring of gas flaring trends for further monitoring and regulatory action on behalf of the World Bank for nations exhibiting increases in flaring behavior.
5.2. Ukrainian Grain Estimates Using VIIRS VHI Data
Ukrainian grain yield estimation is of considerable interest to the world economy, as disruption in Ukrainian grain exports [
14] could constitute an 8–22% increase in the cost of the world grain supply. Researchers from the USDA Foreign Agricultural Service (FAS) utilize the Vegetation Health Index (VHI) product from the VIIRS in regression models to forecast corn yields from Ukraine, comparing current observations to VHI-derived forecasts dating back to SNPP launch (and beyond, with legacy VHI products.). USDA analysts use VIIRS-derived VHI data to compare crop harvests in different parts of Ukraine, inside contested areas and in areas yet untouched by the conflict. VHI-derived corn forecasts show an excellent harvest of Ukrainian corn, due to favorable conditions, in contrast to western Europe, where VHI conditions forecasted lesser harvests. [
15] Understanding the grain harvest, forecasted using VIIRS observations, plays into significant trade and economic decisions made by the FAS as part of their larger efforts to forecast and engage in global agricultural research [
16].
5.3. Developing Nation Analysis from Nighttime Lights
Private organizations often utilize publicly available satellite observations for economic analysis. One such presentation from New Light Technologies showcased multiple applications of VIIRS Day-Night Band (DNB) observations, in concert with (and often supplanting) older DMSP OLS products. VIIRS-specific examples focused on economic impacts of COVID-19 in the Middle East and northern African regions through analysis of changes in night-time lights. Disruption in the economic activity in Nepal as a function of time as a result of the devastating 2015 earthquake and displacement can also be tracked, as well as (again from night-time lights) the migration of rural populations within Myanmar as a result of the ongoing conflict in that country.
VIIRS DNB observations are further included in multivariate analyses of urban infrastructure resilience combining VIIRS observations with geolocated infrastructure components such as roadways, vegetation, construction, and other components. These observations can also be used in regression models to predict gaps in the OpenStreetMaps database and inform and prioritize mapping efforts [
17].
6. Looking to the Future of VIIRS and the DNB
The VIIRS now flies on Suomi-NPP, NOAA-20, and the recently launched NOAA-21. As such, there are now three principally redundant and operational DNB sensors in the same orbital plane. Their even spacing over the ~101 min orbital period will provide a triplet of low-light visible observations at ~33.7 min resolution around the 0130 local time descending node. Since the three satellites fly in the same orbital plane, Earth’s rotation rate (~0.46 km/s at the equator) leads to a relatively small overlap of the three DNB swaths at the equator. Assuming a 33.7 min × 60 s/min × 0.46 km/s = 930 km westward shift between successive satellites at the equator, a 3060 km wide DNB swath, and neglecting the slow (~1 degree/day) drift of the sun-synchronous satellite orbital planes, there will be a ~1200 km wide swath of 3-satellite overlap, separated by 1860 km gaps. These gaps close in at higher latitudes as swath overlap increases. The multi-angle, ~30 min resolution DNB observations in these triplet zones should be useful for retrievals of atmospheric motion, changes in cloud/aerosol morphology and properties, and a number of artificial lights at night applications.
The general interest in visible imagery is not limited to the U.S.-based forecasting community. In a 2019 survey of international-community forecasters from Central America, South America, and the Caribbean (L. Machado, INPE; Personal Communication), a solid 92% of respondents currently use or plan to use daytime visible imagery. However, only 37% of the respondents currently use or plan to use nighttime visible imagery. The disparity may be due in part to unfamiliarity with the (still relatively new) DNB imagery, but more so to the relative lack of temporal resolution compared to daytime visible observations which have been a part of geostationary satellites for decades.
Bolstering the point above, NWS forecasters have expressed a strong appetite for DNB-like measurement capabilities on a future geostationary satellite for the benefit of the higher temporal resolution it would provide. An alternative to the geostationary platform implementation could be the deployment of DNB sensors on additional LEO satellites, e.g., as part of a SmallSat or CubeSat constellation. As mentioned above, at the time of this writing three DNB sensors co-exist in the 1330 LTAN orbit (Suomi-NPP, NOAA-20, and JPSS-2), providing roughly 30 min updates over a window surrounding 0130 local time and offering a preview of a geostationary-like capability (in terms of temporal refresh, although in this case the viewing geometry is not constant). Conceivably, a fully populated constellation of DNB sensors could be implemented to achieve high temporal imagery at all latitudes with global coverage. Given the positive feedback from the limited existing sample, the potential forecaster benefits of such a future system, regardless of orbital implementation strategy, appears very promising.
7. Conclusions
A wide spectrum of utility for VIIRS observations have been made apparent over the past ten years of operations. Significant training efforts modeled after the successful GOES-R proving ground have developed new ways for NWS and other forecasters to better understand and utilize VIIRS observations.
Multiple unique situations observed by VIIRS platforms have been utilized by NWS forecasters to make unprecedented and useful forecasts, including ground blizzards and sea-spray forecasting. The impacts of VIIRS observations on microphysical cloud parameter observations have wide-ranging impact on aviation operations and have made great gains in this field. Finally, a wide range of end-user cases in academia, the private sector, and non-NOAA research offices (such as the USDA) utilize VIIRS observations in unique and socioeconomically relevant ways.
Continued development of the VIIRS program along with the constant evolution of VIIRS-derived products will doubtless provide even greater and wider-ranging impacts in the next ten years and beyond.


 ,
, 


