Article

Using Satellite Imagery and Aerial Orthophotos for the Multi-Decade Monitoring of Subalpine Norway Spruce Stands Changes in Gorce National Park, Poland

Department of Forest Resources Management, Faculty of Forestry, University of Agriculture in Krakow, al. Mickiewicza 21, 31-120 Kraków, Poland
*
Author to whom correspondence should be addressed.
Remote Sens. 2023, 15(4), 951; https://doi.org/10.3390/rs15040951
Submission received: 16 December 2022 / Revised: 6 February 2023 / Accepted: 7 February 2023 / Published: 9 February 2023

Abstract

:
In the last 50 years, forest disturbances, caused mainly by insect outbreaks and windstorms, had a significant impact on the subalpine Norway spruce (Picea abies (L.) H. Karst.) stands across Europe. The high intensity of these factors often led to complete dieback of existing forest stands, as in Gorce National Park (Southern Poland). The aim of this study was to monitor land cover changes in subalpine Norway spruce stands and their dynamics in Gorce NP in the years 1977–2020 (43 years), with the use of archival remote sensing data. The study area was divided into two subareas: A—the Kudłoń and B—the Jaworzyna range. Changes were tracked in six defined land cover classes, based on available aerial orthophotos and Landsat (NASA) imagery, with the help of the authors’ photointerpretation key. The results showed that almost 50% of old-growth Norway spruce stands died in the analyzed time period (50.9% in subarea A; 48.8% in subarea B). However, young forests appeared in almost 17% of the study area (20.7% and 14.2% in subarea A and B, respectively). The dynamics of land cover changes were different for the analyzed subareas; in subarea A Norway spruce dieback processes weakened at the end of the analyzed time period, whereas in subarea B they maintained high intensity. The process of old-growth Norway spruce stands dieback is still occurring in Gorce NP, but it does not result in the disappearance of the whole subalpine spruce forest ecosystem but is rather a generational change, due to emerging young forests.

1. Introduction

The long-term monitoring of land use and land cover (LULC) changes is one of the crucial issues facilitating sustainable development in the face of climate changes and the effects of disturbed processes resulting from them. Forest formations are amongst ecosystems encountering dynamic changes caused by various human activities (harvesting timber and other forest management treatments) and also natural processes. Anthropogenic factors (e.g., industrial emissions), as well as biotic (e.g., insect outbreaks) or abiotic (e.g., windstorms, droughts) factors, are causes of forest disturbances—events that disrupt the existing ecosystem structure and change its environment and resources [1]. The characteristics of disturbances such as frequency, intensity, or their extent can make their impact on biodiversity, resilience of the forest ecosystem, and ability to provide ecosystem services to society highly variable [2,3]. Over the past 200 years, an increase in the frequency of large-scale forest ecosystem disturbances has been observed [4] in both natural biotic and abiotic genesis [5,6]. Their more frequent occurrences can be locally and temporarily challenging for forest ecosystem stability and sustainable forest management [7]. Especially in mountain areas, forests provide important regulating and supporting services, reducing soil erosion, maintaining high water reception capacity, and, in the case of Norway spruce (Picea abies (L.) H. Karst.) stands, providing substrate for the young spruce generation [8,9]. The dominant tree species in subalpine forests of Central Europe is the Norway spruce [10], which has been the subject of abrupt changes in recent years. The issue of Norway spruce forest stands decline was broadly recognized in the second half of the 20th century, when Norway spruce stands in Central (the Harz Mountains, the Bavarian Forest, the Ore Mountains, the Sudety Mountains, the Izerskie Mountains, the Carpathians) and Northern Europe (southern Sweden and Norway) were damaged or began to die out on a large scale [11]. The first reports attributed this phenomenon to air pollution [12,13], climatic stress [14], excessive soil acidification, or a combination of the above factors [15]. Eventually the hypothesis of a synergistic combination of harmful factors responsible for Norway spruce dieback, which can be linked to the so called “spiral model” of tree disease [16], has emerged as a new paradigm [17,18]. The increase in average annual air temperature and the decrease in mean annual precipitation, as well as more frequent extreme weather phenomena (such as windstorms and prolonged droughts), form conditions to which the Norway spruce is not able to adapt quickly [19]. This raises a question whether spruce forests can maintain their regeneration capacity [20]. An important factor is also the provenance of the Norway spruce. Since the 18th century, Norway spruce stands were heavily exploited and then reforested on a large scale, often using seeds of unknown foreign origin, not suitable for local habitat conditions [21]. The occurrence of so many weakening factors renders old-growth Norway spruce forest stands susceptible to disturbances, such as events that occurred in the area of the Bavarian Forest and Sumava National Parks [22,23]. However, similar processes have been observed throughout the whole European range of Norway spruce, also in recent years. Conducted studies contribute latest spruce mortality to drought conditions, such as in central Germany [24], northern Austria [19], Czechia [25], or Poland [26], but they are not able to exclude the influence of other drivers (windstorms, insect outbreaks, other factors resulting from climate changes).
Norway spruce covers only 5.7% of Polish forests [27], but it is locally (the Sudety and Beskidy mountains) one of the most dominant forest-forming tree species. Poland is in the range of two natural distribution zones of Norway spruce: Hercyno-Carpathian in the south, and Baltic-Nordic in the north-east, divided by a disjunction (“spruceless belt”) in central Poland, the existence of which is the subject of debate [28]. Recently, disturbances have mainly affected spruce stands in mountainous areas: air pollution damage in the Sudety and Izery mountains in the 1980s [29,30], snowbreaks, windbreaks and bark beetle outbreaks in the Tatra mountains occurring periodically since the 1960s [31], and windbreaks and bark beetle outbreaks in the Beskidy and Gorce mountains occurring since the 1980s [17], but some locations in the north also suffered from such events, such as bark beetle outbreaks and drought induced mortality in Białowieża Forest in the early 2000s and 2010s [26].
Norway spruce stands decline in the Gorce region began with the web-spinning sawfly (Cephalcia alpina Klug, 1808) outbreak between 1979 and 1985 [32], just before the establishment of Gorce National Park in 1981. Three outbreaks of web-spinning sawfly were located on the S slopes of Kudłoń mountain, on the NW slope under Mostownica peak, and on the N slopes of Jaworzyna Kamienicka. In the culmination phase of the C. alpina outbreak in the summer of 1981, the total area of damaged Norway spruce stands was estimated at 587 ha [32,33]. Windthrows and windbreaks caused by strong winds, as well as tree defoliation caused by C. alpina, created favorable conditions for the massive outbreak of the European bark beetle (Ips typographus L., 1758), which led to the further extension of the forest decline zone. From 1981, the outbreak area was placed under strict protection, but in the next 19 years this was changed several times to partial protection, allowing the removal of dead Norway spruce trees and man-made afforestation. In 2000, the whole Kudłoń range was placed under strict protection, which is still in force there. In selected periods of the years 1981–1999, when the area was under partial protection, approximately 16,400 m3 of timber were removed from the Kudłoń range, almost exclusively Norway spruce. At the same time, more than 630,000 tree seedlings were planted on an area of about 632 ha where the spruce stand had died [34]. In 2002 windstorms occurred in the Gorce area, damaging 700 m3 of Norway spruce timber. The year 2004 brought more damage as a result of windstorms, which was estimated at more than 10,000 m3 in the whole of Gorce National Park [35].
Historical data indicate that, in the past, the share of Norway spruce in Gorce forests reached up to 80%, and the bottom border of subalpine forests was located at a lower altitude than nowadays [36]. The process of old-growth Norway spruce trees decline in Gorce National Park is not only evident in subalpine Norway spruce forests, where they form single species stands, but also in silver fir (Abies alba Mill.)-Norway spruce mixed stands and in European beech (Fagus sylvatica L.) stands, where they usually grow as an admixture. The definition of “old-growth forest” in the literature is rather unambiguous and can refer to forests with different characteristics [37]. In our paper, we use this term to describe mature subalpine Norway spruce stands, often with complex vertical structure, that were not altered by human intervention since the establishment of Gorce National Park in 1981 and were previously not intensively managed, due to their location on the elevated slopes of the mountains [38]. Despite significant changes that have occurred in the subalpine Norway spruce forests in the Gorce mountain range during the last 43 years, there are no studies analyzing long term spatio-temporal patterns of ongoing changes in Gorce National Park. The use of available archival remote sensing data, such as satellite imagery and airborne orthophotos, provides the possibility of filling this gap.
Methods utilizing remote sensing data and GIS analyses enable the comprehensive examination of the spatio-temporal regime of environmental changes, delivering repeatability and high accuracy results. Active remote sensing technologies, such as LiDAR (Light Detection And Ranging) and SAR (Synthetic Aperture Radar) provide precise information regarding the vertical structure of forests, and passive sensors (e.g., aerial multispectral cameras) allow the performance of health condition assessments and other spectral analyses as well. Moreover, a wide range of sensor platforms (satellite-, airborne-, UAV-based) and their improving spatial, spectral, radiometric, and temporal parameters allow for the almost instantaneous detection of changes occurring in the environment. What is equally important are the archival datasets such as cartographical documentation (thematic maps), analogue or digital aerial photos, and satellite imagery. The selection of suitable datasets facilitates the mapping of forest disturbances on a single tree level [39], on the scale of forest management entities [22,40], or broader analyses, such as for a specific continent or even the whole planet [41,42]. Combined with machine learning (ML) solutions, geospatial analyses of remote sensing data offer a comprehensive tool for the monitoring of forest changes [43,44].
The aim of this paper was to track changes that occurred in subalpine Norway spruce stands in Gorce National Park since 1977 until 2020, with the usage of remote sensing data. In particular, we have set out our objectives as:
  • Examining which of the land cover (LC) classes have undergone the most significant changes, using archival remote sensing data;
  • Determining the characteristics of dynamics of changes occurring in selected land cover classes using GIS analyses and archival remote sensing data.
We hypothesized that despite climate changes, which escalate the intensity of dieback processes, Norway spruce stands will maintain the regeneration capacity. More specifically, we hypothesized that forest regeneration will appear on post-decline areas. Our second hypothesis was based on the assumption that the initial location of C. alpina outbreak on the slopes of the opposite aspect (the Kudłoń range—S, the Jaworzyna range—N), will affect the course of changes in forest stands. That is why we decided to divide our test area into two subareas (A—the Kudłoń range, B—the Jaworzyna range), where we expected to see different dynamics of change in forests.

2. Study Area

Established in 1981, Gorce National Park (GNP; 49°30’–49°37′ N, 20°1’–20°15′ E) is located in southern Poland, covering 7029.85 ha of Gorce Mountains (western Carpathians; Figure 1). Turbacz (1310 m a.s.l.) is the highest mountain peak of the range, and other prominent summits are Jaworzyna Kamienicka (1288 m a.s.l.) and Kudłoń (1276 m a.s.l.). Climatic conditions of the study area can be characterized as a mild mountain climate, which consists of two zones: a moderately warm zone (up to 950 m a.s.l., with average annual temperature 6–8 °C) and a moderately cold zone (above 950 m a.s.l., average annual temperature 4–6 °C, [45]). Gorce National Park area is dominated by forest ecosystems, with the highest share of European beech stands (Dentario glandulosae-Fagetum, 3749.68 ha, 53.21%), followed by subalpine Norway spruce forests (Plagiothecio-Piceetum tatricum, 1919.81 ha, 27.25%) and silver fir-Norway spruce mixed forests (Abieti-Piceetum montanum, 658.74 ha, 9.35%; [46]). Subalpine Norway spruce forests, which are the subject of this study, developed naturally in the cold climate zone characterized by high precipitation. Depending on slope aspect, their lower boundaries are situated between 1000 m a.s.l. (northern aspects) and 1150–1200 m a.s.l. (southern aspects). Norway spruce stands characteristics vary along elevation gradient; in the lower altitudes trees reach 25–30 m of height and 60–70 cm of DBH (Diameter at Breast Height), but with an increase in altitude, average stand height decreases and trees often assume a banner form [47]. Over 4005 ha of Gorce National Park are now under strict protection, with human interference in the environment prohibited, 2604 ha are under active (partial) protection, and 437 ha are under landscape protection regime. The area of Gorce National Park also overlaps with two Natura 2000 network units: the Special Area of Conservation unit PLH120018 (established under the European Union’s Habitat Directive [48]) and Special Protection Area unit PLB120001 (established under the European Union’s Bird Directive [49]).
The test area (Figure 1) covered 1616.43 ha and was located in the Kudłoń and Jaworzyna Kamienicka ranges, including the valley of Kamienica stream between them. It has been divided into two subareas: subarea A—Kudłoń (718.80 ha), subarea B—Jaworzyna (897.53 ha).
Our analyses were focused on Norway spruce stand decline and regeneration; therefore, meadows and glades were excluded from the study area. Boundaries of the test area corresponded with the extent of subalpine Norway spruce stands; the northern border of the test area was located at an altitude of 1000 m a.s.l. and the southern border at 1100 m a.s.l., the precise location of the test area can be seen on Figure 1.

3. Materials and Methods

Changes in Norway spruce stands in the test area were tracked by photointerpretation of multi-temporal airborne and satellite remote sensing data and the heads-up digitization of defined land cover classes. We decided to settle for a heads-up digitization approach for the following reasons. Firstly, available datasets were heterogenous in terms of spectral information (B&W—Black and White, RGB—Red, Green, Blue, or CIR—Color Infrared color composites) and spatial resolution (from 0.05 m to 0.75 m GSD for aerial orthophoto datasets and 30.0 m or 60.0 m GSD for Landsat-4, -5 NASA imagery), which poses a challenge to semi-automatic and automatic classification approaches. Furthermore, archive source material (copies of aerial photographs) used for orthophoto generation (1977, 1987, 1997) was scanned in the past. Scanning degraded the quality of materials and resulted in appearance of many artifacts (dust and scratches), which can lead to misclassification errors in automatic approach (GEOBIA—Geographic Object-Based Image Approach segmentation) and would require manual refinement. Particularly challenging could be B&W photos, which are characterized by a relatively low information capacity and can generate problems when used in fully automatic approach. Further considerations regarding chosen methods are placed in the discussion section. Below, characteristics of used datasets are given, followed by a detailed description of photointerpretation methodology and land cover classes definition.

3.1. Materials

The primary remote sensing data used in our study were the archival aerial orthophoto datasets generated in various spectral band compositions (B&W, RGB or CIR), acquired from the publicly available resources of the Head Office of Geodesy and Cartography (GUGiK) and the Gorce National Park (GNP) archive as well (Table 1).
To fill the gaps between years with available aerial orthophoto, two sets of Landsat (NASA) cloudless satellite scenes were acquired: Landsat-4 on 04.05.1984 (MSS instrument, 4 spectral bands, CIR composition, 60.0 m GSD) and Landsat-5 on 05.09.1991 (TM instrument, 7 spectral bands, CIR composition, 30.0 m GSD). Based on available remote sensing data, 8 time periods (1977–1984, 1984–1987, 1987–1991, 1991–1997, 1997–2003, 2003–2009, 2009–2015, 2015–2020) were established (Table 1) where land cover changes were recorded. To conduct additional altitudinal, slope, and aspect analyses, a 1.0 m resolution DEM (Digital Elevation Model) of the study area was downloaded from GUGiK resources.

3.2. Methods

In our study, we defined six LC (land cover) classes fully describing the diversity of the test area and spectrum of our analysis (Table 2).
Our image analysis approach involved three stages:
In Stage 1, based on a fieldwork and long-time experience in the test area, a photointerpretation key (Figure 2) for each LC class and data type was developed.
In Stage 2, boundaries of LC classes were delineated for each imagery dataset by heads-up digitization, with the help of the photointerpretation key. In total, 9 vector layers were created, separately for each imagery dataset.
In Stage 3, GIS spatial analyses to track changes and calculate dynamics of each LC class over the study period were performed. We computed area and share of LC classes for every analyzed dataset. By intersecting two chronologically consecutive layers, the changes of area and share of LC classes was obtained. Moreover, the Dynamics Index (DI; Equation (1)) was computed for both LC classes and analyzed time periods, which was expressed by the formula:
DI % = i | c i | a × 100 %
where c is the value of the change in area of ith LC class relative to previous analyzed date, and a is the total surface area of the study area.
The proportion of defined LC classes was also calculated inside the 50 m elevation (a.s.l.) zones, 5° slope classes, and aspect classes derived from DEM resampled to 10 m GSD for better coherence. All operations were carried out in QGIS 3.18 Software [50] and plots were generated using the ggplot2 R package [51,52].

4. Results

The results of the study can be distinguished into two groups: (i) the mapped changes of the defined LC classes within the study area (A and B) and their spatial statistics and (ii) the dynamics of LC class changes in the analyzed time-period (1977–2020) and the dynamics of time periods.

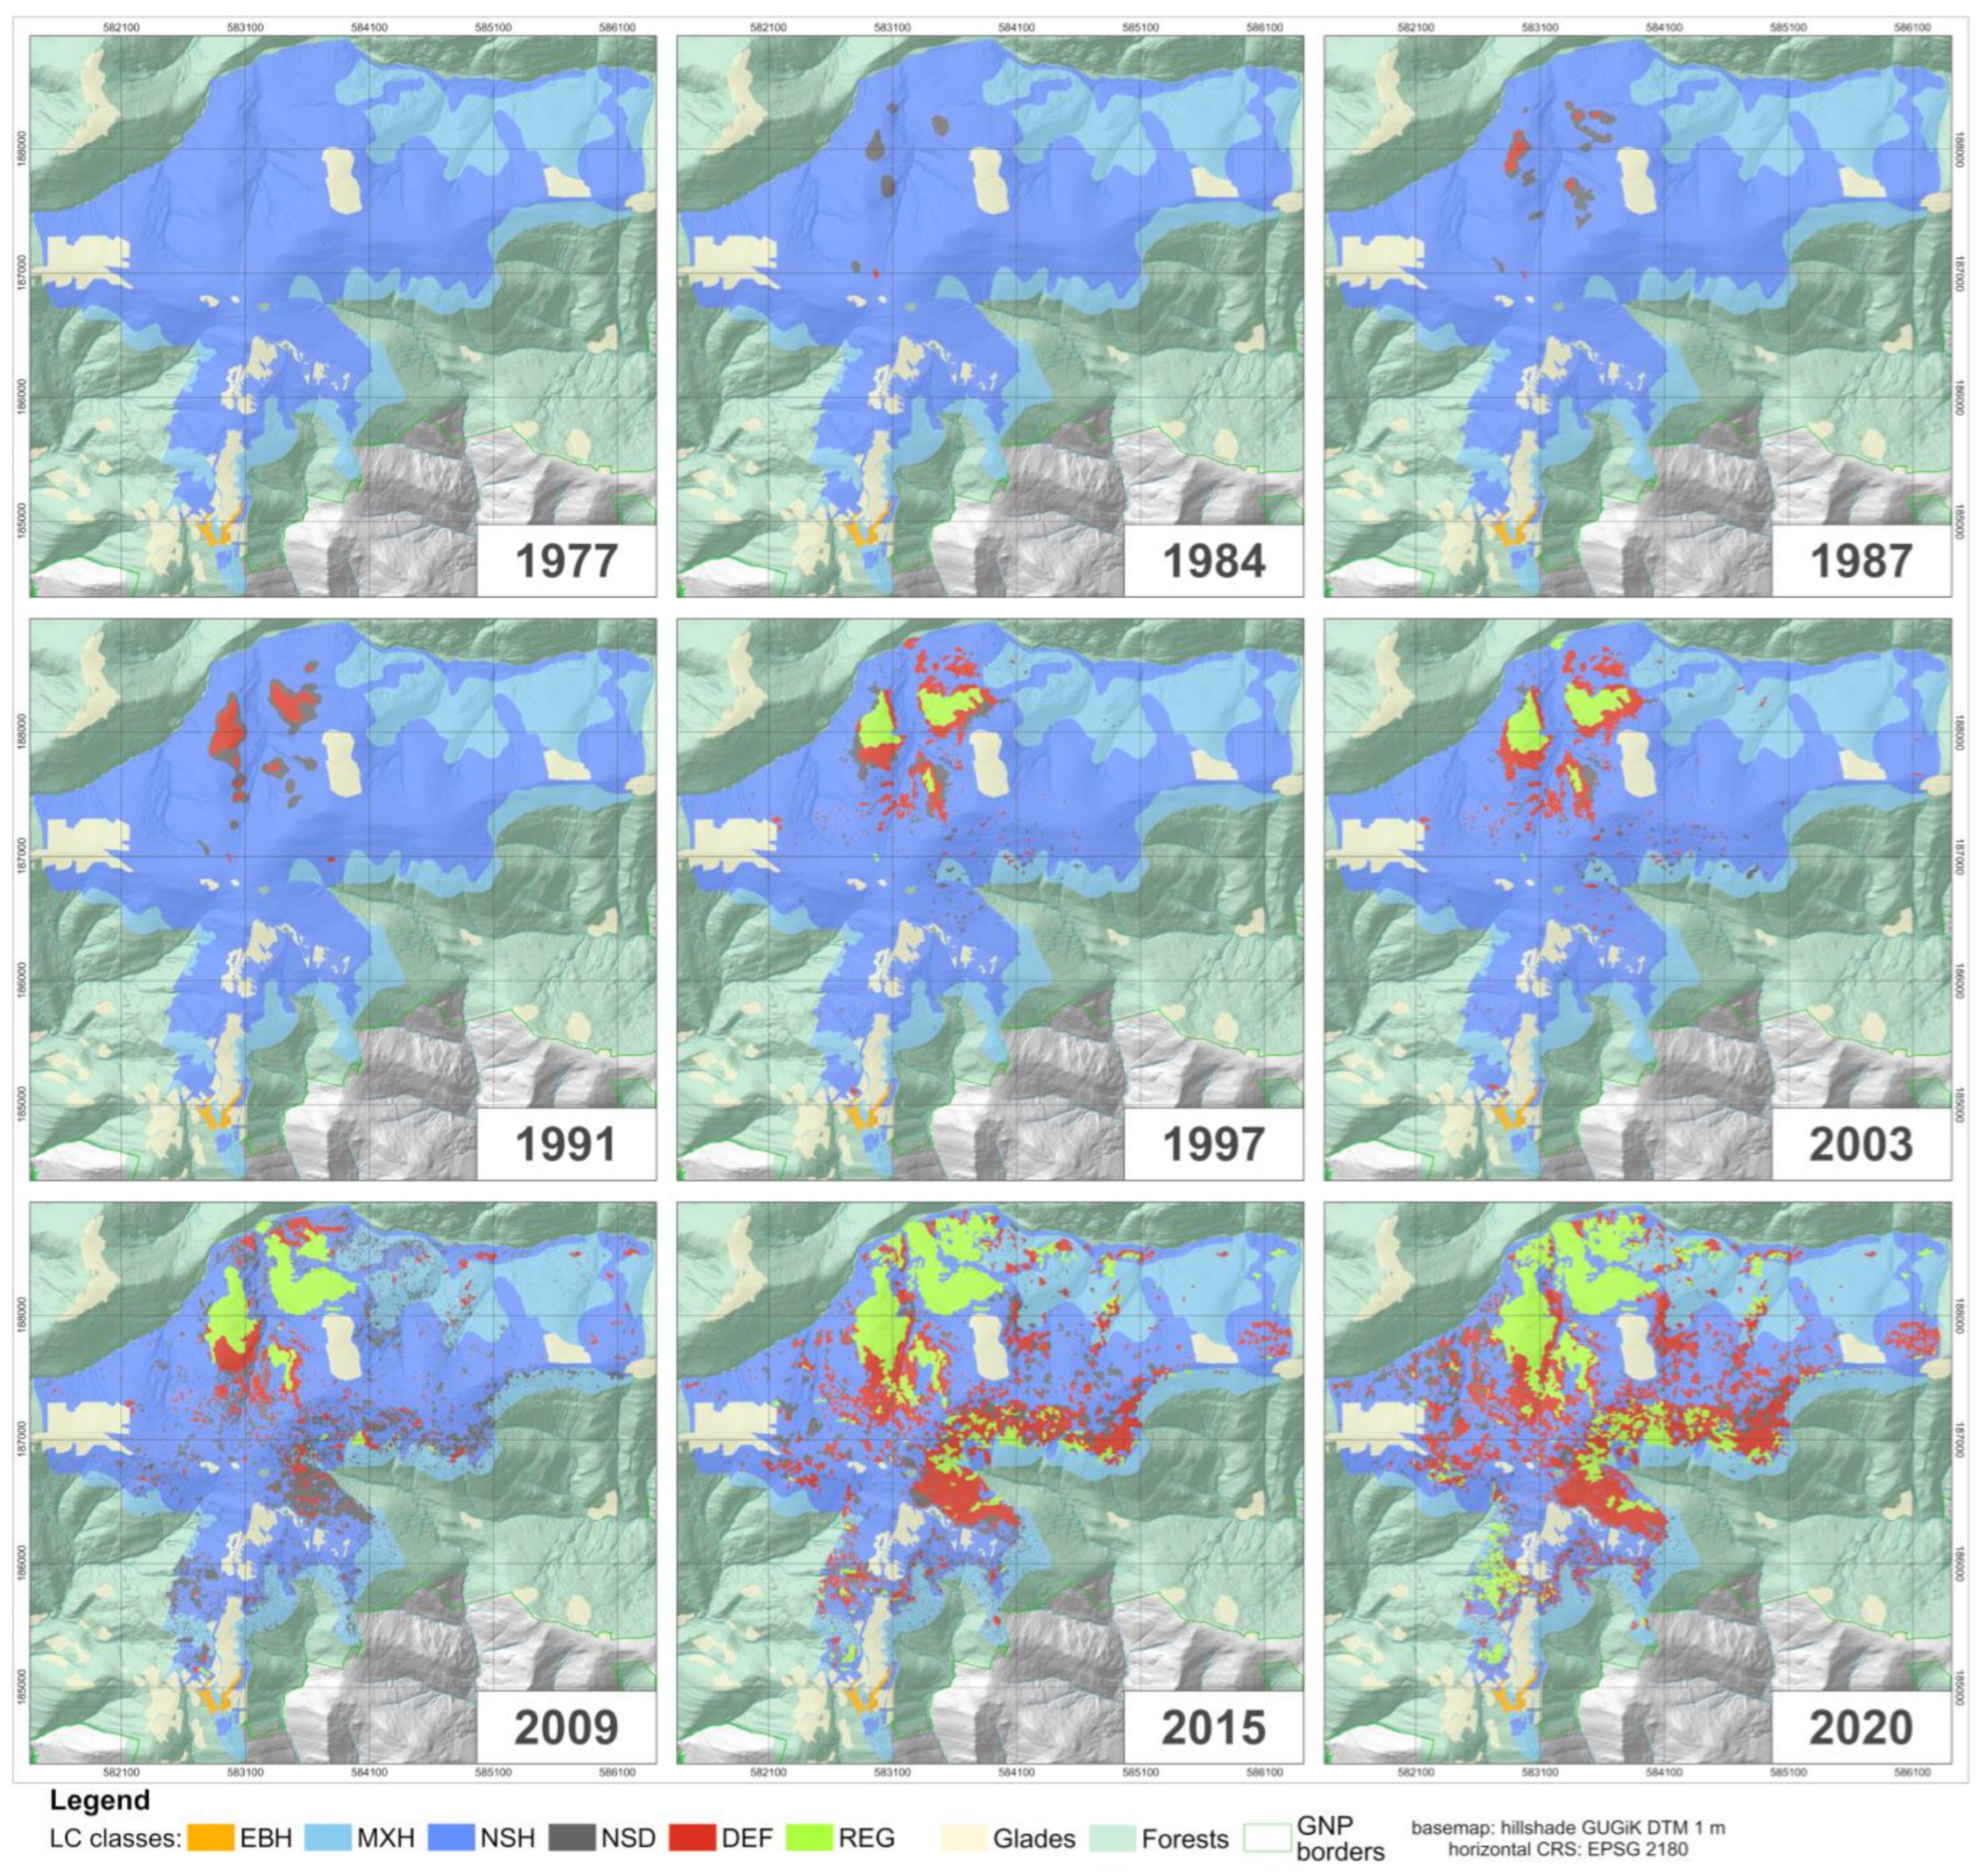
4.1. Land Cover Class Mapping

In subarea A, the predominant change occurring in LC classes during the analyzed time period was a decrease in the area of healthy, old-growth Norway spruce stands (class NSH), which lost 50.9% (−185.21 ha) of their initial area. A small area decrease (−9.4%; −22.35 ha) was recorded for mixed forest stands. The appearance of a regeneration class (REG) was observed in the year 1997, and at the end of the analyzed period, young forests covered 20.7% of subarea A, which accounts for 75% of the area of forest loss (NSH, MXH and EBH loss combined). The direction and area of transformations between LC classes can be seen in Figure 3. Detailed changes in LC classes in subarea A can be seen in Table 3, as well as the map series attached in Appendix A (Figure A1).
Similar to subarea A, the dominant change in LC classes in subarea B was a decline in the area of healthy, old-growth Norway spruce stands (NSH), which decreased by 48.8% (−329.74 ha) in the analyzed time period. A small area decrease (−9.4%; −22.35 ha) was recorded for mixed forest stands. Young forests (REG) were first observed on the 1997 CIR orthophoto, and at the end of the analyzed period, young forests covered 14.5% of subarea B, which accounts for only 36% of the area of forest loss (NSH, MXH and EBH loss combined). The direction and area of transformations between LC classes can be seen in Figure 4. Detailed changes in LC classes in subarea B can be traced in Table 4, as well as the map series attached in Appendix A (Figure A2).

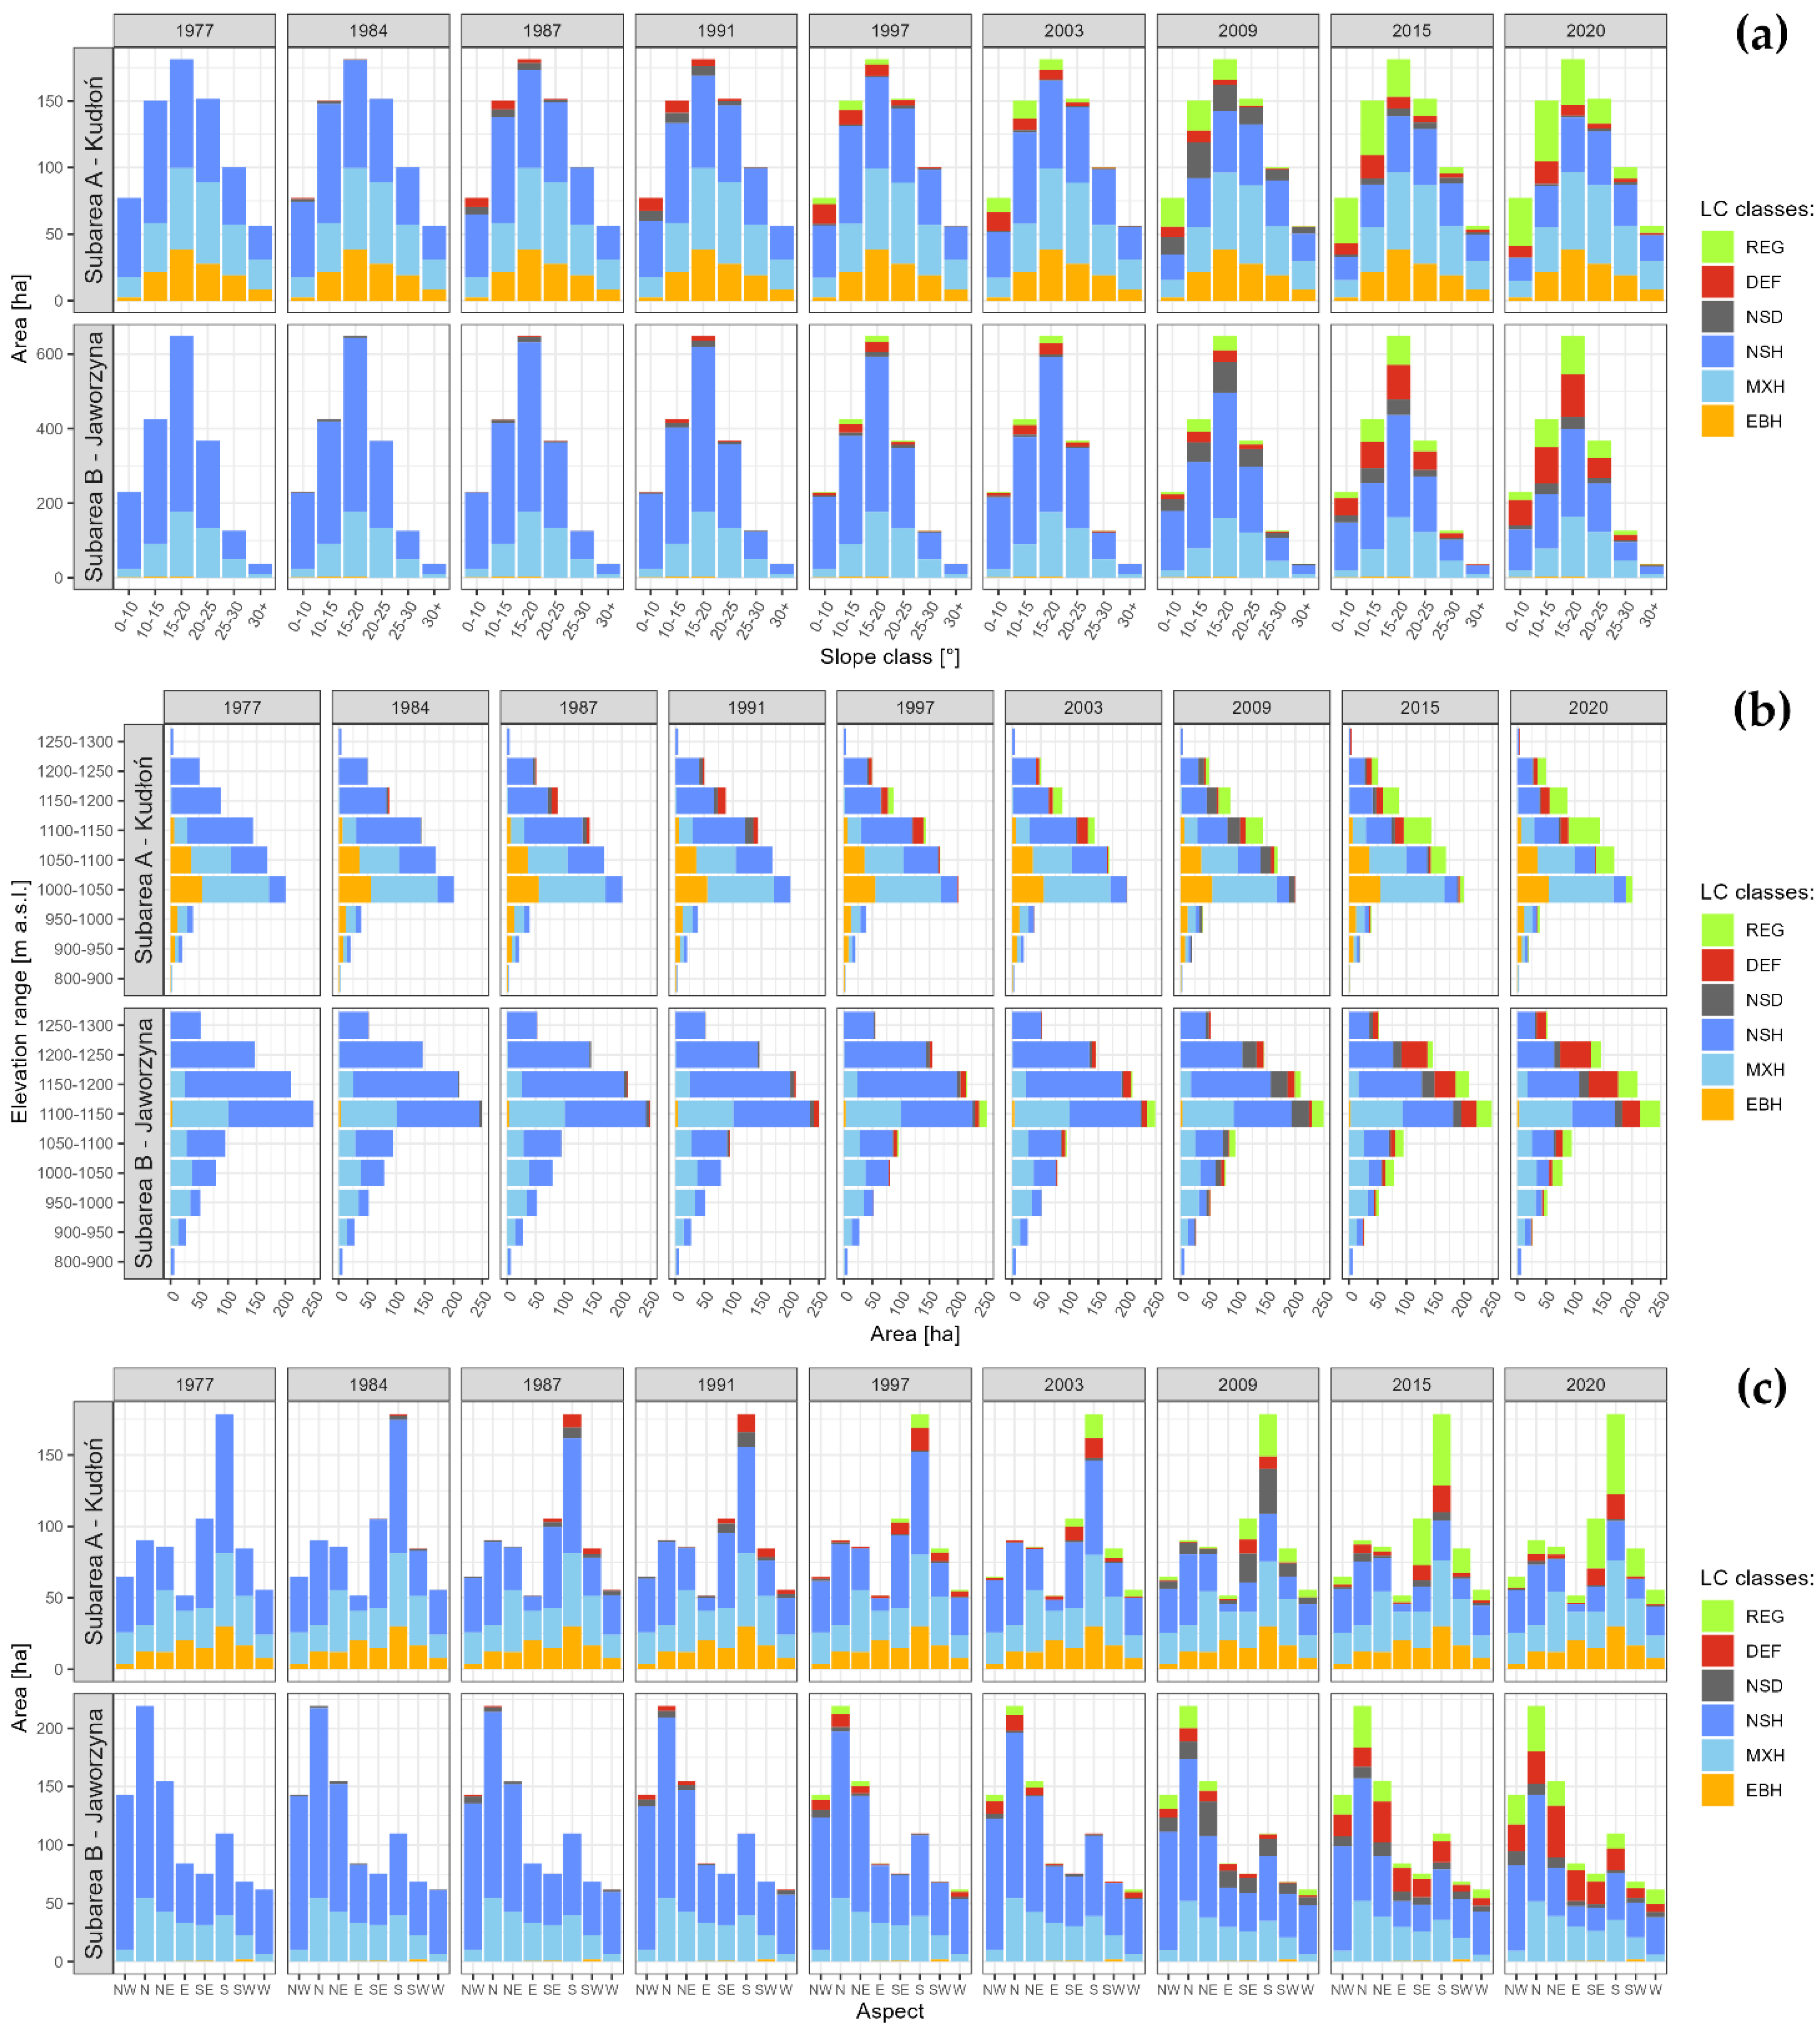
4.2. Slope, Elevation and Aspect Analysis and Comparison of Subareas

Analyses of LC classes in the defined slope classes in both subareas A and B demonstrated no significant influence of this trait on LC changes (Figure 5a). Altitudinal zone division showed that changes in LC classes were most prominent in higher elevations in both subarea A and B. Over 84% of dead Norway spruce stands area in the analyzed period was found above 1100 m a.s.l., which corresponds to the natural range of subalpine Norway spruce stands (Figure 5b). Opposite trends for subarea A and B were observed in relation to slope aspect. In subarea A, healthy Norway spruce stands (NSH) on N slopes remained mainly intact, whereas other slope aspects were largely affected by dieback processes. In subarea B, where the initial outbreak of C. alpina occurred on N slopes, no slope aspect proved to be more resistant to ongoing changes (Figure 5c).
Other notable differences between subarea A and B were observed in the 1984–1991 period, when the intensity of dieback processes increased in subarea A (over 12% of Norway spruce stands transformed into either dead stands or deforested areas) and in subarea B remained low (less than 4% of Norway spruce stands died). Nevertheless, biggest differences between subareas can be seen after 2009. In subarea A after the largest decrease in healthy Norway spruce stands area in the 2003–2009 period, their dieback rate significantly hampered (only 24 ha of Norway spruce stands disappeared in the 2009–2020 period), whereas in subarea B, the dieback rates stayed relatively high (Norway spruce stands area decreased by almost 150 ha between 2009 and 2020). The opposite trend was observed for young forests class (REG), which after 2009 in subarea A was characterized by rapid development, and in subarea B its area extended relatively slowly. Moreover, the process of Norway spruce stands dieback in subarea B was much more fragmented than in subarea A, with numerous patches of standing deadwood and deforested gaps scattered throughout the area.

4.3. Dynamics of Land Cover Classes

The dynamics of LC area changes in the subarea A (the Kudłoń range) in the analyzed time series was closely related to the process of Norway spruce stands dieback. Until 2003, the Dynamics Index (DI, Equation (1)) fluctuated at quite a low level, not exceeding 10% (Table 5). The rapid increase and culmination of change dynamics occurred between 2003 and 2009, when LC changes occurred on almost ⅓ of the total analyzed area. Period 2009–2015 was characterized by only slightly lower dynamics, but its drivers were mainly regeneration processes rather than forest decay. In the last analyzed time period (2015–2020) the DI decreased to the initial low level. During the whole analyzed period, the class characterized by the highest dynamics was the NSD class, followed by the NSH and REG class (Table 6). The NSD class was also the least stable, its mean area where changes did not occur in a single time period was less than 5 ha (area gain from NSH and MXH class, area loss to DEF and REG class, Figure 3). Although characterized by high dynamics, changes in NSH and REG classes in analyzed period were one sided; NSH area was shrinking; and the REG class gained area. Worth mentioning is also a relatively unstable DEF class. It gained area from all classes where changes occurred (MXH, NSH, NSD and REG) and steadily lost its area to the REG class.
The dynamics of changes occurring in subarea B (the Jaworzyna range) until 2015 had an increasing trend, with the exception of period 1997–2003, when small area changes (<10 ha) were recorded (Table 5). A significant increase in change dynamics was first observed in the period 2003–2009, when the largest forest decline occurred. The culmination of DI values occurred in period 2009–2015 when, with the exception of the EBH and MXH classes, the area changes in every class exceeded 40 ha, which resulted in changes on over 30% of subarea B. The last analyzed period was still characterized by high dynamics of LC class changes (changes on over 15% of subarea B). The highest value of the dynamics index on subarea B in the analyzed time period was observed for the NSH class. High values of the dynamics index were also noted for NSD and DEF classes, whereas regeneration class DI was noticeably lower (Table 6), which indicates the dominance of forest dieback processes over regeneration. Similar to subarea A, changes in the NSH class despite its high dynamics were one sided (area loss to NSD, DEF and REG classes). NSD and DEF classes were unstable and gained or lost area to all LC classes where changes occurred. However, in the last period the area of DEF class where changes did not occur spiked over 100 ha, again confirming that dieback processes dynamics was higher than regeneration development.
The comparison of dynamics changes on both subareas (A and B) showed that until 2003 many analogies can be found (Table 5). Dynamics Index (DI) values fluctuated on a relatively low level, so initially, the process of mature Norway spruce stands dieback had low intensity. The exception here is 1984–1987 period, which in subarea A was characterized by DI value almost four times higher than in subarea B. The differences between the two subareas are most pronounced in the years 2003–2020. In the Kudłoń range (subarea A), the culmination of the DI value already occurs in period 2003–2009 and decreases in the following years, while in the Jaworzyna Kamienicka range (subarea B), this culmination occurs 6 years later, in period 2009–2015. In subarea A, after period 2003–2009, the intensity of dieback processes began to hamper, whereas for subarea B, a high rate of spruce dieback was observed until the end of analyzed period. On the other hand, young forests dynamics was noticeably higher in subarea A than in subarea B.

5. Discussion

Obtained results allow us to state that regarding our first research objective, the land cover class that underwent the greatest changes was old-growth Norway spruce stands (NSH), for which the area decreased by 49.53% (−514.95 ha) over the entire analyzed area. The decay of spruce stands initiated a sequence of transformations, in which the next stages were the classes of standing dead spruce stands (NSD), deforested areas (DEF), and finally young forests (REG), all of which have also undergone major area changes. This sequence of transformations can be defined as the process of old-growth Norway spruce stands dieback. Before we proceed with further considerations, it is important to underline that the term “Norway spruce dieback” in this paper is only related to the old-growth spruce stands and cannot be interpreted as a complete decline and loss of the area of Norway spruce forest stands on the test site. Changes in mixed stands (MXH) were marginal, as they provide more favorable conditions for the development of traits that immunize trees for biotic and abiotic factors [53,54]. A very important observation is that at the end of the analyzed period, young forests covered substantial parts of the area where mature spruce stands declined (A: 80.02%; B: 39.41%). Moreover, these values take into consideration only the saplings growing without the upper cover of either dead or green trees canopy, as only such areas were assigned to the REG class. It is known that natural regeneration develops well under both dead and green canopy cover [55]; therefore, we can assume that, especially in subarea B (with still a high concentration of standing deadwood), the area covered by young forests is larger. High dynamics index (DI) values for class REG (A: 20.65%, B 14.16%) show that young forests were characterized by rapid expansion. This suggests that the process of changes in subalpine Norway spruce stands in Gorce National Park can be characterized as a generational transition, rather than a complete decline of spruce stands. The interpretation of high resolution orthophoto sets acquired in 2020, and conducted fieldwork showed that young forests replacing dead stands are dominated by Norway spruce. These results are in line with earlier studies by Loch [34], who determined in 1996 that forest regeneration in the Kudłoń range was dominated by the Norway spruce (88% share), and only the silver fir (5% share) reached a share exceeding 1%. These findings, as well as experiences from the Bavarian Forest [56], provide a basis for confirming our first hypothesis. Despite climate changes unfavorable for subalpine Norway spruce stands, the ecosystem maintained the regeneration capacity. However, to verify the stability of the forest regeneration, a long-term study of new forests appearing on deforested areas is needed, as well as a lapse of time to observe their development and response to various stress factors.
Referring to the second research objective, the dynamics of the defined land cover classes was closely related to the Norway spruce stands dieback processes. The classes with the highest dynamics were the old-growth spruce stands (NSH) and standing dead spruce stands (NSD), which was also the least stable class. The first 25 years of the analyzed period were characterized by low dynamics of changes in land cover classes, but the most interesting period started from 2009, when differences between subareas A and B became pronounced. In subarea A (the Kudłoń range), after the culmination of old-growth spruce stands dieback in 2009, the intensity of these processes decreased, and the expansion of young forests became the dominant change. On the other hand, in subarea B (the Jaworzyna range) after the period of the most intense dieback of spruce stands (2003–2009), their intensity still remained high, and the development of young forests was much less dynamic. Higher intensity of dieback processes in subarea B is also reflected in a higher share of direct transformations from NSH class into DEF class. Slope aspect analysis suggests that Northern aspects providing a more humid and colder microclimate can be beneficial to the resilience of Norway spruce stands (such as in the two last periods in subarea A), but not in a situation of high intensity dieback processes (subarea B). These results confirm the second hypothesis, that subareas A and B were characterized by different dynamics of Norway spruce dieback processes. It is hard to determine which factor is responsible for the differences in dynamics of LC classes between subarea A and B, since there are many biotic (European bark beetle outbreak development dynamics, Norway spruce stands resilience [57,58]), abiotic (topography, windstorms, droughts, mild and wet winters [59]), and anthropogenic (unknown provenance of Norway spruce stands [21]) factors that might have triggered Norway spruce stands transition processes. Research conducted in other areas heavily affected by spruce dieback also show that the influence of a single factor can vary, depending on the genesis of the disturbance (windstorm or bark beetle outbreak [60]). Furthermore, some factors might have site-specific influence on disturbance and dieback intensity, as studies report their different significance in disturbance intensity models (for example slope aspect [61,62]). To fully understand the drivers of the differences in the dynamics of change between subareas A and B, further research is needed.
There are no long-term analyses of spatio-temporal land cover changes in Gorce National Park forests, but the results of this study can be compared with studies conducted for single time frames or dates that overlap with the dates analyzed in this paper. Wężyk and Mansberger [63] assessed the health condition of Norway spruce stands on the slopes of Kudłoń, using a CIR aerial photographs (scale 1:9000) acquired in August 1997, which was also used in this paper. Based on this dataset, we obtained an area of 56.24 ha for DEF and REG classes, which can be compared to the deforested area mapped at the Photogrammetric Station (3D) in their work, which was estimated at 64.73 ha (−8.49 ha difference, the young forests class was not defined in the discussed work and was treated as deforestation). This variation might be the result of different aerial orthophoto generation processes used in both studies and the subjectivity of heads-up digitization of LC class boundaries. Tracking land cover changes in Jaworzyna Kamienicka and Kudłoń ranges using the GEOBIA approach was the subject of a study carried out by Wężyk et al. [40]. Their analysis covered larger area than presented in our paper, but the results also showed high dynamics of forest cover in Gorce National Park in the 1997–2009 period. The main trends of change were the area increase in standing dead forest stands and the expansion of natural regeneration (young forest; REG) on post-decline areas, which concurs with our results. An interesting comparison can be drawn to another Wężyk study [64], which analyzes land cover classes in the Kudłoń range based on CIR aerial orthophotos from 2011. Although 2011 imagery was not used in our study, in 2009 the REG class covered 66.59 ha, and we can see that the area of young forests class in the Kudłoń range 2 years later reached 110.03 ha (+43.44 ha). This shows a quick development of young forests in that area between 2009 and 2011. On the other hand, young forests expansion stagnated in the period 2011–2015 (+13.54 ha).
The issue of disturbances in subalpine Norway spruce stands has been studied across several locations, and one of the better researched areas are Bavarian Forest and Sumava National Parks. Hais et al. [22] studied forest change dynamics using Landsat imagery time series (1985–2007), which showed that forest stands dieback intensity fluctuated during analyzed period, which was also observed in our study in Gorce National Park. However, the use of 30 m Landsat imagery in that study caused an underestimation of the dead stands area, compared to the results obtained from aerial orthophotos interpretation [40]. Highly precise analysis of disturbance effects in Bavarian Forest and Sumava National Parks was presented by Krzystek et al. [39], who used dense Aerial Laser Scanning (ALS) point clouds and aerial orthophotos to map dead trees on a single tree level. Obtained results were characterized by high accuracy (>0.9 overall accuracy) and confirm that ALS data, together with multispectral aerial orthophotos, can become an alternative for traditional forest inventories, enabling time- and cost-effective tools for monitoring of forest health, biomass, and biodiversity. Stych et al. [65] examined the applicability of Landsat satellite-based vegetation indices to determine the impact of disturbances on forests in Sumava and the Low Tatras. Their study proved that in case of disturbances caused by windstorms or bark beetle outbreaks, each driver causes a specific development of disturbance regime, which has different consequences on the forest health and its spectral response. Indices based on the near infrared (NIR) band performed well in detection of windstorm related disturbances, and indices using the short-wave infrared (SWIR) band can be used to determine the intensity of bark beetle gradation. Forest changes and disturbances have also been analyzed for the whole Carpathian ecoregion in the period 1985–2010 [66]. The research found out that the intensity of forest disturbances varied across the study area in the analyzed time period, but generally higher disturbance intensity was observed for the late 1980s and early 1990s. However, in the Czech, Polish and Slovakian Carpathians, an increase in disturbance levels was observed in the last analyzed period (2005–2010), and the relative net change in forest cover for that region was negative. A further continuation of this analysis would provide a valuable insight into forest disturbance patterns and trends in the Carpathian region.
Although in a broader context it is difficult to clearly assess the impact of disturbances on forest stands [3], studies from Bavarian Forest show that disturbances in subalpine Norway spruce stands can have a positive implications for the area’s biodiversity [67]. Standing dead Norway spruce stands, as well as lying deadwood, provide substrate, a habitat for life and breeding, and food for a wide range of insects, plants, birds, mammals, and other organisms [68,69]. Similarly, the change in light conditions resulting from the decay of the forest canopy can have a stimulating effect on biodiversity [70]. Based on these assumptions, we can speculate that changes which occurred in Gorce National Park might foster local biodiversity. Disturbance-related organisms with narrow ecological niches are becoming increasingly rare [68,71], which is why preserving the natural course of stand decay processes in protected areas is important. The non-intervention approach (enforced in the test area with the exception of the part of subarea A in the years 1981–1999) towards the dieback of mature Norway spruce stands has proven successful and should be recommended as optimal [72], especially in protected areas. Experiences from the nearby Beskid Żywiecki and Beskid Śląski mountain ranges [73,74] suggest that disturbed Norway spruce stands after sanitary and salvage logging treatments can have issues with natural regeneration, since they have been deprived of the potential seed bank and favorable substrate in the form of coarse woody debris [73]. Norway spruce stands located in Beskid Żywiecki and Beskid Śląski are known to be of foreign origin due to the extensive logging in 19th century, but in the Gorce mountains, historical records differ in assessing the extent to which forests were exploited in the 18th and 19th centuries [36,75,76]. Nevertheless, subalpine Norway spruce stands at higher elevations (over 1200 m a.s.l.) are reported to be mostly untouched by human activities [77]; therefore, the provenance of Norway spruce growing in the study area can generally be considered local.
Regarding the methodology used in our paper, in the methods section we presented arguments that justified the choice of photointerpretation and heads-up digitization of LC classes in our study. However, the authors are aware of the shortcomings of the applied techniques and that they do not belong to the state-of-the-art methods (GEOBIA). Determining the extent of LC classes with heads-up vectorization is a very time-consuming task that cannot be automated [78,79] and is a highly subjective approach. Even with the help of a photointerpretation key, the results can be impossible to reproduce for another researcher. Moreover, heads-up digitization cannot be easily transferred to another study area, as opposed to the set of classification rules in a pixel- or object-based approach. Automatic classification methods based on a high resolution digital aerial orthophoto set were successfully applied to monitor LC changes also for our study area [40]. Nevertheless, we believe that due to the deficiencies of the archive datasets used in our study and disparity of the datasets’ characteristics, applied methods were justified.

6. Conclusions

Despite shortcomings, archival aerial photos provide a valuable information about the environment in the past and can be utilized in 4D GIS (3D + time domain) spatial analyses. Our study showed that subalpine Norway spruce stands in Gorce National Park in the last four decades have experienced complex changes, the most dynamic of which is the process of old-growth stands dieback. Norway spruce stands in the Kudłoń and Jaworzyna range lost almost half of their initial area in the analyzed 43 years. The dieback of the old-growth spruce stands in analyzed subareas was characterized by a different dynamics regime. The dynamics of this process in subarea A decreased significantly after 2009, and regeneration processes became more vigorous. In subarea B the dieback dynamics remained high, and the development of forest regeneration was relatively slower.
However, 23 years after the first detection (in 1997) of the forest regeneration class, young forests covered almost 17% of the study site, which was 51% of the area where Norway spruce stands have died. Despite the ongoing dieback of old-growth Norway spruce stands, surprisingly, the tree species composition of young forests is still dominated by Norway spruce. We proved in our study that despite unfavorable climate changes, the subalpine Norway spruce ecosystem in Gorce National Park is still able to maintain the self-regeneration capacity, showing its strong surviving strategy in this region. Of course, given the various climate change related phenomena, it is not clear how long these forests will sustain this ability. Therefore, in order to be able to carry out comprehensive and detailed analyses of trends and changes that take place in the environment, it is crucial to monitor them regularly with high resolution, multispectral digital aerial imageries and other state-of-the-art remote sensing technologies. These include LiDAR (Light Detection And Ranging), Airborne Laser Scanning (ALS), and Unmanned Laser Scanning (ULS), which provide 3D information enabling analyses of forest vertical structure, canopy cover (defoliation) trees height, and detection of young forests. In such long-term studies, it is also important to use very high resolution satellite imagery (GSD <0.5 m) with a quick revisit time, which allows near real-time change.

Author Contributions

Conceptualization, W.K. and P.W.; methodology, W.K. and P.W.; software, W.K.; validation, W.K. and P.W.; formal analysis, P.W.; investigation, W.K.; resources, W.K. and P.W.; data curation, W.K.; writing—original draft preparation, W.K.; writing—review and editing, P.W.; visualization, W.K.; supervision, P.W.; project administration, W.K.; funding acquisition, P.W. All authors have read and agreed to the published version of the manuscript.

Funding

This research received no external funding.

Data Availability Statement

The data supporting the findings of this study are available on request from the corresponding author.

Acknowledgments

We would like to thank the Directorate and Department of Research and Education of Gorce National Park for providing data used in the research.

Conflicts of Interest

The authors declare no conflict of interest.

Appendix A

Maps of vectorized land cover classes for each analyzed year, presented separately for subarea A (the Kudłoń range) and B (the Jaworzyna range).
Figure A1. Land cover classes in subarea A (the Kudłoń range) in the analyzed time period.
Remotesensing 15 00951 g0a1
Figure A2. Land cover classes in subarea B (the Jaworzyna range) in the analyzed time period.
Remotesensing 15 00951 g0a2

References

  1. White, P.S.; Pickett, S.T.A. Natural Disturbance and Patch Dynamics: An Introduction. In The Ecology of Natural Disturbance and Patch Dynamics; Elsevier: Amsterdam, The Netherlands, 1985; pp. 3–13. [Google Scholar]
  2. Seidl, R.; Thom, D.; Kautz, M.; Martin-Benito, D.; Peltoniemi, M.; Vacchiano, G.; Wild, J.; Ascoli, D.; Petr, M.; Honkaniemi, J.; et al. Forest Disturbances under Climate Change. Nat. Clim. Chang. 2017, 7, 395–402. [Google Scholar] [CrossRef]
  3. Viljur, M.; Abella, S.R.; Adámek, M.; Alencar, J.B.R.; Barber, N.A.; Beudert, B.; Burkle, L.A.; Cagnolo, L.; Campos, B.R.; Chao, A.; et al. The Effect of Natural Disturbances on Forest Biodiversity: An Ecological Synthesis. Biol. Rev. 2022, 97, 1930–1947. [Google Scholar] [CrossRef]
  4. Schurman, J.S.; Trotsiuk, V.; Bače, R.; Čada, V.; Fraver, S.; Janda, P.; Kulakowski, D.; Labusova, J.; Mikoláš, M.; Nagel, T.A.; et al. Large-Scale Disturbance Legacies and the Climate Sensitivity of Primary Picea abies Forests. Glob. Chang. Biol. 2018, 24, 2169–2181. [Google Scholar] [CrossRef]
  5. Seidl, R.; Schelhaas, M.-J.; Rammer, W.; Verkerk, P.J. Increasing Forest Disturbances in Europe and Their Impact on Carbon Storage. Nat. Clim. Chang. 2014, 4, 806–810. [Google Scholar] [CrossRef]
  6. Janda, P.; Trotsiuk, V.; Mikoláš, M.; Bače, R.; Nagel, T.A.; Seidl, R.; Seedre, M.; Morrissey, R.C.; Kucbel, S.; Jaloviar, P.; et al. The Historical Disturbance Regime of Mountain Norway Spruce Forests in the Western Carpathians and Its Influence on Current Forest Structure and Composition. For. Ecol. Manag. 2017, 388, 67–78. [Google Scholar] [CrossRef] [PubMed]
  7. Albrich, K.; Rammer, W.; Thom, D.; Seidl, R. Trade-Offs between Temporal Stability and Level of Forest Ecosystem Services Provisioning under Climate Change. Ecol. Appl. 2018, 28, 1884–1896. [Google Scholar] [CrossRef]
  8. Gratzer, G.; Alemayehu Duguma, L.; Kohler, T.; Maselli, D.; Romeo, R. Mountain Forests in a Changing World; FAO/MPS and SDC: Rome, Italy, 2011. [Google Scholar]
  9. Szewczyk, J.; Szwagrzyk, J.; Muter, E. Tree Growth and Disturbance Dynamics in Oldgrowth Subalpine Spruce Forests of the Western Carpathians. Can. J. For. Res. 2011, 41, 938–944. [Google Scholar] [CrossRef]
  10. Leuschner, C.; Ellenberg, H. Ecology of Central European Forests: Vegetation Ecology of Central Europe; Springer International Publishing: Cham, Switzerland, 2017; Volume 1, ISBN 978-3-319-43042-3. [Google Scholar]
  11. Prinz, B. Major Hypotheses and Factors Causes of Forest Damage in Europe. Environment 1987, 29, 11–37. [Google Scholar] [CrossRef]
  12. Blank, L.W. A New Type of Forest Decline in Germany. Nature 1985, 314, 311–314. [Google Scholar] [CrossRef]
  13. Holeksa, J. Rozpad Drzewostanu i Odnowienie Świerka a Struktura i Dynamika Karpackiego Boru Górnoreglowego. Monogr. Bot. 1998, 82, 1–209. [Google Scholar] [CrossRef] [Green Version]
  14. Rehfuess, K.E. On the Causes of Decline of Norway Spruce (Picea abies Karst.) in Central Europe. Soil Use Manag. 1985, 1, 30–32. [Google Scholar] [CrossRef]
  15. Schütt, P.; Koch, W.; Blaschke, H.; Land, K.J.; Schluck, H.J.; Summerer, H. So Stirbt Der Wald. Schadbilder Und Krankheitsverlauf; BLV-Verlag: Munich, Germany, 1983. [Google Scholar]
  16. Manion, P. Tree Disease Concepts; Prentice-Hall, Inc.: Englewood Cliffs, NJ, USA, 1981. [Google Scholar]
  17. Bałazy, R. Forest Dieback Process in the Polish Mountains in the Past and Nowadays—Literature Review on Selected Topics. Folia For. Pol. 2020, 62, 184–198. [Google Scholar] [CrossRef]
  18. Synek, M.; Janda, P.; Mikoláš, M.; Nagel, T.A.; Schurman, J.S.; Pettit, J.L.; Trotsiuk, V.; Morrissey, R.C.; Bače, R.; Čada, V.; et al. Contrasting Patterns of Natural Mortality in Primary Picea Forests of the Carpathian Mountains. For. Ecol. Manag. 2020, 457, 117734. [Google Scholar] [CrossRef]
  19. Jandl, R. Climate-Induced Challenges of Norway Spruce in Northern Austria. Trees For. People 2020, 1, 100008. [Google Scholar] [CrossRef]
  20. Honkaniemi, J.; Rammer, W.; Seidl, R. Norway Spruce at the Trailing Edge: The Effect of Landscape Configuration and Composition on Climate Resilience. Landsc. Ecol. 2020, 35, 591–606. [Google Scholar] [CrossRef]
  21. Jansen, S.; Konrad, H.; Geburek, T. The Extent of Historic Translocation of Norway Spruce Forest Reproductive Material in Europe. Ann. For. Sci. 2017, 74, 56. [Google Scholar] [CrossRef]
  22. Hais, M.; Langhammer, J.; Jirsová, P.; Dvořák, L. Dynamics of Forest Disturbance in Central Part of the Šumava Mountains between 1985 and 2007 Based on Landsat TM/ETM+ Satellite Data. Acta Univ. Carol. Geogr. 2008, 43, 53–62. [Google Scholar] [CrossRef]
  23. van der Knaap, W.O.; van Leeuwen, J.F.N.; Fahse, L.; Szidat, S.; Studer, T.; Baumann, J.; Heurich, M.; Tinner, W. Vegetation and Disturbance History of the Bavarian Forest National Park, Germany. Veg. Hist. Archaeobot. 2019, 29, 277–295. [Google Scholar] [CrossRef]
  24. Obladen, N.; Dechering, P.; Skiadaresis, G.; Tegel, W.; Keßler, J.; Höllerl, S.; Kaps, S.; Hertel, M.; Dulamsuren, C.; Seifert, T.; et al. Tree Mortality of European Beech and Norway Spruce Induced by 2018-2019 Hot Droughts in Central Germany. Agric. For. Meteorol. 2021, 307, 108482. [Google Scholar] [CrossRef]
  25. Krejza, J.; Cienciala, E.; Světlík, J.; Bellan, M.; Noyer, E.; Horáček, P.; Štěpánek, P.; Marek, M.V. Evidence of Climate-Induced Stress of Norway Spruce along Elevation Gradient Preceding the Current Dieback in Central Europe. Trees 2020, 35, 103–119. [Google Scholar] [CrossRef]
  26. Stereńczak, K.; Mielcarek, M.; Kamińska, A.; Kraszewski, B.; Piasecka, Ż.; Miścicki, S.; Heurich, M. Influence of Selected Habitat and Stand Factors on Bark Beetle Ips typographus (L.) Outbreak in the Białowieża Forest. For. Ecol. Manag. 2020, 459, 117826. [Google Scholar] [CrossRef]
  27. Zajączkowski, G.; Jabłoński, M.; Jabłoński, T.; Szmidla, H.; Kowalska, A.; Małachowska, J.; Piwnicki, J. Raport o Stanie Lasów w Polsce 2020; PGL Lasy Państwowe: Warszawa, Poland, 2020; pp. 1–119. [Google Scholar]
  28. Koprowski, M.; Zielski, A. Dendrochronology of Norway Spruce (Picea abies (L.) Karst.) from Two Range Centres in Lowland Poland. Trees 2006, 20, 383–390. [Google Scholar] [CrossRef]
  29. Jurek, E.; Olszowska, G.; Olszowski, J. Zamieranie Drzewostanów Świerkowych w Rejonie Gór Izerskich. Sylwan 1983, 127, 13–20. [Google Scholar]
  30. Jarocińska, A.; Zagajewski, B.; Ochtyra, A.; Marcinkowska, A.; Kycko, M.; Pabjanek, P. Przebieg Klęski Ekologicznej w Karkonoszach i Górach Izerskich Na Podstawie Analizy Zdjęć Satelitarnych Landsat. In Proceedings of the 25 lat po klęsce ekologicznej w Karkonoszach i Górach Izerskich—Obawy a Rzeczywistość; Knapik, R., Ed.; Karkonoski Park Narodowy: Jelenia Góra, Poland, 2014; pp. 47–62. [Google Scholar]
  31. Ochtyra, A. Forest Disturbances in Polish Tatra Mountains for 1985–2016 in Relation to Topography, Stand Features, and Protection Zone. Forests 2020, 11, 579. [Google Scholar] [CrossRef]
  32. Capecki, Z. Masowe Wystąpienie Zasnui Wysokogórskiej w Gorcach. Sylwan 1982, 126, 41–50. [Google Scholar]
  33. Honowski, J.; Huflejt, T. O Występowaniu Zasnui Wysokogórskiej Cephalcia falleni (Dalm.), w Gorczańskim Parku Narodowym. Pol. Pismo Entomol. 1988, 58, 433–445. [Google Scholar]
  34. Loch, J.; Wężyk, P.; Małek, S.; Pająk, M. Natural Regeneration versus Tree Planting in the Subalpine Spruce Forest Plagiothecio-Piceetum tatricum of the Gorce National Park (Southern Poland). Nat. Conserv. 2001, 58, 5–15. [Google Scholar]
  35. Grodzki, W.; Loch, J.; Armatys, P. Występowanie Kornika Drukarza Ips typographus L. w Uszkodzonych Przez Wiatr Drzewostanach Świerkowych Masywu Kudłonia w Gorczańskim Parku Narodowym Occurrence of Ips typographus L. in Wind-Damaged Norway Spruce Stands of Kudłoń Massif in the Gorce Natio. Ochr. Beskidów Zachodnich 2006, 1, 125–137. [Google Scholar]
  36. Chwistek, K. Zmiany Składu Gatunkowego i Struktury Drzewostanów Gorczańskiego Parku Narodowego w Latach 1992–2007. Ochr. Beskidów Zachodnich 2010, 3, 79–92. [Google Scholar]
  37. O’Brien, L.; Schuck, A.; Fraccaroli, C.; Pötzelsberger, E.; Winkel, G.; Lindner, M. Protecting Old-Growth Forests in Europe—A Review of Scientific Evidence to Inform Policy Implementation; European Forest Institute: Joensuu, Finland, 2021. [Google Scholar]
  38. Loch, J. Świerczyny górnoreglowe Gorczańskiego Parku Narodowego-stan zachowania i dynamika zmian. Probl. Zagospod. Ziem Górskich 2002, 48, 185–193. [Google Scholar]
  39. Krzystek, P.; Serebryanyk, A.; Schnörr, C.; Červenka, J.; Heurich, M. Large-Scale Mapping of Tree Species and Dead Trees in Sumava National Park and Bavarian Forest National Park Using Lidar and Multispectral Imagery. Remote Sens. 2020, 12, 661. [Google Scholar] [CrossRef]
  40. Wężyk, P.; Hawryło, P.; Janus, B.; Weidenbach, M.; Szostak, M. Forest Cover Changes in Gorce NP (Poland) Using Photointerpretation of Analogue Photographs and GEOBIA of Orthophotos and NDSM Based on Image-Matching Based Approach. Eur. J. Remote Sens. 2018, 51, 501–510. [Google Scholar] [CrossRef]
  41. Hansen, M.C.; Potapov, P.V.; Moore, R.; Hancher, M.; Turubanova, S.A.; Tyukavina, A.; Thau, D.; Stehman, S.V.; Goetz, S.J.; Loveland, T.R.; et al. High-Resolution Global Maps of 21st-Century Forest Cover Change. Science 2013, 342, 850–853. [Google Scholar] [CrossRef]
  42. Senf, C.; Seidl, R. Mapping the Forest Disturbance Regimes of Europe. Nat. Sustain. 2021, 4, 63–70. [Google Scholar] [CrossRef]
  43. Meigs, G.W.; Kennedy, R.E.; Cohen, W.B. A Landsat Time Series Approach to Characterize Bark Beetle and Defoliator Impacts on Tree Mortality and Surface Fuels in Conifer Forests. Remote Sens. Environ. 2011, 115, 3707–3718. [Google Scholar] [CrossRef]
  44. Migas-Mazur, R.; Kycko, M.; Zwijacz-Kozica, T.; Zagajewski, B. Assessment of Sentinel-2 Images, Support Vector Machines and Change Detection Algorithms for Bark Beetle Outbreaks Mapping in the Tatra Mountains. Remote Sens. 2021, 13, 3314. [Google Scholar] [CrossRef]
  45. Miczyński, J. Klimat Rządzi Przyrodą. In Gorczański Park Narodowy. Przyroda i Krajobraz pod Ochroną; Gorczański Park Narodowy: Poręba Wielka, Poland, 2015; pp. 35–38. [Google Scholar]
  46. Protection Plan of Gorce National Park, Journal of Laws of the Republic of Poland, Item 579. 2022; pp. 4–5. Available online: https://isap.sejm.gov.pl/isap.nsf/download.xsp/WDU20220000579/O/D20220579.pdf (accessed on 6 February 2023).
  47. Tomasiewicz, J. Bory Regla Górnego. In Gorczański Park Narodowy. Przyroda i Krajobraz pod Ochroną; Gorczański Park Narodowy: Poręba Wielka, Poland, 2015; pp. 82–89. [Google Scholar]
  48. European Council. Council Directive 92/43/EEC of 21 May 1992 on the Conservation of Natural Habitats and of Wild Fauna and Flora 1992. Available online: https://eur-lex.europa.eu/legal-content/EN/TXT/?uri=CELEX%3A01992L0043-20130701 (accessed on 6 February 2023).
  49. European Parliament and the Council Directive 2009/147/EC of the European Parliament and of the Council of 30 November 2009 on the Conservation of Wild Birds 2009. Available online: https://eur-lex.europa.eu/legal-content/EN/TXT/?uri=CELEX%3A02009L0147-20190626 (accessed on 6 February 2023).
  50. QGIS Association QGIS Geographic Information System 2020. Available online: https://qgis.org/site/ (accessed on 6 February 2023).
  51. R Core Team. R: A Language and Environment for Statistical Computing; R Core Team: Vienna, Austria, 2022. [Google Scholar]
  52. Wickham, H. ggplot2: Elegant Graphics for Data Analysis; Springer: New York, NY, USA, 2016; ISBN 978-3-319-24277-4. [Google Scholar]
  53. Hlásny, T.; Zimová, S.; Merganičová, K.; Štěpánek, P.; Modlinger, R.; Turčáni, M. Devastating Outbreak of Bark Beetles in the Czech Republic: Drivers, Impacts, and Management Implications. For. Ecol. Manag. 2021, 490, 119075. [Google Scholar] [CrossRef]
  54. Faccoli, M.; Bernardinelli, I. Composition and Elevation of Spruce Forests Affect Susceptibility to Bark Beetle Attacks: Implications for Forest Management. Forests 2014, 5, 88–102. [Google Scholar] [CrossRef]
  55. Jonášová, M.; Matějková, I. Natural Regeneration and Vegetation Changes in Wet Spruce Forests after Natural and Artificial Disturbances. Can. J. For. Res. 2007, 37, 1907–1914. [Google Scholar] [CrossRef]
  56. Zeppenfeld, T.; Svoboda, M.; DeRose, R.J.; Heurich, M.; Müller, J.; Čížková, P.; Starý, M.; Bače, R.; Donato, D.C. Response of Mountain Picea abies Forests to Stand-Replacing Bark Beetle Outbreaks: Neighbourhood Effects Lead to Self-Replacement. J. Appl. Ecol. 2015, 52, 1402–1411. [Google Scholar] [CrossRef]
  57. Kausrud, K.; Økland, B.; Skarpaas, O.; Grégoire, J.-C.; Erbilgin, N.; Stenseth, N. Chr. Population Dynamics in Changing Environments: The Case of an Eruptive Forest Pest Species. Biol. Rev. 2012, 87, 34–51. [Google Scholar] [CrossRef] [PubMed]
  58. Jakuš, R.; Edwards-Jonášová, M.; Cudlín, P.; Blaženec, M.; Ježík, M.; Havlíček, F.; Moravec, I. Characteristics of Norway Spruce Trees (Picea abies) Surviving a Spruce Bark Beetle (Ips typographus L.) Outbreak. Trees 2011, 25, 965–973. [Google Scholar] [CrossRef]
  59. Seidl, R.; Müller, J.; Hothorn, T.; Bässler, C.; Heurich, M.; Kautz, M. Small Beetle, Large-Scale Drivers: How Regional and Landscape Factors Affect Outbreaks of the European Spruce Bark Beetle. J. Appl. Ecol. 2016, 53, 530–540. [Google Scholar] [CrossRef] [PubMed]
  60. Klopcic, M.; Poljanec, A.; Gartner, A.; Boncina, A. Factors Related to Natural Disturbances in Mountain Norway Spruce (Picea abies) Forests in the Julian Alps. Écoscience 2009, 16, 48–57. [Google Scholar] [CrossRef]
  61. Bałazy, R.; Hycza, T.; Kamińska, A.; Osińska-Skotak, K. Factors Affecting the Health Condition of Spruce Forests in Central European Mountains-Study Based on Multitemporal RapidEye Satellite Images. Forests 2019, 10, 943. [Google Scholar] [CrossRef]
  62. Despres, T.; VaItkov, L.; Bace, R.; Cada, V.; Janda, P.; Mikolas, M.; Schurman, J.S.; Trotsiuk, V.; Svoboda, M. Past Disturbances and Intraspecific Competition as Drivers of Spatial Pattern in Primary Spruce Forests. Ecosphere 2017, 8, e02037. [Google Scholar] [CrossRef]
  63. Wężyk, P.; Mansberger, R. Techniki Fotogrametrii Cyfrowej i GIS w Ocenie Degradacji Drzewostanów Świerkowych w Masywie Kudłonia w Gorcach. Arch. Fotogram. Kartogr. Teledetekcji 1998, 8, 21. [Google Scholar]
  64. Wężyk, P.; Mucha, M.; Szostak, M. Mapa Użytkowania i Pokrycia Fragmentu Gorczańskiego Parku Narodowego Opracowana w Oparciu o Fotointerpretację Cyfrowych Ortofotomap Lotniczych CIR z 2011 Roku. Rocz. Geomatyki 2017, 15, 119–131. [Google Scholar]
  65. Stych, P.; Lastovicka, J.; Hladky, R.; Paluba, D. Evaluation of the Influence of Disturbances on Forest Vegetation Using the Time Series of Landsat Data: A Comparison Study of the Low Tatras and Sumava National Parks. ISPRS Int. J. Geo-Inf. 2019, 8, 71. [Google Scholar] [CrossRef] [Green Version]
  66. Griffiths, P.; Kuemmerle, T.; Baumann, M.; Radeloff, V.C.; Abrudan, I.V.; Lieskovsky, J.; Munteanu, C.; Ostapowicz, K.; Hostert, P. Forest Disturbances, Forest Recovery, and Changes in Forest Types across the Carpathian Ecoregion from 1985 to 2010 Based on Landsat Image Composites. Remote Sens. Environ. 2014, 151, 72–88. [Google Scholar] [CrossRef]
  67. Bässler, C.; Seifert, L.; Müller, J. The BIOKLIM Project in the National Park Bavarian Forest: Lessons from a Biodiversity Survey. Silva Gabreta 2015, 21, 81–93. [Google Scholar]
  68. Tanona, M.; Czarnota, P. Natural Disturbances of the Structure of Norway Spruce Forests in Europe and Their Impact on the Preservation of Epixylic Lichen Diversity: A Review. Ecol. Quest. 2019, 30, 7–17. [Google Scholar] [CrossRef]
  69. Thorn, S.; Bässler, C.; Svoboda, M.; Müller, J. Effects of Natural Disturbances and Salvage Logging on Biodiversity—Lessons from the Bohemian Forest. For. Ecol. Manag. 2017, 388, 113–119. [Google Scholar] [CrossRef]
  70. Kulakowski, D.; Seidl, R.; Holeksa, J.; Kuuluvainen, T.; Nagel, T.A.; Panayotov, M.; Svoboda, M.; Thorn, S.; Vacchiano, G.; Whitlock, C.; et al. A Walk on the Wild Side: Disturbance Dynamics and the Conservation and Management of European Mountain Forest Ecosystems. For. Ecol. Manag. 2017, 388, 120–131. [Google Scholar] [CrossRef] [PubMed]
  71. Nagel, T.A.; Zenner, E.K.; Brang, P. Research in Old-Growth Forests and Forest Reserves: Implications for Integrated Forest Management. In Integrative Approaches as an Opportunity for the Conservation of Forest Biodiversity; Kraus, D., Krumm, F., Eds.; European Forest Institute: Joensuu, Finland, 2013; pp. 44–50. ISBN 978-952-5980-07-3. [Google Scholar]
  72. Nováková, M.H.; Edwards-Jonášová, M. Restoration of Central-European Mountain Norway Spruce Forest 15 Years after Natural and Anthropogenic Disturbance. For. Ecol. Manag. 2015, 344, 120–130. [Google Scholar] [CrossRef]
  73. Zielonka, T. When Does Dead Wood Turn into a Substrate for Spruce Replacement? J. Veg. Sci. 2006, 17, 739–746. [Google Scholar] [CrossRef]
  74. Małek, S.; Barszcz, J.; Majsterkiewicz, K. Changes in the Threat of Spruce Stand Disintegration in the Beskid Śla̧ski and Żywiecki Mts. in the Years 2007-2010. J. For. Sci. 2012, 58, 519–529. [Google Scholar] [CrossRef]
  75. Jarosz, S. Badania Geograficzno-Leśne w Gorcach. Pract. Rol.-Śne 1935, 16, 1–125. [Google Scholar]
  76. Chwistek, K. Historia Lasów i Leśnictwa w Gorcach. Wierchy 2002, 68, 135–160. [Google Scholar]
  77. Świerz-Zaleski, T. Rezerwat Leśny w Gorcach Imienia Władysława Orkana. Ochr. Przyr. 1930, 10, 54–58. [Google Scholar]
  78. Lang, S.; Schöpfer, E.; Langanke, T. Combined Object-Based Classification and Manual Interpretation–Synergies for a Quantitative Assessment of Parcels and Biotopes. Geocarto Int. 2009, 24, 99–114. [Google Scholar] [CrossRef]
  79. Blaschke, T.; Hay, G.J.; Kelly, M.; Lang, S.; Hofmann, P.; Addink, E.; Queiroz Feitosa, R.; van der Meer, F.; van der Werff, H.; van Coillie, F.; et al. Geographic Object-Based Image Analysis—Towards a New Paradigm. ISPRS J. Photogramm. Remote Sens. 2014, 87, 180–191. [Google Scholar] [CrossRef] [PubMed] [Green Version]
Figure 1. The location of the study area in Gorce National Park. Subarea A (the Kudłoń range) in the northern part and subarea B (the Jaworzyna Kamienicka range) in the southern part.
Remotesensing 15 00951 g001
Figure 2. A photointerpretation key developed for defined LC classes for three types of color composite orthophoto imagery used in the study. LC class abbreviations: DEF: deforested areas with fallen deadwood, forest gaps; REG: young forests on post-decline areas; NSD: standing, dead and severely damaged groups of Norway spruce trees; NSH: mature, healthy forest stands dominated by the Norway spruce; MXH mature, healthy mixed forest stands; EBH: healthy, forest stands dominated by the European beech.
Remotesensing 15 00951 g002
Figure 3. LC classes conversion matrix in subarea A (the Kudłoń range) for analyzed time periods. Data represented with red bars was logarithmically transformed (left y axis), changes represented with blue bars are shown in hectares (right y axis).
Remotesensing 15 00951 g003
Figure 4. LC classes conversion matrix in subarea B (the Jaworzyna range) for analyzed time periods. Data represented with red bars was logarithmically transformed (left y axis), changes represented with blue bars are shown in hectares (right y axis).
Remotesensing 15 00951 g004
Figure 5. LC classes area in defined (a) slope classes (b) elevation zones (c) slope aspect classes in subarea A (the Kudłoń range) and subarea B (the Jaworzyna range). LC class abbreviations: REG: young forests on post-decline areas; DEF: deforested areas with fallen deadwood, forest gaps; NSD: standing, dead and severely damaged groups of Norway spruce trees; NSH: mature, healthy forest stands dominated by the Norway spruce; MXH mature, healthy mixed forest stands.
Remotesensing 15 00951 g005
Table 1. A list of aerial orthophoto sets (B&W—Black and White; CIR—Color Infrared; RGB—Red, Green, Blue) used in the study. Datasets marked with * in the source column were generated from scanned copies of aerial photos.
Year of AcquisitionSpectral CompositionGround Sampling Distance [m]Source
1977B&W0.50GNP archive *
1987B&W0.75GNP archive *
1997CIR0.25GNP archive *
2003B&W0.25GUGiK
2009RGB0.25GUGiK
2015RGB and CIR0.25GUGiK
2020RGB and CIR0.05GNP archive
Table 2. LC classes defined in the study with their code and description.
LC Class CodeDescription
NSHMature, healthy forest stands dominated by the Norway spruce.
EBHHealthy, forest stands dominated by the European beech.
MXHMature, healthy mixed forest stands, typically European beech-
Norway spruce, European beech-silver fir, or silver fir-Norway spruce mixtures, with sycamore (Acer pseudoplatanus L.) and rowan (Sorbus aucuparia L.) admixtures.
NSDAreas with standing, dead and severely damaged groups of Norway spruce trees.
DEFDeforested areas with fallen deadwood, forest gaps.
REGYoung forests on post-forest decline areas.
Table 3. Changes in the area of LC classes relative to the previously analyzed date in subarea A. *—no change was observed, **—class not detected.
LC Class1977–19841984–19871987–19911991–19971997–20032003–20092009–20152015–2020Total Changes Compared to 1977
[ha]
EBH*******−0.02−0.02
MXH***−2.18−0.11−11.230.600.66−12.26
NSH−6.68−29.20−16.16−8.70−11.00−88.87−18.33−6.26−185.21
NSD4.9814.146.73−19.16−1.9380.27−62.13−14.908.01
REG******16.8818.5231.1956.9924.86148.43
DEF1.7015.069.4313.16−5.49−11.3522.87−4.3541.04
Table 4. Change in the area of LC classes relative to the previously analyzed date in subarea B. *—no change was observed, **—class not detected.
LC Class1977–19841984–19871987–19911991–19971997–20032003–20092009–20152015–2020Total Changes Compared to 1977
[ha]
EBH********0.0
MXH0.00.00.0−1.44−0.79−22.250.681.44−22.35
NSH−7.53−10.07−16.09−33.93−3.02−111.05−89.85−58.20−329.74
NSD7.266.966.12−1.85−6.52104.01−53.59−15.1447.25
REG******18.313.2825.1049.7033.55129.94
DEF0.273.149.9718.927.044.2093.0738.34174.95
Table 5. Dynamics Index of analyzed time periods in subareas A—the Kudłoń and B—the Jaworzyna range.
1977–19841984–19871987–19911991–19971997–20032003–20092009–20152015–2020
[%]
Subarea A—
Kudłoń
1.868.134.508.365.1531.0122.397.10
Subarea B—
Jaworzyna
1.642.203.518.112.2529.0531.2615.98
Table 6. The Dynamics Index of defined LC classes in subareas A—the Kudłoń and B—the Jaworzyna range. LC class abbreviations: EBH: healthy, forest stands dominated by the European beech; MXH mature, healthy mixed forest stands; NSH: mature, healthy forest stands dominated by the Norway spruce; NSD: standing, dead and severely damaged groups of Norway spruce trees; REG: young forests on post-decline areas; DEF: deforested areas with fallen deadwood, forest gaps.
EBHMXHNSHNSDREGDEF
[%]
Subarea A—
Kudłoń
0.002.0525.7728.4120.6511.61
Subarea B—
Jaworzyna
0.002.9035.9321.9514.1619.06
Disclaimer/Publisher’s Note: The statements, opinions and data contained in all publications are solely those of the individual author(s) and contributor(s) and not of MDPI and/or the editor(s). MDPI and/or the editor(s) disclaim responsibility for any injury to people or property resulting from any ideas, methods, instructions or products referred to in the content.

