Technical Note

Baseline Assessment of Ecological Quality Index (EQI) of the Marine Coastal Habitats of Tonga Archipelago: Application for Management of Remote Regions in the Pacific

1
ENEA, Marine Environment Research Centre, Pozzuolo di Lerici, Lerici, 19032 La Spezia, Italy
2
ENEA, Models and Technologies for Risks Reduction Division, 40129 Bologna, Italy
3
MEIDECC—Ministry of Meteorology, Energy, Information, Disaster Management, Environment, Climate Change and Communications, Nuku’alofa 00100, Tonga
*
Author to whom correspondence should be addressed.
Remote Sens. 2023, 15(4), 909; https://doi.org/10.3390/rs15040909
Submission received: 15 December 2022 / Revised: 1 February 2023 / Accepted: 2 February 2023 / Published: 7 February 2023

Abstract

:
The loss of coral habitats and associated biodiversity have direct effects both on the physical dynamics of the coast and on natural resources, threatening the survival of local populations. Conservative actions, such as the creation of new Marine Protected Areas, are urgent measures needed to face climate change. Managers need fast and simple methods to evaluate marine habitats for planning conservation areas. Here, we present the application of an Ecological Quality Index (EQI), developed for regional-scale habitat maps of the Atlas of the Marine Coastal Habitats of the Kingdom of Tonga, by processing Copernicus Sentinel-2 imagery. Both the habitat mapping classification and the EQI application were focused on the importance of coral reef, seagrass and mangrove habitats, both as natural defense and sustenance for the local populations. Twelve main Pacific reef habitats were evaluated through a three-level EQI score assigned to six parameters: nursery ground, connectivity, species reservoir, fish attraction, biodiversity and primary production. The EQI was integrated into a developed georeferenced database associated to the QGIS software providing the ability to identify on the maps the area of interest and the associated habitats, and to quantify their ecological relevance. The EQI is proposed as a tool that can offer to stakeholders and environmental managers a simple and direct indicator of the value of the marine coastal environment. The index may be handled for management purposes of vast areas with remote and uninhabited islands.

1. Introduction

Marine habitat mapping is a fundamental tool used for the knowledge and management of marine coastal environments. Among the regional-scale approaches, habitat maps derived from satellite images provide the coverage of large areas in remote and uninhabited regions. This is extremely useful for the control and monitoring of vast archipelagos with scattered islands as in the Pacific Ocean. Here, governments face natural disasters, such as tsunamis, volcanic eruptions, hurricanes and floods, which have increased their intensity in recent years owing to the effects of climate change. Natural disasters may also be due to coral bleaching or to the outbreaks of alien or local species, such as the coral-eating crown-of-thorns starfish (COTS) Acanthaster sp., which has contributed to a coral cover decrease [1].
In tropical marine environments, remote sensing reaches its greatest effectiveness in the submerged environment due to the transparency of the waters. Satellite images show the extent of the coastal communities to be recognized and quantified, in some cases up to a depth of 30 m. Among the most important marine communities identified with remote sensing, particular attention is paid to coral reefs, seagrass meadows and mangrove forests. These marine communities are fundamental not only for maintaining the balance of the coasts [2] and their natural defense from storms or flooding events [3] but also for their biodiversity, which guarantees the survival of local populations whose most important resource is fishing [4]. Fishing activity, which is vital for people living on the few islands of vast archipelagos, may be locally endangered due to the illegal exploitation or excessive collection of species, such as corals, sea cucumbers, fish and mollusks [5,6]. To counter these damaging activities, Pacific communities have launched multi-year projects to safeguard their resources and encourage the development of marine spatial plans (MSPs). MSPs have, among their priorities, the establishment of marine-protected areas and the sensitization of local populations by the involvement of people in activities, such as the replanting of corals or mangroves, and the promotion of tourism activities of low impact, such as snorkeling, whale watching and diving [7,8,9,10,11].
To support these development projects, remote sensing and marine habitat mapping are extremely effective tools for providing managers with information on the entire territory of the state, including the remote and uninhabited islands and coral banks that prove to be the richer in species, and hotspots for maintaining biodiversity and pristine habitats in the Pacific [12].
Marine habitat mapping evolved in this last decade when new constellations of satellites with new sensors and higher spatial resolution made it possible to increase the collections of images begun in the 1970s with the launch of satellites dedicated to marine investigation, such as the Landsat [13]. Today, Sentinel 1, 2 and 3 have provided access to free repositories of images and dedicated software, increasing enormously the studies on marine coastal habitats. Moreover, the joint action of international bodies and private foundations have contributed to the publications of digital coral reef atlases. The Atlas of the ‘Millennium Coral Reef Mapping Project’ conducted in 2003–2004 was the first attempt to provide a large-scale mapping of the world’s coral reefs using Landsat images [14]. The Millennium Project was designed to assess the surface of modern reefs worldwide; to do so, a classification scheme based on 126 hierarchical classes, mainly geomorphologic classes, was developed [15].
In 2013, the Khaled bin Sultan Living Oceans Foundation (KSLOF) conducted the Global Reef Expedition (GRE) to evaluate the health status of 13 coral reef locations in the world. High-resolution bathymetric maps and thematic habitat maps collecting 16 marine habitat classes were created [16,17] from WorldView-2 satellite images.
In 2019, the Allen Coral Atlas Project was published online [18]. The classification was based on coral reefs in the United Nations Environment Program (UNEP) 2010 “Coral Layer” integrated with Planet Scope satellite imagery. The Atlas included 22 geomorphic zones and six benthic habitats from the coastline up to a depth of 10 m [19,20].
Habitat maps are fundamental to know the extension of habitats in each region of interest and provide useful information to meet the global demand to face climate change and loss of biodiversity. Due to the complexity of surveying large and often inaccessible marine areas with traditional approaches such as biological censuses, habitats have been proposed as surrogates to describe the biodiversity of reef species with special attention to fish and invertebrate of commercial value [21,22,23].
Habitat maps give to stakeholders and decision makers the ability to view the extent of habitats on a map. However, for marine spatial planning, dedicated maps on the value/health status of an area should be planned. The multi-metric, indicator-based assessment approach uses parameters collected locally from water, sediment and biota that are illustrated on the maps through a score/color classification. This approach, largely adopted in Europe, is used to classify marine areas from local to regional scales [24,25,26] and to support ecosystem-based management through the existing international networks [27]. In Pacific areas, large-scale habitat mapping and multi-parametric local data are rare. To describe Tonga’s special unique marine areas a qualitative approach was based on four criteria of classification: geographic explicitness, justification, information sources and legal obligations [8].
Here, we present the application of an Ecological Quality Index (EQI) to the Atlas of the Marine Coastal Habitat Mapping of the Kingdom of Tonga derived from Copernicus Sentinel-2 images. The habitat mapping allowed the quantification of the cover of each ecological habitat for the entire archipelago of Tonga (approximately 174 islands).
The EQI was evaluated for twelve main Pacific reef habitats through six ecological parameters, which were focused on the potential of reef habitats as refugia, resilience and recovery sites for reef species after a disturbance that alters the physical and biological structure of the reef. The EQI is proposed as a tool that provides to stakeholders and environmental managers a simple and direct indicator of the value of the marine environment to be handled for management purposes of vast areas with remote and uninhabited islands.

2. Materials and Methods

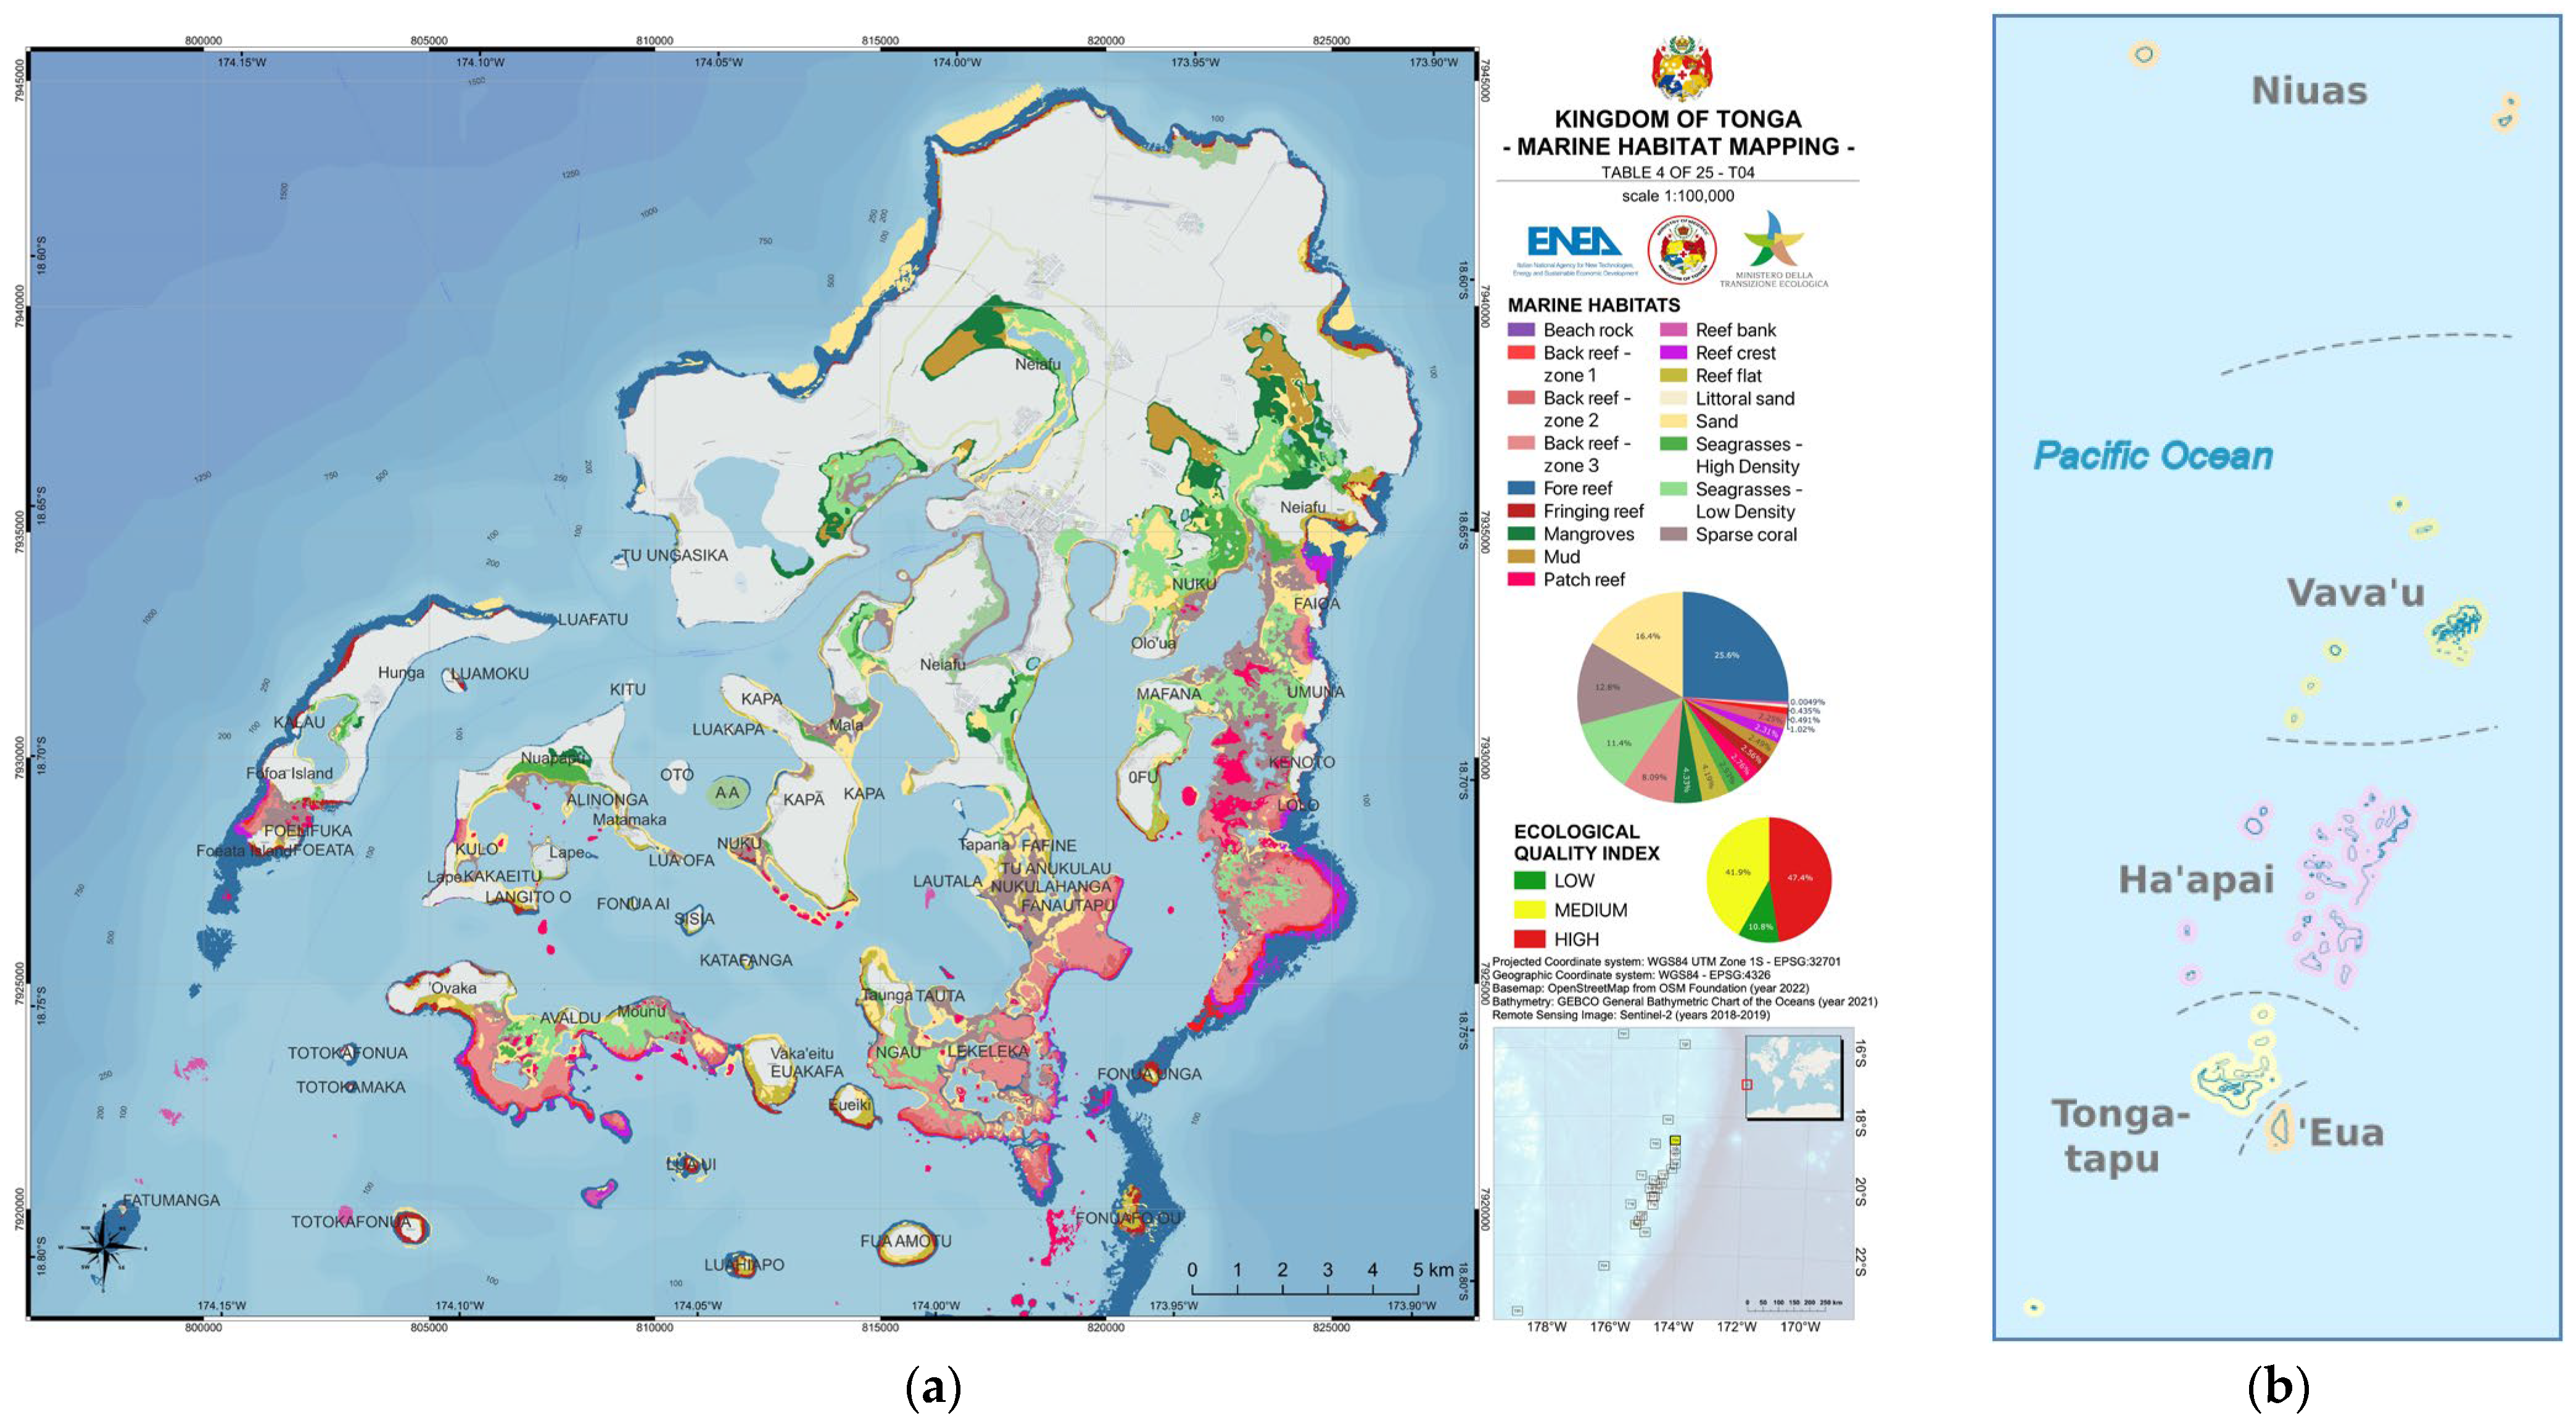
2.1. The Atlas of the Marine Coastal Habitats of the Kingdom of Tonga

The Kingdom of Tonga is located in the central South Pacific, and its archipelago spans 950 km including the Minerva Reefs. The archipelago consists of approximately 174 islands scattered across 360,000 km2 with only 720 km2 above sea level and only 37 inhabited islands [5,6]. The project of the Atlas of the Marine Coastal Habitat of the Kingdom of Tonga was born with the objective to use remote sensing as a basic tool for monitoring such a large area. To start a monitoring program, it is fundamental to fix a unique reference time to compare data from a chronological point of view; to meet this requirement, free satellite images available from January 2018 to December 2019 for the whole Tonga Archipelago were collected from the Sentinel-2 and Landsat free repositories on the web portals of the U.S. Geological Survey USGS-Earth Explorer [28] and the ESA-Copernicus organization [29]. Image processing followed the procedure of Immordino et al. [30]; the pre-processing steps included image radiometric, atmospheric and geometric correction, application of depth invariant bands and correction for the air–water interface through the use of ERDAS Imagine software. Two separate approaches were used for the habitat classification: the unsupervised classification was used with ENVI® software v. 5.6.3 to classify images using bands 1-2-3-4-5-8 with bands 1 and 8 resampled from the native spatial resolution of 20 m to 10 m, and the supervised classification was used with Trimble eCognition® software v. 10.1 to map the littoral mangrove forests. The unsupervised classification performs a subdivision of the feature space into a certain number of “spectral classes” without requiring the informative contribution of the number and identity of the classes. The fundamental hypothesis of this approach is that similar objects must correspond to similar spectral responses, and this is reflected in the space of the characteristics with values associated with the pixels of the image, which tend to be distributed in groups or clusters; the unsupervised method, therefore, finds a certain number of clusters without knowledge of the number or nature of the clusters. The criteria used for subdividing the multispectral space into “spectral classes” are proximity or similarity criteria. After the automatic assignment to the different spectral classes, the interpretation is up to the expert who, with the experience and knowledge of the characteristics of the study environment, identifies the thematic classes to be associated with the spectral classes identified with the clustering procedure [31]. Fourteen classes related to coral coastal marine habitats (terrestrial mangrove habitat excluded) have, therefore, been defined in the ISODATA algorithm of the unsupervised classification; the raster file obtained has been transformed into .shp vector format. Hence, the ENVI® software allowed us to get a first classification of habitat classes exported in vector format as shapefiles (.shp) to be imported into QGIS freeware software for photo interpretation.
The mangrove habitat was mapped following, partially, the approach applied by Wang et al., 2018 [32]. A two-level hierarchical structure based on the spatial structure of a mangrove ecosystem and geographic object-based image analysis was utilized and modified. So, the mangrove determination in the Archipelago of Tonga was divided into two levels, namely landscape and vegetation cover type (Table 1).
The object-based image analysis approach was used to implement the hierarchy of Levels 1 and 2. For this purpose, Trimble eCognition® software was used. Creating an object-based classification mainly consists of two steps: image segmentation and object classification. Table 2 shows the algorithm (rule set) and classification processes developed for the archipelago of the Kingdom of Tonga in which some spectral indices are selected and combined.
The first level was used to discriminate vegetation and non-vegetation and produced a mask of vegetation. A chessboard segmentation with an object size of one pixel was applied in order to preserve the pixel value of coarse or moderate resolution images. Following segmentation, the objects with a Modified Normalized Difference Water Index MNDWI (1) higher than zero and a Forest Discrimination Index FDI (2) less than zero were classified as water. Moreover, due to some mudflat overlapping with water and the brightness of the mudflat being greater than water, the brightness was used as a supplement to exclude these mudflats (Brightness < 1250). The second level was used to separate mangrove from non-mangrove within the vegetation mask, and Wang et al. [32] applied the Mangrove Discrimination Index 2 (MDI2) index:
MDI2 = (Band 8 − Band 12)/Band 12 = (NIR − SWIR2)/SWIR2
By applying the MDI2 index in the few islands of the Tonga archipelago where the presence of mangroves is confirmed with the bibliography, it has been observed that, in this context, sometimes the use of the MDI2 index overestimates the extension of the mangroves. For this reason, a check with a selection of the values of Band 11 (SWIR1) was also applied together with the global basemaps on QGIS as described hereafter.
The processing allows us to obtain vector data that, in the same way as the coral unsupervised classification, was reprocessed with QGIS (version 3.4 “Madeira”) through photo-interpretation tools. In this context, we used QGIS, which is an open-source, cross-platform desktop, Geographic Information System (GIS) application that supports viewing, editing and analysis of geospatial data [33]. In QGIS, all habitat classes obtained through supervised and unsupervised classification were carefully checked and corrected through QGIS tools, such as the HCMGIS plugin, that offers global basemaps from Google, Carto, ESRI and OSM Stamen that may be added as backview of the habitat mapping. Digital nautical maps, photos and videos available on the WEB were used as ancillary data to help in defining the typology and the limits of the habitat classes.
The final cartography and habitat classification formed the digital Atlas of the Marine Coastal Habitats of the Kingdom of Tonga in a shapefile (.shp) format viewable on all GIS software. Shapefile format is a digital vector storage format that stores the polygons related to each habitat class (layer). Data attributes (i.e., geographical location, cover in hectares and EQI) are linked to each layer. The digital Atlas is the representation of the shapes on a geographic georeferenced plane.

2.2. The Habitat Classification and the Ecological Quality Index (EQI)

With the aim to identify priority habitats useful for further analysis on the environmental health status, we referred mainly to the NOAA Shallow-Water Benthic Habitats Manual [34] and to the Millennium Project [14], reporting detailed illustrations and photographs of the geomorphology of the coral reef zones and of the associated biological communities of the Pacific and their ecological connections. Ancillary information, such as scientific reports, literature, web-free imagery, videos and photos, was used for interpretation and to achieve the maps of relevant habitats without field data validation [30]. To compute the Ecological Quality Index (EQI), the benthic classification and habitat mapping was adapted to the objectives of the Atlas with particular emphasis to corals, seagrasses and mangroves as priority habitats for the maintenance of biodiversity and ecosystem services [22,23].
In the two main morphological zones of the reef islands, the barrier reef and the coastal reef, the following 12 main biological habitat classes and 5 subzones were identified (Figure 1 and Table 3):
1.
Sparse Coral/Coral Beds (SC): This class groups all colonies or beds of colonies sparse on sand or gravel bottoms around islands or in the lagoons. SC has a great importance as a fish refuge and area with coral recolonization potential after mortality events.
2.
Reef Banks (RB): These banks are found offshore. In the classification procedure, RB were considered all reefs isolated from barrier reefs or islands from a depth greater than 30 m. They can emerge at the surface with reef crest (RC) and go deeper behind the depth limit of the satellite detection. RB may be considered as submerged, coralline islands or coralline shoals. In some cases, RB may reach hundreds of meters of depth with active exchanges of larvae and nutrients from the bottom to the surface. For this reason, offshore RB may be considered as pristine areas with high biodiversity and high fish abundance that act as true marine biosphere reserves.
3.
Patch Reef (PR): Normally formed by the fragmentation of the Back Reef (BR). PR is found mainly in lagoons and on large, shallow, submerged coral platforms out of the Fore Reef (FR). PR are visible in satellite images as tens of meters isolated coral knobs and little coral platforms of various forms emerging from lagoons or in large areas in shallow, offshore bottoms. PR is important because it includes isolated, living reef that represent a reservoir both in terms of larvae and individuals of different coral species.
4.
Fore Reef (FR): It is the outward part of the Back Reef (BR) or of the Fringing Reef (FRI). On its underwater cliff, all coral biodiversity is concentrated along the first 20–40 m of depth. It represents the most important reservoir for coral and fish maintenance and survival. The class includes the shelf-break with various coral formations, and it may be extended at large and behind the depth limit of the satellite detection (20–30 m).
5.
Reef Crest (RC): It is the edge of the Barrier Reef. It is the part of the Barrier Reef more exposed to open-ocean waves. It is the most important area of the barrier for the defense of the coastline, and it is most sensitive to mortality due to low tides, elevated seawater temperatures and storms. This class is also associated to the emerging part of the Patch Reef (PR) and Reef Banks (RB).
6.
Back Reef (BR): It is the area of the Barrier Reef between the Reef Crest (RC) and the coast; it is formed by a coral platform and is limited towards the coastline by the lagoon. It may be very large and, in its shallow areas, is characterized by an eroded platform and rubbles with associated subclasses of coralline algae, massive corals and algal turf. The Back Reef class is divided into three subclasses/subzones:
  • Subzone 1 (BR 1): Behind the Reef crest, it is the zone where mainly coralline algae and living corals can be found. It may be masked by the wave breaker front of the Reef Crest.
  • Subzone 2 (BR 2): Between the Subzone 1 and the Subzone 3, it is formed by an eroded platform with scattered, little living coral colonies and fleshy algae.
  • Subzone 3 (BR 3): It is the zone situated between the Subzone 2 and the lagoon; it is formed by a platform with massive corals. Here, fragments of corals of the reef crest damaged by open-ocean waves may survive.
7.
Fringing Reef (FRI): Named also ‘coastal reef crest’, it is the seaward fringe of the coastal Reef Flat (RF). The abundance of living corals is related to its exposition to storms. FRI is the most important indicator of coastal reef erosion.
8.
Reef Flat (RF): It includes the reef platform formed by dead coral surrounding the coast of the major islands, and it can reach the coastline as a rocky substrate where boulders formed by the dead coral may be found. Massive corals and fleshy algae and seagrasses may occur in submerged areas where wave action is reduced.
9.
Seagrasses (SE): It is the class grouping all the marine, submerged plants living in sand patches or bars; seagrasses may be found on barrier and coastal reefs and in front of Mangrove (MA) forests. Seagrasses are important for primary production and coastal defense, as foraging areas for turtles and dugongs and nursery ground for fish, crab and mollusks. The seagrasses class is divided into two subclasses/subzones:
  • Subzone 1 or High density (SE H): Dense seagrasses beds near the coast or in lagoons.
  • Subzone 2 or Low density (SE L): Seagrasses in sparse patches on sand, variable in time and space.
10.
Algae (AL): Large patches of algae that may be present on sandy and rocky bottoms of the Barrier Reef and Coastal Reef.
11.
Mangrove (MA): Terrestrial plant forests growing in coastal saline or brackish water. Mangroves act as the final defense from storms and land erosion and are important as the greatest primary producers; moreover, mangroves are a refuge and feeding area for juvenile fish.
12.
Mud (MU): The Mud zones (MU) in front of mangrove forests are important transition areas creating a link among littoral and offshore areas.
An additional four classes with no or scarce biological relevance were identified during the habitat classification and were included in the Atlas: Sand (S), Littoral Sand or beaches (LS), Beach Rocks (BR) and No Reefs (NR). The classification of these environments was necessary for their relationships with biological classes and for their natural value for the Marine Protected Areas. For example, sand cover in the lagoons may vary in seasons and years, and seagrasses may colonize new sand bars or disappear under them. Littoral Sand (LS) and Beach Rocks are of relevant interest from a geomorphological point of view and may be of interest both for coastal management and related tourist activities. The No Reef (NR) class is associated with rocky, basaltic reefs of volcanic island, which are boulder beaches with no value from the biological point of view.
The Ecological Quality Index (EQI) was calculated for each of the 15 habitats classes/subzones of ecological relevance as the mean of the three-level scores (1 = low value/Green, 2 = medium value/Yellow, 3 = high value/Red) assigned to the following 6 ecological parameters: nursery ground, connectivity, species reservoir, fish attraction, biodiversity and primary production (Table 2). The ecological parameters were focused on the value of each habitat class and subclass as refugia, resilience and recovery sites for reef species (Table 2).

3. Results

3.1. The Atlas of the Marine Coastal Habitats of the Kingdom of Tonga

The data available for the period from 1 January 2018 to 1 December 2019 showed the greatest number of satellite images available in the Sentinel-2 repositories. Since cloud cover is observed frequently on islands in the tropics, the satellite image analysis was restricted to images with a cloud cover <10%. On the Sentinel-2 images, a further analysis was conducted on every image covering hundreds of km2 to ensure the best, most recent and free of clouds view for each island or group of islands. Although the research focused on the period 2018–2019, for some areas, such as Hihifo-Tafai and Tofua-Kau, the only image without clouds dated back to 2017. Moreover, only one image was found for one of the two atolls of Minerva Reef. For Ata Island, the one Landsat-8 image free of clouds was utilized. With regard to mangroves, only one image dated back to 2016 for Tongatapu and one recent 2020 image for Vavau were free of clouds and were utilized. The results of the habitat classification on QGIS allowed us to visualize the habitat mapping for the Tonga Archipelago, compute the cover in hectares of the mapped habitats and estimate their ecological importance through the EQI (Figure 2).
The QGIS mapping data allowed the publication of the Atlas of the Marine Habitat of the Kingdom of Tonga [35], reporting 25 tables of the Tongan Archipelago. To obtain the Atlas, the DataPlotly plugin was used; the plugin allows the creation of interactive charts with data in shapefiles [33]. New fields were inserted into the database with color-coding of the Habitats and Ecological Quality Index that allowed a representation of tables with related pie charts. The 25 sheets composing the Atlas of the Tongan Archipelago are all the same size, 32 × 28 km, and have been included in an A3-size layout with a scale of 1:100,000. (Figure 3a).

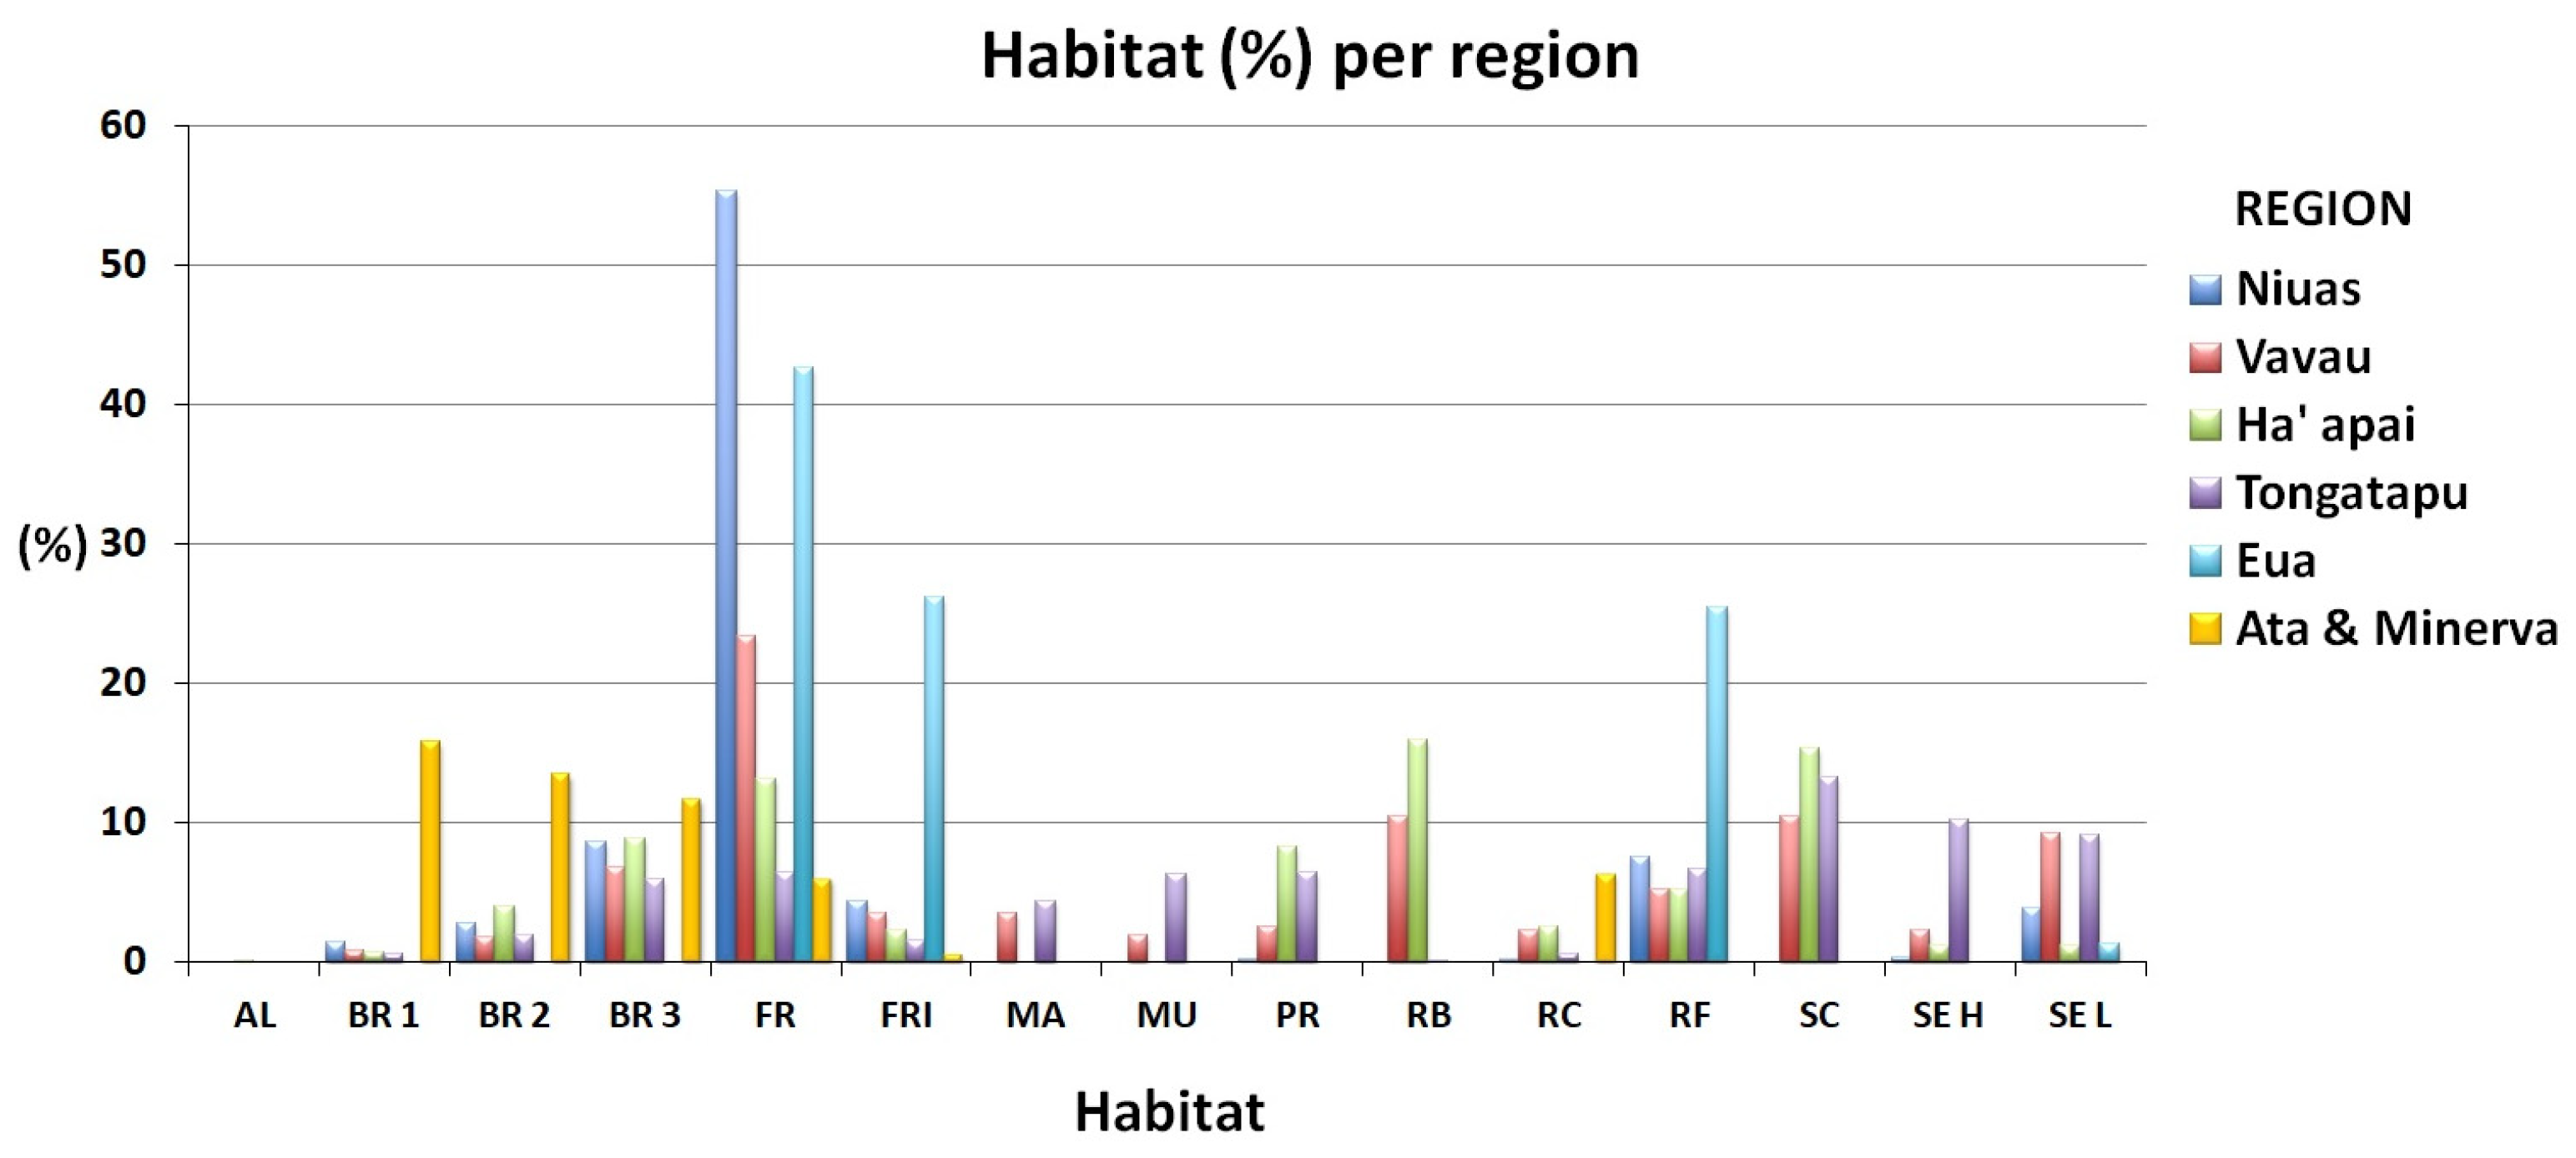
3.2. The Habitat Classification and the Ecological Quality Index (EQI)

A total of 104,147 hectares of the Tonga Archipelago were investigated of which 82,526 hectares (79.23%) were classified as relevant from a biological point of view. The QGIS database allowed us to compare the five main Tongan administrative regions, Ata Island and Minerva atoll (Figure 3b) on the occurrence of the 15 main biological habitats classes/subzones. The comparison showed that the Fore Reef (FR), Fringing Reef (FRI) and Reef Flat (RF) habitats were found in all of the archipelago with the highest cover percentages (Figure 4). The Sparse Coral (SC) habitat was found in Vavau, Ha’apai and Tongatapu on littoral, sandy bottoms. The Back Reef (BR) was recognized in all regions except for Eua. The Mangroves (MA) and the associated Mud (MU) habitats were limited to Vavau and Tongatapu, the regions with the greatest islands. Seagrasses (SE) were found in all regions with cover in hectares reaching the highest values in Tongatapu. Reef Banks (RB) were found only in the Vavau and Ha’apai regions.
The Ecological Quality Index per region showed that all marine areas of the Archipelago have high ecological values from 39% upward (Figure 5). The assessment of habitats of biological importance for the whole Tonga Archipelago showed that Fore Reef, Sparse Corals and Reef Banks are the habitats with the highest sea bottom cover with values from 10,791 to 14,717 hectares, contributing to the total highest values of the EQI assigned to 71.42% of the total area covered by habitat mapping in this study. The high cover of Fore Reef and Reef Banks is related to the Tonga Ridge, which marks the eastern boundary of the large plateau connecting the Vavau region to the Ha’hapai region and the Ha’hapai region to the Tongatapu region [36]. The Sparse Corals high cover is related to large areas of shallow bottoms that are typical of all Tonga regions.

4. Discussion

Despite that the Sentinel-2 images have a resolution limited to 10 m for Blue, Green, Red and Near-Infrared bands, the high revisiting time of 5–10 days allows us to visualize the environmental changes due to storms or tsunamis, or to detect coral mortality events due to climate change, also in remote and uninhabited areas. Hedley et al. [13] evidenced that the highly usable acquisition rate of Sentinel-2 makes it possible to collect several good images a year, meeting the needs for several essential coral reef scientific and monitoring objectives. For example, the detection of bleaching events requires a high frequency of images. The revisiting time of Sentinel-2 was demonstrated to be adequate to follow an event that may last for 1 to 6 weeks before coral recovery or colonization by macroalgae [13]. However, to achieve detailed high-accuracy data to follow mortality events to adequate scales, an effort should be made to continue to improve the input data. To reach a monitoring of coral reefs at regional to global scales, point-based in situ observations on biodiversity, validation procedures and the use of automated procedures using artificial intelligence and machine learning approaches should be implemented [19,37]. The proposed Ecological Quality Index (EQI) was based on the most important prerequisite of reef monitoring through remote sensing: the classification system should make good ecological sense [38].
The use of Sentinel-2 images to monitor large areas of the Tonga archipelago demonstrates the possibility to perform regular surveys with satellite images. Despite the difficulty to find good images because the cloud cover is a constant disturbing factor in tropical zones, the limited time period of two years imposed at the start of the project proved to be a practical way to use satellite images in large-scale monitoring programs on coral reefs. This monitoring attribute is particularly useful for extended territories, such as Pacific coral archipelagos formed by dispersed, uninhabited islands, banks or shallow bottoms with species-rich habitats that may be a fundamental source for the recovery of areas damaged by natural and/or anthropic pressure [1,22].
However, it is important to keep in mind that the information derived from the Atlas is just a piece of a network of information. The proposed approach is useful for a first mapping of large and remote areas at a regional scale. The habitat recognition and classification without ground truth was possible thanks to the existing publications of atlases and manuals about Pacific habitats and to ancillary products as free high-resolution internet images. However, the recognition was limited to main habitat classes due to the satellite resolution that limited the reading to a maximum magnification scale of 1:100,000. Hence, information must be completed and corrected with appropriate ground truthing and detailed surveys on the areas of interest [19].
Moreover, the submerged habitats of corals and seagrasses were identified taking into consideration the operational limit of the satellite images, normally within 20–30 m depth in the best conditions of water transparency. Deeper areas, e.g., offshore zones around banks, should be investigated with other methodologies, such as multibeam or sidescan sonar, or underwater imagery to obtain observations of biodiversity [39,40]. These deep areas are of relevant ecological importance; coral species inhabiting these zones could be an important reservoir for the shallower reefs impacted by climate change, and they should be protected from overfishing and included in marine spatial planning [6,36,41].
The procedure followed in the present work using open-access, free Sentinel-2 images and freeware, open-source mapping platforms is in general agreement with the seven main attributes of the mapping framework of Lyons et al. [19]. Among these attributes, the most important is to compose a mapping framework that is easy, efficient and timely to ‘re-run’ by the original investigators or by different individuals in order to update the outputs when new sensors or new data are available. GIS tools provide a quick and efficient visualization tool of the digital maps of the Atlas of the coastal marine habitats of Tonga and of the associated EQI. This configuration makes the Atlas accessible by everyone on laptop computers, also without an internet connection, with the advantages associated with its use in field campaigns and remote areas.
Digital maps provided by the Atlas and its database are open and available to Tongan stakeholders (scientists or administrative personnel). QGIS software gives the ability to assess the status of any area in the Tonga archipelago in terms of habitat occurrence, cover and ecological value (EQI), contributing to the evaluation of ecosystem services associated to each habitat [22,23]. The Atlas offers a baseline for monitoring environmental changes, allowing the quantification of natural or anthropic damages in term of habitat loss. The Atlas could be modified, updated and implemented with new maps on marine and terrestrial habitats, offering an efficient system for spatial planning issues and to prevent climate change. Thanks to GIS tools, past and future marine habitat maps may be uploaded and chronologically compared to the marine environment status recorded for the entire archipelago of Tonga for the years 2016–2020. Moreover, the digital Atlas could be added in the future to the WEB portals as the Pacific Environment Data Portal [42], the Pacific Data HUB [43] or the Ocean data Viewer [44], collecting data and maps on coral environments at regional or global scales.
Following the ongoing Marine Spatial Planning of Tonga, the proposed marine habitat mapping and the EQI are in accordance with the main objectives of the project [36]: to help decision makers appreciate the values of marine ecosystems and the importance of spatially planning the uses of these values; and to assist the planning processes using the accompanying data layers and raw data in Geographic Information Systems (GIS).

5. Conclusions

Satellite images, thanks to the innovation in image and software availability and despite some problems related to areal coverage, presence of clouds or image resolution, are consolidated tools to study and quantify the effects of climate change and human impact on earth’s ecosystems. The Ecological Quality Index (EQI) proposed in this work combines the relevant biological characteristics of reefs and associated ecosystems with specific ecological classes and the ecosystem values associated with them. The digital Atlas of Marine Habitats of the Tonga Kingdom running on the freeware QGIS platform is proposed as an example of a simplified tool for government technical offices for a first working approach of the marine spatial planning of large remote areas and uninhabited and pristine islands.

Author Contributions

Conceptualization, A.P., I.D., F.I., S.C., A.L.M. and T.H.; methodology, A.P., I.D., M.B., F.I. and S.C.; software, M.B., F.I. and L.M.; validation, F.I. and E.C.; formal analysis, A.P., I.D., M.B. and S.C.; resources, A.L.M. and T.H.; data curation, M.B. and L.M.; writing—original draft preparation, A.P.; writing—review and editing, A.P., I.D., M.B., F.I. and A.L.M.; visualization, A.P. and L.M.; supervision, A.P.; project administration, A.L.M.; funding acquisition, A.P. All authors have read and agreed to the published version of the manuscript.

Funding

This research was funded by the Ministry of Meteorology, Energy, Information, Disaster Management, Environment, Climate Change and Communications (MEIDECC) of Tonga within the project “Strengthening Protected Area Management in the Kingdom of Tonga” (ENV/ BD-MPA/01-19). The research was supported by the Italian Ministry of Environment and Energy Security and the Italian National Agency for New Technologies, Energy and Sustainable Economic Development (ENEA).

Data Availability Statement

Applicable on request at MEIDECC.

Acknowledgments

The authors thank the editors and the two referees whose help greatly improved the ms.

Conflicts of Interest

The authors declare no conflict of interest.

References

  1. Hock, K.; Wolff, N.H.; Ortiz, J.C.; Condie, S.A.; Anthony, K.R.N.; Blackwell, P.G.; Mumby, P.J. Connectivity and systemic resilience of the Great Barrier Reef. PLoS Biol. 2017, 15, e2003355. [Google Scholar] [CrossRef] [PubMed]
  2. Kurniawan, F.; Adrianto, L.; Bengen, D.G.; Prasetyo, L.B. Vulnerability assessment of small islands to tourism: The case of the Marine Tourism Park of the Gili Matra Islands, Indonesia. Glob. Ecol. Conserv. 2016, 6, 308–326. [Google Scholar] [CrossRef]
  3. Albert, S.; Saunders, M.I.; Roelfsema, C.M.; Leon, J.X.; Johnstone, E.; Mackenzie, J.R.; Hoegh-Guldberg, O.; Grinham, A.R.; Phinn, S.R.; Duke, N.C.; et al. Winners and losers as mangrove, coral and seagrass ecosystems respond to sea-level rise in Solomon Islands. Environ. Res. Lett. 2017, 12, 1–11. [Google Scholar] [CrossRef]
  4. Micheli, F.; Mumby, P.J.; Brumbaugh, D.R.; Broad, K.; Dahlgren, K.P.; Harborne, A.R.; Holmes, K.E.; Kappel, C.V.; Litvin, S.Y.; Sanchirico, J.N. High Vulnerability of Ecosystem Function and Services to Diversity Loss in Caribbean Coral Reefs. Biol. Conserv. 2014, 171, 186–194. [Google Scholar] [CrossRef]
  5. Lovell, E.R.; Palaki, A. National coral reef status report Tonga IN. In Coral Reefs in the Pacific: Status and Monitoring, Resources and Management; Nouméa: IRD. Doc. Sei. Tech Numéro Il; Institut de Recherche pour le d Veloppement, Centre de Nouméa: Nouméa, New Caledonia, 2002; pp. 303–329. [Google Scholar]
  6. Fa’anunu, H.L. Assessing Stakeholder Expectations for Marine Spatial Planning in Tonga: Implications for Governance, World Maritime University Dissertations, 2019. Volume 1141, p. 60. Available online: https://commons.wmu.se/cgi/viewcontent.cgi?article=2140&context=all_dissertations (accessed on 14 December 2022).
  7. MESCAL. Review of Policy and Legislation Relating to Mangroves, the Use and Management of Mangroves in Tonga. Mangrove Ecosystems for Climate Change Adaptation and Livelihoods. 2013, Volume 7, p. 48. Available online: http://macbio-pacific.info/wp-content/uploads/2017/08/Tonga-_Mangrove-Policy-and-Legislative-review-report.pdf (accessed on 14 December 2022).
  8. Ceccarelli, D.M.; Wendt, H.; Matoto, A.L.; Fonua, E.; Fernandes, L. Biophysically Special, Unique Marine Areas of Tonga; MACBIO (GIZ, IUCN, SPREP): Suva, Fiji, 2017; p. 113. [Google Scholar]
  9. Ceccarelli, D.; Davey, K.; Fernandes, L. Developing a Marine Spatial Plan: A Toolkit for the Pacific; MACBIO (SPREP/IUCN/BMU): Suva, Fiji, 2018; p. 39. [Google Scholar]
  10. United Nations Environment Programme; International Sustainability Unit; International Coral Reef Initiative. The Coral Reef Economy: The Business Case for Investment in the Protection, Preservation and Enhancement of Coral Reef Health. 2018, p. 36. Available online: https://wedocs.unep.org/20.500.11822/26694 (accessed on 15 November 2022).
  11. Smallhorn-West, P.; Sheehan, J.; Rodriguez-Troncoso, A.; Malimali, S.; Halafihi, T.; Mailau, S.; Le’ota, A.; Ceccarelli, D.M.; Stone, K.; Pressey, B.; et al. Kingdom of Tonga Special Management Area Report. 2020, p. 86. Available online: https://www.sprep.org/attachments/VirLib/Tonga/special-management-area-report.pdf (accessed on 10 November 2022).
  12. Baker, E.K.; Harris, P.T. Habitat mapping and marine management. In Seafloor Geomorphology as Benthic Habitat, 2nd ed.; Peter, T., Harris, E.B., Eds.; Elsevier: Amsterdam, The Netherlands, 2020; pp. 17–34. [Google Scholar]
  13. Hedley, J.D.; Roelfsema, C.; Brando, V.; Giardino, C.; Kutser, T.; Phinn, S.; Mumby, P.J.; Barrilero, O.; Laporte, J.; Koetz, B. Coral reef applications of Sentinel-2: Coverage, characteristics, bathymetry and benthic mapping with comparison to Landsat 8. Remote Sens. Environ. 2018, 216, 598–614. [Google Scholar] [CrossRef]
  14. Andréfouët, S.; Chauvin, C.; Spraggins, S.; Torres-Pulliza, D.; Kranenburg, C. Atlas des Récifscoralliens de Polynésie Française; Centre IRD de Nouméa: Nouméa, New Caledonia, 2005; Volume 38. [Google Scholar]
  15. Andréfouët, S. Reef typology. In Encyclopedia of Modern Coral Reefs Structure form and Process; Hopley, D., Ed.; Springer: Dordrecht, The Netherlands, 2011; pp. 906–910. [Google Scholar]
  16. Saul, S.; Purkis, S.J. Semi-automated object-based classification of coral reef habitat using discrete choice models. Remote Sens. 2015, 7, 15894–15916. [Google Scholar] [CrossRef]
  17. Purkis, S.J.; Gleason, A.C.R.; Purkis, C.R.; Dempsey, A.C.; Renaud, P.G.; Faisal, M.; Saul, S.; Kerr, J.M. High-resolution habitat and bathymetry maps for 65,000 sq. Km of Earth’s remotest coral reefs. Coral Reefs 2019, 38, 467–488. [Google Scholar] [CrossRef]
  18. Allen Coral Atlas Project. Available online: https://allencoralatlas.org (accessed on 15 November 2022).
  19. Lyons, M.B.; Roelfsema, C.M.; Kennedy, E.V.; Kovacs, E.M.; Borrego-Acevedo, R.; Markey, K.; Roe, M.; Yuwono, D.M.; Harris, D.L.; Phinn, S.R.; et al. Mapping the world’s coral reefs using a global multiscale earth observation framework. Remote Sens. Ecol. Conserv. 2020, 6, 557–568. [Google Scholar] [CrossRef]
  20. Kennedy, E.; Roelfsema, C.; Mitchell, L.; Kovacs, E.; Borrego Acevedo, R.; Roe, M.; Phinn, S.; Larsen, K.; Murray, N.; Yuwono, D.; et al. Reef Cover: A coral reef classification to guide global habitat mapping from remote sensing. Sci. Data 2021, 8, 1–12. [Google Scholar] [CrossRef]
  21. Harborne, A.R.; Mumby, P.J.; Kappel, C.V.; Dahlgren, C.P.; Micheli, F.; Holmes, K.E.; Brumbaugh, D.R. Tropical coastal habitats as surrogates of fish community structure, grazing, and fisheries value. Ecol. Appl. 2008, 18, 1689–1701. [Google Scholar] [CrossRef] [Green Version]
  22. Dalleau, M.; Andréfouët, S.; Wabnitz, C.; Payri, C.; Wantiez, L.; Pichon, M.; Friedman, K.; Vigliola, L.; Benzoni, F. Use of Habitats as Surrogates of Biodiversity for Efficient Coral Reef Conservation Planning in Pacific Ocean Islands. Conserv. Biol. 2010, 24, 541–552. [Google Scholar] [CrossRef] [PubMed]
  23. Mumby, P.J.; Broad, K.; Brumbaugh, D.R.; Dahlgren, C.P.; Harborne, A.R.; Hastings, A.; Holmes, K.E.; Kappel, C.V.; Micheli, F.; Sanchirico, J.N. Coral reef habitats as surrogates of species, ecological functions, and ecosystem services. Conserv. Biol. 2008, 22, 941–951. [Google Scholar]
  24. Andersen, J.H.; Caetano, M.; Grouhel-Pellouin, A.; Harvey, E.T.; Reker, J.B.; Ciaran, J.M. Mapping of contamination problem areas in Europe’s seas using a multi-metric indicator-based assessment tool. Front. Mar. Sci. 2022, 9, 1–9. [Google Scholar] [CrossRef]
  25. Gobert, S.; Sartoretto, S.; Rico-Raimondino, V.; Andral, B.; Chery, A.; Lejeune, P.; Boissery, P. Assessment of the ecological status of Mediterranean French coastal waters as required by the Water Framework Directive using the Posidonia oceanica Rapid Easy Index: PREI. Mar. Pollut. Bull. 2009, 58, 1727–1733. [Google Scholar] [CrossRef]
  26. Fano, E.A.; Mistri, M.; Rossi, R. The ecofunctional quality index (EQI): A new tool for assessing lagoonal ecosystem impairment. Estuar. Coast. Shelf Sci. 2003, 56, 709–716. [Google Scholar] [CrossRef]
  27. Andersen, J.; Manca, E.; Agnesi, S.; Al-Hamdani, Z.; Lillis, H.; Mo, G.; Populus, J.; Reker, J.; Tunesi, L.; Vasquez, M. European Broad-Scale Seabed Habitat Maps Support Implementation of Ecosystem-Based Management. Open J. Ecol. 2018, 8, 86–103. [Google Scholar] [CrossRef]
  28. USGS-Earth Explorer. Available online: https://earthexplorer.usgs.gov/ (accessed on 15 November 2022).
  29. ESA-Copernicus Open Access Hub. Available online: https://scihub.copernicus.eu/ (accessed on 15 November 2022).
  30. Immordino, F.; Barsanti, M.; Candigliota, E.; Cocito, S.; Delbono, I.; Peirano, A. Application of Sentinel-2 Multispectral Data for Habitat Mapping of Pacific Islands: Palau Republic (Micronesia, Pacific Ocean). J. Mar. Sci. Eng. 2019, 7, 316. [Google Scholar] [CrossRef]
  31. Brivio, P.A.; Lechi, G.; Zilioli, E. Principi e Metodi di Telerilevamento; Studi, C., Ed.; UTET: Milan, Italy, 2006; p. 542. [Google Scholar]
  32. Wang, D.; Wan, B.; Qiu, P.; Su, Y.; Guo, Q.; Wang, R.; Sun, F.; Wu, X. Evaluating the performance of Sentinel-2, Landsat 8 and Pléiades-1 in mapping mangrove extent and species. Remote Sens. 2018, 10, 1468. [Google Scholar] [CrossRef]
  33. QGIS. A Free and Open Source Geographic Information System. Available online: https://qgis.org/en/site/ (accessed on 15 November 2022).
  34. NOAA Biogeography Branch. Shallow-Water Benthic Habitats of American Samoa, Guam, and the Commonwealth of the Northern Mariana Islands: Manual; NOAA National Ocean Service, National Centers for Coastal Ocean Science: Silver Spring, MD, USA, 2005; p. 33.
  35. Moretti, L.; Barsanti, M.; Candigliota, L.; Cocito, S.; Delbono, I.; Hokafonu, F.T.; Immordino, F.; Matoto, L.A.; Peirano, A. Atlas of marine habitats—Kingdom of Tonga. In Annex to the Final Report—Strengthening Protected Area Management in the Kingdom of Tonga; Work Package 3; ENEA: Roma, Italy, 2022; p. 44. [Google Scholar]
  36. Gassner, P.; Westerveld, L.; Fonua, E.; Takau, L.; Matoto, A.L.; Kula, T.; Macmillan-Lawler, M.; Davey, K.; Baker, E.; Clark, M.; et al. Marine Atlas. In Maximizing Benefits for Tonga; MACBIO (GIZ/IUCN/SPREP): Suva, Fiji, 2019; p. 84. [Google Scholar]
  37. Burns, C.; Bollard, B.; Narayanan, A. Machine-Learning for Mapping and Monitoring Shallow Coral Reef Habitats. Remote Sens. 2022, 14, 2666. [Google Scholar] [CrossRef]
  38. Xu, J.; Dongzhi, Z. Review of Coral Reef Ecosystem Remote Sensing. Acta Ecol. Sin. 2014, 34, 19–25. [Google Scholar] [CrossRef]
  39. Komatsu, T.; Mikami, A.; Sultana, S.; Ishida, K.; Hiraishi, T.; Tatsukawa, K.I. Hydro-acoustic methods as a practical tool for cartography of seagrass beds. Otsuchi Mar. Sci. 2003, 28, 72–79. [Google Scholar]
  40. Komatsu, T.; Igararashi, C.; Tatsukawa, K.I.; Nakaoka, M.; Hiraishi, T.; Taira, A. Mapping of seagrass and seaweed beds using hydro-acoustic methods. Fish. Sci. 2002, 68 (Suppl. S1), 580–583. [Google Scholar] [CrossRef] [PubMed] [Green Version]
  41. Atherton, J.N.; McKenna, S.A.; Wheatley, A. Rapid Biodiversity Assessment of the Vava’u Archipelago, Kingdom of Tonga; SPREP: Apia, Samoa, 2015; p. 312. [Google Scholar]
  42. Pacific Environmental Data Portal. Available online: https://pacific-data.sprep.org/ (accessed on 13 January 2023).
  43. Pacific Data HUB. Available online: https://pacificdata.org/ (accessed on 13 January 2023).
  44. UNEP-WCMC; WorldFish Centre; WRI; TNC. Global Distribution of Warm-Water Coral Reefs, Compiled from Multiple Sources Including the Millennium Coral Reef Mapping Project; Version 2.0, Includes contributions from IMaRS-USF and IRD (2005), IMaRS-USF (2005) and Spalding et al. (2001); UN Environment World Conservation Monitoring Centre: Cambridge, UK, 2010; Available online: http://data.unep-wcmc.org/datasets/1 (accessed on 17 January 2023).
Figure 1. Zonation scheme of the marine shallow-water habitat classes identified and included in the Atlas of the Coastal Marine Habitat of the Kingdom of Tonga.
Remotesensing 15 00909 g001
Figure 2. Examples of the QGIS outputs of one area selected in the Ha’apai Region of Tonga Archipelago: (a) Habitat map; (b) Ecological Quality Index (EQI) map (1 = low ecological value; 2 = medium ecological value; 3 = high ecological value).
Remotesensing 15 00909 g002
Figure 3. (a) The table N. 25 of the Atlas of the Marine Habitat of Tonga [35]. (b) The five Tonga administrative subdivisions or regions (source: https://gadm.org/ and Tonga Department of Statistics, accessed on 14 December 2022).
Remotesensing 15 00909 g003
Figure 4. Total habitat percentage occurrence of the 15 main habitats classes/subzones in the five Tonga regions, Ata Island and Minerva Reef. For habitat abbreviations on the x-axis, see Table 2.
Remotesensing 15 00909 g004
Figure 5. Ecological Quality Index (EQI) percentages calculated for the five Tonga regions, Ata Island and Minerva Reef.
Remotesensing 15 00909 g005
Table 1. Image object hierarchy for the mangrove feature classifications from Sentinel-2.
Level 1: LandscapeLevel 2: Vegetation Cover Type
Sentinel-2VegetationNon-mangroves
WaterMangroves
Table 2. Mangrove feature classifications based on Sentinel-2 imagery using MNDWI (Modified Normalized Difference Water Index) = (Band 3 − Band 11)/(Band 3 + Band 11) = (Green − SWIR1)/(Green + SWIR1), FDI (Forest Discrimination Index) = Band 8 − (Band 4 + Band 3) = NIR− (Red + Green) and WFI (Wetland Forest Index) = (Band 8 − Band 4)/Band 12 = (NIR − Red)/SWIR2.
LevelClassificationSentinel-2 Image (13 Bands)
Level 1WaterChessboard Seg: 1
MNDWI > 0
FDI < 0
Brightness < 1250
VegetationWFI > 0.7
Level 2MangrovesMultiresolution Seg: 64
~600 < Band 11 (SWIR1) < ~1000
Non-mangrovesNot “mangroves”
Table 3. Main Classes and subzones used for Tonga habitat mapping. The Ecological Quality Index (EQI) was calculated as the mean of the three-level scores assigned to six ecological parameters (nursery ground, connectivity, species reservoir, fish attraction, biodiversity, primary production).
Biological Habitat ClassesAbbreviationSub ZonesGeomorphological SettingBiological Value (1 = Low, 2 = Medium, 3 = High)Ecological Quality Index
(EQI)
Nursery GroundConnectivitySpecies ReservoirFish AttractionBiodiversityPrimary Production
SPARSE CORALCS Sparse colonies on sand and gravel bottoms1222202
REEF BANKRB Offshore sparse banks and shoals in the open ocean3333303
PATCH REEFPR Coral Pinnacles and broken reef, may reach the surface with a reef crest (RC)2333303
FORE REEFFR Coral cliffs and continuous, dense coral beds and bank shelves outward fringing reef and barrier reef. It includes spur and grooves2333303
REEF CRESTRC Outward edge of barrier reef, coral and coralline algae exposed to wave action, and to air at low tide2333333
BACK REEFBR1Coral and coralline algae. Just behind reef crest2333333
2Scattered corals and flesh algae on coral platform behind the BR zone 11111111
1Scattered coral on coral platform with moderate slope with sand and gravel. Between the BR zone 2 and internal lagoon and sand bar.1121102
FRINGING REEFFRI Coral on the edge of RF. Exposed to air at low tide and to wave action.2223312
REEF FLATRF Coral platform among the FRI and the coast rare, sparse coral, sand patches, and algae1111111
SEAGRASSESSE1 = High Densitydense plant cover on sand patches on barrier reef in lagoons and on RF3333333
2 = Low densityplant patches variable in space and time on sand bars in lagoons and on RF2212222
ALGAEAL large patches of algae may be present on sandy and rocky bottoms of the Barrier Reef and Coastal Reef1112132
MANGROVEMA Terrestrial plant forest implanted along coastline where rivers are present3333333
MUDMU Mud fringe in front of mangrove water limit2111001
SANDS Sand bottoms, sand bars0000000
LITORAL SANDLS Beaches0000000
NO REEFNR Rocky, basaltic reefs of volcanic island, boulder beaches0000000
Disclaimer/Publisher’s Note: The statements, opinions and data contained in all publications are solely those of the individual author(s) and contributor(s) and not of MDPI and/or the editor(s). MDPI and/or the editor(s) disclaim responsibility for any injury to people or property resulting from any ideas, methods, instructions or products referred to in the content.

