Article

Land-Use Change, Habitat Connectivity, and Conservation Gaps: A Case Study of Shorebird Species in the Yellow River Delta of China Using the InVEST Model and Network Analysis

1
Key Laboratory of Ecosystem Network Observation and Modelling, Institute of Geographic Sciences and Natural Resources Research, Chinese Academy of Sciences, Beijing 100101, China
2
College of Resources and Environment, University of Chinese Academy of Sciences, Beijing 100190, China
*
Author to whom correspondence should be addressed.
Remote Sens. 2022, 14(24), 6191; https://doi.org/10.3390/rs14246191
Submission received: 23 October 2022 / Revised: 28 November 2022 / Accepted: 5 December 2022 / Published: 7 December 2022

Abstract

:
Coastal wetlands form a transition zone between terrestrial and marine environments and provide important ecosystem services. Land-use change in the coastal zone has a substantial effect on habitat connectivity and biodiversity. However, few studies have characterized the effects of land-use change on coastal habitat connectivity. We conducted remote sensing analysis, modeling with the Integrated Valuation of Ecosystem Services and Trade-offs model, geospatial analysis, and habitat connectivity analysis to evaluate historical spatiotemporal changes in the habitat quality and habitat connectivity of migratory shorebirds in the Yellow River Delta, which is an important stopover site along the East Asian–Australasian Flyway migratory route. Several high- and medium-quality areas have been converted to industrial mining and mariculture sites because of land reclamation. The probability of connectivity decreased by −66.7% between 1975 and 2020. Approximately 71.0%, 11.6%, and 5.8% of patches with high importance have been converted to non-habitat patches, habitat patches with medium importance, and habitat patches with low importance, respectively; approximately 58.9% and 11.7% of the patches with medium importance have been converted to non-habitat patches and habitat patches with low importance, respectively. The total priority conservation area was 389.4 km2, and 125.0 km2 (32.1%) of this area remains unprotected; these unprotected areas are mainly distributed in the northwestern and eastern parts of the Yellow River Delta. We recommend that the boundary of the Yellow River Delta National Nature Reserve be expanded to incorporate these unprotected areas.

1. Introduction

Migratory birds rely on habitat networks to travel between breeding and non-breeding grounds [1]. Migratory waterbirds frequently use multiple stopover sites to rest and refuel before arriving at a breeding area [2]. Therefore, maintaining habitat connectivity among sites along migratory routes is key for enhancing the stability of natural populations of migratory bird species [3]. Coastal wetlands in China provide important stopover sites for migratory shorebirds along the East Asian–Australasian Flyway (EAAF) migratory route [4,5]. However, land-use change has affected the size and structure of available habitat, as well as ecosystem functions [6,7], and this has implications for habitat connectivity. The effects of land-use change on coastal habitat connectivity have not yet been clarified.
Habitat connectivity is defined as the extent of structural and functional contiguity in the landscape [8]. The maintenance and improvement of habitat connectivity can increase the adaptive capacity of species to external disturbance and improve population stability [9]. Habitat patches play different roles in network connectivity depending on their location, quality, and size [10]. The selection of important habitat patches that maintain network connectivity is important for identifying priority conservation areas and can greatly aid the management of biodiversity. Previous studies aimed at identifying conservation priority areas have mainly focused on habitat patch suitability [11]; however, patch configuration and the role of patches in maintaining network connectivity have received less attention by comparison.
The Yellow River Delta is the largest estuarine wetland area in China, and it provides critically important foraging sites for shorebird species along the EAAF migratory route [12]. Most coastal wetlands in this region have been lost and fragmented because of human activities [13,14]. Such human activities can alter the area and structure of habitat, which can affect habitat connectivity [15]. Although these coastal wetlands have undergone drastic changes, few studies have characterized the effects of coastal wetland change caused by land-use change on habitat connectivity. Moreover, priority conservation areas that contain critically important habitat patches that support network connectivity require identification.
We used the InVEST model and habitat connectivity analysis to explore changes in habitat connectivity for shorebirds in the Yellow River Delta from 1975 to 2020; we then identified priority conservation areas and conservation gap areas by locating habitat patches of high importance. Specifically, we attempted to determine (1) how the habitat connectivity of shorebirds in the Yellow River Delta has changed over the last half century (between 1975 and 2020) and identify (2) areas with habitat patches of conservation significance because of their role in maintaining habitat connectivity.

2. Materials and Methods
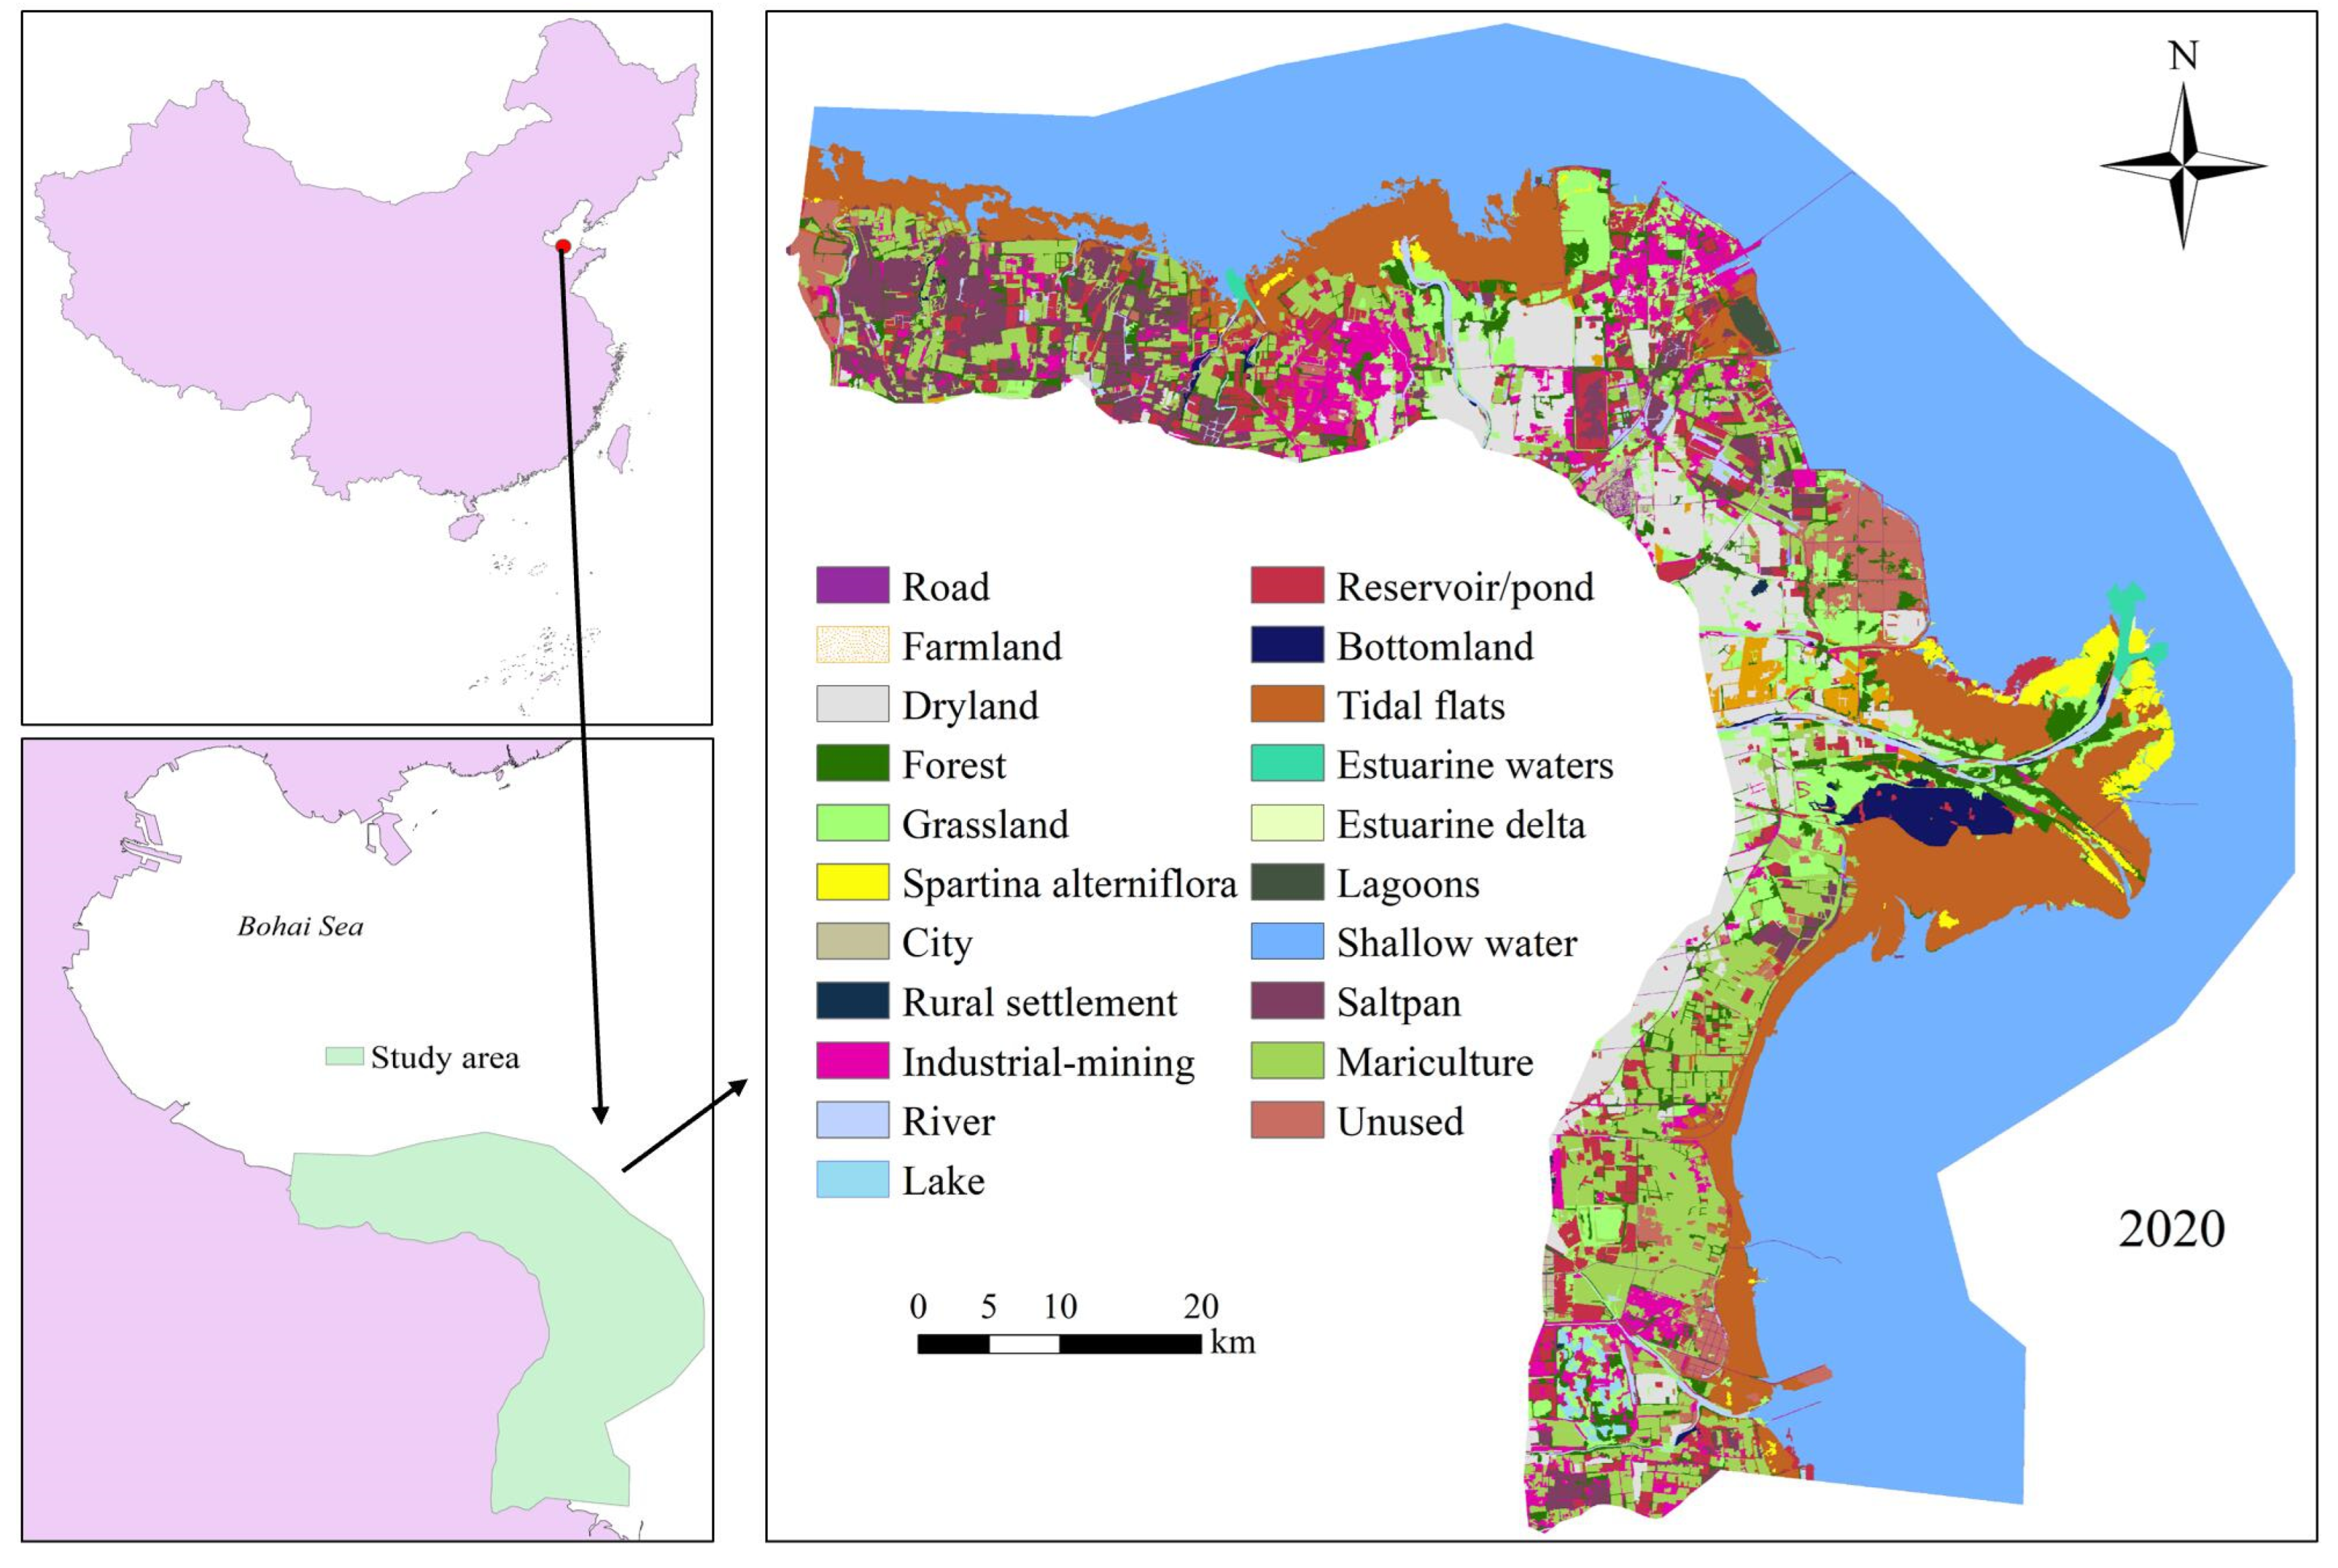
2.1. Study Area

This study was conducted in the Yellow River Delta, which is located along the coast of Dongying (Figure 1). The Yellow River Delta is an important breeding, stopover, and wintering site for migratory waterbirds along the EAAF migratory route. It is a particularly important stopover site for migratory shorebirds, and populations of more than 20 shorebird species meet the Ramsar 1% criterion (exceeding 1% of the total population in the flyway) [16]. Land reclamation [17] and invasion of Spartina alterniflora [18] are responsible for the loss and degradation of coastal wetlands, reductions in habitat patch area, and increases in the distance between habitat patches. These changes pose serious threats to shorebird populations [13].

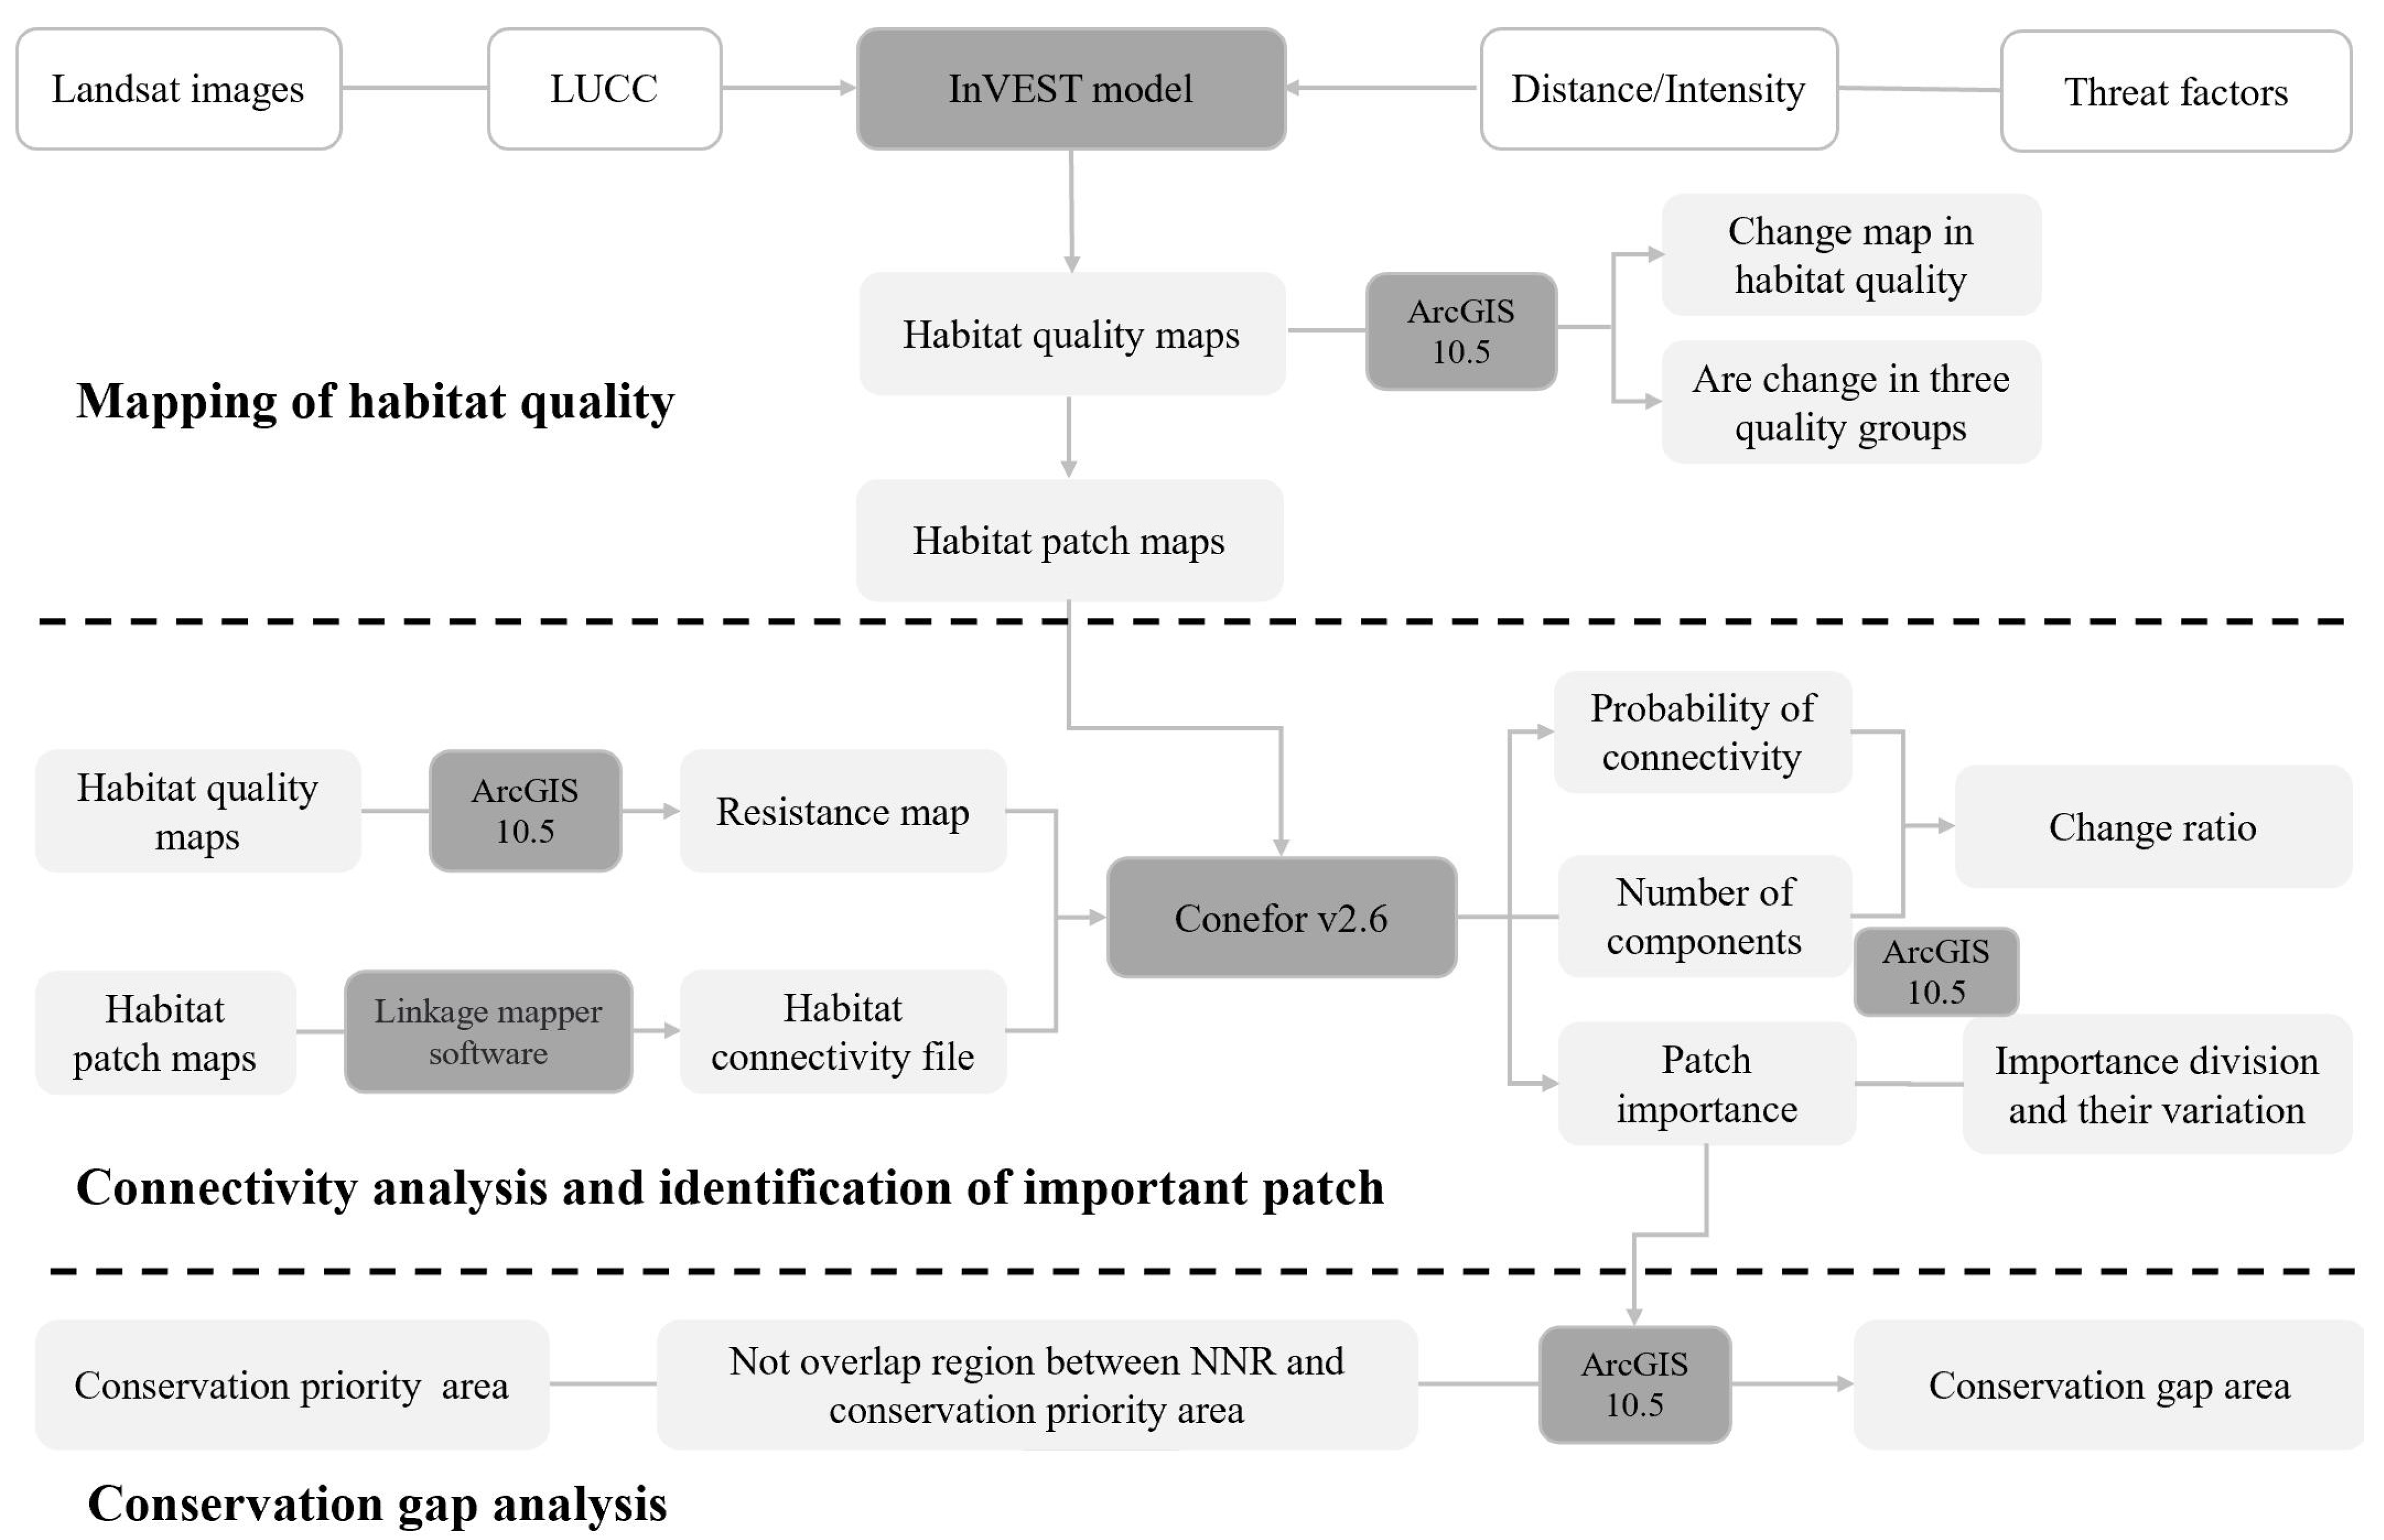
2.2. Habitat Patch Identification

2.2.1. Land-Use/Land-Cover Data

We used an object-oriented classification method to make land-use/land-cover maps in 1975, 1980, 1985, 1990, 1995, 2000, 2005, 2010, 2015, and 2020, with a cell size of 30 m × 30 m. The data sources included Landsat Thematic Mapper/Landsat Enhanced Thematic Mapper satellite images and Landsat 8 Operational Land Images, which were acquired from Geospatial Data Cloud (www.gscloud.cn/sources/, accessed on 15 March 2021) and the USGS Global Visualization Viewer (GloVis) (http://glovis.usgs.gov, accessed on 15 March 2021). The land-use/land-cover map classification system was derived from Di et al. (2014). We used object-based image analysis and support vector machine methods to classify Landsat Thematic Mapper/Landsat Enhanced Thematic Mapper satellite images and Landsat Operational Land Images; we also included information from field investigations of S. alterniflora land cover in the Yellow River Delta for 2010, 2015, and 2020 (S. alterniflora was not common before 2010) [18]. S. alterniflora distribution data were obtained from the Northeast Institute of Geography and Agroecology, Chinese Academy Sciences, with a spatial resolution of 30 m × 30 m. We used ArcGIS 10.5 to incorporate the S. alterniflora land-cover data into land-use/land-cover maps in 2010, 2015, and 2020 (Figure 1).

2.2.2. Habitat Simulation and Conversion

We used the habitat module in InVEST 3.7.0 to estimate shorebird habitat quality between 1975 and 2020 (1975, 1980, 1985, 1990, 1995, 2000, 2005, 2010, 2015, and 2020). The habitat quality module includes two elements: land-cover maps and biodiversity threat factors. It is calculated by Equation (1):
Q i j = H j 1 D i j z D i j z + k z
where Qij is the habitat quality of the ith grid cell in land type j; Hj is the habitat suitability of land type j; Dij represents the effects of threat factors on the ith grid cell in land type j; and z and k are the scaling constant and half-saturation constant, which were 2.5 and 0.5 in this study, respectively, because these values are frequently used in the habitat module of the InVEST model [19].
Habitat quality mainly depends on habitat suitability, which in turn depends on land use and land cover, distance between habitat and threat factors (i.e., threat distance), threat intensity, habitat sensitivity to various threat factors, and the accessibility of degraded sources [19]. Habitat suitability ranged from 0 (lowest habitat suitability) to 1 (highest habitat suitability). Land types included farmland, reservoirs/ponds, bottomlands, tidal flats, estuarine waters, estuarine deltas, saltpans, mariculture, and unused land. These habitat types were extracted from land-use data between 1975 and 2020 with a raster resolution 30 m × 30 m. Habitat suitability values were developed by [15], and input files were in .csv format (Table 1). Data on threat distance, threat intensity, and habitat sensitivity to threat factors were also collected from [15] (Table 1), and these input files were in .csv format. Threat intensity ranged from 0 (lowest threat intensity) to 1 (highest threat intensity). The accessibility of degraded sources is the relative accessibility of the protected areas to threat sources. We divided the Yellow River Delta National Nature Reserve into three parts, the core area, experimental area, and buffer zone, according to the level of human activity permitted. The shapefile boundaries of these three parts were obtained from the Institute of Geographic Sciences and Natural Resources Research, Chinese Academy of Sciences. We set the accessibility values for the core area, experimental area, and buffer zone to 0.1, 0.5, and 1.0, respectively, with higher values indicating greater habitat accessibility.
We used the above input files to run the habitat quality module of InVEST and acquired the habitat quality maps in the Yellow River Delta between 1975 and 2020. The habitat quality score in the habitat quality maps was ranked from 0 to 1, with values closer to 1 indicating higher habitat quality.
We used the “Raster Calculator” in ArcGIS 10.5 to calculate changes in the habitat quality of shorebirds in the Yellow River Delta between 1975 and 2020; we then divided the map into regions in which habitat quality has “declined,” remained “unchanged,” and “increased” and calculated the relative proportions of each category. We categorized habitat quality into three groups using the Jenks natural break method in ArcGIS 10.5 [20,21] according to the habitat quality score between 1975 and 2020: non-habitat (NH), medium- and low-quality habitat (MH), and high-quality habitat (HH). We created a transfer matrix in ArcGIS 10.5, quantified the change in the area of these three groups from 1975 to 2020, and identified the land type to which the habitat was converted.

2.2.3. Connectivity Analysis and Assessment of Patch Importance and Variation

We considered habitat with habitat quality scores above 0.7 as habitat patches. We used the analysis tool of Conefor 2.6 (http://www.conefor.org, accessed on 15 March 2021) to conduct connectivity analysis on the basis of habitat patches in 1975, 1980, 1985, 1990, 1995, 2000, 2005, 2010, 2015, and 2020. Conefor 2.6 is a simple program that quantifies the importance of habitat patches for maintaining landscape connectivity through graph structures and habitat availability indices [7]. A habitat patch file, habitat connectivity file, ecological resistance surface, and maximum dispersal distance of species are required to run this program.
Patch and connectivity files of habitats can be generated using Linkage Mapper software (https://circuitscape.org/linkagemapper, accessed on 15 March 2021) on the basis of habitat patch maps. The ecological resistance surface reflects the difficulty of species migration from one habitat patch to another, and larger resistance values indicate greater difficulty of species movement between two habitat patches [22,23]. In this study, we considered land use categories road, city, rural settlement, industrial-mining, Spartina alterniflora, shallow water, grassland, forest, and dryland have highest resistance to species movement. Because these land use categories were defined as non-habitat types. For habitat categories, we considered patches with lower habitat quality scores have higher resistance to species migration. Thus, we used the reciprocal values of the habitat quality maps as resistance maps. The maximum dispersal distance of shorebird species was set to 4 km according to the maximum home range of shorebird species was assigned on the basis of unpublished GPS tracking data.
We calculated the probability of connectivity (PC) on the basis of the habitat patches of shorebirds between 1975 and 2020. PC is defined as the extent to which there is structural and functional contiguity of the landscape, and a larger PC value indicates higher habitat connectivity [8] (Equation (2)).
P C = i = 1 n j = 1 n a i × a j × p i j * A L 2  
n is the total number of habitat patches; ai and aj are the area of the ith and jth habitat patches, respectively; AL is the largest area of a habitat patch; and p*ij is the maximum product probability of all paths between patches i and j.
PC was calculated using the least-cost distance between two patches. Least-cost distance was transformed into the probability of connection between two patches by a decreasing exponential function (Equation (3)).
p i j = e α d i j
α is a cost distance-decay coefficient, and dij is the linear distance between two patches that a shorebird has to fly over land or an NH patch. pij = 0.05, which corresponds to the maximum dispersal distance of species, and α is usually set to the maximum distance [24].
We calculated the change in PC between 1975 and 2020 (Equation (4)).
P C c h a n g e = P C 2020 P C 1975 P C 1975 × 100
PC2020 and PC1975 indicate PC in 2020 and 1975, respectively.
We calculated the number of components and their variation between 1975 and 2020. A component (or connected region) is a set of habitat patches in which a path exists between every pair of patches. Thus, there is no functional relationship between patches that belong to different components. Additionally, an isolated patch is considered a component. As a landscape gets more connected, it presents fewer components [8].
The patch importance indicates the importance of a patch for maintaining habitat connectivity in the landscape network (Equation (5)).
d P C = 100 % × P C P C r e m o v e P C
dPC is the importance of a patch in the landscape, and larger dPC values indicate higher patch importance. PC is the index value before patch i loss, and PCremove is the index value considering patch i loss.
We divided levels of patch importance into high patch importance (HPI), medium patch importance (MPI), and low patch importance (LPI) by the Jenks natural break method in ArcGIS 10.5. We calculated changes in the number of patches and area of patches of HPI, MPI, and LPI from 1975 to 2020.

2.2.4. Priority Conservation Areas and Conservation Gaps

We defined the habitat patches in the Yellow River Delta in 2020 with HPI and MPI as priority conservation areas. We overlapped the distributions of the Yellow River Delta National Nature Reserve with priority conservation areas and quantified conservation gaps. The boundary of the Yellow River Delta National Nature Reserve was obtained from the Institute of Geographic Sciences and Natural Resources Research, Chinese Academy of Sciences.
The technical flowchart of our method is provided in Figure 2.

3. Results

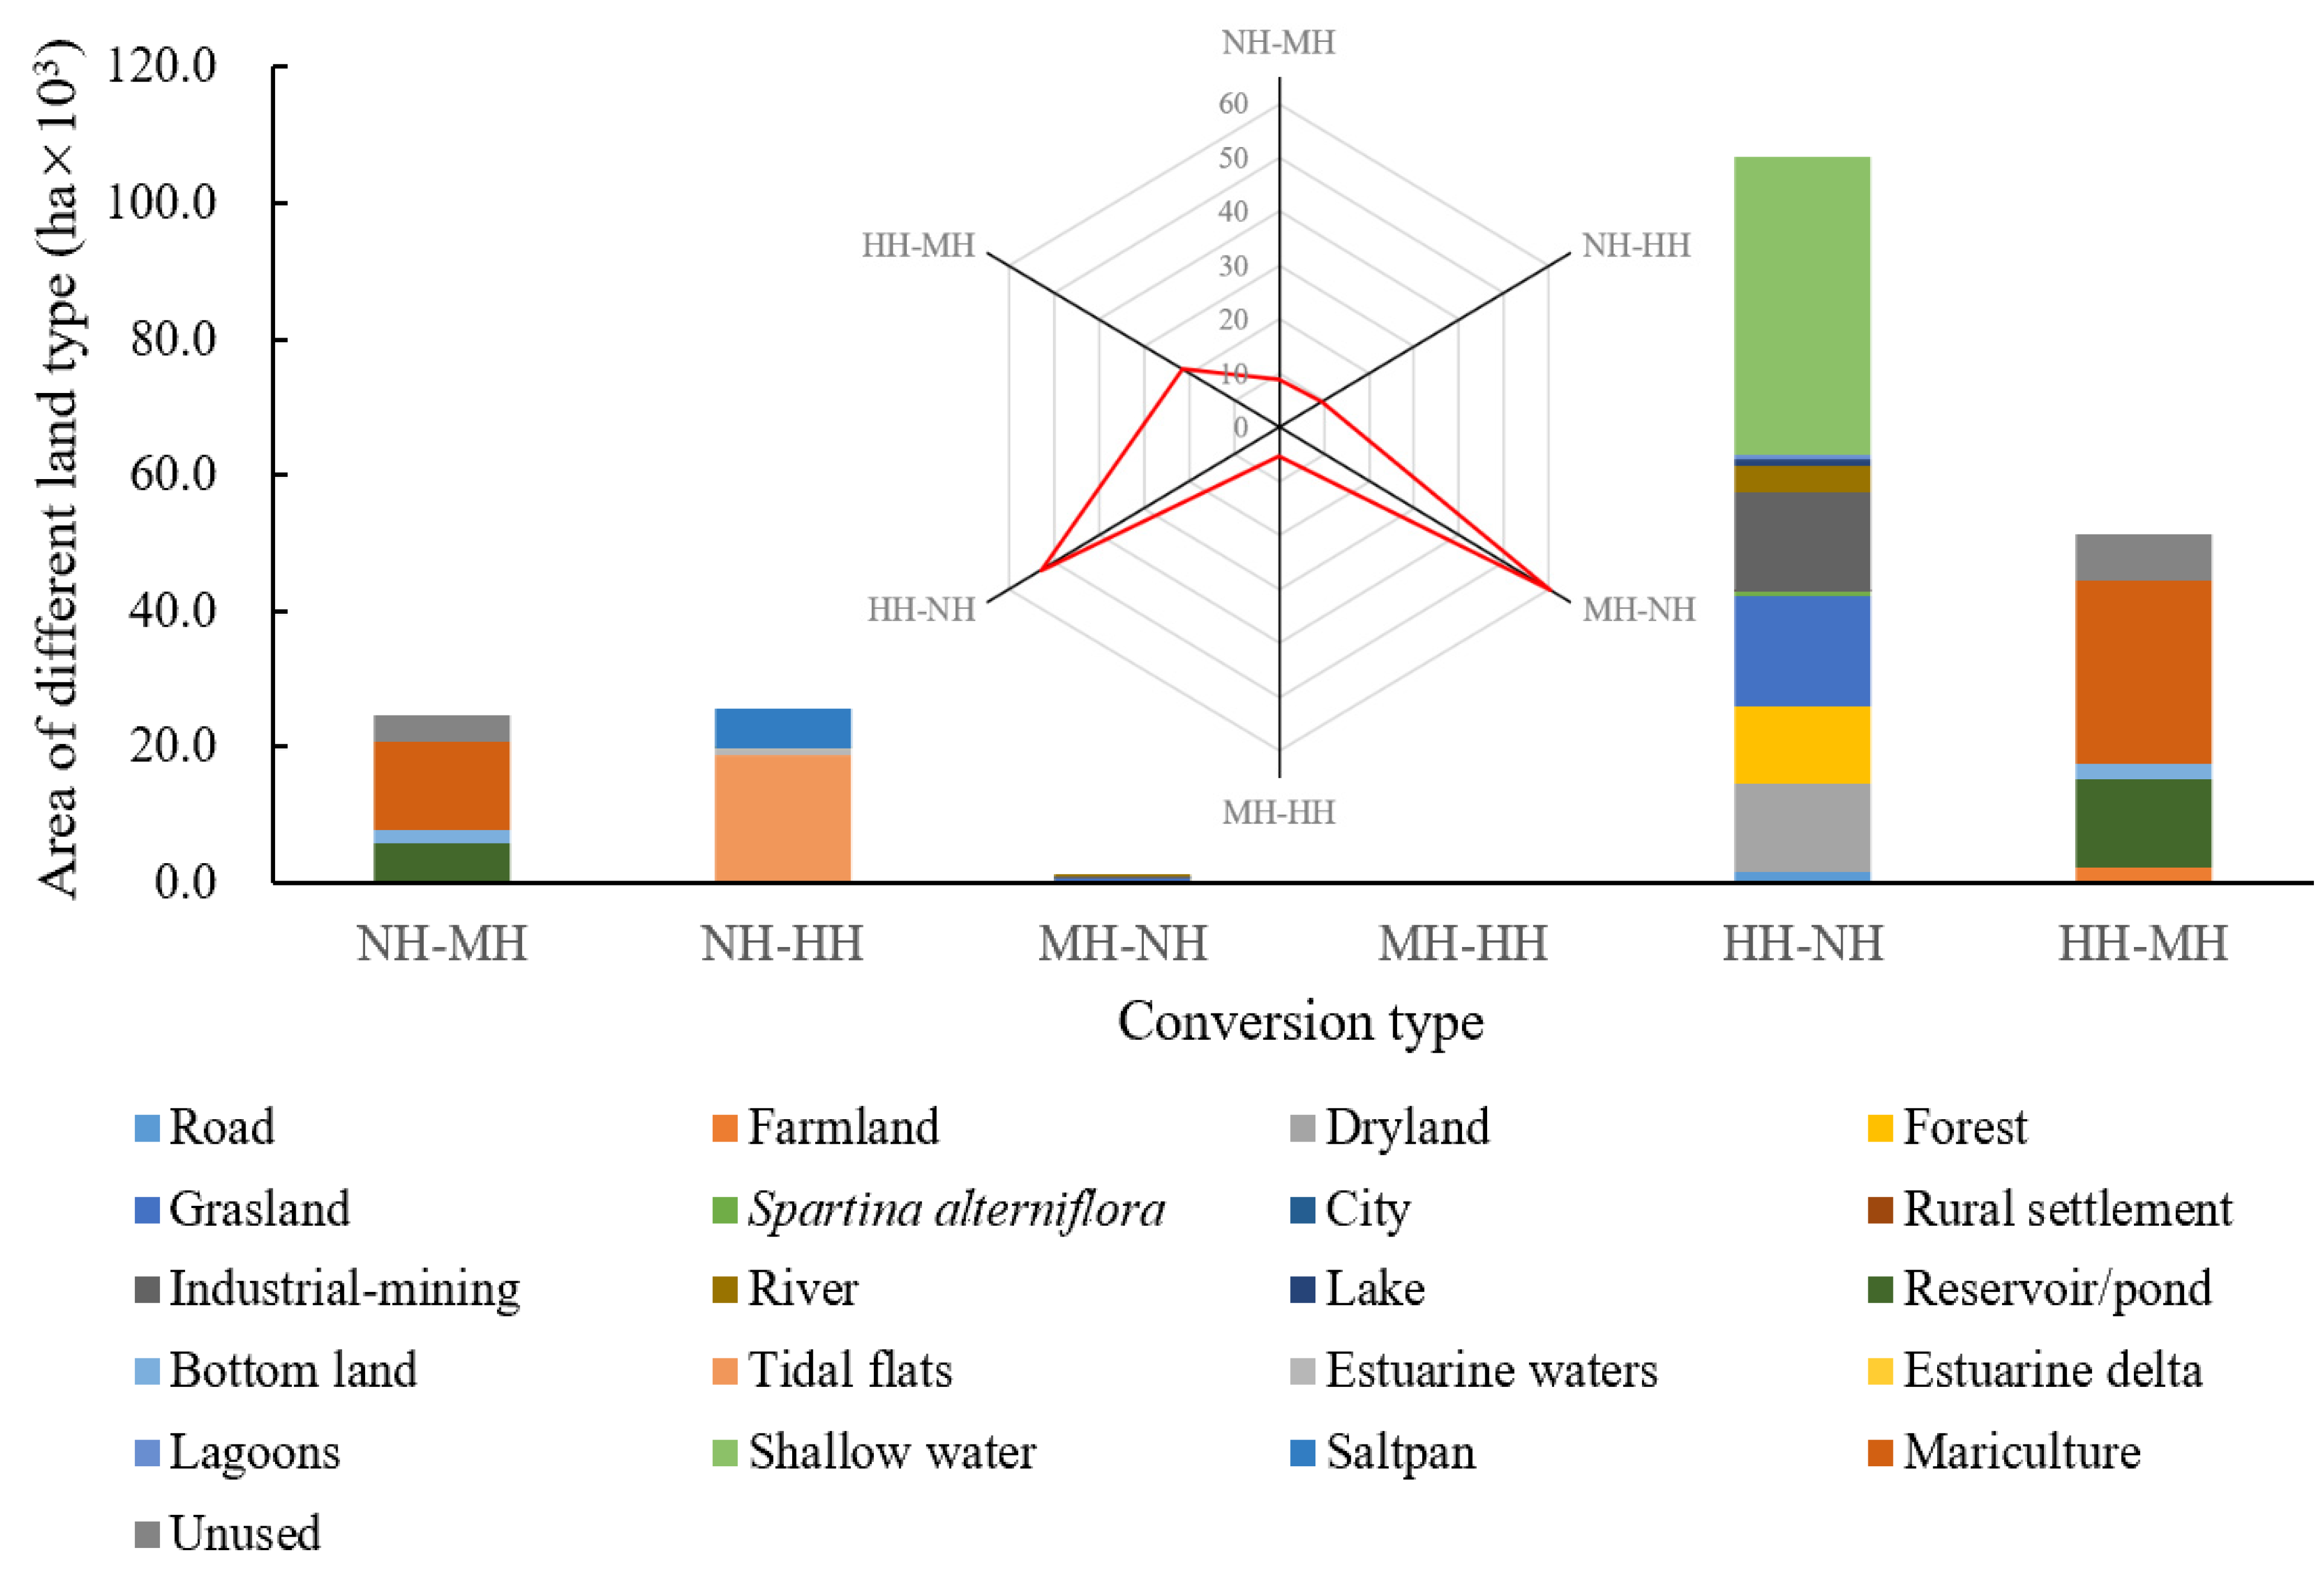
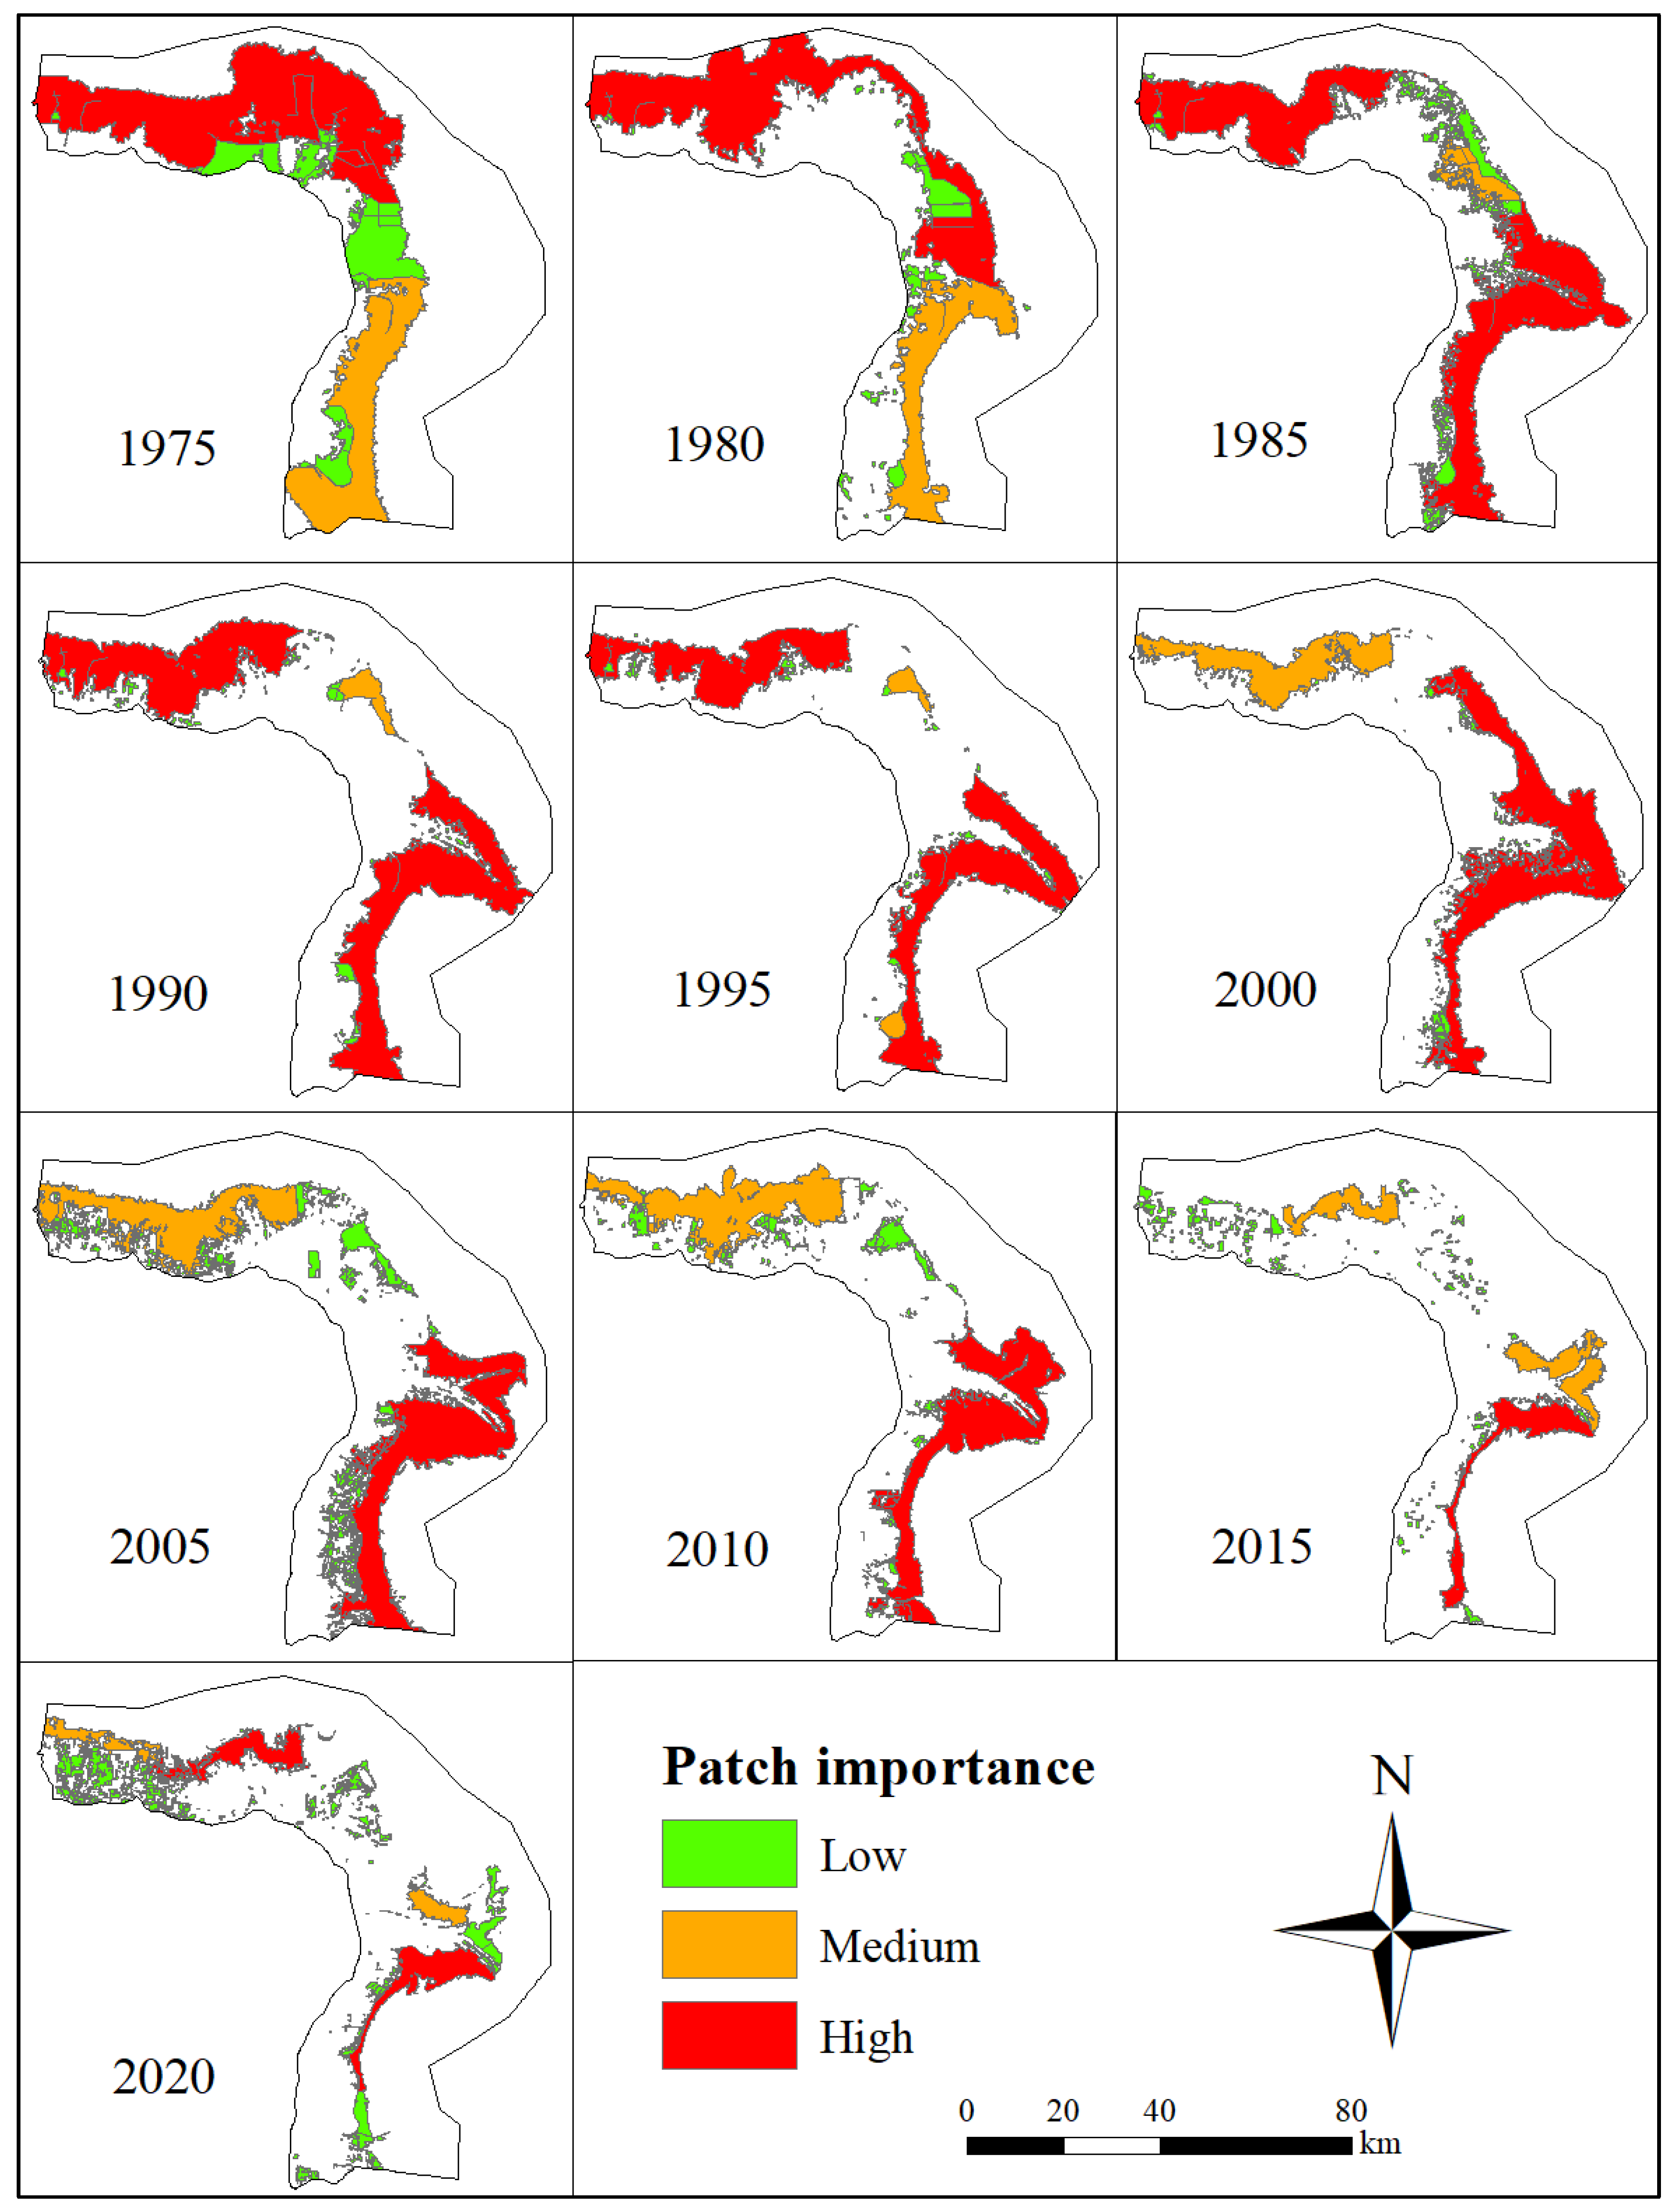
3.1. Changes in Habitat Patches

Shorebird habitat modeled by InVEST was mainly distributed throughout the coastal regions of the Yellow River Delta from 1975 to 2020. Generally, mean habitat quality gradually declined from 0.42 to 0.20 from 1975 to 2020. Overall, 47.0%, 42.0%, and 11.0% of habitat remained unchanged, decreased, and increased in quality, respectively (Figure 3).
Medium- and low-quality habitat (MH) and high-quality habitat (HH) accounted for 0.3% and 42.1% of all habitat in 1975 and 16.0% and 14.5% of all habitat in 2020, respectively. A total of 53.0% of HH and 60.3% of MH were converted to non-habitat (NH), and 21.5% of HH was converted to MH. In contrast, only 9.0% of NH improved to HH and 9.4% to MH (Figure 4). The transfer matrix of land use between 1975 and 2020 showed that habitat loss and degradation (e.g., HH to NH, MH to NH) were mainly caused by the occupation of construction sites and the degradation of artificial wetlands. Among the area of HH that was converted to NH, 13.4% was converted to industrial mining areas. Among the area of HH that was converted to MH, 52.3% was converted to mariculture and 25.2% to reservoirs/ponds. Among the area of MH that was converted to NH, 26.9% was converted to industrial mining areas (Figure 4).

3.2. Change in Habitat Connectivity

The habitat connectivity analysis showed that the number of graph components decreased from 18 to 11 (−38.9%) between 1975 and 2020. The probability of connectivity (PC) decreased from 0.15 to 0.05 (−66.7%). The number of habitat patches significantly increased from 93 to 846 (809.7%), whereas the area of habitat patches decreased by 65.7% (Table 2).
Generally, the patch importance of habitats located in the northern Yellow River Delta declined from high patch importance (HPI) to low patch importance (LPI) (Figure 5). The number of habitats with HPI and medium patch importance (MPI) remained unchanged from 1975 to 2020, whereas the number of habitats with LPI significantly increased from 91 to 842 (825.3%). The area of patches with HPI, MPI, and LPI declined between 1975 and 2020; in particular, areas of patches with HPI and MPI declined by 74.7% and 78.6%, respectively (Table 3).
From 1975 to 2020, 71.0%, 11.6%, and 5.8% of the habitat area with HPI were converted to NH, habitat with LPI, and habitat with MPI, respectively. The area converted was mainly distributed in the northwestern part of the Yellow River Delta. A large intact patch with HPI was segmented into a single patch with MPI and 306 patches with LPI (Figure 6). A total of 58.9%, 11.7%, and 29.4% of the area with MPI was converted to non-habitat patches, habitat with LPI, and habitat with HPI, respectively. A large intact patch with MPI was segmented into 168 patches with LPI and one patch with HPI (Figure 6). The area converted was mainly distributed in the eastern part of the Yellow River Delta.

3.3. Identification of Priority Conservation Areas

We defined habitat patches in the Yellow River Delta with HPI and MPI as priority conservation areas. The total size of priority conservation areas was 389.4 km2, and these areas were mainly distributed in the northwestern and eastern parts of the Yellow River Delta; 125.0 km2 (32.1%) of this area remains unprotected (Figure 7).

4. Discussion

4.1. Change in Shorebird Habitat Quality

The quality of shorebird habitat in the Yellow River Delta modeled by InVEST continuously decreased from 1975 to 2020, and the decrease was greater than 40%. A previous study has shown that the mean habitat quality in the Yellow River Delta declined by more than 20% during 2000–2015, and the area of optimal habitat declined by more than 19% [18]. Shorebird habitat quality in the Yellow River Delta declined from 2000 to 2015 [11], and most waterbird habitat declined in quality in the Yellow and Bohai Seas between 1990 and 2015 [2]. Our results confirmed these findings. Most high-quality habitat (HH) and medium- and low-quality habitat (MH) were degraded because these areas were converted to industrial mining sites and artificial wetlands for mariculture. These results indicate that land reclamation caused by human activities has had a substantial effect on the quality of shorebird habitat in the Yellow River Delta over the past half century. This finding supports the results of a previous study showing that urban development is a major threat to biodiversity [25]. The habitat quality of a small portion of inland edge areas has increased, and these new MHs have been converted to mariculture. Most of these mariculture areas were derived from inland grasslands; this suggests that land reclamation occurs in both inland and coastal regions. In addition, natural factors have altered habitats; for example, new HH has been generated via the expansion of the Yellow River delta during the last few decades [26].

4.2. Change in Habitat Connectivity

The quality of shorebird habitat has declined because land reclamation has significantly altered the spatial structure of habitats. The probability of connectivity gradually declined from 1975 to 2020 and declined by more than 60% between 1975 (0.15) and 2020 (0.05). The number of habitat patches significantly increased nine-fold from 1975 (93) to 2020 (846). This might be the most important reason why the habitat connectivity in this habitat network has declined [9,24]. Changes in land use and land cover stemming from land reclamation have resulted in the conversion of large habitat patches to small habitat patches, and this has increased the patch number but reduced the connectivity between habitat patches.
The analysis of habitat patch importance corroborates these findings. From 1975 to 2020, the number of patches with HPI and MPI remained unchanged, whereas the number of patches with LPI sharply increased. These findings are mainly attributed to the decline in habitat quality and the separation of larger patches into numerous smaller patches [27]; these patches were mainly distributed in the northwestern and eastern parts of the Yellow River Delta. Our results showed that more than 70% of the area with HPI was converted to non-habitat patches and 11.6% was converted to patches with Low patch importance (LPI). More than 50% of the area of patches with medium patch importance (MPI) was converted to non-habitat patches, and 11.7% was converted to patches with LPI. Large intact patches with high patch importance (HPI) and MPI were segmented into 474 patches with LPI. These regions were mainly distributed along the northwestern and eastern parts of the Yellow River Delta. These findings are consistent with the results of previous studies [15,17,28] and indicate that land reclamation poses a serious threat to shorebird habitat connectivity.

4.3. Habitat Conservation and Management

Habitat patches with high connectivity are important for improving the stability of waterbird populations. For example, the middle and lower reaches of the Yangtze River are key wintering sites of waterbirds along the EAAF migratory route [29], and the maintenance of connectivity among habitat patches in this migratory network is critically important [10]. A previous study suggests that the loss of habitat connectivity in the middle and lower reaches of the Yangtze River has induced a rapid population decline in populations of migratory geese [1]. The Yellow River Delta is an important stopover site for highly mobile shorebirds that connects breeding areas and non-breeding areas. Previous studies have confirmed that habitat loss in the Yellow River Delta has greatly contributed to reductions in the numbers of shorebirds [30]. Thus, consideration of the relative contributions of habitat quality scores and habitat patch importance to maintaining habitat connectivity is important for the identification of priority conservation areas and conservation gaps in the Yellow River Delta.
Our results showed that the total size of priority conservation areas for shorebirds was 389.4 km2, and 32.1% of this area remains unprotected; these conservation gaps are distributed along the northwestern and eastern parts of the Yellow River Delta. Our conclusions were made under the guidance of government files, including the No. 42 File issued by the General Office of the Communist Party of China Central Committee in 2019, the No. 48 File issued by the General Office of the Communist Party of China Central Committee in 2019, and the No. 71 File issued by the National Forestry and Grassland Administration of the Ministry of Natural Resources in 2020, which stipulate “at least maintaining the size of protected areas, the protection intensity and the protection property” [31]. To protect the conservation gaps in shorebird habitat in the northwestern and eastern parts of the Yellow River Delta defined in our study, we suggest that the boundary of the protected areas of the Yellow River Delta National Nature Reserve be further expanded to incorporate these areas. The restoration of marine aquaculture ponds to mudflats could also increase the area of natural wetlands. Natural wetland loss is caused by increases in the mariculture area in the Yellow River Delta [32]. The conversion of mariculture to mudflats and the recovery of mudflat wetlands and their ecological functions can be achieved via regulation of hydrology and pollution control. These actions could facilitate the merging of many small habitat patches into a large intact patch and increase shorebird habitat connectivity.

4.4. Limitations and Future Research

Although the InVEST model can assess habitat quality over large spatial and temporal scales, there is still some error and uncertainty associated with these estimates. Sources of degradation, habitat sensitivity to threat sources, habitat quality score, distance between the threat source and habitat, and threat weight were all determined on the basis of expert judgment, which can be inherently subjective. Future analyses should consider using analytical hierarchy process modeling to enhance objectivity. In addition, ecological resistance surfaces were generated on the basis of habitat quality maps because we lack information on the dispersal processes of species; additional field observations of dispersal would greatly aid future analyses.

5. Conclusions

We used the InVEST model and habitat network connectivity analysis to explore spatial–temporal variation in shorebird habitat in the Yellow River Delta; we identified priority conservation areas and conservation gap areas by determining the importance of habitat patches. The quality of shorebird habitat in the Yellow River Delta gradually declined from 1975 to 2020, and high-quality habitat and medium- and low-quality habitat were converted to industrial mining areas and mariculture sites because of land reclamation. The probability of connectivity significantly decreased by 66.7% because of habitat fragmentation. The number of habitat patches significantly increased by 809.7%, whereas the area of habitat patches decreased by 65.7%. Large habitat patches with high patch importance (HPI) and medium patch importance (MPI) were converted to numerous small habitat patches with low patch importance and non-habitat patches. The total priority conservation area with HPI and MPI was 389.4 km2, and 125.0 km2 (32.1%) of this area remains unprotected; these areas were mainly distributed in the northwestern and eastern parts of the Yellow River Delta. We recommend expanding the boundary of the Yellow River Delta National Nature Reserve to incorporate these unprotected areas.

Author Contributions

X.Y. and H.D. planned and designed the research; H.D. collected data; H.D. analyzed data and wrote the manuscript; and H.D. and X.Y. collaboratively revised the manuscript. All authors have read and agreed to the published version of the manuscript.

Funding

This research was funded by the National Natural Science Foundation of China (42101105), the Earth Big Data Scientific Engineering project of the Chinese Academy of Sciences (Grant No. XDA19020305) and the Key Laboratory of Coastal Environmental Processes and Ecological Remediation, YICCAS (Grant No. 2020KFJJ02). The APC was funded by the Earth Big Data Scientific Engineering project of the Chinese Academy of Sciences (Grant No. XDA19020305).

Data Availability Statement

The data that support the findings of this study are available from the corresponding author upon reasonable request.

Conflicts of Interest

The authors declare no conflict of interest.

References

  1. Xu, Y.J.; Si, Y.L.; Wang, Y.Y.; Zhang, Y.; Prins, H.H.T.; Cao, L.; de Boer, W.F. Loss of functional connectivity in migration networks induces population decline in migratory birds. Ecol. Appl. 2019, 29, e01960. [Google Scholar] [CrossRef] [PubMed] [Green Version]
  2. Murray, N.J.; Fuller, R.A. Protecting stopover habitat for migratory shorebirds in East Asia. J. Ornithol. 2015, 156, 217–225. [Google Scholar] [CrossRef]
  3. Macarthur, R. The Theory of Island Biogeography; Princeton University Press: Princeton, NJ, USA, 1967. [Google Scholar]
  4. Duan, H.L.; Yu, X.B.; Xia, S.X.; Liu, Y. Conserving unprotected important sites for shorebirds on China’s coasts. Ecosphere 2022, 13, e3950. [Google Scholar] [CrossRef]
  5. Bai, Q.Q.; Chen, J.Z.; Chen, Z.H.; Dong, G.T.; Han, Y.X.; Lu, G.; Li, J.; Liu, Y.; Lin, Z.; Meng, D.R.; et al. Identification of coastal wetlands of international importance for waterbirds: A review of China coastal Waterbird surveys 2005–2013. Avian Res. 2015, 6, 1–16. [Google Scholar] [CrossRef] [Green Version]
  6. Studds, C.E.; Kendall, B.E.; Murray, N.J.; Wilson, H.B.; Rogers, D.I.; Clemens, R.S.; Gosbell, K.; Hassell, C.J.; Jessop, R.; Melville, D.S.; et al. Rapid population decline in migratory shorebirds relying on Yellow Sea tidal mudflats as stopover sites. Nat. Commun. 2017, 8, 14895. [Google Scholar] [CrossRef] [Green Version]
  7. Wang, C.; Zhou, Y.; Zhang, H.B.; Li, Y.F.; Liu, H.Y.; Dong, B. Study on the rare waterbird habitat networks of a new UNESCO World Natural Heritage site based on scenario simulation. Sci. Total Environ. 2022, 843, 157058. [Google Scholar] [CrossRef] [PubMed]
  8. Zhao, H.Z.; Liu, D.F.; Li, F.X.; Liu, X.J.; Niu, J.Q.; He, J.H.; Liu, Y.L. Incorporating spatio-temporal connectivity for prioritized conservation of individual habitat patches in a dynamic landscape. Ecol. Indic. 2021, 124, 107414. [Google Scholar] [CrossRef]
  9. Tarabon, S.; Bergès, L.; Dutoit, T.; Nondedeu, F.I. Environmental impact assessment of development projects improved by merging species distribution and habitat connectivity modelling. J. Environ. Manag. 2019, 241, 439–449. [Google Scholar] [CrossRef] [Green Version]
  10. Xu, Y.J.; Si, Y.L.; Takekawa, J.; Liu, Q.; Prins, H.H.T.; Yin, S.L.; Prosser, D.J.; Gong, P.; de Boer, W.F. A network approach to prioritize conservation efforts for migratory birds. Conserv. Biol. 2019, 34, 416–426. [Google Scholar] [CrossRef] [Green Version]
  11. Duan, H.L.; Xia, S.X.; Hou, X.Y.; Liu, Y.; Yu, X.B. Conservation planning following reclamation of intertidal areas throughout the Yellow and Bohai Seas, China. Biodivers. Conserv. 2019, 28, 3787–3801. [Google Scholar] [CrossRef]
  12. Hou, X.Y.; Ning, J.C.; Xing, Q.G.; Yu, X.B. Remote Sensing on Wetland Habitat Evolution in the Yellow River Delta; Science Press: Beijing, China, 2020. [Google Scholar]
  13. Paulson Institute. Blueprint of coastal wetland conservation and management in China. In Institute of Geographic Sciences and Natural Resources Research, CAS; Higher Education Press: Beijing, China, 2016. [Google Scholar]
  14. Mao, D.H.; Wang, Z.M.; Wu, J.G.; Wu, B.F.; Zeng, Y.; Song, K.S.; Yi, K.P.; Luo, L. China’s wetlands loss to urban expansion. Land Degrad. Dev. 2018, 29, 2644–2657. [Google Scholar] [CrossRef]
  15. Li, X.W.; Hou, X.Y.; Song, Y.; Shan, K.; Zhu, S.Y.; Yu, X.B.; Mo, X.Q. Assessing changes of habitat quality for shorebirds in stopover sites: A case study in Yellow River Delta, China. Wetlands 2018, 39, 67–77. [Google Scholar] [CrossRef]
  16. Xia, S.X.; Yu, X.B.; Millington, S.; Liu, Y.; Jia, Y.F.; Wang, L.Z.; Hou, X.Y.; Jiang, L.G. Identifying Priority Sites and Gaps for the Conservation of Migratory Waterbirds in China’s Coastal Wetlands. Biol. Conserv. 2016, 210, 72–82. [Google Scholar] [CrossRef]
  17. Ma, T.T.; Li, X.W.; Bai, J.H.; Cui, B.S. Habitat modification in relation to coastal reclamation and its impacts on waterbirds along China’s coast. Glob. Ecol. Conserv. 2019, 17, e00585. [Google Scholar] [CrossRef]
  18. Mao, D.H.; Liu, M.Y.; Wang, Z.M.; Li, L.; Man, W.D.; Jia, M.M.; Zhang, Y.Z. Rapid Invasion of Spartina Alterniflora in the Coastal Zone of Mainland China: Spatiotemporal Patterns and Human Prevention. Sensors 2019, 19, 2308. [Google Scholar] [CrossRef] [Green Version]
  19. Sharp, R.; Douglass, J.; Wolny, S.; Chaplin-Kramer, R.; Nelson, E.; Ennaanay, D.; Wolny, S.; Olwero, N.; Vigerstol, K.; Pennington, D.; et al. InVEST + VERSION + User’s Guide. 2016. Available online: https://invest-userguide.readthedocs.io/en/latest/index.html (accessed on 22 October 2022).
  20. Alexander, J.L.; Olimb, S.K.; Bly KL, S.; Restani, M.; Notes, A. Use of least-cost path analysis to identify potential movement corridors of swift foxes in Montana. J. Mammal. 2016, 97, 891–898. [Google Scholar] [CrossRef] [Green Version]
  21. Poor, E.E.; Loucks, C.; Jakes, A.; Urban, D.L. Comparing habitat suitability and connectivity modeling methods for conserving pronghorn migrations. PLoS ONE 2012, 7, e49390. [Google Scholar] [CrossRef]
  22. Dickson, B.G.; Albano, C.M.; McRae, B.H.; Anderson, J.J.; Theobald, D.M.; Zachmann, L.L.; Sisk, T.D.; Dombeck, M.P. Informing Strategic Efforts to Expand and Connect Protected Areas Using Model of Ecological Flow, with Application to the Western United States. Conserv. Lett. 2017, 10, 564–571. [Google Scholar] [CrossRef]
  23. Spear, S.F.; Balkenhol, N.; Fortin, M.J.; Mcrae, B.H.; Scribner, K. Use of resistance surfaces for landscape genetic studies: Considerations for parameterization and analysis. Mol. Ecol. 2010, 19, 3576–3591. [Google Scholar] [CrossRef]
  24. Urban, D. Landscape connectivity: A graph-theoretic perspective. Ecology 2001, 82, 1205–1218. [Google Scholar] [CrossRef]
  25. Snyder, C.D.; Young, J.A. Identification of management thresholds of urban development in support of aquatic biodiversity conservation. Ecol. Indic. 2020, 112, 106124. [Google Scholar] [CrossRef]
  26. Zhu, Q.T.; Li, P.; Li, Z.H.; Pu, S.X.; Wu, X.; Bi, N.X.; Wang, H.J. Spatiotemporal changes of coastline over the Yellow River Delta in the previous 40 years with Optical and SAR Remote Sensing. Remote Sens. 2021, 13, 1940. [Google Scholar] [CrossRef]
  27. Wang, G.; Wang, C.; Guo, Z.R.; Liu, H.Y.; Chen, H.; Zhang, Y.N.; Zhao, Y.X.; Cheng, H.; Ma, T.W.; Xue, F. Integrating Maxent model and landscape ecology theory for studying spatiotemporal dynamics of habitat: Suggestions for conservation of endangered Red-crowned crane. Ecol. Indic. 2020, 116, 106472. [Google Scholar] [CrossRef]
  28. Duan, H.L.; Xia, S.X.; Jackson, M.V.; Zhao, N.; Liu, Y.; Teng, J.K.; Meng, Z.; Yu, X.B.; Shi, J.B. Identifying new sites of significance to waterbirds conservation and their habitat modification in the Yellow and Bohai Seas in China. Glob. Ecol. Conserv. 2020, 22, e01031. [Google Scholar] [CrossRef]
  29. Xia, S.X.; Yu, X.B.; Lei, J.Y.; Hearn, R.; Smith, B.; Lei, G.; Xie, P. Priority sites and conservation gaps of wintering waterbirds in the Yangtze River floodplain. J. Geogr. Sci. 2020, 30, 1617–1632. [Google Scholar] [CrossRef]
  30. Duan, H.L.; Yu, X.B.; Shan, K.; Zhang, C.H.; Liu, H.F. Effects of habitat loss on migratory shorebird community structure at stopover sites: A case study in the Yellow River Delta, China. Front. Mar. Sci. 2022, 9, 1049765. [Google Scholar] [CrossRef]
  31. Yu, X.B.; Zhang, L. Green Paper of China’s Coastal Wetland Conservation; Science Press: Beijing, China, 2020. [Google Scholar]
  32. Jackson, M.V.; Fuller, R.A.; Gan, X.J.; Li, J.; Mao, D.H.; Melville, D.S.; Murray, N.J.; Wang, Z.M.; Choi, C.Y. Dual threat of tidal flat loss and invasive Spartina alterniflora endanger important shorebird habitat in coastal mainland China. J. Environ. Manag. 2021, 278, 111549. [Google Scholar] [CrossRef]
Figure 1. The Yellow River Delta and its land use and land cover in 2020.
Remotesensing 14 06191 g001
Figure 2. Methodological framework.
Remotesensing 14 06191 g002
Figure 3. InVEST habitat quality model of the Yellow River Delta between 1975 and 2020.
Remotesensing 14 06191 g003
Figure 4. Conversion ratio between different habitat quality categories and causes of habitat conversion. Non-habitat (NH), medium- and low-quality habitat (MH), and high-quality habitat (HH).
Remotesensing 14 06191 g004
Figure 5. Habitat patch importance for maintaining habitat connectivity between 1975 and 2020.
Remotesensing 14 06191 g005
Figure 6. Change in the area and number of patches with high patch importance (A) and medium patch importance (B) between 1975 and 2020. LPI: Low patch importance, MPI: Medium patch importance, HPI: High patch importance, NHP: Non-habitat patch.
Remotesensing 14 06191 g006
Figure 7. Priority conservation and gap areas in the Yellow River Delta and their percentages.
Remotesensing 14 06191 g007
Table 1. Input data for the habitat quality module in the InVEST model.
ThreatsThreat Distance (km)WeightLand Cover Maps Considered as Habitat
FarmlandReservoir/PondBottomlandTidal FlatsEstuarine WatersEstuarine DeltaSaltpanMaricultureUnused
Habitat suitability
0.400.250.181.000.891.000.700.550.19
Habitat sensitivity for threats
City7.100.901.000.411.000.800.700.750.310.410.90
Rural settlement4.000.680.800.400.500.290.210.390.300.400.75
Industrial-mining5.600.800.600.010.400.350.340.320.010.010.95
Mariculture14.00.920.100.010.100.950.700.800.010.010.30
Road0.500.710.800.500.301.000.800.800.600.500.50
Unused0.100.500.010.100.100.200.100.100.010.100.01
Spartina alterniflora0.501.000.100.100.100.900.900.900.300.300.30
Table 2. Assessment of habitat connectivity in the Yellow River Delta between 1975 and 2020.
Graph Characteristics1975198019851990199520002005201020152020Change between 1975 and 2020
Number of components18261820282219211811−38.9%
Number of habitat patches9382321142150189515330401846809.7%
Mean size of habitat patches (km2) 2014.71520.21514.01298.81064.81141.51329.21121.9536.5691.5−65.7%
Probability of connectivity0.150.110.080.070.050.070.060.050.060.05−66.7%
Table 3. Number and area of patches with low, medium, and high patch importance in the Yellow River Delta between 1975 and 2020.
1975198019851990199520002005201020152020Change between 1975 and 2020
Numbers of low patch importance9180318139146187513328398842825.3%
Numbers of medium patch importance1111211122100%
Numbers of high patch importance1122211112100%
Area of low patch importance (km2)394.9161.6208.564.447.153.4267.9153130.9302.1−23.5%
Area of medium patch importance (km2)514.339386.856.657314.1385.1399.6230.7110.1−78.6%
Area of high patch importance (km2)1105.5965.61236.51177.9960.777476.2569.3174.8279.2−74.7%
Publisher’s Note: MDPI stays neutral with regard to jurisdictional claims in published maps and institutional affiliations.

