Technical Note

High Spatiotemporal Flood Monitoring Associated with Rapid Lake Shrinkage Using Planet Smallsat and Sentinel-1 Data

1
Research Institute for Humanity and Nature, Kyoto 603-8047, Japan
2
Graduate School of Science and Technology for Innovation, Yamaguchi University, Ube 755-8611, Japan
3
Center for Research and Application of Satellite Remote Sensing, Yamaguchi University, Ube 755-8611, Japan
*
Author to whom correspondence should be addressed.
Remote Sens. 2023, 15(4), 1099; https://doi.org/10.3390/rs15041099
Submission received: 14 January 2023 / Revised: 12 February 2023 / Accepted: 13 February 2023 / Published: 17 February 2023
(This article belongs to the Special Issue Remote Sensing of Floods: Progress, Challenges and Opportunities)

Abstract

:
High spatiotemporal flood monitoring is critical for flood control, mitigation, and management purposes in areas where tectonic and geological events significantly exacerbate flood disasters. For example, the rapid lake shrinkage resulting from the transformations of enclosed seas into lakes by the rapid land movement in the collision zone dramatically increases the flood risks in Indonesia, which requires frequent and detailed monitoring and assessment. This study primarily quantified the detailed flood disasters associated with the rapid lake shrinkage in Gorontalo Regency in Gorontalo Province, Indonesia using high spatiotemporal monitoring with a combination of PlanetScope smallsat constellations, Sentinel-1, and surface water datasets. Based on the findings that indicated its volume, distribution, pace, and pattern, the flood event that occurred in Gorontalo in November 2022 was demonstrated within a short interval of 2–12 days. The results also indicate both direct and indirect floodwater overflow from different water resources. Combining these results with the surface water occurrences from 1984 to 2021, our findings reveal the historical major flood-prone areas associated with the rapid lake shrinkage. These findings are expected to aid in the timely high spatiotemporal monitoring of rapid environmental change-induced flood disasters, even in tropical regions with high cloud coverage. Furthermore, these are also expected to be integrated into the flood hazard mitigation and management strategies associated with local-specific tectonic and geological systems.

Graphical Abstract

1. Introduction

The combinations of natural environmental degradation and human activities and decisions have inextricably influenced the capacities of the world’s ecosystems [1,2,3], such as lake systems [4,5,6,7,8,9]. Flood is an overflow of water that temporarily submerges land [10], and it is one of the most destructive environmental hazards, costing human lives and displacement, loss of livelihood, infrastructural damage, and agricultural losses [11,12]. Therefore, quantifying the spatiotemporal dynamic distribution of floodwater is critical for damage assessment, disaster preparedness, mitigation, management, and recovery activity purposes [13,14,15,16]. Meanwhile, local tectonic and geological systems also cause rapid changes in the lake systems [4,17], thereby significantly accelerating flood risks.
Indonesia lies on the contact point between the Eurasian–Australian plates, which still experience an uplift movement that results in various unusual geological phenomena [17,18]. For example, Limboto Lake on Sulawesi Island is rapidly shrinking [17,19,20] as a result of rapidly induced erosion of the inner bay sediments formed during the plate collision due to the pre-Pleistocene uplift [17]. The overgrowth and massive distributions of invasive floating plants, such as the water hyacinth, have also contributed to lake siltation and land conversion [17,21]. Furthermore, this substantial lake shrinkage has decreased the lake’s water-storing capacity and increased its high vulnerability to floods, especially in converted lands (land that is converted from the lake for other purposes such as agricultural activities). Even if a lake returns to its previous extent during the ongoing and postflood stages, it is regarded as a flooded area in this study.
As remote sensing techniques advance, an increasing number of Earth observation satellites are available to monitor natural hazards and disasters over time at various spatiotemporal scales [22,23,24,25,26,27,28,29,30,31,32]. This technology provides a basis for rapid and effective responses to natural hazards and disasters (e.g., floods) by capturing Earth’s surface information, even in remote, inaccessible, and dangerous areas [23]. Previous studies investigated the time-series surface water distribution using passive optical sensors, active microwave radar sensors, their combination, or remote sensing techniques and hydraulic modeling. The passive optical systems provide unique data on the land surface, which is appropriate for land use or landcover (LC) classification because of their exceptional spatial, spectral, and temporal resolution [33] and quick and precise retrieval capacity [16]. However, they are easily affected by the cloud cover, particularly in tropical regions, which experience a high cloud coverage [34,35,36,37,38,39]. The active microwave radar systems acquire the backscattered intensity information of the surface using cloud-penetrating properties [40], thereby overcoming the weather-related limitations of passive sensors. In previous studies, moderate resolution imagery, such as the moderate resolution imaging spectroradiometer (~250 m, twice a day) [24,25,26], Landsat (~30 m, 16 days) [27,28], Environmental Satellite (~150 m, 35 days) [41], Radarsat-2 [a Synthetic Aperture Radar (SAR) operation system, ~100 m, 24 days] [41], and Sentinel-1 (S-1) [SAR, 10 m, 12 days) [29,30], are widely used with various flood detection methodologies. Although timely and detailed flood maps are required for effective flood management, none of them can be solely implemented for the timely investigation of disaster and relief supply [31,32]. A combination of optical and SAR sensors has been used to overcome these limitations [15,16,31,33]. This remote sensing technique has been used in various applications such as flood mapping [27,29,30,33,41], impact assessment on vegetation [24,33,42], and monitoring spatiotemporal dynamics of flood water [13,16,26,31,43]. Although the number of flood surface observations has improved, high spatiotemporal, detailed information is still essential to analyze the dynamics of an ongoing flood and postflood recovery processes [33], particularly in regions of high flood vulnerability resulting from rapid environmental changes.
Previous studies on flood monitoring largely relied on areas where floods occurred due to climate change, human-induced activities, or combinations of these factors [4,5,6,7,8,9]. However, the complexity of flood disasters associated with rapid lake shrinkage caused by unique tectonic and geological systems, such as inner bay creations under land uplifts and rapid erosion of the inner bay sediments, has not yet been well explored. Limited studies conducted in such important areas revealed the details of flood inundation areas with more than two-month intervals [44], flood detection using before and postflooding imageries [45], and flood simulation [46]. However, a dramatic increase in flood hazard threats resulting from such local tectonic and geological systems urgently necessitates a considerable amount of detailed spatiotemporal analyses. Challenges related to the dense cloud cover remain in tropical regions experiencing heavy rainstorms. Therefore, using high spatiotemporal observations combined with SAR-based information may be the key to identifying details such as floodwater distribution, postflood recovery, and high-risk areas over time. In line with this, applying high spatiotemporal commercial observation smallsats, such as PlanetScope’s (PS) smallsat constellations (SSCs), comprising multiple satellite groups with approximately 3 m spatial resolutions [47], is critical in identifying details on daily, weekly, and monthly bases.
This study primarily investigates the flood disasters associated with the rapid lake shrinkage under unique tectonic and geological systems in Gorontalo Regency in Gorontalo Province, Indonesia. Particularly, specific objectives are to (1) investigate the converted lands associated with the rapid lake shrinkage from 1978 to 2020 using Landsat series, (2) assess the detailed floodwater distribution and recovery processes from 2021 to 2022 using a combination of the PS-SSC and S-1 series, and (3) characterize major flood-prone areas associated with historical water occurrences from 1984 to 2021 and the world LC map 2020 datasets.
Here, the novelty of our study includes developing a novel spatiotemporal flood monitoring system in flood-prone areas due to unique tectonic and geological systems using a combination of multiple sensors and data sources.

2. Materials and Methods

2.1. Overall Methodological Workflow

Figure 1 shows the methodological workflow used in this study, which is organized into four main steps to achieve its primary objective of investigating the flood disasters associated with the rapid lake shrinkage. First, the converted lands were identified using a supervised classification method using the Landsat series (1978–2020). Second, the flood-inundated areas and their recovery processes along major river areas and converted lands identified from Step 1 were analyzed using a combination of the PS-SSC and S-1 series (2021–2022). Here, the supervised classification and unsupervised image thresholding methodologies were applied to the PS-SSC and S-1 series, respectively. Third, the potential flood-inundated areas were extracted using water occurrence datasets (1984–2021). Fourth, major flood-prone areas were identified by overlaying the results generated from Steps 1–3. This study presents a discussion based on its findings. The numbers in Figure 1 correspond to the specific objectives mentioned in the Introduction section. The methods used in each step are described in the subsequent sections.

2.2. Study Area

Limboto Lake plays a remarkable hydrological, ecological, socioeconomic, and cultural role at the local and regional levels [17,38,48]. It receives water from 23 rivers, of which Alopohu River is the major contributor of river sediments, creating a delta in the lake’s western part [17,38]. Unfortunately, it is one of the 10 critically endangered lakes in the country [49] due to various factors, such as geological characteristics [17], human activities [50], and climate change. Our study area is located in the Gorontalo flat lowland plain, particularly on the western side of the lake (Figure 2). Lowland agriculture, such as crop cultivation, is mainly practiced in this area.
The high-intensity precipitation in this region caused river overflows on 6 November 2021, which influenced several subdistricts and affected 3634 people and 1262 houses with a maximum flood depth of 1 m [51].

2.3. Satellite Imagery and Data Processing

2.3.1. Landsat Series

Landsat surface reflectance products from 1978 to 2020 were used to investigate the converted lands resulting from the rapid lake shrinkage. Imagery was chosen based on seasons (April and May) and cloud coverage (<30%) to minimize the potential impacts from meteorology and agricultural activities. Subsequently, cloud-masking functions were applied to the acquired Landsat 3, 5, 7, and 8 imageries. Indices, such as the bare soil index (BSI), modified normalized difference water index (MNDW), built-up index (NDBI), and normalized difference vegetation index (NDVI), were then generated using Equations (1)–(4). The elevation and slope data acquired from the Advanced Land Observation Satellite World 3D-30 m were also added to each median composite together with the above-generated indices to increase the classification quality. Subsequently, the data were normalized to the 0–1 range.
BSI = ((Red + SWIR) − (NIR + Blue))/((Red + SWIR) + (NIR + Blue))
MNDWI = (GreenSWIR)/(Green + SWIR)
NDBI = (SWIRNIR)/(SWIR + NIR)
NDVI = (NIRRed)/(NIR + Red)

2.3.2. PlanetScope Series

PlanetScope’s SuperDove (PS-SD) surface reflectance products (Ortho Scene–Analytic Level 3B) [52] from 2021 to 2022 were used to investigate the detailed flood inundation extents and recovery processes in the ongoing and postflood stages. After applying a cloud-masking function, the NDVI, elevation, and slope were added to each image and normalized.

2.3.3. Sentinel-1 Series

The S-1 C-band SAR level-1 grand range detected datasets (interferometric wide-swath mode, descending, vertical–vertical polarization) were used to supplement the PS-SD datasets. The S-1 image acquired on 28 July 2021 was selected as a preflood stage by referring to the Climate Hazards Group InfraRed Precipitation with Station (CHIRPS) data. Image processing, including speckle filtering, terrain correction, and conversion of the intensity value of σ0, was applied.

2.3.4. Surface Water and World Landcover Datasets

The European Commission (EC) Joint Research Center (JRC) Global Surface Water Mapping Layers (GSWML) v1.4 (1984–2021) and the European Space Agency (ESA) WorldCover 10 m 2020 (WC2020) products were also used to determine the long-term changes in the surface water occurrences (SWOs). The GSWML product contained different surface water data facets generated based on Landsat 5, 7, and 8 products with a 30 m ground resolution [53]. The WC2020 dataset provided a global LC map of 2020 with a 10 m ground resolution generated by the S-1 and Sentinel-2 datasets [54]. First, the GSWML dataset’s water occurrence band representing the surface water frequency from 1984 to 2021 was primarily used to investigate the areas that floods may historically have caused. We primarily considered the SWOs less than 20% (SWO < 20) as flood-affected surface water extents. Second, the open water and herbaceous wetland classes were extracted from the WC2020 product. Third, the resulting images generated from Step 1 were masked by the results from Step 2. Postclassification was applied, thereafter.

2.3.5. Climate Hazards Group InfraRed Precipitation with Station Dataset

The time-series precipitation in the study area was simultaneously assessed using the CHIRPS data to regard vulnerability to the flood hazards. The precipitation trends were also statistically evaluated using the nonparametric Mann–Kendall test with significance at the 95% confidence level, followed by Sen’s slope test if any trend existed.
The Landsat, PS-SD, S-1, GSWML, WC2020, and CHIRPS datasets were processed via Google Earth Engine. Consequently, four medium Landsat images, five PS-SD, eight S-1 images, and one water occurrence image were generated. Table 1 summarizes the main specifications of the imagery and sensors used in this work [47].

2.4. Landcover Classification and Accuracy Assessment

The LC classes were categorized into agriculture/barren, built-up, vegetation, and water in the Landsat and PS-SD series. A supervised classification was applied to the results generated from Section 2.3.1 and Section 2.3.2 for the time-series LC transformation (LCT) analysis. Moreover, the ground control points were determined at the pixel level. A simple random forest classifier with 50 decision trees was used. The overall accuracy was employed to evaluate the accuracy of the produced maps. Various SAR-based techniques for flood detection were used; however, threshold-based methods are commonly applied in unsupervised classification owing to their simplicity and flexibility [13]. For the S-1 datasets generated from Section 2.3.3, the Otsu thresholding algorithm, which is an exhaustive algorithm for searching the global optimal threshold [55], was applied to generate binary images of water and nonwater areas. The results obtained from the S-1 were validated using the PS-SD image acquired on 13 November 2021 as a reference. Thereafter, this accuracy level was applied to all S-1 results due to the unavailability of data captured on the same date. The resulting water classes from the PS-SD and S-1 were then masked by the trees, built-up, open water, and herbaceous wetland classes extracted from the WC2020 dataset. The ground control point, classifier, accuracy assessment, and masking results were implemented in Google Earth Engine. The total floodwater areas were calculated and graphed.

2.5. Identification of Major Flood-Prone Areas

Major flood-prone areas were visualized by overlaying the results of the Landsat (23 May 1978) generated from Section 2.3.1, S-1 (7 December 2021) generated from Section 2.3.2, and SWOs < 30 imageries generated from Section 2.3.4.

2.6. Investigation of Lake Surrounding Areas

Field survey and observation was conducted using a Garmin Oregon 750 handheld Global Positioning System in January 2020 to investigate the environment surrounding the lake and the geology of the Gorontalo lowland plain area. A total of 130 points were investigated in terms of sedimentary structure, riverside environment, and converted lands. Additionally, interviews were conducted with local villagers on the worksites.

3. Results

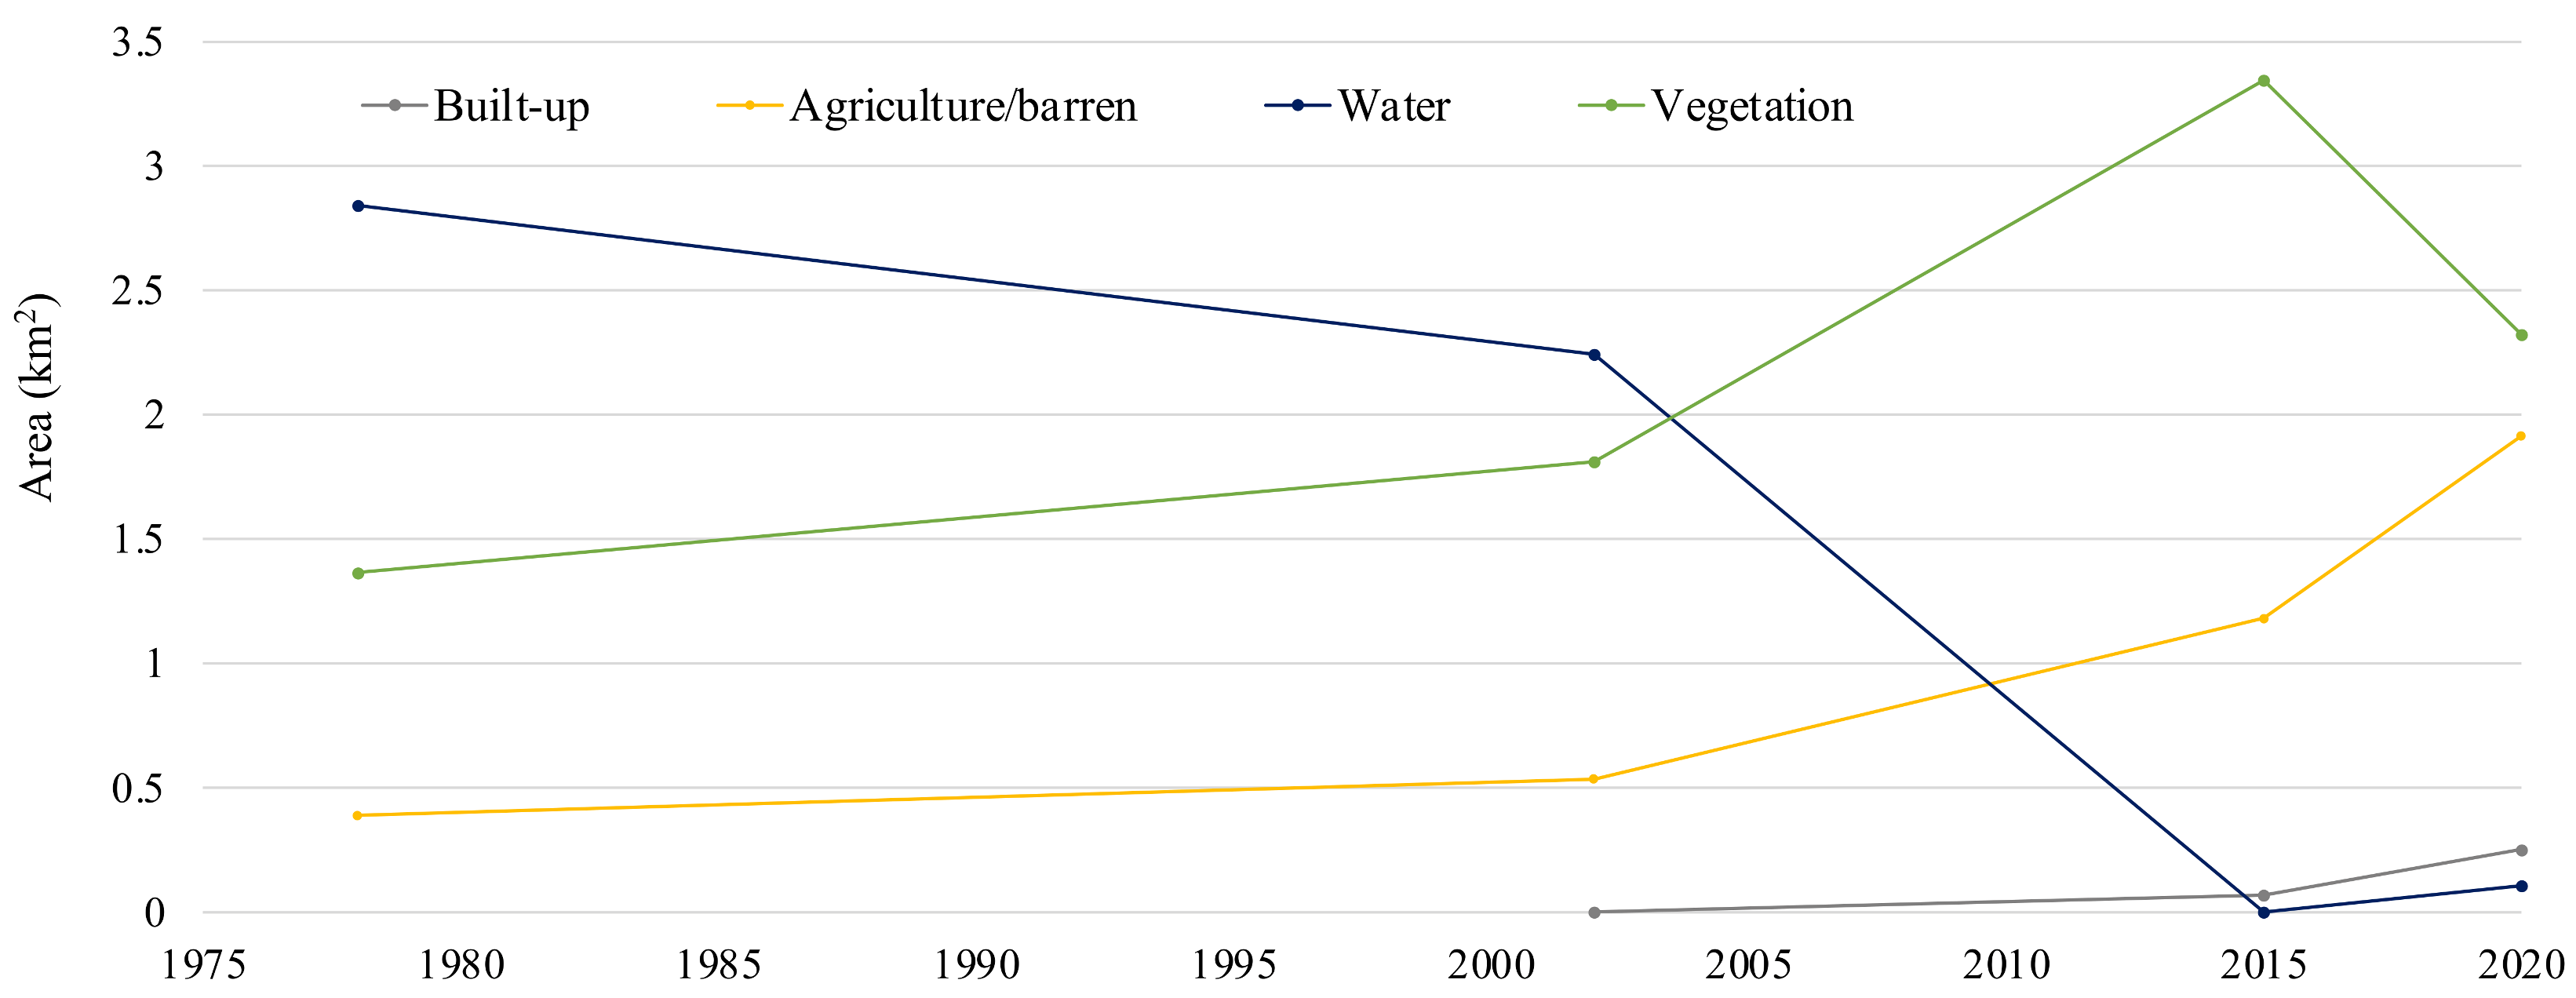
3.1. Time-Series Landcover Transformations Associated with Lake Shrinkage and Emergence of Converted Lands

The four LC maps had overall accuracies of 93.8% (1978), 93.3% (2002), 100.0% (2015), and 100.0% (2020) (Figure 3a–d). The decreases in the water surface extent were particularly remarkable, that is, 40.3 km2 (1978), 32.6 km2 (2002), 15.7 km2 (2015), and 11.8 km2 (2020). However, the following notable increases in the built-up and agriculture/barren extents were also observed: 1.1 km2 (2002), 4.9 km2 (2015), and 6.8 km2 (2020) in the built-up area and 7.4 km2 (1978), 18.5 km2 (2002), 33.7 km2 (2015), and 29.6 km2 (2020) in the agriculture/barren area. The vegetation extents were 36.2 km2 (1978), 31.5 km2 (2002), 29.3 km2 (2015), and 35.9 km2 (2020). According to the time-series LCT analysis, the lake shrinkage was critical, even in the study period. Vegetation, such as water hyacinths, has been widely spread in the lake and its edge since 2015 (Figure 3c–g), transforming them into agricultural/barren extents (Figure 3a–d and Figure 4). The emergence of converted land is remarkable on the west side of the lake, particularly in Teratai Village (Figure 4), which receives water from the Alopohu, Galian Tiga Hari, Marisa, and Meluopo rivers.

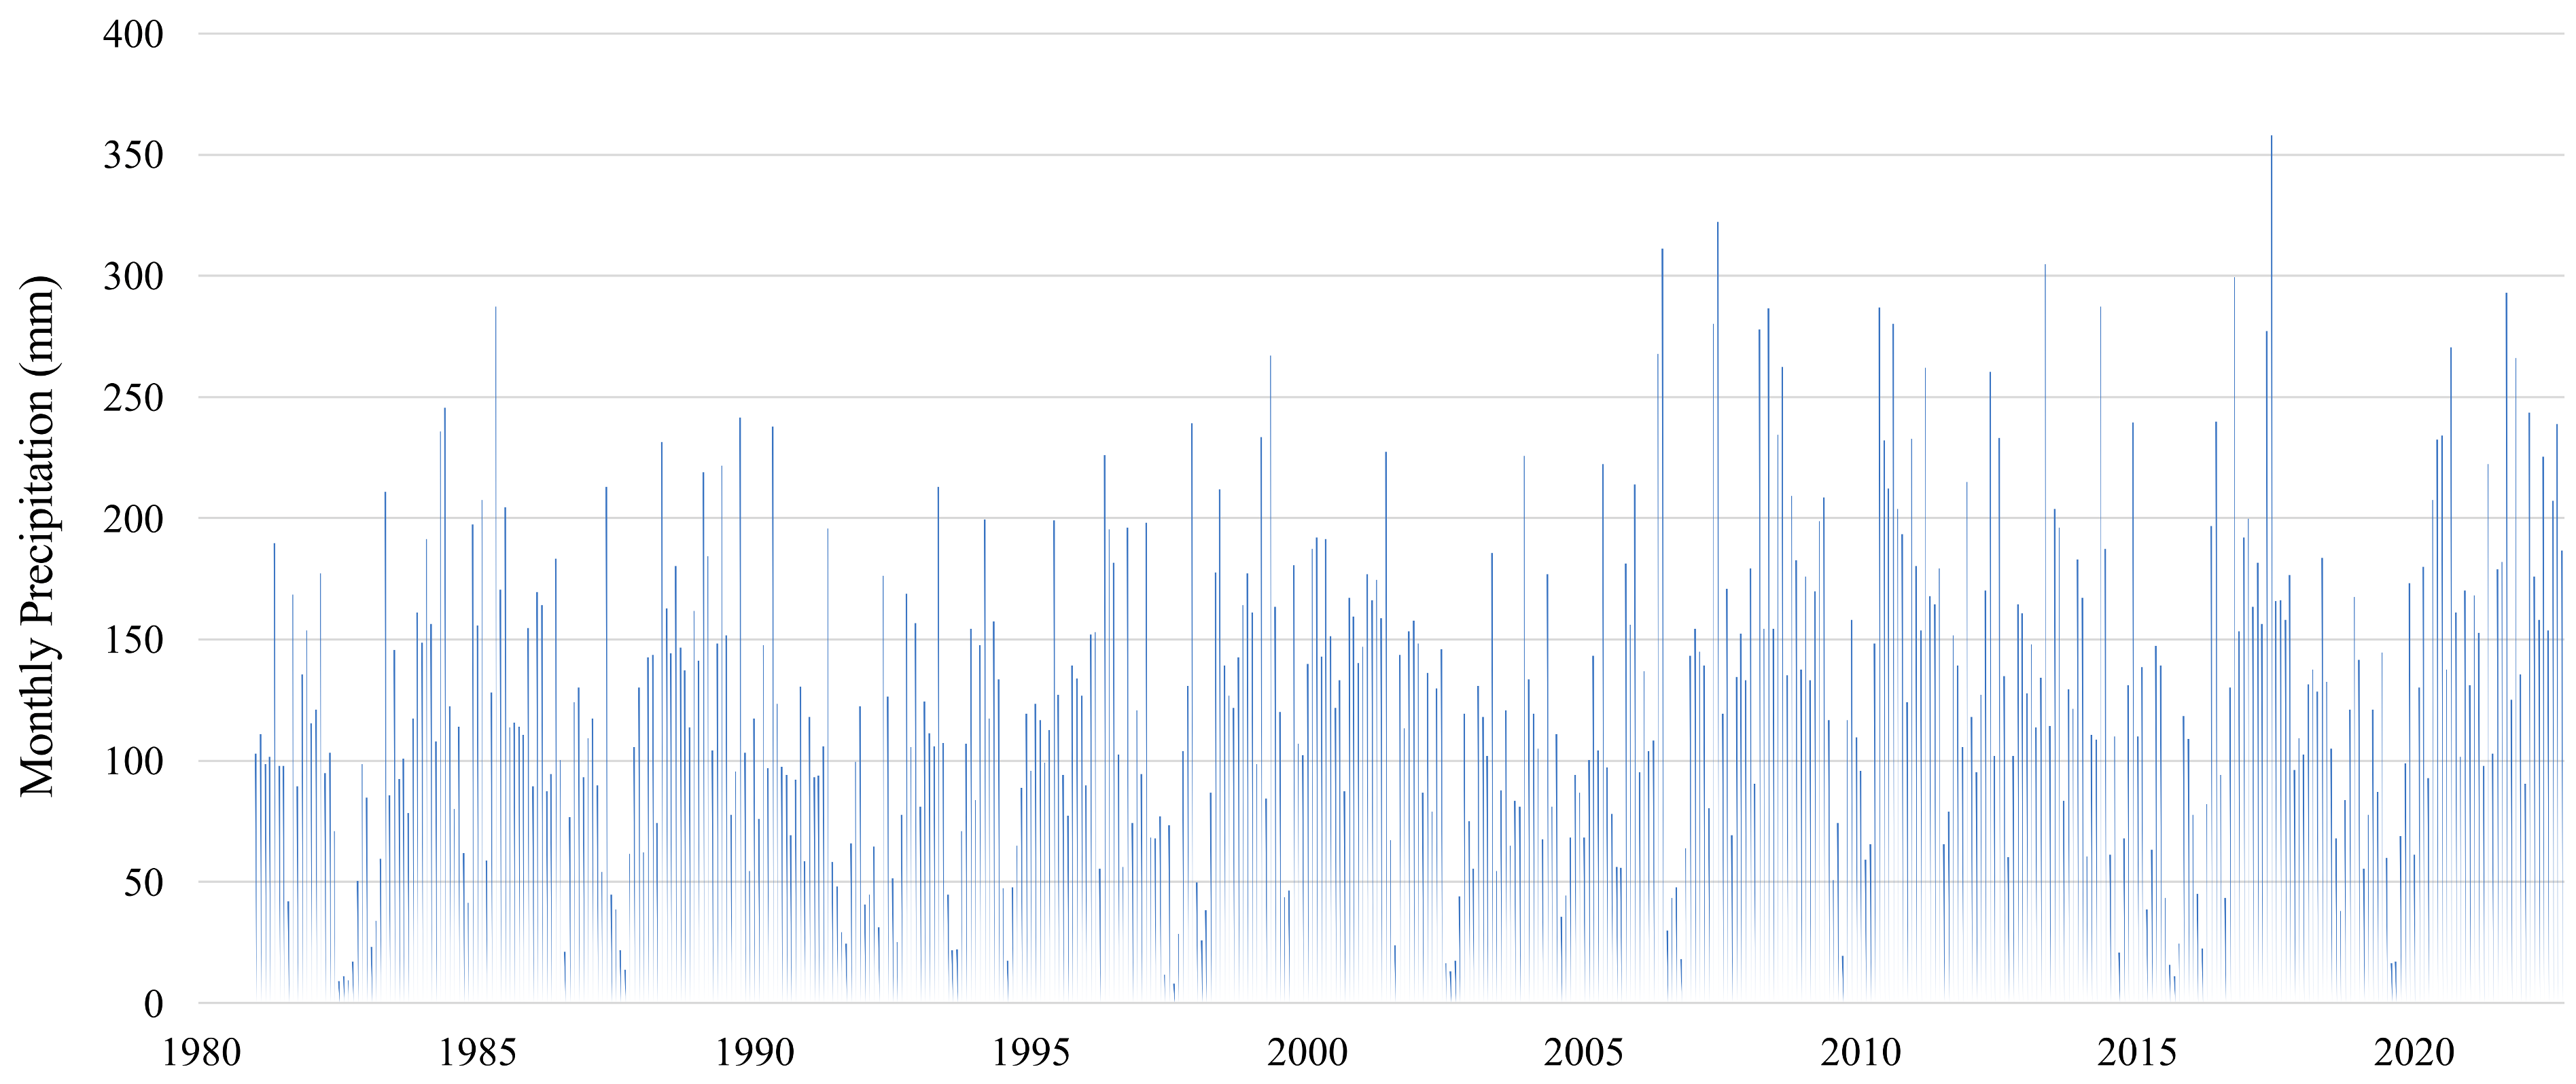
3.2. Time-Series Precipitation Trend

The monthly precipitation from 1981 to 2022 was computed using the CHIRPS Pentad dataset (Figure 5). The maximum monthly precipitation in June 2017 was 357.9 mm, whereas the average value was 126.6 mm. The statistical test described in Section 2.3.5 showed a positive increasing trend with a 0.085 slope (p = 0.00002).

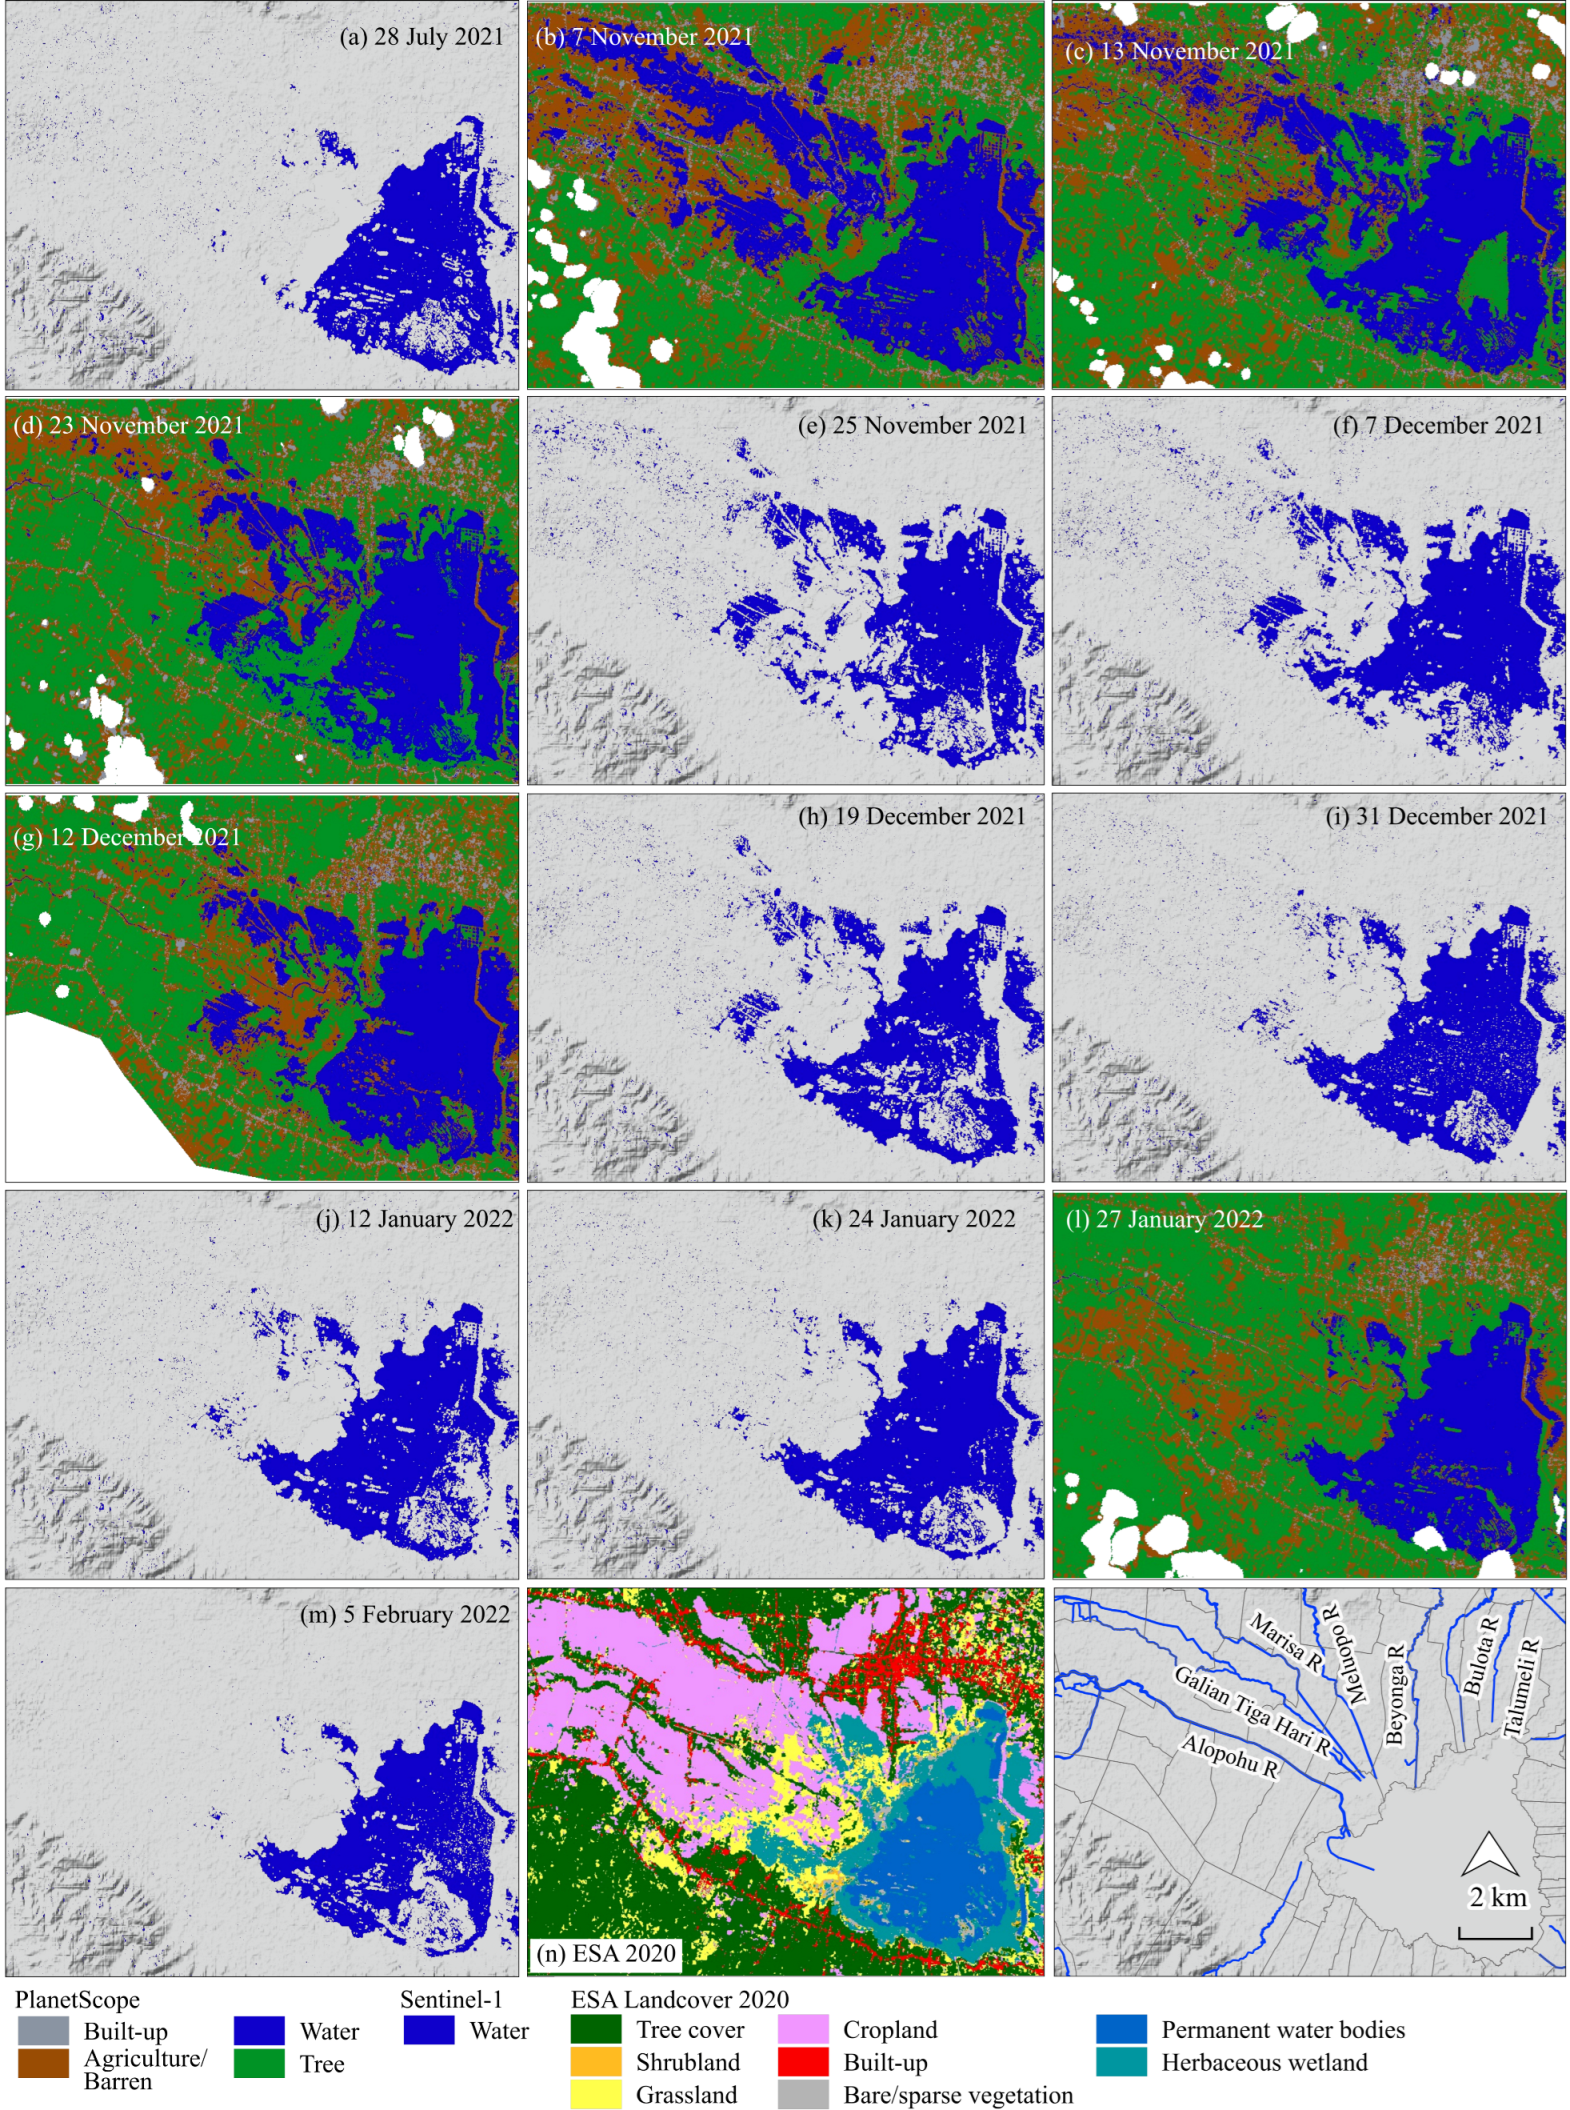
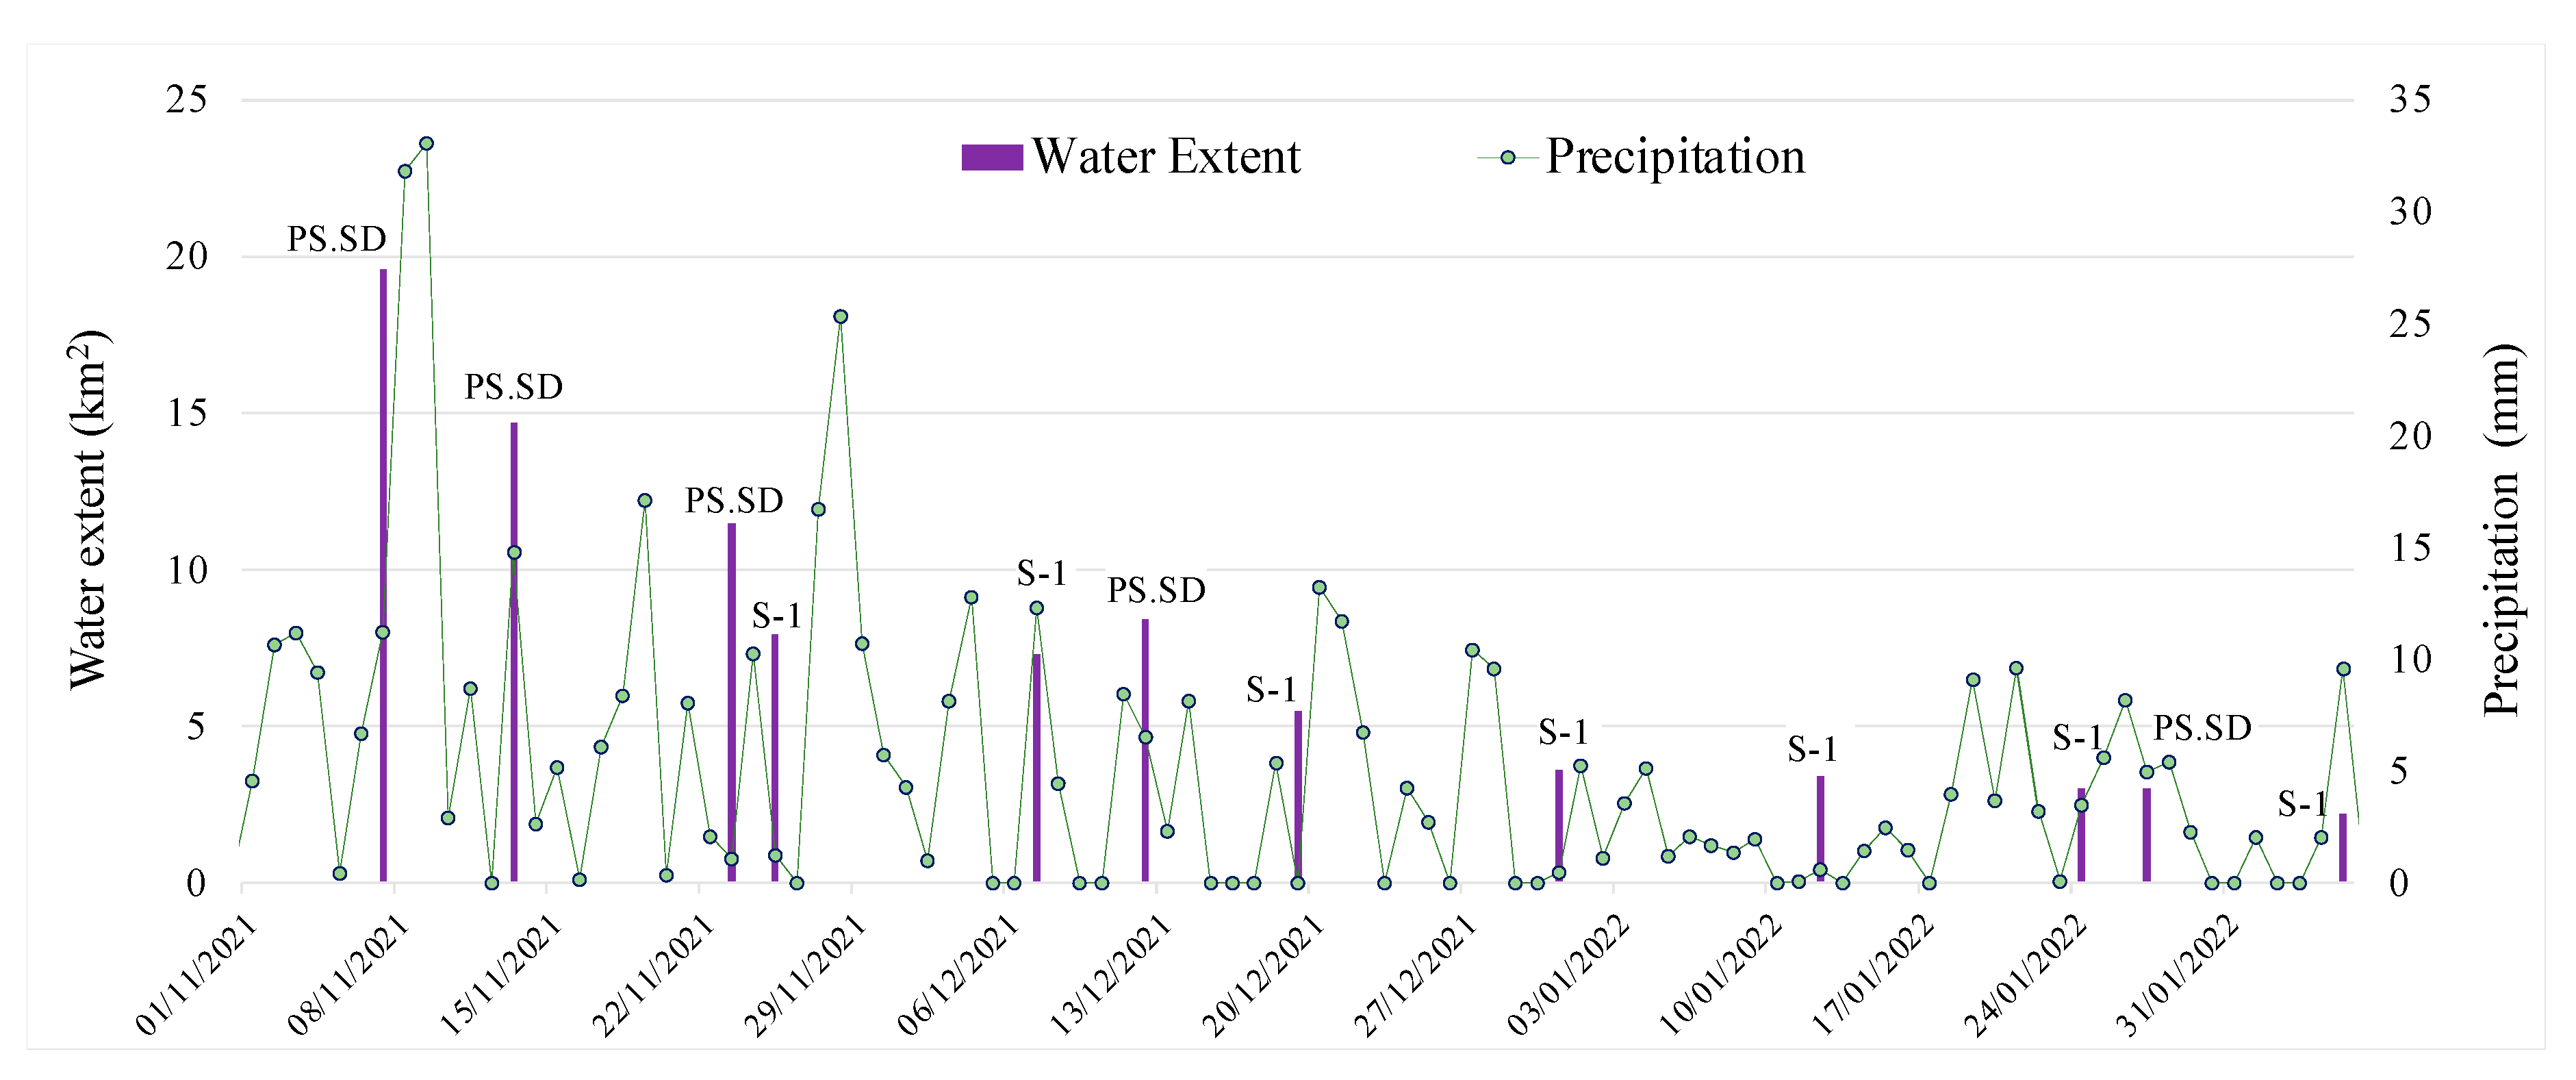
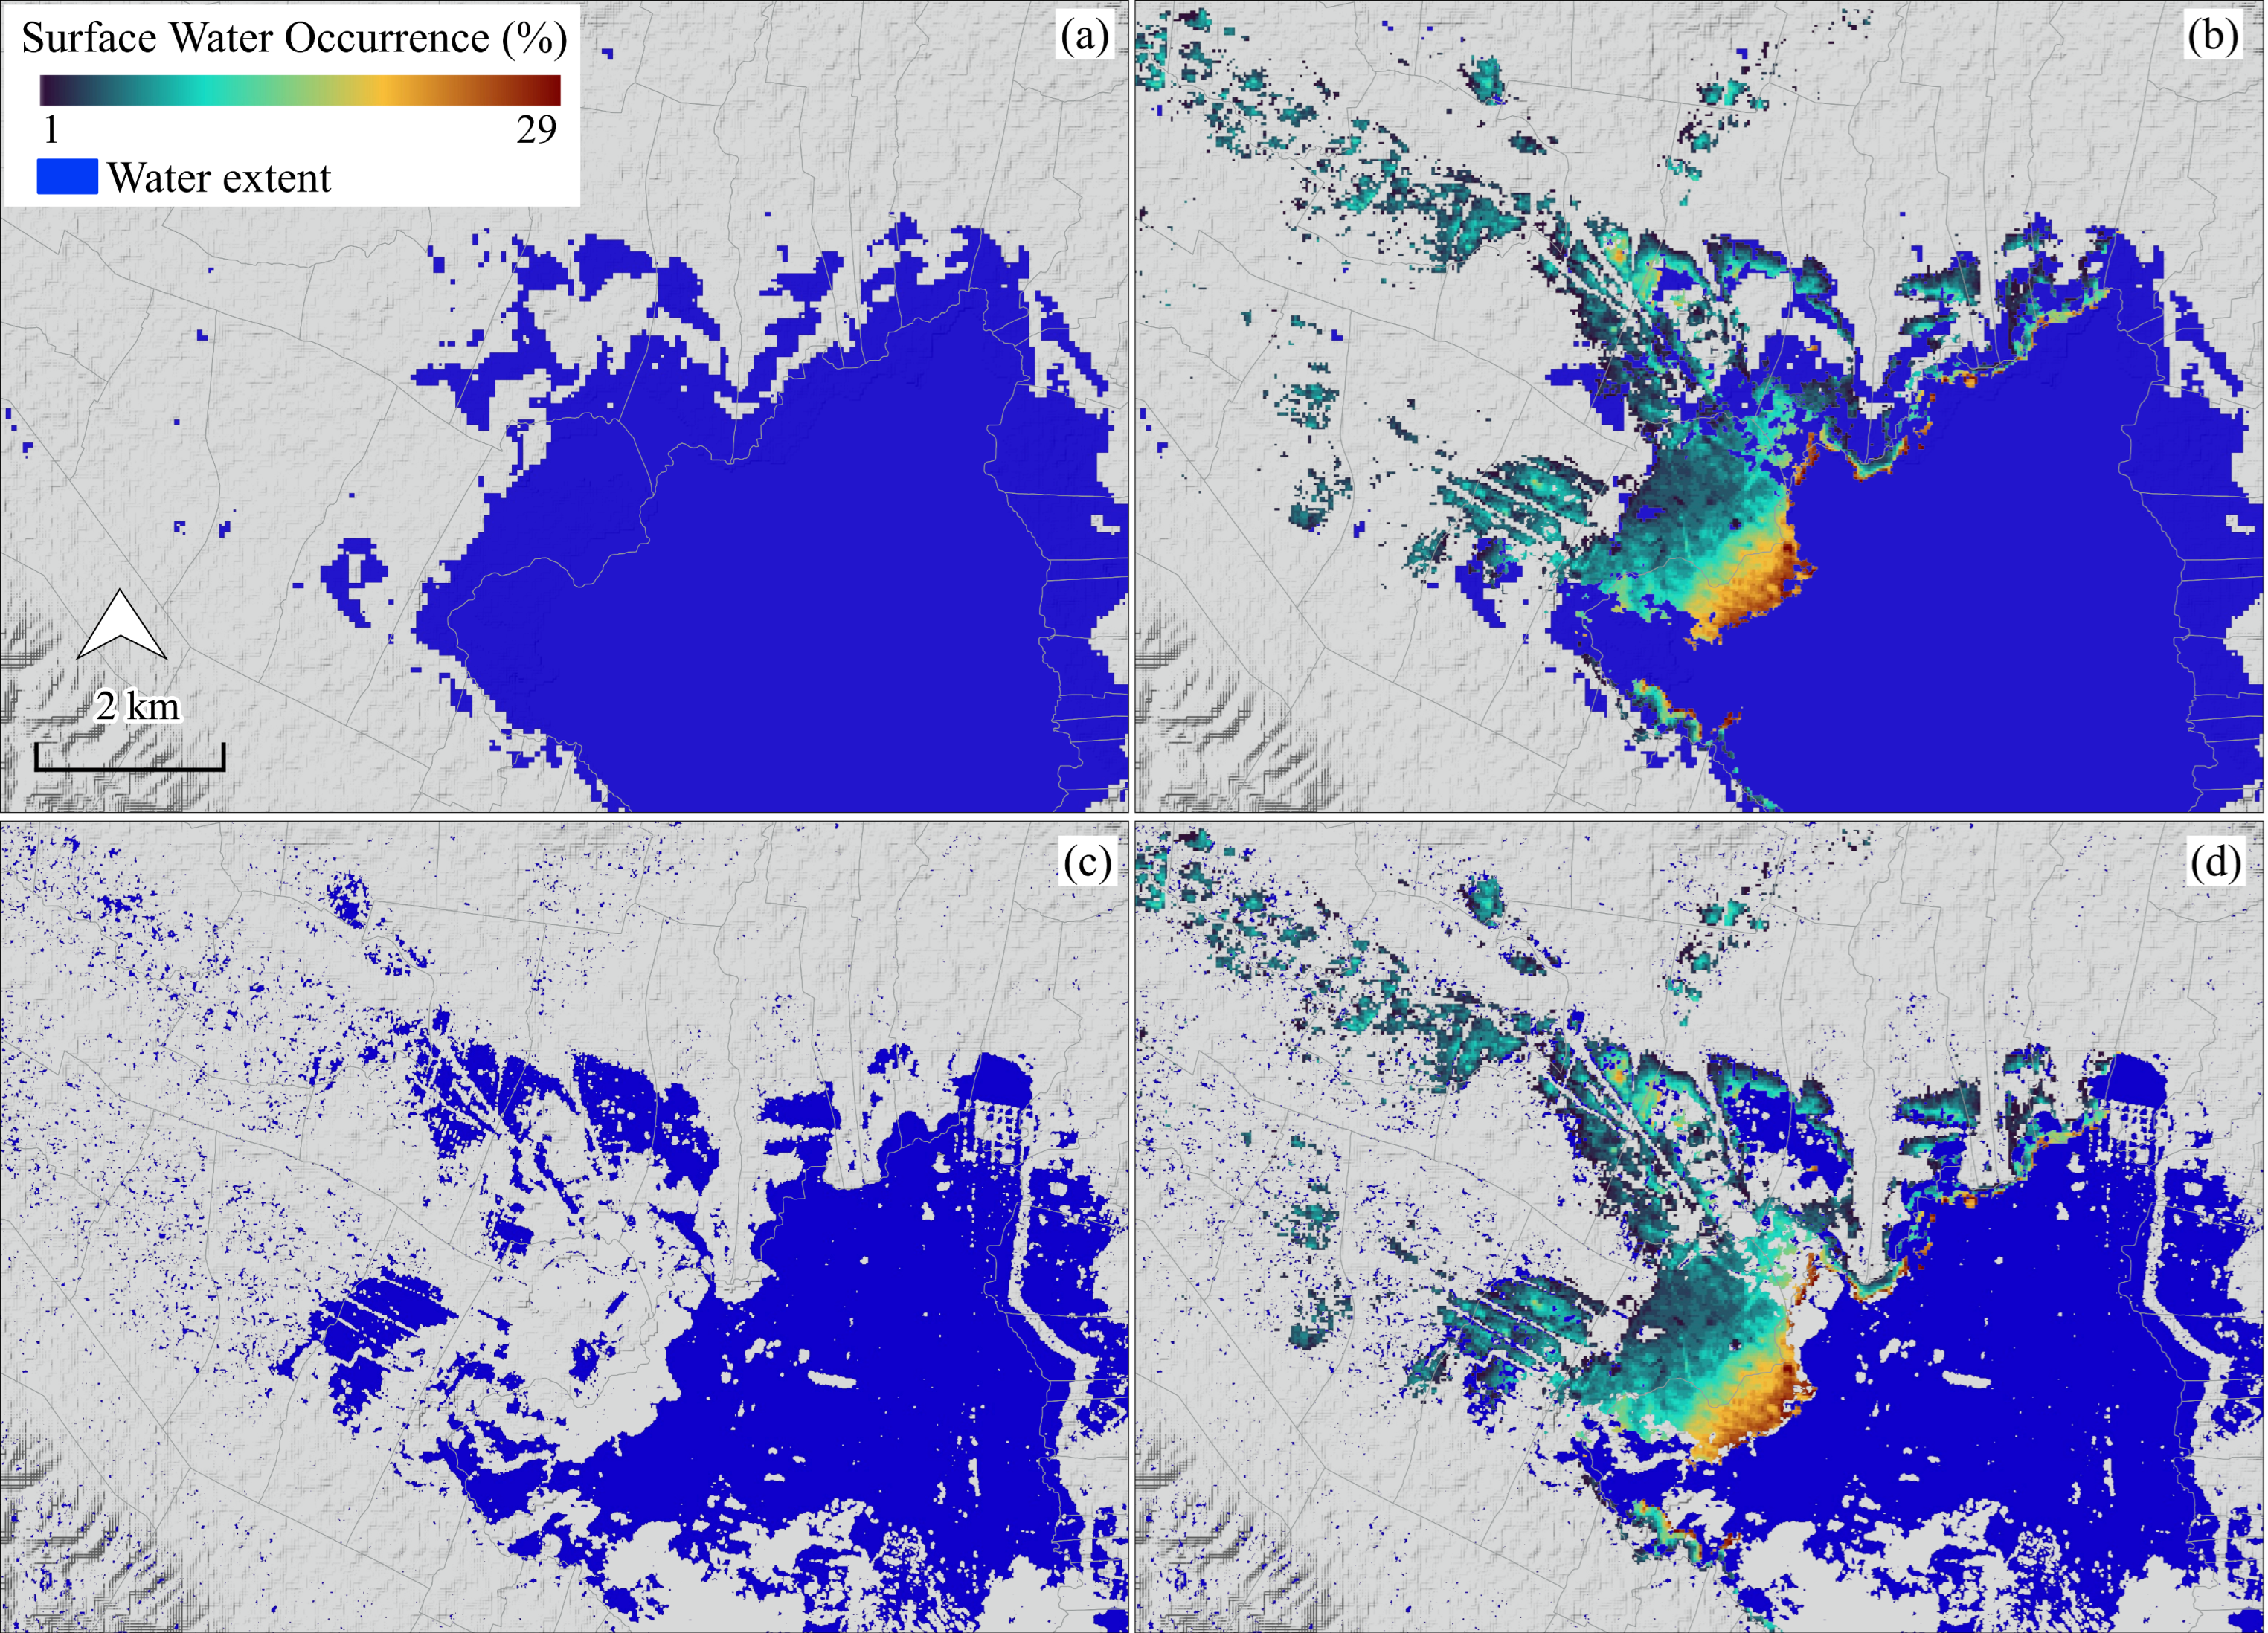
3.3. Time-Series Flood Inundation Areas Using Multiple Satellite Dataset Series

Figure 6 demonstrates the time-series LC transformations (LCTs) and the detected water extents using the PS-SD and S-1 datasets. The five LC maps had overall accuracies of 91.3% (7 November 2021, Figure 6b), 90.9% (13 November 2021, Figure 6c), 92.9% (23 November 2021, Figure 6d), 95.5% (12 December 2021, Figure 6g), and 95.2% (27 January 2022, Figure 6l), whereas S-1 had an accuracy of 90.0%. As described in Section 2.2, the high-intensity precipitation caused river overflows on 6 November 2021 [51]. Extreme water extents were observed on 7 November 2021 in the northwestern part of the study area, widely spreading across the Galian Tiga Hari, Marisa, and Meluopo rivers (Figure 6b). Moreover, the water overflow reached the lake by 13 November resulting in barren/agricultural lands (Figure 6c). However, the water observed in the northwestern and western parts of the lake remained until the middle of December (Figure 6d–h) and gradually cleared as usual (Figure 6i–m). Small pixels in the northwestern part of the lake corresponded to the cropland (Figure 6e–h), where water remained similar to that in the northwestern and western parts of the lake. Lake vegetation, such as water hyacinths, was mobile and is associated with the massive water inflow.
The potential flood-affected surface water extent computed based on Section 2.4 was graphed together with the precipitation amount (Figure 7). The water extent observed on 28 July 2021 was 1.5 km2. A peak change was significantly observed on 7 November 2021 (19.6 km2), which was followed by those on 13 November 2021 (14.7 km2), 23 November 2021 (11.5 km2), 25 November 2021 (7.9 km2), 7 December 2021 (7.3 km2), 12 December 2021 (8.4 km2), and 19 December 2021 (5.5 km2). Water extents <4 were observed from the end of December 2021 to early February 2022. High precipitation >15 mm was observed on 8 (31.9 mm), 9 (33.1 mm), 19 (17.1 mm), 27 (16.7 mm), and 28 (25.4 mm) November 2021.

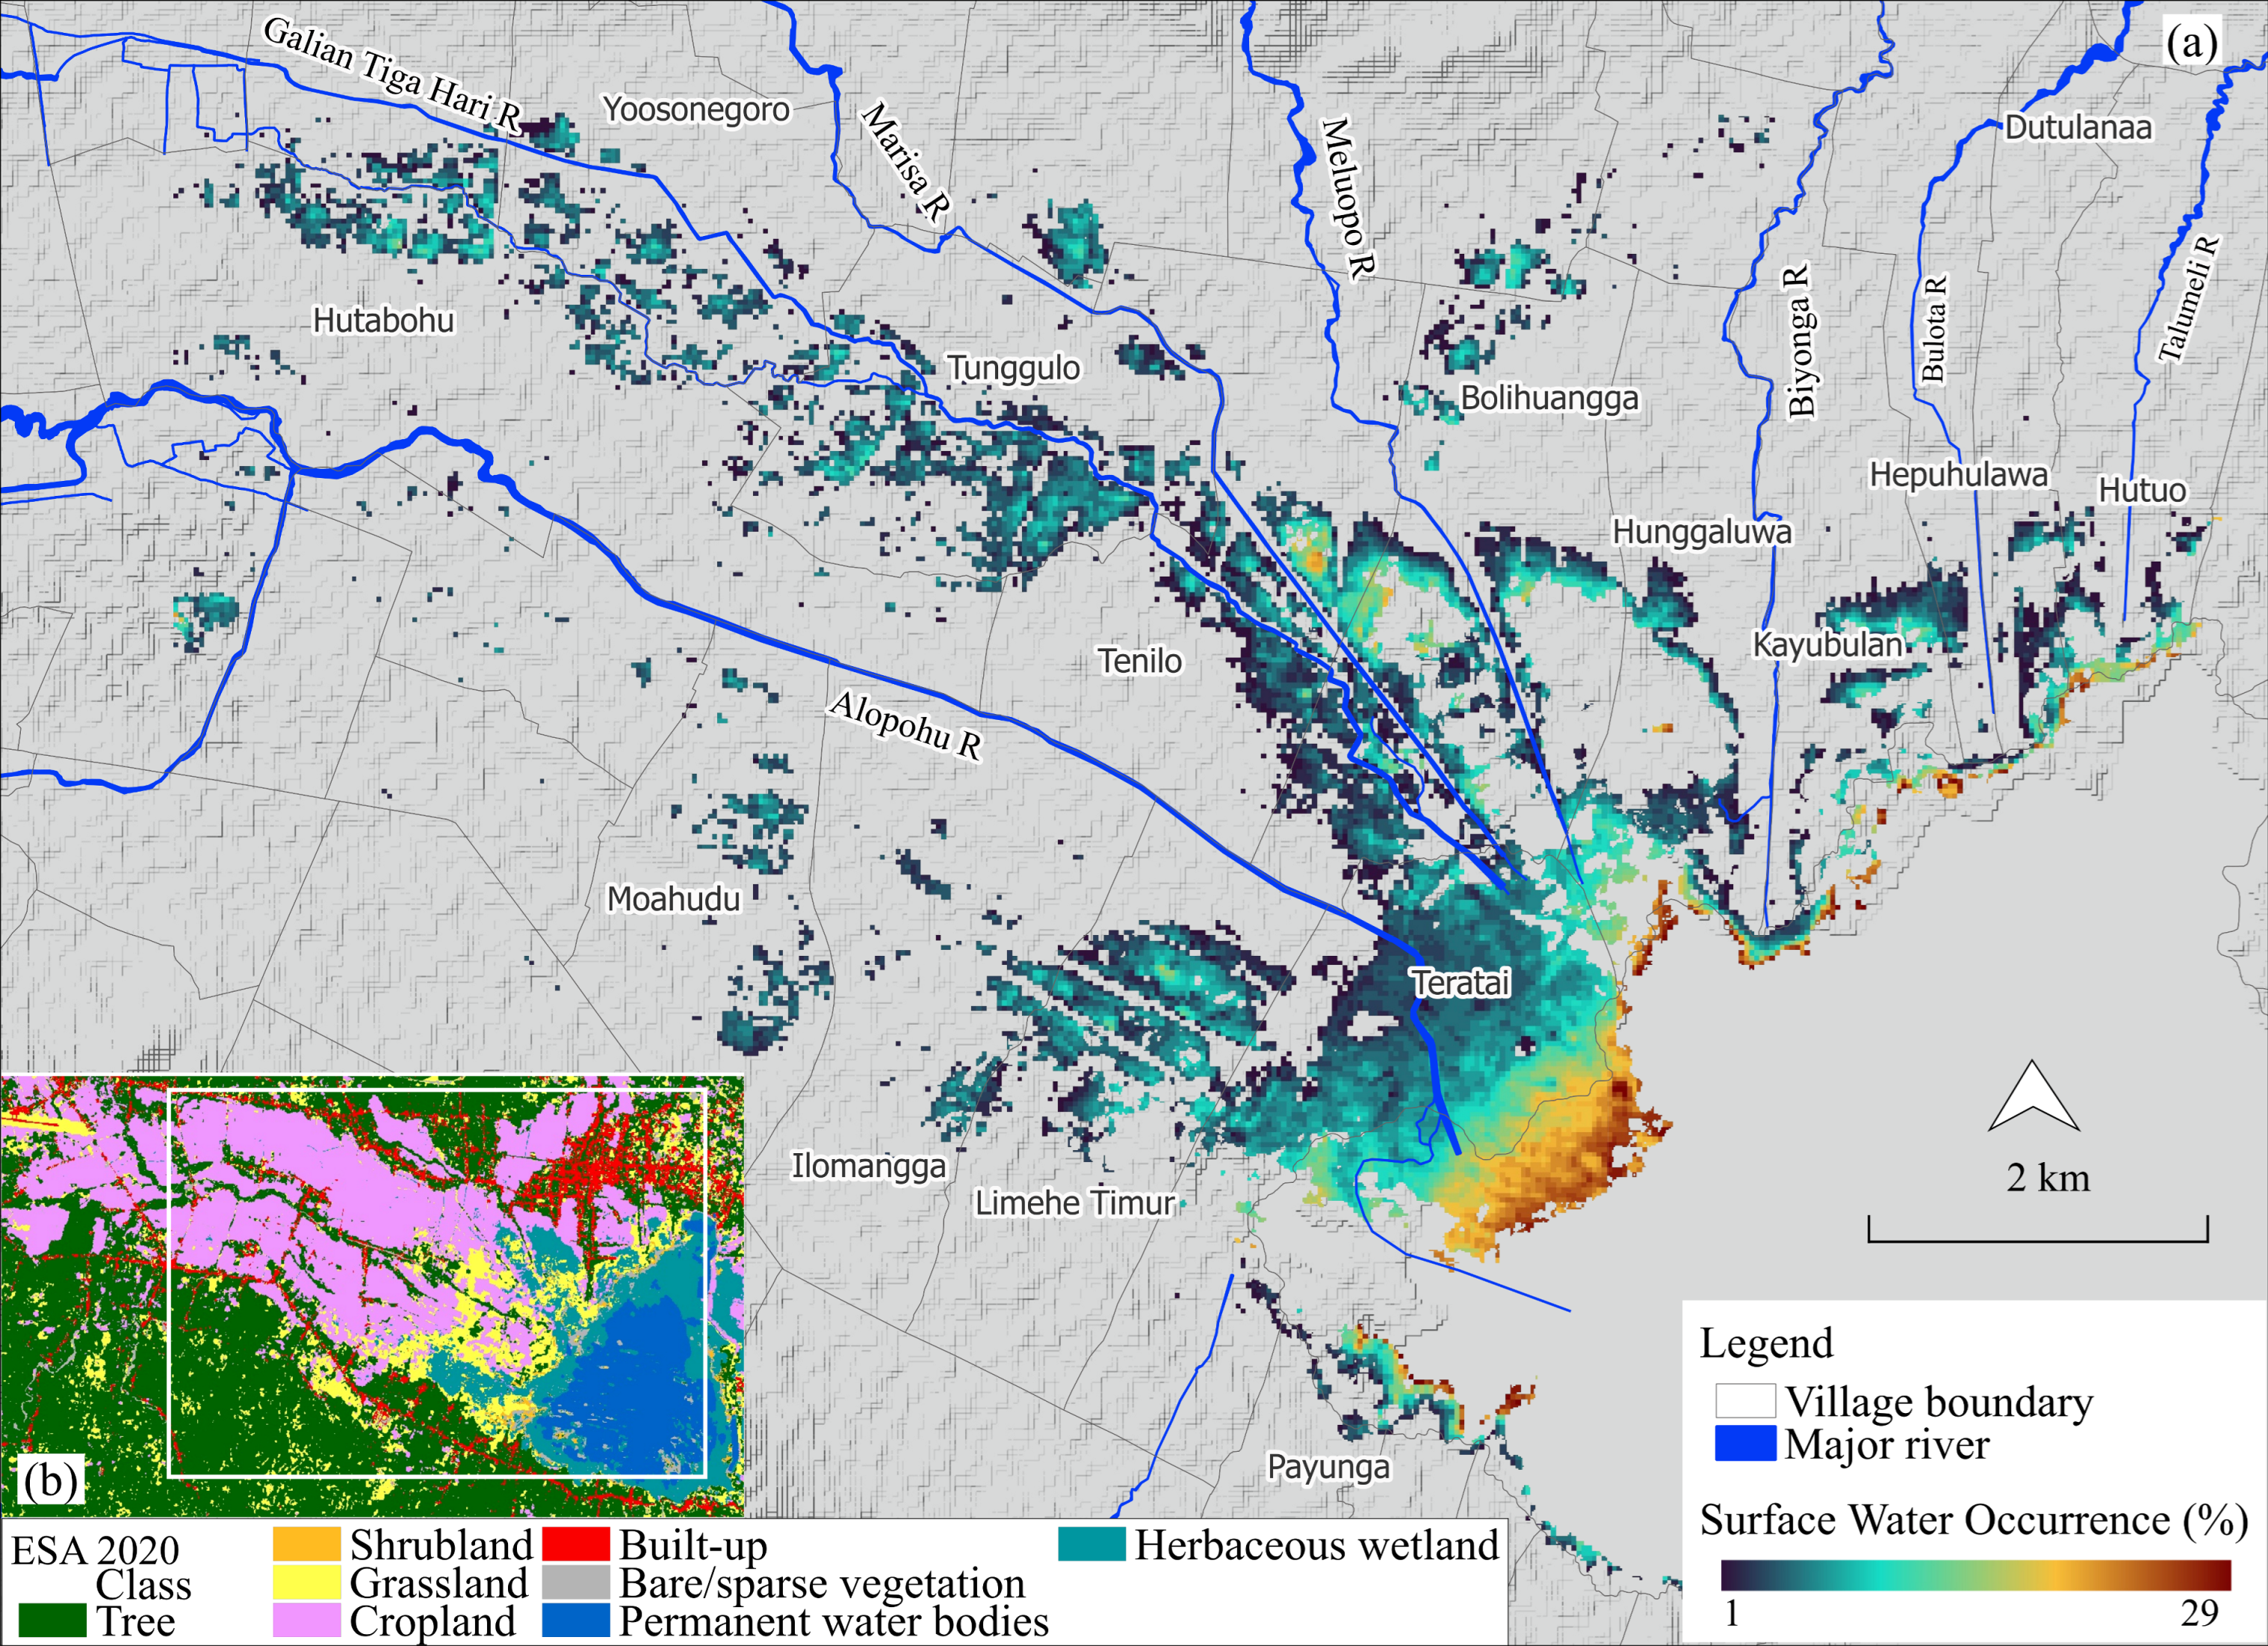
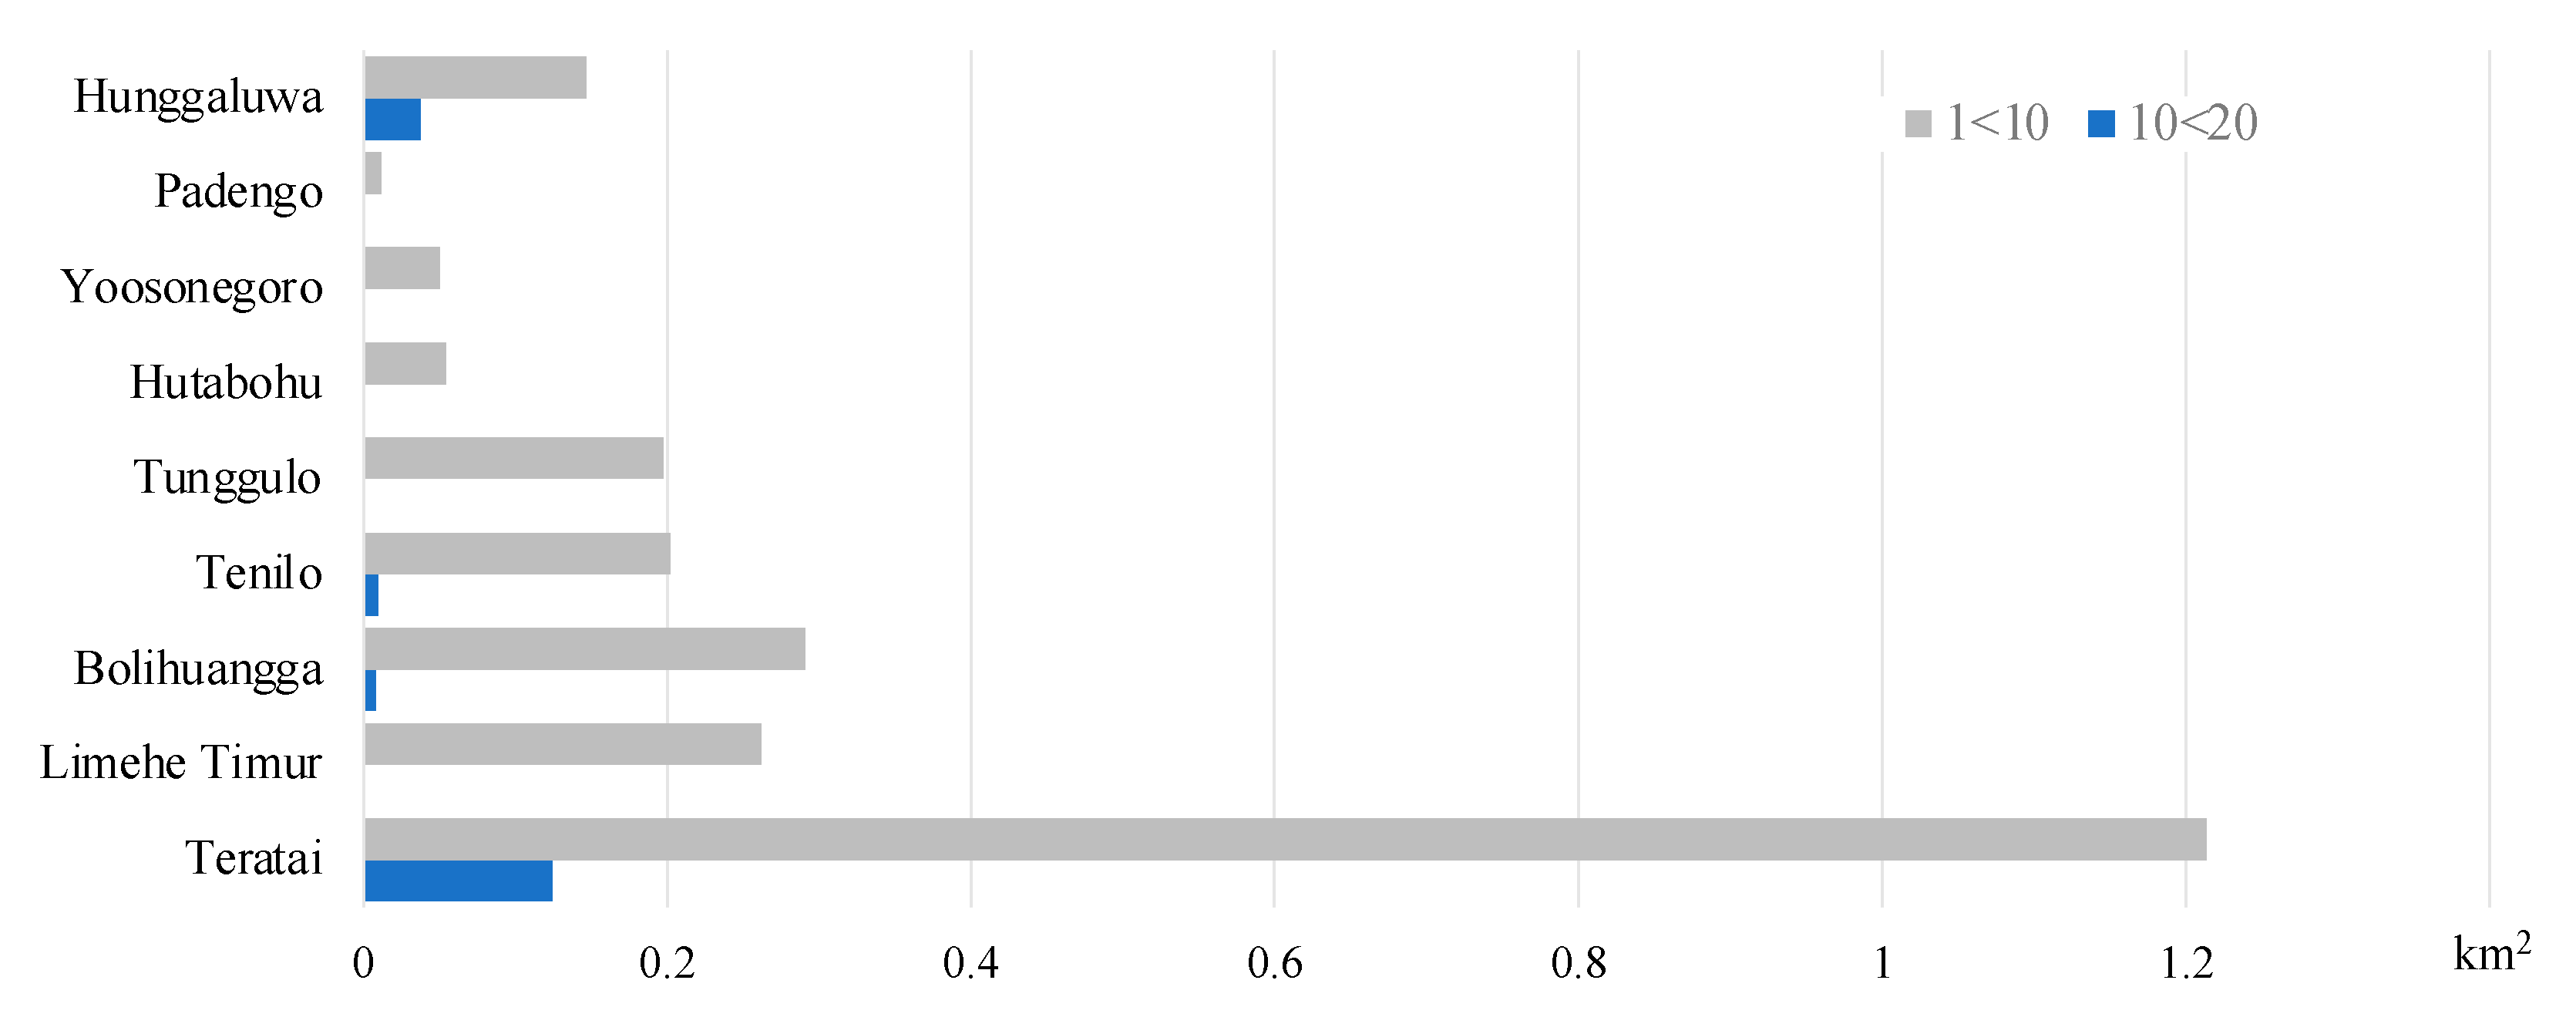
3.4. Surface Water Occurrence at the Lake’s Surrounding Areas

SWOs < 30 observed from 1984 to 2021 were extracted (Figure 8a). The total area of SWOs < 30 was 22.3 km2. The large portion comprised SWOs 1 < 10 (83.1%), followed by 10 < 20 (10.7%) and 20 < 30 (6.2%). Higher SWOs 20 < 30 were notably observed at the western edge of the lake, bordering the northeastern part of Teratai Village, which is mainly covered with grassland (Figure 8b). Conversely, a lower SWO 1 < 10 was observed along the Galian Tiga Hari River and the northern part of Teratai Village, where croplands are widely distributed (Figure 8b).
SWOs 10 < 20 at the riverside village level are as follows: Teratai (0.12 km2), Hunggaluwa (0.04 km2), and Bolihuangga and Tenilo (0.01 km2) Villages. SWOs 1 < 10 were largely found in Teratai (1.21 km2), followed by the Bolihuangga (0.29 km2), Limehe Timur (0.26 km2), Tenilo and Tunggulo (0.20 km2), Hunggaluwa (0.15 km2), Hutabohu and Yoosonegoro (0.05 km2), and Padengo (0.01 km2) Villages (Figure 9). Excluding Teratai Village, the following remarkable villages that showed lower SWOs also comprised several rivers: Bolihuangga (Galian Tiga Hari, Marisa, and Meluopo rivers) and Tenilo and Tunggulo (Galian Tiga Hari and Marisa rivers) Villages (Figure 8a). Conversely, the lower SWOs in Limehe Timur Village were observed slightly away from Alopohu River.
The extracted SWOs < 30 were further overlapped with the imagery of 23 May 1978 and 7 December 2022 (Figure 10). Although a higher SWOs 20 < 30 was observed in the lake water area, a lower SWO was observed in inland areas (Figure 10b). The lower SWOs <10 in inland areas were largely found in floodwater-detected areas (Figure 10d).

4. Discussion

4.1. Time-Series Analysis of Flood Inundation Using Multiple Satellite Datasets

The highly influential spatiotemporal time-series analysis presented here quantified the floodwater extent and the recovery phase (Figure 6) in areas where significant land conversions were observed due to the rapid lake shrinkage under unique tectonic events and geological systems (Figure 3 and Figure 4). Climate change and human-induced activities are largely considered the key driving factors causing dynamic floods [13,43]. Therefore, only a few studies have focused on the fundamental tectonic and geological systems that exacerbate flood threats. Integrating local tectonic and geological perspectives into flood assessments will provide local-specific flood mitigation and management strategies. In this work, we quantified the flood events that occurred in areas where a typical phenomenon associated with the transformation of enclosed seas into lakes by the rapid land uplift in the collision zone and rapid erosion of the inner bay sediments were observed.
Only a few studies quantified the ongoing and postflood hazard impacts using high spatiotemporal observations, particularly at regions with unique tectonic and geological characteristics. The combination of optical and SAR remote sensing datasets quantified a comprehensive understanding of the flood hazard impacts associated with the rapid environmental changes. A recent study [45] conducted flood inundation mapping using SAR imagery at Tempei Lake in Indonesia. However, this study relied only on two images from preflood (2 May 2018) and postflood (26 May 2018) events (15–19 May 2018). The utilization of SAR imagery could overcome the challenges of optical medium spatiotemporal resolution satellites, particularly in tropical regions with a high cloud frequency [36,37]. By comparison, our study quantified detailed changes in the floodwater extents with a long time frame and a short interval (2–12 days), combining multiple high spatiotemporal datasets of the PS-SD and S-1 series (Figure 6).
While a previous investigation [17] focused on a study area comparable to ours, and explored the mechanisms behind the rapid lake shrinkage in the Limboto area in terms of geological characteristics using a time-series Landsat series and conducting a river outcrop investigation, the LCTs of the lake’s surrounding areas and their considerable effect on flood hazards were not focused. Conversely, we quantified detailed flood hazard impacts in a shorter interval with combined high spatiotemporal datasets (Figure 6).

4.2. Implication of the Time-Series Analysis

Combining the PS-SD series with the SAR datasets helps perform a more systematic analysis of natural hazards in shorter time frames by overcoming meteorological limitations. A high spatiotemporal observation with various satellite datasets considering the local tectonic and geological characteristics may provide a useful insight for characterizing the pace/pattern/effect in ongoing and postflood stages. These will further develop local-specific and effective disaster mitigation, risk reduction, and management strategies in the future. The analysis showed that with the continuous lake shrinkage, the lake’s surrounding areas will have high vulnerability to flooding with increased precipitation. Floodwater was observed after high-intensity precipitation with a peak on 7 November 2021 (Figure 6b and Figure 7). It widely overflowed from the main rivers to the surrounding croplands (Figure 6). Floodwater was also observed away from the main rivers, and it sometimes remained. This floodwater appearance may directly and indirectly be caused by different water resources. Direct floodwater overflows can come from the main rivers. The indirect overflows mainly observed in Limehe Timur Village can come from the lake overflowing beyond its water storage capacity. These indirect overflows appeared during the heavy inundation period and remained for more than a month. The ESA’s SWOs also characterized this pattern, demonstrating that notable SWOs < 20 were largely observed both along the major inflow rivers and Limehe Timur Village (Figure 8 and Figure 9). Using a combination of historical Landsat imagery, water extents resulting from the rapid lake shrinkage is separable (Figure 10). Thus, these areas can be typical major flood-prone areas due to various overflows. Our work expanded upon a previous study [17] to reveal the flood patterns and the major flood-prone areas associated with tectonic and geological characteristics.

4.3. Limitations

This study has certain limitations associated with the characteristics of the datasets used. First, although the PS series comprised daily products, the cloud-free data availability is still limited by the region’s high cloud coverage. Second, although the SAR data help in the weather-independent active observation, the mountain shadows caused by the SAR’s side looking would result in a notable misclassification during the flood event. Third, the differences in the spatial resolution of the datasets used here would result in mixed pixels, which may possibly cause an overestimation or a miscalculation of the water extent. Fourth, the SWOs and the world LC map applied in this study relied on the EC’s JRC GSWML v1.4 (1984–2021) and ESA’s WC2020. Finally, due to the operation period of the PS-SD series, the methodologies applied herein were limited only to the period after 2020.

5. Conclusions

This study quantified the flood disasters in Gorontalo, Indonesia that are associated with the rapid lake shrinkage caused by tectonic and geological events by using high spatiotemporal time-series and SWO datasets. The measures used allowed us to characterize the distinct floodwater distribution, pace, pattern, and major flood-prone areas in the ongoing and postflood stages. In a region where the spatiotemporal monitoring of flood events is challenging due to the limited availabilities of optical cloud-free imagery, our methodology supported high spatiotemporal monitoring. Our findings also broadened our understanding of the major flood-prone areas associated with the rapid lake shrinkage, created by the uplifting of the land due to plate tectonics and rapid erosion of the inner bay sediments. We expect our findings to aid in the high spatiotemporal flood monitoring and the local tectonic and geological systems to be integrated into flood hazard mitigation and management strategies.

Author Contributions

S.K. contributed to conceptualization of the research, methodology, data analysis, data visualization, writing—original draft preparation, and writing—review and editing. M.N. provided the PS-SSC datasets. All authors have read and agreed to the published version of the manuscript.

Funding

This research was financially supported by the Research Institute for Humanity and Nature (RIHN: a constituent member of NIHU). Project No. RIHN 14200102.

Data Availability Statement

Not applicable.

Acknowledgments

We thank the Center for Research and Application of Satellite Remote Sensing, Yamaguchi University, Japan, for providing the PS-SSC datasets for this research. We also thank the anonymous reviewers for their constructive comments that strengthened the work.

Conflicts of Interest

The authors declare no conflict of interest.

References

  1. Daily, G.C.; Polasky, S.; Goldstein, J.; Kareiva, P.M.; Mooney, H.A.; Pejchar, L.; Ricketts, T.H.; Salzman, J.; Shallenberger, R. Ecosystem services in decision making: Time to deliver. Front. Ecol. Environ. 2009, 7, 21–28. [Google Scholar] [CrossRef] [Green Version]
  2. Arias-Arévalo, P.; Martín-López, B.; Gómez-Baggethun, E. Exploring intrinsic, instrumental, and relational values for sustainable management of social-ecological systems. Ecol. Soc. 2017, 22, 43. [Google Scholar] [CrossRef] [Green Version]
  3. Jones, N.A.; Shaw, S.; Ross, H.; Witt, K.; Pinner, B. The study of human values in understanding and managing social-ecological systems. Ecol. Soc. 2016, 21, 15. [Google Scholar] [CrossRef] [Green Version]
  4. Du, Y.; Xue, H.P.; Wu, S.J.; Ling, F.; Xiao, F.; Wei, X.H. Lake area changes in the middle Yangtze region of China over the 20th century. J. Environ. Manag. 2011, 92, 1248–1255. [Google Scholar] [CrossRef] [PubMed]
  5. Bakoariniaina, L.N.; Kusky, T.; Raharimahefa, T. Disappearing Lake Alaotra: Monitoring catastrophic erosion, waterway silting, and land degradation hazards in Madagascar using Landsat imagery. J. Afr. Earth Sci. 2006, 44, 241–252. [Google Scholar] [CrossRef]
  6. Page, M.J.; Trustrum, N.A.; DeRose, R.C. A high resolution record of storm-induced erosion from lake sediments, New Zealand. J. Paleolimnol. 1994, 11, 333–348. [Google Scholar] [CrossRef]
  7. Ariztegui, D.; Anselmetti, F.S.; Robbiani, J.M.; Bernasconi, S.M.; Brati, E.; Gilli, A.; Lehmann, M.F. Natural and human-induced environmental change in southern Albania for the last 300 years—Constraints from the Lake Butrint sedimentary record. Glob. Planet. Chang. 2010, 71, 183–192. [Google Scholar] [CrossRef] [Green Version]
  8. United Nation. Drying Lake Chad Basin Gives Rise to Crisis. 2019. Available online: https://www.un.org/africarenewal/magazine/december-2019-march-2020/drying-lake-chad-basin-gives-rise-crisis (accessed on 1 December 2022).
  9. Kiprutto, N.; Munyao, C.; Ngoriarita, J.; Kangogo, M.; Kiage, E. Tracing the Possible Root Causes for Fleeing Flamingos in Kenya’s Lake Nakuru National Park. J. Nat. Sci. Res. 2012, 2, 23–31. [Google Scholar]
  10. Patel, D.P.; Srivastava, P.K. Flood Hazards Mitigation Analysis Using Remote Sensing and GIS: Correspondence with Town Planning Scheme. Water Resour. Manag. 2013, 27, 2353–2368. [Google Scholar] [CrossRef]
  11. Lakshmi, V. (Ed.) Remote Sensing of Hydrological Extremes; Springer Remote Sensing/Photogrammetry; Springer: Cham, Switzerland, 2016. [Google Scholar]
  12. The UN Office for Disaster Risk Reduction. Human Cost of Disasters: An Overview of the Last 20 Years (2000–2019); The UN Office for Disaster Risk Reduction: Geneva, Switzerland, 2020. [Google Scholar] [CrossRef]
  13. Zeng, Z.; Gan, Y.; Kettner, A.J.; Yang, Q.; Zeng, C.; Brakenridge, G.R.; Hong, Y. Towards high resolution flood monitoring: An integrated methodology using passive microwave brightness temperatures and Sentinel synthetic aperture radar imagery. J. Hydrol. 2020, 582, 124377. [Google Scholar] [CrossRef]
  14. Brivio, P.A.; Colombo, R.; Maggi, M.; Tomasoni, R. Integration of remote sensing data and GIS for accurate mapping of flooded areas. Int. J. Remote Sens. 2002, 23, 429–441. [Google Scholar] [CrossRef]
  15. Kuntla, S.K. An era of Sentinels in flood management: Potential of Sentinel-1, -2, and -3 satellites for effective flood management. Open Geosci. 2021, 13, 1616–1642. [Google Scholar] [CrossRef]
  16. Chen, Z.; Zhao, S. Automatic monitoring of surface water dynamics using Sentinel-1 and Sentinel-2 data with Google Earth Engine. Int. J. Appl. Earth Obs. Geoinf. 2022, 13, 103010. [Google Scholar] [CrossRef]
  17. Kimijima, S.; Sakakibara, M.; Amin, A.K.M.A.; Nagai, M.; Arifin, Y.I. Mechanism of the rapid shrinkage of limboto lake in Gorontalo, Indonesia. Sustainability 2020, 12, 9598. [Google Scholar] [CrossRef]
  18. Japan International Cooperation Agency. The Study on Flood Control and Water Management Limboto-Bolango-Bone Basin in the Republic of Indonesia Volume-III Supporting Report: Part-A Existing Conditions; Japan International Cooperation Agency: Tokyo, Japan, 2002. [Google Scholar]
  19. Katili, J.A. Past and Present Getectonic Indonesia Position of Sulawesi, Indonesia. Tectonophysic 1978, 45, 289–322. [Google Scholar] [CrossRef]
  20. Druce, S.C. The Lands West of the Lakes; KITLV Press: Leiden, The Netherlands, 2009. [Google Scholar]
  21. Sulastri. Inland water resources and limnology in Indonesia. Tropics 2006, 15, 285–295. [Google Scholar] [CrossRef]
  22. Kimijima, S.; Nagai, M.; Sakakibara, M. Distribution of Enhanced Potentially Toxic Element Contaminations due to Natural and Coexisting Gold Mining Activities using Planet Smallsat Constellations. Remote Sens. 2023, 15, 861. [Google Scholar] [CrossRef]
  23. Li, L.; Su, H.; Du, Q.; Wu, T. A novel surface water index using local background information for long term and large-scale Landsat images. ISPRS J. Photogramm. Remote Sens. 2021, 172, 59–78. [Google Scholar] [CrossRef]
  24. Kwak, Y.; Arifuzzanman, B.; Iwami, Y. Prompt proxy mapping of flood damaged rice fields using MODIS-derived indices. Remote Sens. 2015, 7, 15969–15988. [Google Scholar] [CrossRef] [Green Version]
  25. Ticehurst, C.; Guerschman, J.P.; Chen, Y. The strengths and limitations in using the daily MODIS open water likelihood algorithm for identifying flood events. Remote Sens. 2014, 6, 11791–11809. [Google Scholar] [CrossRef] [Green Version]
  26. Hu, Y.; Huang, J.; Du, Y.; Han, P.; Huang, W. Monitoring spatial and temporal dynamics of flood regimes and their relation to wetland landscape patterns in Dongting Lake from MODIS time-series imagery. Remote Sens. 2015, 7, 7494–7520. [Google Scholar] [CrossRef] [Green Version]
  27. Ireland, G.; Volpi, M.; Petropoulos, G.P. Examining the capability of supervised machine learning classifiers in extracting flooded areas from landsat tm imagery: A case study from a mediterranean flood. Remote Sens. 2015, 7, 3372–3399. [Google Scholar] [CrossRef] [Green Version]
  28. Wang, Y. Using Landsat 7 TM data acquired days after a flood event to delineate the maximum flood extent on a coastal floodplain. Int. J. Remote Sens. 2004, 25, 959–974. [Google Scholar] [CrossRef]
  29. Bauer-Marschallinger, B.; Cao, S.; Tupas, M.E.; Roth, F.; Navacchi, C.; Melzer, T.; Freeman, V.; Wagner, W. Satellite-Based Flood Mapping through Bayesian Inference from a Sentinel-1 SAR Datacube. Remote Sens. 2022, 14, 3673. [Google Scholar] [CrossRef]
  30. Chen, S.; Huang, W.; Chen, Y.; Feng, M. An adaptive thresholding approach toward rapid flood coverage extraction from sentinel-1 SAR imagery. Remote Sens. 2021, 13, 4899. [Google Scholar] [CrossRef]
  31. Lei, T.; Wang, J.; Li, X.; Wang, W.; Shao, C.; Liu, B. Flood Disaster Monitoring and Emergency Assessment Based on Multi-Source Remote Sensing Observations. Water 2022, 14, 2207. [Google Scholar] [CrossRef]
  32. Ahamed, A.; Bolten, J.; Doyle, C.; Fayne, J. Near Real-Time Flood Monitoring and Impact Assessment Systems. In Remote Sensing of Hydrological Extremes; Lakshmi, V., Ed.; Springer International Publishing: Cham, Switzerland, 2017. [Google Scholar]
  33. Psomiadis, E.; Diakakis, M.; Soulis, K.X. Combining SAR and optical earth observation with hydraulic simulation for flood mapping and impact assessment. Remote Sens. 2020, 12, 3980. [Google Scholar] [CrossRef]
  34. Kimijima, S.; Sakakibara, M.; Nagai, M.; Gafur, N.A. Time-series Assessment of Camp-type Artisanal and Small-scale Gold Mining Sector with Large Influxes of Miners using LANDSAT Imagery. Int. J. Environ. Res. Public Health 2021, 18, 9441. [Google Scholar] [CrossRef] [PubMed]
  35. Kimijima, S.; Sakakibara, M.; Nagai, M. Detection of artisanal and small-scale gold mining activities and their transformation using earth observation, nighttime light, and precipitation data. Int. J. Environ. Res. Public Health 2021, 18, 10954. [Google Scholar] [CrossRef]
  36. Kimijima, S.; Sakakibara, M.; Nagai, M. Characterizing Time-Series Roving Artisanal and Small-Scale Gold Mining Activities in Indonesia Using Sentinel-1 Data. Int. J. Environ. Res. Public Health 2022, 19, 6266. [Google Scholar] [CrossRef]
  37. Kimijima, S.; Sakakibara, M.; Nagai, M. Investigation of Long-Term Roving Artisanal and Small-Scale Gold Mining Activities Using Time-Series Sentinel-1 and Global Surface Water Datasets. Int. J. Environ. Res. Public Health 2022, 19, 5530. [Google Scholar] [CrossRef] [PubMed]
  38. Kimijima, S.; Nagai, M.; Sakakibara, M.; Jahja, M. Investigation of Cultural–Environmental Relationships for an Alternative Environmental Management Approach Using Planet Smallsat Constellations and Questionnaire Datasets. Remote Sens. 2022, 14, 4249. [Google Scholar] [CrossRef]
  39. Kimijima, S.; Nagai, M.; Sakakibara, M. Monitoring Coexisting Rapid Small-scale and Large-scale Gold Mining Developments Using Planet Smallsats Constellations. Mining 2022, 2, 566–577. [Google Scholar] [CrossRef]
  40. The National Aeronautics and Space Administration. What Is Synthetic Aperture Radar? 2022. Available online: https://www.earthdata.nasa.gov/learn/backgrounders/what-is-sar (accessed on 1 December 2022).
  41. Long, S.; Fatoyinbo, T.E.; Policelli, F. Flood extent mapping for Namibia using change detection and thresholding with SAR. Environ. Res. Lett. 2014, 9, 035002. [Google Scholar] [CrossRef]
  42. Tsyganskaya, V.; Martinis, S.; Marzahn, P.; Ludwig, R. SAR-based detection of flooded vegetation–a review of characteristics and approaches. Int. J. Remote Sens. 2018, 39, 2255–2293. [Google Scholar] [CrossRef]
  43. Yang, H.; Wang, H.; Lu, J.; Zhou, Z.; Feng, Q.; Wu, Y. Full lifecycle monitoring on drought-converted catastrophic flood using sentinel-1 sar: A case study of poyang lake region during summer 2020. Remote Sens. 2021, 13, 3485. [Google Scholar] [CrossRef]
  44. Eraku, S.; Akase, N.; Koem, S. Analyzing Limboto lake inundation area using landsat 8 OLI imagery and rainfall data. J. Phys. Conf. Ser. 2019, 1317, 012111. [Google Scholar] [CrossRef]
  45. Febrianti, N.; Yulianto, F.; Arda, M.; Haryani, N. Flood inundation mapping using synthetic aperture radar data single polarization: A case study of flood in lake tempe, South Sulawesi-Indonesia. IOP Conf. Ser. Earth Environ. Sci. 2020, 572, 012028. [Google Scholar] [CrossRef]
  46. Kanematsu Corporation Japan Weather Association. FY 2018 Operational Feasibility Study Project towards Overseas Deployment of High-Quality Infrastructure (Republic of Indonesia: Feasibility Study Project for Flood Disaster Preparedness Planning Assuming the Use of Flood Simulator and Weather Radar in the Province of Gorontalo). 2019. Available online: https://www.meti.go.jp/meti_lib/report/H30FY/000154.pdf (accessed on 1 December 2022).
  47. Planet Labs. PlanetScope. 2022. Available online: https://developers.planet.com/docs/data/planetscope/#:~:text=lastupdated%3AJune01%2C2022,200millionkm2%2Fday (accessed on 1 December 2022).
  48. Subehi, L.; Wibowo, H.; Jung, K. Characteristics of rainfall-discharge and water quality at Limboto Lake, Gorontalo, Indonesia. J. Eng. Technol. Sci. 2016, 48, 288–300. [Google Scholar] [CrossRef] [Green Version]
  49. Lamangida, T.; Akib, H.; Malago, J. Management of Public Assets Study Management of Lake Limboto Gorontalo District. IOSR J. Humanit. Soc. Sci. 2018, 23, 92–99. [Google Scholar] [CrossRef]
  50. BPS-Statistics Indonesia. STATISTIC INDONESIA. 2020. Available online: https://www.bps.go.id/ (accessed on 1 December 2022).
  51. ASEAN Disaster Information Network. Indonesia, Flooding in Gorontalo Regency, Gorontalo. 2022. Available online: https://adinet.ahacentre.org/report/indonesia-flooding-in-gorontalo-regency-gorontalo-20211106 (accessed on 1 December 2022).
  52. Planet Labs. Planet Explore. 2022. Available online: https://www.planet.com/expl (accessed on 1 December 2022).
  53. Pekel, J.F.; Cottam, A.; Gorelick, N.; Belward, A.S. High-resolution mapping of global surface water and its long-term changes. Nature 2016, 540, 418–422. [Google Scholar] [CrossRef] [PubMed]
  54. European Space Agency. Worldwide Land Cover Mapping. 2022. Available online: https://esa-worldcover.org/en (accessed on 1 December 2022).
  55. Otsu, N. A Threshold Selection Method from Gray-Level Histograms. IEEE Trans. Syst. Man. Cybern. 1979, 9, 62–66. [Google Scholar] [CrossRef] [Green Version]
Figure 1. Overall methodological workflow.
Remotesensing 15 01099 g001
Figure 2. Study area: (a,b) overview of the study area and (c) Limboto Lake and flowing rivers.
Remotesensing 15 01099 g002
Figure 3. Landcover transformations in the lake’s surrounding areas: (ad) landcover classification using Landsat series (1978–2020) and (eg) water hyacinth growth on/at the lake in 2020.
Remotesensing 15 01099 g003
Figure 4. Landcover changes in Teratai Village.
Remotesensing 15 01099 g004
Figure 5. Monthly precipitation trend in the study area (1981–2022).
Remotesensing 15 01099 g005
Figure 6. Landcover transformations and water areas using PlanetScope’s SuperDove and Sentinel-1 series: (a,e,f,hk) and (m) water extents extracted from the Sentinel-1 datasets using the Otsu thresholding algorithm; (bd,g,l) landcover classification using PlanetScope’s SuperDove datasets; and (n) ESA 2020 landcover.
Remotesensing 15 01099 g006
Figure 7. Potential flood-affected surface water extents after the flood on 6 November 2021 and the precipitation amount.
Remotesensing 15 01099 g007
Figure 8. (a) Surface water occurrence from 1984 to 2021. (b) ESA’s World Cover 2020.
Remotesensing 15 01099 g008
Figure 9. Area identified with surface water occurrences by villages (1984–2021).
Remotesensing 15 01099 g009
Figure 10. (a) Water extents (23 May 1978) extracted by the Landsat; (b) overlay of surface water occurrence on (a); (c) water extents (7 December 2021) extracted by the Sentinel-1; (d) overlay of surface water occurrence on (c).
Remotesensing 15 01099 g010
Table 1. Main specifications of the satellite imagery used in the study.
Instrument
(Sensor)
Acquisition DateSpatial Res.
(m)
Temporal Res.
(Days)
Operational Mode and Pass (Polarization)Space
Agency
Landsat3 (TM)23 May 197830–6016 USGS
Landsat7 (ETM+)14 April 2002, 16 May 200215–30
Landsat8 (OLI)10 April 2015, 12, 28 May 201515–30
23 April 2020, 9, 25 May 2020
Planet smallsat7 November 202131 Planet
(SuperDove)13 November 2021 Scope
23 November 2021
12 December 2021
27 January 2022
Sentinel-1(C-SAR)28 July 20211012Interferometric Wide ESA
13 November 2021 swath mode
25 November 2021 Descending
7 December 2021 (vertical–vertical)
19 December 2021
31 December 2021
12 January 2022
24 January 2022
5 February 2022
Disclaimer/Publisher’s Note: The statements, opinions and data contained in all publications are solely those of the individual author(s) and contributor(s) and not of MDPI and/or the editor(s). MDPI and/or the editor(s) disclaim responsibility for any injury to people or property resulting from any ideas, methods, instructions or products referred to in the content.

