Article

Isostatic Anomaly and Isostatic Additional Force Analysis by Multiple Geodetic Observations in Qinling Area

1
Institute of Seismology, China Earthquake Administration, Wuhan 430071, China
2
School of Geography and Information Engineering, China University of Geosciences, Wuhan 430074, China
3
Key Laboratory of Geological Survey and Evaluation of Ministry of Education, China University of Geosciences, Wuhan 430074, China
*
Author to whom correspondence should be addressed.
Remote Sens. 2023, 15(3), 740; https://doi.org/10.3390/rs15030740
Submission received: 4 January 2023 / Revised: 24 January 2023 / Accepted: 25 January 2023 / Published: 27 January 2023

Abstract

:
Determination of the isostatic anomaly and the isostatic additional force plays a key role in understanding the deep tectonic features and dynamics in the Qinling area. At present, high-accuracy observation gravity data are one of the important means to obtain the isostatic anomaly and the isostatic additional force. Firstly, we calculate the free-air gravity anomalies and the Bouguer gravity anomalies by using hybrid gravity and GPS observation data. Then, we invert the isostatic anomaly and the isostatic additional force. The results show that the isostatic depth calculated by Airy isostatic theory is 40–49 km, and the Moho depth is 39–48 km. The Weihe Basin is in a non-isostatic state with an upward isostatic additional force that reached about 20 MPa. The isostatic anomaly and the isostatic additional force are approximately zero in the northern Sichuan Basin, which indicates that the crust is in isostatic state. The negative isostatic anomaly and isostatic additional force in Liupanshan Mountains, the southwest margin of the Ordos Basin, and the local areas of the Qinling Orogen and Dabashan indicate the existence of crustal movement. By combining the measurement of InSAR, we obtain the surface deformation information of the Weihe Basin, as well as an upward trend, which proves that the result is highly consistent with the gravity observation.

1. Introduction

The Qinling Orogen crosses the central part of China and splits the North China Block and the South China Block. It is one of the three basic tectonic zones in central-eastern China which have experienced multi-periods of tectonic evolutionary movements and have complex geological formations. The study of its deep isostatic anomaly and isostatic additional force is important to reveal the formation mechanism of the Qinling Orogen, the tectonic evolution of the Chinese continent, and other dynamics mechanisms [1,2].
In recent years, numerous geophysical researchers have conducted a series of studies to characterize the isostatic anomaly, including the seismic wave and gravity methods. For the seismic wave method, the Moho depth was obtained by using seismic velocity, and the isostatic depth was obtained according to isostatic theory [3,4,5,6]. Finally, a comparison of the Moho depth and the isostatic depth was conducted to obtain the isostatic anomaly, in order to analyze the tectonic motion [7,8,9,10]. The gravity method has the advantages of low data acquisition cost and high spatial resolution; therefore, it is widely used. This method has been applied in many studies in the Qinling area. Wang et al. [11] collected the gravity data along a profile crossing the Ordos Basin, Weihe Basin, Middle Qinling Orogen, and eastern Sichuan Basin. They concluded that there is a distinctive “basin-orogen-basin” tectonic system in the North China Craton-Middle Qinling Orogen-Yangzi Craton, with special recent characters of evolution. She et al. [12] conducted hybrid gravity and Global Positioning System (GPS) observation at a survey line. They investigated the isostatic anomaly of the Liupanshan Mountains near the Qinling area and found that the isostatic depth was thicker than the Moho depth. They revealed that the largest gradient of the crust load is located at the position of the fault of the eastern Liupanshan Mountains. In order to investigate the structure of the crust beneath the Middle Qinling Orogen, Zhang et al. [13] conducted a gravity profile which suggested future growth of the crust. However, these researchers only analyzed the isostatic anomaly in the Qinling area and did not provide the crustal isostatic additional force. At present, some scholars have used gravity data to obtain the isostatic additional force in some areas of mainland China. Gao et al. [14] presented a new method to calculate the isostatic additional force of the crust by using hybrid gravity and GPS observation data. They calculated the isostatic additional force at the eastern boundary of Bayanhar block and the surrounding area. Wang et al. [15] conducted a dense gravity and GPS survey in Qinling Orogen. The results showed that the downward isostatic additional force reaches a peak of −14 MPa in the Liupanshan Mountains, whereas the highest value of upward isostatic additional force reaches about 8 MPa and is attained in the Middle Qinling Orogen. She et al. [16] used gravity/GPS observation data to calculate the isostatic additional force in the eastern part of the Bayan Har block, and found that the gradient belt of the isostatic additional force corresponds to the lateral distribution of the observed earthquakes, and the area of the negative and positive isostatic additional force corresponds to the deep and shallow earthquakes, respectively.
With the development of modern geodetic and geophysical technologies, ground displacement can be monitored, which contributes to a better understanding of the material movement. Differential interferometric synthetic aperture radar (InSAR) can measure wide-area ground displacement [17,18]. However, spatial and temporal decorrelations and atmospheric screens seriously affect the accuracy of differential InSAR. With the accumulation of SAR images, time series InSAR methods, e.g., persistent scatterer InSAR [19] and small baseline subset (SBAS) InSAR [20], can measure ground displacement with high accuracy using stable scatterers that remain stable over a certain or a long period.
In general, the study of isostatic anomalies and isostatic additional force in the Qinling area is not enough, and corresponding results are not given in most areas. Moreover, few studies have been conducted by combining multi-geodetic data.
In this study, we conducted a gravity and GPS hybrid survey in the Qinling area and obtained high-accuracy gravity and elevation data. Based on these data, we obtain free-air gravity anomalies and Bouguer gravity anomalies. Then, we calculate the isostatic anomaly and isostatic additional force of the study area. Finally, we use Sentinel-1 SAR images between July 2020 and July 2022 to map the displacement rate of the Weihe Basin. In this paper, we discuss the isostatic state and motion mechanism of the study area by combining the geology and tectonic results.

2. Geological Setting and Observation Data of the Qinling Area

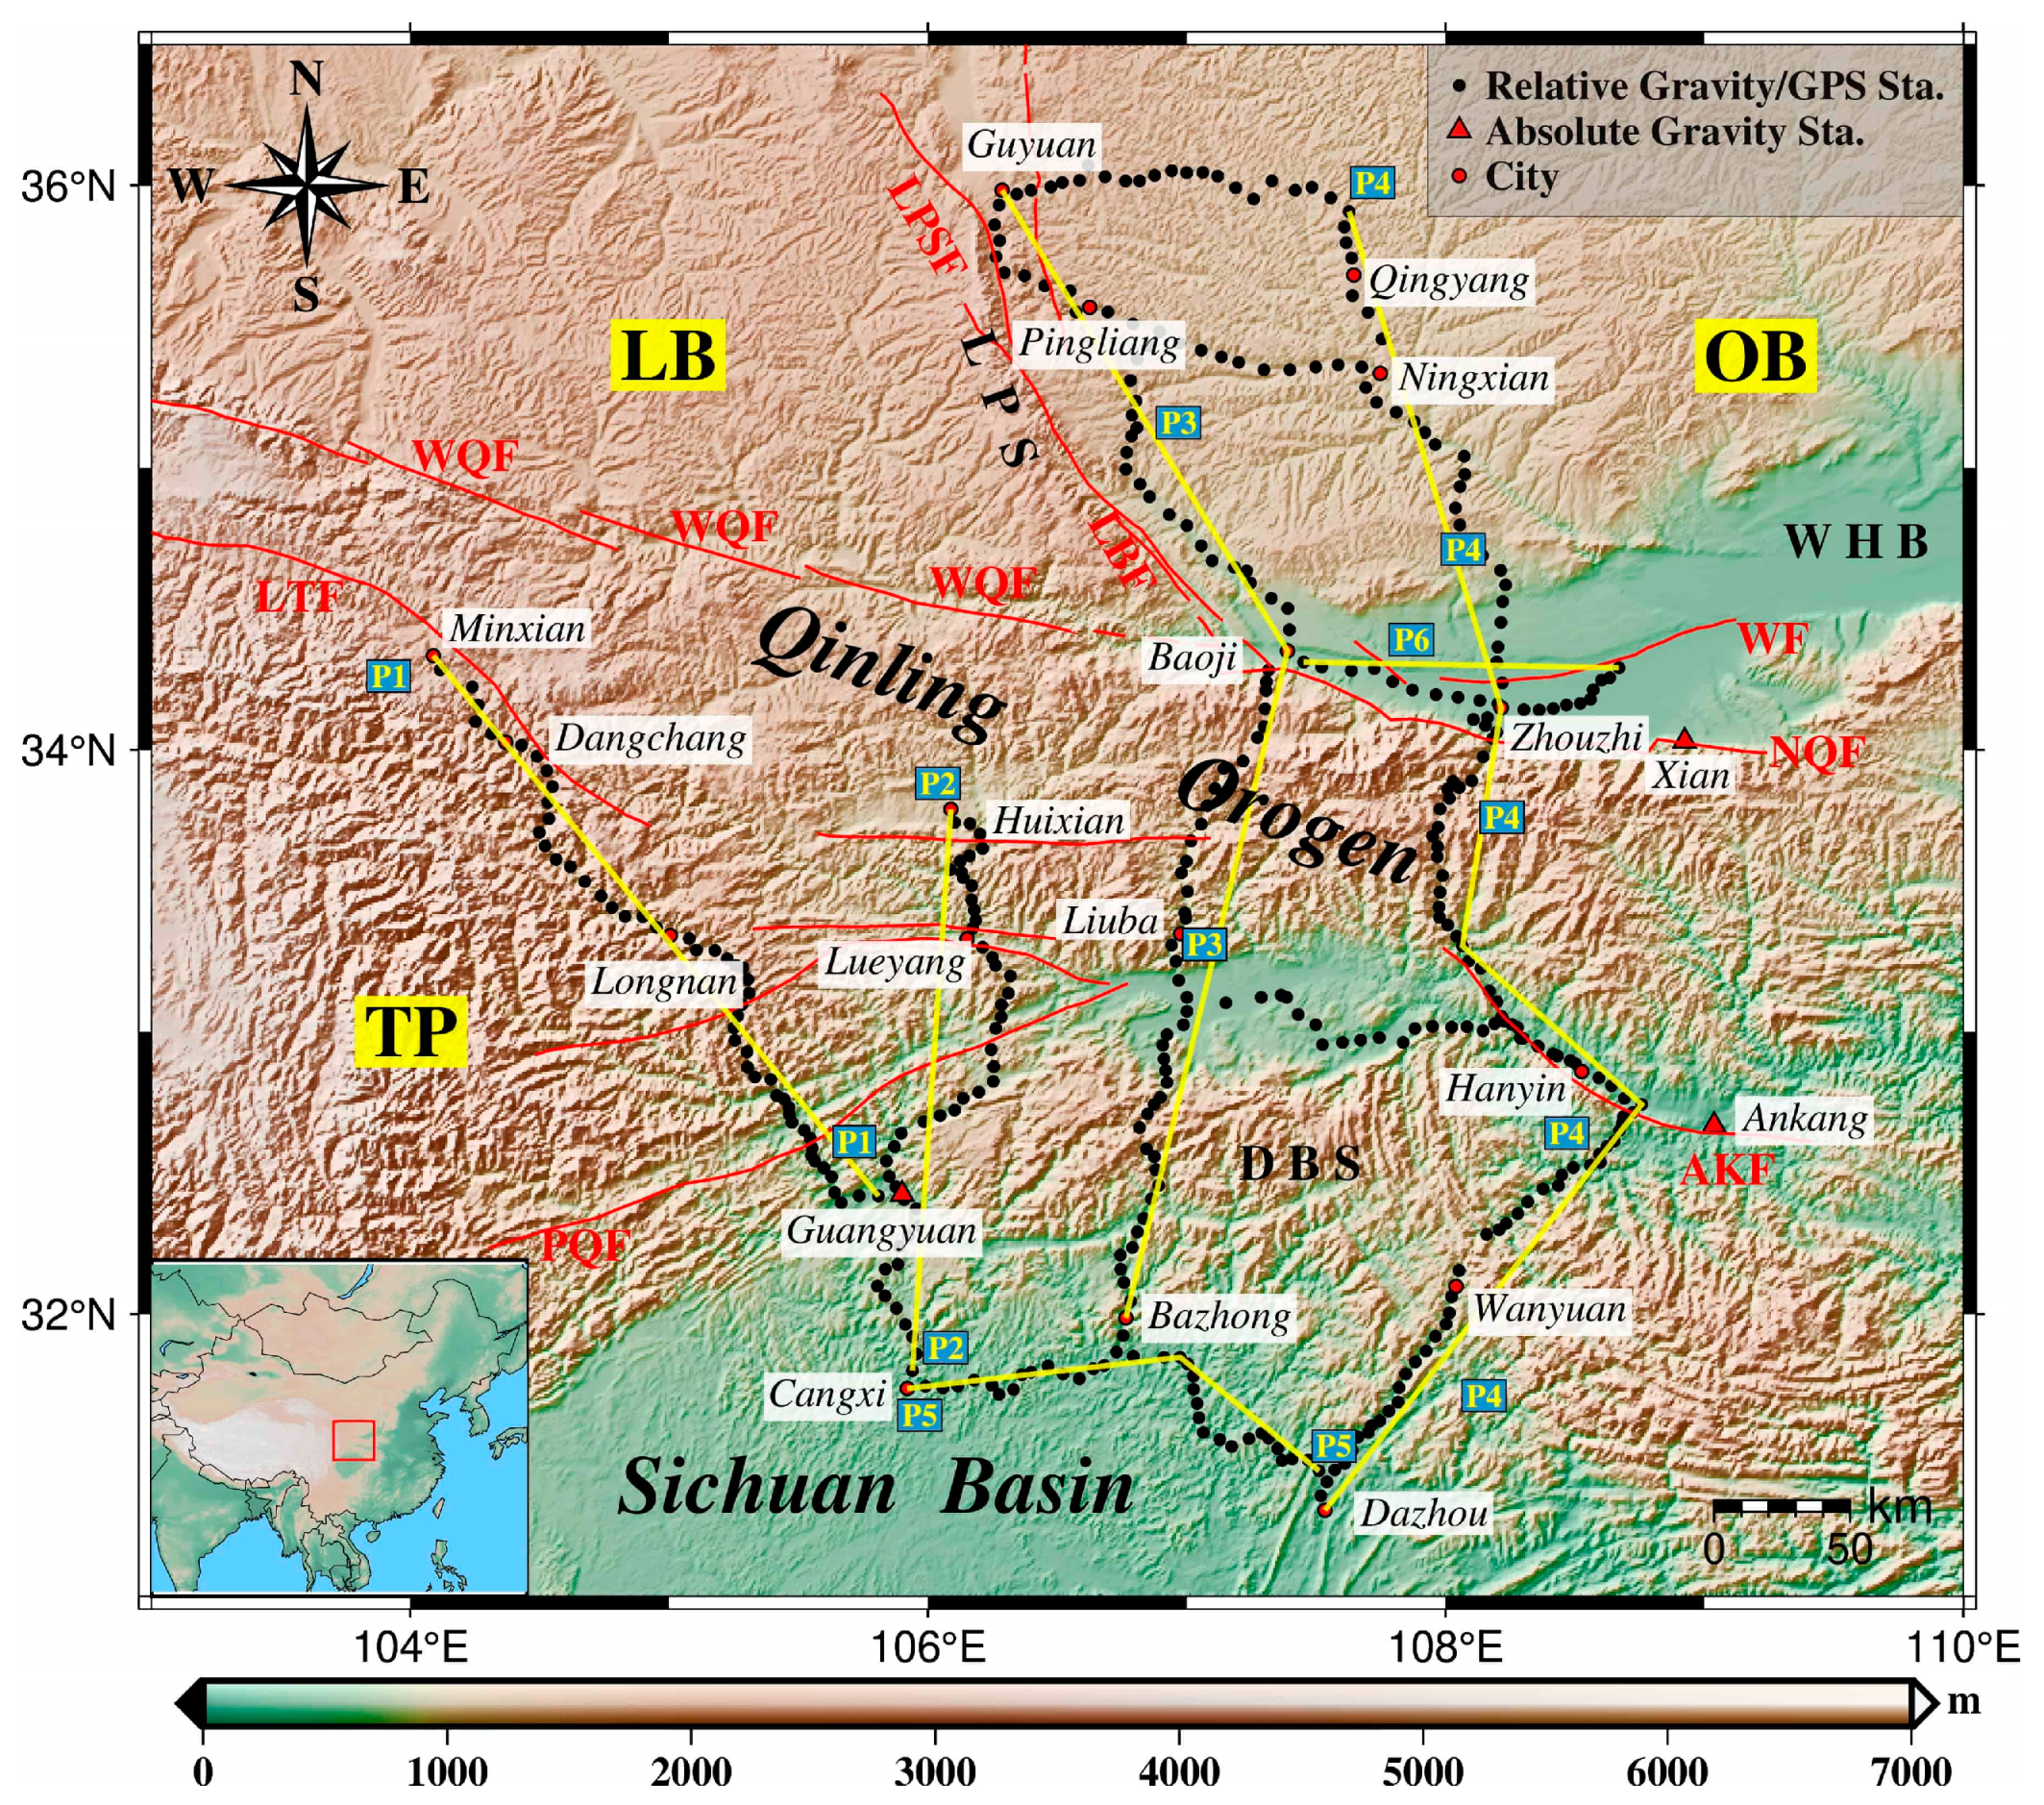
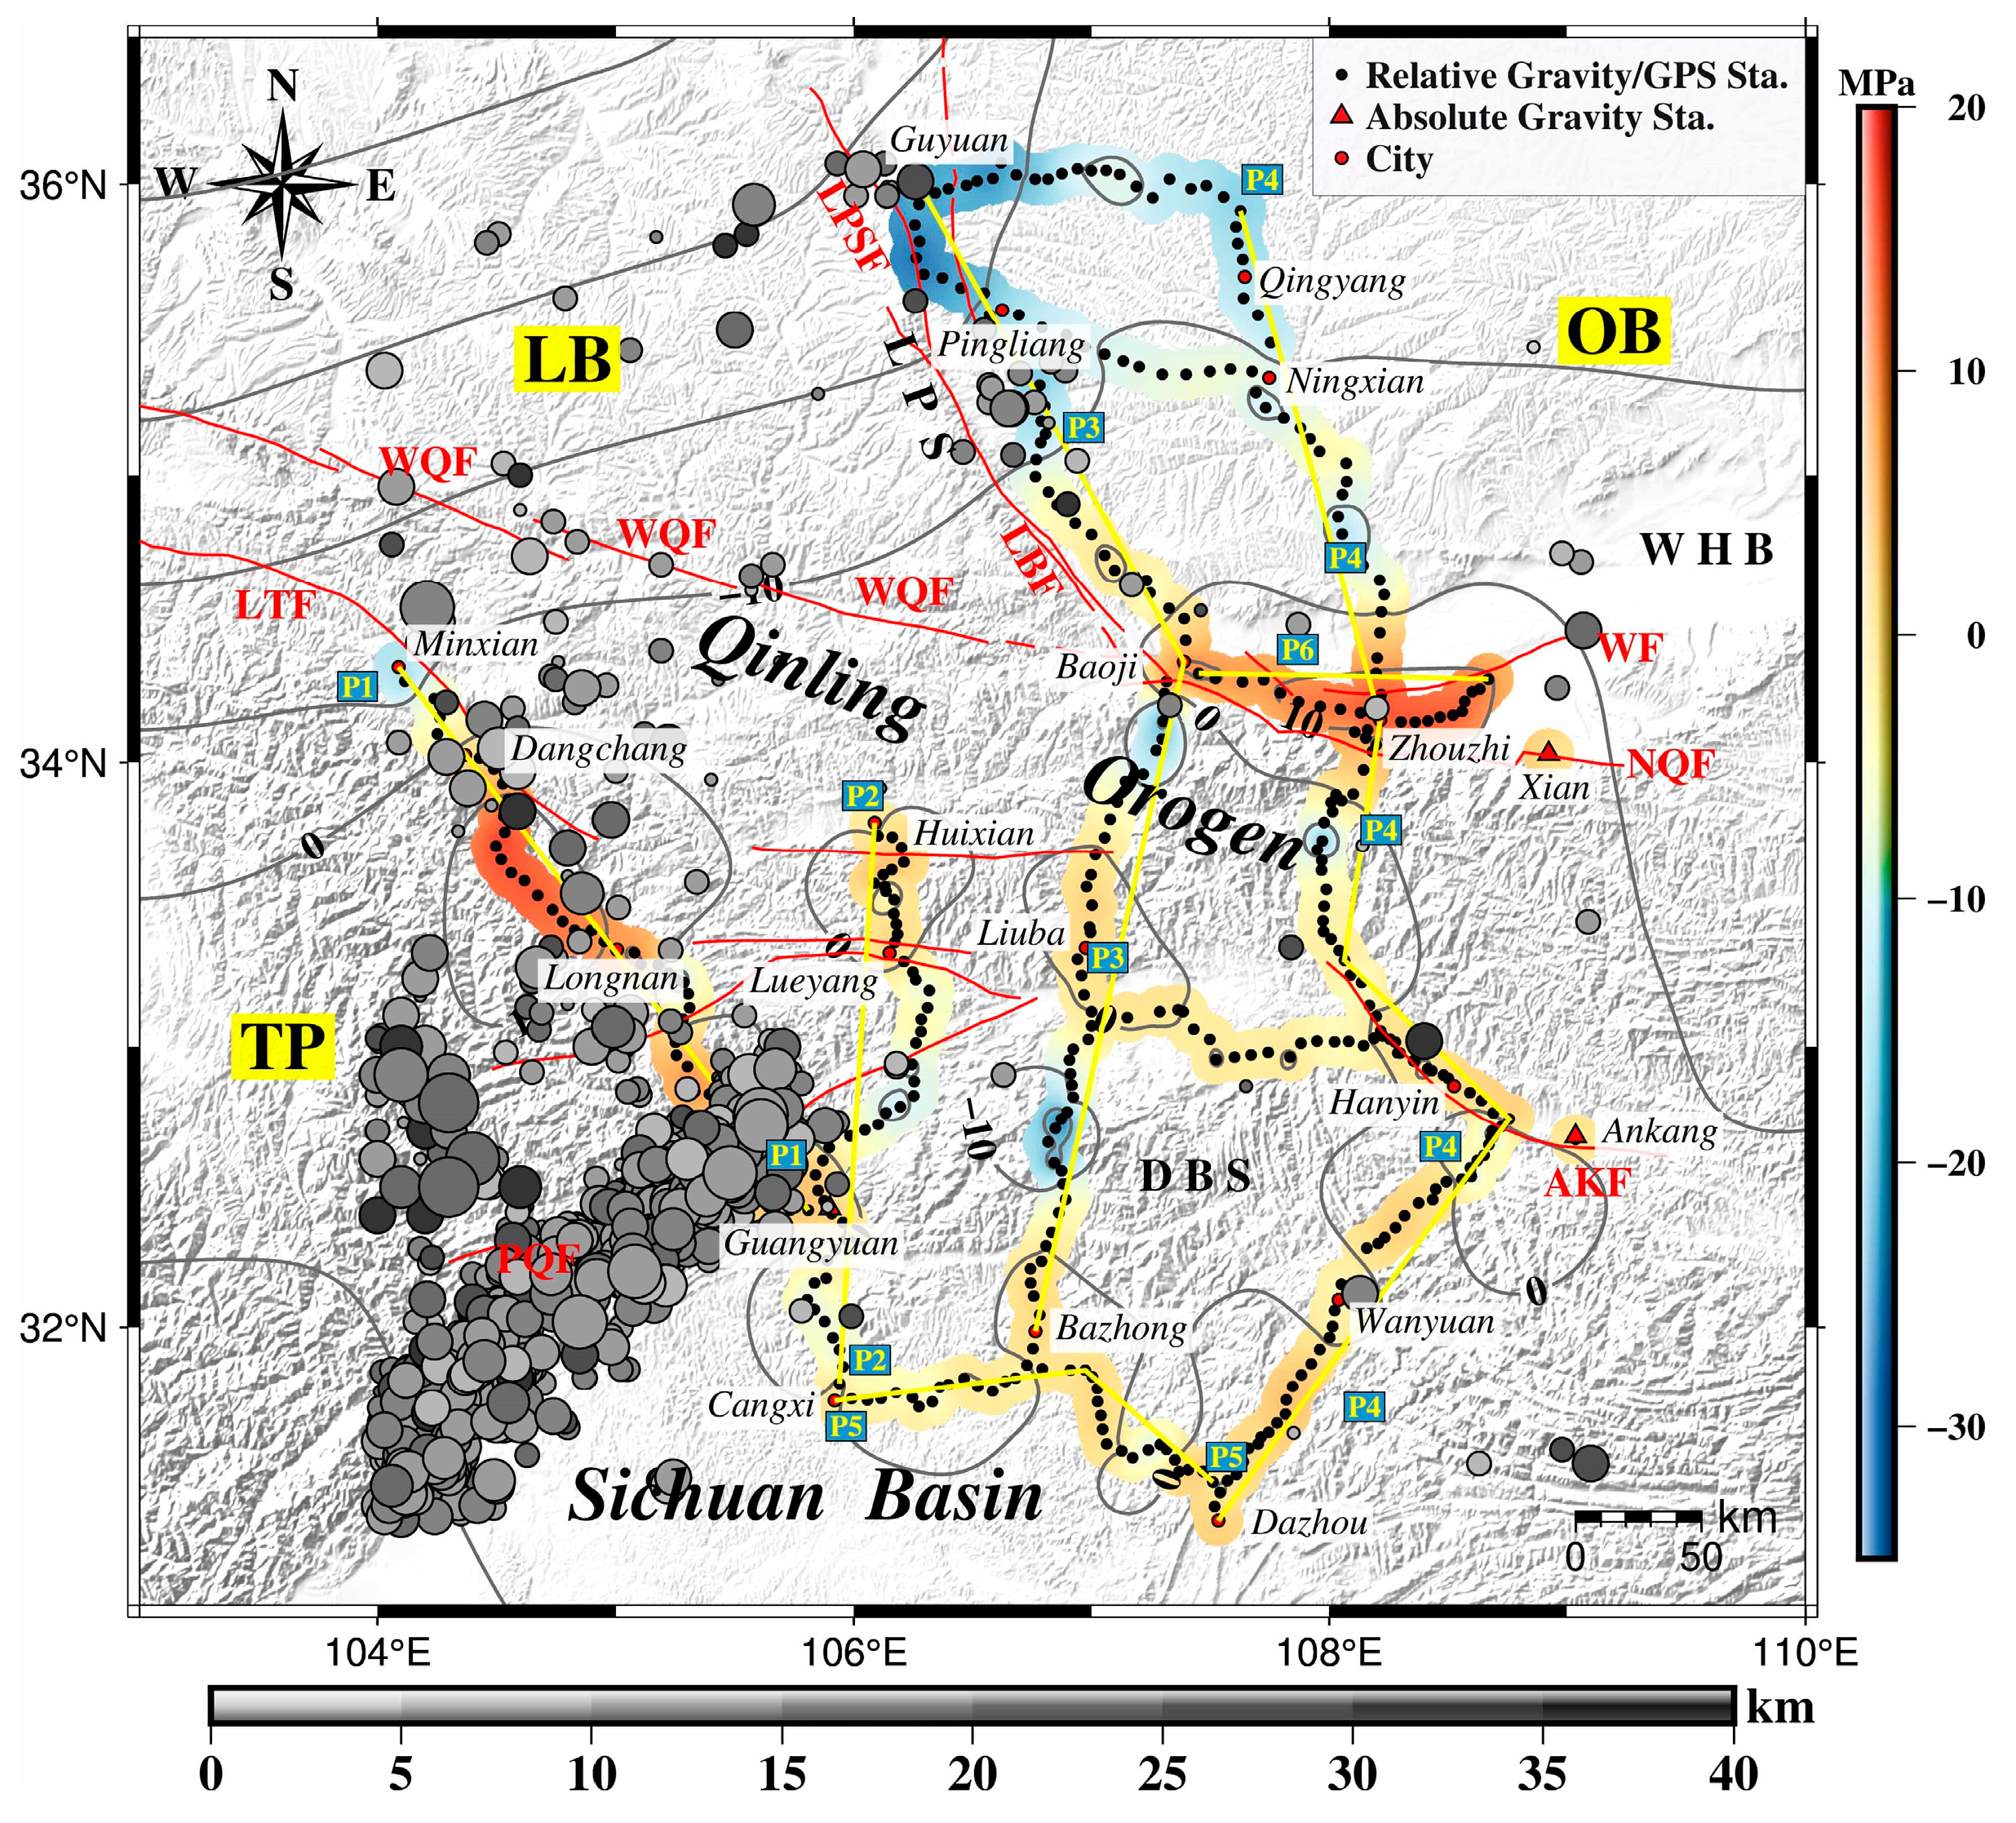
2.1. Geological Setting

The study area (Figure 1) comprises the Shaanxi, Sichuan, and Gansu zones in central and western China and runs across the five major tectonic units, namely (from north to south): Ordos Basin, Weihe Basin, Qinling Orogen, Dabashan, and Sichuan Basin. The Ordos Basin is a stable sedimentation cratonic basin. It is in the western part of the North China Block, one of the oldest and most stable cratons in Asia [21]. The Ordos Basin and its peripheral areas are subjected to different tectonic stresses; the Ordos Basin itself exhibits little seismicity, weak internal deformation, and overall stability. Further, Ordos Basin is surrounded by a series of active tectonic zones with intensive present-day seismic activity.
The Weihe Basin is located south of the Ordos Basin and north of the Qinling Orogen, showing a distributed trend of deep south to shallow north, inclined to the south. It experienced intensive compression in the Palaeozoic and Mesozoic periods, and subsequent extensional movement caused by the far-field effect of the India–Eurasia collision in the Cenozoic period with obvious vertical differential movements, strong seismic activity, and active fault movements within the basin; it is one of the areas with the largest Quaternary subsidence amplitude and accumulation thickness in North China [22]. According to previous work, the tectonic stress field in the Weihe Basin area was uneven, and the tensile stresses were controlled in the east and compressive stress was observed in the west [23].
The Qinling Orogen is an important dividing line between North and South China, with a long-lasting evolutionary history which spans the central part of China. The tectonic framework of the Qinling Orogen is a multi-system orogenic belt with three blocks, namely: the North China Block, the South Qinling, and the South China Block, separated by the Shangdan and Mianlue sutures [24,25]. The Shangdan suture is located in the middle of Qinling, and it is about 100 km long from east to west and 8-10 km wide. It is a plate subduction-collision zone of the main orogenic phase facies of the Qinling. The Mianlue suture includes the Mianxian-Lueyang ophiolitic tectonic melange and its eastern extension, and the Bashan arc-like thrust belt, which is another suture zone secondary to the Shangdan suture zone in the Qinling. Petrological assemblages within the Mianlue suture are complicated, including ultramafic rocks, gabbros, marine volcanic rocks, siliceous rocks, limestone, and basement metamorphic rocks [1].
The Dabashan is located between the Sichuan Basin and the Qinling Orogen. The study of the tectonic morphology, formation, and geodynamic processes of Dabashan shows that it formed between the late Middle Jurassic and early Cretaceous periods. The Chengkou-Fangxian fault zone divides the Dabashan into two parts: the northern Dabashan and the southern Dabashan, respectively [26]. The northern Dabashan is mainly composed of volcano-sedimentary rocks and slate-carbonate rocks. Metamorphic volcano-sedimentary rocks and carbonate sandstone-shale are the main features of the southern Dabashan [27].
The Sichuan Basin is a rigid block located in the western portion of the South China Block that became a distinct unit in the Late Triassic period and was covered with huge, thick Mesozoic continental sediments [28]. The interior of the Sichuan Basin is flat with low hilly terrain and is surrounded by high mountains, with a north-eastward distribution in a rhombic shape. The central part of the basin is dominated by metamorphic and magmatic rocks with a high degree of hardening; the two sides of the basin are uplifted, and the northwest and southeast directions are folded basement depression zones with a low degree of hardening, consisting of shallow metamorphic rocks, which belong to the crustal stability zone.

2.2. Geodetic Observations and Data Processing

The gravity and GPS hybrid observation datasets that we use in this study were performed from two measurement phases (Figure 1). One part of our observation in July 2021 included 265 observation stations, and another part in July 2022 included 144 observation stations. Observation stations were selected from stable foundation, flat, and easy access locations. We conducted an out-and-back procedure to gather observation data to minimize errors, that is, 1 → 2 → 3 → … → 3 → 2 → 1 [29]. All stations are linked to the absolute gravity stations at Xian, Ankang, and Guangyuan. In order to reduce the observation error, the distance between two adjacent measuring stations was approximately 6–10 km. Gravity data were then adjusted using the software named LGADJ of the China Earthquake Administration [30], and observation stations absolute gravity values were calculated from the three sites of Xian, Ankang, and Guangyuan. The overall accuracy of the gravity data is 0.02 mGal.
Firstly, the free-air gravity anomalies have undergone a series of gravity corrections, including the normal field correction and the height correction ( g F = 0.3086   h ,   where   h   is   the   GPS   elevation ). Here, the data processing was done in the WGS84 reference frame. We then applied the Bouguer plate correction and terrain correction by using the topography model ETOPO1 to obtain Bouguer gravity anomalies [31,32]. The free-air gravity anomalies and Bouguer gravity anomalies are shown in Figure 2 and Figure 3. We present the most reliable results near the observation stations, shown in color, and the results far from the observation stations are shown in contours.
It can be seen from Figure 2 that the free-air gravity anomalies range from −80 to 50 mGal with an average of −75 mGal, which correspond well with the topographic relief. The changes are more drastic in places with intense relief, and more moderate in the northern Sichuan Basin with smooth relief. According to Figure 3, the Bouguer gravity anomaly of the study area is negative as a whole and gradually decreases from southeast to northwest. It is a high negative anomaly value area from Longnan to Minxian. The variation in gravity anomaly mainly reflects the evolution trend of deep tectonics. The anomaly value gradually increases from northwest to southeast, indicating that the Moho depth is slowly rising.
We collected 51 Sentinel-1 SAR images acquired from July 2020 to July 2022 by ascending orbit in terrain observation by progressive scans (TOPS) mode in Weihe Basin (Figure 4). The resolutions are 5 m in the range and 20 m in the azimuth directions. The look angle is approximately 34°. The ALOS World 3D (AW3D) digital surface model (DSM) [33] was used to remove the topographic phase and geocode.

3. Methods

3.1. Isostatic Anomaly Computation

It is assumed that the densities of crust and mantle in the study area are constant. The isostatic crustal thickness H at different elevation h can be determined according to Airy isostatic theory, as follows [34]:
H = h + r + H 0 = ( 1 + ρ t / Δ ρ ) h + H 0
where r is the Airy-type root thickness, H0 is the average crustal thickness, ρ t is the average density above the sea level (2.67 g/cm3), and Δ ρ is the density difference between the crust and mantle. Based on the results of previous studies [35], we assume that the crust-mantle density difference Δ ρ and the average crustal thickness H0 are 0.690 g/cm3 and 39 km, respectively. Once H is obtained, the isostatic depth D can be calculated as follows:
D = H h .
As an interface between the crust and the mantle, the Moho is an active zone for the interaction between the crust and the mantle material. We can obtain the Moho depth through forward and inverse computation by using the Bouguer gravity anomaly. We consider that the crustal density is constant in the study area, and the variation in the Moho depth can be approximated by the variation in the density layer. The density of the layer is the crust-mantle density difference Δ ρ , then the Bouguer gravity anomalies can be translated to the variations in the density layer near the depth of the Moho [36]:
Δ g = 2 π G Δ ρ H H + Δ h d z = 2 π G Δ ρ Δ h
where G is the gravitational constant, and Δ h is the density layer thickness. Substitute Δ ρ = 0.690 g/cm3, then
Δ g = 0.029 Δ h .
If the Moho depth M0 and the Bouguer gravity anomaly Δ g 0 of a station are known, the Moho depth Mi of all stations in the gravity observation network can be computed as follows:
M i = M 0 + ( Δ g i Δ g 0 ) / 0.029 .
The difference between Mi and D gives the isostatic anomaly
Δ M = M i D .

3.2. Isostatic Additional Force Computation

We adopted the method proposed by Gao et al. [10] to calculate the isostatic additional force [37]. The specific calculations are as follows: (1) the Moho depth is obtained using the Bouguer gravity anomaly; (2) the isostatic depth is obtained according to Airy isostatic theory; (3) the isostatic additional force P is obtained based on the additional buoyancy between the Moho and isostatic surface. The equation is as follows:
P = Δ M Δ ρ g ,
where g is the gravitational constant, and the positive and negative P are the upward and downward stress of the lithosphere, respectively.

3.3. Persistent Scatterer InSAR Method

High co-registration accuracies (better than 0.001 pixels) are required for SAR data acquired in TPOS mode [38]. Geometric co-registration and an enhanced spectral diversity approach are jointly used to achieve this accuracy using the GAMMA software [39]. In order to reduce computational burden, multi-look factors of 10 in range and 2 in azimuth are used to generate differential interferograms. We use amplitude dispersion (<0.4) and temporal coherence (<0.3) thresholds to select the final persistent scatterer (PS) pixels for time series analysis. The minimum cost flow method is used to retrieve the unwrapped phase. Phase ramp in each interferogram is estimated and removed with a bilinear model [40]. The topographic phase residual is estimated using a linear fitting between perpendicular baselines and unwrapped phases [40]. We then remove the atmospheric phase screen using temporally high-pass and spatially low-pass filters. The final time series displacements of each pixel are then retrieved after we remove all the other phases.

4. Results and Analysis

4.1. Isostatic Anomaly

The isostatic depth in the study area is calculated by Equations (1) and (2), and the results are shown in Figure 5. As in Figure 2, only the results with higher accuracy near the observation stations are shown in color, and the results far from the observation stations are shown in contours. According to Figure 5, the isostatic depth in the study area is relatively influenced by topographic variations. The isostatic depth of the study area changes from about 40 km to 49 km. The maximum value is located near Minxian in the Qinling Orogen, and the minimum value is located near Hanyin. In order to compare and analyze the Moho and isostatic depth, and to determine the Moho depth based on Equation (5) of all stations in the study area, we use the Bouguer gravity anomaly, and the results are shown in Figure 6. Similarly, the results with higher accuracy are shown in color and the results with lower accuracy are shown in contours. It can be seen from Figure 6 that the Moho depth in the study area changes between 39 km and 48 km, which is consistent with the results of 35 to 50 km [41], and the distribution is increasing steadily from southeast to northwest. The average Moho depth of 409 observation stations is 41.896 km.
According to the Airy isostatic theory, if the Moho depth is close to or equal to the isostatic depth, the crust is in isostatic state. Consequently, there is little material and energy exchange, migration, or adjustment, and the tectonic motion is relatively stable. On the contrary, when there is a difference between the Moho depth and the isostatic depth, the crust does not achieve the isostatic state. A larger difference indicates a larger non-isostatic state of the crust, which would result in more intense material and energy exchange, migration, or adjustment [10,13]. Using this theory, it is possible to determine whether the crust has reached isostatic state, and to further analyze the crustal movement. Therefore, the isostatic anomaly is obtained by comparing the Moho depth and the isostatic depth in the study area (Figure 7). We show the results close to the observation stations in color and those far from the observation stations are marked with contours.
It should be noted that, when the isostatic anomaly Δ M > 0 , in order to reach the equilibrium, the Moho depth has a tendency to decrease, or the topography must increase in movement. Figure 7 indicates that the difference in most of the study area is about zero, where the crust is roughly in an isostatic state. The positive isostatic anomaly is mainly concentrated in the Weihe Basin and from the Longnan to Dangchang areas, which is consistent with precise leveling data result and indicates that the area is in an uplift state [42]. The large positive isostatic anomaly result in the Weihe Basin indicates that the area is in a non-isostatic state. It proves that the crust is undergoing strong activity of Weihe Basin from the gravitology perspective [43]. However, in the Liupanshan Mountains, the southwestern part of Ordos Basin, the local areas of Qinling Orogen and Dabashan show a negative isostatic anomaly. That is, the Moho depth is thinner than the isostatic depth. To approach the isostatic state of crust, the topography has a subsiding tendency. Zhang et al. [44] applied highly precise leveling data and found that the surface movement of Liupanshan Mountains is upward after deducting non-tectonic effects, which is contrary to our results.

4.2. Isostatic Additional Force

The isostatic additional force is calculated by Equation (7), and the results are shown in Figure 8. We show the results close to the observation stations in color and far from the observation stations in contours. It should be noted that the Moho depth is greater than the isostatic depth, which indicates upward positive isostatic additional force. The Moho depth is less than the isostatic depth, and the downward negative isostatic additional force will be produced in order to satisfy equilibrium. From the contents of Figure 8, the pattern of the isostatic additional force distribution in the study area is relatively similar to the isostatic anomaly (Figure 7). In the area south of 32°N, the isostatic additional force is almost zero. The negative isostatic additional force appears in the Liupanshan Mountains, the southwest margin of the Ordos Basin, and the local areas of Qinling Orogen and Dabashan, while the Weihe Basin and the area from Guangyuan to Dangchang indicate obvious positive isostatic additional force value. The isostatic additional force gradient varies dramatically on both sides of the North Qinling fault, with a large positive isostatic additional force of about 20 MPa in the Weihe Basin to the north and a negative isostatic additional force in the Qinling area to the south.
The P1 profile shows a “positive-negative-positive-negative” isostatic additional force distribution from southeast to northwest, the P2 profile forms a “zero-negative-zero” alternating distribution from south to north, the P3 profile forms a “zero-negative-zero-negative-positive-negative” alternating distribution from south to north, and the P4 profile has a distribution trend of “zero-negative-zero-negative-positive-negative” from south to north. The isostatic additional force in profile P5 is basically zero MPa, which can be considered as a relatively stable internal structure in the area. The P6 profile is located in the Weihe Basin, and all stations have isostatic additional force greater than zero.

4.3. InSAR Displacement Rate Map over Weihe Basin

The displacement rate map of Weihe Basin is shown in Figure 9. A total of 4,789,127 points were selected. Most of the displacement rates range between −10 mm/yr and 10 mm/yr. Negative values reflect moving away from the sensors while positive values mean the opposite. The subsidence of the Weihe Basin exceeded 100 mm/a during 1992–2015 [45]. Our results indicate that the rates significantly slowed down or even uplifted, which is in accordance with the study by Li et al. [45]. The significant variations in displacement rates in the Weihe Basin are due to groundwater level recovery [45]. Obvious displacement gradient variations along the North Qinling fault are detected.

5. Discussion

The uplift and extension of the northeastern Tibetan Plateau are key issues in the field of earth science, and the northeastern Tibetan Plateau includes our study area. According to previous studies, there are some widely accepted understandings, and these are: (1) Crustal shortening, which is the basic knowledge regarding the uplift of the Tibetan Plateau by geologists, suggests that the Tibetan Plateau is expanding outward from higher elevations in a retrograde compressional manner [46,47]. (2) Middle-lower crustal flow; it is believed that the mid-lower crustal material of the Tibetan Plateau moving eastward is blocked by the Ordos and the Sichuan Basin, which produces the accumulation and thickening of some material [48,49]. (3) Migration of mantle materials [50]. At present, there is some disputation going on. Some researchers consider that the combined effect of the above mechanisms has led to the complex deformation of the northeastern Tibetan Plateau.
The Bouguer gravity anomaly is obtained by making various corrections, excludes the material mass above the geoid, and reflects the density variations. In general, the Bouguer gravity anomaly has a mirror image relationship with the elevation, that is, the higher the topography, the lower the gravity anomaly. At the same time, variations in Moho depth are positively correlated with Bouguer gravity anomaly.
The data points selected from our gravity observation area across the Qinling Orogen and in the Weihe Basin are expanded into profiles (P1, P2, P3, P4, and P6). Figure 10 and Figure 11 show the characteristics of the Bouguer gravity anomaly, topography, the Moho depth, and the isostatic depth for the five profiles. In the Weihe Basin, the displacement rate of 38 data points extracted from persistent scatterer-InSAR (Figure 9) with exactly the same latitude and longitude as the gravity observations were plotted and analyzed (Figure 12) to further verify the reliability of the obtained results.
According to Figure 10a, the topographic relief from Guangyuan to Minxian is obvious, and the Bouguer gravity anomaly decreases gradually with increases in elevation. The difference between the Moho depth and the isostatic depth is small in the area near Guangyuan (Sichuan Basin), which can be considered as being in an isostatic state. In the Qinghai-Tibet Plateau, the Moho depth is greater than the isostatic depth in most areas, indicating that there is an influx of crustal material from the northeastern Qinghai-Tibet Plateau into the Qinling Orogen, and that there is accumulation, resulting in the subsidence of the Moho surface. From Figure 10b, we can see that the distribution of Bouguer gravity anomalies from the Sichuan Basin to Dabashan and then to the Qinling Orogen show their unique morphology and significant difference characteristics, which is probably a representation of geological tectonic units with different properties in the crustal deep part, and there are obvious negative anomalies in the Qinling Orogen, indicating the loss of crustal materials. The topography of the P3 (Figure 10c) varies greatly. We can see that Bouguer gravity anomaly varies with the topography in the area south of Liupanshan Mountains, and the negative Bouguer gravity anomaly is higher south of the North Qinling fault and is flatter in the Liupanshan Mountains. Li et al. [51] suggested that it is due to the convergence of the northeastern Qinghai-Tibet Plateau and the Ordos Basin near the Liupanshan Mountains, resulting in the uplift of the Liupanshan Mountains, showing the characteristics of convergence, compression, and obvious shortening. The P4 profile (Figure 10d) crosses the Middle Qinling Orogen. According to previous research results [52,53,54], there are obvious tectonic differences between the eastern and the western Qinling Orogen, which implies a loss of “mountain root” in the eastern Qinling Orogen and the opposite in the western Qinling Orogen. Comparing the difference between Moho depth and isostatic depth, we find that the Moho surface is thinner than the isostatic surface in the Middle Qinling Orogen. This type of distribution can be interpreted using a subduction and extrusion model, which suggests that the crust in the Middle Qinling Orogen is rising due to the north-south extrusion. In the Ordos Basin, the Moho depth changes slightly.
The formatting and evolution of the Weihe Basin is directly related to the collocation and development of the Qinling Orogen and the Ordos Basin, which have formed the present graben tectonic due to fault activities over the years. We analyze the motion mechanism in the Weihe Basin from gravity data and InSAR data.
From the contents of Figure 11, the Bouguer gravity anomaly in the Weihe Basin is weakly correlated with the topography, and the fluctuation of Moho and the isostatic surface is smooth relief. The Moho surface is thicker than the isostatic surface, and positive isostatic anomaly is thus generated, indicating an upward-moving trend. Combined with Figure 12, the displacement rate obtained is basically greater than zero in the Weihe Basin, which indicates that there is an upward movement trend in Weihe Basin from July 2020 to July 2022 and corroborates the observation results of gravity data. The middle-lower crustal flow model seems to have difficulty the explaining the motion beneath the Weihe Basin. This can be explained by the subduction and extrusion model [55]. In this model, examining subduction and extrusion of the South China Block with the North China Block, the crust of the Weihe Basin subsides, which results in the Moho being deeper than the isostatic surface and the lithosphere being in positive isostatic anomaly.
We discuss the correspondence between the isostatic additional force and the earthquake distribution. We collect the distribution of earthquakes of Ms ≥ 2.0 in the study area from 1970 and statistics on the focal depth, as shown in Figure 13 and Table 1. In Figure 13, the gray dots indicate earthquakes, where the size of the dots indicates the earthquake magnitude, and the color shade indicates the focal depth. According to Figure 13, earthquakes are mainly distributed along fault lines, including WF and NQF, and they are also on both sides of the zero line of the isostatic additional force, i.e., the transition zone of isostatic state adjustment. We find that earthquakes are mainly distributed in the combination of the Tibetan Plateau, the Qinling Orogen, and the Sichuan Basin, in the study area. In addition, in the Liupanshan Mountains and the Weihe Basin, although earthquakes occur, they are still in a relatively quiet period with low frequency. It can be seen from Table 1 that the focal depth of the earthquakes in the study area are mainly shallow-focus earthquakes within 30 km. As a conclusion, according to the analysis on the isostatic state in the present study, the results indicate high potential seismic risks near the Liupanshan Mountains, the Weihe Basin, and the P1 profile.

6. Conclusions

Multi-geodetic observations and methods are used in this study. We obtain gravity and GPS hybrid observation datasets in the Qinling area to obtain the free-air and the Bouguer gravity anomalies. Based on the Airy isostatic theory, the Moho depth, the isostatic depth, and the isostatic anomaly of the study area were obtained by using the Bouguer gravity anomaly and GPS elevation datasets, identifying the crustal isostatic state as well. We obtain the isostatic additional force based on the additional relationship between the Moho and the isostatic surface. By combining the measurement of InSAR, we obtain the surface deformation information of the Weihe Basin. The main conclusions of the study are as follows.
(1)
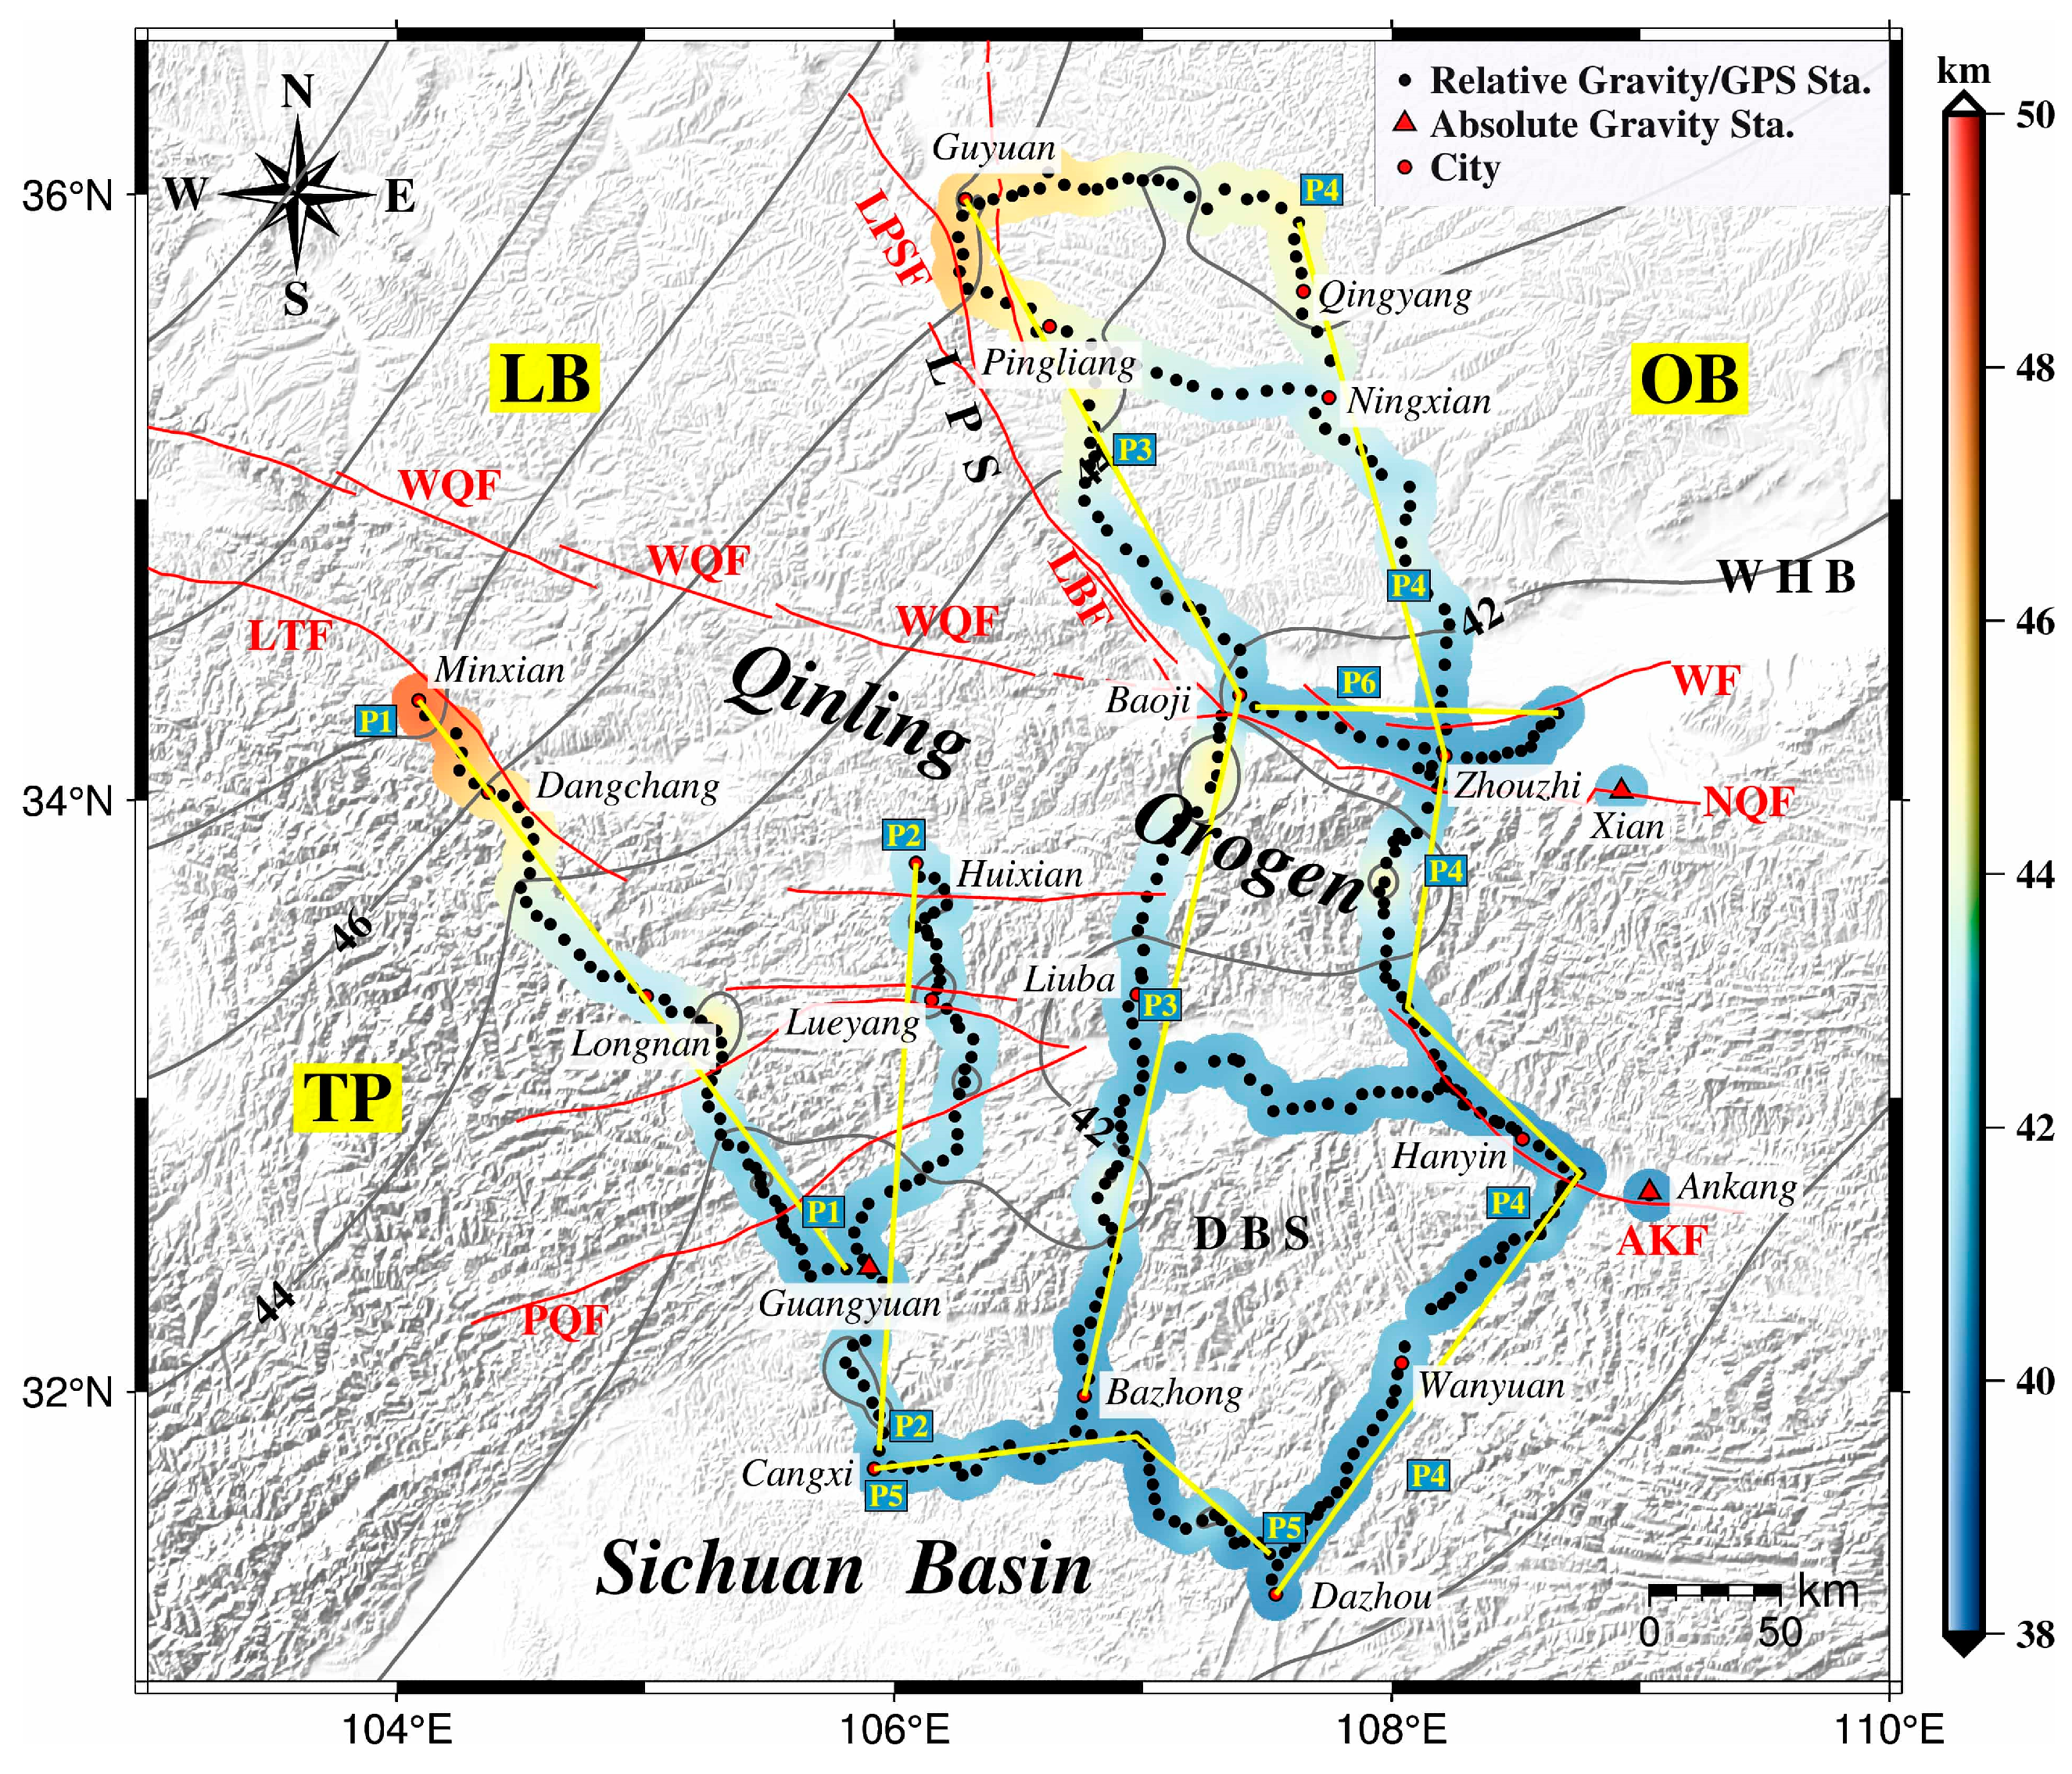
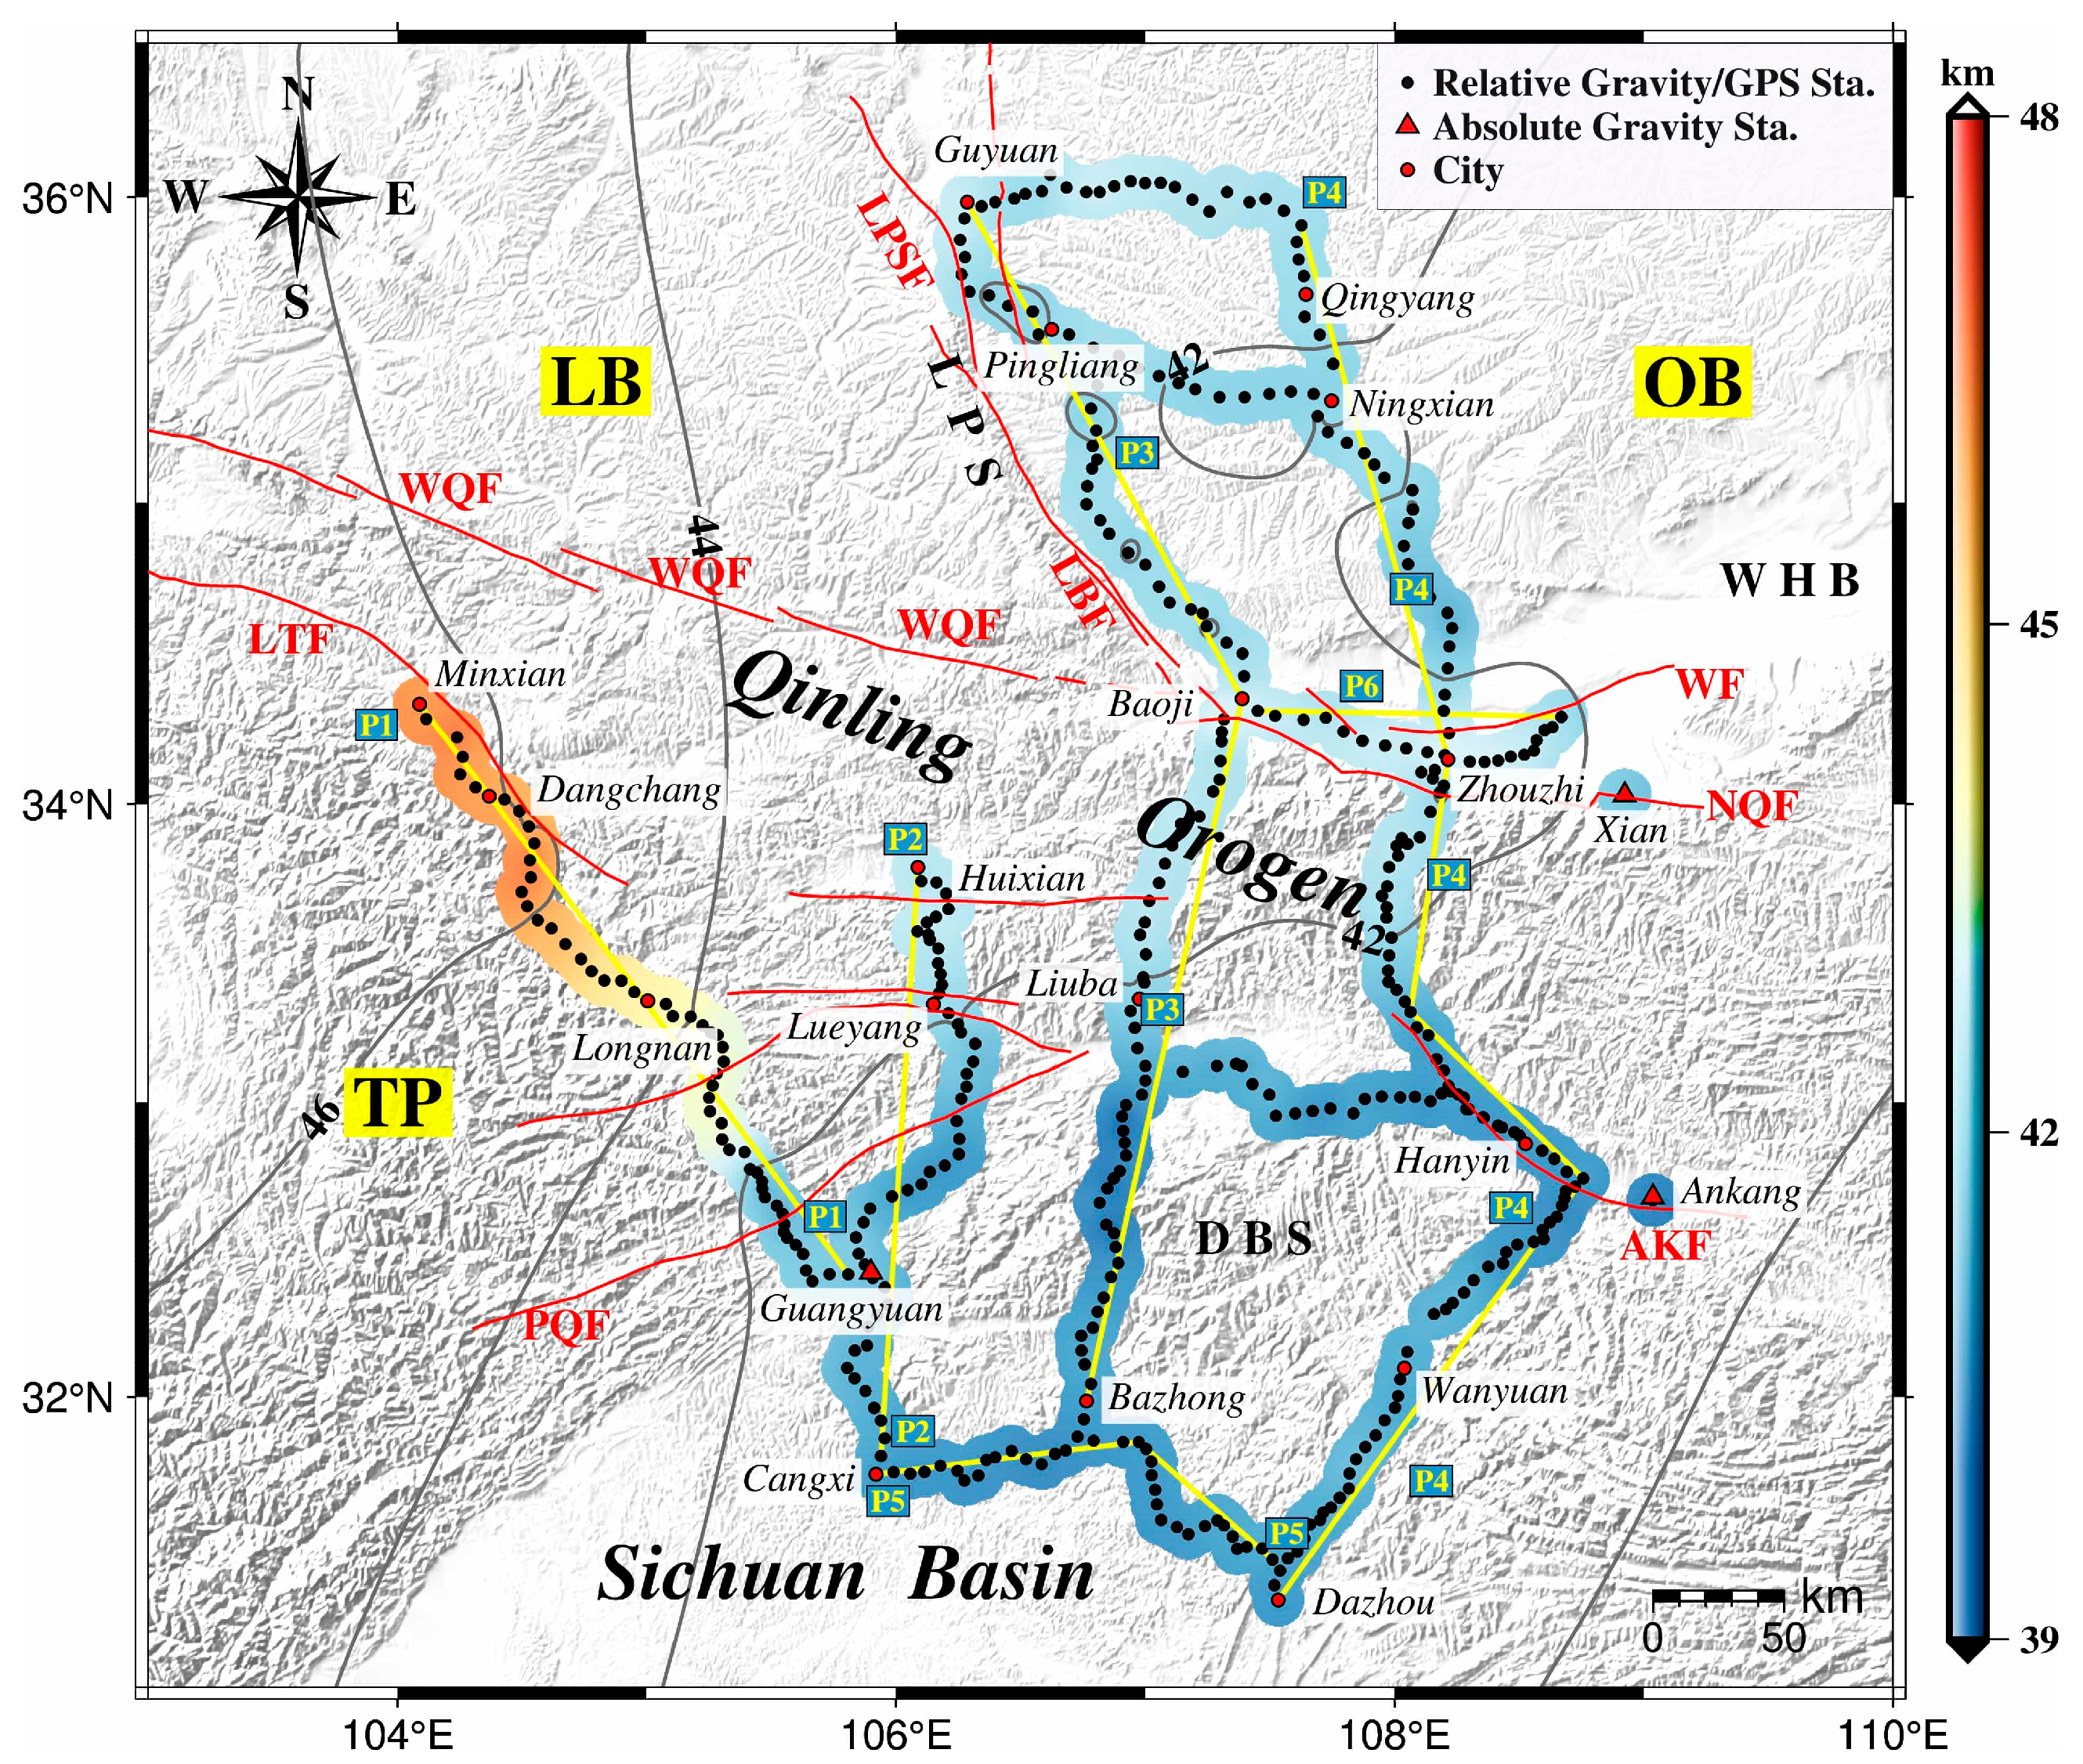
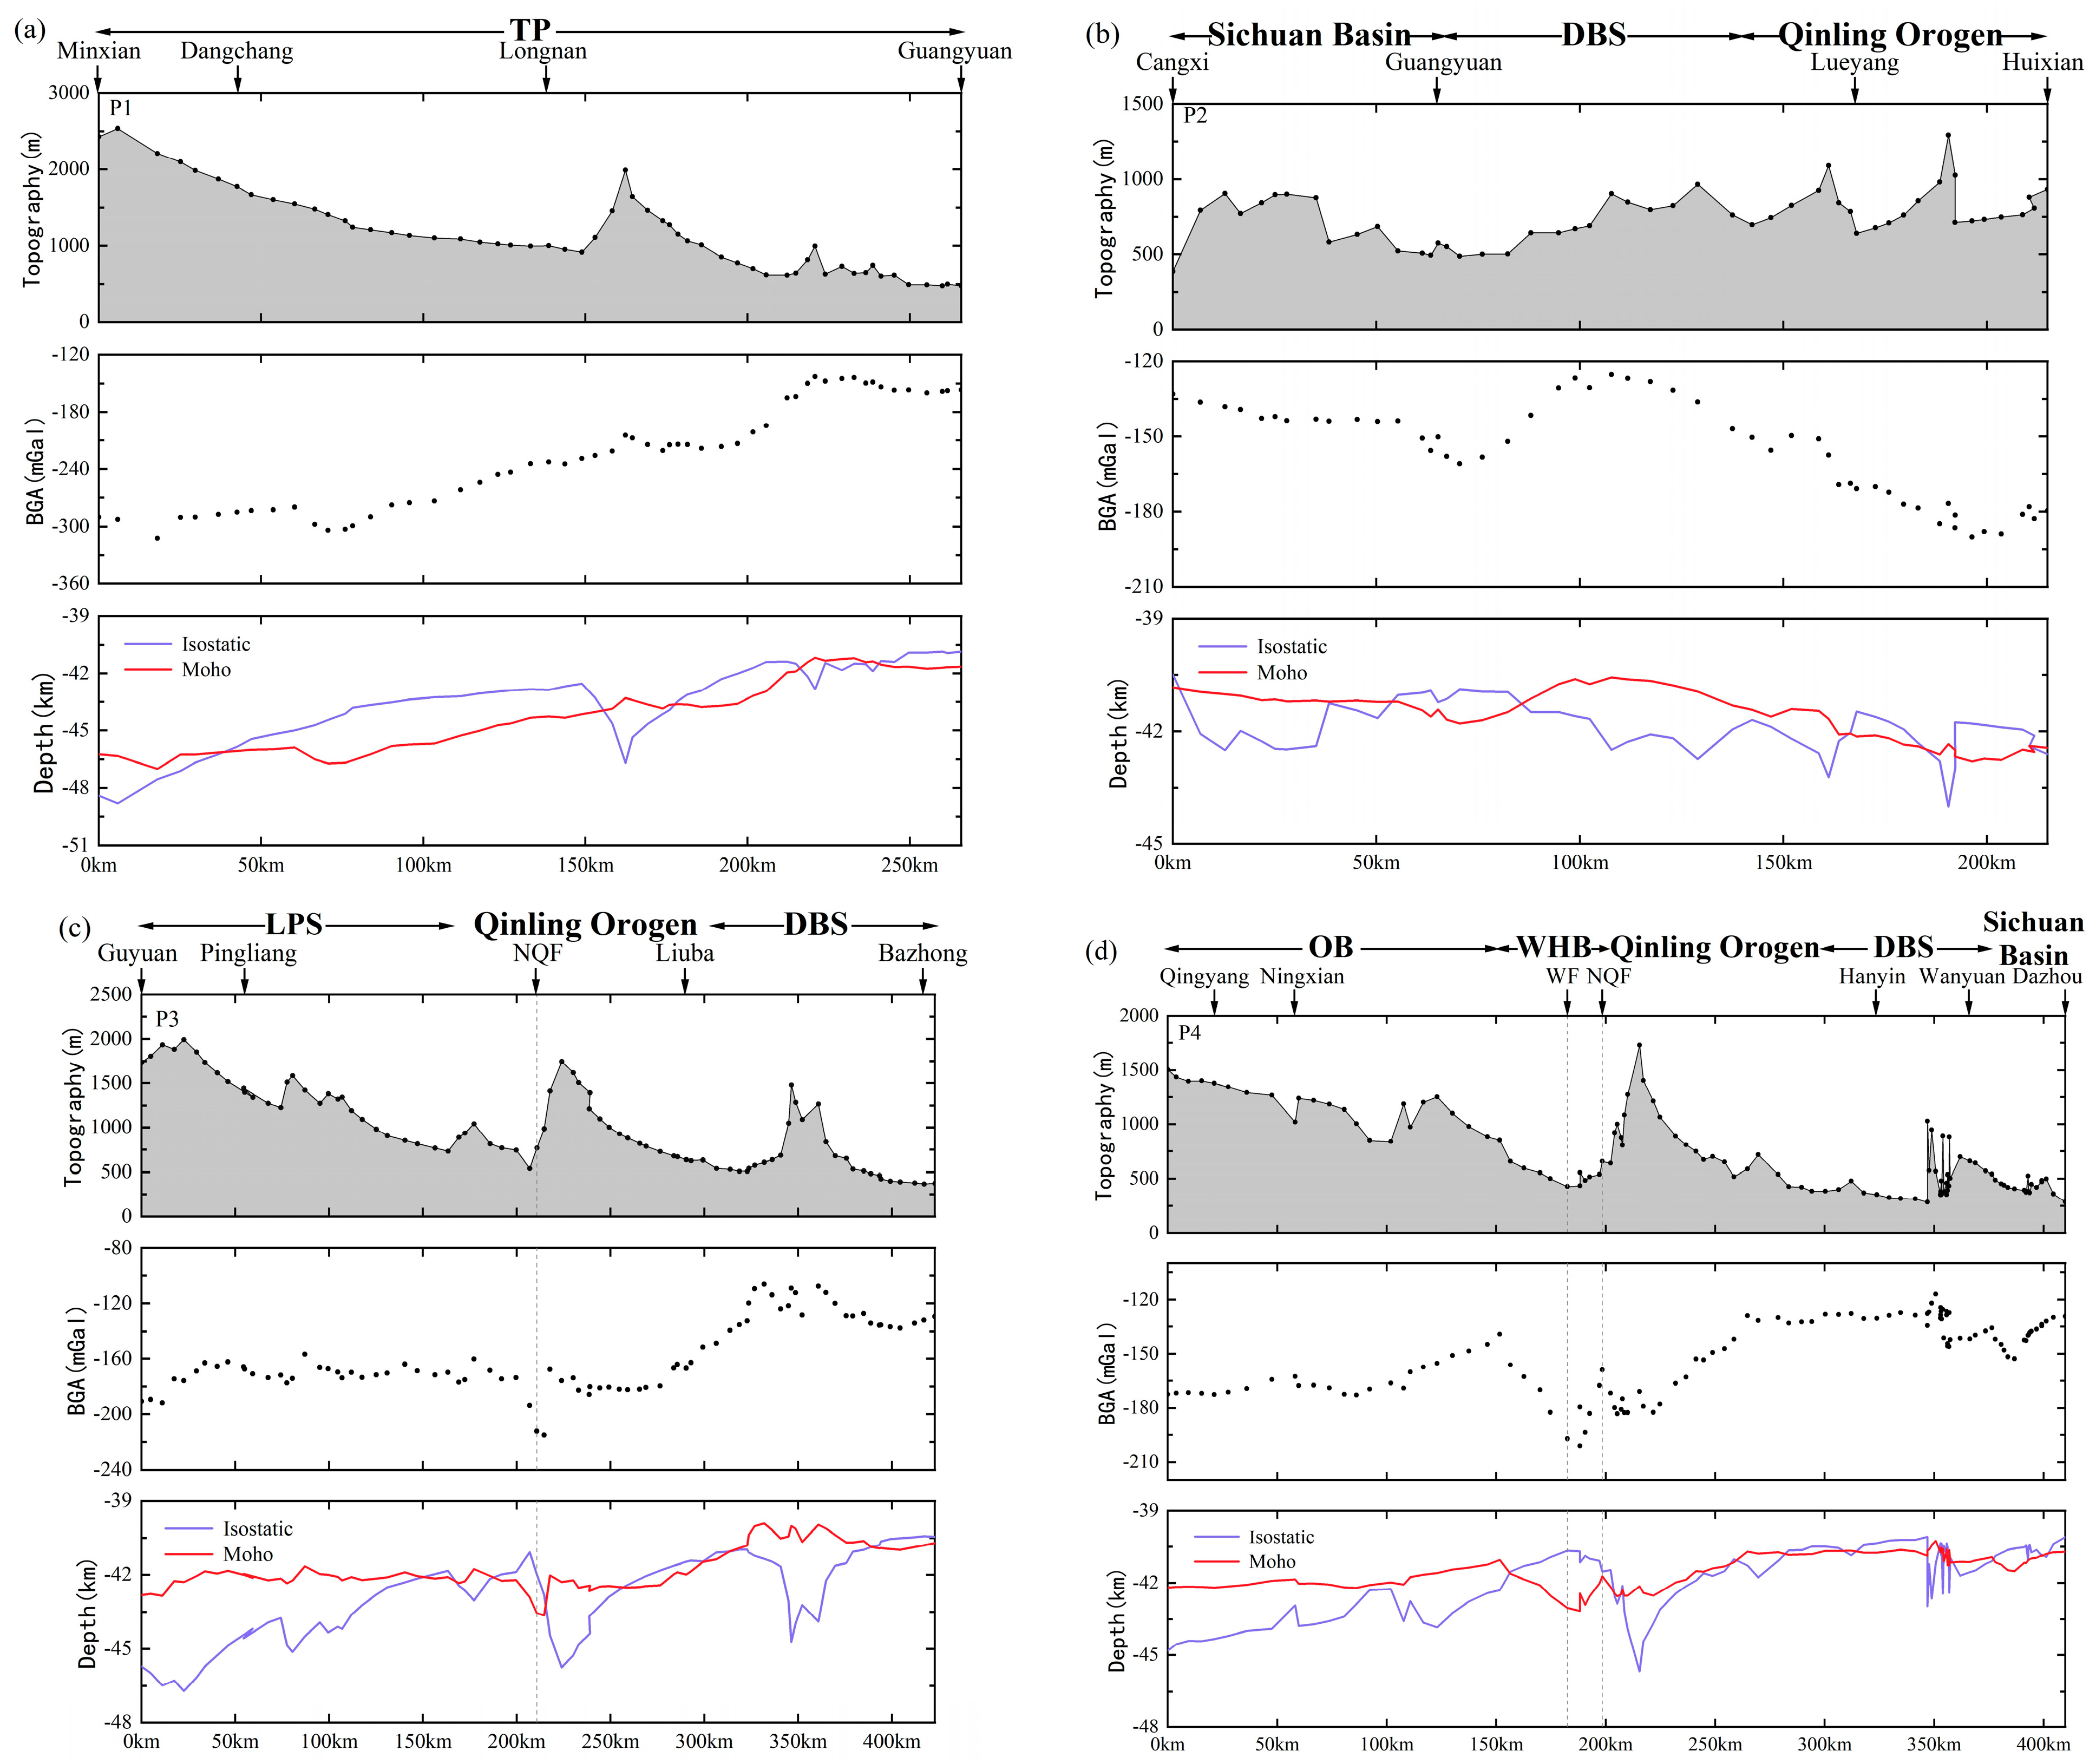
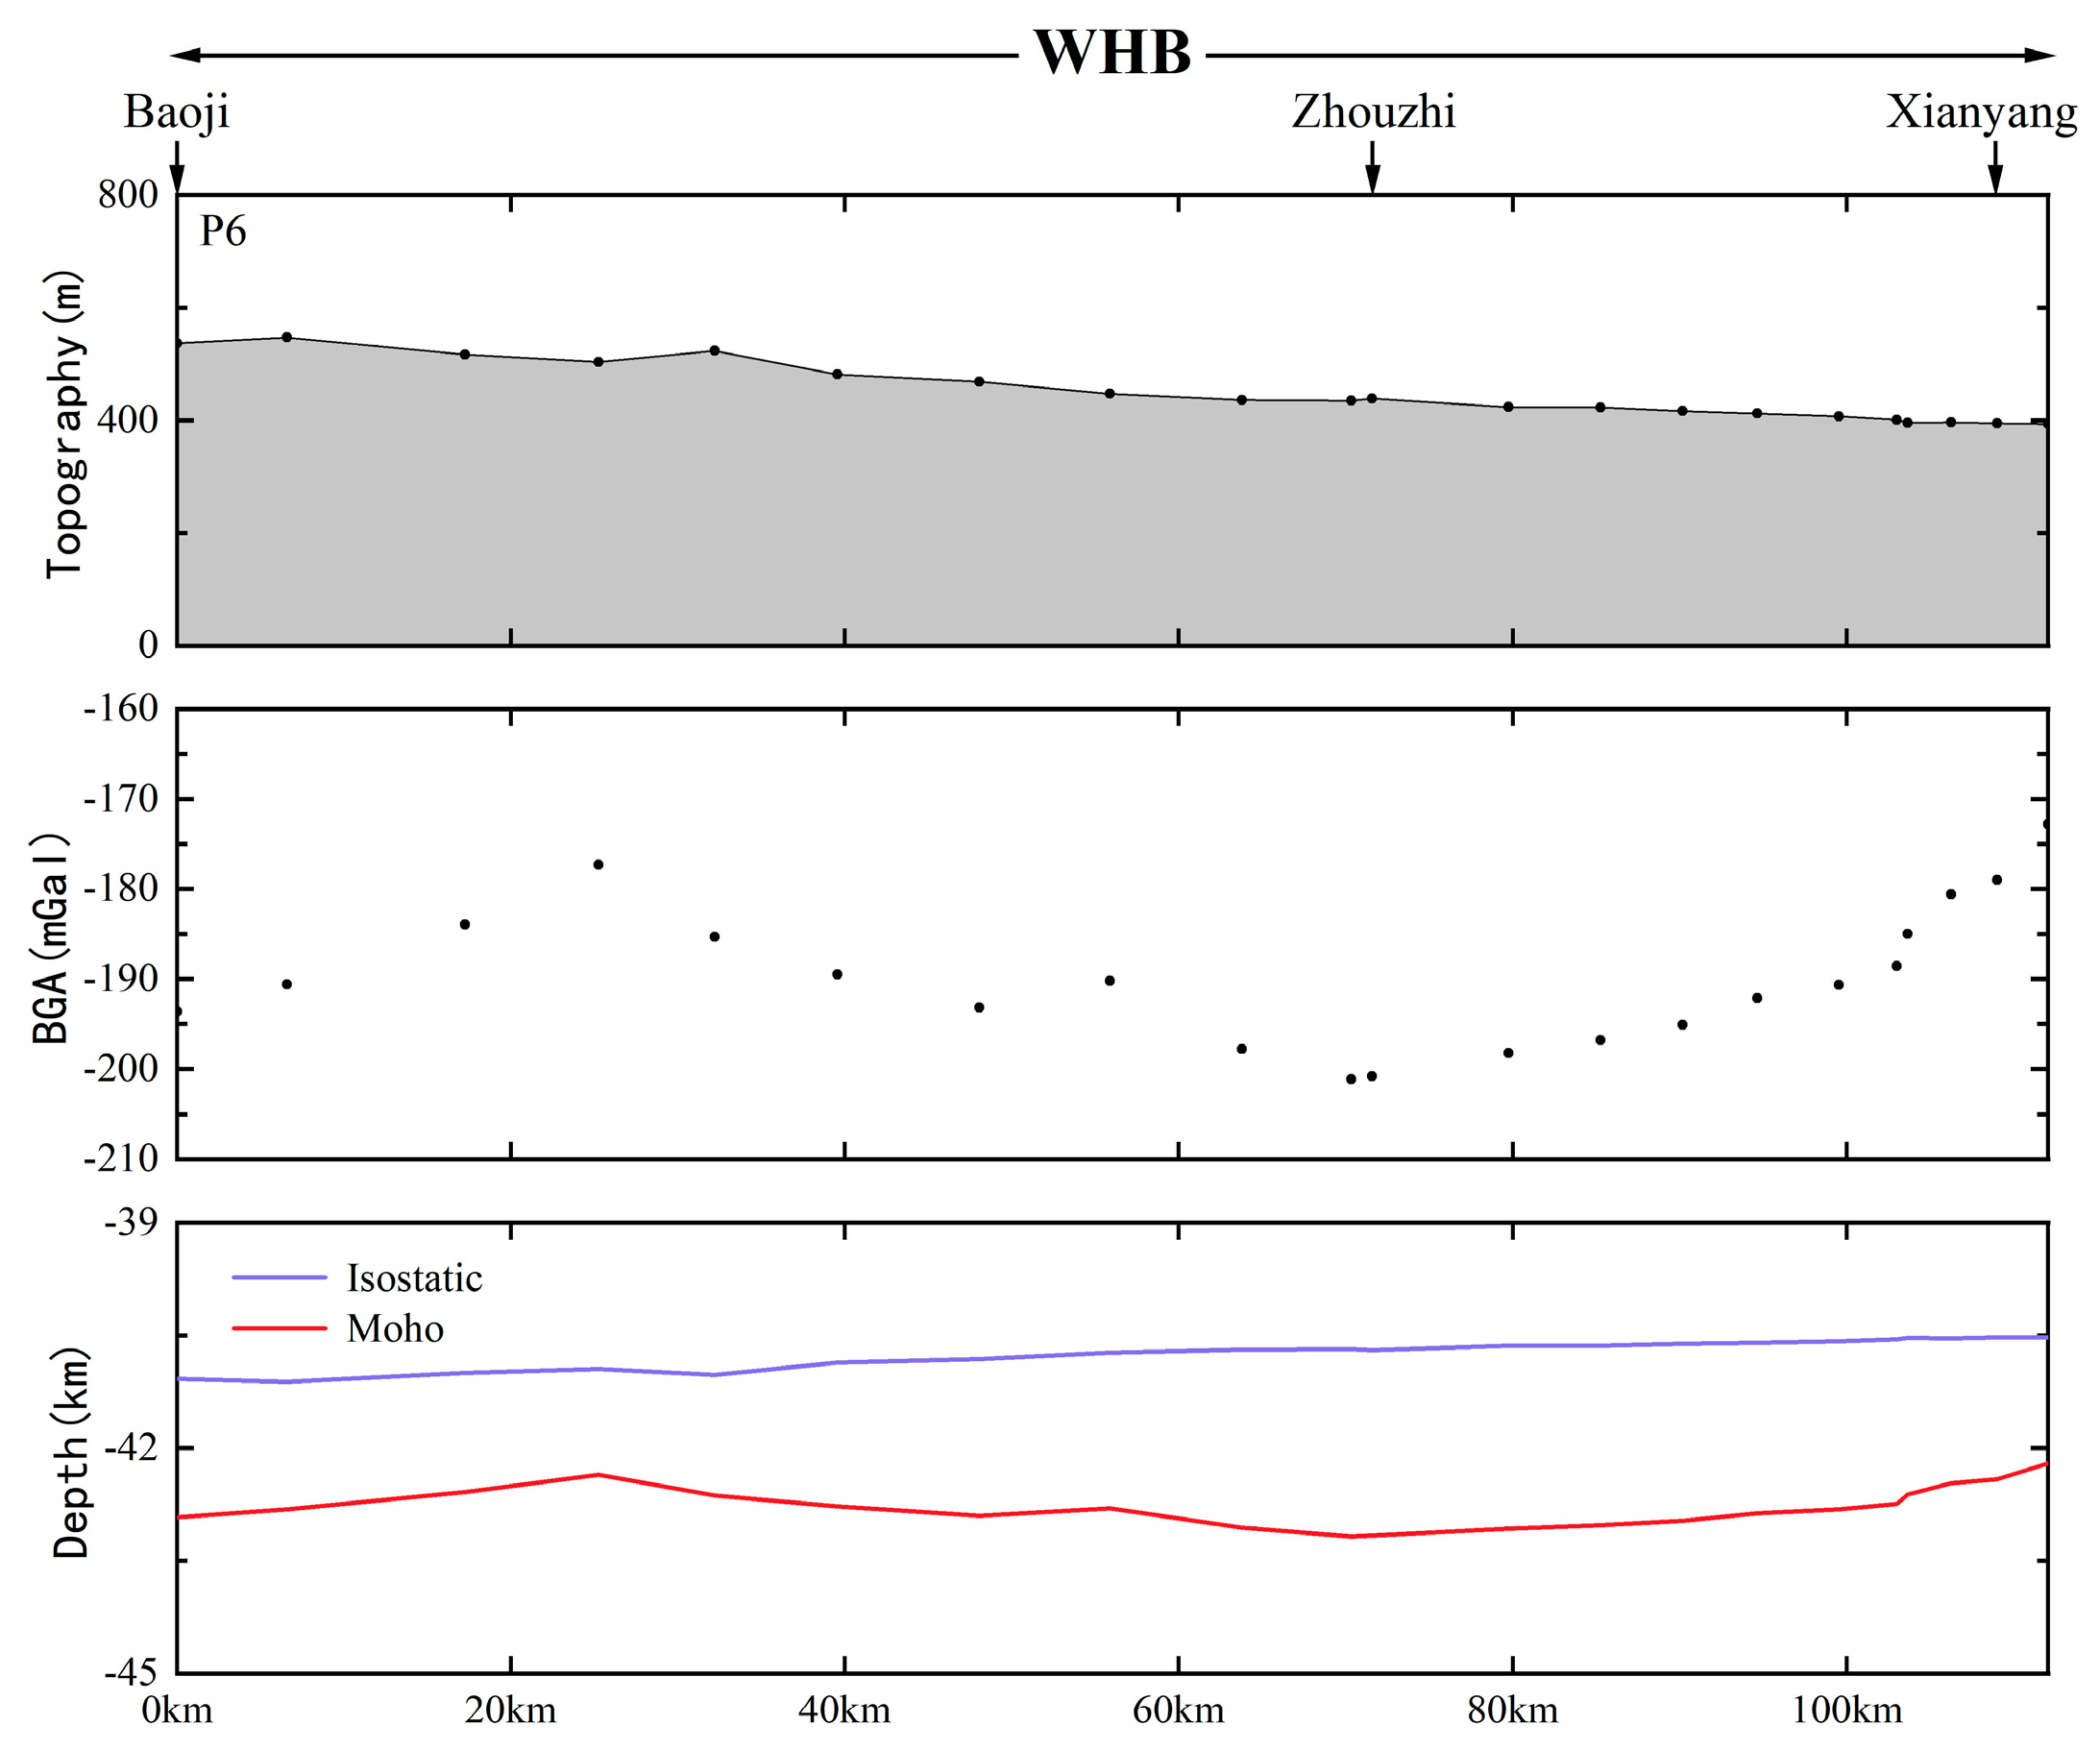
The Moho depth ranges between 39 km and 48 km in the study area, and the distribution is increasing steadily from southeast to northwest. The trend is negatively related to the variation in the Bouguer gravity anomaly. The average Moho depth of 409 observation stations is 41.896 km.
(2)
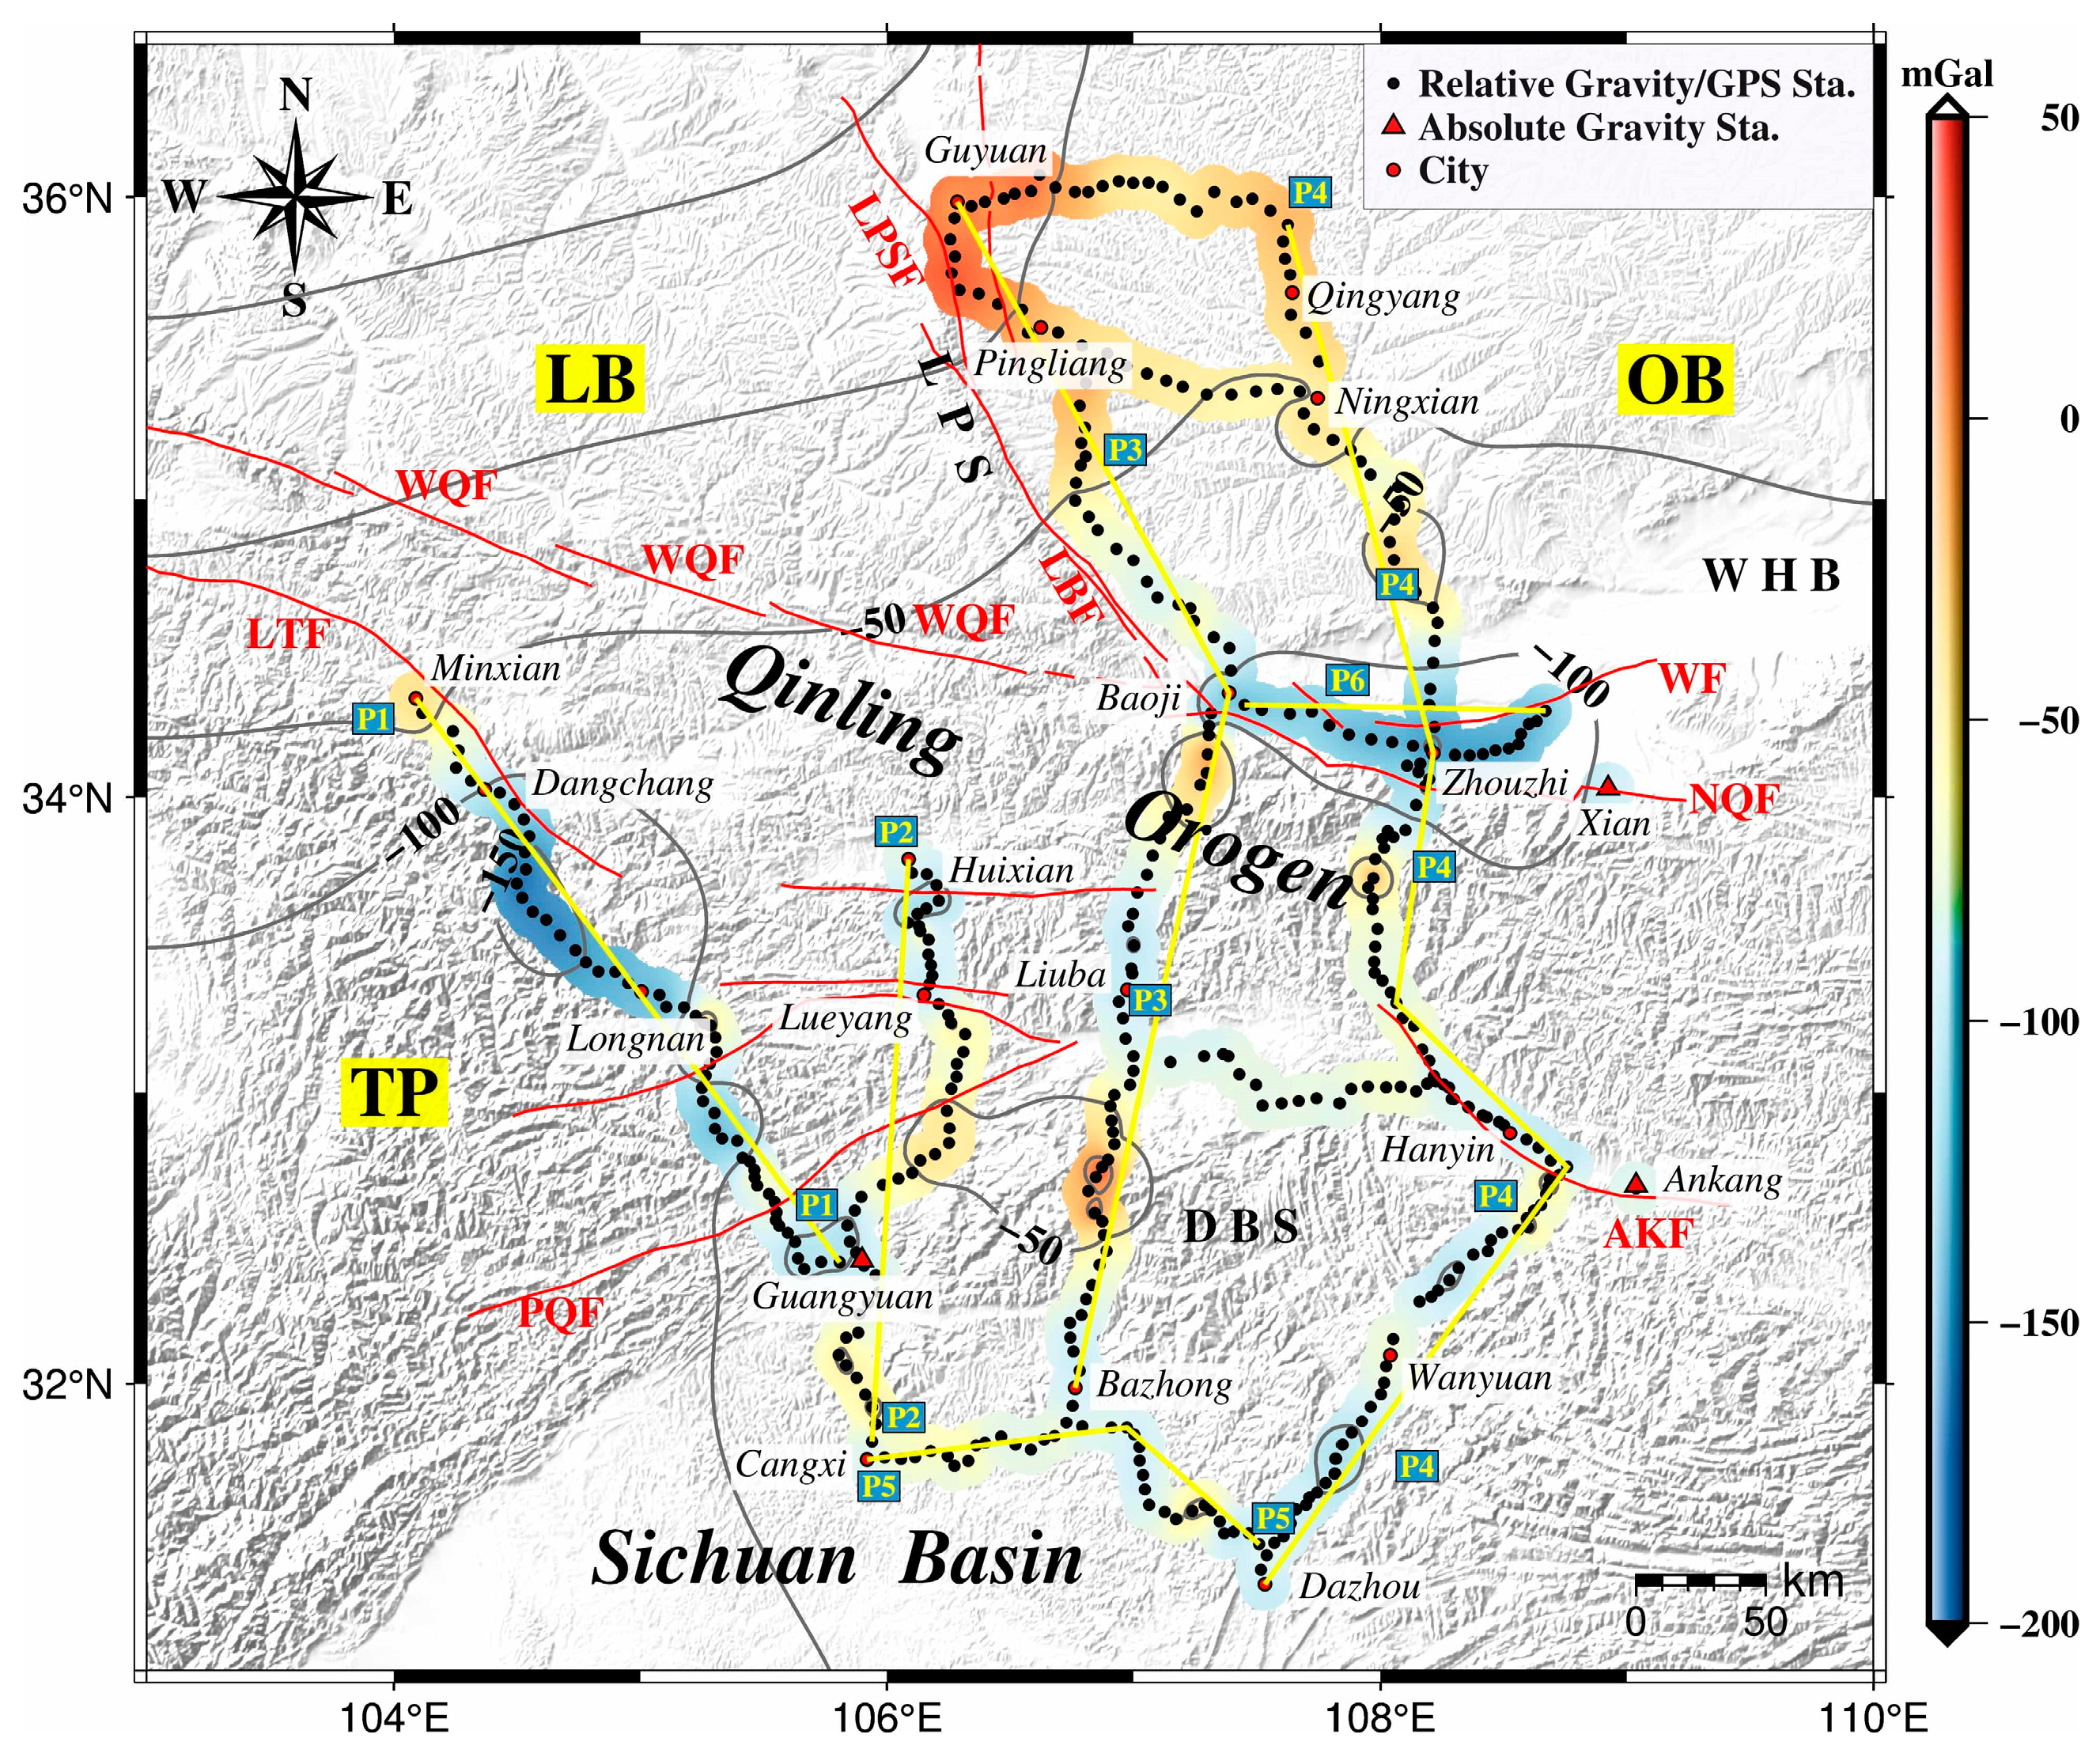
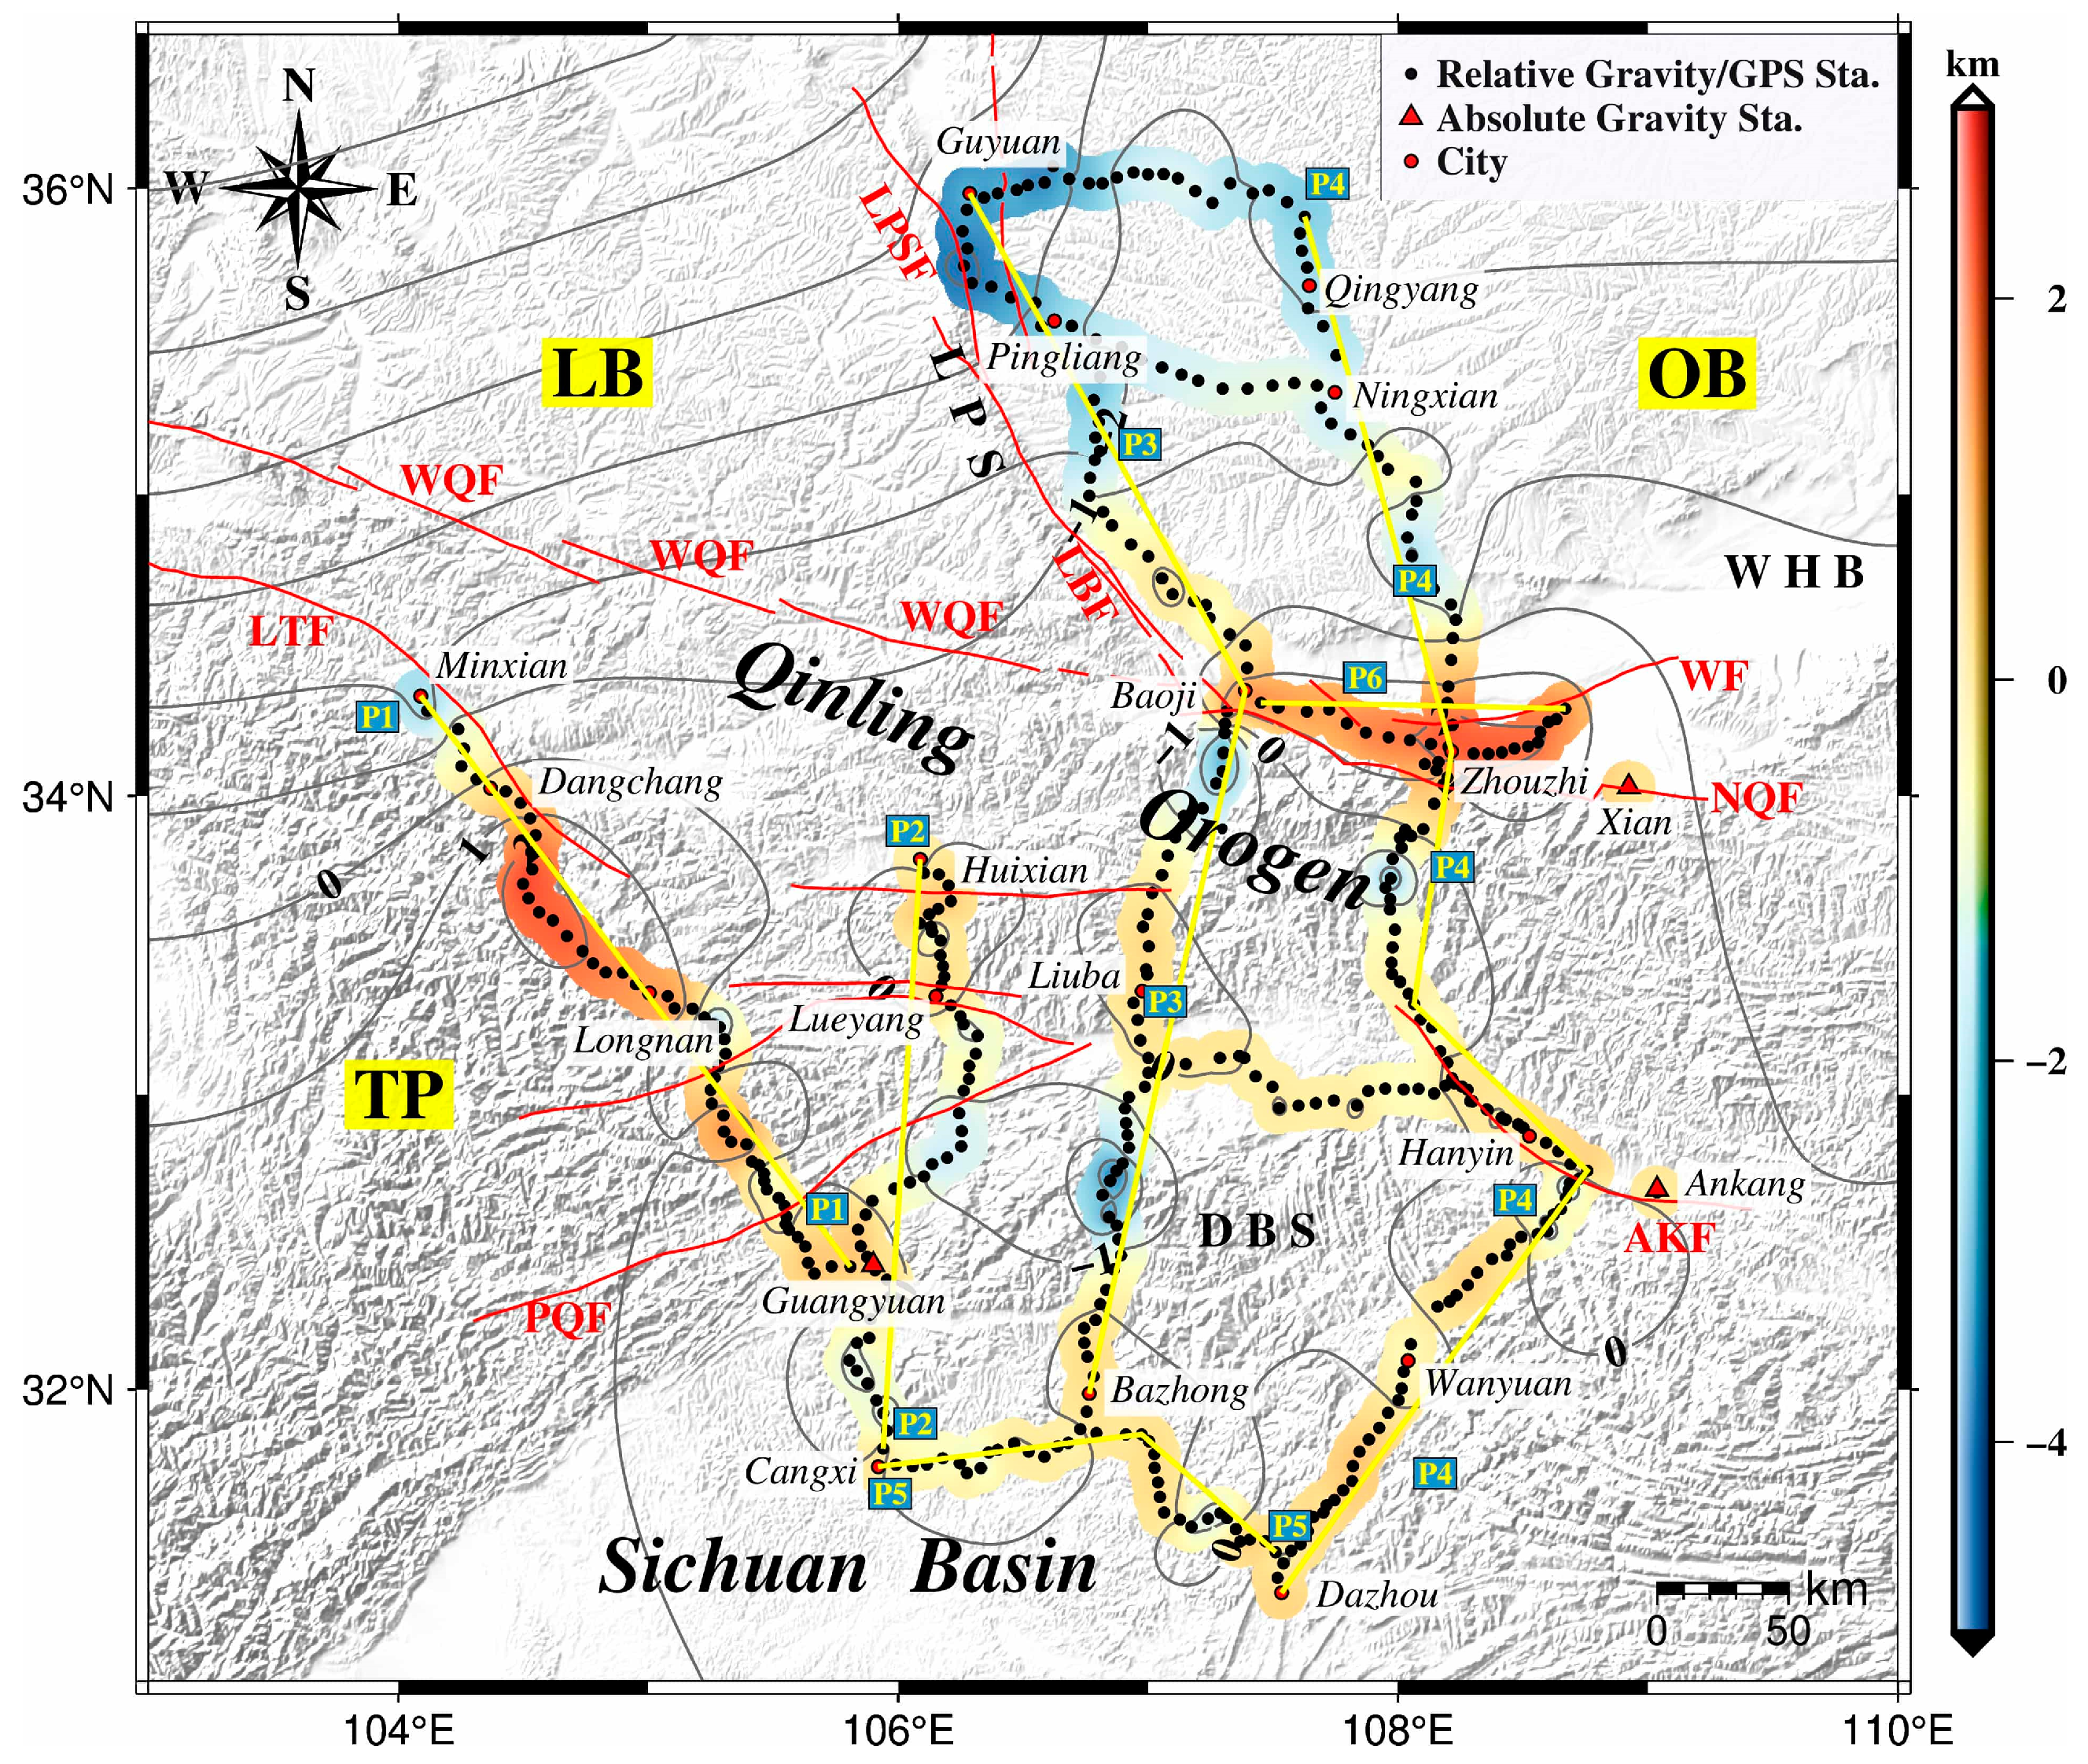
Using Airy isostatic theory and topography data, the isostatic depth and the isostatic anomaly are obtained. The crust of most of the study area is in an isostatic state. The positive isostatic anomaly is mainly concentrated in the Weihe Basin and Longnan to Dangchang area; whereas, the negative isostatic anomaly in local areas of the Liuanshan Mountain, the southwestern edge of the Ordos Basin, the Qinling Orogen, and Dabashan indicate the existence of crustal activity.
(3)
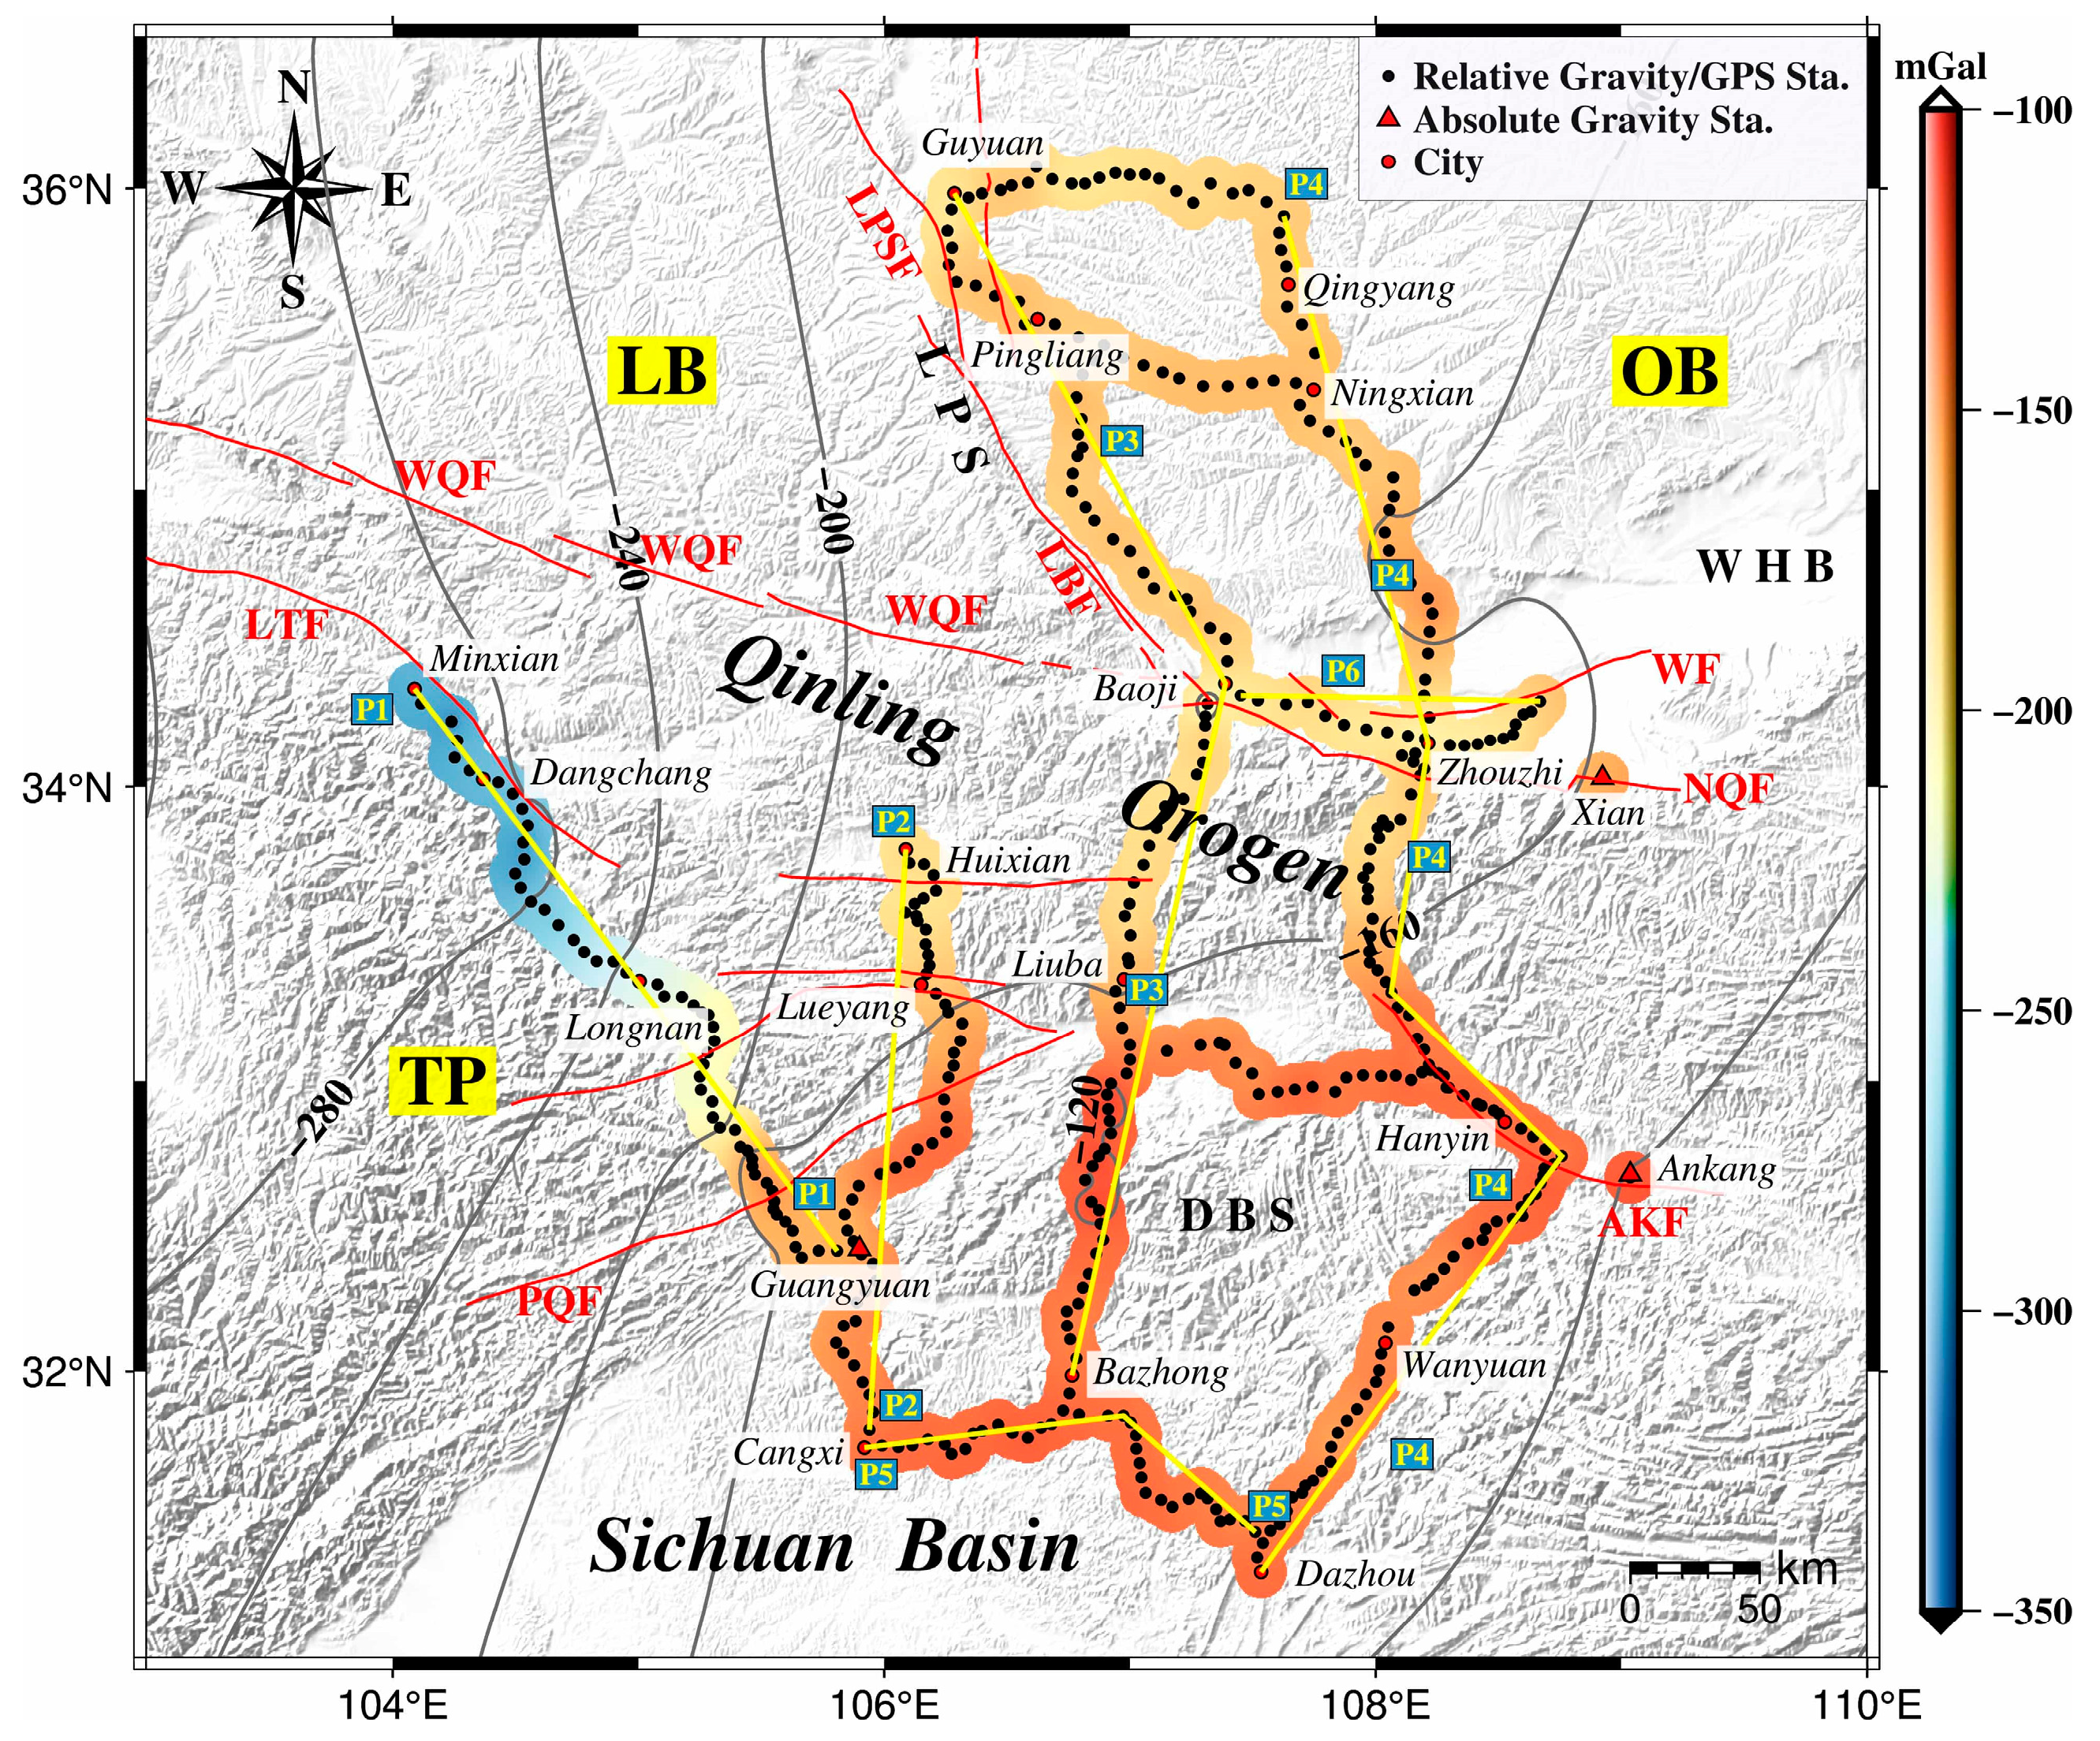
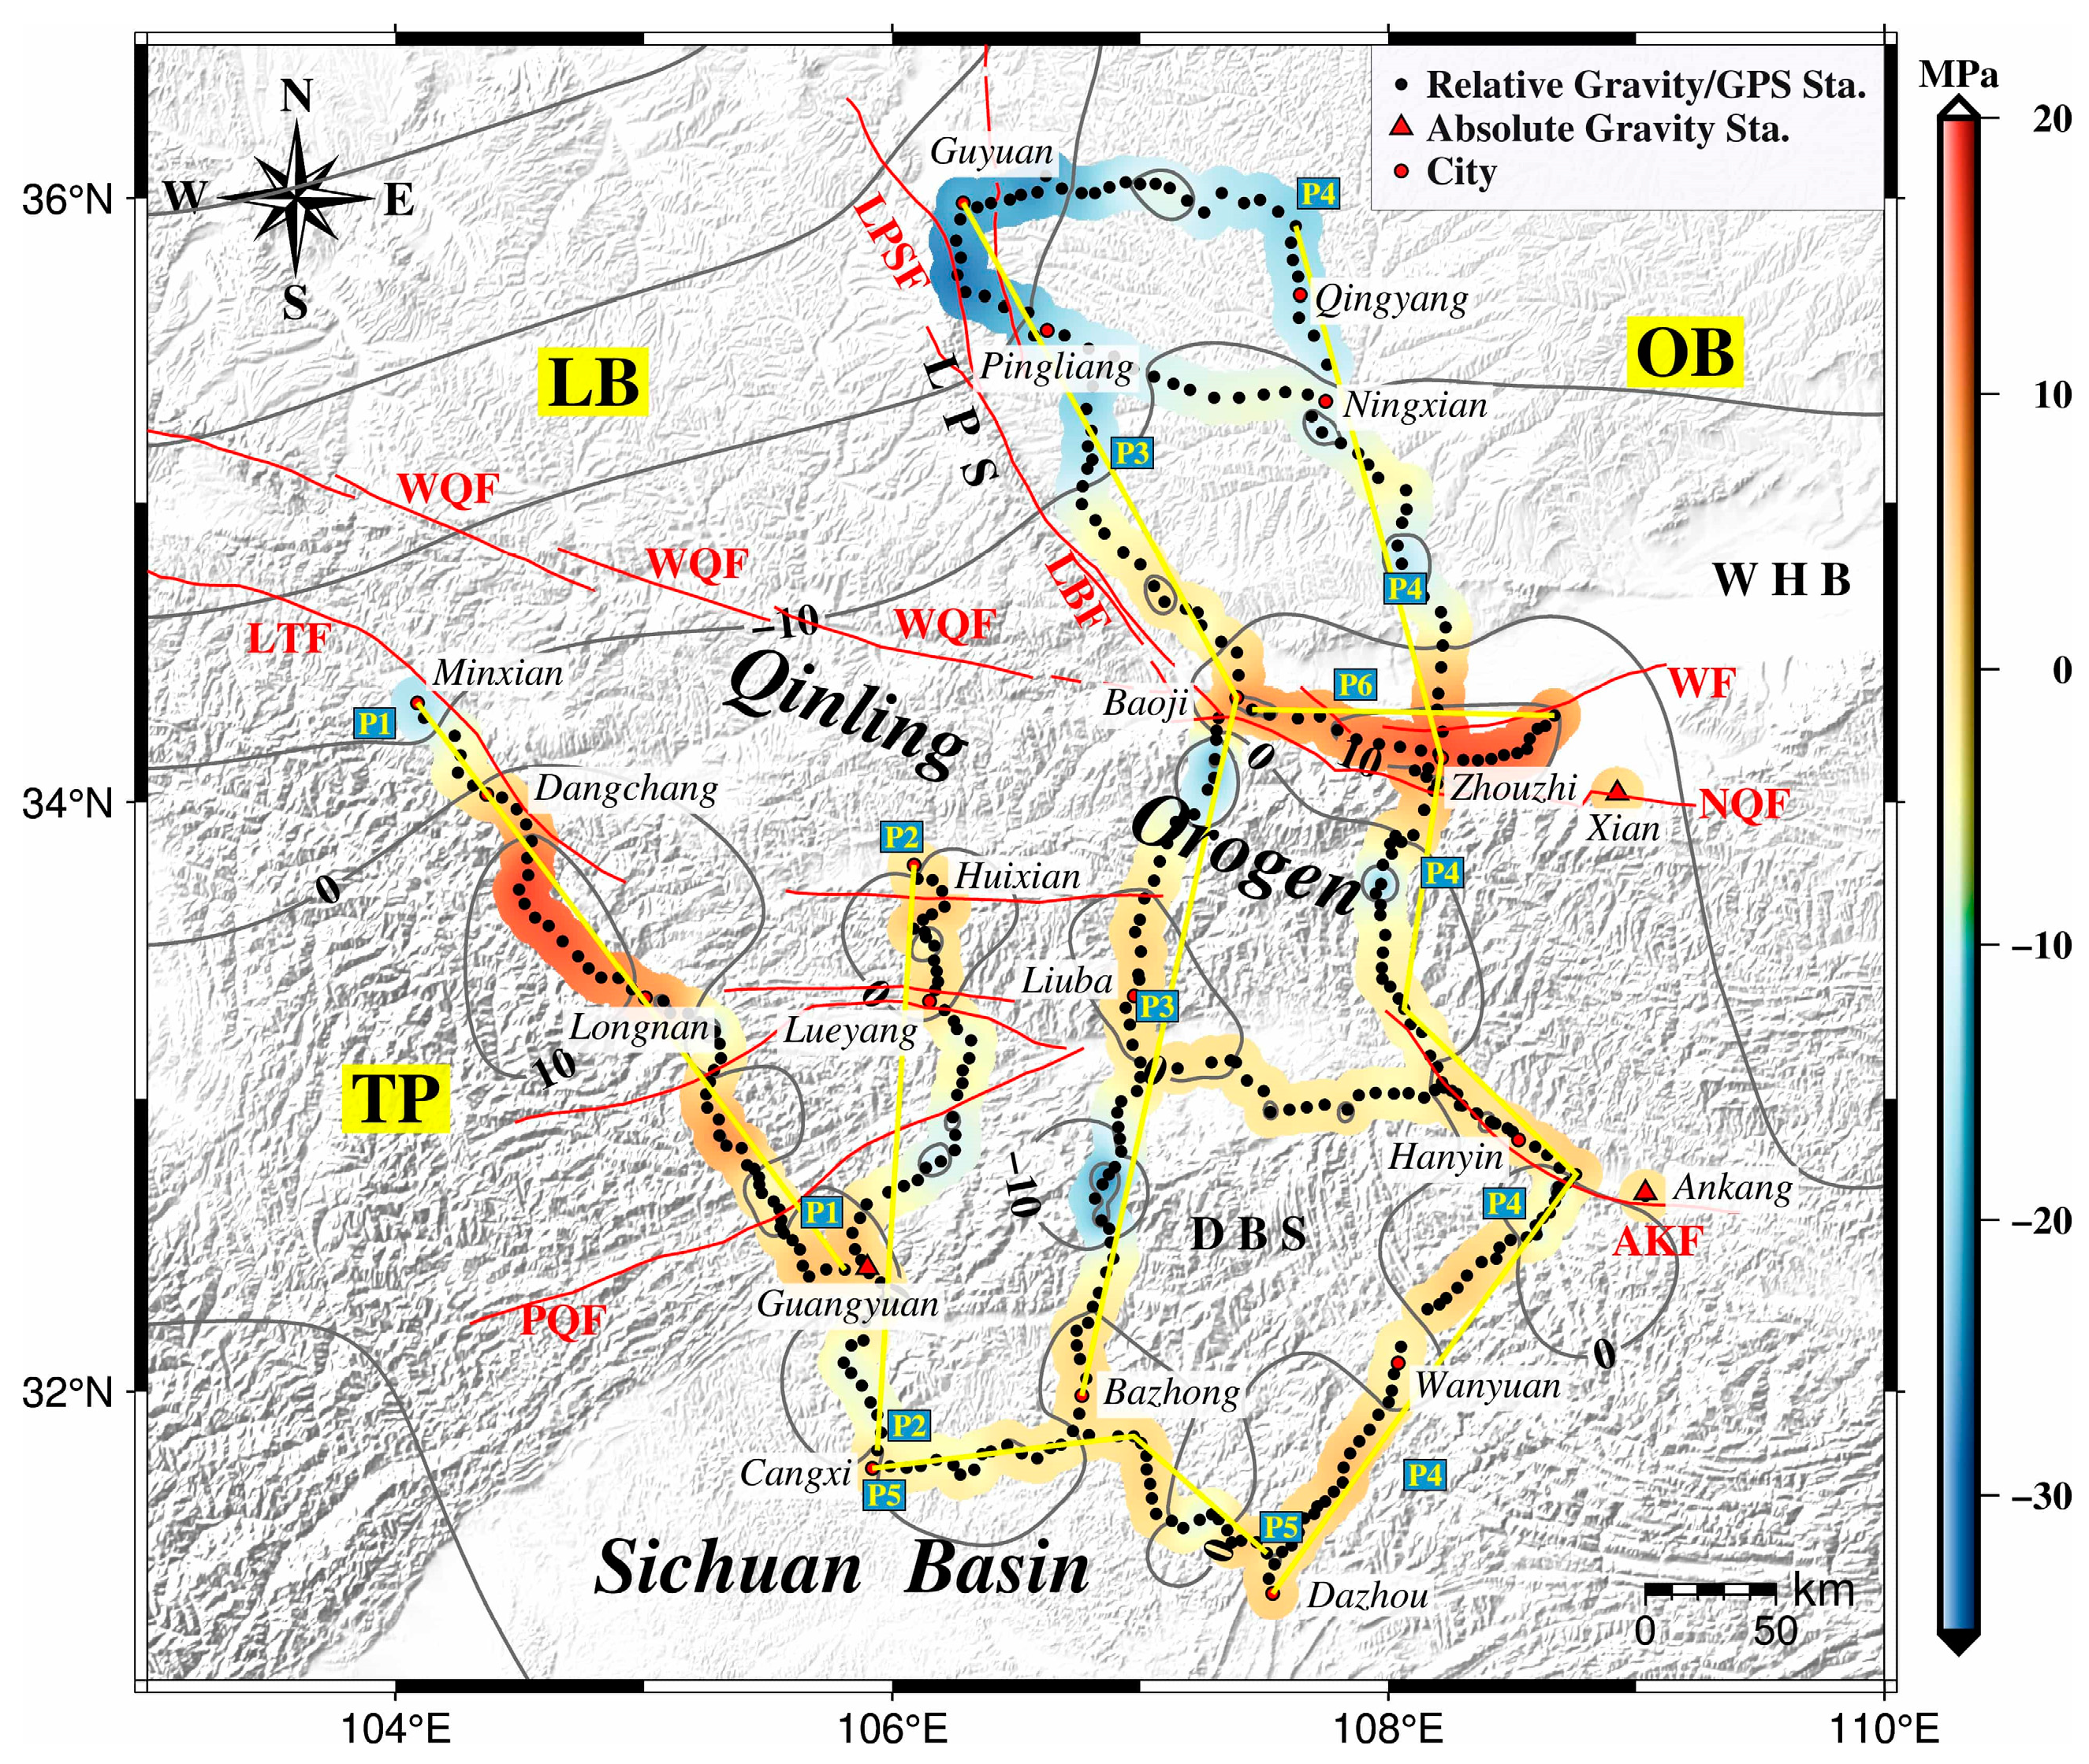
The upward isostatic additional force reaches about 20 MPa in the Weihe Basin, and the isostatic additional force gradient varies dramatically on both sides of the North Qinling fault. The negative isostatic additional force appears in the Liupanshan Mountains, the southwest margin of the Ordos Basin, the local areas of Qinling Orogen, and Dabashan. In the northern Sichuan Basin, the isostatic additional force is almost zero MPa.
(4)
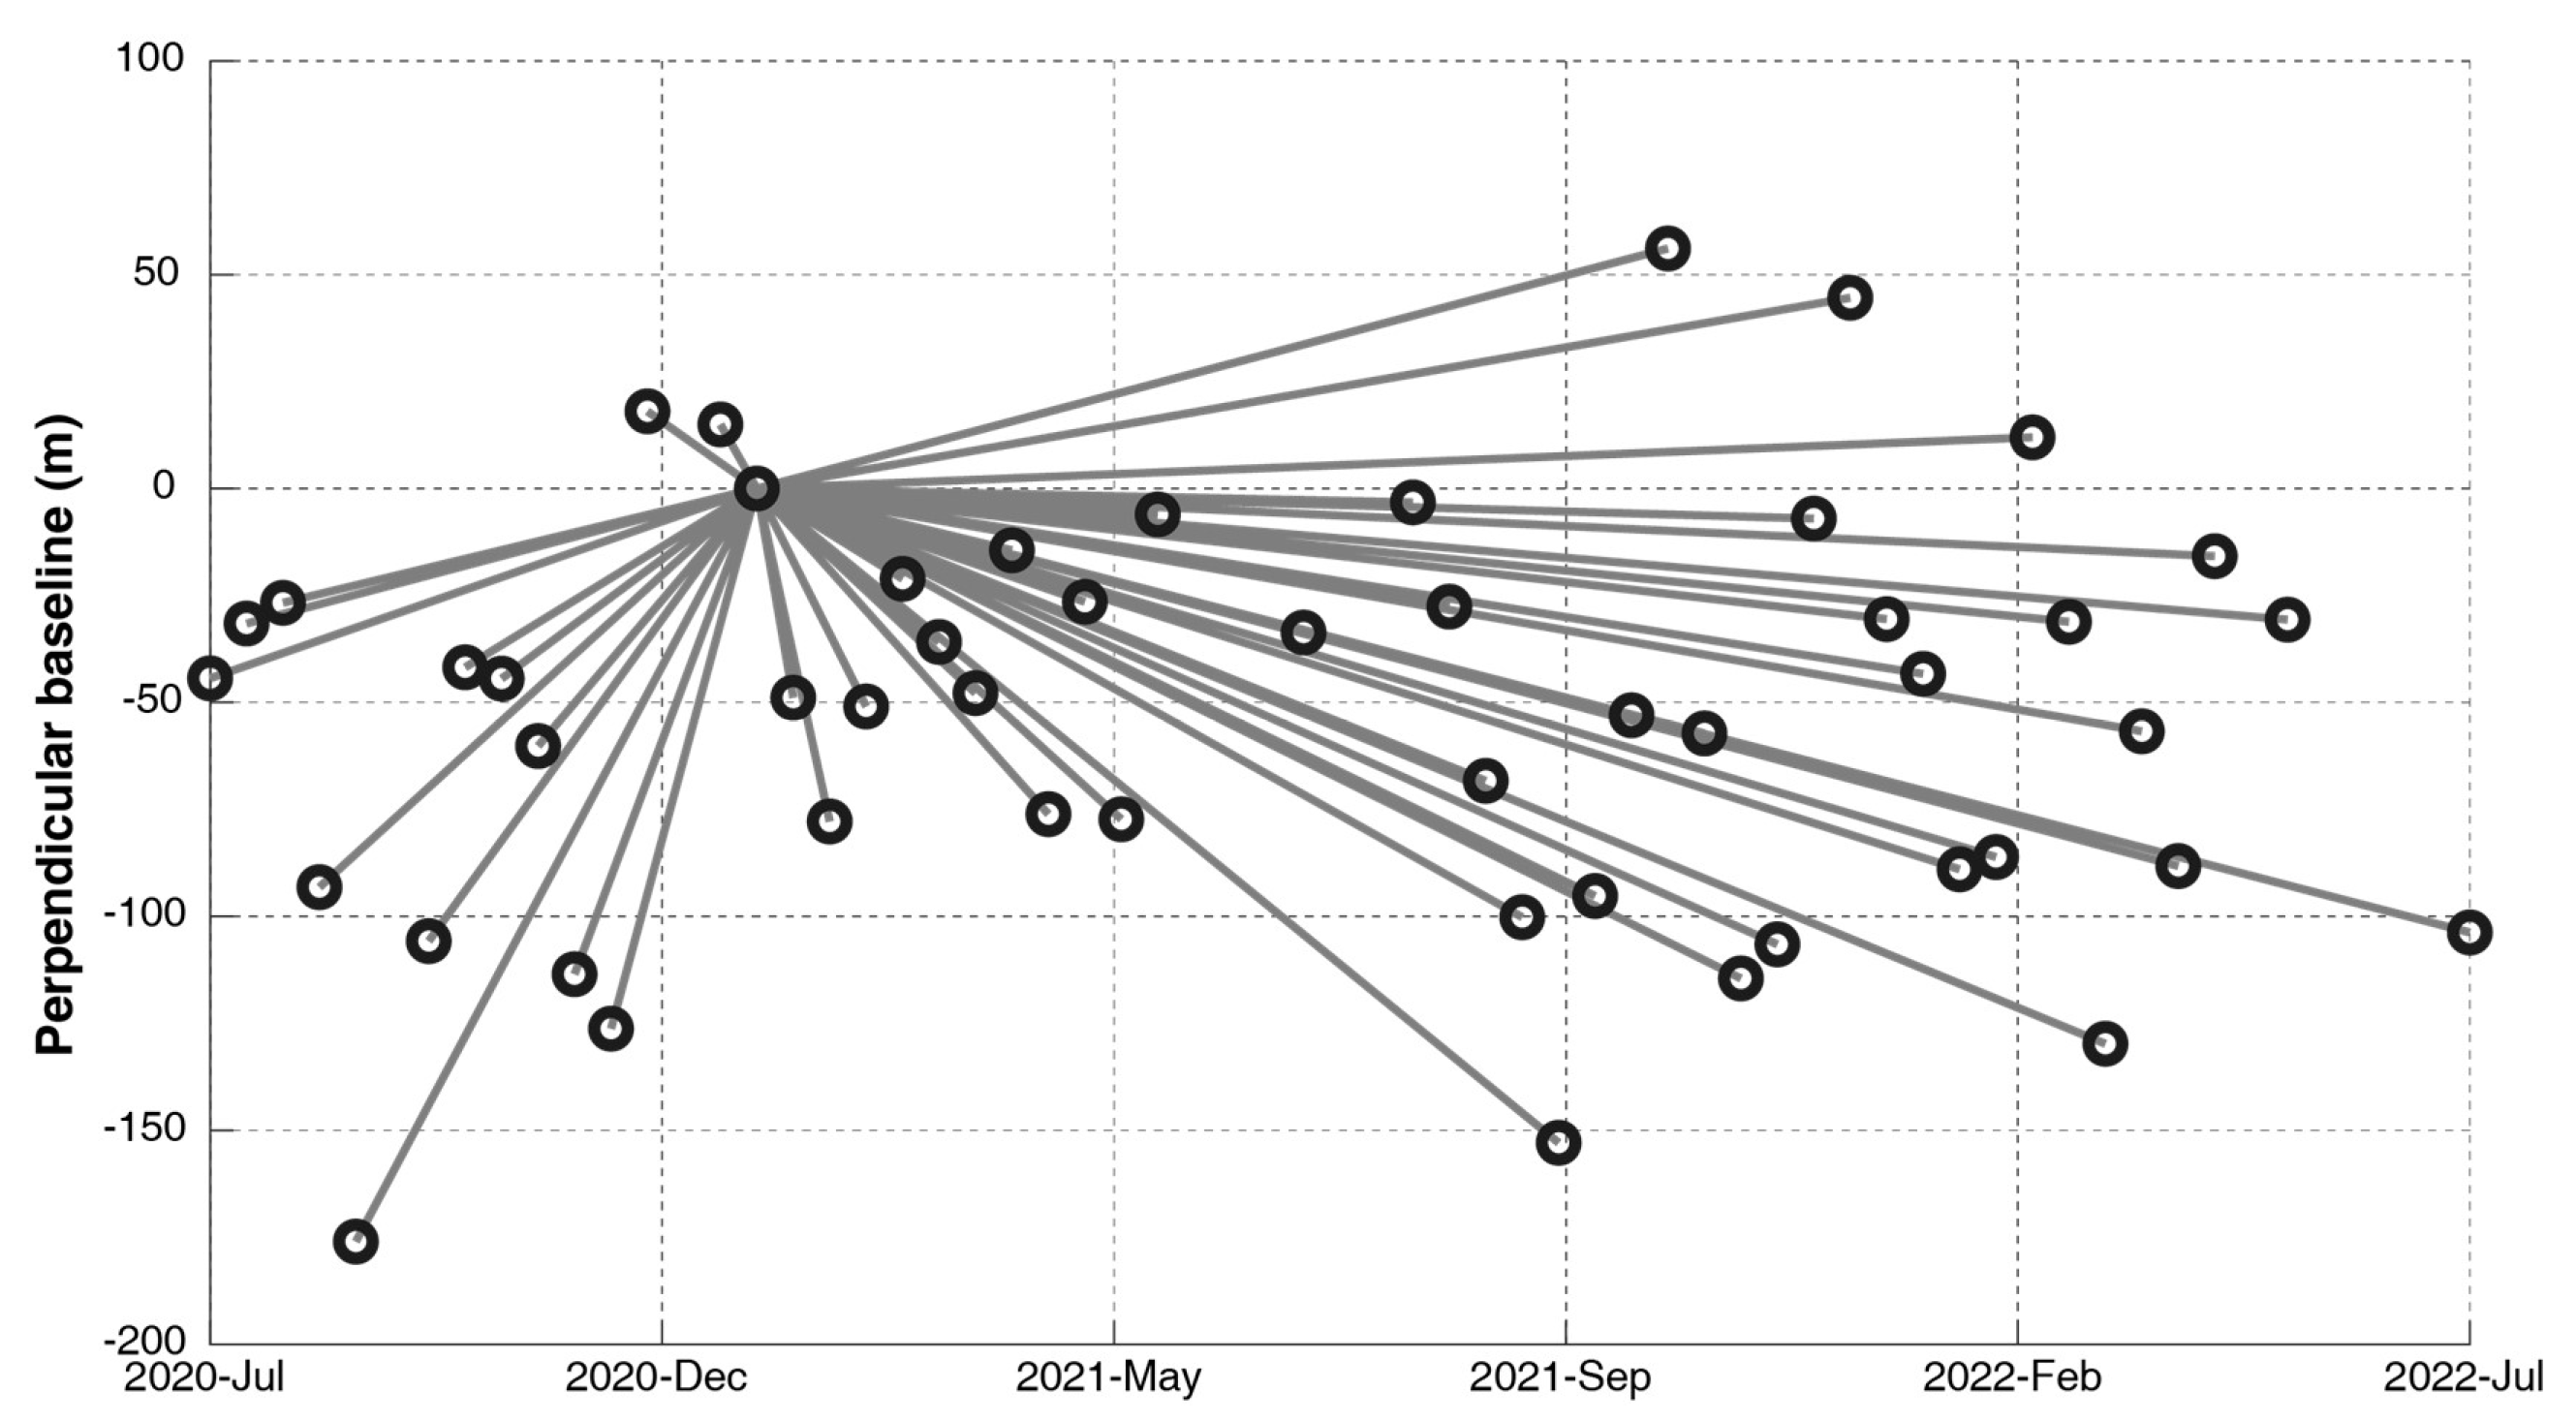
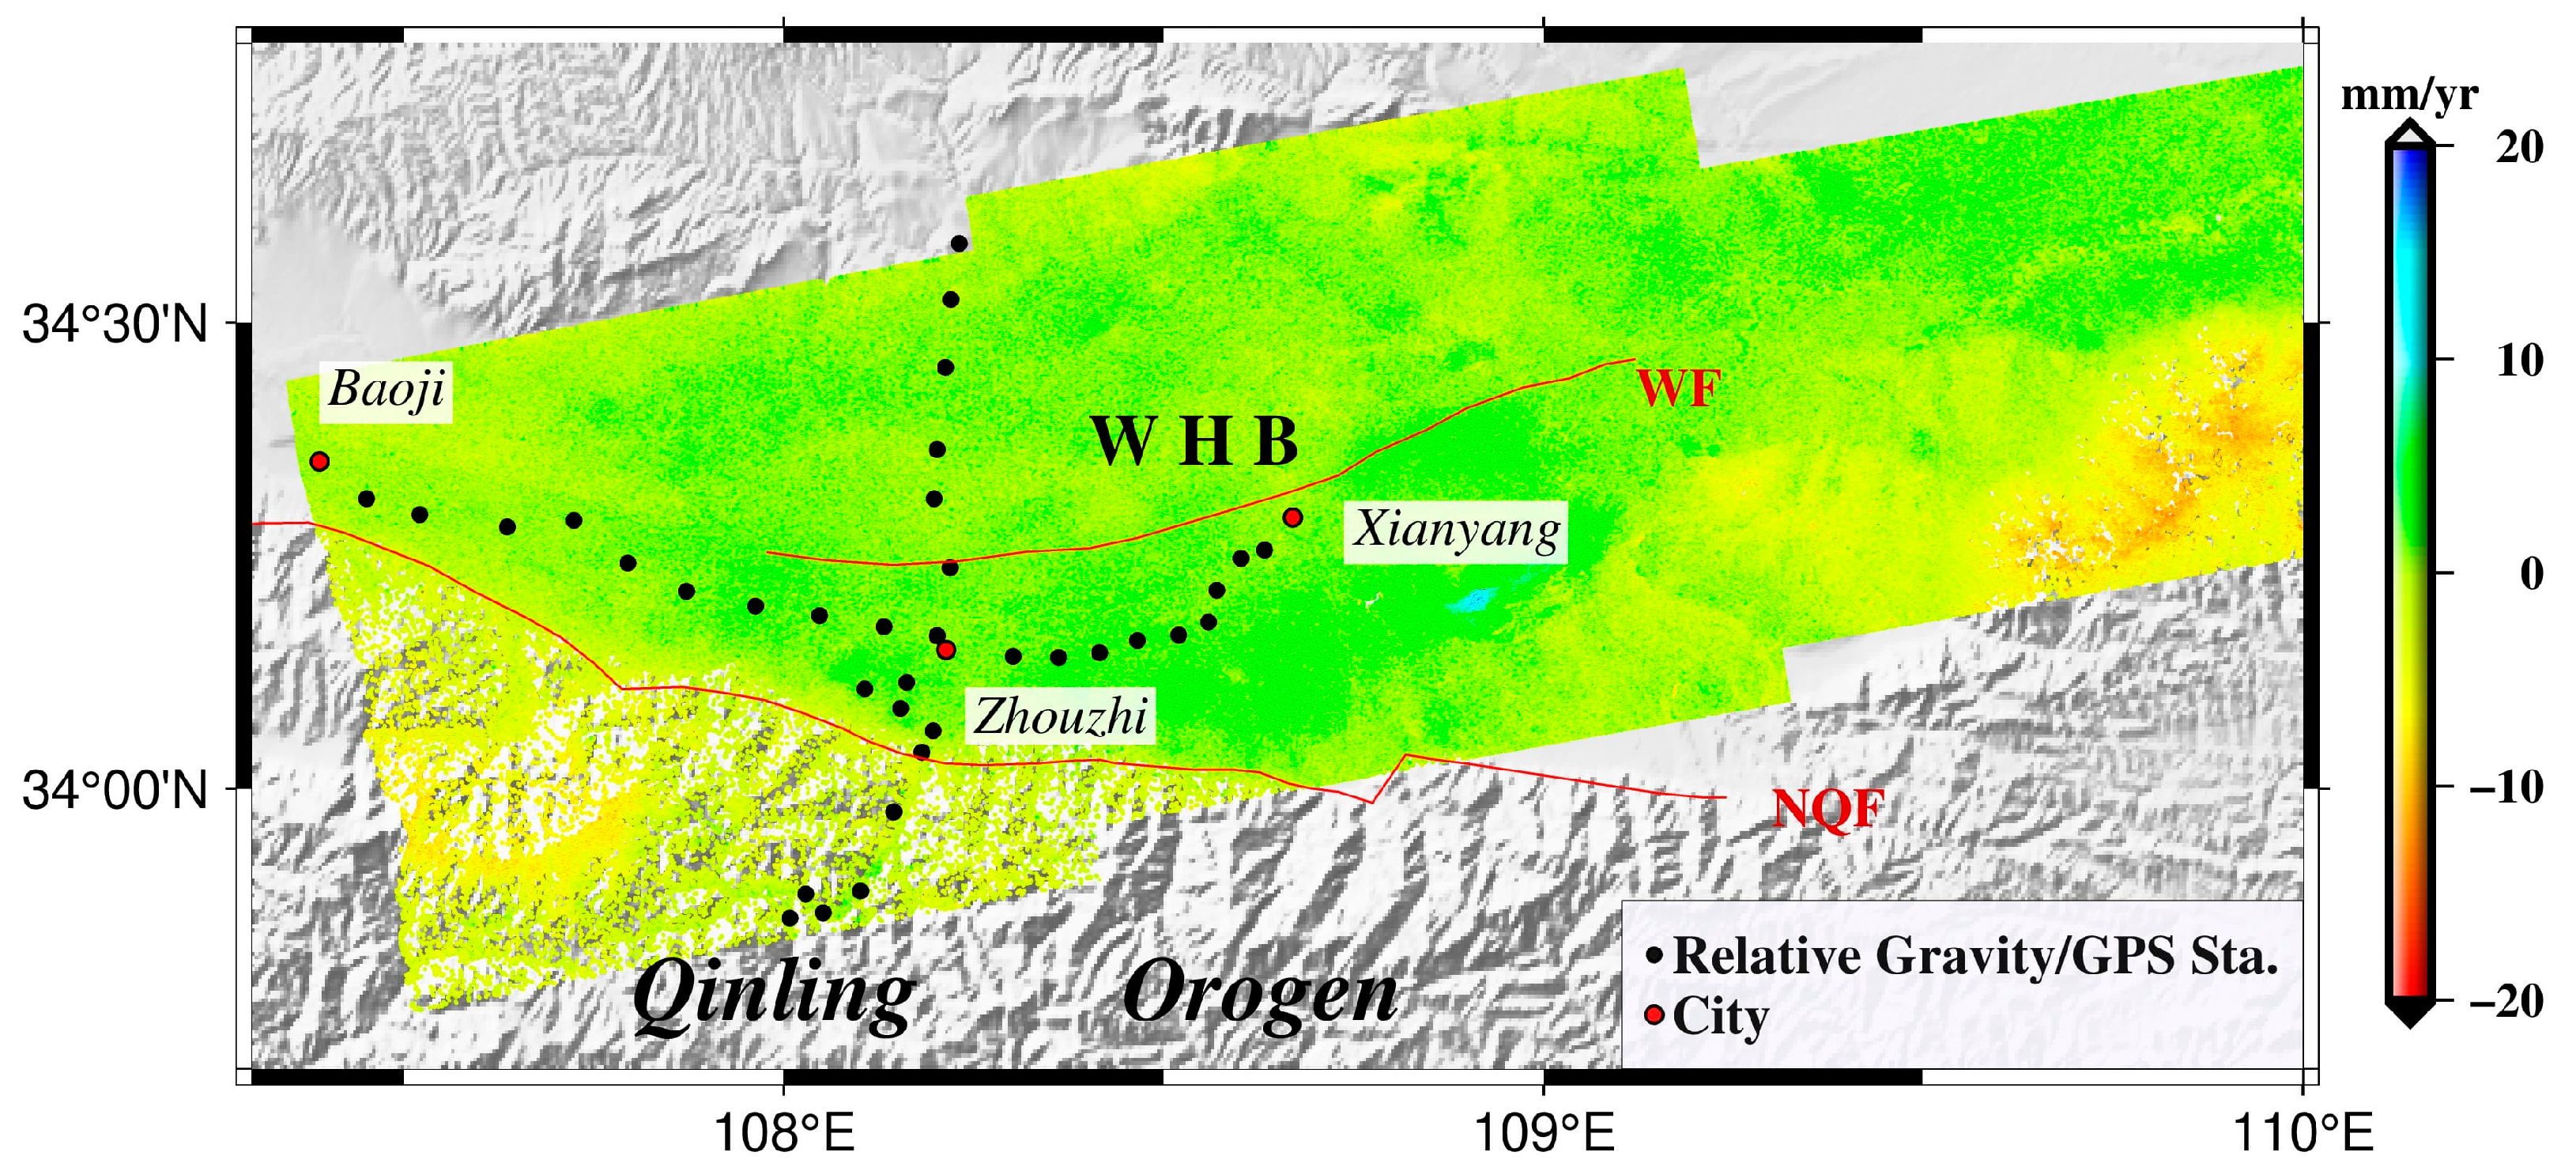
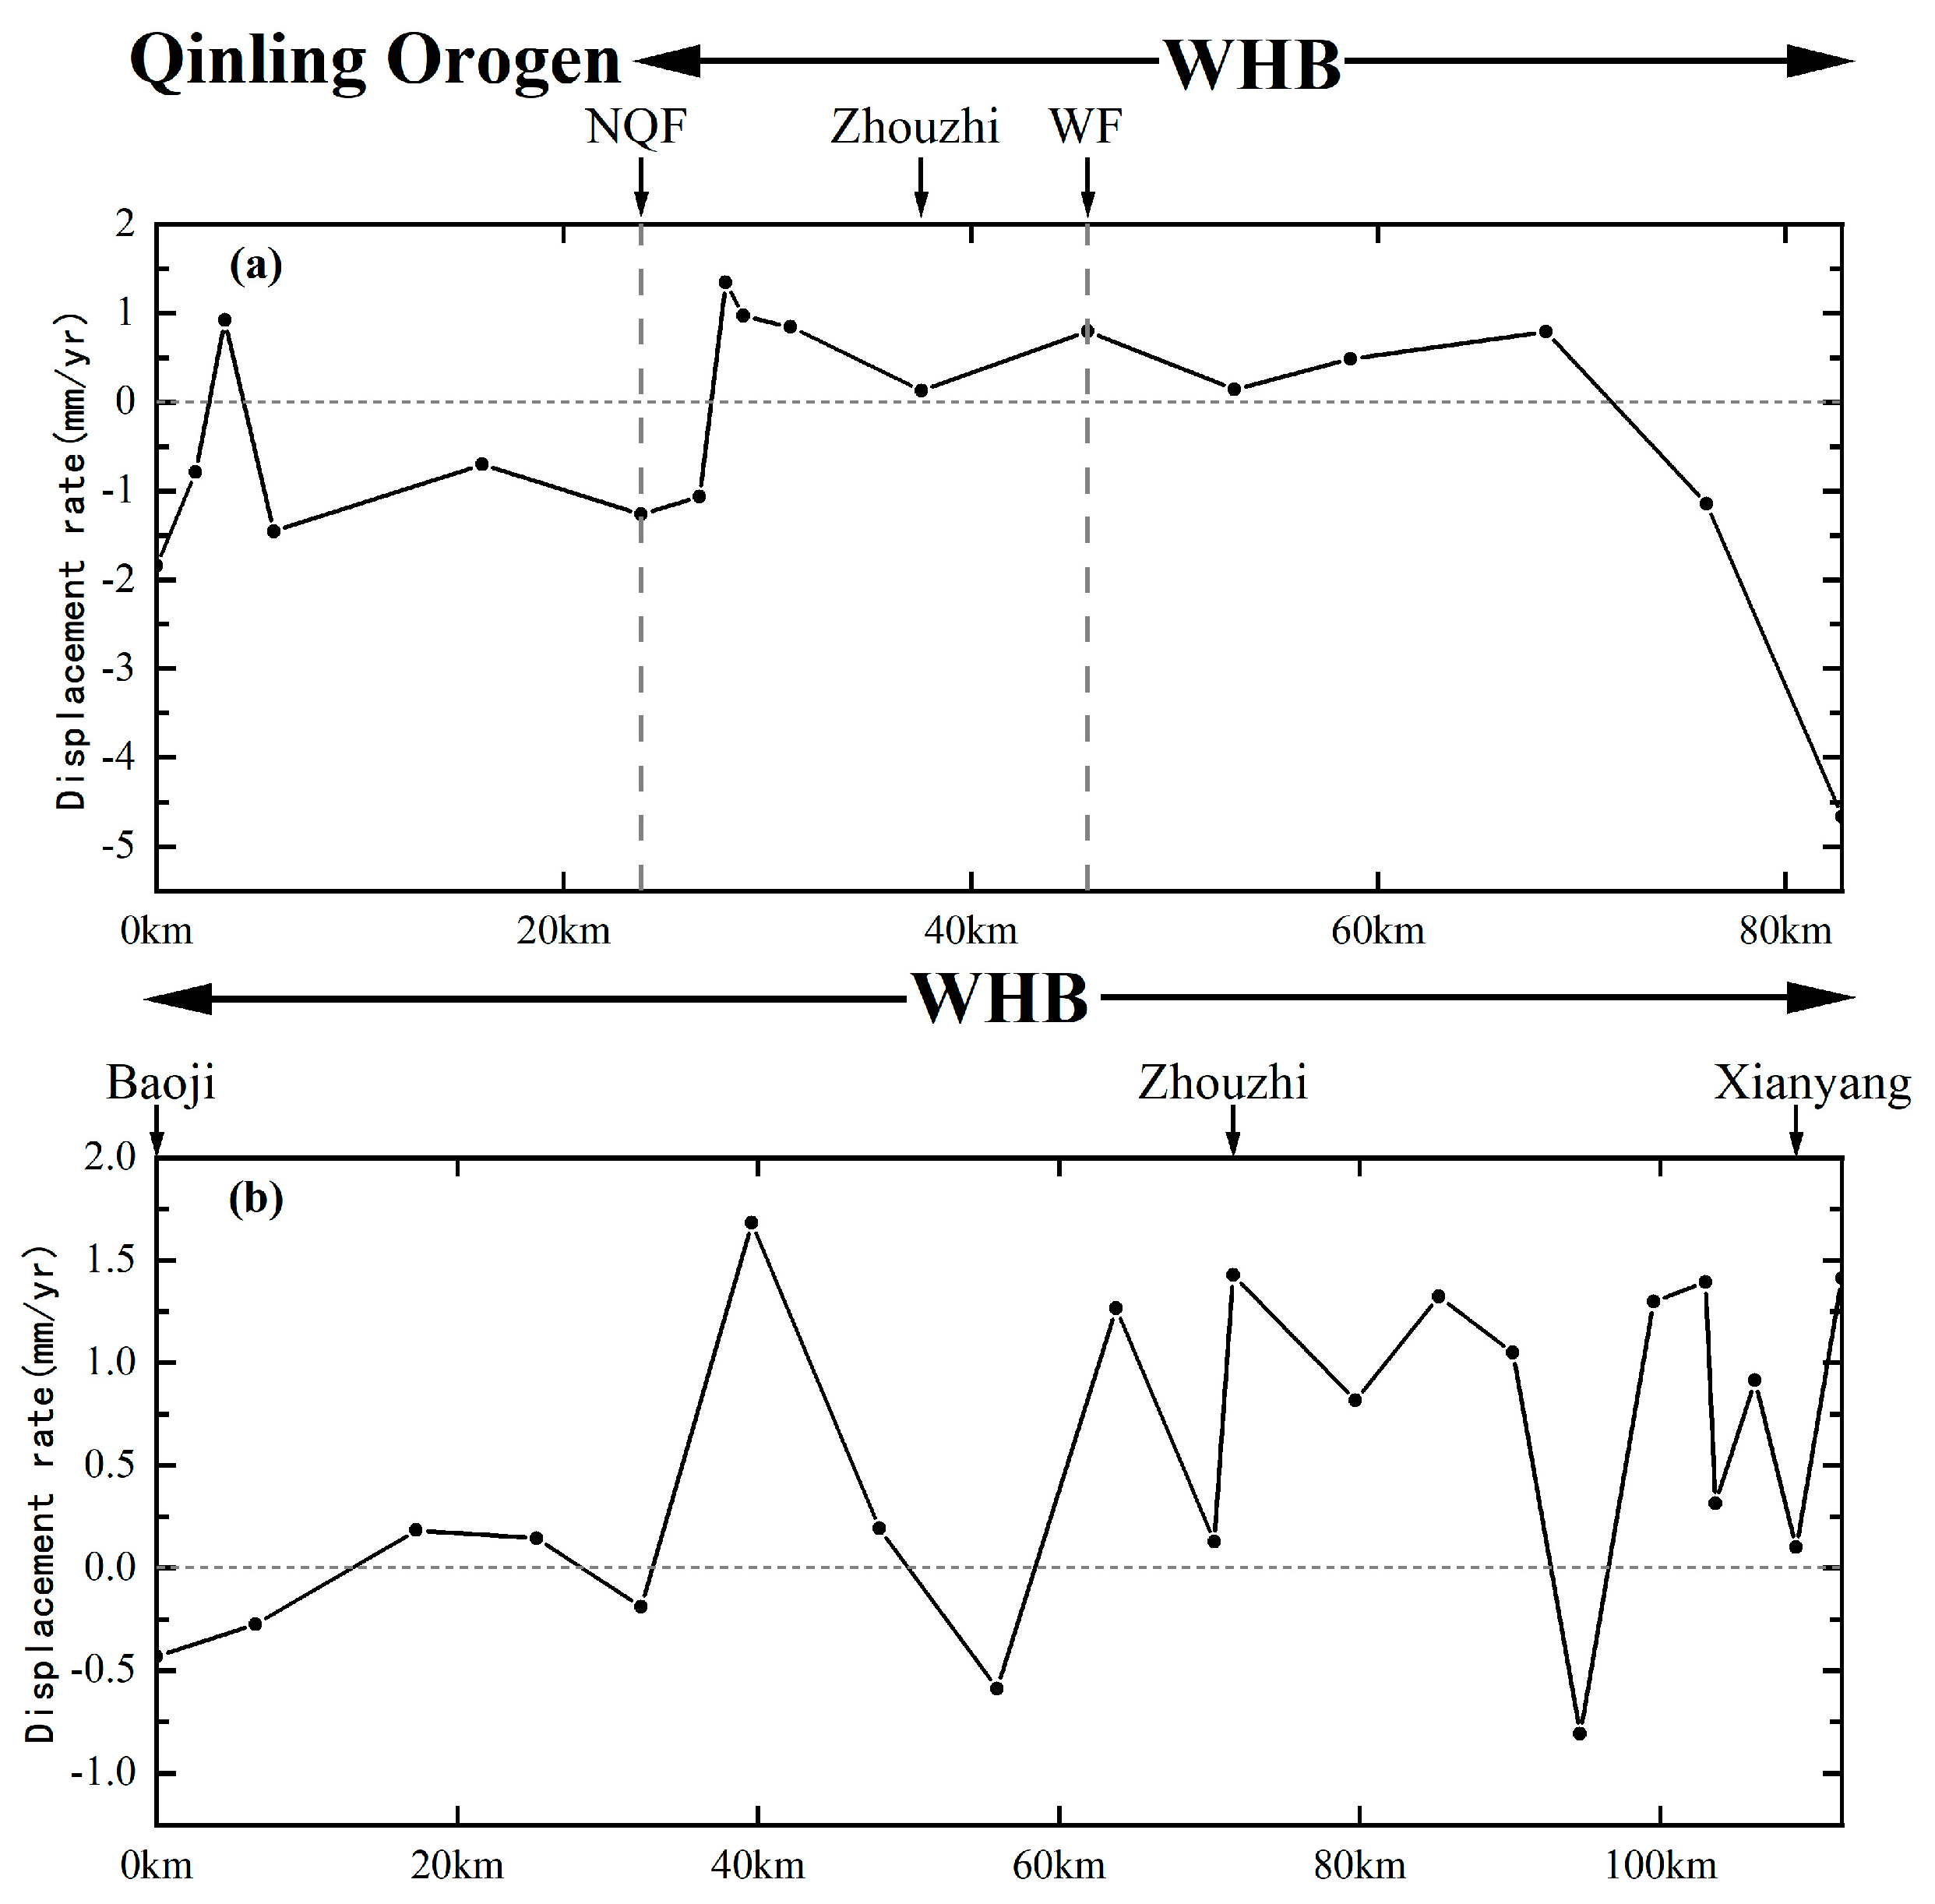
Sentinel-1 SAR image and the persistent scatterer InSAR data processing method are used to obtain the displacement rate of the Weihe Basin. The results show that the vertical deformation of the Weihe Basin is dominated by uplift, and the subsidence areas are mostly located at the Qinling Orogen.
(5)
According to the Bouguer gravity anomaly, the Moho depth, and isostatic anomaly, we found that there is middle-lower crustal flow in the northeastern Qinghai-Tibet Plateau (west of Baoji), namely, the Middle Qinling Orogen and the Weihe Basin are affected by subduction and extrusion. The Liupanshan Mountains is formed by the crustal shortening without middle-lower crustal flow.
(6)
There are high potential seismic risks near the Liupanshan Mountains, the Weihe Basin, and the P1 profile in the near future.

Author Contributions

Conceptualization, H.Y. and Y.W.; methodology, H.Y. and X.S.; software, H.Y. and Y.Z.; validation, Y.W. and S.B.; formal analysis, Y.W.; investigation, H.Y.; data curation, H.Y. and X.S.; writing—original draft preparation, H.Y.; writing—review and editing, Y.W., Y.Z. and S.B.; visualization, H.Y.; supervision, Y.W.; project administration, Y.W.; funding acquisition, Y.W. All authors have read and agreed to the published version of the manuscript.

Funding

This research was funded by the National Natural Science Fund of China (41974096, 41931074, 42274113), Opening Fund of Key Laboratory of Geological Survey and Evaluation of Ministry of Education (Grant No. GLAB2022ZR07).

Institutional Review Board Statement

Not applicable.

Informed Consent Statement

Not applicable.

Data Availability Statement

The data set with the products resulting in this paper is available by contacting the corresponding author.

Acknowledgments

We thank the two anonymous reviewers for their constructive comments. We are grateful to NGDC for releasing the ETOPO1 data. Some of the figures were plotted using the Generic Mapping Tools (GMT) software, developed by Wessel and Smith (1991), we would like to express our gratitude to its maintainers.

Conflicts of Interest

The authors declare no conflict of interest.

References

  1. Zhang, G.; Meng, Q.; Lai, S. Tectonics and Structure of the Qinling Orogenic Belt. Sci. China Ser. B 1995, 38, 1379–1394. [Google Scholar]
  2. Zhang, G.; Meng, Q.; Yu, Z.; Sun, Y.; Zhou, D.; Guo, A. Orogenesis and Dynamics of the Qinling Orogen. Sci. China Ser. D 1996, 39, 225–234. [Google Scholar]
  3. Teng, J.; Zhang, Z.; Zhang, X.; Wang, C.; Gao, R.; Yang, B.; Qiao, Y.; Deng, Y. Investigation of the Moho Discontinuity beneath the Chinese Mainland Using Deep Seismic Sounding Profiles. Tectonophysics 2013, 609, 202–216. [Google Scholar] [CrossRef]
  4. Teng, J.; Deng, Y.; Badal, J.; Zhang, Y. Moho Depth, Seismicity and Seismogenic Structure in China Mainland. Tectonophysics 2014, 627, 108–121. [Google Scholar] [CrossRef]
  5. Wang, C.; Sandvol, E.; Lou, H.; Wang, X.; Chen, Y. Evidence for a Crustal Root beneath the Paleoproterozoic Collision Zone in the Northern Ordos Block, North China. Precambrian Res. 2017, 301, 124–133. [Google Scholar] [CrossRef]
  6. Zhang, P.; Yao, H.; Chen, L.; Fang, L.; Wu, Y.; Feng, J. Moho Depth Variations From Receiver Function Imaging in the Northeastern North China Craton and Its Tectonic Implications. J. Geophys. Res. Solid Earth 2019, 124, 1852–1870. [Google Scholar] [CrossRef] [Green Version]
  7. Bao, X.; Song, X.; Xu, M.; Wang, L.; Sun, X.; Mi, N.; Yu, D.; Li, H. Crust and Upper Mantle Structure of the North China Craton and the NE Tibetan Plateau and Its Tectonic Implications. Earth Planet. Sci. Lett. 2013, 369, 129–137. [Google Scholar] [CrossRef]
  8. Liu, M.; Mooney, W.D.; Li, S.; Okaya, N.; Detweiler, S. Crustal Structure of the Northeastern Margin of the Tibetan Plateau from the Songpan-Ganzi Terrane to the Ordos Basin. Tectonophysics 2006, 420, 253–266. [Google Scholar] [CrossRef]
  9. Wang, C.; Han, W.; Wu, J.; Lou, H.; Chan, W. Crustal Structure beneath the Eastern Margin of the Tibetan Plateau and Its Tectonic Implications. J. Geophys. Res. 2007, 112, B07307. [Google Scholar] [CrossRef]
  10. Zhang, Y.; Teng, J.; Wang, Q.; Hu, G. Density Structure and Isostatic State of the Crust in the Longmenshan and Adjacent Areas. Tectonophysics 2014, 619–620, 51–57. [Google Scholar] [CrossRef]
  11. Wang, Q.; Teng, J.; Zhang, Y.; Pi, J. Gravity Anomalies and Deep Crustal Structure of the Ordos Basin—Middle Qinling Orogen—Eastern Sichuan Basin. Chin. J. Geophys. 2015, 58, 532–541. (In Chinese) [Google Scholar] [CrossRef]
  12. She, Y.; Fu, G.; Su, X.; Meng, G.; Zhu, Y.; Guo, S.; Xu, Y. Crustal isostasy and uplifting mechanism of the Liupanshan area. Prog. Geophys. 2016, 31, 1464–1472. (In Chinese) [Google Scholar] [CrossRef]
  13. Zhang, Y.; Teng, J.; Wang, Q.; Lü, Q.; Si, X.; Xu, T.; Badal, J.; Yan, J.; Hao, Z. A Gravity Study along a Profile across the Sichuan Basin, the Qinling Mountains and the Ordos Basin (Central China): Density, Isostasy and Dynamics. J. Asian Earth Sci. 2017, 147, 310–321. [Google Scholar] [CrossRef]
  14. Gao, S.; She, Y.; Fu, G. A New Method for Computing the Vertical Tectonic Stress of the Crust by Use of Hybrid Gravity and GPS Data. Chin. J. Geophys. 2016, 59, 2006–2013. (In Chinese) [Google Scholar] [CrossRef]
  15. Wang, Z.; Fu, G.; She, Y. Crustal Density Structure, Lithosphere Flexure Mechanism, and Isostatic State Throughout the Qinling Orogen Revealed by In Situ Dense Gravity Observations. J. Geophys. Res. Solid Earth. 2018, 123, 10,026–10,039. [Google Scholar] [CrossRef]
  16. She, Y.; Fu, G.; Wang, Z.; Gao, Y. Vertical Tectonic Stress in Eastern Margin of Bayan Har Block Revealed by Gravity and Terrain Data. Chin. J. Geophys. 2017, 60, 2480–2492. (In Chinese) [Google Scholar] [CrossRef]
  17. Shi, X.; Wang, J.; Jiang, M.; Zhang, S.; Wu, Y.; Zhong, Y. Extreme Rainfall-Related Accelerations in Landslides in Danba County, Sichuan Province, as Detected by InSAR. Int. J. Appl. Earth Obs. Geoinf. 2022, 115, 103109. [Google Scholar] [CrossRef]
  18. Shi, X.; Zhu, T.; Tang, W.; Jiang, M.; Jiang, H.; Yang, C.; Zhan, W.; Ming, Z.; Zhang, S. Inferring Decelerated Land Subsidence and Groundwater Storage Dynamics in Tianjin–Langfang Using Sentinel-1 InSAR. Int. J. Digit. Earth 2022, 15, 1526–1546. [Google Scholar] [CrossRef]
  19. Ferretti, A.; Prati, C.; Rocca, F. Permanent Scatterers in SAR Interferometry. IEEE Trans. Geosci. Remote Sens. 2001, 39, 8–20. [Google Scholar] [CrossRef]
  20. Berardino, P.; Fornaro, G.; Lanari, R.; Sansosti, E. A New Algorithm for Surface Deformation Monitoring Based on Small Baseline Differential SAR Interferograms. IEEE Trans. Geosci. Remote Sens. 2002, 40, 2375–2383. [Google Scholar] [CrossRef] [Green Version]
  21. Deng, Q.; Cheng, S.; Min, W.; Yang, G.; Ren, D. Discussion on Cenozoic Tectonics and Dynamics of Ordos Block. J. Geomech. 1999, 5, 13–21. (In Chinese) [Google Scholar]
  22. Li, H.; Gao, R.; Xiong, X.; Wang, H.; Li, W. Moho Fabrics of North Qinling Belt, Weihe Graben and Ordos Block in China Constrained from Large Dynamite Shots. Geophys. J. Int. 2017, 209, 643–653. [Google Scholar] [CrossRef]
  23. Zhang, Q.; Qu, W.; Peng, J.; Wang, Q.; Li, Z. Research on Tectonic Causes of Numerous Ground Fissures Development Mechanism and Its Unbalance Distribution between Eastern and Western of Weihe Basin. Chinese J. Geophys. 2012, 55, 2589–2597. (In Chinese) [Google Scholar] [CrossRef]
  24. Zhang, Y.; Dong, S.; Wang, H.; Feng, M.; Thybo, H.; Li, J.; Gao, R.; Shi, W. Coupled Lithospheric Deformation in the Qinling Orogen, Central China: Insights from Seismic Reflection and Surface-Wave Tomography. Geophys. Res. Lett. 2022, 49. [Google Scholar] [CrossRef]
  25. Meng, Q.; Zhang, G. Geologic Framework and Tectonic Evolution of the Qinling Orogen, Central China. Tectonophysics 2000, 323, 183–196. [Google Scholar] [CrossRef]
  26. Yang, Z.; Shen, C.; Ratschbacher, L.; Enkelmann, E.; Jonckheere, R.; Wauschkuhn, B.; Dong, Y. Sichuan Basin and beyond: Eastward Foreland Growth of the Tibetan Plateau from an Integration of Late Cretaceous-Cenozoic Fission Track and (U-Th)/He Ages of the Eastern Tibetan Plateau, Qinling, and Daba Shan. J. Geophys. Res. Solid Earth 2017, 122, 4712–4740. [Google Scholar] [CrossRef]
  27. Hu, J.; Chen, H.; Qu, H.; Wu, G.; Yang, J.; Zhang, Z. Mesozoic Deformations of the Dabashan in the Southern Qinling Orogen, Central China. J. Asian Earth Sci. 2012, 47, 171–184. [Google Scholar] [CrossRef]
  28. Meng, Q.; Wang, E.; Hu, J. Mesozoic Sedimentary Evolution of the Northwest Sichuan Basin: Implication for Continued Clockwise Rotation of the South China Block. Geol. Soc. Am. Bull. 2005, 117, 396–410. [Google Scholar] [CrossRef]
  29. Fu, G.; She, Y. Gravity Anomalies and Isostasy Deduced From New Dense Gravimetry Around the Tsangpo Gorge, Tibet: Dense Gravimetry Around Tsangpo Gorge. Geophys. Res. Lett. 2017, 44, 10,233–10,239. [Google Scholar] [CrossRef]
  30. Liu, D.; Li, H.; Liu, S. A Data Processing System for Mobile Gravity Measurements—LGADJ; Seismological Press: Beijing, China, 1991; pp. 339–350. ISBN 7-5028-0417-X/P.267. [Google Scholar]
  31. Fullea, J.; Fernàndez, M.; Zeyen, H. FA2BOUG—A FORTRAN 90 Code to Compute Bouguer Gravity Anomalies from Gridded Free-Air Anomalies: Application to the Atlantic-Mediterranean Transition Zone. Comput. Geosci. 2008, 34, 1665–1681. [Google Scholar] [CrossRef]
  32. Amante, C.; Eakins, B. Etopo1 1 Arc-Minute Global Relief Model: Procedures, Data Sources and Analysis; NOAA Technical Memorandum NESDIS NGDC-24; National Oceanic and Atmospheric Administration: Washington, DC, USA, 2009; pp. 1–19.
  33. Takaku, J.; Tadono, T.; Tsutsui, K.; Ichikawa, M. VALIDATION OF “AW3D” GLOBAL DSM GENERATED FROM ALOS PRISM. ISPRS Ann. Photogramm. Remote Sens. Spat. Inf. Sci. 2016, 3, 25–31. [Google Scholar] [CrossRef] [Green Version]
  34. Wang, C.; Zhu, L.; Lou, H.; Huang, B.; Yao, Z.; Luo, X. Crustal Thicknesses and Poisson’s Ratios in the Eastern Tibetan Plateau and Their Tectonic Implications. J. Geophys. Res. 2010, 115, B11301. [Google Scholar] [CrossRef]
  35. Wang, C.; Sandvol, E.; Zhu, L.; Lou, H.; Yao, Z.; Luo, X. Lateral Variation of Crustal Structure in the Ordos Block and Surrounding Regions, North China, and Its Tectonic Implications. Earth Planet. Sci. Lett. 2014, 387, 198–211. [Google Scholar] [CrossRef]
  36. Fu, G.; Gao, S.; Freymueller, J.T.; Zhang, G.; Zhu, Y.; Yang, G. Bouguer Gravity Anomaly and Isostasy at Western Sichuan Basin Revealed by New Gravity Surveys. J. Geophys. Res. Solid Earth 2014, 119, 3925–3938. [Google Scholar] [CrossRef]
  37. Guo, L.; Fu, G.; She, Y.; Wang, Z.; Yang, J. Lithosphericisostasy and risk of reservoir-induced earthquakes along the Yarlung Zangbo River between Sangri and Mêdog. Chin. J. Geophys. 2021, 64, 3220–3231. (In Chinese) [Google Scholar] [CrossRef]
  38. Jiang, M. Sentinel-1 TOPS Co-Registration over Low-Coherence Areas and Its Application to Velocity Estimation Using the All Pairs Shortest Path Algorithm. J. Geod. 2020, 94, 95. [Google Scholar] [CrossRef]
  39. Wegmüller, U.; Werner, C.; Strozzi, T.; Wiesmann, A.; Frey, O.; Santoro, M. Sentinel-1 IWS mode support in the GAMMA software. In Proceedings of the 2015 IEEE 5th Asia-Pacific Conference on Synthetic Aperture Radar (APSAR), Singapore, 1–4 September 2015; pp. 431–436. [Google Scholar]
  40. Shi, X.; Liao, M.; Li, M.; Zhang, L.; Cunningham, C. Wide-Area Landslide Deformation Mapping with Multi-Path ALOS PALSAR Data Stacks: A Case Study of Three Gorges Area, China. Remote Sens. 2016, 8, 136. [Google Scholar] [CrossRef] [Green Version]
  41. Song, P.; Teng, J.; Zhang, X.; Liu, Y.; Si, X.; Ma, X.; Qiao, Y.; Dong, X. Flyover Crustal Structures Beneath the Qinling Orogenic Belt and Its Tectonic Implications. J. Geophys. Res. Solid Earth. 2018, 123, 6703–6718. [Google Scholar] [CrossRef]
  42. Hao, M.; Wang, Q.; Shen, Z.; Cui, D.; Ji, L.; Li, Y.; Qin, S. Present Day Crustal Vertical Movement Inferred from Precise Leveling Data in Eastern Margin of Tibetan Plateau. Tectonophysics 2014, 632, 281–292. [Google Scholar] [CrossRef]
  43. Ren, J.; Feng, X.; Wang, F.; Peng, J.; Liu, C.; Dai, W.; Li, G.; Zhang, Y.; Ma, J. Fine Crust Structures of Xi’an Sag in the Weihe Basin Revealed by a Deep Seismic Reflection Profile. Chin. J. Geophys. 2013, 56, 513–521. (In Chinese) [Google Scholar] [CrossRef]
  44. Zhang, G.; Zhu, Y.; Zhang, T.; Li, Z.; Wang, Y.; Liang, W. Crustal Deformations in the Northeastern Tibetan Plateau Revealed by Multiple Geodetic Datasets. Pure Appl. Geophys. 2022, 1–12. [Google Scholar] [CrossRef]
  45. Li, G.; Zhao, C.; Wang, B.; Peng, M.; Bai, L. Evolution of Spatiotemporal Ground Deformation over 30 Years in Xi’an, China, with Multi-Sensor SAR Interferometry. J. Hydrol. 2022, 616, 128764. [Google Scholar] [CrossRef]
  46. Avouac, J.-P.; Tapponnier, P. Kinematic Model of Active Deformation in Central Asia. Geophys. Res. Lett. 1993, 20, 895–898. [Google Scholar] [CrossRef] [Green Version]
  47. Tapponnier, P.; Zhiqin, X.; Roger, F.; Meyer, B.; Arnaud, N.; Wittlinger, G.; Jingsui, Y. Oblique Stepwise Rise and Growth of the Tibet Plateau. Science 2001, 294, 1671–1677. [Google Scholar] [CrossRef] [PubMed]
  48. Royden, L.H.; Burchfiel, B.C.; King, R.W.; Wang, E.; Chen, Z.; Shen, F.; Liu, Y. Surface Deformation and Lower Crustal Flow in Eastern Tibet. Science 1997, 276, 788–790. [Google Scholar] [CrossRef]
  49. Royden, L.H.; Burchfiel, B.C.; van der Hilst, R.D. The Geological Evolution of the Tibetan Plateau. Science 2008, 321, 1054–1058. [Google Scholar] [CrossRef] [Green Version]
  50. Molnar, P.; England, P.; Martinod, J. Mantle Dynamics, Uplift of the Tibetan Plateau, and the Indian Monsoon. Rev. Geophys. 1993, 31, 357–396. [Google Scholar] [CrossRef]
  51. Li, H.; Gao, R.; Wang, H.; Li, W. Extracting the Moho structure of Liupanshan by the method of near vertical incidenc. Chin. J. Geophys. 2013, 56, 3811–3818. (In Chinese) [Google Scholar] [CrossRef]
  52. Gao, R.; Wang, H.; Zeng, L.; Zhang, J.; Guo, T.; Li, Q.; Li, W.; Li, P.; Guan, Y. The Crust Structures and the Connection of the Songpan Block and West Qinling Orogen Revealed by the Hezuo-Tangke Deep Seismic Reflection Profiling. Tectonophysics 2014, 634, 227–236. [Google Scholar] [CrossRef]
  53. Wang, H.; Gao, R.; Ma, Y.; Zhu, X.; Li, Q.; Kuang, Z.; Li, P.; Lu, Z. Basin range coupling and lithosphere structure between the Zoige and the west Qinling. Chin. J. Geophys. 2007, 50, 472–481. [Google Scholar]
  54. Yuan, X.; Xu, M.; Tang, W.; Wang, Q. Eastern Qinling seismic reflection profiling. Acta Geophys. Sin. 1994, 37, 749–758. (In Chinese) [Google Scholar]
  55. Mattauer, M.; Matte, P.; Malavieille, J.; Tapponnier, P.; Maluski, H.; Qin, X.Z.; Lun, L.Y.; Qin, T.Y. Tectonics of the Qinling Belt: Build-up and Evolution of Eastern Asia. Nature 1985, 317, 496–500. [Google Scholar] [CrossRef]
Figure 1. Map of the study area showing topography and the distribution of the gravity/GPS stations in the Qinling Area. The red square in the subfigure in the bottom left corner shows the geographical position of the study area in China. The black dots indicate the geographical positions of the measurement stations. Red triangles denote absolute gravity stations. Red dots denote cities. P1–P6 denote observation profiles, the start and end points of each trace of P1–P6 on the map are connected by a yellow line. Red lines are faults. WQF: Western Qinling fault, LPSF: Liupanshan fault, LBF: Longxian-Baoji fault, WF: Weihe fault, NQF: North Qinling fault, LTF: Lintan-Tanchang fault, PQF: Pingwu-Qingchuan fault, and AKF: Ankang fault. Abbreviations for tectonic units are as follows. OB: Ordos Basin, LB: Longxi Block, TP: Tibetan Plateau, WHB: Weihe Basin, DBS: Dabashan, and LPS: Liupanshan Mountains.
Remotesensing 15 00740 g001
Figure 2. Free-air gravity anomaly map in the Qinling area. Abbreviations are the same as those used in Figure 1.
Remotesensing 15 00740 g002
Figure 3. Bouguer gravity anomaly map in the Qinling area. Abbreviations are the same as those used in Figure 1.
Remotesensing 15 00740 g003
Figure 4. Persistent scatterer InSAR network used in this study.
Remotesensing 15 00740 g004
Figure 5. The isostatic depth map in the Qinling area. Abbreviations are the same as those used in Figure 1.
Remotesensing 15 00740 g005
Figure 6. The Moho depth map in the Qinling area. Abbreviations are the same as those used in Figure 1.
Remotesensing 15 00740 g006
Figure 7. The isostatic anomaly map in the Qinling area. Abbreviations are the same as those used in Figure 1.
Remotesensing 15 00740 g007
Figure 8. Distribution of isostatic additional force map in the Qinling area. Abbreviations are the same as those used in Figure 1.
Remotesensing 15 00740 g008
Figure 9. Displacement rate map of Weihe Basin. Abbreviations are the same as those used in Figure 1.
Remotesensing 15 00740 g009
Figure 10. Topography, measured gravity anomalies, inverted Moho depth, and isostatic depth along four profiles; (a) P1, (b) P2, (c) P3, and (d) P4. Abbreviations are the same as those used in Figure 1.
Remotesensing 15 00740 g010
Figure 11. Topography, measured gravity anomalies, inverted Moho depth, and isostatic depth along profile P6 in Weihe Basin. Abbreviations are the same as those used in Figure 1.
Remotesensing 15 00740 g011
Figure 12. Displacement rate map of profiles P4 and P6 in Weihe Basin. (a) P4, and (b) P6. Abbreviations are the same as those used in Figure 1.
Remotesensing 15 00740 g012
Figure 13. The distribution of earthquakes of Ms ≥ 2.0 in the study area from 1970 and the isostatic additional force relationships. The color scale indicates the isostatic additional force, the size of the gray dots indicates the earthquake magnitude, and the color shade indicates the focal depth. Abbreviations are the same as those used in Figure 1.
Remotesensing 15 00740 g013
Table 1. Focal depth of the Ms ≥ 2.0 earthquakes from 1970 to 2022.
Focal Depth/kmFrequencyProportion (%)
<1012510.9
10–2082371.5
20–3017515.2
>30282.4
Disclaimer/Publisher’s Note: The statements, opinions and data contained in all publications are solely those of the individual author(s) and contributor(s) and not of MDPI and/or the editor(s). MDPI and/or the editor(s) disclaim responsibility for any injury to people or property resulting from any ideas, methods, instructions or products referred to in the content.

