Article

GRACE Satellite-Based Analysis of Spatiotemporal Evolution and Driving Factors of Groundwater Storage in the Black Soil Region of Northeast China

1
State Key Laboratory of Black Soils Conservation and Utilization, Northeast Institute of Geography and Agroecology, Chinese Academy of Sciences, Changchun 130102, China
2
College of Geographic Sciences, Changchun Normal University, Changchun 130032, China
*
Author to whom correspondence should be addressed.
Remote Sens. 2023, 15(3), 704; https://doi.org/10.3390/rs15030704
Submission received: 2 December 2022 / Revised: 11 January 2023 / Accepted: 20 January 2023 / Published: 25 January 2023

Abstract

:
Clarifying the evolution pattern of groundwater storage (GWS) is crucial for exploring the amount of available water resources at a regional or basin scale. Currently, the groundwater resources of Northeast China have been extensively exploited, but only limited studies have assessed the extent of GWS depletion and its driving mechanisms. In this study, the groundwater storage anomaly (GWSA) in the black soil region of Northeast China was explored based on the Gravity Recovery and Climate Experiment (GRACE) satellite combined with the Global Land Data Assimilation System (GLDAS) hydrological model. The results show that from 2002 to 2021, the overall GWSA decreased (−0.4204 cm/a), and specifically, the average rates of decrease in Heilongjiang, Jilin, and Liaoning Provinces were −0.2786, −0.5923, and −0.6694 cm/a, respectively, with the eastern, southern, and central parts of Heilongjiang, Jilin, and Liaoning Provinces losing seriously. Especially the GWSA deficit trend can reach −0.7471 cm/a in southern Jilin Province. The GWSA deficits in the three provinces from April to September were greater than 0.40 cm/a, while the deficit values from January to March and from October to December were less than 0.40 cm/a. This study is the first to quantitatively analyze the GWSA and its influencing factors in Northeast China for 2002–2021. The results of the study help clarify the differences in the spatial and temporal distribution of groundwater resources and their driving mechanisms in the northeastern black soil regions and provide a reference for the conservation and sustainable utilization of groundwater resources in the black soil region.

1. Introduction

Aquifers are the world’s largest reservoir of freshwater resources, and groundwater is an important source of water for agricultural irrigation, industrial and mining enterprises, and urban living due to its stable water supply conditions and good water quality [1,2]. Additionally, groundwater plays an important role in maintaining the evolution and development of the ecosystem [3]. The significant drop in the groundwater table caused by overexploitation is producing serious ecological problems, such as desiccation and death of surface vegetation, ecological degradation, soil erosion, shrinkage and disappearance of rivers and lakes, and desertification [4,5,6]. The global risk of groundwater depletion is an escalating concern [7,8], and groundwater predictions and thresholds at global and regional scales are becoming a hot topic in groundwater-related research [9,10]. The groundwater-related sustainability in China is also not optimistic, especially in the arid and semiarid regions of the North China Plain and Northwestern China, where the groundwater is severely depleted [11,12,13]. Consequently, scholars are increasingly searching for approaches to assess groundwater resources and their sustainability [14,15,16].
Traditional in-situ groundwater dynamic monitoring involves table measurements in observation wells, which requires a large amount of labor and material costs [17]. Additionally, the limited number of monitoring points leads to low spatial resolution of the monitoring results due to human and mechanical errors [18,19]. Groundwater dynamics measured in wells can be used as qualitative indicators of local groundwater storage (GWS) changes [20,21]. However, assessing regional GWS changes requires not only a dense well network covering the entire region, but also a good understanding of the characteristics of the subsurface soil and aquifer properties [22,23,24]. Therefore, the traditional groundwater well observation method has limitations in reflecting the spatial and temporal variations of GWS in large regions.
In March 2002, a gravity satellite mission, Gravity Recovery and Climate Experiment (GRACE), was jointly launched by the National Aeronautics and Space Administration (NASA) and the German Aerospace Center. The satellite was succeeded by GRACE Follow-On in May 2018, a year after the GRACE satellite was decommissioned [25]. Although studies have shown that tectonic movements affect water mass changes derived by GRACE satellites [26,27], changes in the Earth’s gravity field are mainly due to changes in the mass of water on shorter time scales. The GRACE satellite is a combination of two satellites that monitor changes in total terrestrial water storage by sensing small gravitational changes caused by local changes in the Earth’s mass [28]. GRACE observes gravity anomalies, which are converted to monthly changes in terrestrial water storage [29]. The Global Land Data Assimilation System (GLDAS) hydrological model was jointly published by NASA and the National Centers for Environmental Prediction [30], which utilizes surface modeling and data assimilation techniques, as well as joint satellite and ground-based observational data products to generate optimal fields of land surface states and fluxes [31]. GLDAS drives the land surface models, including Community Land Model (CLSM), MOSAIC, NOAH, Variable Infiltration Capacity, and Catchment Land Surface Model (VIC), using surface observations and satellite remote sensing observations [32], which provide diverse land surface information on factors, such as wind speed, air temperature, total precipitation rate, soil moisture, transpiration, snow depth, and storm surface runoff [33]. Among them, compared with other datasets, the NOAH dataset has the advantages of stable driving fields, advanced patterns, and long time series. Therefore, the GRACE satellite combined with the GLDAS hydrological model is suitable for assessing GWS under all types of terrestrial conditions [34]. This combination can effectively solve the problems of low spatial and temporal resolutions and time-consuming and labor-intensive human and mechanical errors arising from traditional ground-based measurements and consequently increase the evaluation accuracy significantly [35].
GRACE satellite data are currently being widely used in the monitoring of the groundwater storage anomaly (GWSA) at different scales [36]. Wahr et al. [37] showed that GRACE can recover changes in terrestrial water storage at scales of several hundred kilometers or greater, on time scales of weeks or longer, with an accuracy of nearly 2 mm. They confirmed the accuracy of estimating the change in the Earth’s surface mass using GRACE and established the theoretical foundation for the inversion of terrestrial water storage change using GRACE satellite data. In areas with poor groundwater monitoring data, such as deserts and remote mountainous areas of northern India [38,39,40], Mississippi River Basin [41] and Illinois in the USA [42,43], and Yemen [44], GRACE satellite data presented an unprecedented opportunity to assess GWS and its depletion. Additionally, groundwater drought monitoring and evaluation using the GRACE-based groundwater drought index can effectively explore groundwater drought conditions and provide a reference for the spatial and temporal evolution of groundwater resources and water resource management [45].
Tangdamrongsub et al. used GRACE satellite data to monitor terrestrial water and groundwater changes in North China and found a significant decreasing trend in the GWSA during 2002–2014 [46]. Moiwo et al. utilized the GRACE satellite to explore changes in GWS in the western part of Jilin Province and discovered the presence of collapsed soil pores and ground subsidence caused by the depletion of water storage in the study area [47]. Tao et al. used GRACE and GLDAS data to invert the changes in GWS in Anhui Province and compared them with the groundwater resources in Anhui Province released by the National Bureau of Statistics and found a strong correlation (r = 0.89), which proved the feasibility of using GRACE satellite data in estimating groundwater reserves as a supplement to traditional ground surveys [48].
The northeast region of China is an essential grain-producing area, with its grain production accounting for 1/4th of the total national output. It is also an important commodity grain base, with an average grain commodity rate of approximately 70% of the country’s total rate. With social and economic development, agricultural water consumption has markedly increased, resulting in an imbalance between the supply and demand of surface water resources in many areas. Groundwater resources have become the major source of recharge for agricultural water and are being seriously overexploited in some areas, and problems, such as drawdown of the groundwater table, land subsidence, and cone of groundwater depression, are arising. Therefore, the principal objectives of this investigation were to (1) obtain the time series of the GWSA for each monthly interval in the three provinces by deducting the soil moisture and snow water equivalent obtained from GLDAS from the terrestrial water storage anomaly (TWSA) obtained from the GRACE satellite; (2) assess the spatiotemporal dynamics of GWSA in Northeast China from 2002 to 2021 for the first time, based on the GRACE satellite and GLDAS hydrological models; and (3) analyze the driving factors of GWSA in Northeast China. The results of the study can provide a scientific basis for sustainable groundwater resource utilization and management under the influence of climate change and human activities.

2. Materials and Methods
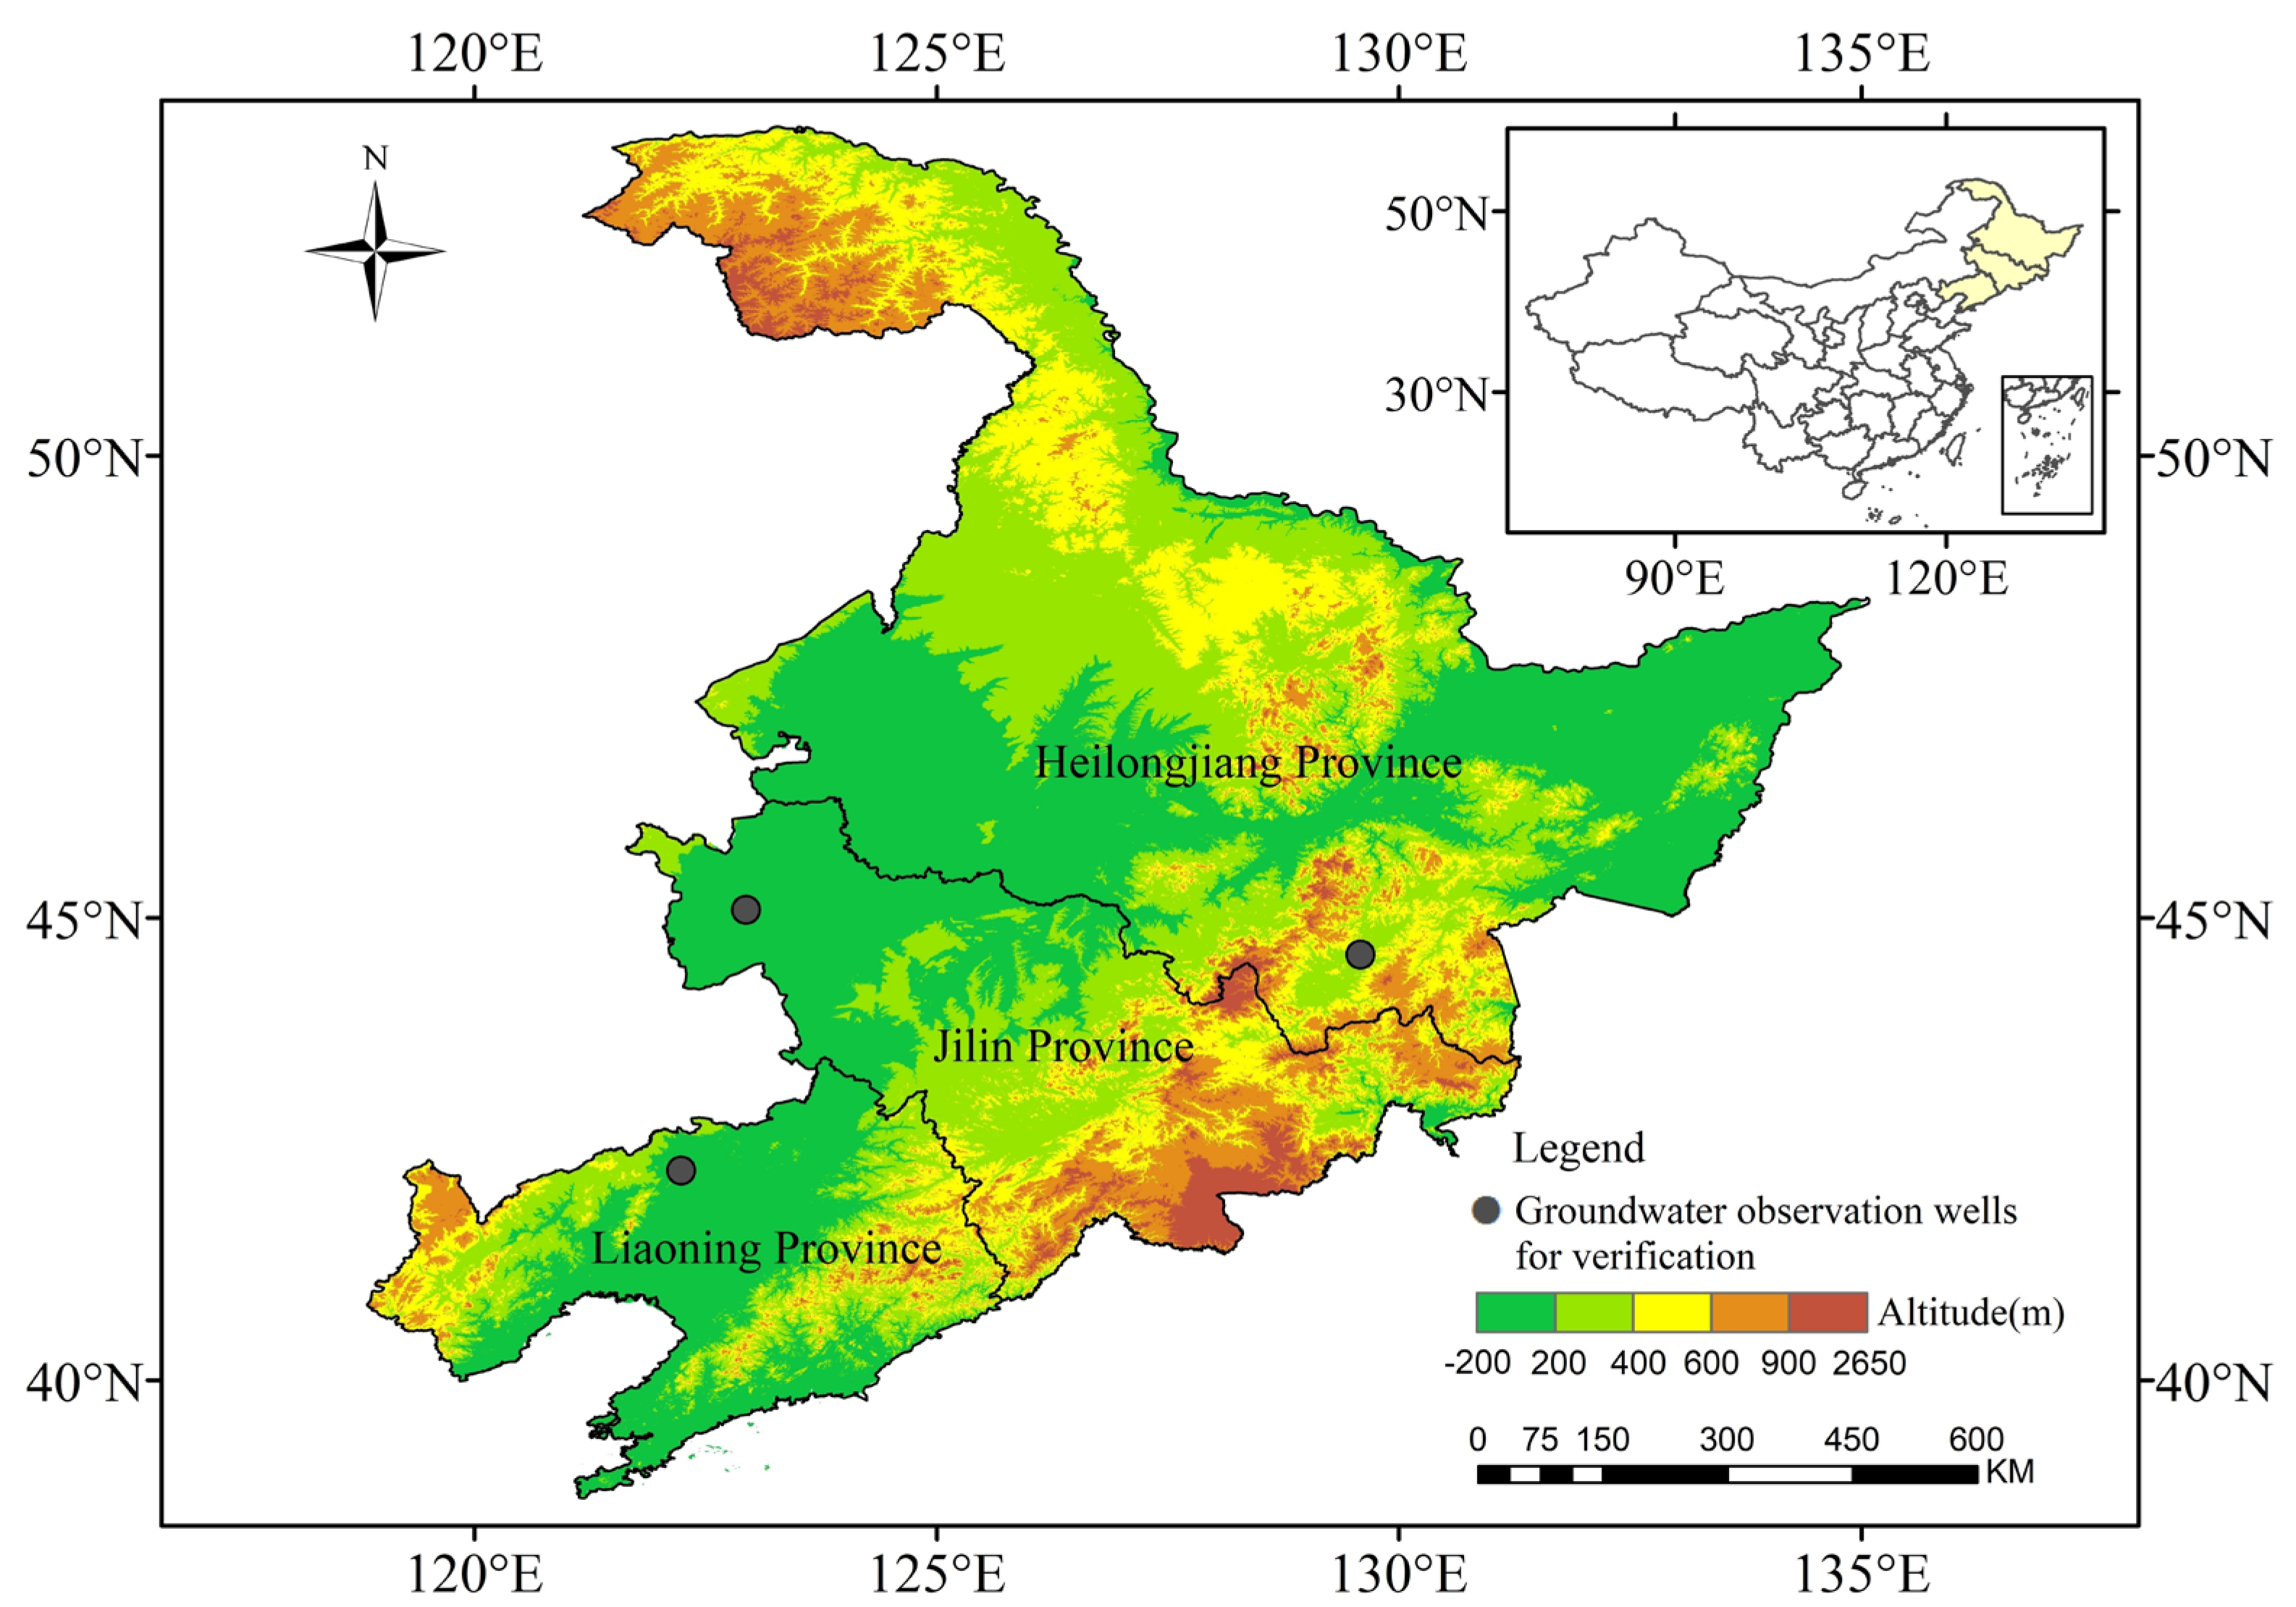
2.1. Study Area

The study was conducted in Northeast China in Heilongjiang, Jilin, and Liaoning provinces in the black soil regions, with their geographic locations ranging from 38°43′ to 53°34′N and 118°50′ to 135°05′E (Figure 1). The terrain in the area is dominated by plains and mountains, with the Changbai Mountain Range in the east and the Xiaoxinganling and Daxinganling in the north and west, respectively. The region has a temperate continental monsoon climate with four distinct seasons: high temperatures and rain in summer and cold and dry climate in winter. There are more than 290 rivers with catchment area above 1000 km2 in the study area, mainly including Heilongjiang, Songhua, Liao, Yalu, Tumen, and Suifen rivers, and other water systems, which provide abundant water resources for agricultural and industrial production in Northeast China. By 2021, the total water resources in the region were 216.524 billion m3, of which 185.861 billion m3 were surface water sources and 44.096 billion m3 were groundwater resources. As an important source of agricultural water supply, the demand for irrigation exploitation has been increasing each year, and the problem of groundwater overexploitation has emerged in the western part of Songnen and Liaohe plains, where water resources are relatively scarce. During 2000–2020, the average annual groundwater exploitation in Northeast China was 23.983 billion m3, accounting for 22% of the total exploitation in the country. Precipitation is one of the primary sources of groundwater in Northeast China. The annual precipitation is 350–700 mm, with uneven temporal distribution, mainly in the summer months of July, August, and September.

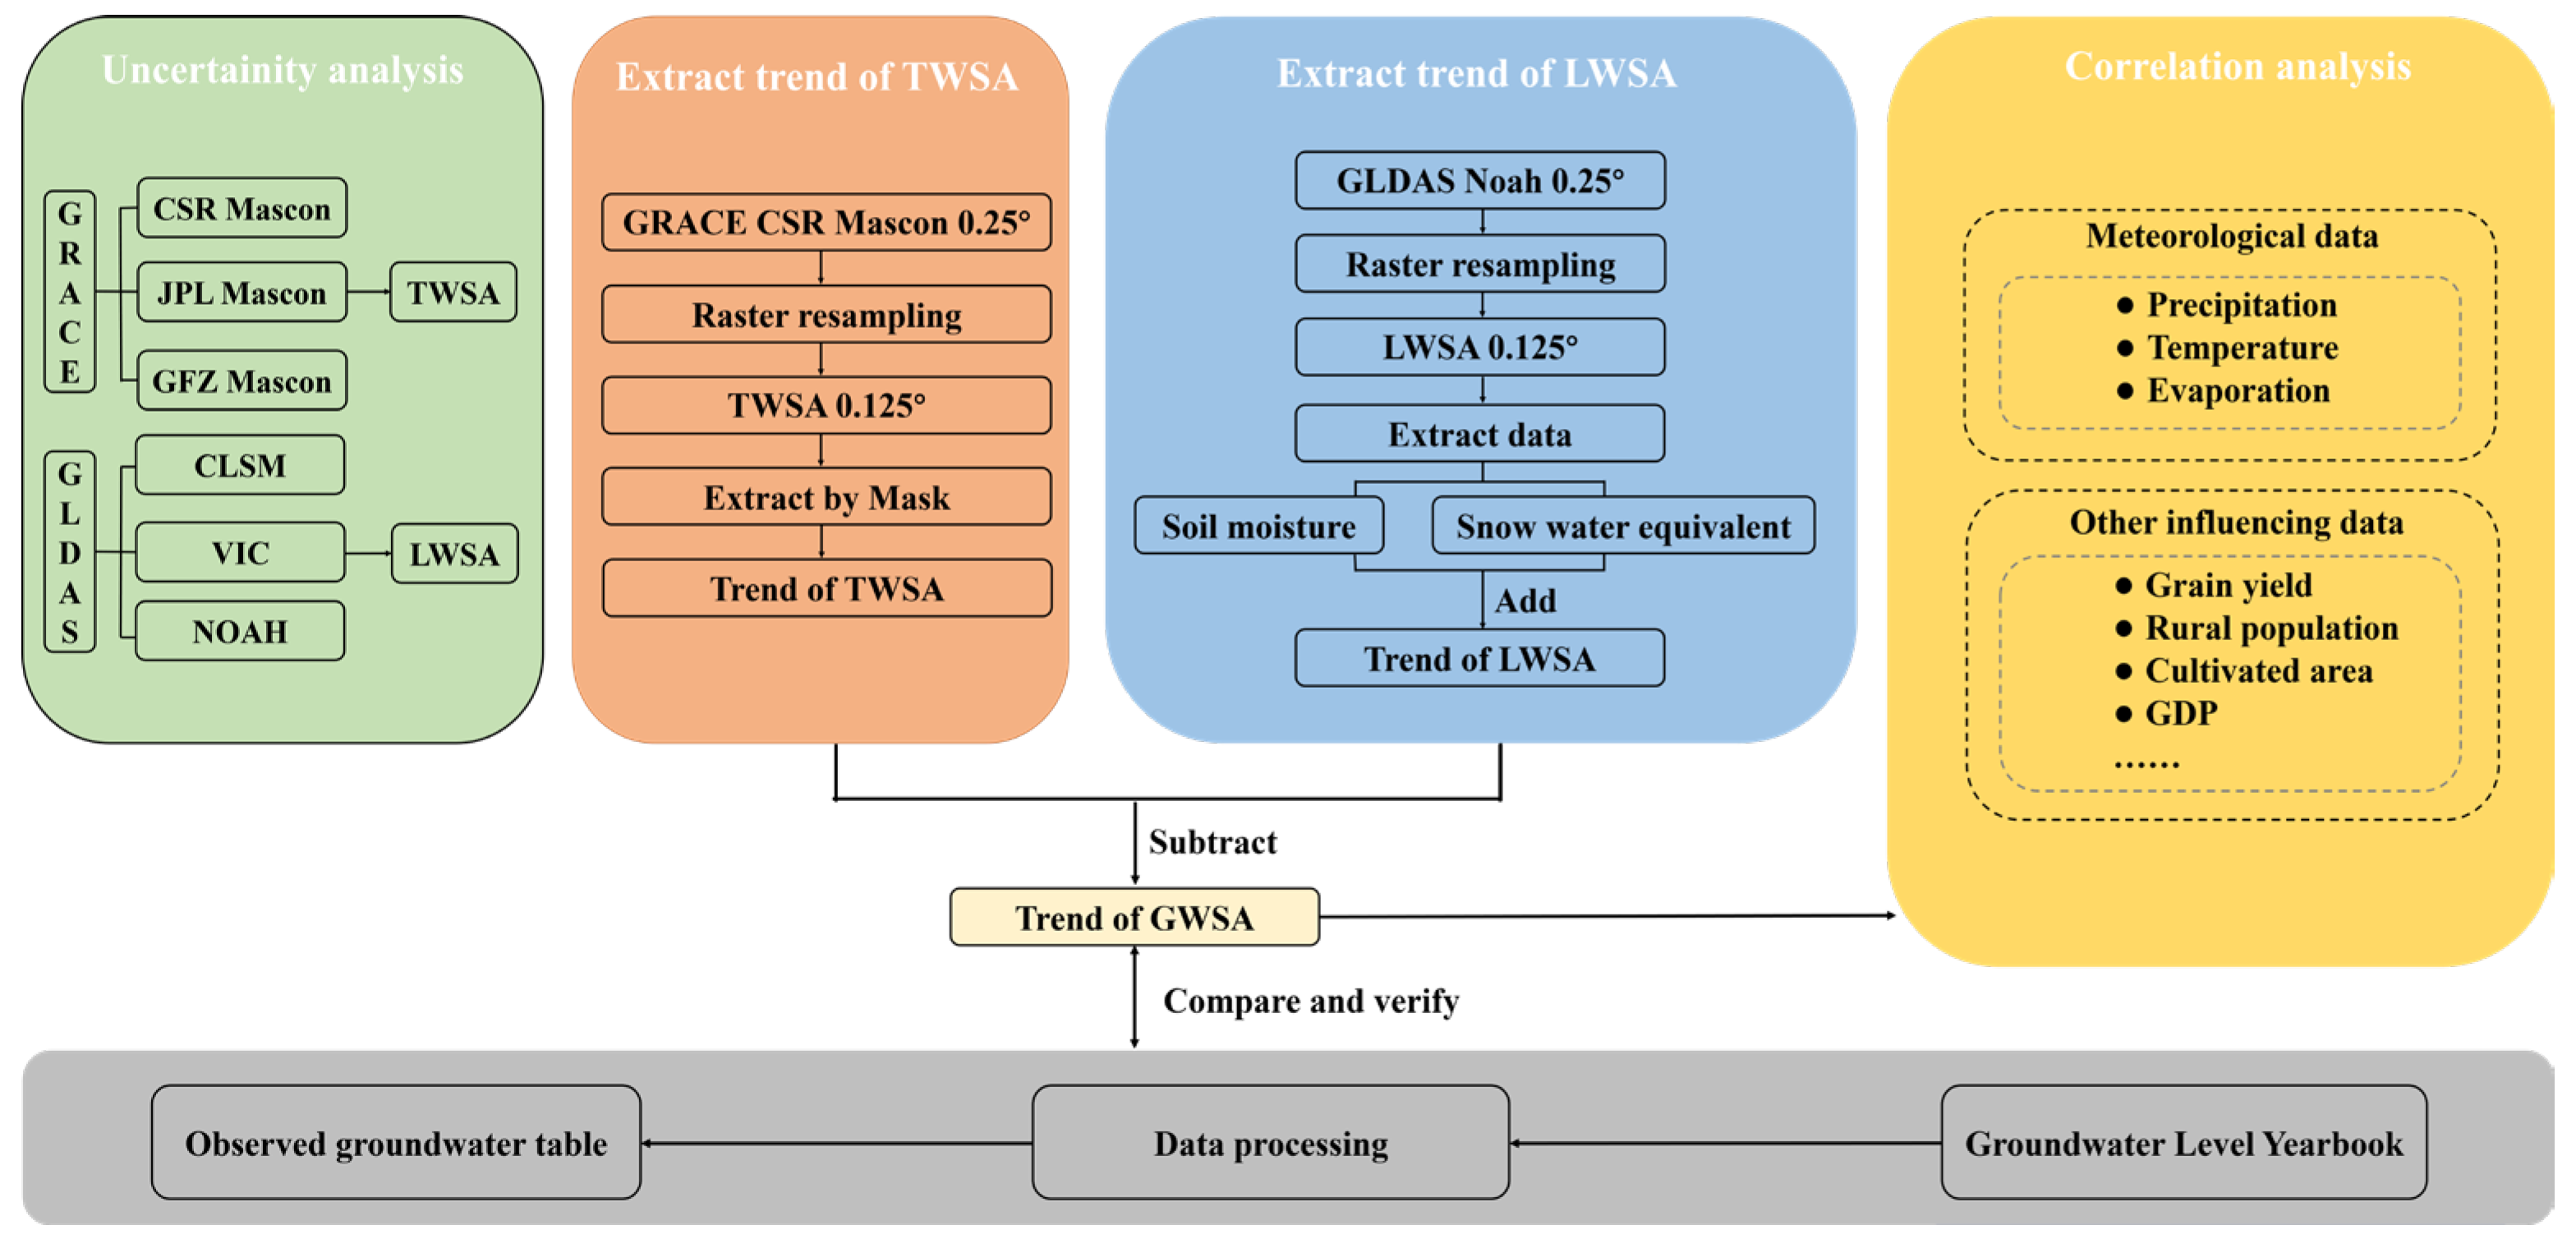
2.2. Data Sources and Processing

In this study, it is assumed that the mass variation obtained by GRACE satellite is mainly due to the change in water mass caused by the hydrological cycle. Firstly, TWSAs of the three provinces were extracted from GRACE Mascon of the Center for Space Research (CSR), the Jet Propulsion Laboratory (JPL), and the German Research Center for Geoscience (GFZ). Subsequently, the trends of land surface water storage anomaly (LWSA) were extracted and processed by invoking the three land surface process models (CLSM, VIC, and NOAH) from the GLDAS hydrological model, and the uncertainties of the above parameters were analyzed using the three-cornered hat (TCH) method. The data with the smallest uncertainty were selected to calculate and analyze the spatial and temporal variability of GWSA. Observed groundwater table data were collected to verify the results of GWSA. Finally, the influence of meteorological factors and anthropogenic activities on GWSA were analyzed. The summarized main flow chart of this study is shown in Figure 2.

2.2.1. Uncertainty Analysis

Mascon data from CSR, JPL, and GFZ and soil moisture anomaly (SMA) and snow water equivalent anomaly (SWEA) data from VIC, CLSM, and NOAH with a temporal resolution of one month were selected as input data. Uncertainty analysis was performed by the TCH method. The actual value of water storage is not easy to obtain, and evaluating the accuracy of water storage products directly is difficult [49]. The TCH method differs from the traditional error estimation method, as it does not require a known actual reference field; and can obtain the uncertainty of three or more sets of observation sequence data [50].
Assuming that the single observation consists of the actual value and the error, while the error conforms to the law of normal distribution, the following can be obtained:
obs i   =   x   +   e i
where obs i is the calculated result of the product at a position; x is the actual signal at that point, and e i is the error of the i-th observation sequence. If three groups of observations (i, j, k) are provided, the difference between two groups of observations (i, j) is calculated as follows:
obs i obs j = x + e i x + e j = e i e j
where obs j is the reference time series and e j is the error of the jth observation sequence. The variance of this difference is:
σ ij 2 = σ ei 2 + σ ej 2 2 cov ( e i , e j )  
where cov ( ) is the covariance operator. Assuming that the errors e i and ej are independent of each other, and the two covariances cov ( e i , e j ) = 0. The variance of the single observation error σ ei 2 is then obtained by replacing the elimination element:
σ ei 2 = 1 2 ( σ ij 2 + σ ik 2 σ jk 2 )

2.2.2. GRACE Monthly Gravity Field Model Data

We used a new generation of GRACE Mascon observational data products released by the CSR, which overcomes the leakage error of conventional spherical harmonic coefficients by filtering results with better accuracy [51]. In the case of missing data for individual months, the average values of the two months before and after were applied. The precipitation-based terrestrial water storage reconstruction data released by the National Tibetan Plateau Data Center were used to connect the 11-month window period between the GRACE and GRACE Follow-On (GRACE-FO) missions [52]. For data processing, because Mascon products can be operated conveniently, the Network Common data form files were downloaded from CSR and converted into Tagged Image File format files using MATLAB software. The TWSAs within the study area were then extracted by masking through ArcGIS.

2.2.3. GLDAS Hydrological Model Data

In this study, we selected GLDAS_NOAH_M.2.1 data with a resolution of 0.25° × 0.25° at the monthly scale. We assumed that the non-negligible terrestrial water storage mass variability in the study area originates from GWSA, SMA, and SWEA. To calculate the changes in surface water storage, we used “Iterator”—“Raster”—“Extract by Mask” in ArcGIS to batch crop the boundary of the study area. The changes in surface water storage were then calculated by adding the four layers of soil water and snow water equivalents using python programming, subtracting the distance level, and converting the units to centimeters, which is the same as that of GRACE terrestrial water storage. Finally, the four layers of SMA and SWEA files obtained in GLDAS were subtracted from the GRACE TWSA by Python programming to generate a new GWSA file.

2.2.4. Groundwater Monitoring Well Data

The groundwater tables inverted by GRACE and GLDAS in the northeastern black soil regions were verified according to the China Geoenvironmental Monitoring Groundwater Table Yearbook. Owing to anomalous values in the data and some missing periods in different provinces, three representative groundwater monitoring wells with continuous measurement data during 2006–2015 were selected to verify the results of GWSA (Figure 1). The GRACE-derived GWSA data are expressed as equivalent water height; that is, the mass of GWSA was converted to the height of the water column in the hypothetical plane because the unit of groundwater table in monitoring wells is centimeters, and the physical interpretation of the two is different. The observed groundwater table should have been multiplied by the specific yield for comparison with the GWSA retrieved by GRACE; however, information on the specific yield of the three northeastern provinces was lacking; therefore, we only verified the trend of the GRACE-inverted data and observation data.

2.2.5. Meteorological Data

Precipitation, temperature, and evaporation data were collected from the National Meteorological Science Data Center. The selected meteorological stations were Mudanjiang City in Heilongjiang Province, Tongyu County in Jilin Province, and Zhangwu County in Liaoning Province, spanning the period from April 2002 to December 2020. The daily-scale meteorological station data were compiled into monthly value series and then compared with the raster values of GWSA changes from GRACE inversions nearest to the meteorological stations to analyze the relationship between them.

2.2.6. Other Data

The cultivated land area, grain production, total population, and the number of rural populations were obtained from the Heilongjiang, Jilin, and Liaoning provincial statistical yearbooks. The effective irrigated area and total agricultural water consumption of each province were obtained from the National Bureau of Statistics, and the total water supply and groundwater supply were selected from Heilongjiang, Jilin, and Liaoning Province Water Resources Bulletins. All the above data were in the time range of 2002–2021 and were used to analyze the factors affecting the inverse GWSA.

2.2.7. Calculation and Verification of GWSA

The TWSAs inversed by GRACE represent the combined effects of anomalies in surface water storage (soil moisture, snow water equivalent, and vegetation canopy water) and GWSA [53,54]. The groundwater component of the total storage can be successfully separated from the total storage observed by GRACE [55]. Thus, the water balance equation of the study area is:
ΔGWSA = ΔTWSA − ΔSMA − ΔSWEA − ΔCWSA
where ΔGWSA represents the anomaly in GWS (mm), ΔTWSA represents the anomaly in terrestrial water storage (mm) obtained from GRACE satellite, and ΔSMA and ΔSWEA represent the anomaly in soil moisture (mm) and snow water equivalent (mm), respectively, obtained from GLDAS NOAH. ΔCWSA represents the anomaly in total canopy water storage (mm). Some studies on groundwater storage calculations have reported that the variation of biomass in the study area was relatively small, and the values of anomalies in vegetation canopy water were negligible [47,56,57]. Therefore, it is assumed that CWSA was negligible in this study.

2.2.8. Theil–Sen Median Trend Analysis and Mann–Kendall Test

Theil–Sen Median trend analysis and the Mann–Kendall test were used to analyze the GWSA time series trends. Sen’s nonparametric statistical method was used to calculate the variations in the slope of GWSA trend, and the slope was expressed as the median value, which was calculated as follows:
β = Median x j x i j i
where j > i, i is any integer, β > 0 means that the GWSA temporal change shows an increasing trend, and β < 0 implies that the GWSA temporal change follows a decreasing trend.
Mann–Kendall trend test method can effectively distinguish whether the groundwater change process is in natural fluctuation or if there is a definite change trend. Mann–Kendall is also used to verify the significance of the Sen trend. The formula of Mann–Kendall test is as follows:
S = i = 1 n 1 j = i + 1 n sgn x j x i
where   x j and x i   denote the corresponding year data, n denotes the length of the time series, and sgn x j x i   is the sign function. The test statistic Z was applied to test the trend, and the Z value was calculated as follows:
Z = S Var S     ( S > 0 )   0             ( S = 0 ) S + 1 Var S     ( S < 0 )
where Var was calculated as follows:
Var(S) = n ( n 1 ) ( 2 n + 5 ) 18
Taking the length of time series n = 20, the Sen trend analysis and Z test values were combined to divide the results of significance test at 0.05 confidence level. When β > 0, Z > 1.96 or Z < −1.96, an increasing trend of temporal changes in GWSA is observed, and when β < 0, Z > 1.96, or Z < −1.96, a decreasing trend of temporal change of GWSA is obtained.

3. Results

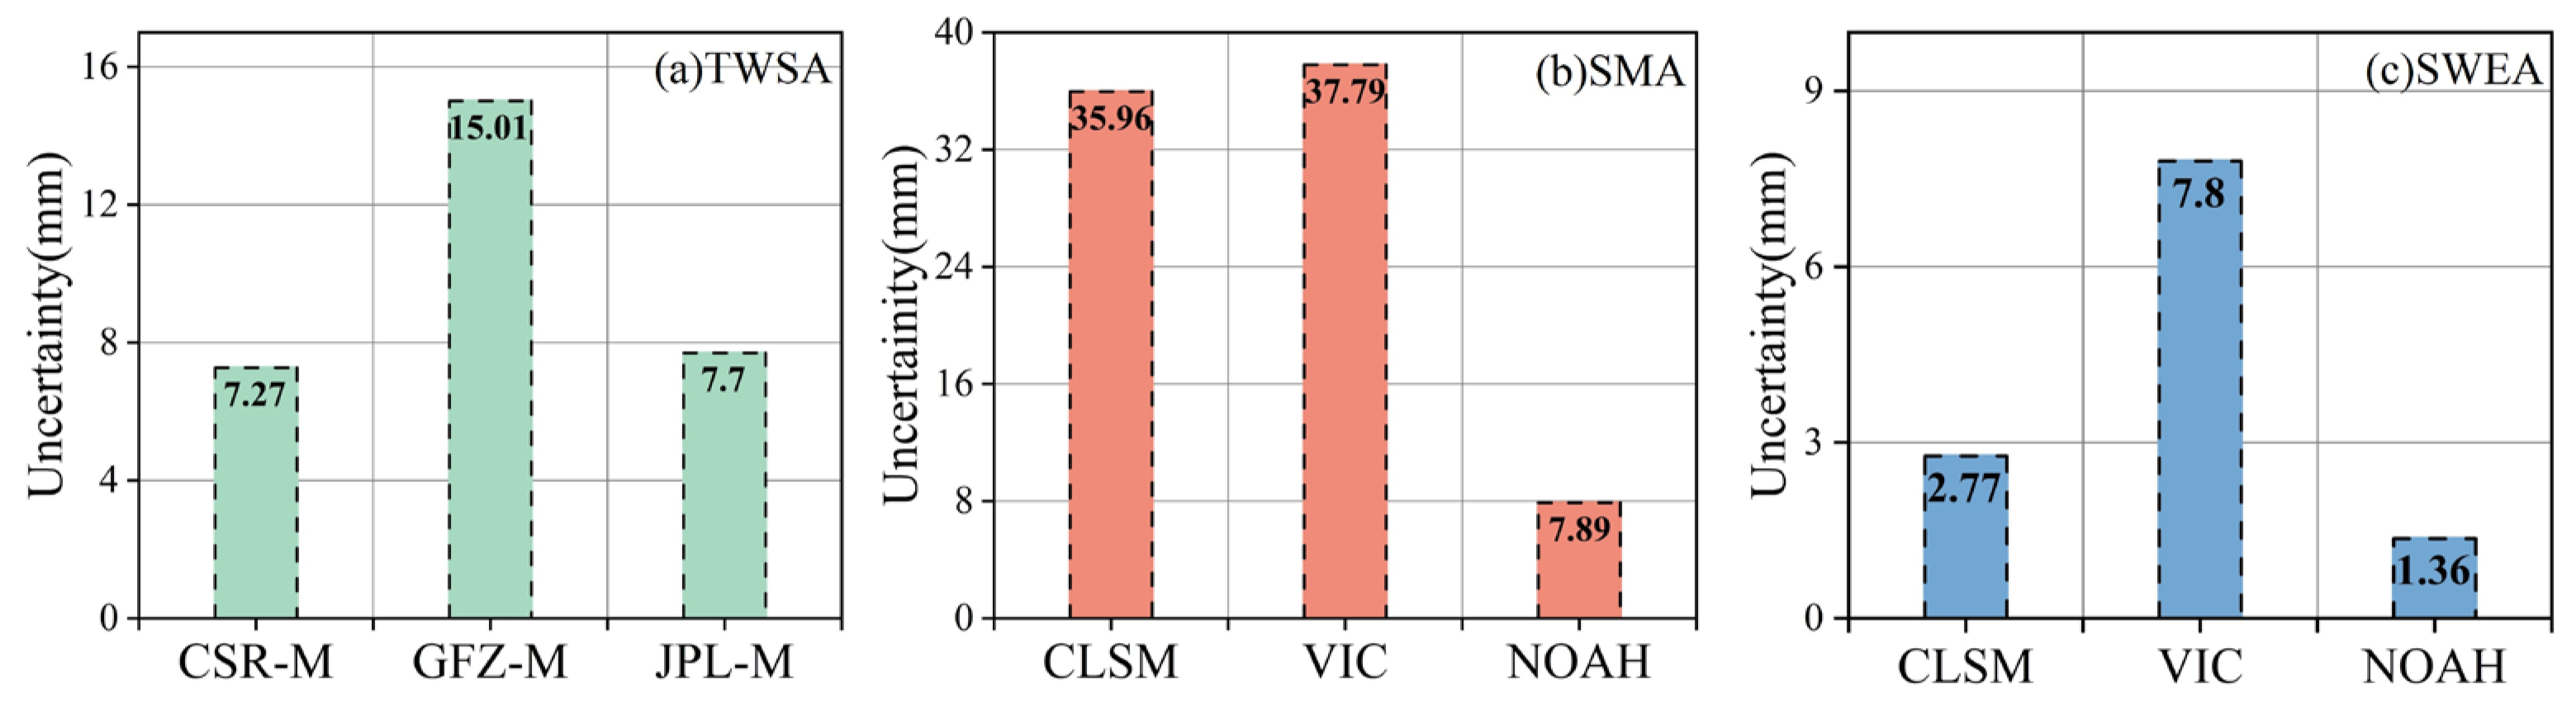
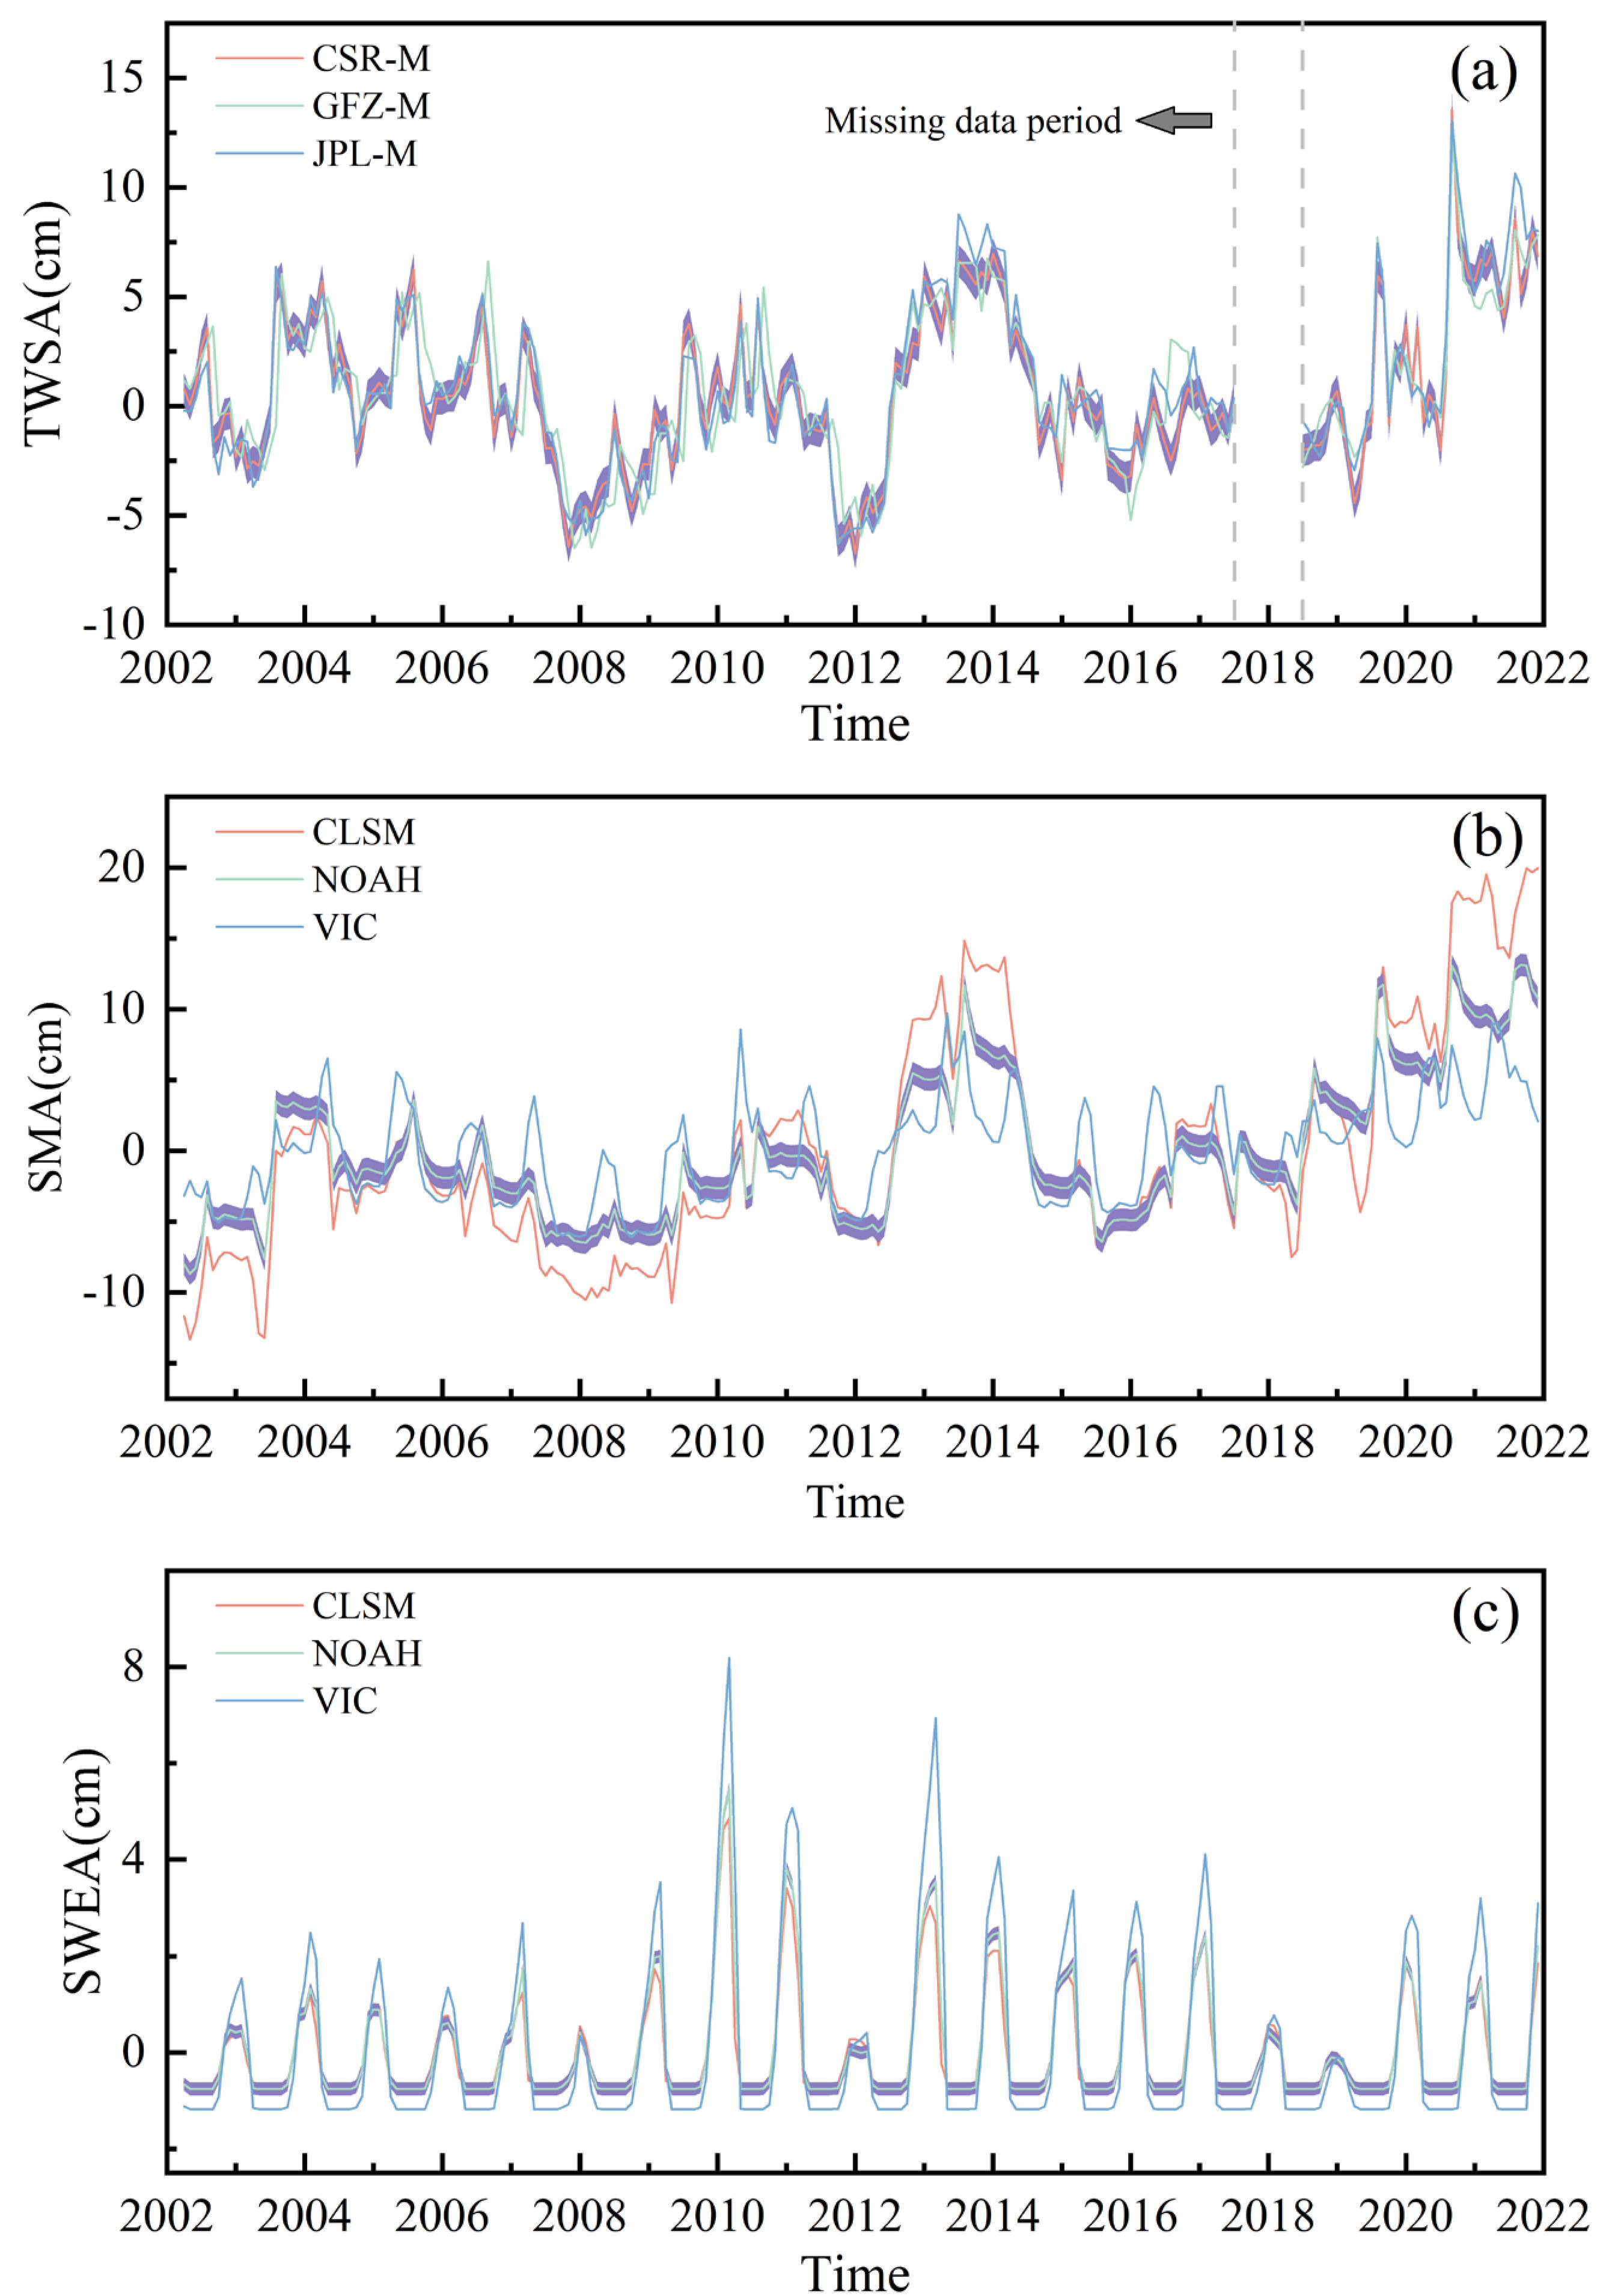
3.1. Uncertainty Analysis on TWSA, SMA, and SWEA Variations

The relative uncertainties of the different products of TWSA, SMA, and SWEA derived by the TCH method were estimated (Figure 3). The consistency of the three TWSA products within the total three provinces is good with average correlation coefficients within the range of 0.88–0.96. For TWSA, the highest uncertainty was found for the GFZ-M product (15.01 mm), followed by JPL-M (7.7 mm), and the lowest uncertainty was found for the CSR-M solution (7.27 mm). For SMA and SWEA, the NOAH product had the lowest uncertainty (estimated to be 7.89 mm and 1.36 mm). Therefore, the CSR Mascon product and NOAH data were selected to calculate GWSA. The long-term trends of TWSA, SMA, and SWEA products are shown in Figure 4.

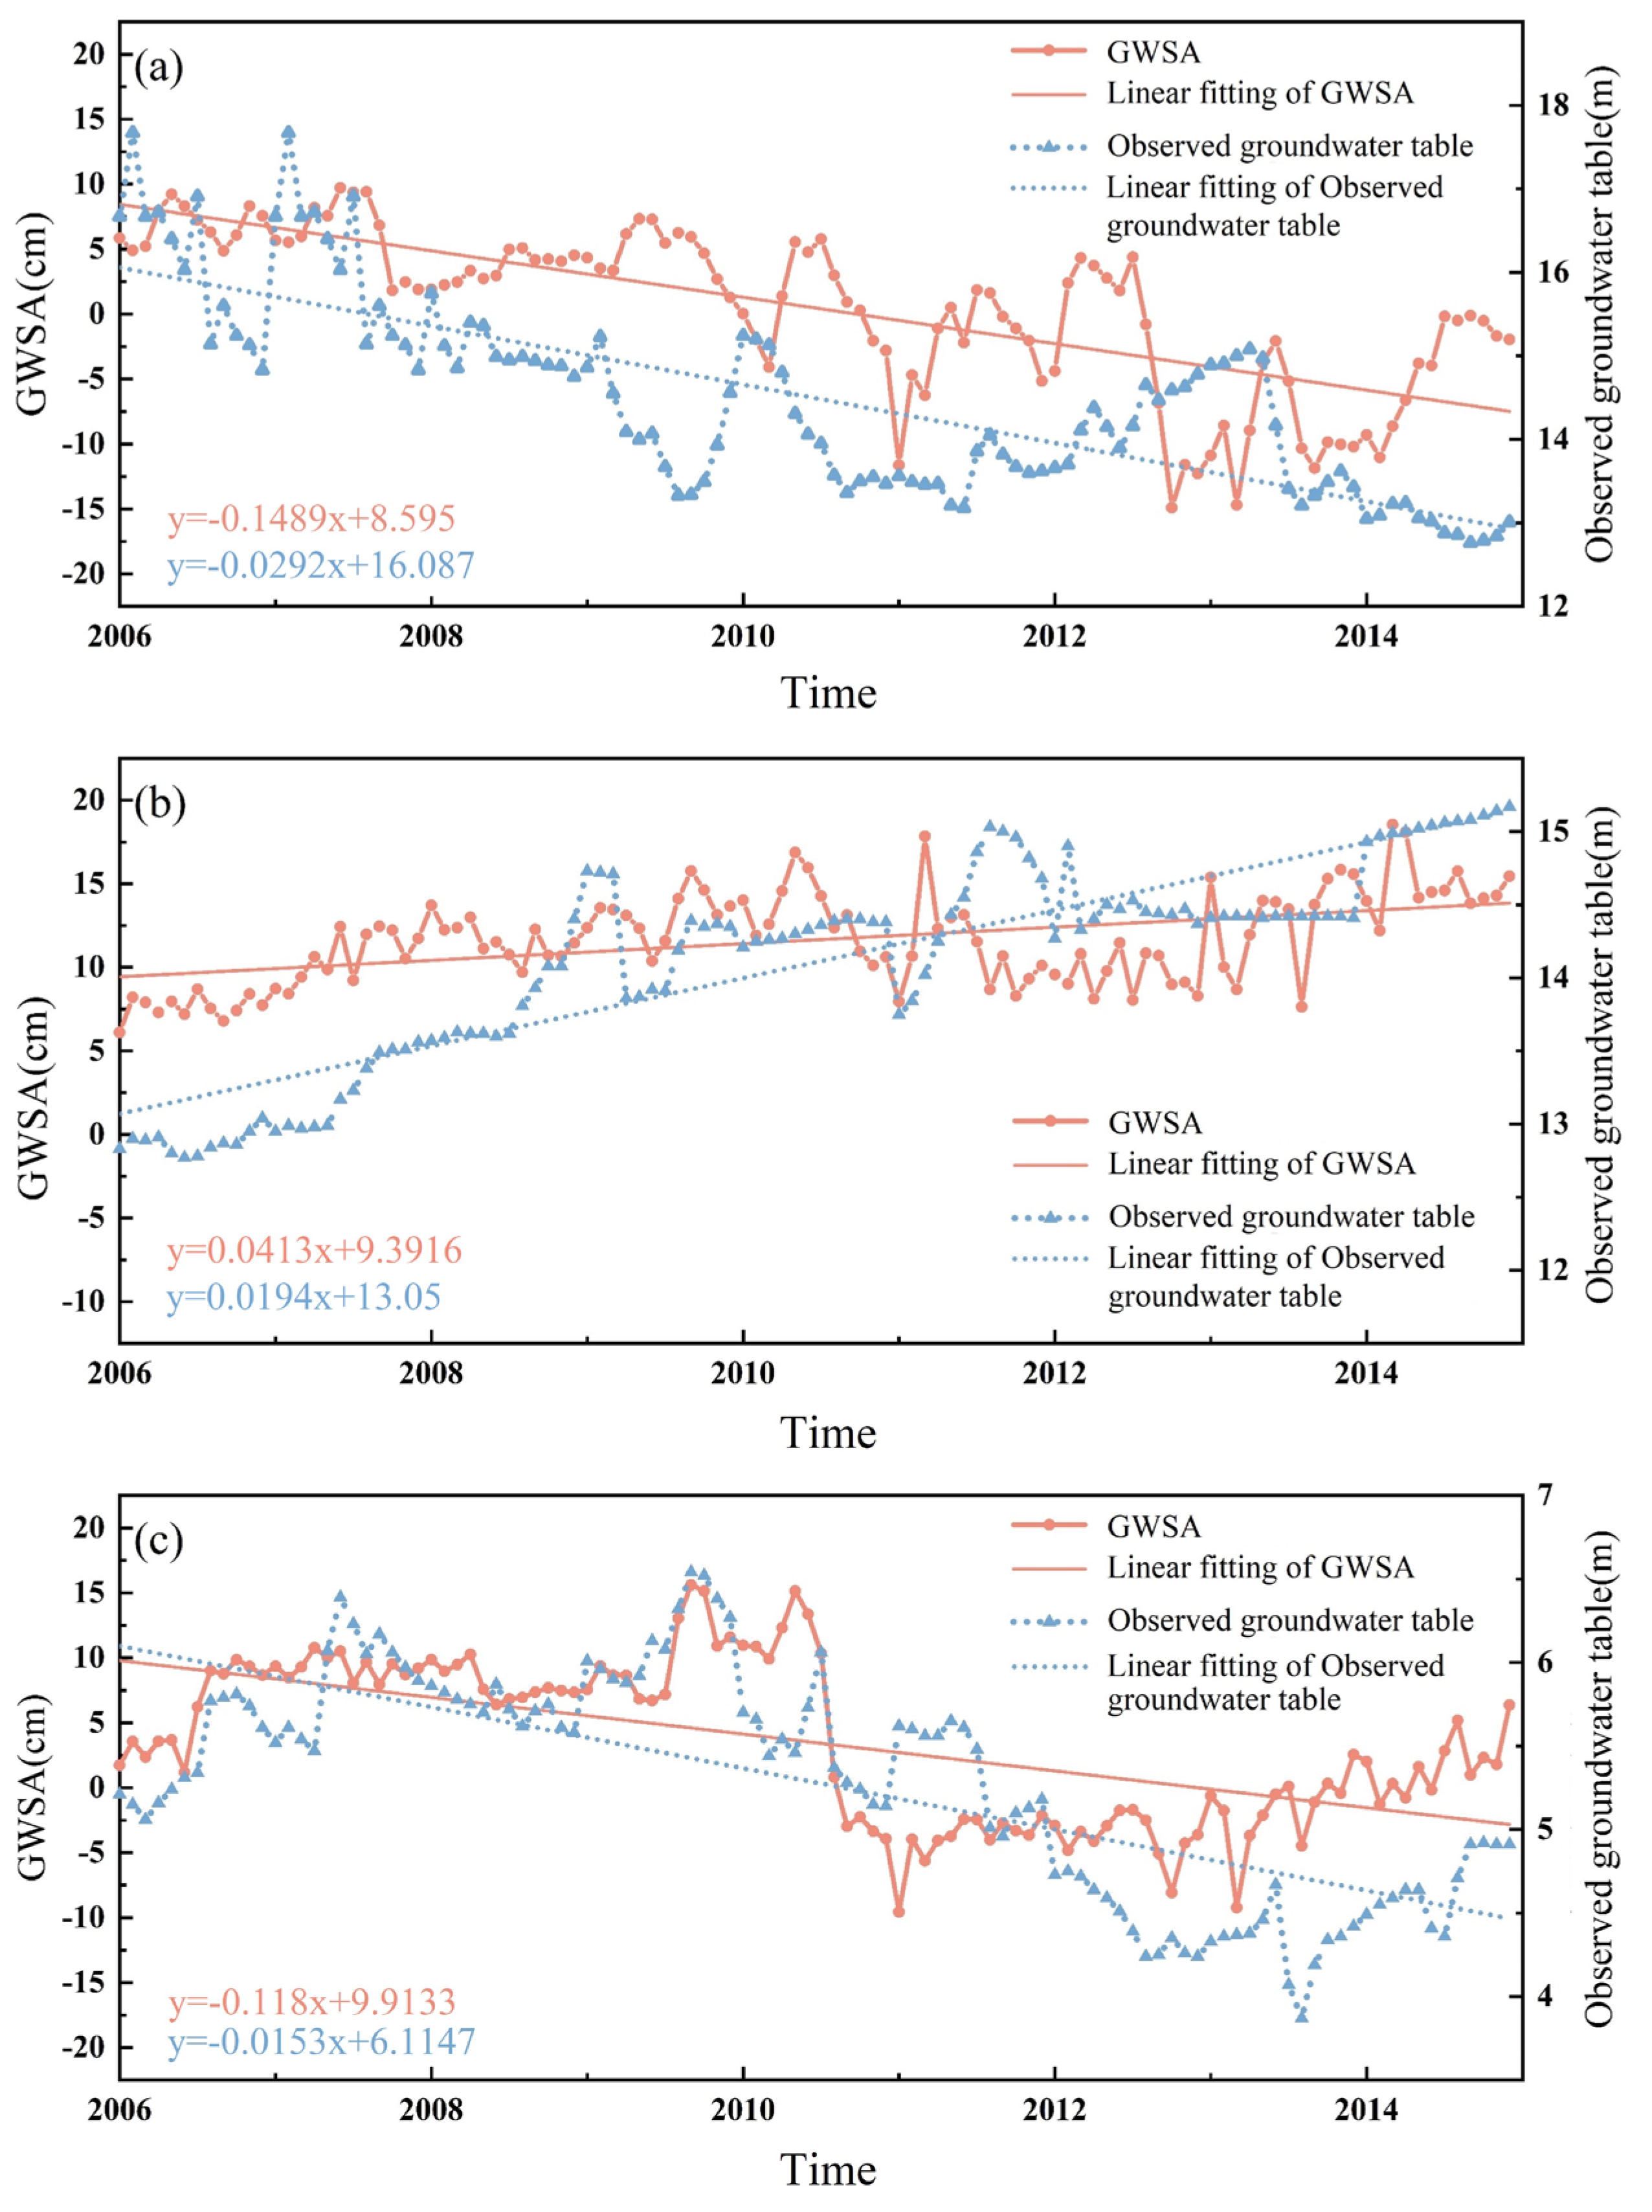
3.2. Validation of the Inversion Results

To testify the accuracy of the GWSA data, groundwater table data of three selected groundwater observation wells in three provinces were compared with the GRACE-derived GWSA of the 0.25° × 0.25° grid to verify the GRACE-derived GWSA in the corresponding period. Groundwater observation well data for 2006–2015 for the three provinces were selected for comparison due to the problems of missing months in individual years, discontinuous monitoring time, and anomalous fluctuations in the values of the observation well data. The comparison results are shown in Figure 5. The GWSA and the measured groundwater table trends and amplitudes showed good agreement, with same profit and loss. The correlation coefficient between the two was 0.7, 0.53, and 0.51 for Liaoning, Heilongjiang, and Jilin provinces, respectively, thus showing a moderate correlation. This correlation was particularly evident in Liaoning Province. The measured groundwater table in Liaoning Province obtained from the groundwater table yearbook presented an increasing trend from 2006 to 2010 and a gradually decreasing trend from 2010 to 2013, which was identical to the trend of the GRACE data, thus verifying the accuracy of the GRACE inversion of the GWSA.

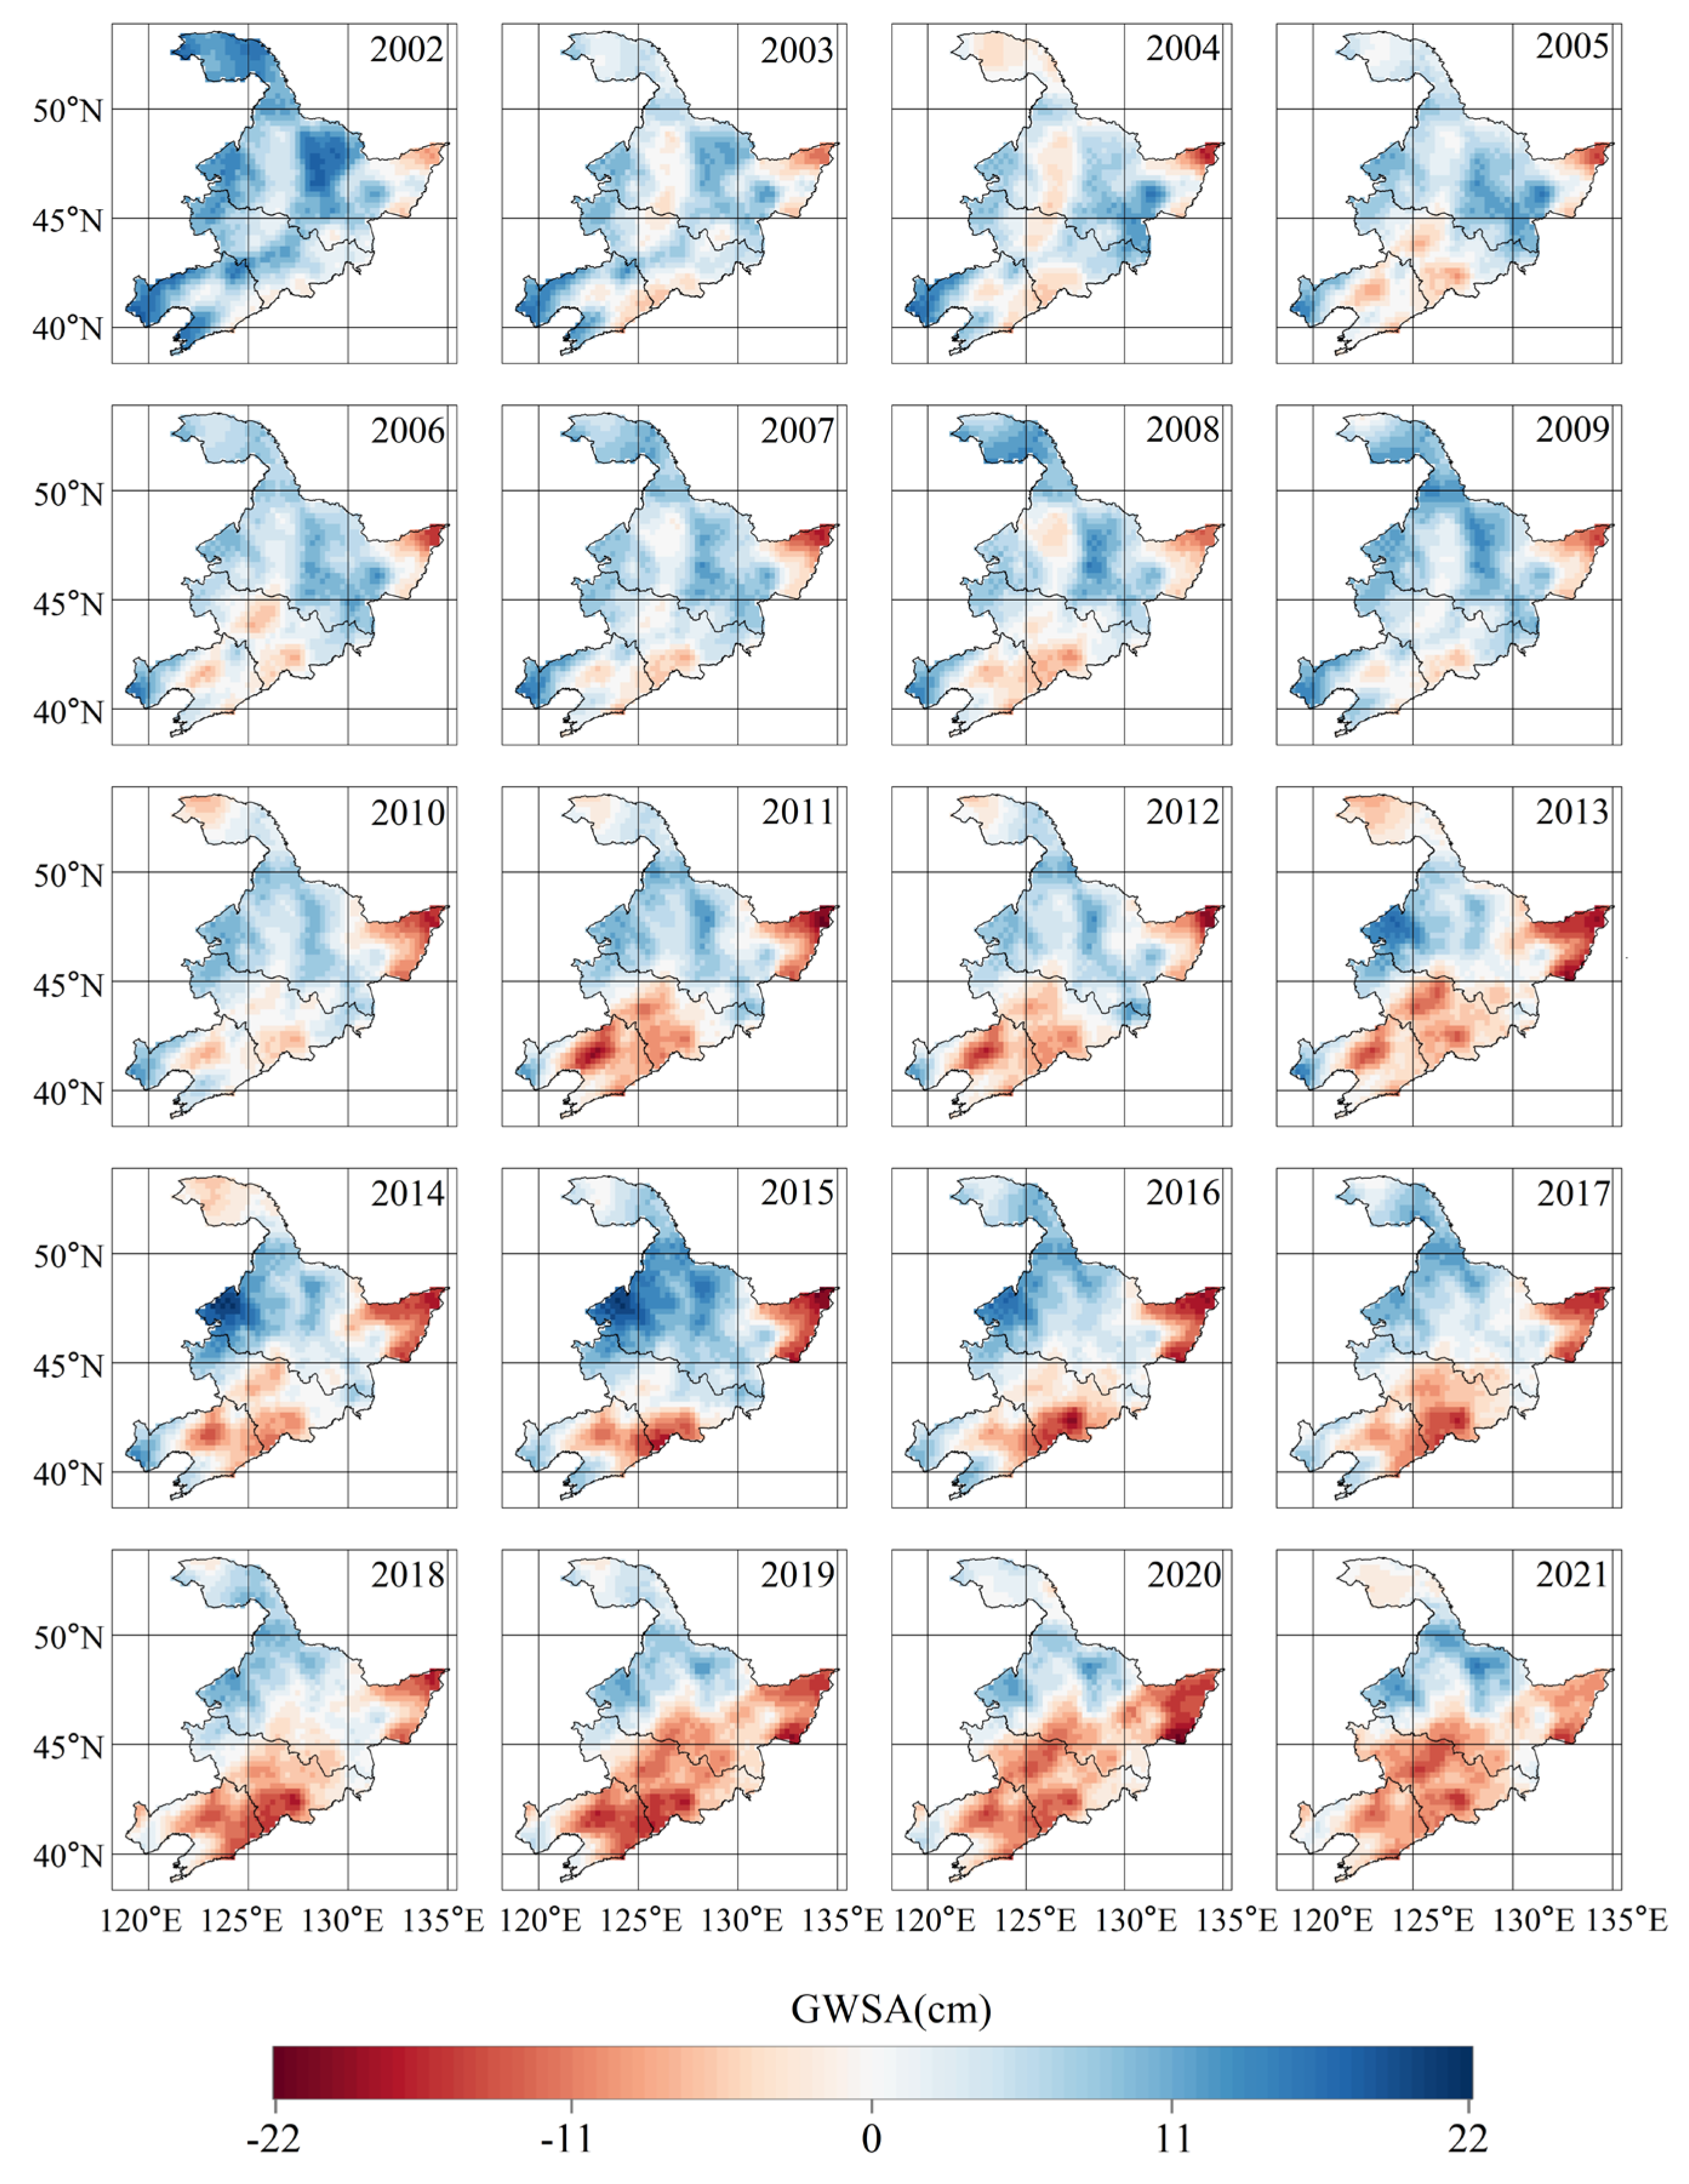
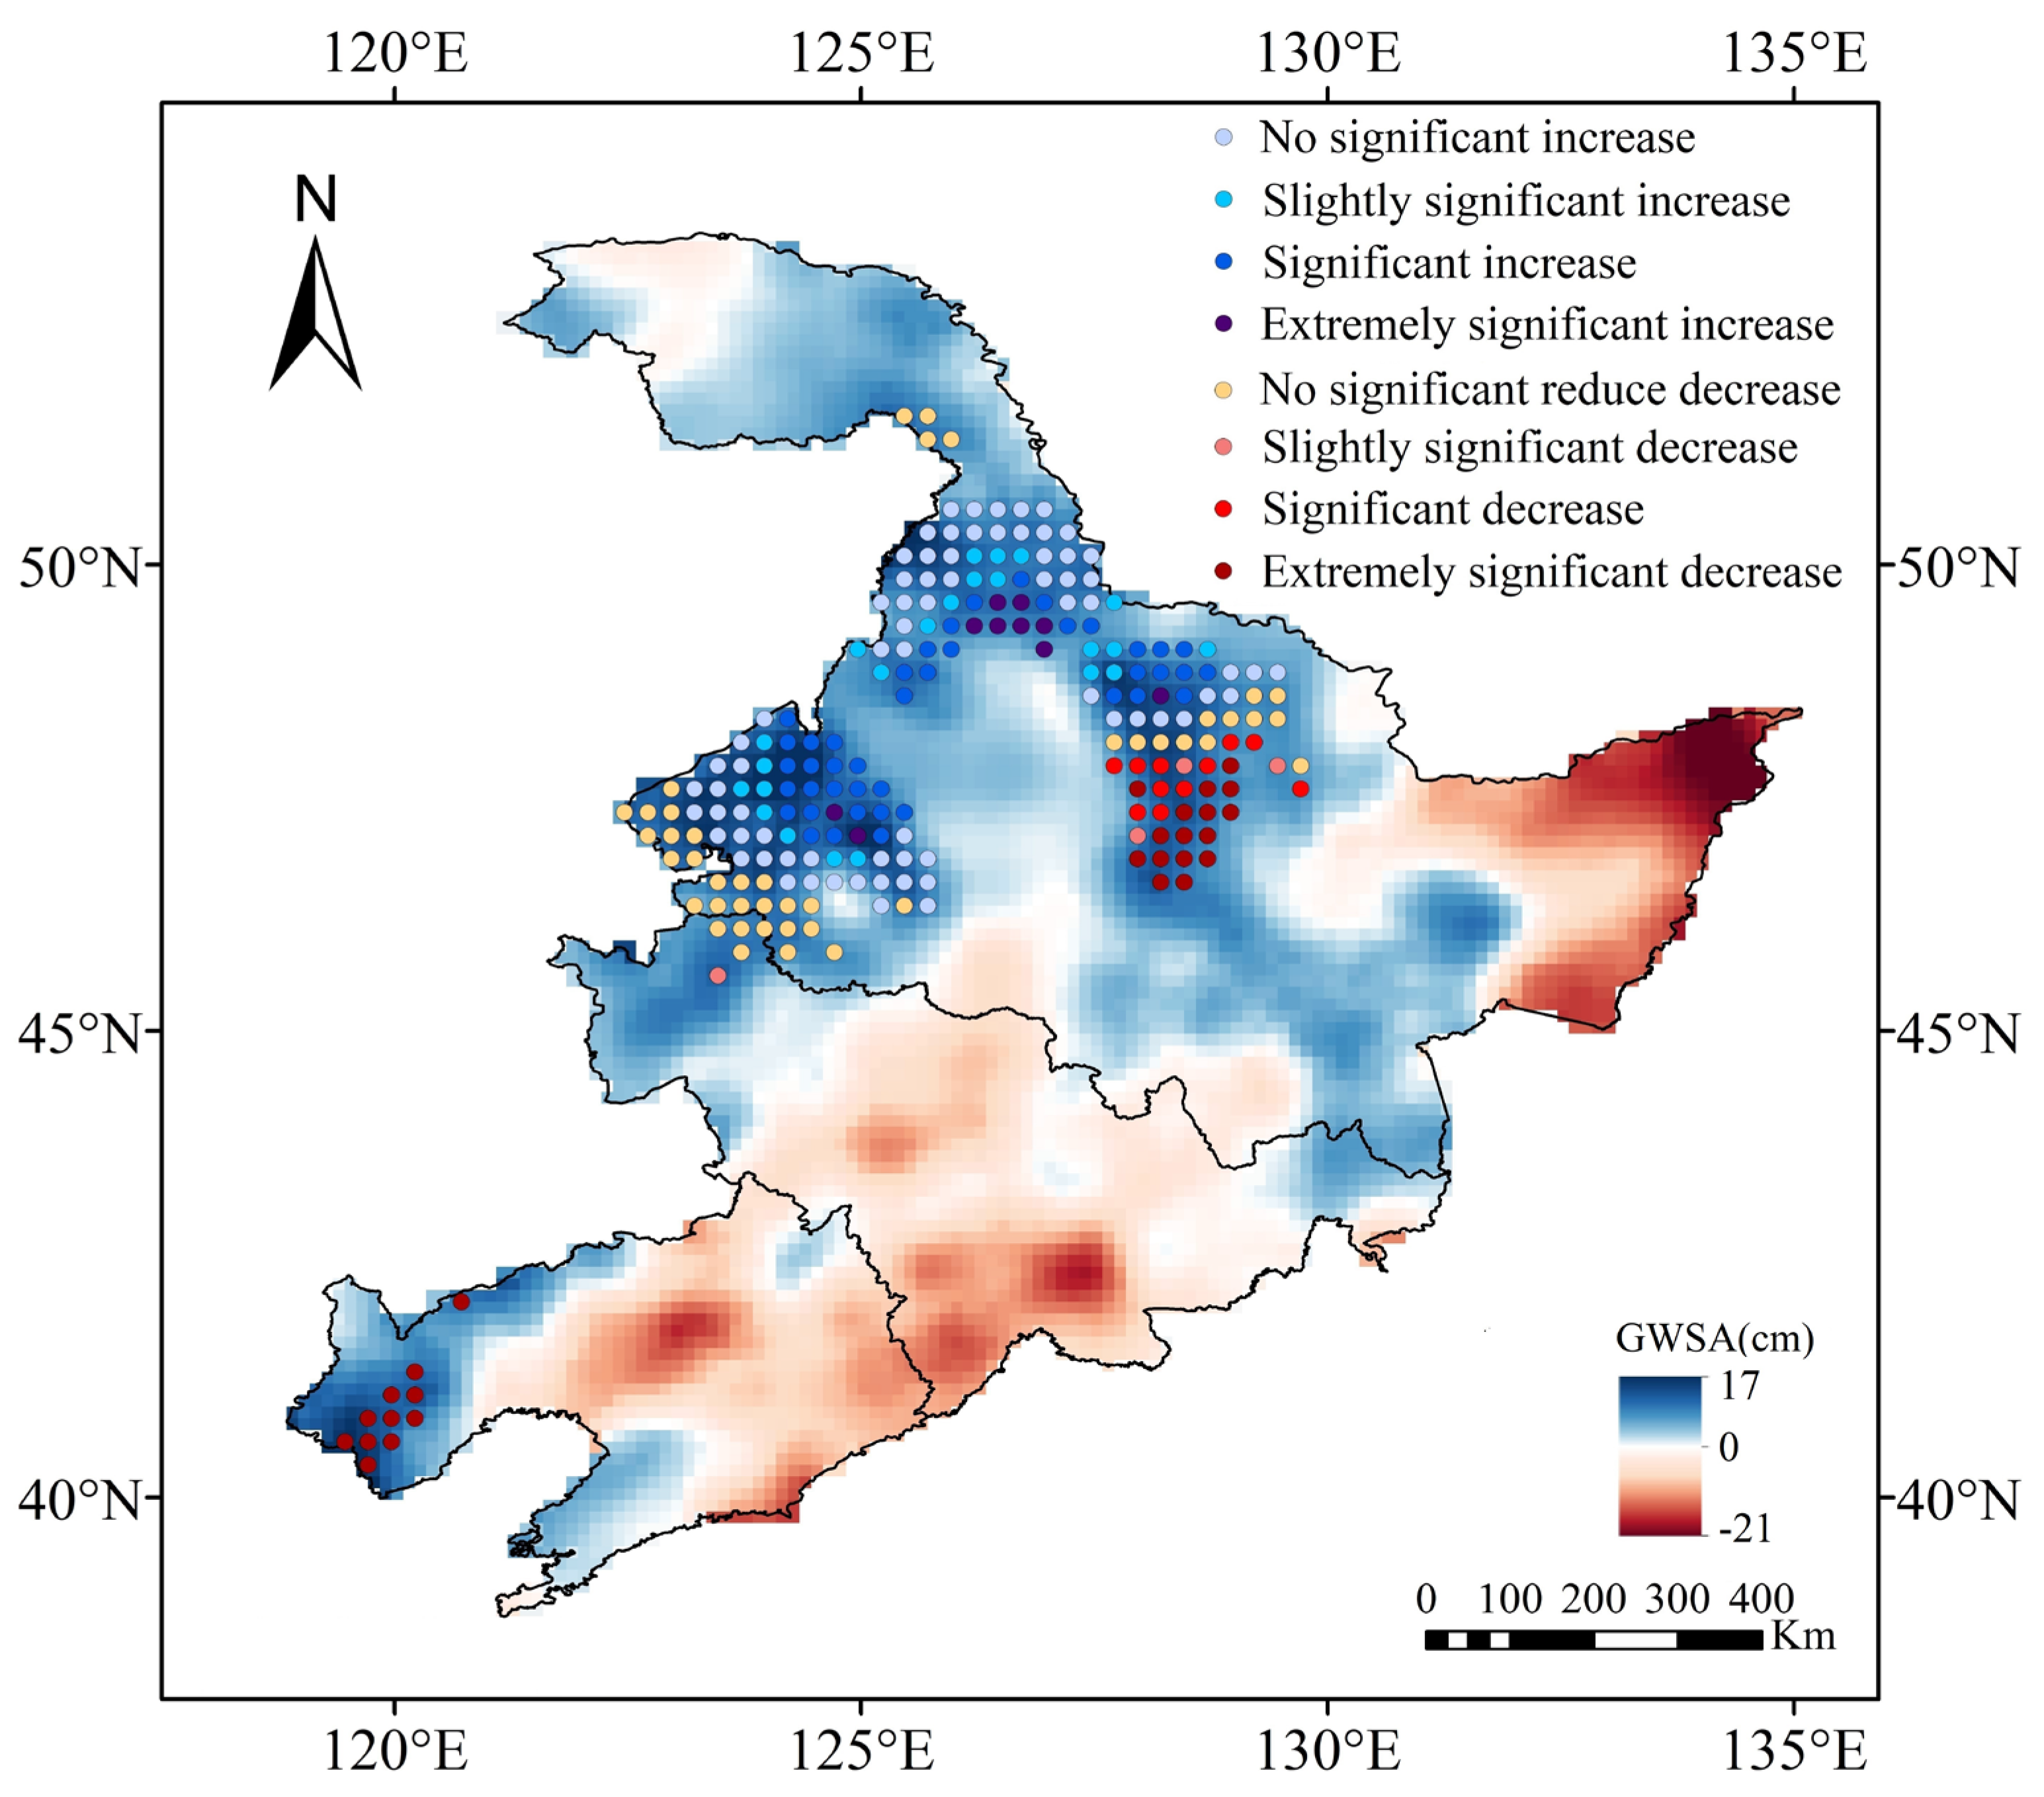
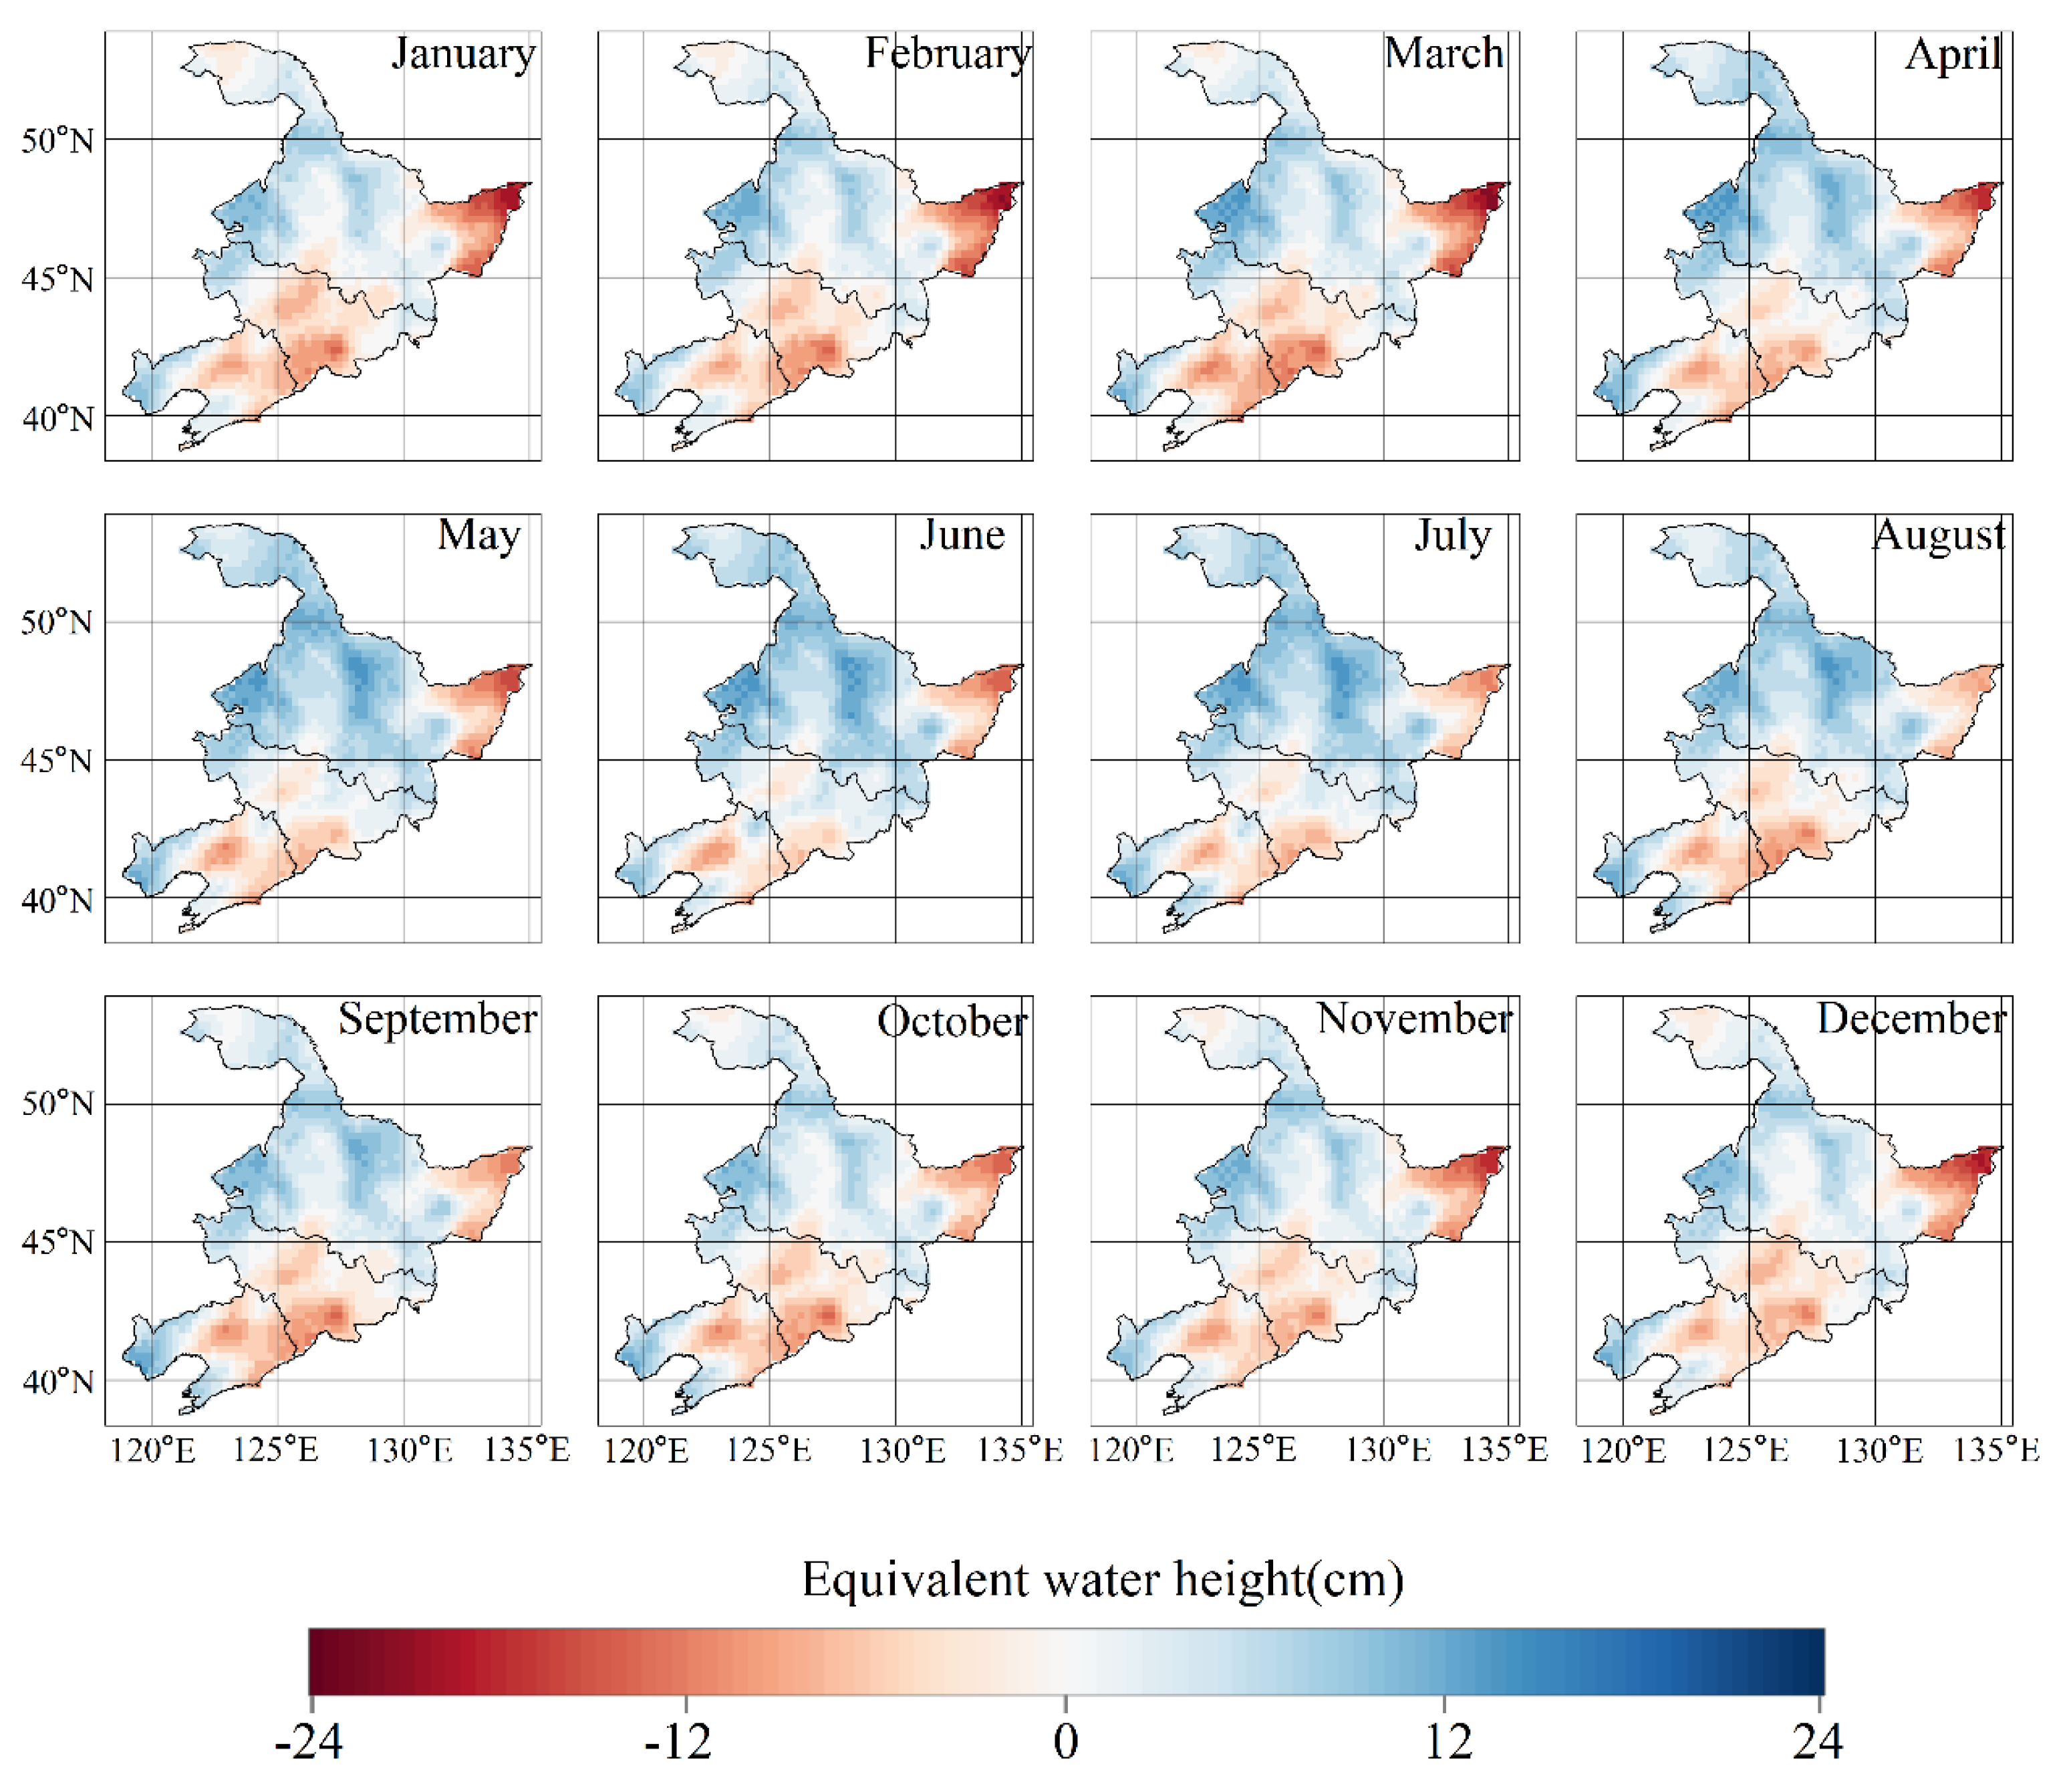
3.3. Variations in the Spatial Characteristics of GWSA

The GWSA clearly presented a severe spatial deficit in the southern region (Figure 6). In 2002–2010, deficits were observed in eastern Heilongjiang Province, southern and central Liaoning Province, and central and southern Jilin Province, but surpluses were observed in other areas. In 2011–2013, the southern part of Heilongjiang Province, the entire Jilin Province, and most parts of Liaoning Province showed serious losses in GWS. However, in 2014–2015, the deficits in the three provinces were alleviated and the areas with losses were reduced. In 2016–2021, the area of GWS deficit increased substantially, except for the western part of Heilongjiang Province. During 2002–2021, the overall rate of change in GWSA in the northeastern black soil region was approximately −0.4204 cm/a. Among them, the rate of GWSA in Heilongjiang Province was the smallest, fluctuating and decreasing at a rate of −0.2786 cm/a, followed by Jilin Province with a rate of change in GWSA of −0.5923 cm/a, and Liaoning Province with the largest rate of change of approximately −0.6694 cm/a.
A combination of the Theil–Sen method and Mann–Kendall significance test was used to measure the trend of spatial variation in the GWSA (Figure 7). Only a small proportion of areas passed the significance test, such as western, central, and northern Heilongjiang Province, northwestern Jilin Province, and western Liaoning Province. Other areas did not pass the significance test, probably due to marginal variations in GWSA, irregular profits and losses, and insignificant differences. GWS may have experienced a continuous rise or fall during the period of 2002–2021, but the overall maximum and minimum trends in the rate of change obtained during the period were 17 cm/a and −21 cm/a, respectively. However, based on the rate of change in GWSA from 2002 to 2021, it can be concluded that the GWSA in the study area generally showed a spatial increasing trend in the northern parts and decreasing trends in the southern parts. GWSA in eastern Heilongjiang Province, central and southern Jilin Province, and central and eastern Liaoning Province showed serious deficits. The GWSA in northwestern and southern Heilongjiang Province and northern and eastern Jilin Province showed smaller deficits, while the GWSA in other regions showed surpluses. The groundwater deficit trend in eastern Heilongjiang Province was −0.6 cm/a, and that in southern Jilin Province was the most serious with −0.7471 cm/a. The long-term trend of the GWSA had significant spatial differences.

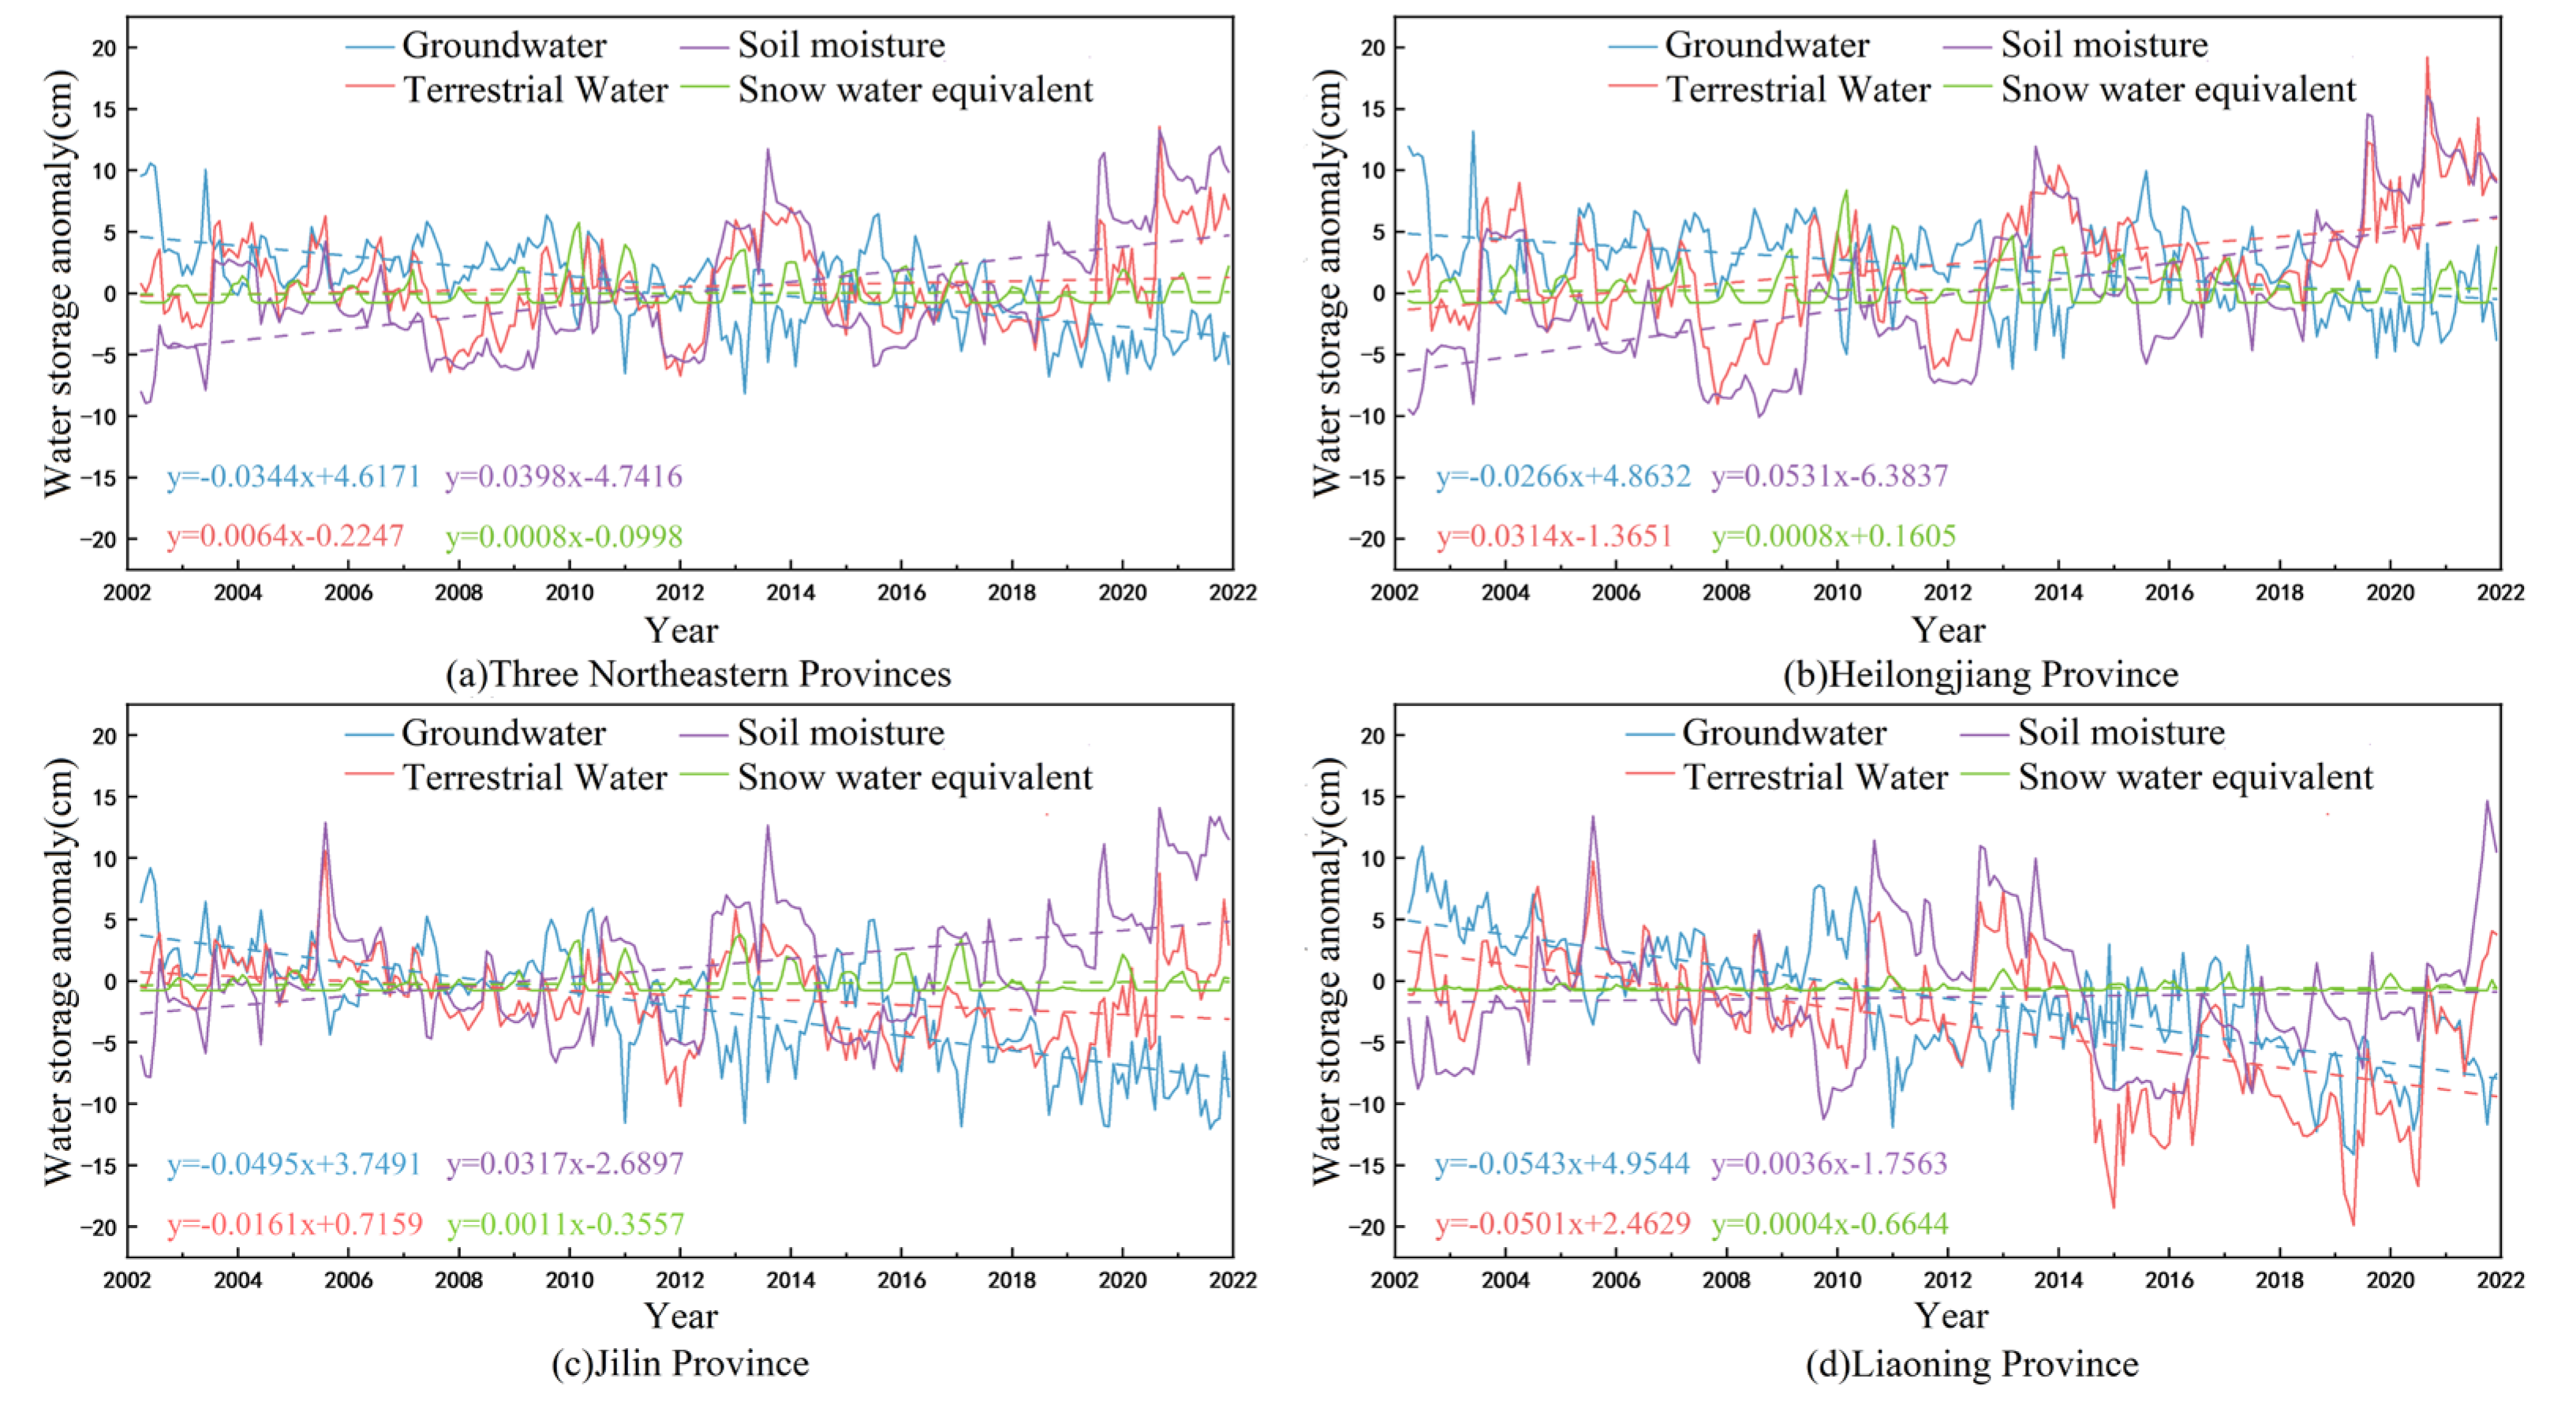
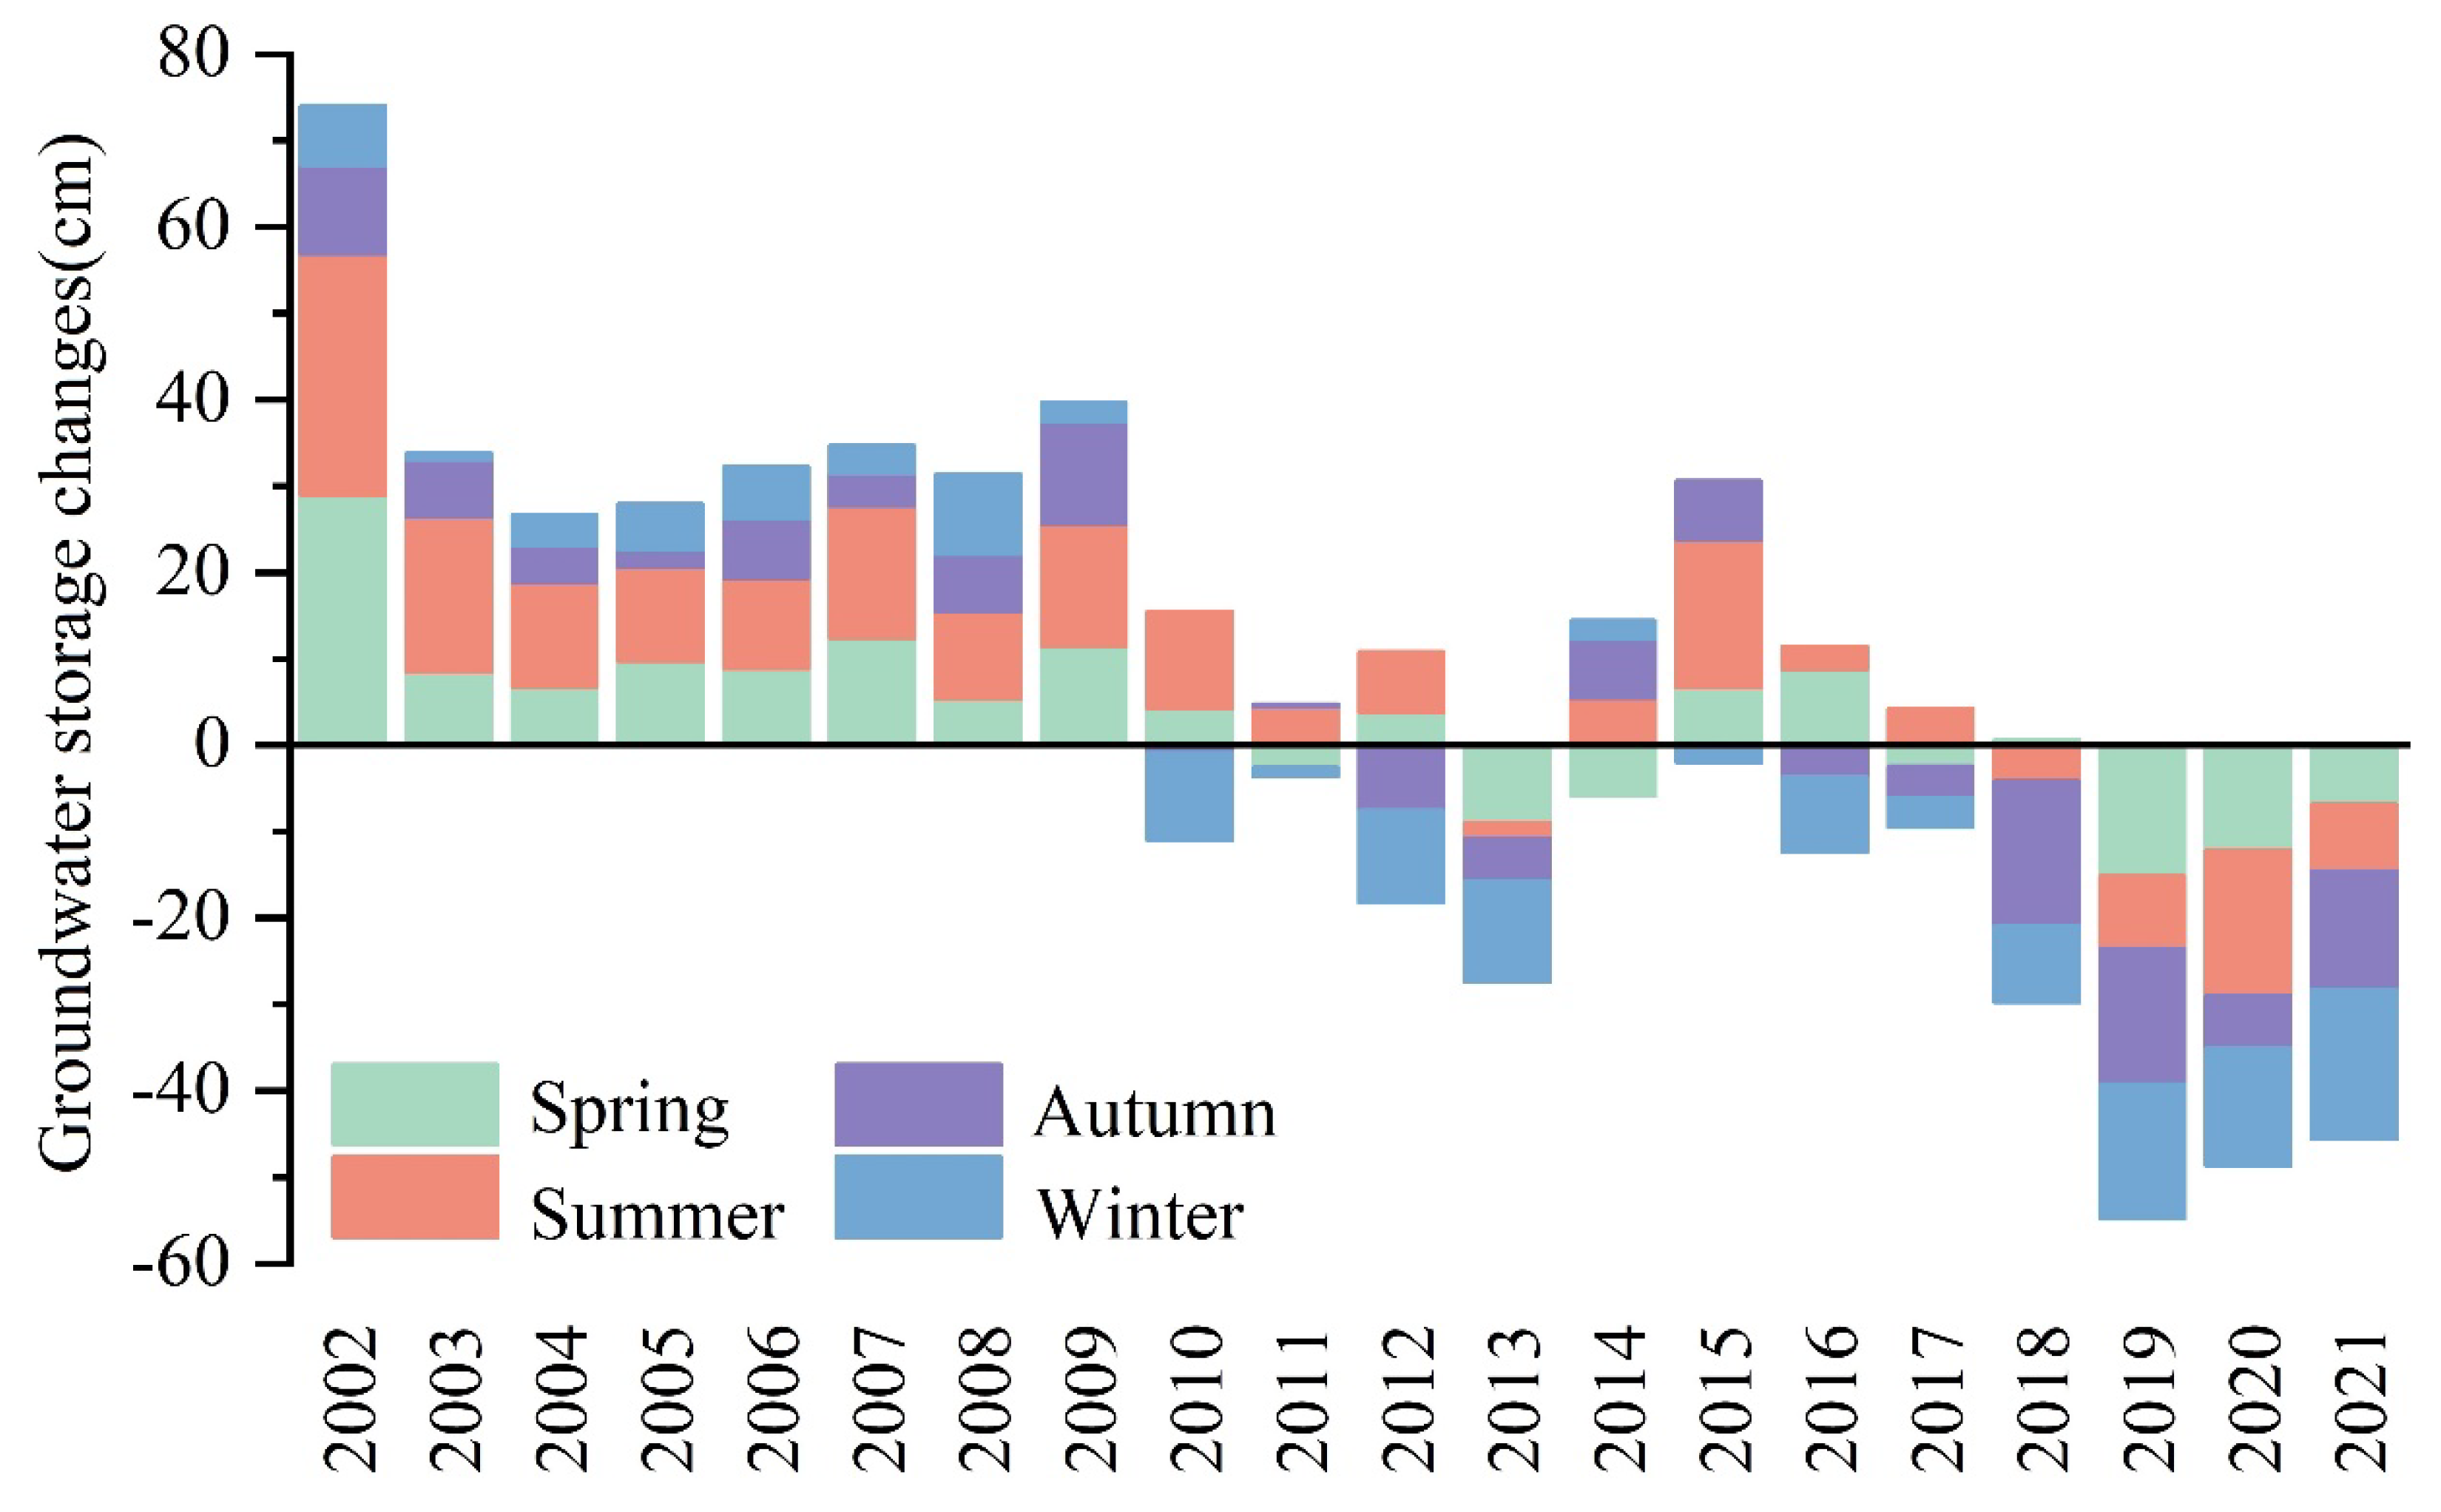
3.4. Variations in the Temporal Characteristics of GWSA

The time series of TWSA, GWSA, SMA, and SWEA in the northeastern black soil region are shown in Figure 8. During the period of 2002–2021, the overall GWSA of the three provinces shows a decreasing trend (−0.0344 cm/month). The TWSA showed a decreasing trend except in Heilongjiang Province. The SMA in all three provinces showed an increasing trend, and the SWEA was relatively stable. Among them, the GWSA in Liaoning Province exhibited the most pronounced deficit (−0.0543 cm/month), followed by Jilin Province and Heilongjiang Province, with the rates of change of −0.0495 cm/month and −0.0266 cm/month, respectively. The TWSA change rates of Liaoning, Jilin, and Heilongjiang provinces were −0.0501 mm/month, −0.0161 cm/month, and 0.0314 cm/month respectively. The correlation coefficients among the components were calculated (Table 1), which shows that the TWSA and GWSA are most correlated with SMA. Soil moisture varied greatly due to the influence of evaporation. Groundwater was less affected by evaporation and was only affected by exploitation. The GWSA caused by groundwater exploitation was not enough to affect the change in the TWSA, implying that SMA remains the main cause of the TWSA. Further, GWSA showed a negative correlation with SMA (r = −0.7). This can be attributed to the increase in groundwater storage leads to a rise in the groundwater table and the original soil moisture becomes groundwater, so the soil moisture decreases, vice versa.
The GWSA of the study area in each season and the average of the monthly GWSA during 2002–2021 were measured to gain insights into the seasonal variations in the northeastern black soil region. As shown in Figure 9, a turning point in the GWSA appeared in 2010. The GWSA in all seasons was positive during 2002–2009, indicating that the GWSA in the northeastern black soil region was in surplus, while during 2010–2021, the GWSA of different seasons gradually changed from a state of alternating positive and negative to a total loss. The multiyear monthly GWSA characteristics of the northeastern black soil region (Figure 10) showed that partial GWSA deficits mainly occurred in eastern Heilongjiang Province, central and southern Jilin Province, and central and eastern Liaoning Province. The regional GWSA had a large deficit from April to September at a decreasing rate of 0.4466 cm/a, 0.4293 cm/a, 0.5620 cm/a, 0.4876 cm/a, 0.4428 cm/a, and 0.4138 cm/a, which were all >0.40 cm/a; additionally, a relatively light deficit from January to March and October to December at decreasing rates of 0.3783 cm/a, 0.3334 cm/a, 0.3749 cm/a, 0.2961 cm/a, and 0.3934 cm/a were observed, which were all below 0.40 cm/a. Although the precipitation during the irrigation period was relatively sufficient, groundwater storage was depleted by agricultural water use, resulting in high deficits in the GWSA mainly during the irrigation period. In other periods, due to the reduction of groundwater consumption, the GWSA deficits eased.

4. Discussion

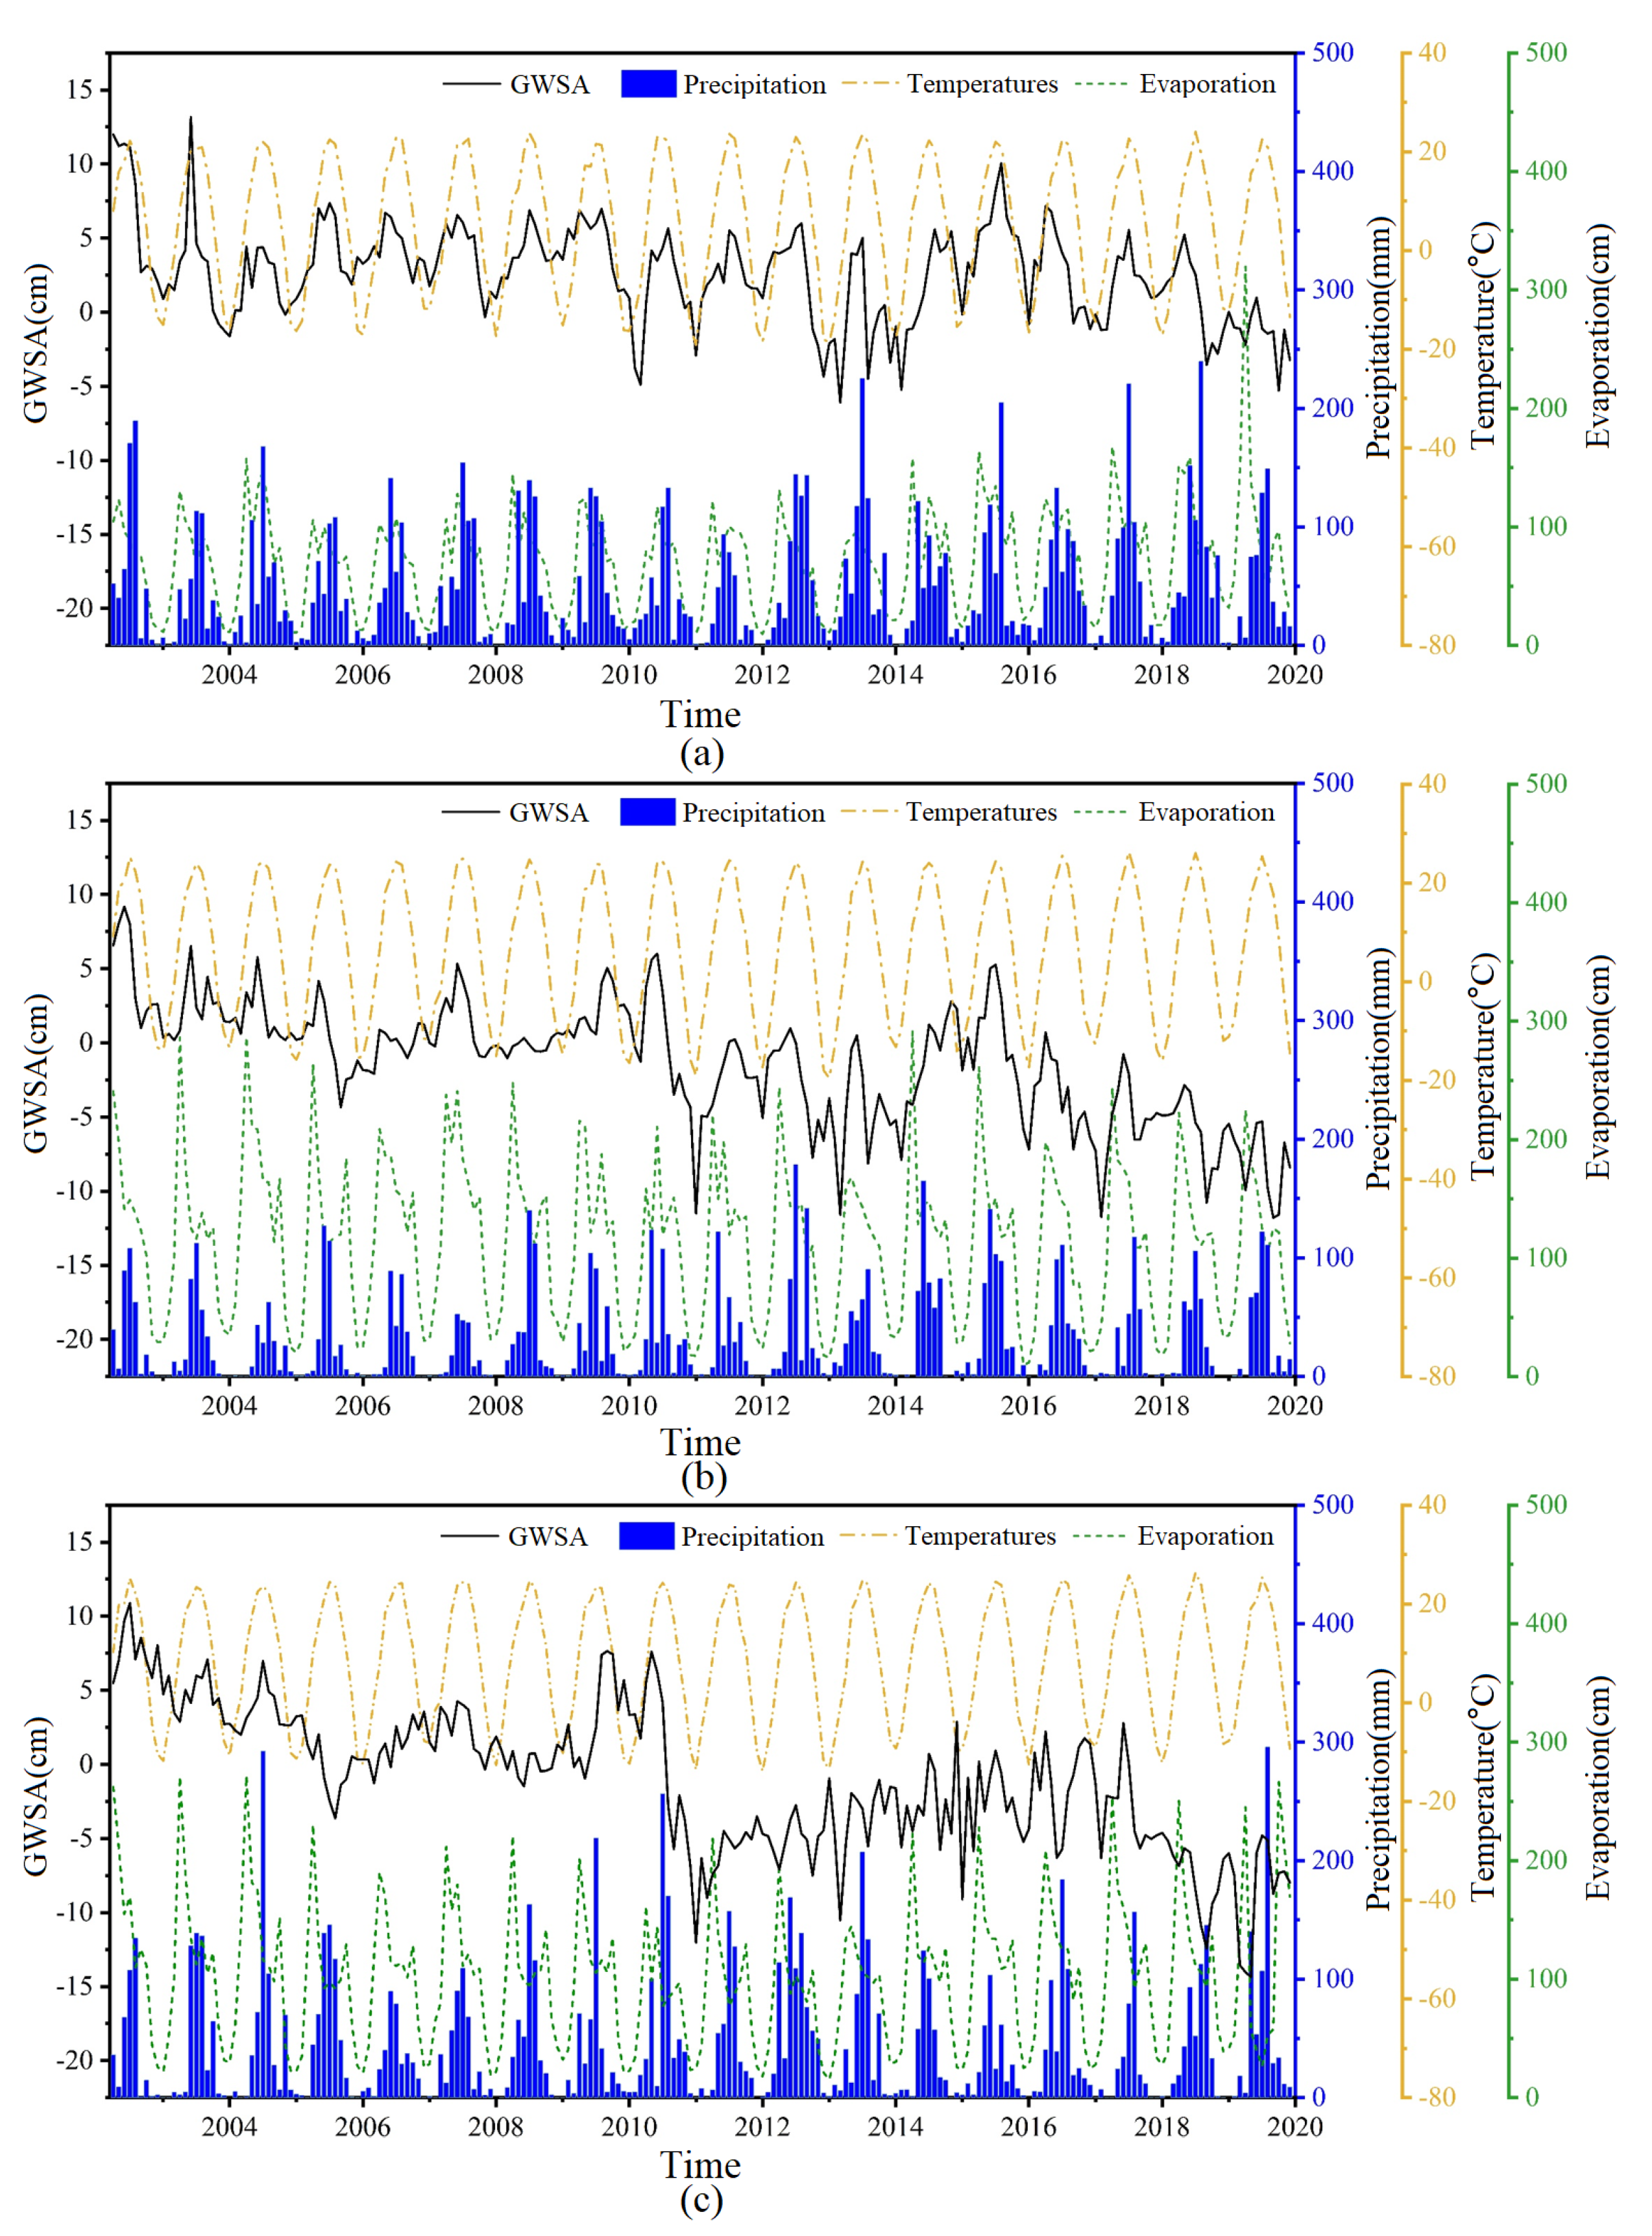
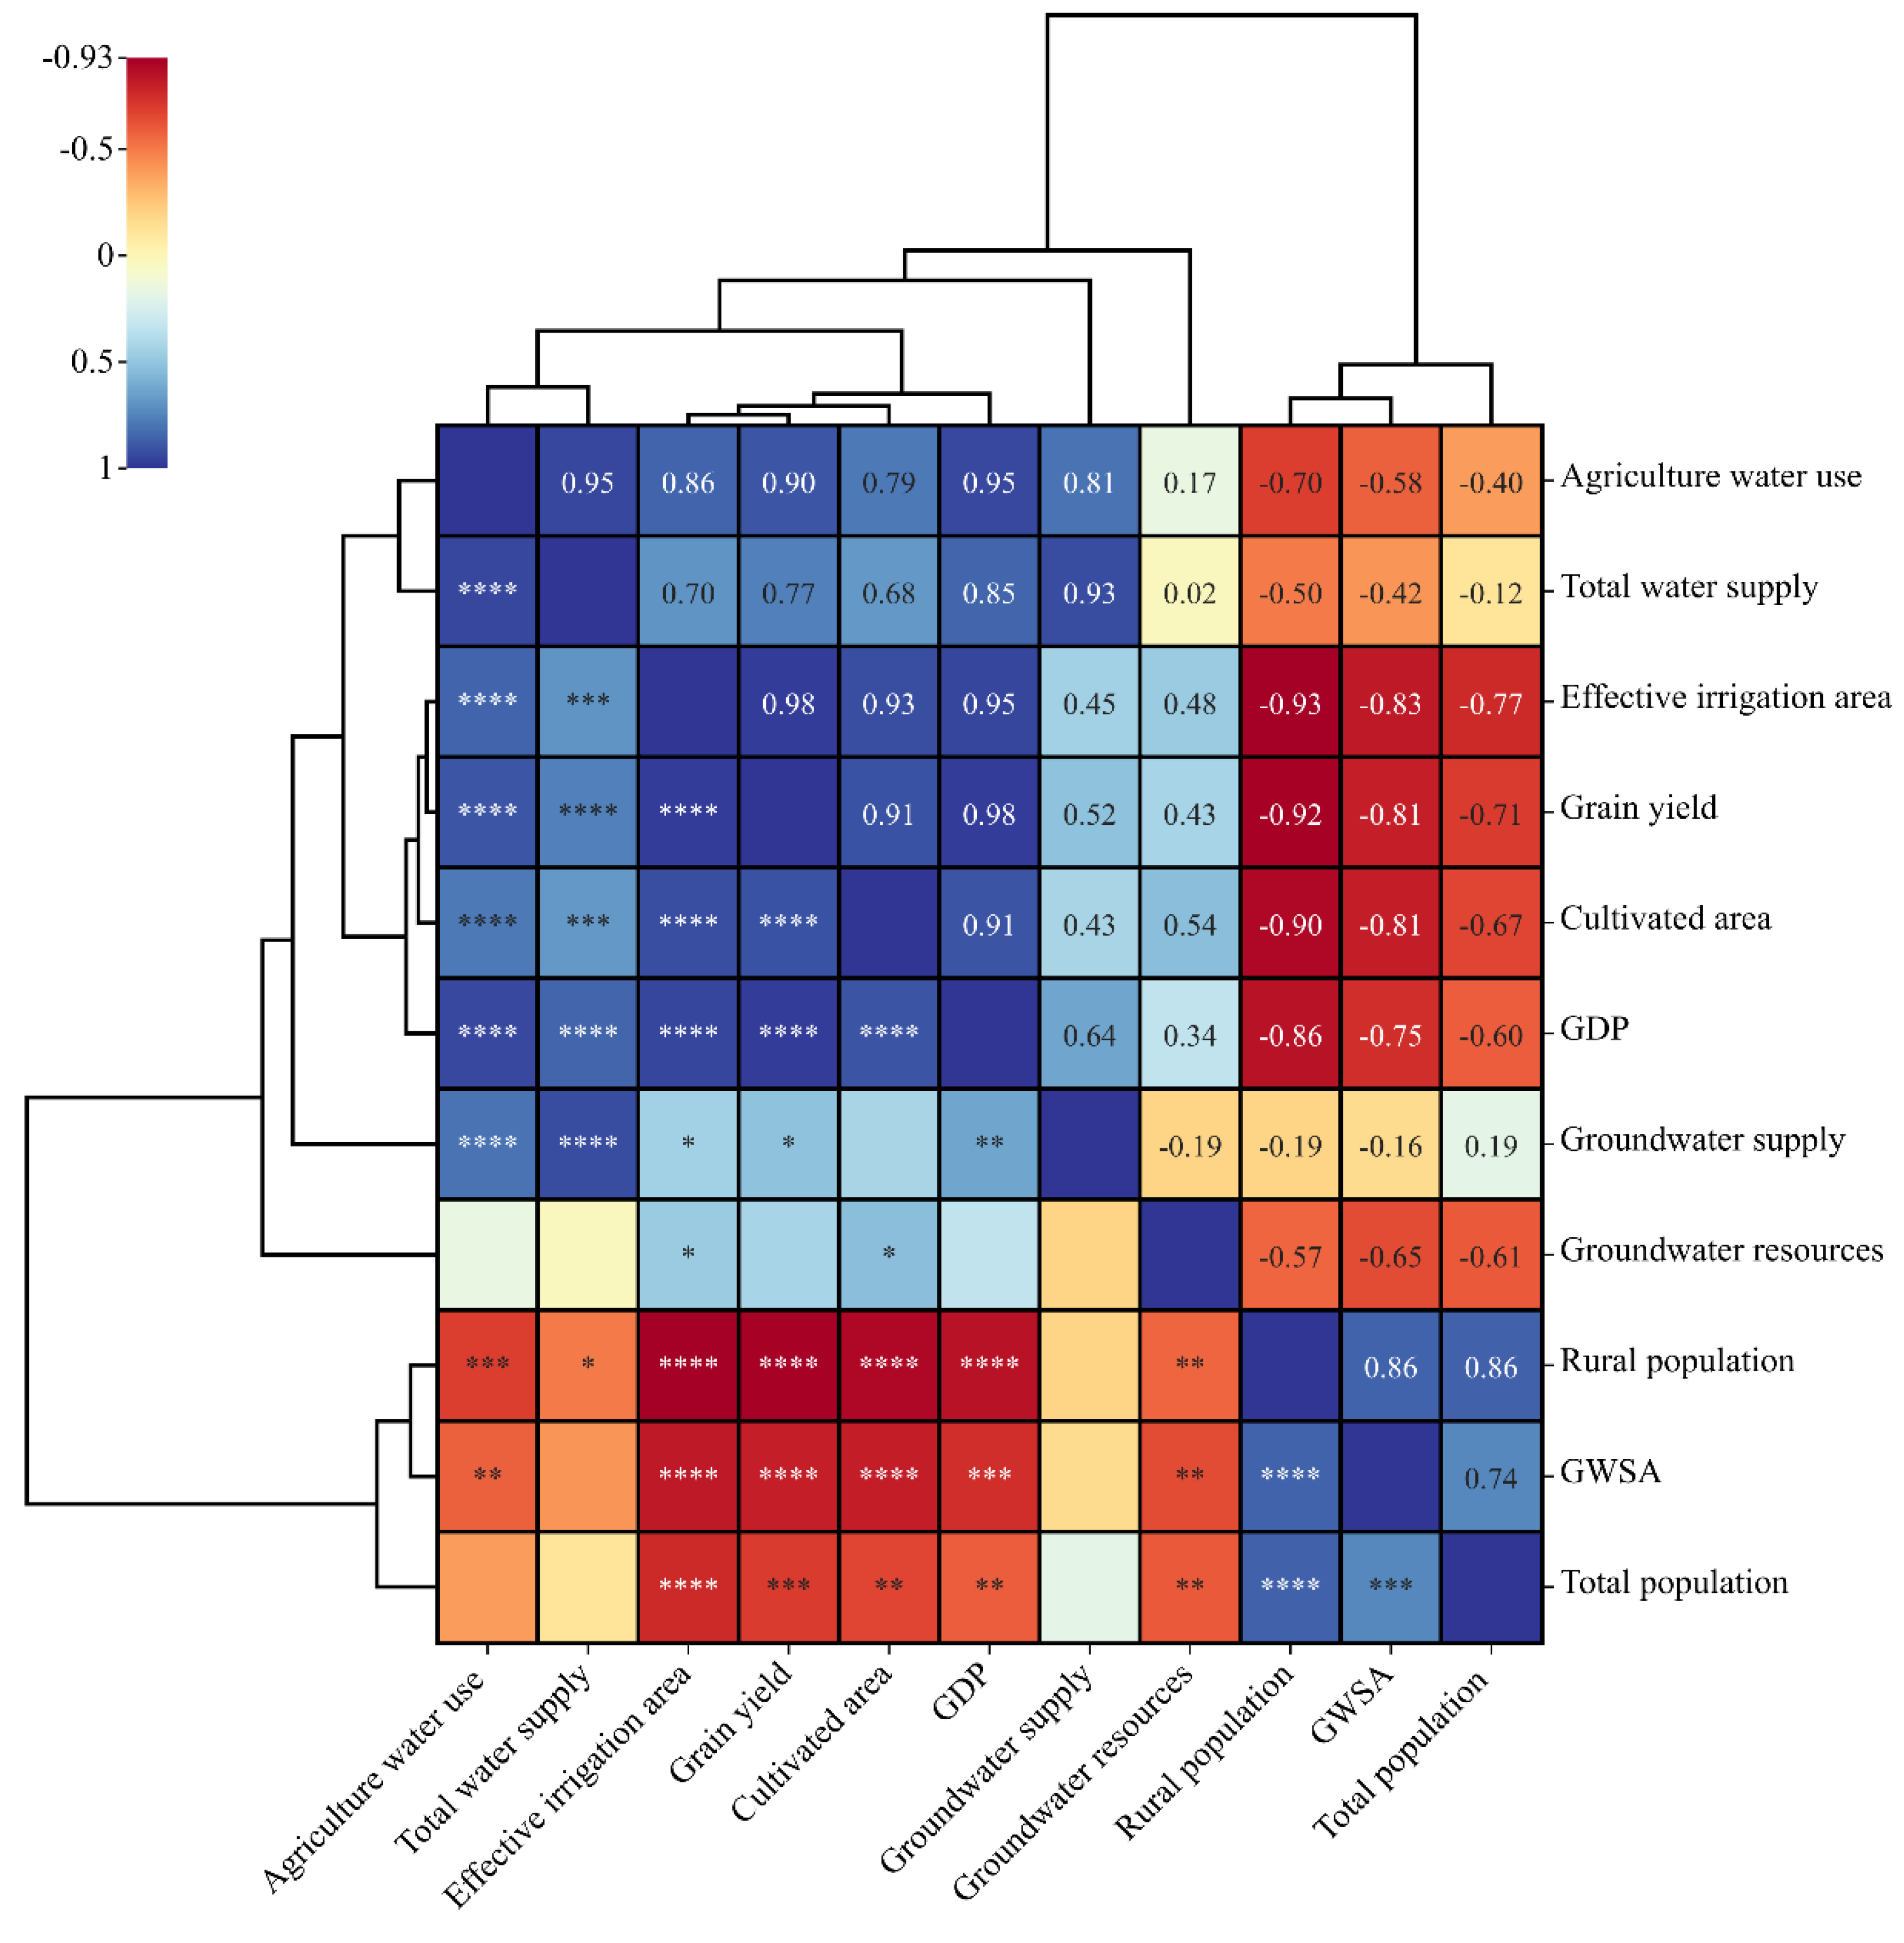
4.1. Factors Influencing the GWSA

The meteorological data of the northeastern black soil region provided by the National Meteorological Science Data Center were compiled to obtain precipitation, temperature, and evaporation data from three meteorological stations in the three provinces. The extracted data were then compared with the GRACE-derived GWSA values in the raster near the meteorological stations (Figure 11). As can be seen from the figure, GWSA, precipitation, evaporation, and temperature all showed periodic fluctuations and exhibited excellent consistency in the variation trend. The cyclical fluctuations of temperature were more stable, and precipitation was negatively correlated with evaporation. GWSA responded most apparently to precipitation, with concentrated precipitation in summer, where surplus GWSA increased, and precipitation decreased each month in autumn and winter; additionally, the GWSA showed a decreasing trend. The increase in GWSA in Liaoning Province was slightly lagged relative to precipitation, probably owing to the delay in groundwater recharge from precipitation infiltration. Among the three types of meteorological data, precipitation was the most dominant factor affecting the GWSA.
A correlation analysis of the GWSA and other influencing factors was simultaneously conducted to explore the impact of anthropogenic activities on the GWSA (Figure 12). Among the numerous influencing factors, the GWSA presented extremely strong negative correlations with arable land area, grain yield, and effective irrigated area (p < 0.001) with correlation coefficients of −0.818, −0.807, and −0.83, respectively. Additionally, GWSA showed a moderate negative correlation with agricultural water use (r = −0.584, p < 0.01). The results fully demonstrate the exploitation of groundwater during crop irrigation that led to a decrease in GWSA. Further, GWSA was negatively correlated with gross domestic product (r = −0.75, p < 0.01). The correlation between the amount of groundwater resources and the GWSA was also significant (r = −0.649, p < 0.01), indicating that the increase in groundwater storage can restrain the recharge of external water sources to the aquifer to a certain extent. Both arable land and effective irrigated areas were significantly and positively correlated with the amount of groundwater resources, indicating that a larger amount of groundwater resources can stimulate the development of agricultural activities, that the amount of groundwater resources no longer dominates the GWSA in the region, and that the influence of agricultural production on the GWSA gradually increased.
A comprehensive analysis of the effects of climate change and anthropogenic activities on the GWSA revealed that although atmospheric precipitation is the primary source of groundwater recharge in the study area, agricultural activities were gradually becoming the dominant factor for the GWSA.

4.2. Comparison of Related Studies and Limitations

Regarding the variation of the TWSA within the northeast region, Chen et al. used the GRACE spherical harmonic solution and JPL Mascon solution to study the TWSA in the West Liaoning River basin within Liaoning Province, and found that the TWSA showed a decreasing trend during 2005–2008, a fluctuating increasing trend from 2008 to 2013, and a gradually decreasing trend from 2013 to 2016, which is similar to the TWSA trend of Liaoning Province in this study [58]. Further, Qian et al. found that the amplitude of the TWSA in Northeast China during2003–2017 was in the range from −8 to 8 cm/a, and the amplitude of the TWSA in the same period in this study was between −7 and 7 cm/a [59]. The results of the two studies are similar and can be used for mutual verification.
There are relatively few studies on the GWSA in Northeast China. Liu monitored the GWSA in the same study area from 2002 to 2017 based on GRACE satellite data and concluded that the overall GWSA showed a decreasing trend [54]. Moiwo et al. inverted the GWSA in western Jilin Province from 2002 to 2009 and concluded that the SMA showed a decreasing trend and the loss area of GWS showed an expanding trend with a deficit of −0.85 mm/month [47]. Further, Chen et al. found that the GWSA in the Songhua River Basin showed a deficit trend from 2008 to 2013 [57]. Based on the groundwater sustainability index of extraction response, Fang et al. concluded that from 2013 to 2017, GWS decreased sharply with groundwater extraction in Daan City, Jilin Province [60]. These studies reported that GWS within Northeast China showed a decreasing trend, which was roughly consistent with the results of this study.
For some years, the differences between the GWSA and the observed groundwater table could be possibly due to following reasons: (1) GRACE satellite can detect shallow and deep groundwater in the study area, but groundwater wells only represent the value of shallow groundwater at a certain point. (2) When performing GRACE inversion, only the change in soil water content at a depth of 2 m at the surface was deducted, while that for a depth below 2 m and above the water table was not, and the changes in vegetation canopy water, river runoff, and reservoirs were ignored. (3) The sample data of observation wells were not sufficiently abundant and could not fully represent the actual values of the whole area. (4) The occurrence of a large area of groundwater extraction at a certain time may affect the observation accuracy of the GRACE satellite.

5. Conclusions

The results of the study indicated that the overall changing rate of GWSA in the black soil region of Northeast China was approximately −0.4204 cm/a. Eastern Heilongjiang Province, central and southern Jilin Province, and central and eastern Liaoning Province showed serious deficits, while northwestern and southern Heilongjiang Province and northern and eastern Jilin Province showed smaller deficit trends, and other regions showed surpluses. The consumption of dynamic and static storage of groundwater resources by agricultural activities caused high GWSA deficits during the irrigation period. Precipitation is an important source of groundwater recharge; and continuous agricultural development has changed the spatial and temporal distribution patterns of GWS in the northeastern black soil area. Consequently, GWS evolved gradually from being influenced by natural factors to being influenced by natural and anthropogenic compounds and anthropogenic factors.
To control the complex process of the influence of natural factors and anthropogenic activities on GWS, the following two suggestions are proposed: (1) Key monitoring of areas with serious groundwater deficits in the black soil area should be conducted to realize reasonable development and allocation of groundwater resources, determine production and ecological water quotas, and maximize the storage efficacy of groundwater resources. (2) The agricultural planting structure of the study area should be adjusted. Water-saving irrigation should be vigorously promoted. The renovation and upgrading of water-saving irrigation facilities should be promoted, and the level of agricultural planting and the efficiency of groundwater resource utilization should be improved.
The northeastern black soil region is one of the three largest black soil regions in the world, and it is the ballast for national food security. The increasing water demand for agriculture in this region has led to serious groundwater exploitation. Therefore, more studies are needed to determine the exact relationship between the dynamic characteristics of groundwater storage and its influencing factors in this region. The results of this study will enrich the existing knowledge of groundwater storage in the northeastern region. The results are critical for the protection of fragile ecosystems and environments and the development of water management strategies in the region; additionally, the study has implications for global and regional studies of large-scale water storage changes.

Author Contributions

S.W.: Writing—original draft, Validation, and Software. G.C.: Conceptualization, Methodology, Data curation, and Writing—review and editing. X.L. (Xiaojie Li).: Software, Validation, and Funding acquisition. Y.L.: Writing—review and editing. X.L. (Xiaofeng Li).: Investigation. S.T.: Supervision. M.Z.: Validation. All authors have read and agreed to the published version of the manuscript.

Funding

This research was supported by the Strategic Priority Research Program of the Chinese Academy of Sciences (Grant No. XDA28110501) and the Jilin Association of Science and Technology (QT202206).

Data Availability Statement

Data will be available on request.

Acknowledgments

The authors express their deep gratitude to the funding agency for supporting this research.

Conflicts of Interest

The authors declare no conflict of interest.

References

  1. Liu, K.; Li, X.; Long, X. Trends in groundwater changes driven by precipitation and anthropogenic activities on the southeast side of the hu line. Environ. Res. Lett. 2021, 16, 094032. [Google Scholar] [CrossRef]
  2. Xu, L.; Chen, N.; Zhang, X.; Chen, Z. Spatiotemporal changes in china’s terrestrial water storage from grace satellites and its possible drivers. J. Geophys Res.-Atmos 2019, 124, 11976–11993. [Google Scholar] [CrossRef]
  3. Xu, Y.; Gong, H.; Chen, B.; Zhang, Q.; Li, Z. Long-term and seasonal variation in groundwater storage in the north china plain based on grace. Int. J. Appl. Earth Obs. Geoinf. 2021, 104, 102560. [Google Scholar] [CrossRef]
  4. Akbari, M.; Shalamzari, M.J.; Memarian, H.; Gholami, A. Monitoring desertification processes using ecological indicators and providing management programs in arid regions of iran. Ecol. Indic. 2020, 111, 106011. [Google Scholar] [CrossRef]
  5. Wang, Y.; Zheng, C.; Ma, R. Safe and sustainable groundwater supply in china. Hydrogeol. J. 2018, 26, 1301–1324. [Google Scholar] [CrossRef]
  6. Zhang, H.; Wang, X.-S. The impact of groundwater depth on the spatial variance of vegetation index in the ordos plateau, china: A semivariogram analysis. J. Hydrol. 2020, 588, 125096. [Google Scholar] [CrossRef]
  7. Rodell, M.; Velicogna, I.; Famiglietti, J.S. Satellite-based estimates of groundwater depletion in india. Nature 2009, 460, 999–1002. [Google Scholar] [CrossRef] [Green Version]
  8. Wada, Y.; Van Beek, L.P.; Van Kempen, C.M.; Reckman, J.W.; Vasak, S.; Bierkens, M.F. Global depletion of groundwater resources. Geophys. Res. Lett. 2010, 37, L20402. [Google Scholar] [CrossRef] [Green Version]
  9. de Graaf, I.E.; Gleeson, T.; Sutanudjaja, E.H.; Bierkens, M.F. Environmental flow limits to global groundwater pumping. Nature 2019, 574, 90–94. [Google Scholar] [CrossRef]
  10. Noori, R.; Maghrebi, M.; Mirchi, A.; Tang, Q.; Bhattarai, R.; Sadegh, M.; Noury, M.; Torabi Haghighi, A.; Kløve, B.; Madani, K. Anthropogenic depletion of iran’s aquifers. Proc. Natl. Acad. Sci. USA 2021, 118, e2024221118. [Google Scholar] [CrossRef]
  11. Jin, S.; Feng, G. Large-scale variations of global groundwater from satellite gravimetry and hydrological models, 2002–2012. Glob. Planet. Chang. 2013, 106, 20–30. [Google Scholar] [CrossRef]
  12. Yang, Y.; Watanabe, M.; Zhang, X.; Zhang, J.; Wang, Q.; Hayashi, S. Optimizing irrigation management for wheat to reduce groundwater depletion in the piedmont region of the taihang mountains in the north china plain. Agric. Water Manag. 2006, 82, 25–44. [Google Scholar] [CrossRef]
  13. Feng, T.; Shen, Y.; Chen, Q.; Wang, F.; Zhang, X. Groundwater storage change and driving factor analysis in north china using independent component decomposition. J. Hydrol. 2022, 609, 127708. [Google Scholar] [CrossRef]
  14. Jia, X.; O’Connor, D.; Hou, D.; Jin, Y.; Li, G.; Zheng, C.; Ok, Y.S.; Tsang, D.C.; Luo, J. Groundwater depletion and contamination: Spatial distribution of groundwater resources sustainability in china. Sci. Total Environ. 2019, 672, 551–562. [Google Scholar] [CrossRef]
  15. Shen, Y.; Zheng, W.; Zhu, H.; Yin, W.; Xu, A.; Pan, F.; Wang, Q.; Zhao, Y. Inverted algorithm of groundwater storage anomalies by combining the gnss, grace/grace-fo, and gldas: A case study in the north china plain. Remote Sens. 2022, 14, 5683. [Google Scholar] [CrossRef]
  16. Fatolazadeh, F.; Goïta, K. Reconstructing groundwater storage variations from grace observations using a new gaussian-han-fan (ghf) smoothing approach. J. Hydrol. 2022, 604, 127234. [Google Scholar] [CrossRef]
  17. Ma, N.; Szilagyi, J.; Zhang, Y. Calibration—free complementary relationship estimates terrestrial evapotranspiration globally. Water Resour. Res. 2021, 57, e2021WR029691. [Google Scholar] [CrossRef]
  18. Akhtar, F.; Nawaz, R.A.; Hafeez, M.; Awan, U.K.; Borgemeister, C.; Tischbein, B. Evaluation of grace derived groundwater storage changes in different agro-ecological zones of the indus basin. J. Hydrol. 2022, 605, 127369. [Google Scholar] [CrossRef]
  19. Voss, K.A.; Famiglietti, J.S.; Lo, M.; De Linage, C.; Rodell, M.; Swenson, S.C. Groundwater depletion in the middle east from grace with implications for transboundary water management in the tigris—euphrates—western iran region. Water Resour. Res. 2013, 49, 904–914. [Google Scholar] [CrossRef] [Green Version]
  20. Liu, X.; Liu, C.; Brutsaert, W. Mutual consistency of groundwater storage changes derived from grace and from baseflow recessions in the central yangtze river basin. J. Geophys Res.-Atmos. 2020, 125, e2019JD031467. [Google Scholar] [CrossRef]
  21. Joodaki, G.; Wahr, J.; Swenson, S. Estimating the human contribution to groundwater depletion in the middle east, from grace data, land surface models, and well observations. Water Resour. Res. 2014, 50, 2679–2692. [Google Scholar] [CrossRef]
  22. Chen, J.; Li, J.; Zhang, Z.; Ni, S. Long-term groundwater variations in northwest india from satellite gravity measurements. Glob. Planet. Chang. 2014, 116, 130–138. [Google Scholar] [CrossRef] [Green Version]
  23. Bhanja, S.N.; Mukherjee, A.; Saha, D.; Velicogna, I.; Famiglietti, J.S. Validation of grace based groundwater storage anomaly using in-situ groundwater level measurements in india. J. Hydrol. 2016, 543, 729–738. [Google Scholar] [CrossRef]
  24. Ma, N.; Zhang, Y. Increasing tibetan plateau terrestrial evapotranspiration primarily driven by precipitation. Agric. For. Meteorol. 2022, 317, 108887. [Google Scholar]
  25. Pokhrel, Y.N.; Fan, Y.; Miguez-Macho, G.; Yeh, P.J.F.; Han, S.-C. The role of groundwater in the amazon water cycle: 3. Influence on terrestrial water storage computations and comparison with grace. J. Geophys Res.-Atmos. 2013, 118, 3233–3244. [Google Scholar] [CrossRef]
  26. Choi, S.; Oh, C.-W.; Luehr, H. Tectonic relation between northeastern china and the korean peninsula revealed by interpretation of grace satellite gravity data. Gondwana Res. 2006, 9, 62–67. [Google Scholar] [CrossRef]
  27. Shen, Y.; Wang, Q.; Rao, W.; Sun, W. Spatial distribution characteristics and mechanism of nonhydrological time-variable gravity in mainland china. Earth Planet. Phys. 2022, 6, 94–107. [Google Scholar] [CrossRef]
  28. Sarkar, T.; Kannaujiya, S.; Taloor, A.K.; Champati Ray, P.K.; Chauhan, P. Integrated study of grace data derived interannual groundwater storage variability over water stressed indian regions. Groundw. Sustain. Dev. 2020, 10, 100376. [Google Scholar] [CrossRef]
  29. Su, Y.; Guo, B.; Zhou, Z.; Zhong, Y.; Min, L. Spatio-temporal variations in groundwater revealed by grace and its driving factors in the huang-huai-hai plain, china. Sensors 2020, 20, 922. [Google Scholar] [CrossRef] [Green Version]
  30. Zhu, Q.; Zhang, H. Groundwater drought characteristics and its influencing factors with corresponding quantitative contribution over the two largest catchments in china. J. Hydrol. 2022, 609, 127759. [Google Scholar] [CrossRef]
  31. Liu, X.; Hu, L.; Sun, K.; Yang, Z.; Sun, J.; Yin, W. Improved understanding of groundwater storage changes under the influence of river basin governance in northwestern china using grace data. Remote Sens. 2021, 13, 2672. [Google Scholar] [CrossRef]
  32. Yin, W.; Hu, L.; Zhang, M.; Wang, J.; Han, S.-C. Statistical downscaling of grace-derived groundwater storage using et data in the north china plain. J. Geophys Res.-Atmos. 2018, 123, 5973–5987. [Google Scholar] [CrossRef]
  33. Zhong, Y.; Zhong, M.; Feng, W.; Zhang, Z.; Shen, Y.; Wu, D. Groundwater depletion in the west liaohe river basin, china and its implications revealed by grace and in situ measurements. Remote Sens. 2018, 10, 493. [Google Scholar] [CrossRef] [Green Version]
  34. Tapley, B.D.; Bettadpur, S.; Ries, J.C.; Thompson, P.F.; Watkins, M.M. Grace measurements of mass variability in the earth system. Science 2004, 305, 503–505. [Google Scholar] [CrossRef] [Green Version]
  35. Zheng, W.; Hsu, H.; Zhong, M.; Yun, M. Requirements analysis for future satellite gravity mission improved-grace. Surv. Geophys. 2015, 36, 87–109. [Google Scholar] [CrossRef]
  36. Rzepecka, Z.; Birylo, M. Groundwater storage changes derived from grace and gldas on smaller river basins—A case study in poland. Geosciences 2020, 10, 124. [Google Scholar] [CrossRef] [Green Version]
  37. Wahr, J.; Molenaar, M.; Bryan, F. Time variability of the earth’s gravity field: Hydrological and oceanic effects and their possible detection using grace. J. Geophys. Res. Solid Earth 1998, 103, 30205–30229. [Google Scholar] [CrossRef]
  38. Tiwari, V.M.; Wahr, J.; Swenson, S. Dwindling groundwater resources in northern india, from satellite gravity observations. Geophys. Res. Lett. 2009, 36, L18401. [Google Scholar] [CrossRef] [Green Version]
  39. Asoka, A.; Mishra, V. A strong linkage between seasonal crop growth and groundwater storage variability in india. J. Hydrometeorol. 2021, 22, 125–138. [Google Scholar] [CrossRef]
  40. Saha, A.; Pal, S.C.; Chowdhuri, I.; Roy, P.; Chakrabortty, R. Effect of hydrogeochemical behavior on groundwater resources in holocene aquifers of moribund ganges delta, india: Infusing data-driven algorithms. Environ. Pollut. 2022, 314, 120203. [Google Scholar] [CrossRef]
  41. Rodell, M.; Chen, J.; Kato, H.; Famiglietti, J.S.; Nigro, J.; Wilson, C.R. Estimating groundwater storage changes in the mississippi river basin (USA) using grace. Hydrogeol. J. 2007, 15, 159–166. [Google Scholar] [CrossRef] [Green Version]
  42. Yeh, P.J.F.; Swenson, S.C.; Famiglietti, J.S.; Rodell, M. Remote sensing of groundwater storage changes in illinois using the gravity recovery and climate experiment (grace). Water Resour. Res. 2006, 42, W12203. [Google Scholar] [CrossRef]
  43. Swenson, S.; Yeh, P.J.F.; Wahr, J.; Famiglietti, J. A comparison of terrestrial water storage variations from grace with in situ measurements from illinois. Geophys. Res. Lett. 2006, 33, L16401. [Google Scholar] [CrossRef] [Green Version]
  44. Moore, S.; Fisher, J.B. Challenges and opportunities in grace-based groundwater storage assessment and management: An example from yemen. Water Resour. Manag. 2012, 26, 1425–1453. [Google Scholar] [CrossRef]
  45. Li, T.; Xia, J.; Zhang, L.; She, D.; Wang, G.; Cheng, L. An improved complementary relationship for estimating evapotranspiration attributed to climate change and revegetation in the loess plateau, china. J. Hydrol. 2021, 592, 125516. [Google Scholar] [CrossRef]
  46. Tangdamrongsub, N.; Han, S.-C.; Tian, S.; Müller Schmied, H.; Sutanudjaja, E.H.; Ran, J.; Feng, W. Evaluation of groundwater storage variations estimated from grace data assimilation and state-of-the-art land surface models in australia and the north china plain. Remote Sens. 2018, 10, 483. [Google Scholar] [CrossRef] [Green Version]
  47. Moiwo, J.P.; Lu, W.; Tao, F. Grace, gldas and measured groundwater data products show water storage loss in western jilin, china. Water Sci. Technol. 2012, 65, 1606–1614. [Google Scholar] [CrossRef]
  48. Tao, Z.; Tao, T.; Ding, X.; He, R. Groundwater storage changes in anhui province derived from grace and gldas hydrological model. Prog. Geophys. 2021, 4, 1456–1463. (In Chinese) [Google Scholar]
  49. Ali, S.; Wang, Q.; Liu, D.; Fu, Q.; Mafuzur Rahaman, M.; Abrar Faiz, M.; Jehanzeb Masud Cheema, M. Estimation of spatio-temporal groundwater storage variations in the lower transboundary indus basin using grace satellite. J. Hydrol. 2022, 605, 127315. [Google Scholar] [CrossRef]
  50. Ferreira, V.G.; Montecino, H.D.C.; Yakubu, C.I.; Heck, B. Uncertainties of the gravity recovery and climate experiment time-variable gravity-field solutions based on three-cornered hat method. J. Appl. Remote Sens. 2016, 10, 015015. [Google Scholar] [CrossRef]
  51. Zhang, H.; Ding, J.; Wang, Y.; Zhou, D.; Zhu, Q. Investigation about the correlation and propagation among meteorological, agricultural and groundwater droughts over humid and arid/semi-arid basins in china. J. Hydrol. 2021, 603, 127007. [Google Scholar] [CrossRef]
  52. Zhong, Y.; Feng, W.; Zhong, M.; Ming, Z. Dataset of Reconstructed Terrestrial Water Storage in China Based on Precipitation (2002–2019). Available online: https://data.tpdc.ac.cn/en/data/71cf70ec-0858-499d-b7f2-63319e1087fc/ (accessed on 12 October 2022).
  53. Katpatal, Y.B.; Rishma, C.; Singh, C.K. Sensitivity of the gravity recovery and climate experiment (grace) to the complexity of aquifer systems for monitoring of groundwater. Hydrogeol. J. 2018, 26, 933–943. [Google Scholar] [CrossRef]
  54. Feng, W.; Zhong, M.; Lemoine, J.-M.; Biancale, R.; Hsu, H.-T.; Xia, J. Evaluation of groundwater depletion in north china using the gravity recovery and climate experiment (grace) data and ground-based measurements. Water Resour. Res. 2013, 49, 2110–2118. [Google Scholar] [CrossRef]
  55. Huang, Z.; Pan, Y.; Gong, H.; Yeh, P.J.F.; Li, X.; Zhou, D.; Zhao, W. Subregional—scale groundwater depletion detected by grace for both shallow and deep aquifers in north china plain. Geophys. Res. Lett. 2015, 42, 1791–1799. [Google Scholar] [CrossRef]
  56. Liu, B. Water Storage Monitoring in Three Northeastern Provinces Based on Grace Satellites during 2002–2017; Jilin University: Changchun, China, 2021. (In Chinese) [Google Scholar]
  57. Chen, H.; Zhang, W.; Nie, N.; Guo, Y. Long-term groundwater storage variations estimated in the songhua river basin by using grace products, land surface models, and in-situ observations. Sci. Total Environ. 2019, 649, 372–387. [Google Scholar] [CrossRef]
  58. Chen, X.; Jiang, J.; Li, H. Drought and flood monitoring of the liao river basin in northeast china using extended grace data. Remote Sens. 2018, 10, 1168. [Google Scholar] [CrossRef] [Green Version]
  59. Qian, A.; Yi, S.; Chang, L.; Sun, G.; Liu, X. Using grace data to study the impact of snow and rainfall on terrestrial water storage in northeast china. Remote Sens. 2020, 12, 4166. [Google Scholar] [CrossRef]
  60. Fang, Z.; Ding, X.; Gao, H. Local-scale groundwater sustainability assessment based on the response to groundwater mining (mgsi): A case study of da’an city, jilin province, china. Sustainability 2022, 14, 5618. [Google Scholar] [CrossRef]
Figure 1. Location map of the study area.
Remotesensing 15 00704 g001
Figure 2. Flow chart showing the processes and operations employed in this study.
Remotesensing 15 00704 g002
Figure 3. Uncertainties of TWSA, SWA, and SWEA estimated by the TCH method. (a) Uncertainties of TWSA products of CSR-M, GFZ-M, and JPL-M. (b) Uncertainties of SMA products of CLSM, VIC, and NOAH. (c) Uncertainties of SWEA products of CLSM, VIC, and NOAH.
Remotesensing 15 00704 g003
Figure 4. Monthly time series of TWSA, SWA, and SWEA products. Light purple shade represents the uncertainties of CSR Mascon and NOAH by the TCH method. (a) Monthly time series of TWSA products of CSR-M, GFZ-M, and JPL-M. The gray dashed lines represent the missing data period. (b) Monthly time series of SWA products of CLSM, NOAH, and VIC. (c) Monthly time series of SWEA products of CLSM, NOAH, and VIC.
Remotesensing 15 00704 g004
Figure 5. Comparison of the GWSA and observed groundwater table (a): Heilongjiang Province; (b): Jilin Province; and (c): Liaoning Province.
Remotesensing 15 00704 g005
Figure 6. Spatial distribution of annual changes in GWS in the northeast black soil region.
Remotesensing 15 00704 g006
Figure 7. Variation trends and annual average change rates of GWSA from 2002 to 2021.
Remotesensing 15 00704 g007
Figure 8. Time series of water storage changes in the northeastern black soil region. (a) Time series of GWSA, TWSA, SMA and SWEA for the entire study area. (b) Time series of GWSA, TWSA, SMA and SWEA for Heilongjiang Province. (c) Time series of GWSA, TWSA, SMA and SWEA for Jilin Province. (d) Time series of GWSA, TWSA, SMA and SWEA for Liaoning Province.
Remotesensing 15 00704 g008
Figure 9. GWSA in different seasons in different years in the black soil area of Northeast China.
Remotesensing 15 00704 g009
Figure 10. Monthly variation characteristics of GWSA in northeastern black soil area.
Remotesensing 15 00704 g010
Figure 11. Comparison of meteorological data and GWSA (a): Heilongjiang Province; (b): Jilin Province; and (c): Liaoning Province.
Remotesensing 15 00704 g011
Figure 12. Heat map of correlation between GWSA and influencing factors in northeastern black soil region. Colors close to red represent positive correlations and that close to blue represent negative correlations. The darker the color, the greater the correlation. **** represents p < 0.0001, *** represents p < 0.001, ** represents p < 0.01, * represents p < 0.05.
Remotesensing 15 00704 g012
Table 1. Correlation among the components of the three northeastern provinces.
SMASWEATWSA
SWEA0.08
TWSA0.760.15
GWSA−0.7−0.35−0.16
Disclaimer/Publisher’s Note: The statements, opinions and data contained in all publications are solely those of the individual author(s) and contributor(s) and not of MDPI and/or the editor(s). MDPI and/or the editor(s) disclaim responsibility for any injury to people or property resulting from any ideas, methods, instructions or products referred to in the content.

