
Geophysical and Remote Sensing Assessment of Chad’s Groundwater Resources


Abstract
:1. Introduction
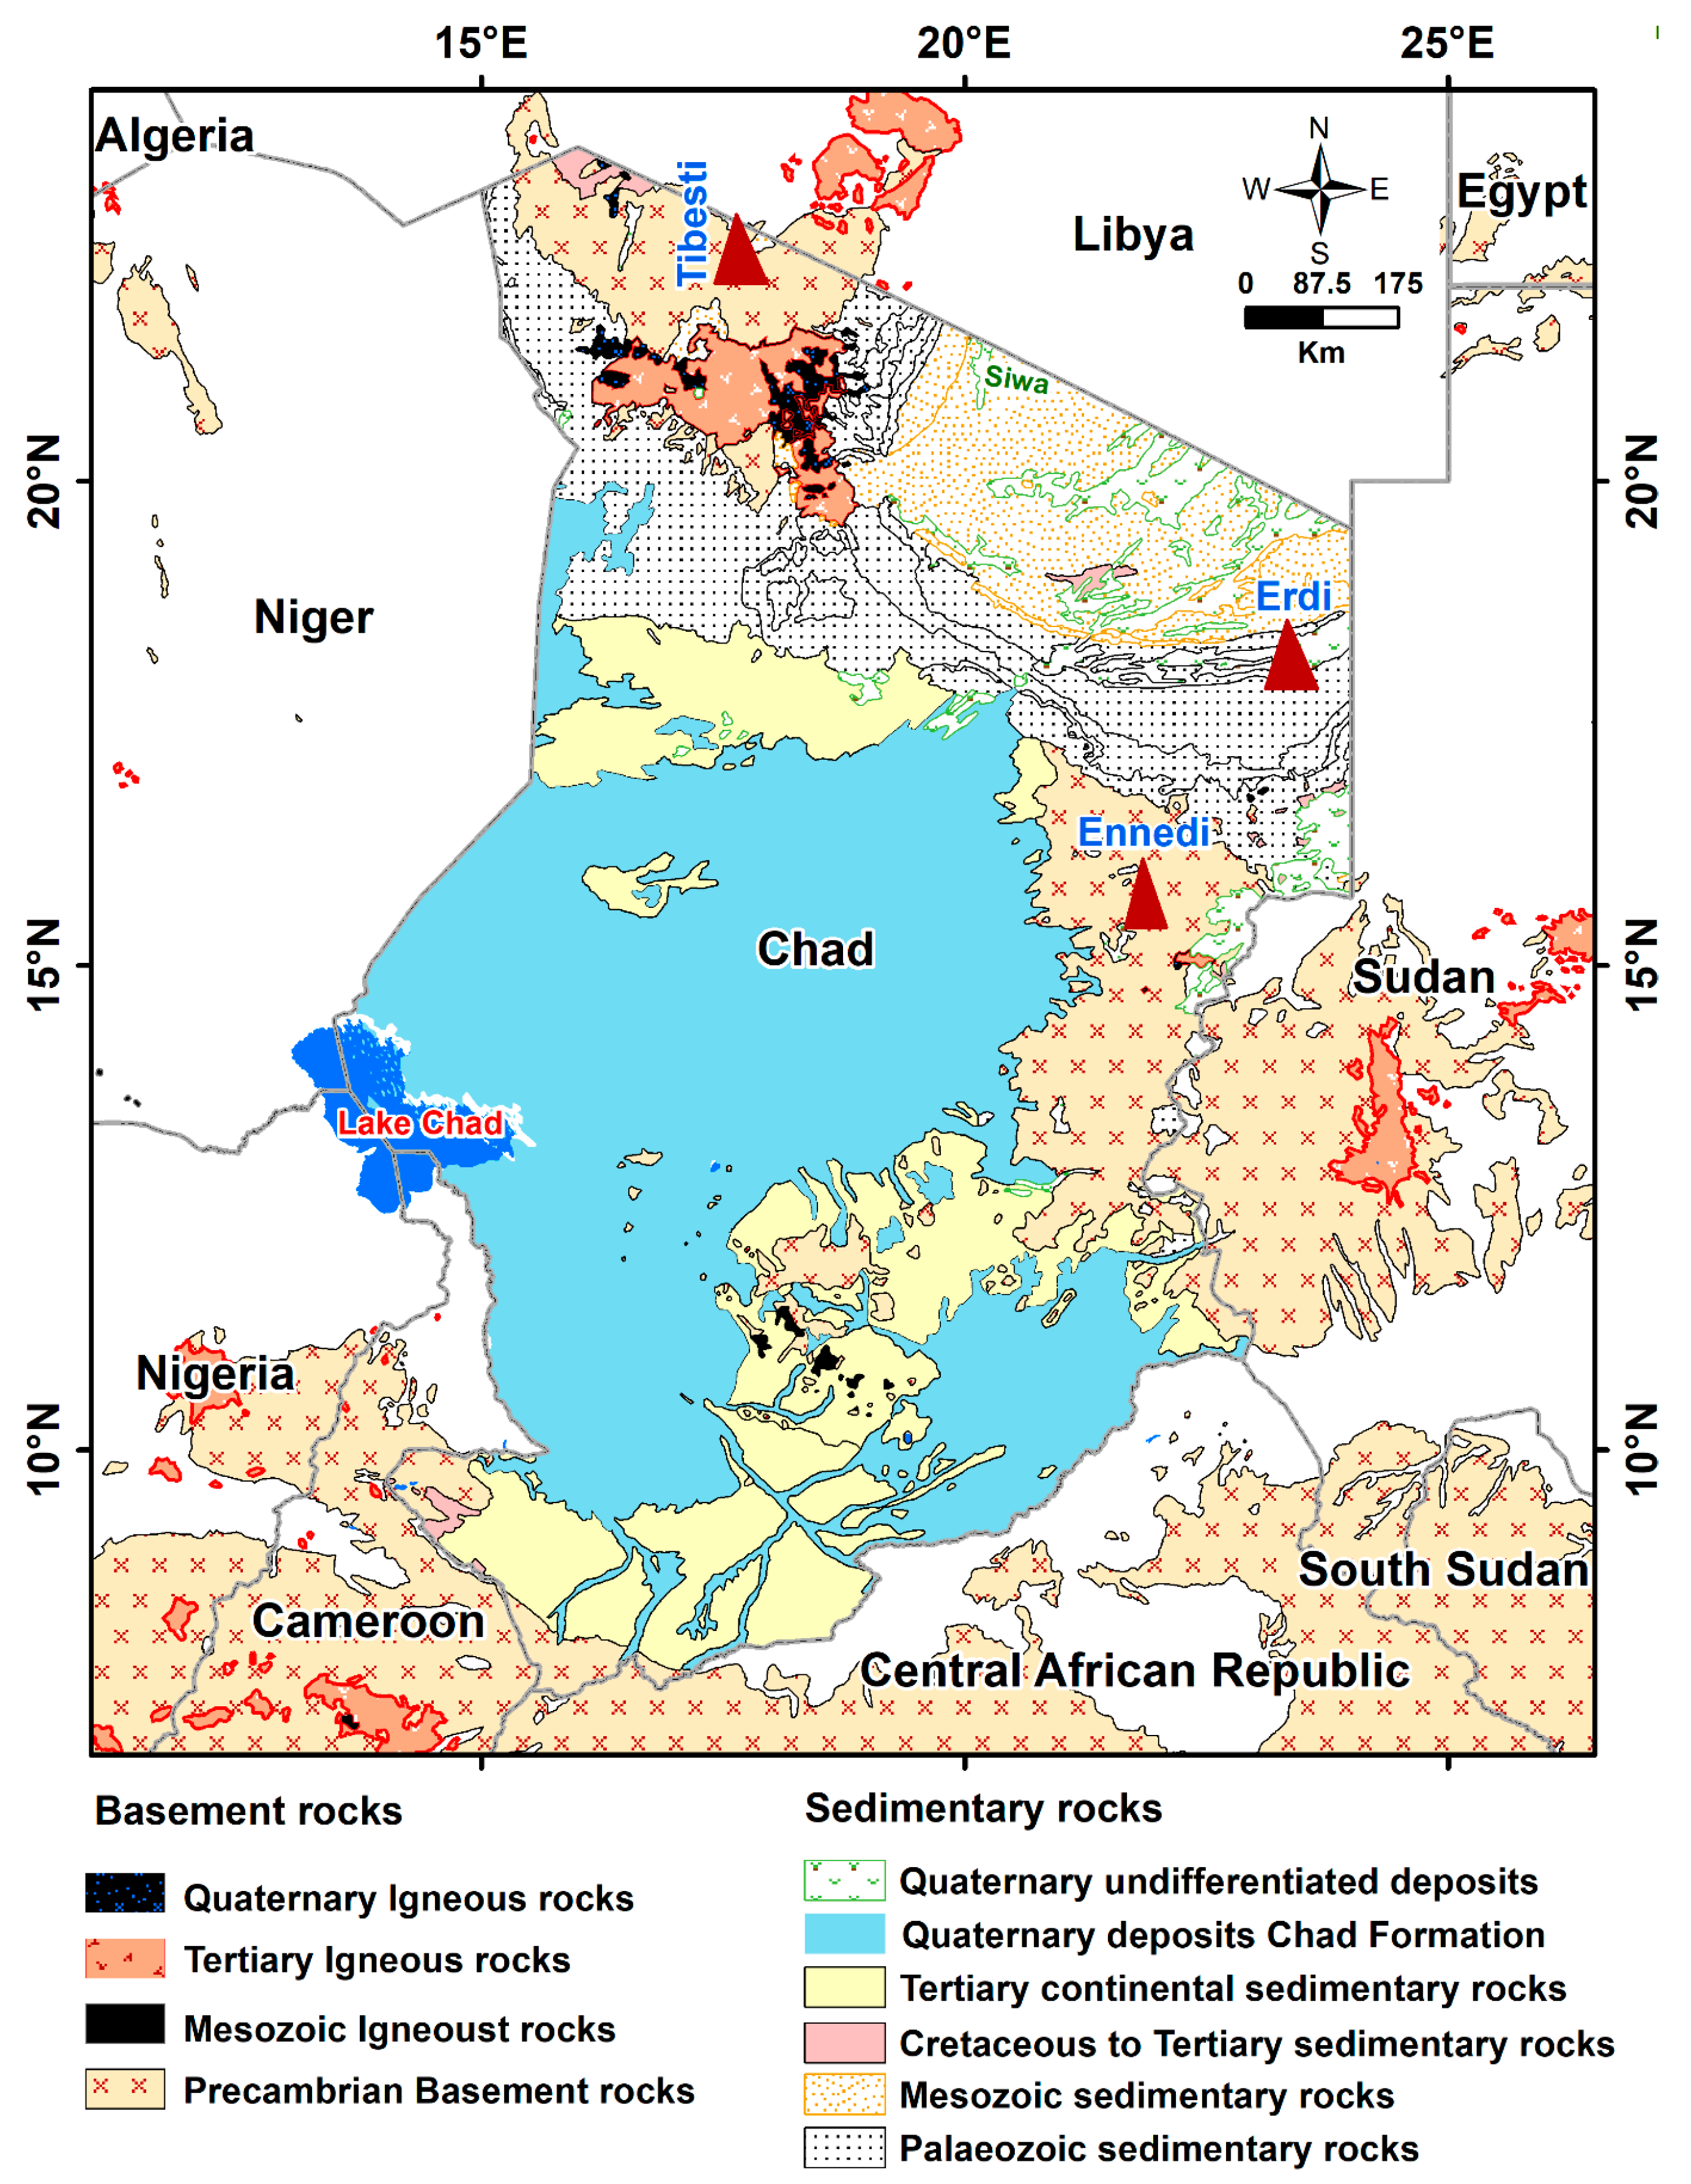
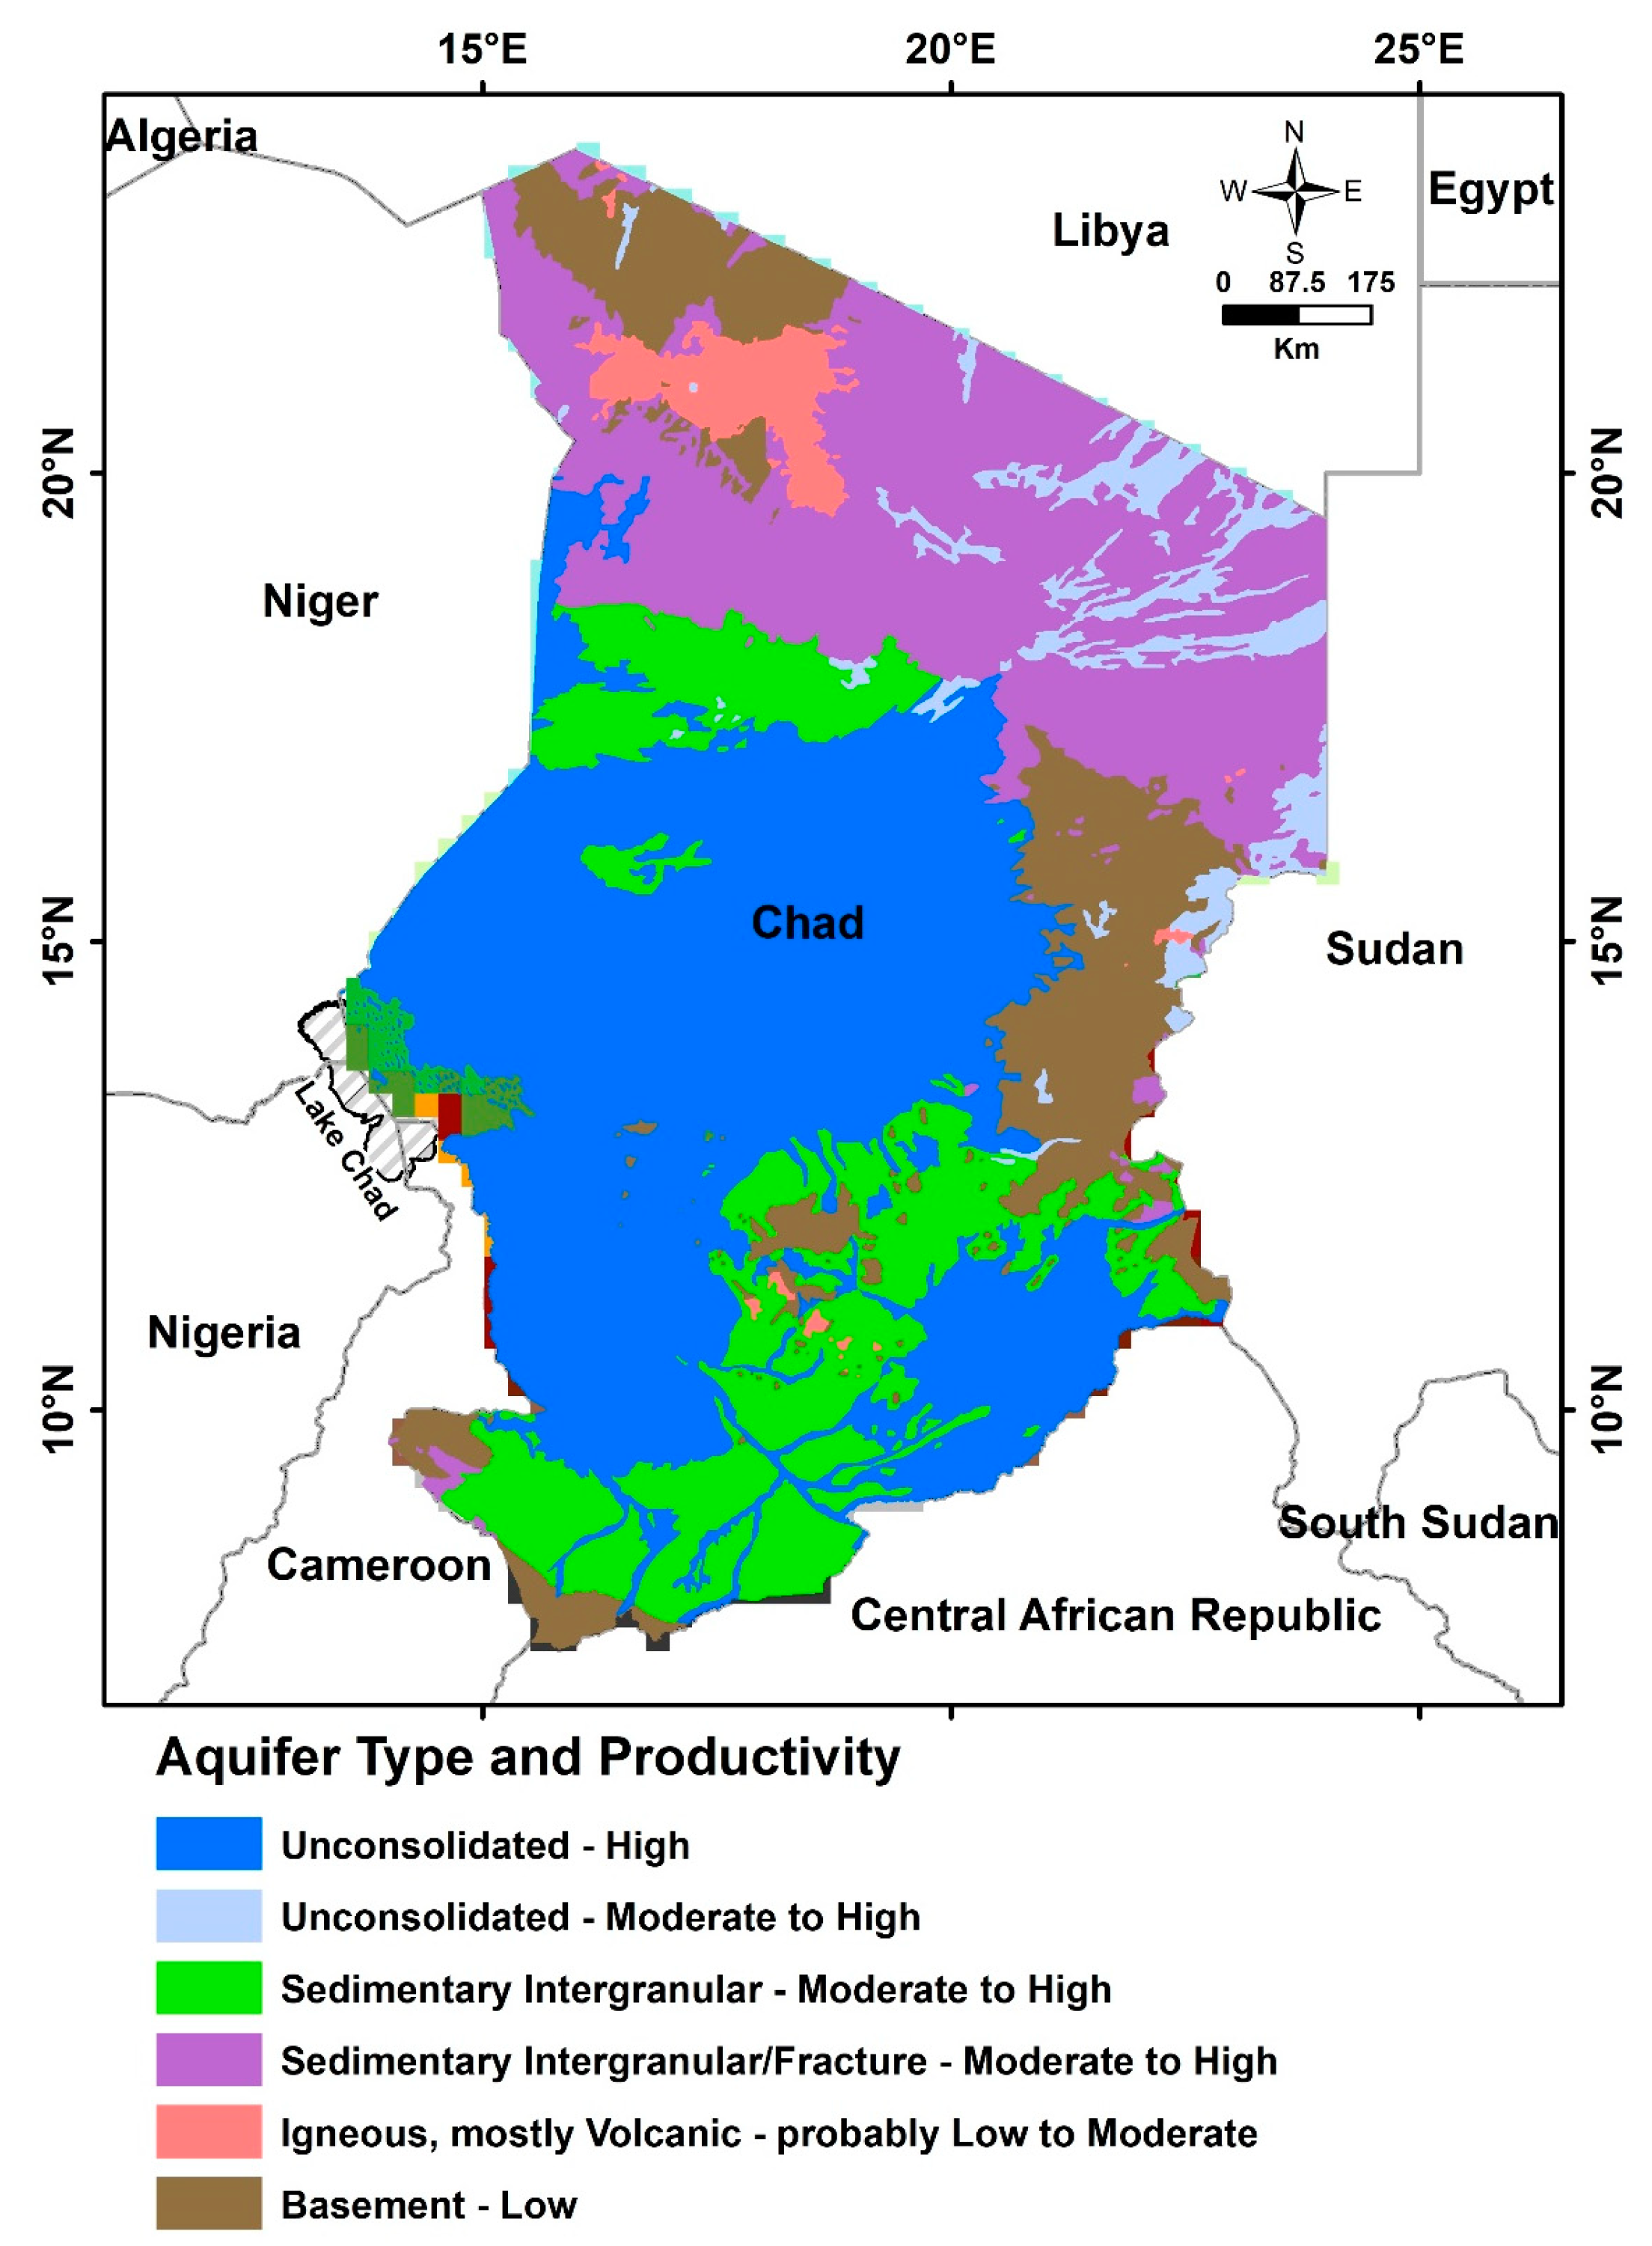
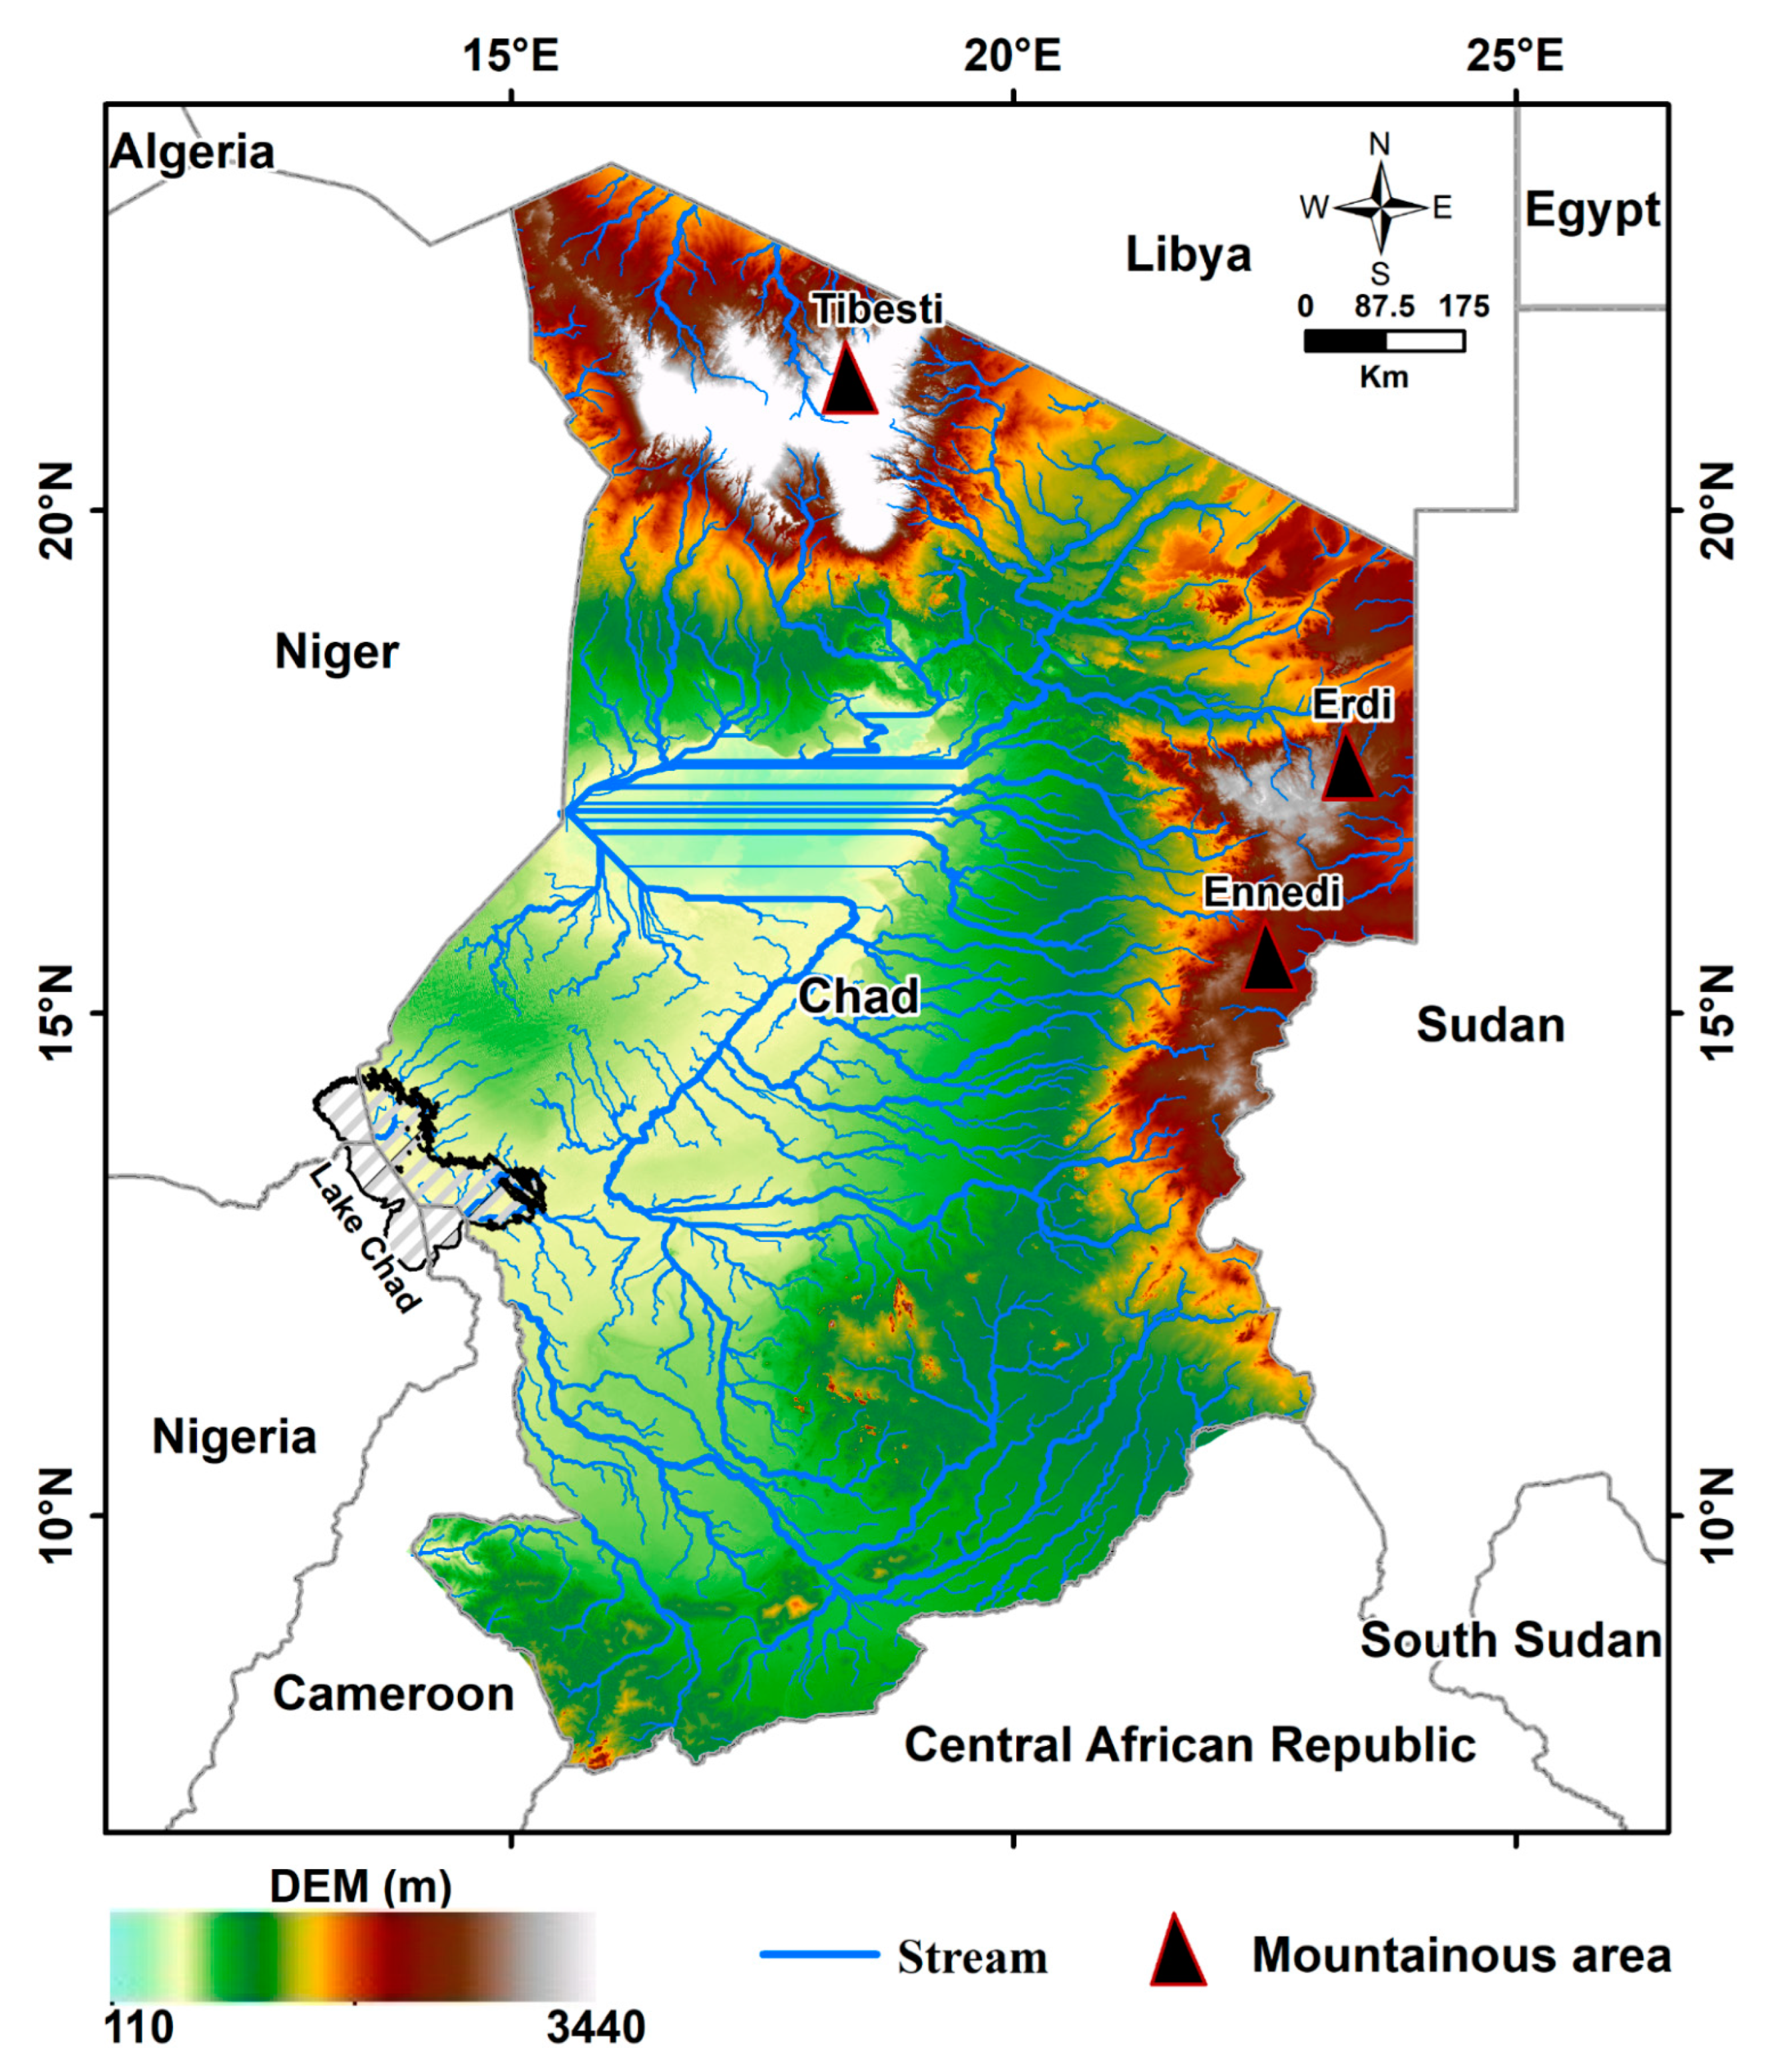
2. Study Area
3. Data and Methods
3.1. Gravity Data
3.2. GLDAS
3.3. Lake Chad Reservoir
3.4. TRMM
4. Result and Discussion
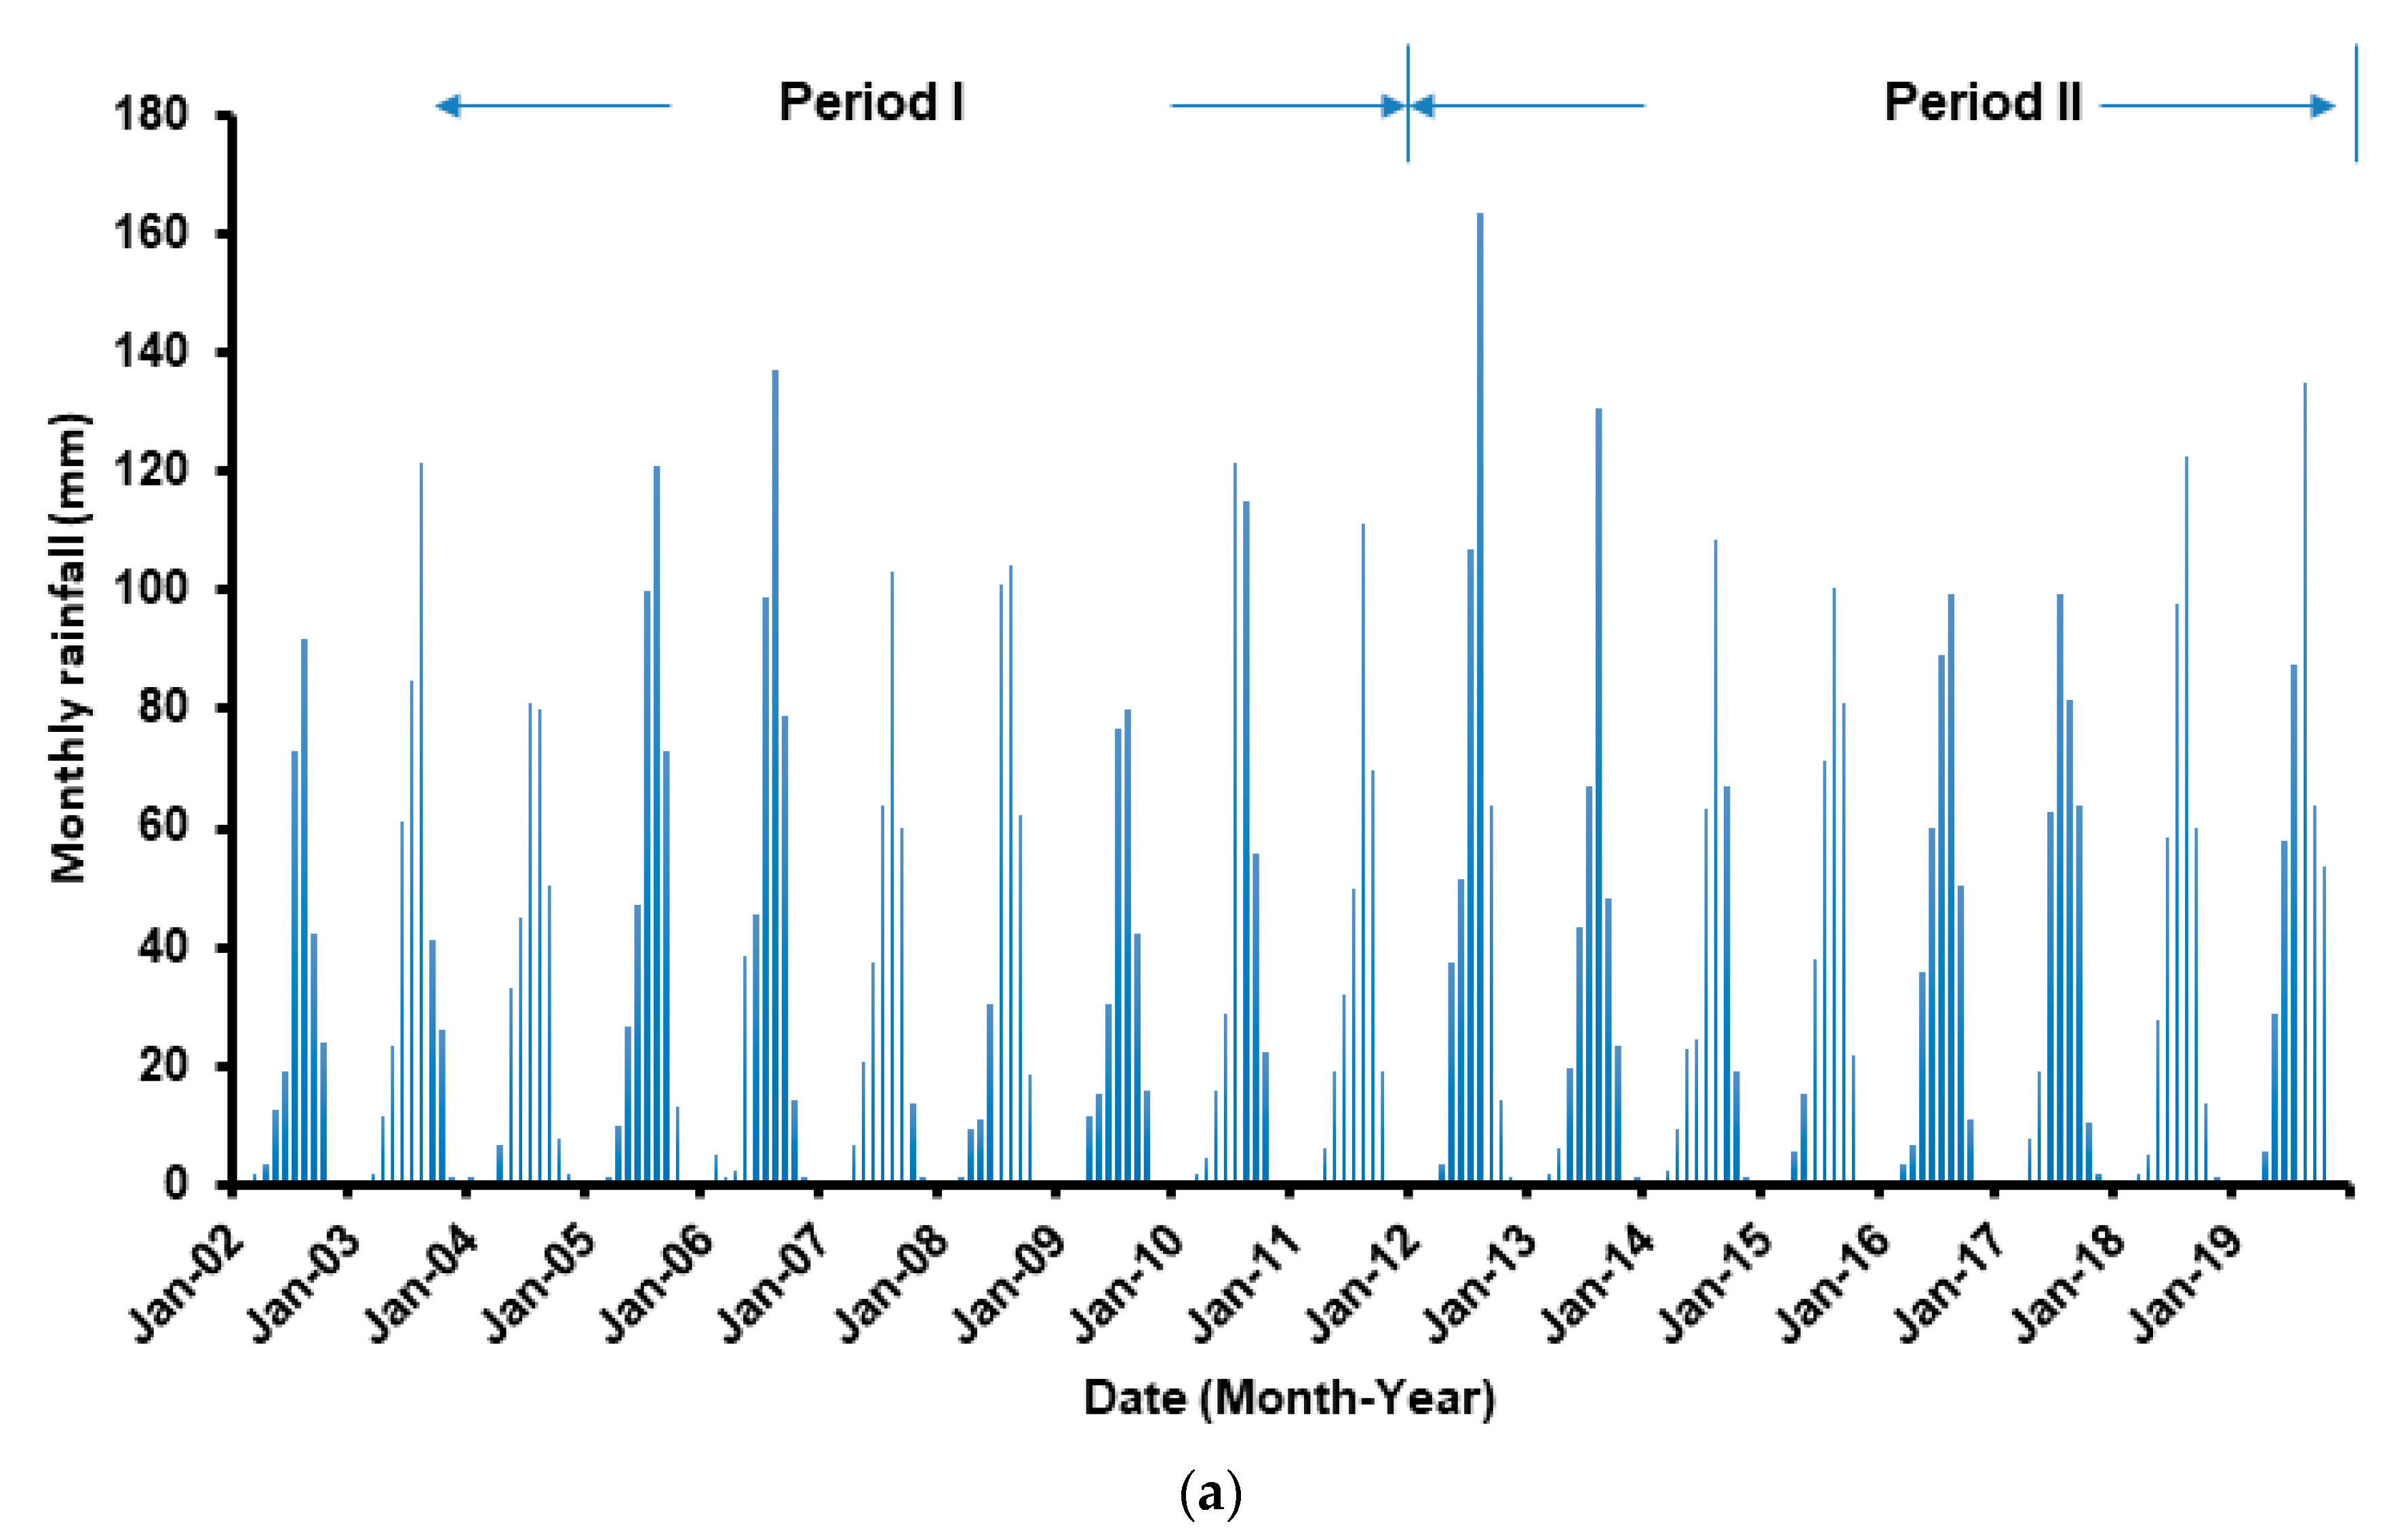
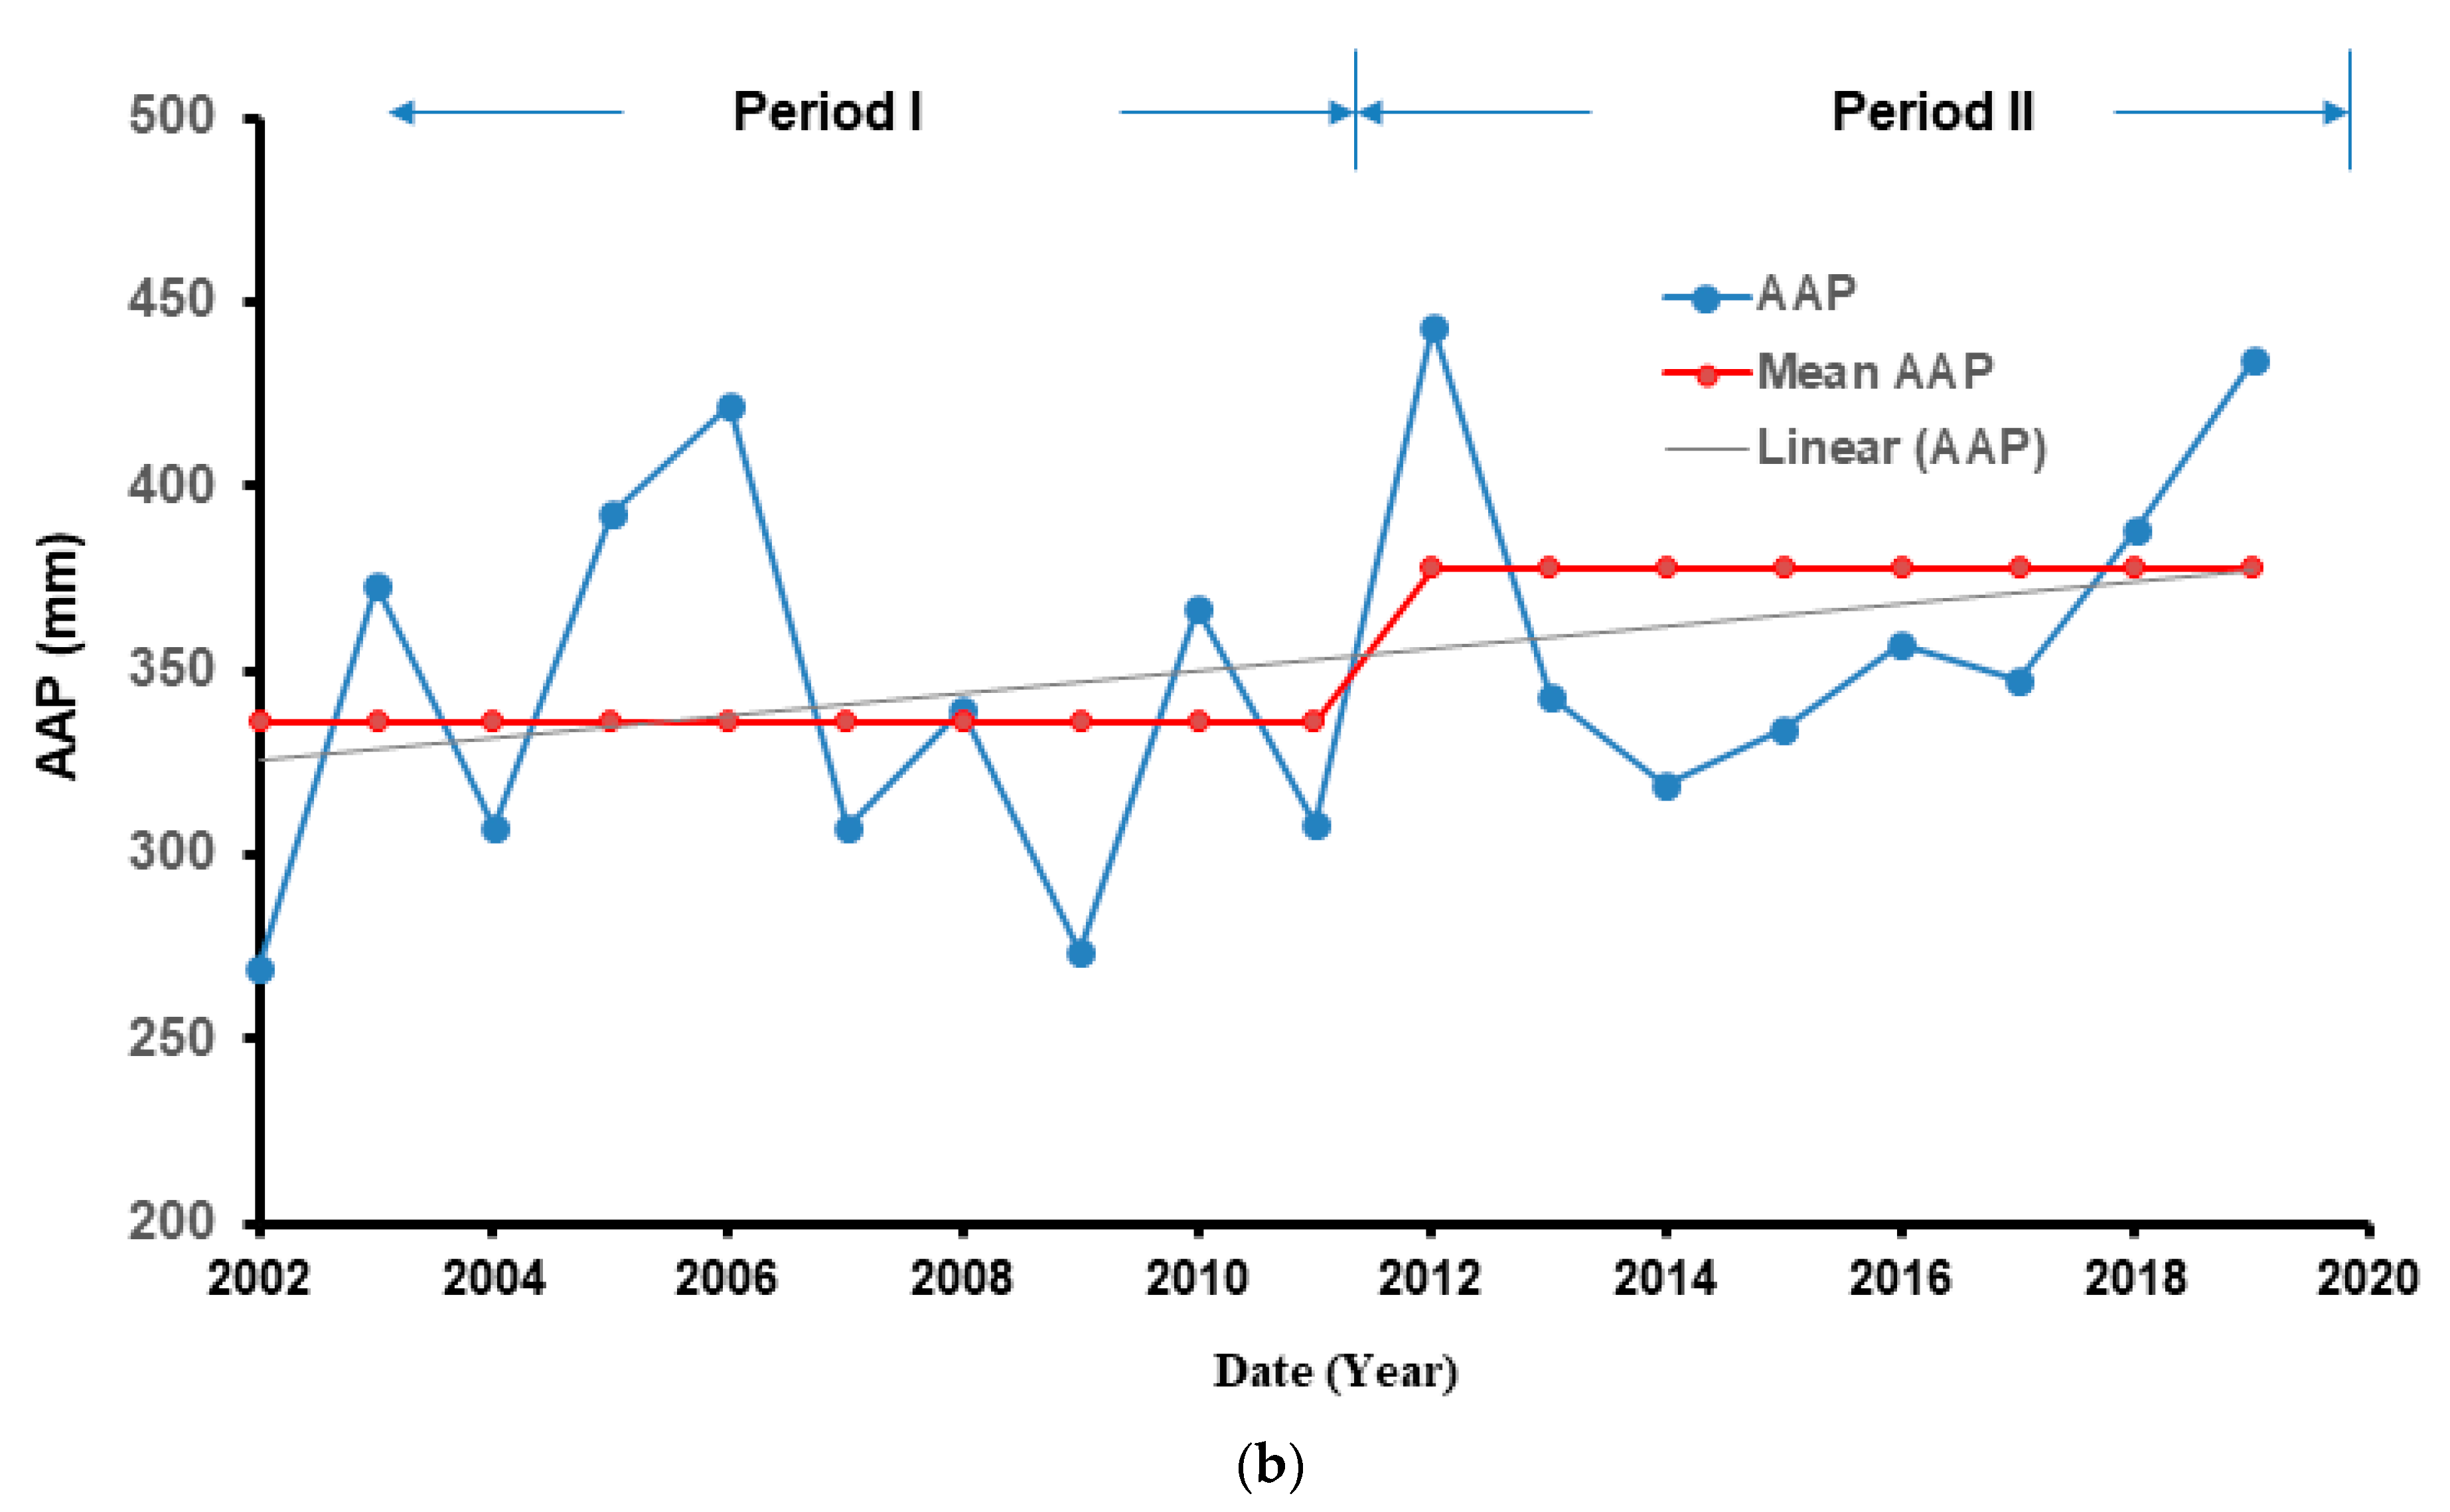
4.1. Analysis of Rainfall Data
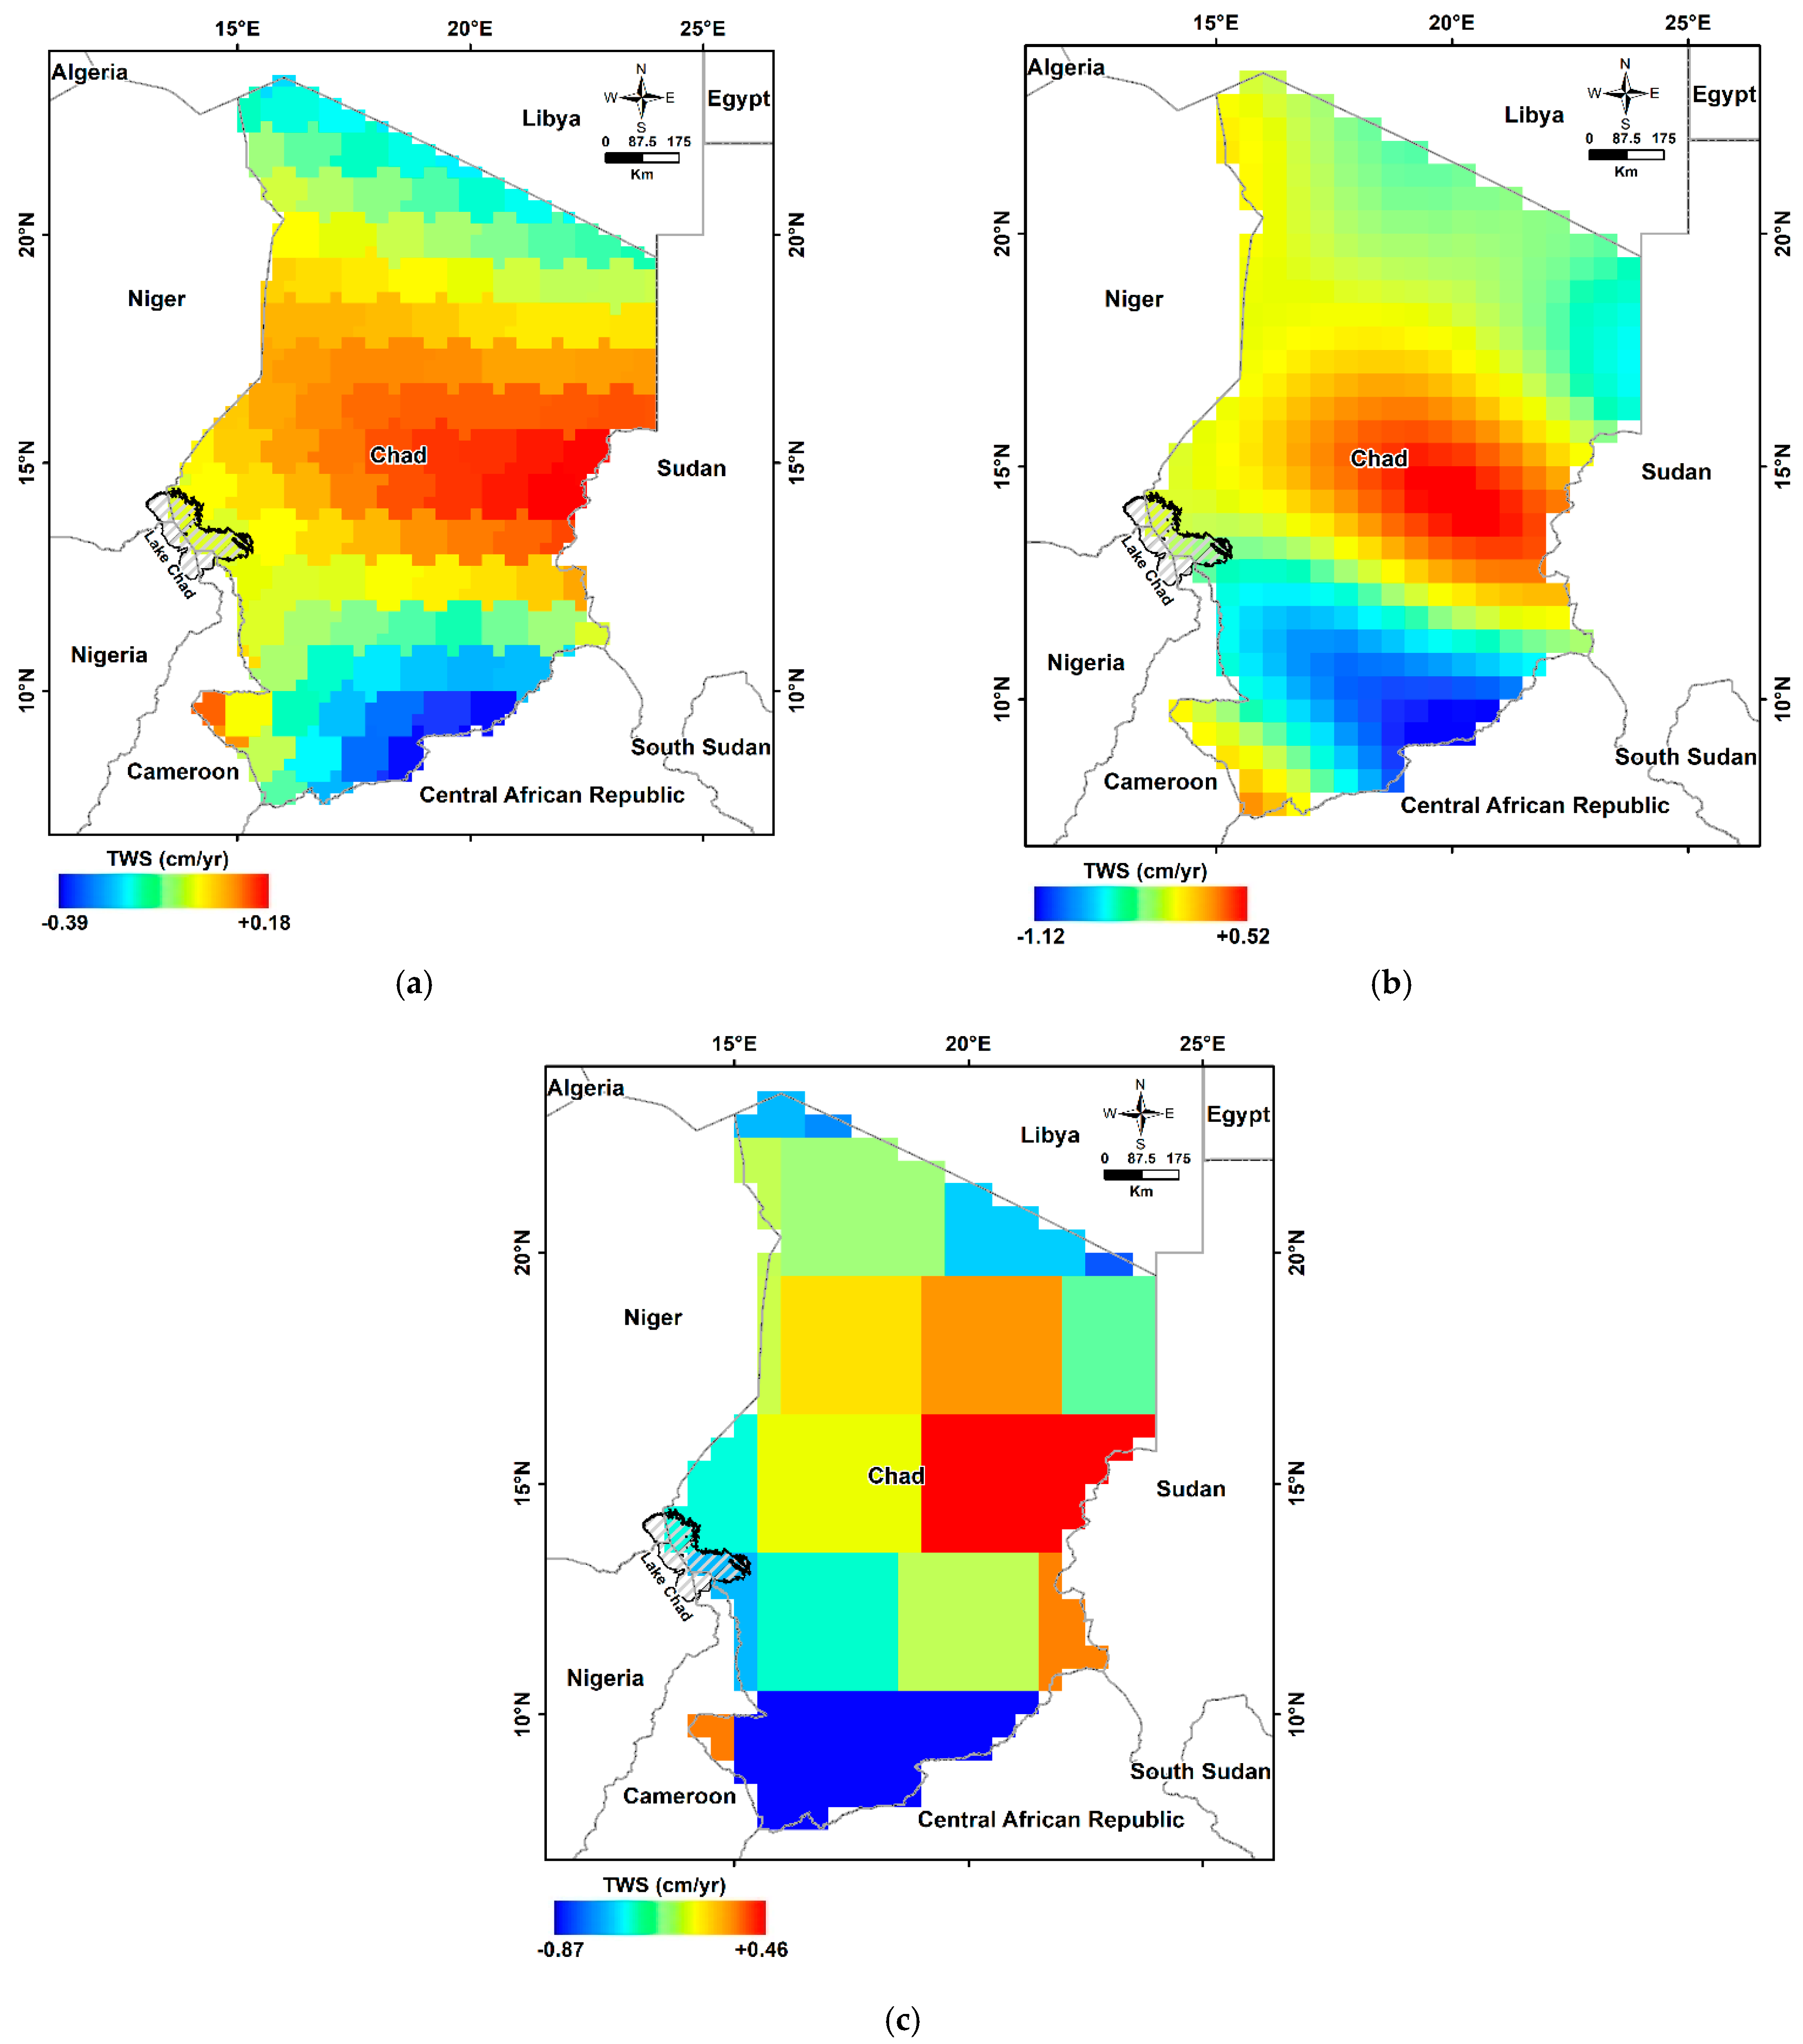
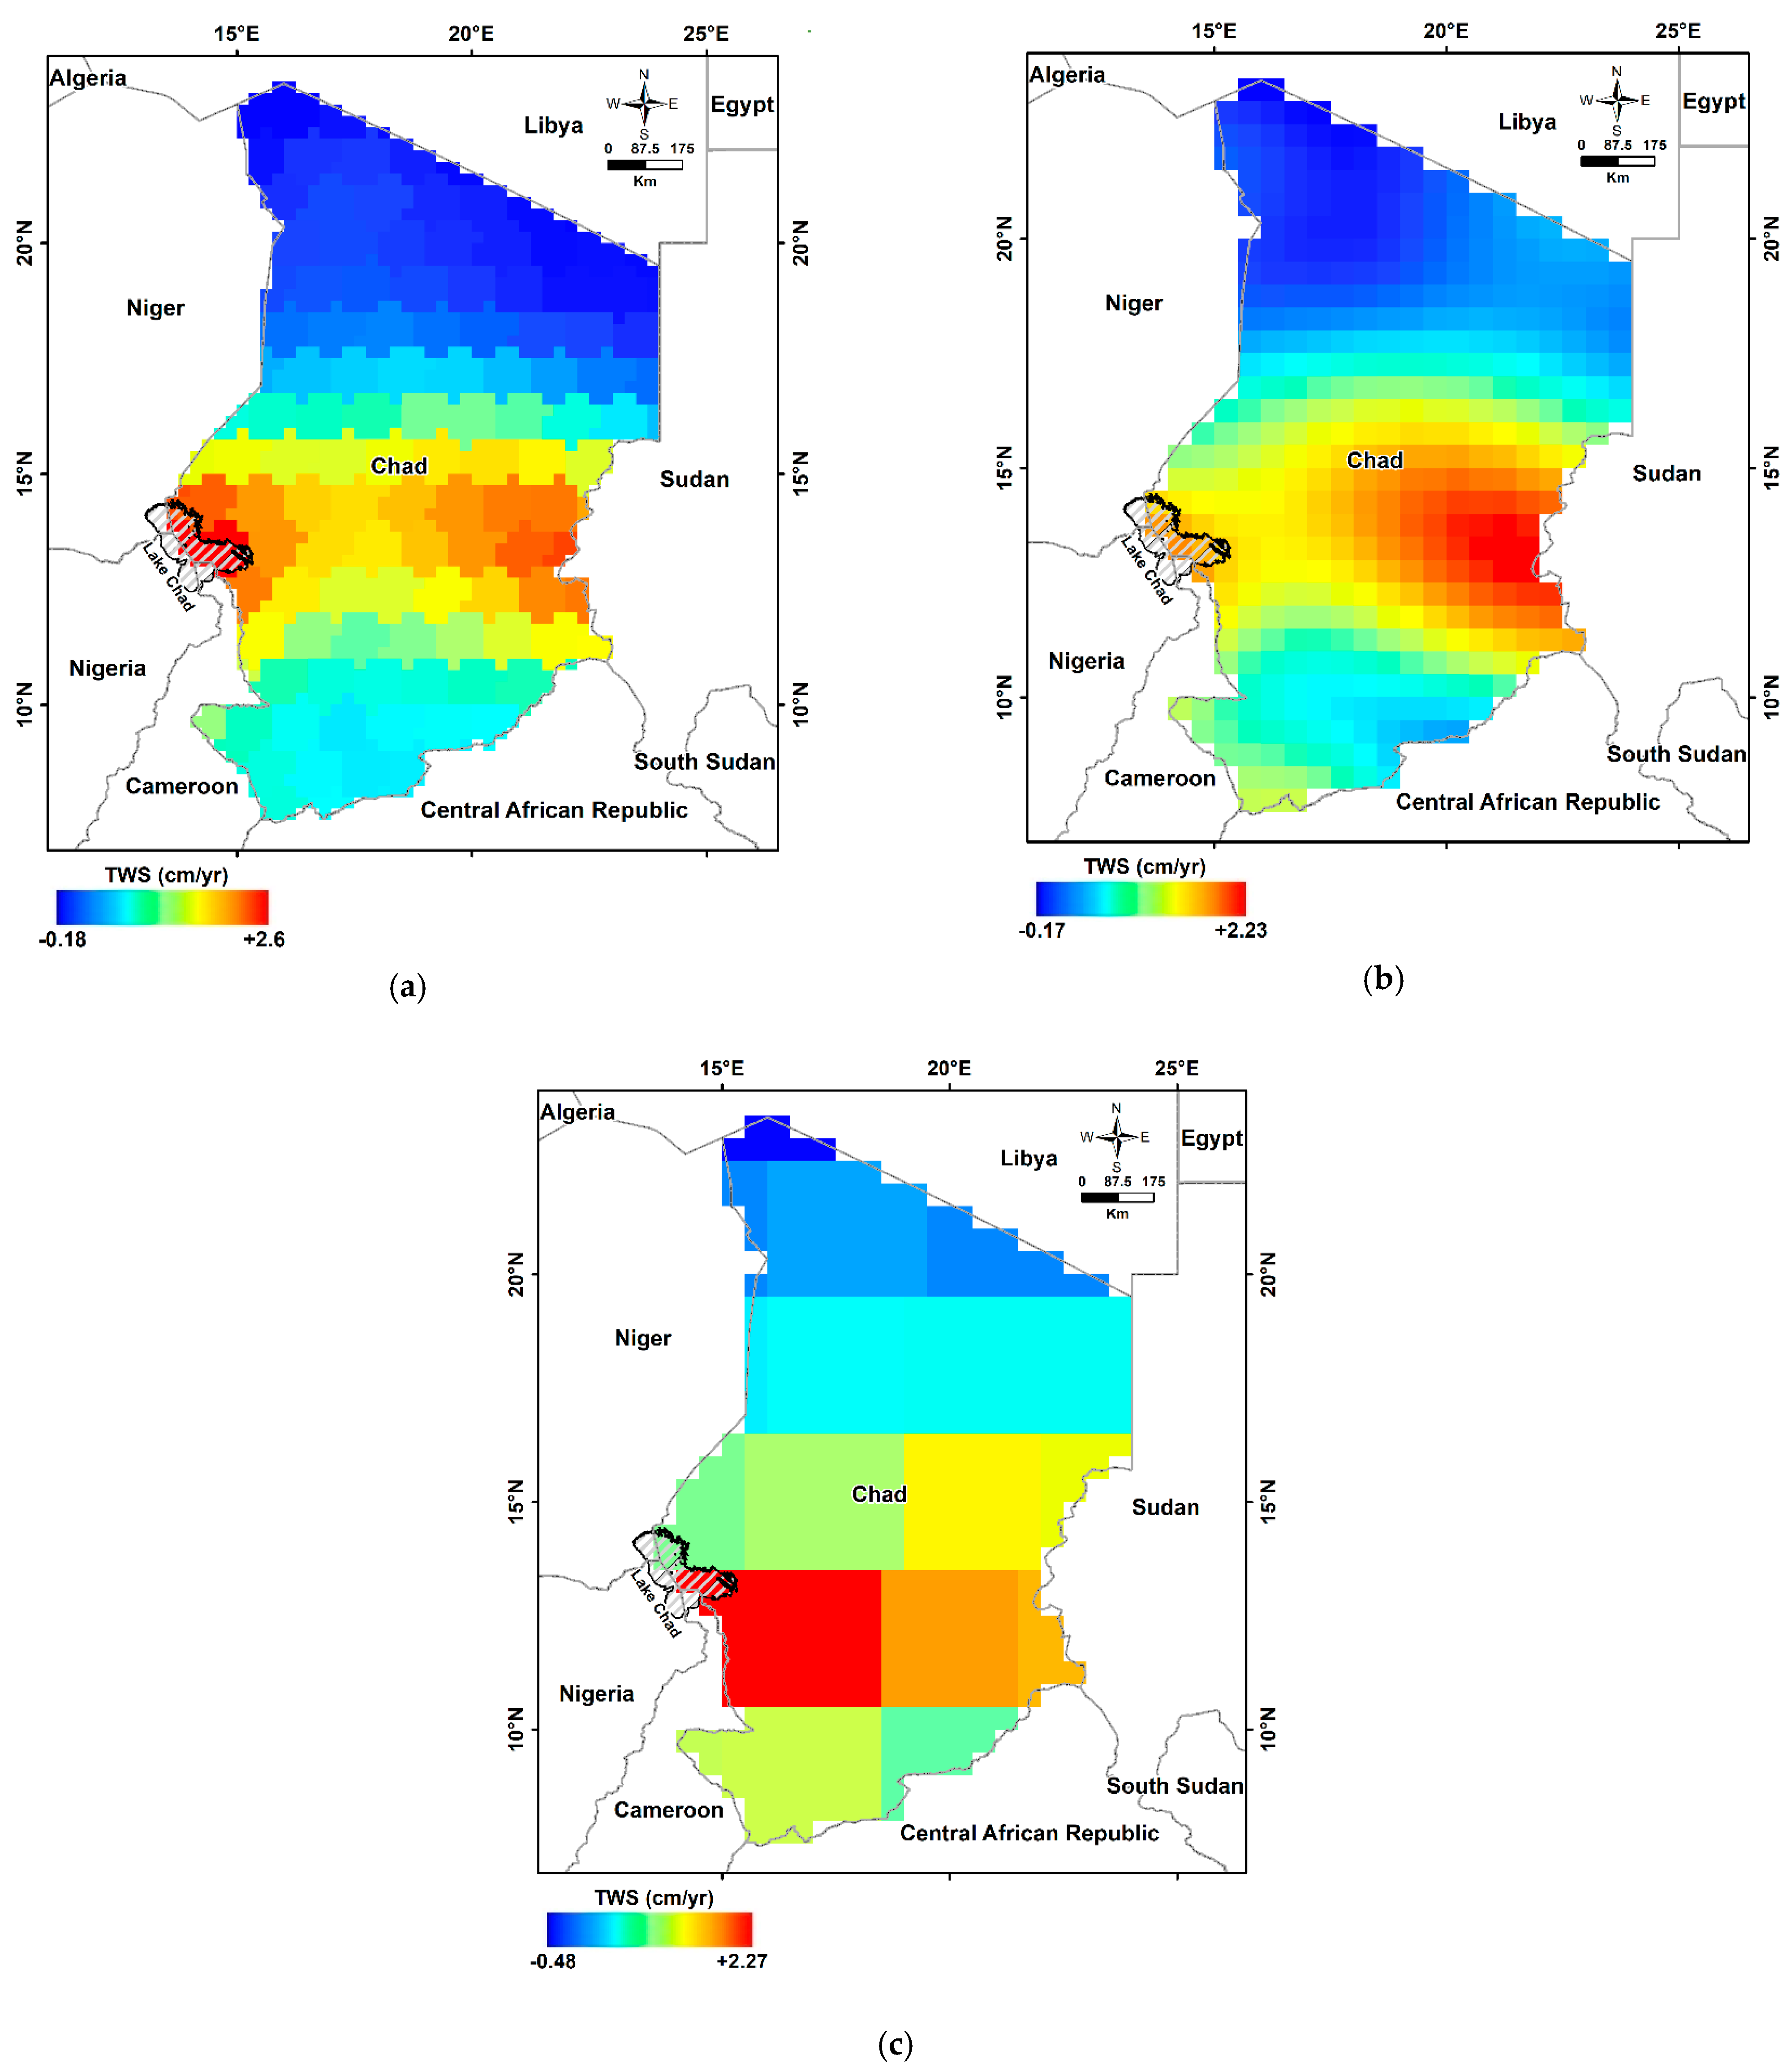
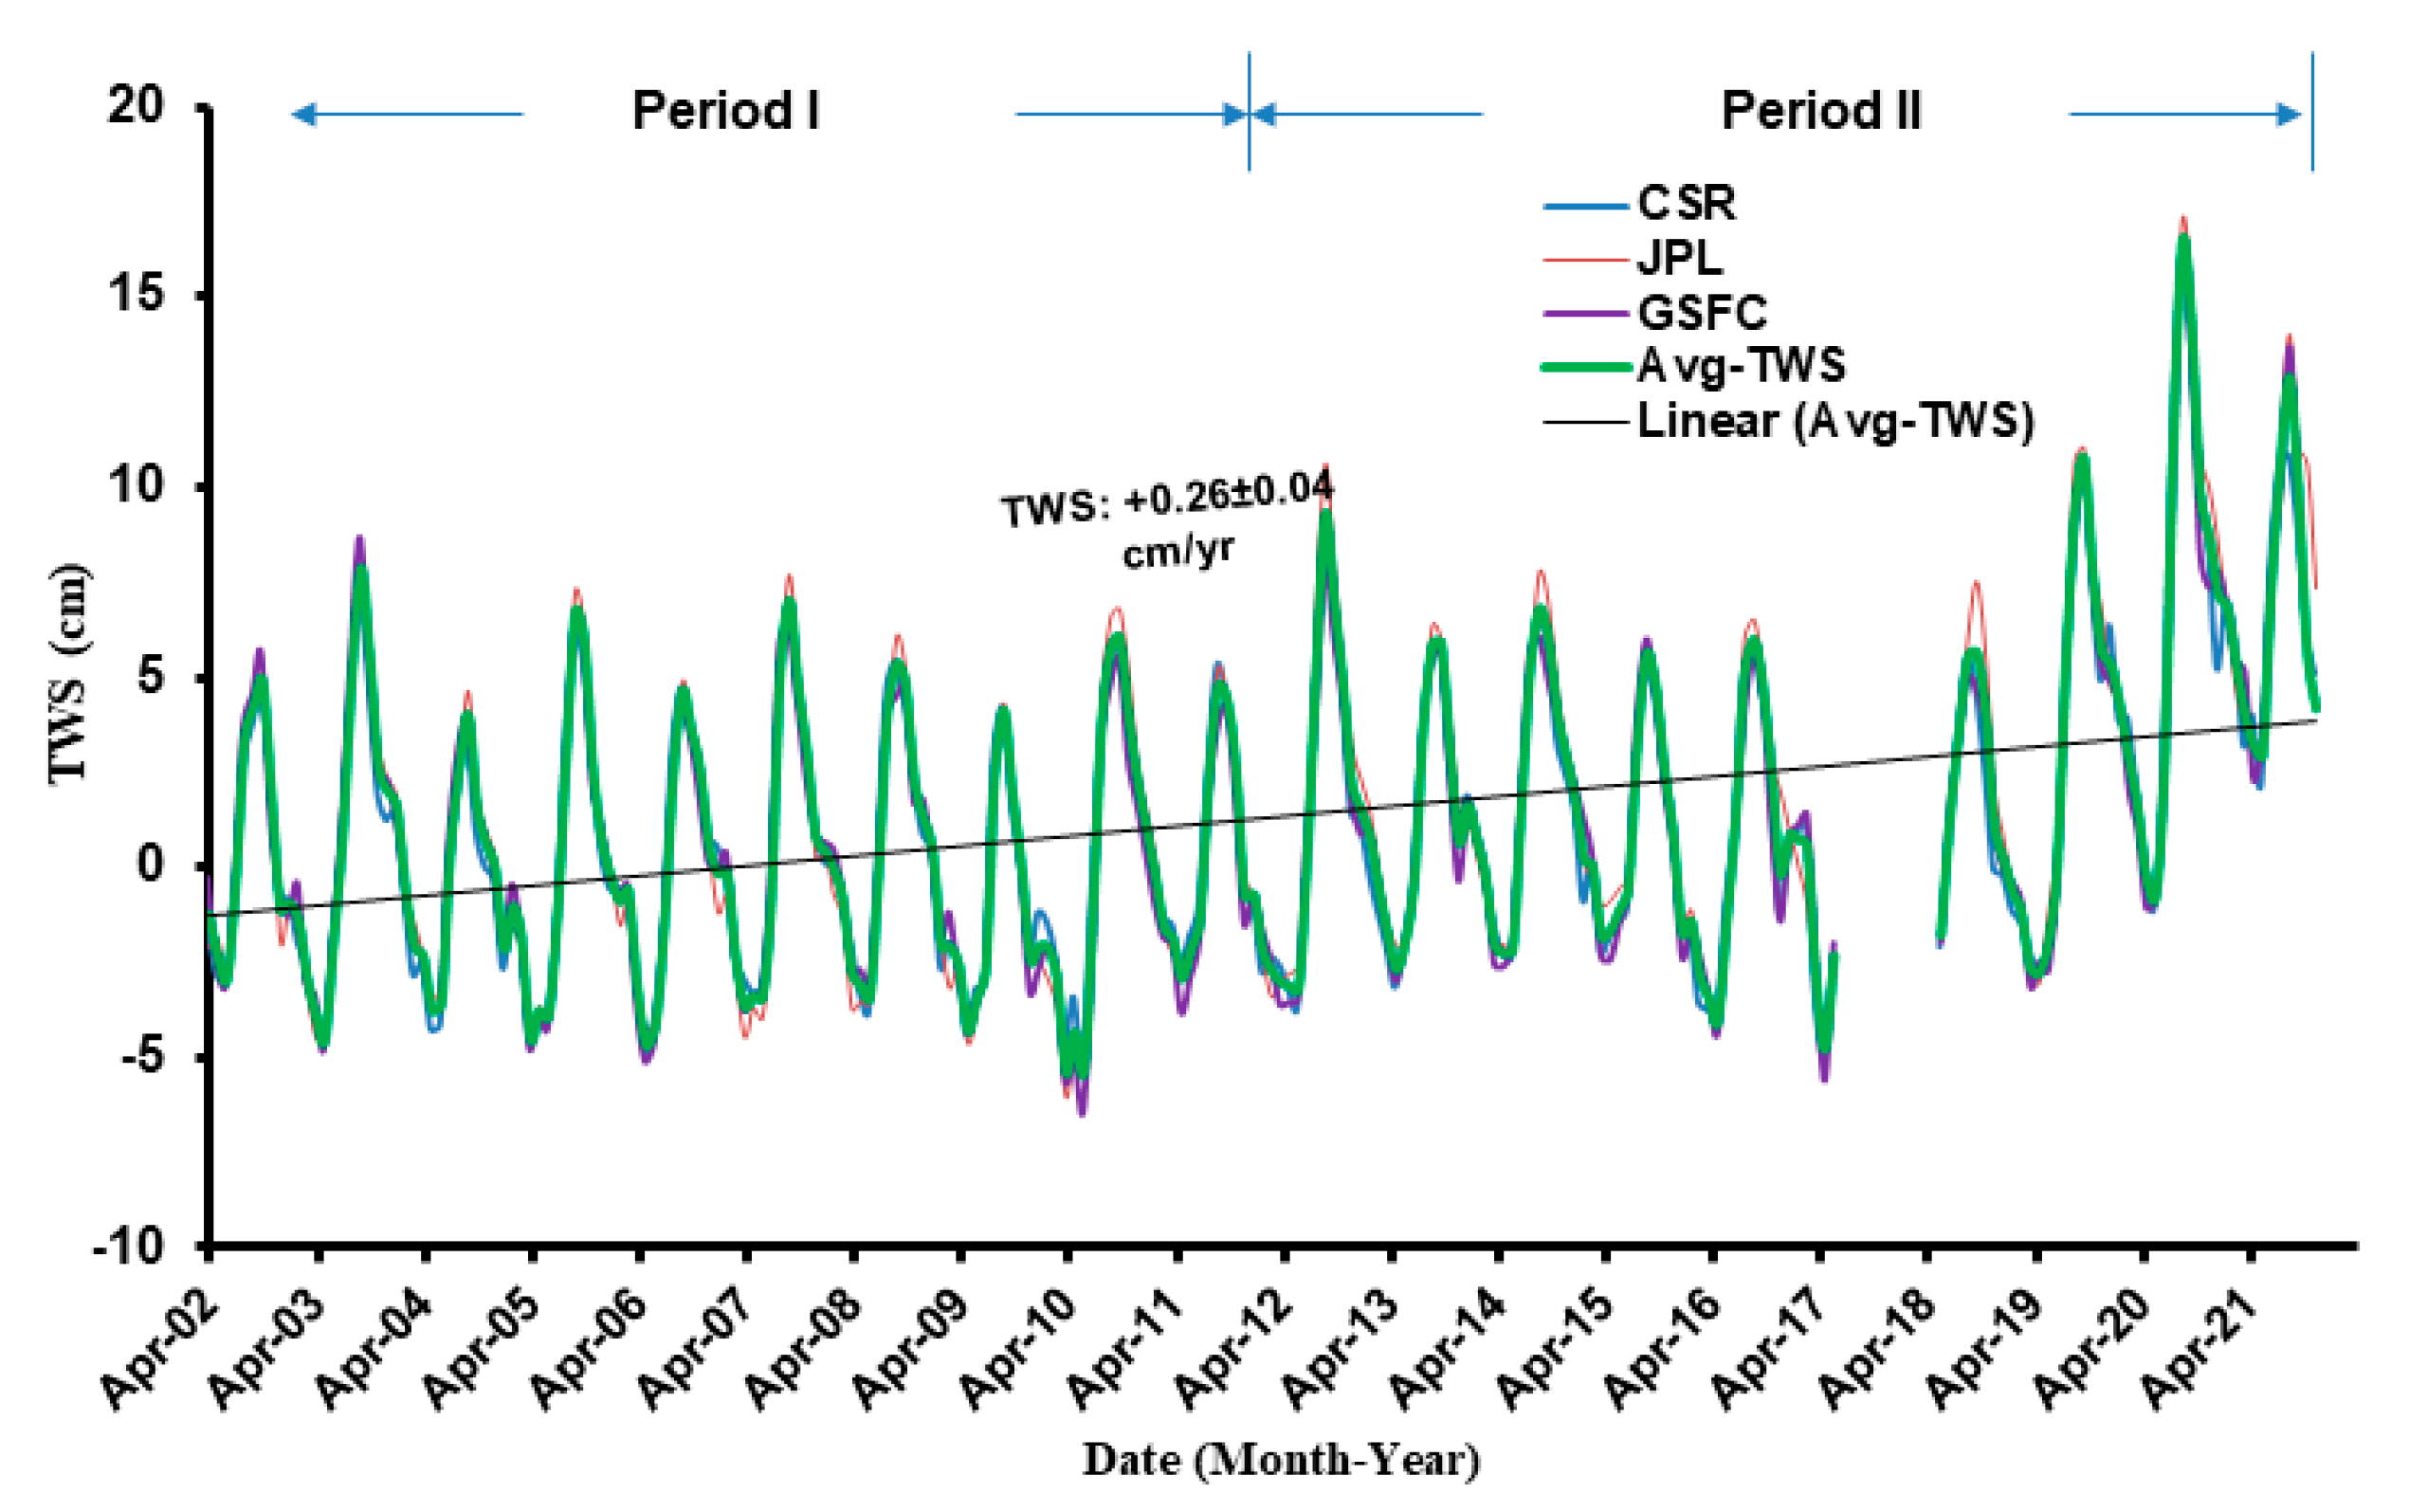
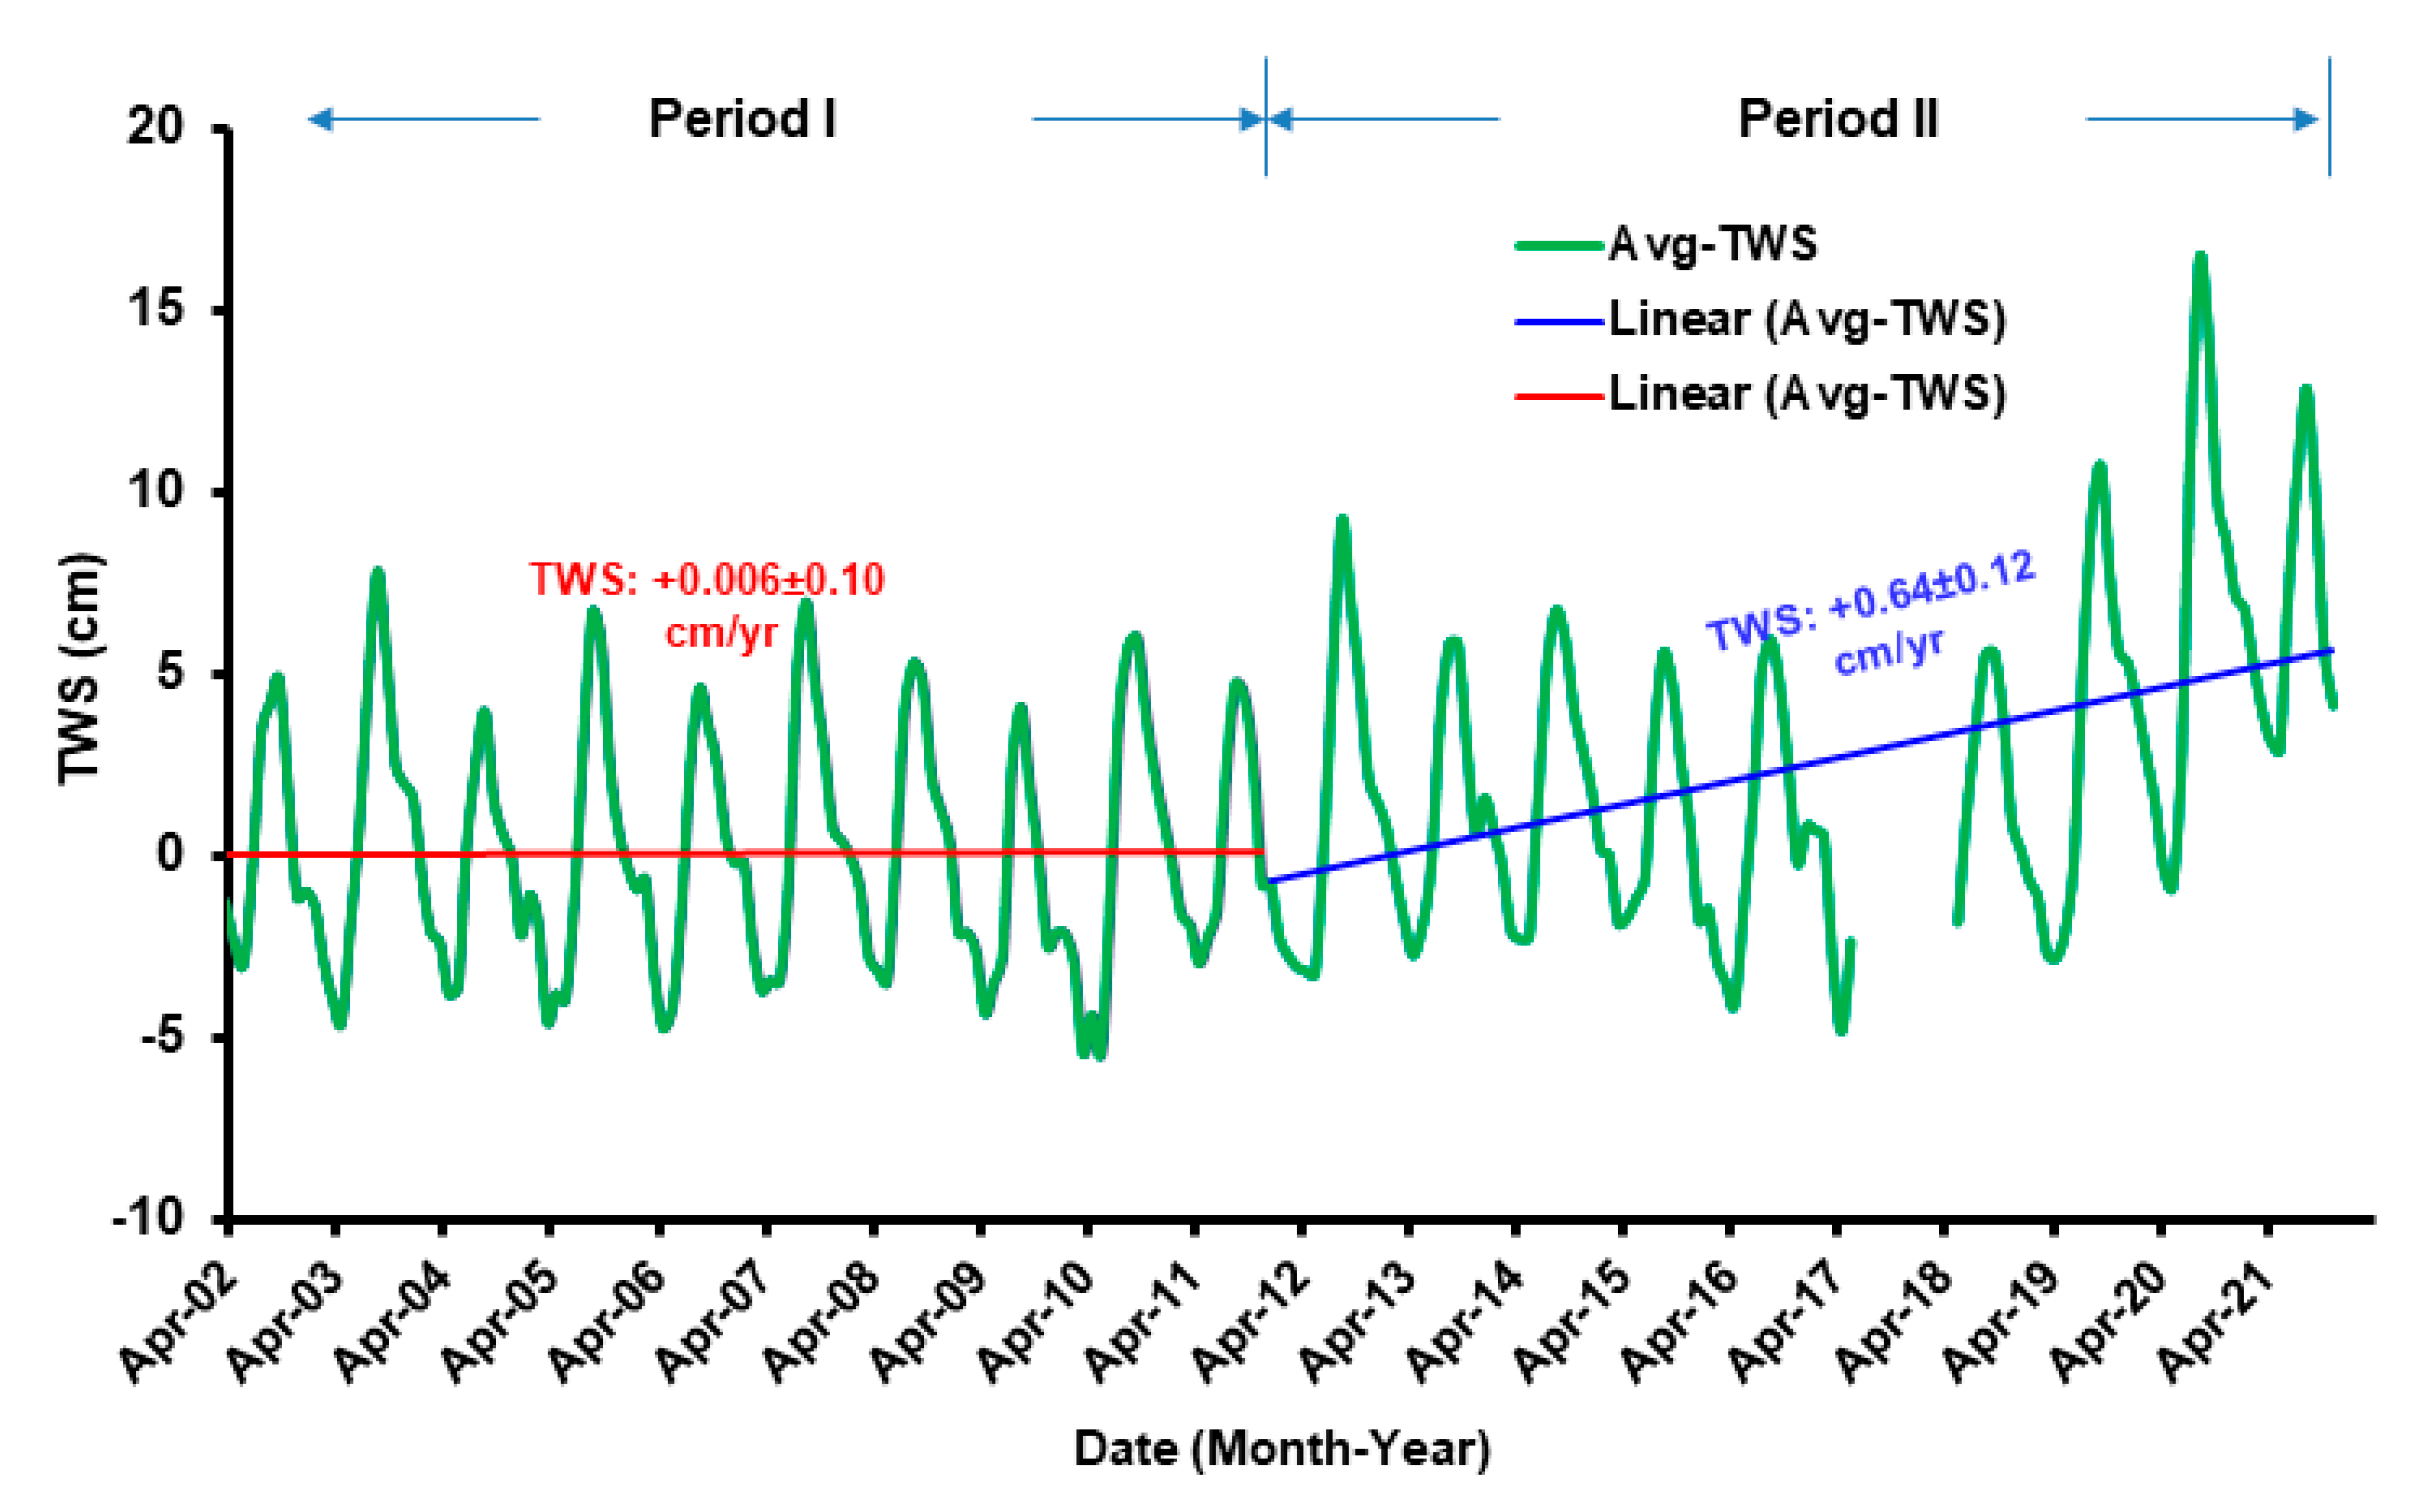
4.2. Analysis of TWS Variations
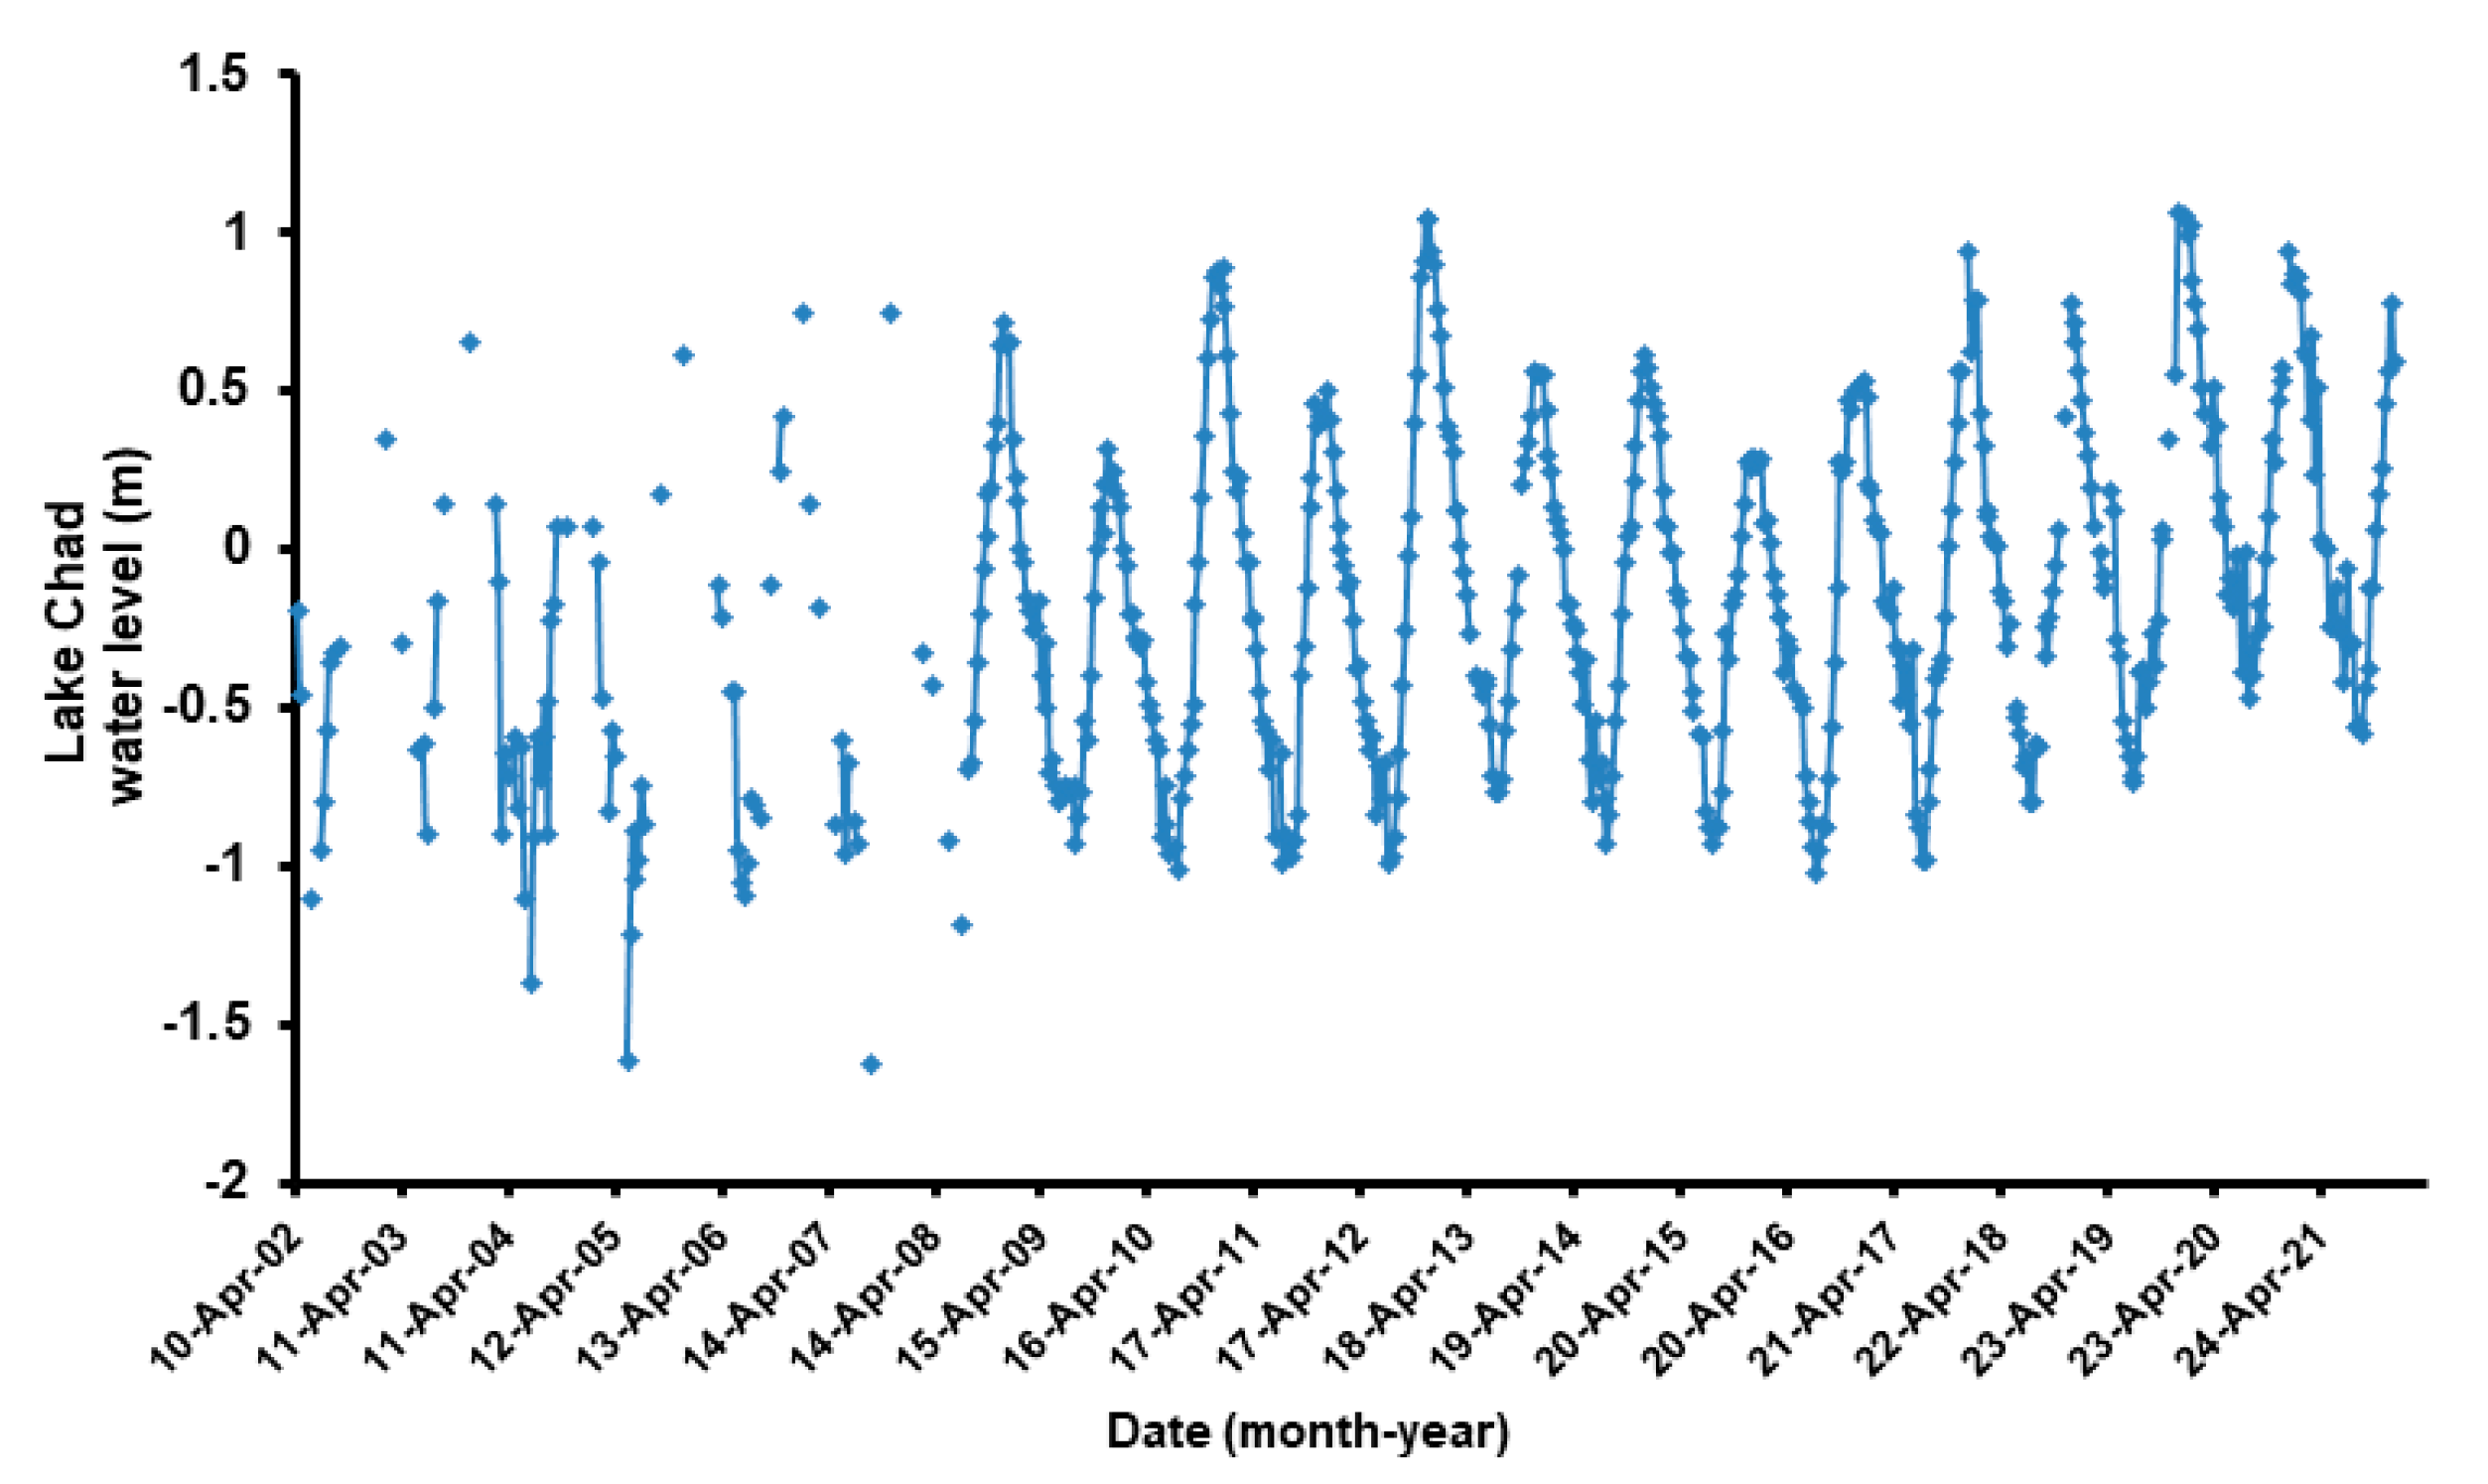
4.3. Examining the Lake Chad’s Surface Water Levels over Time
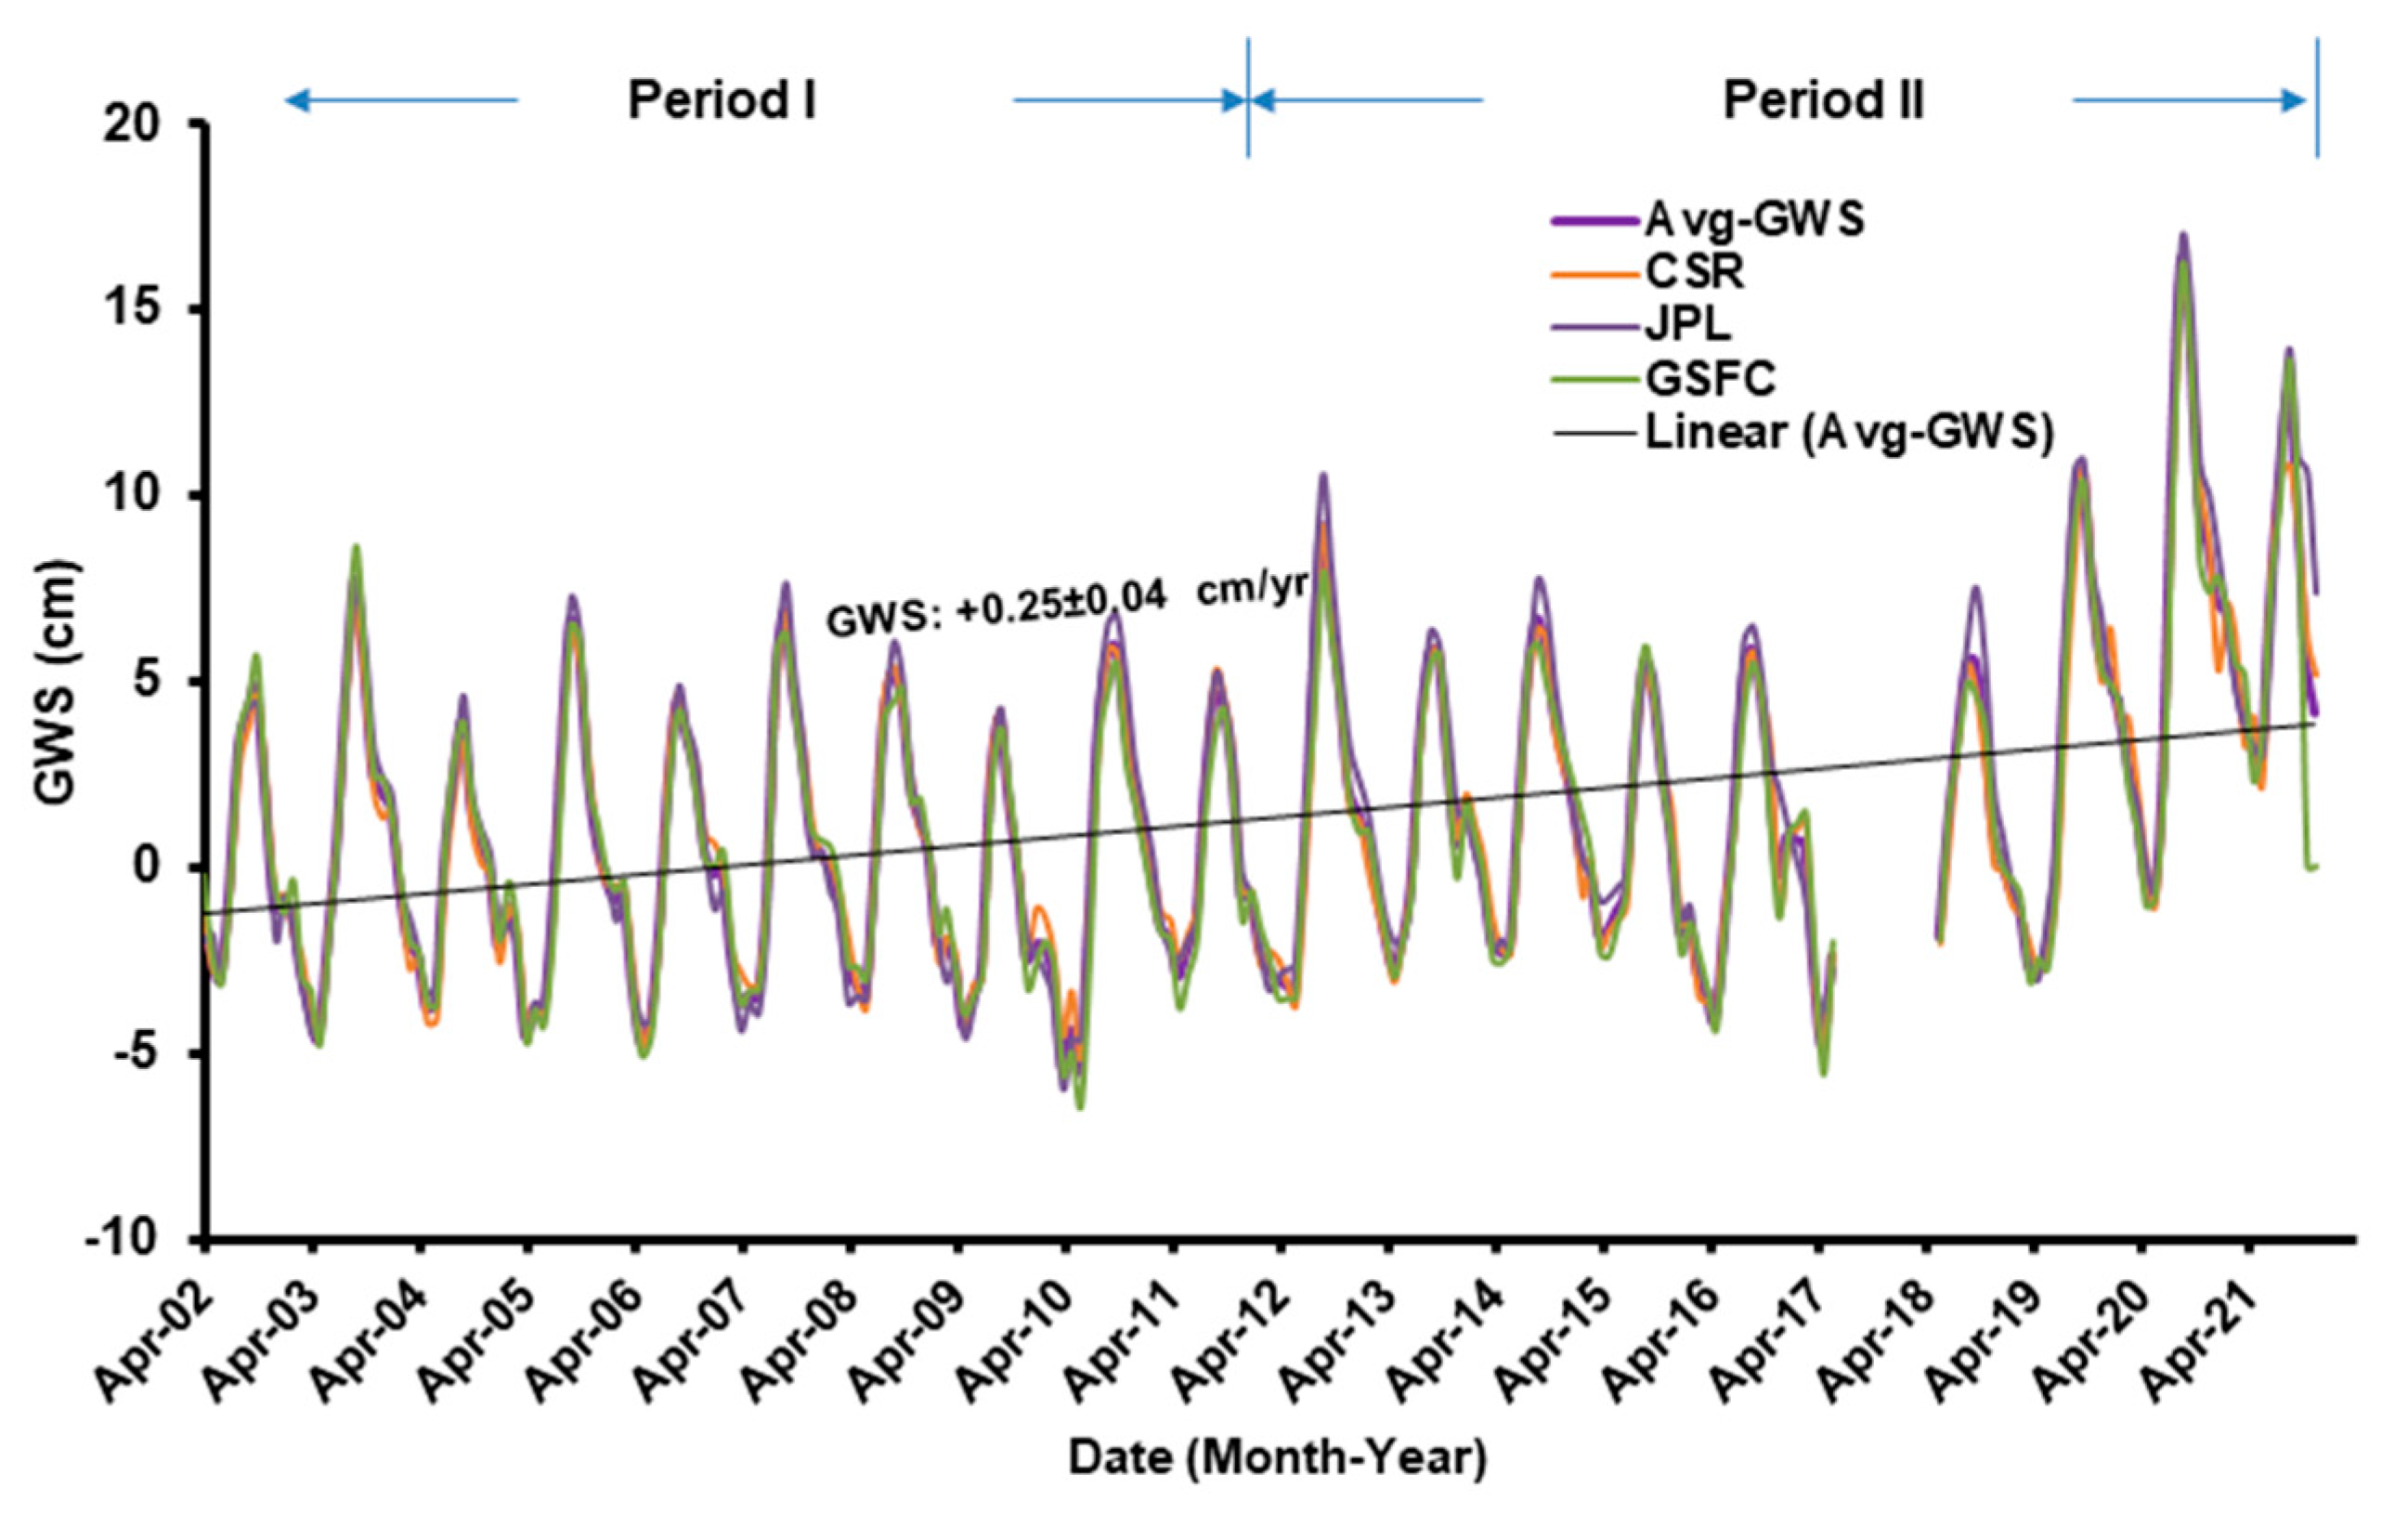
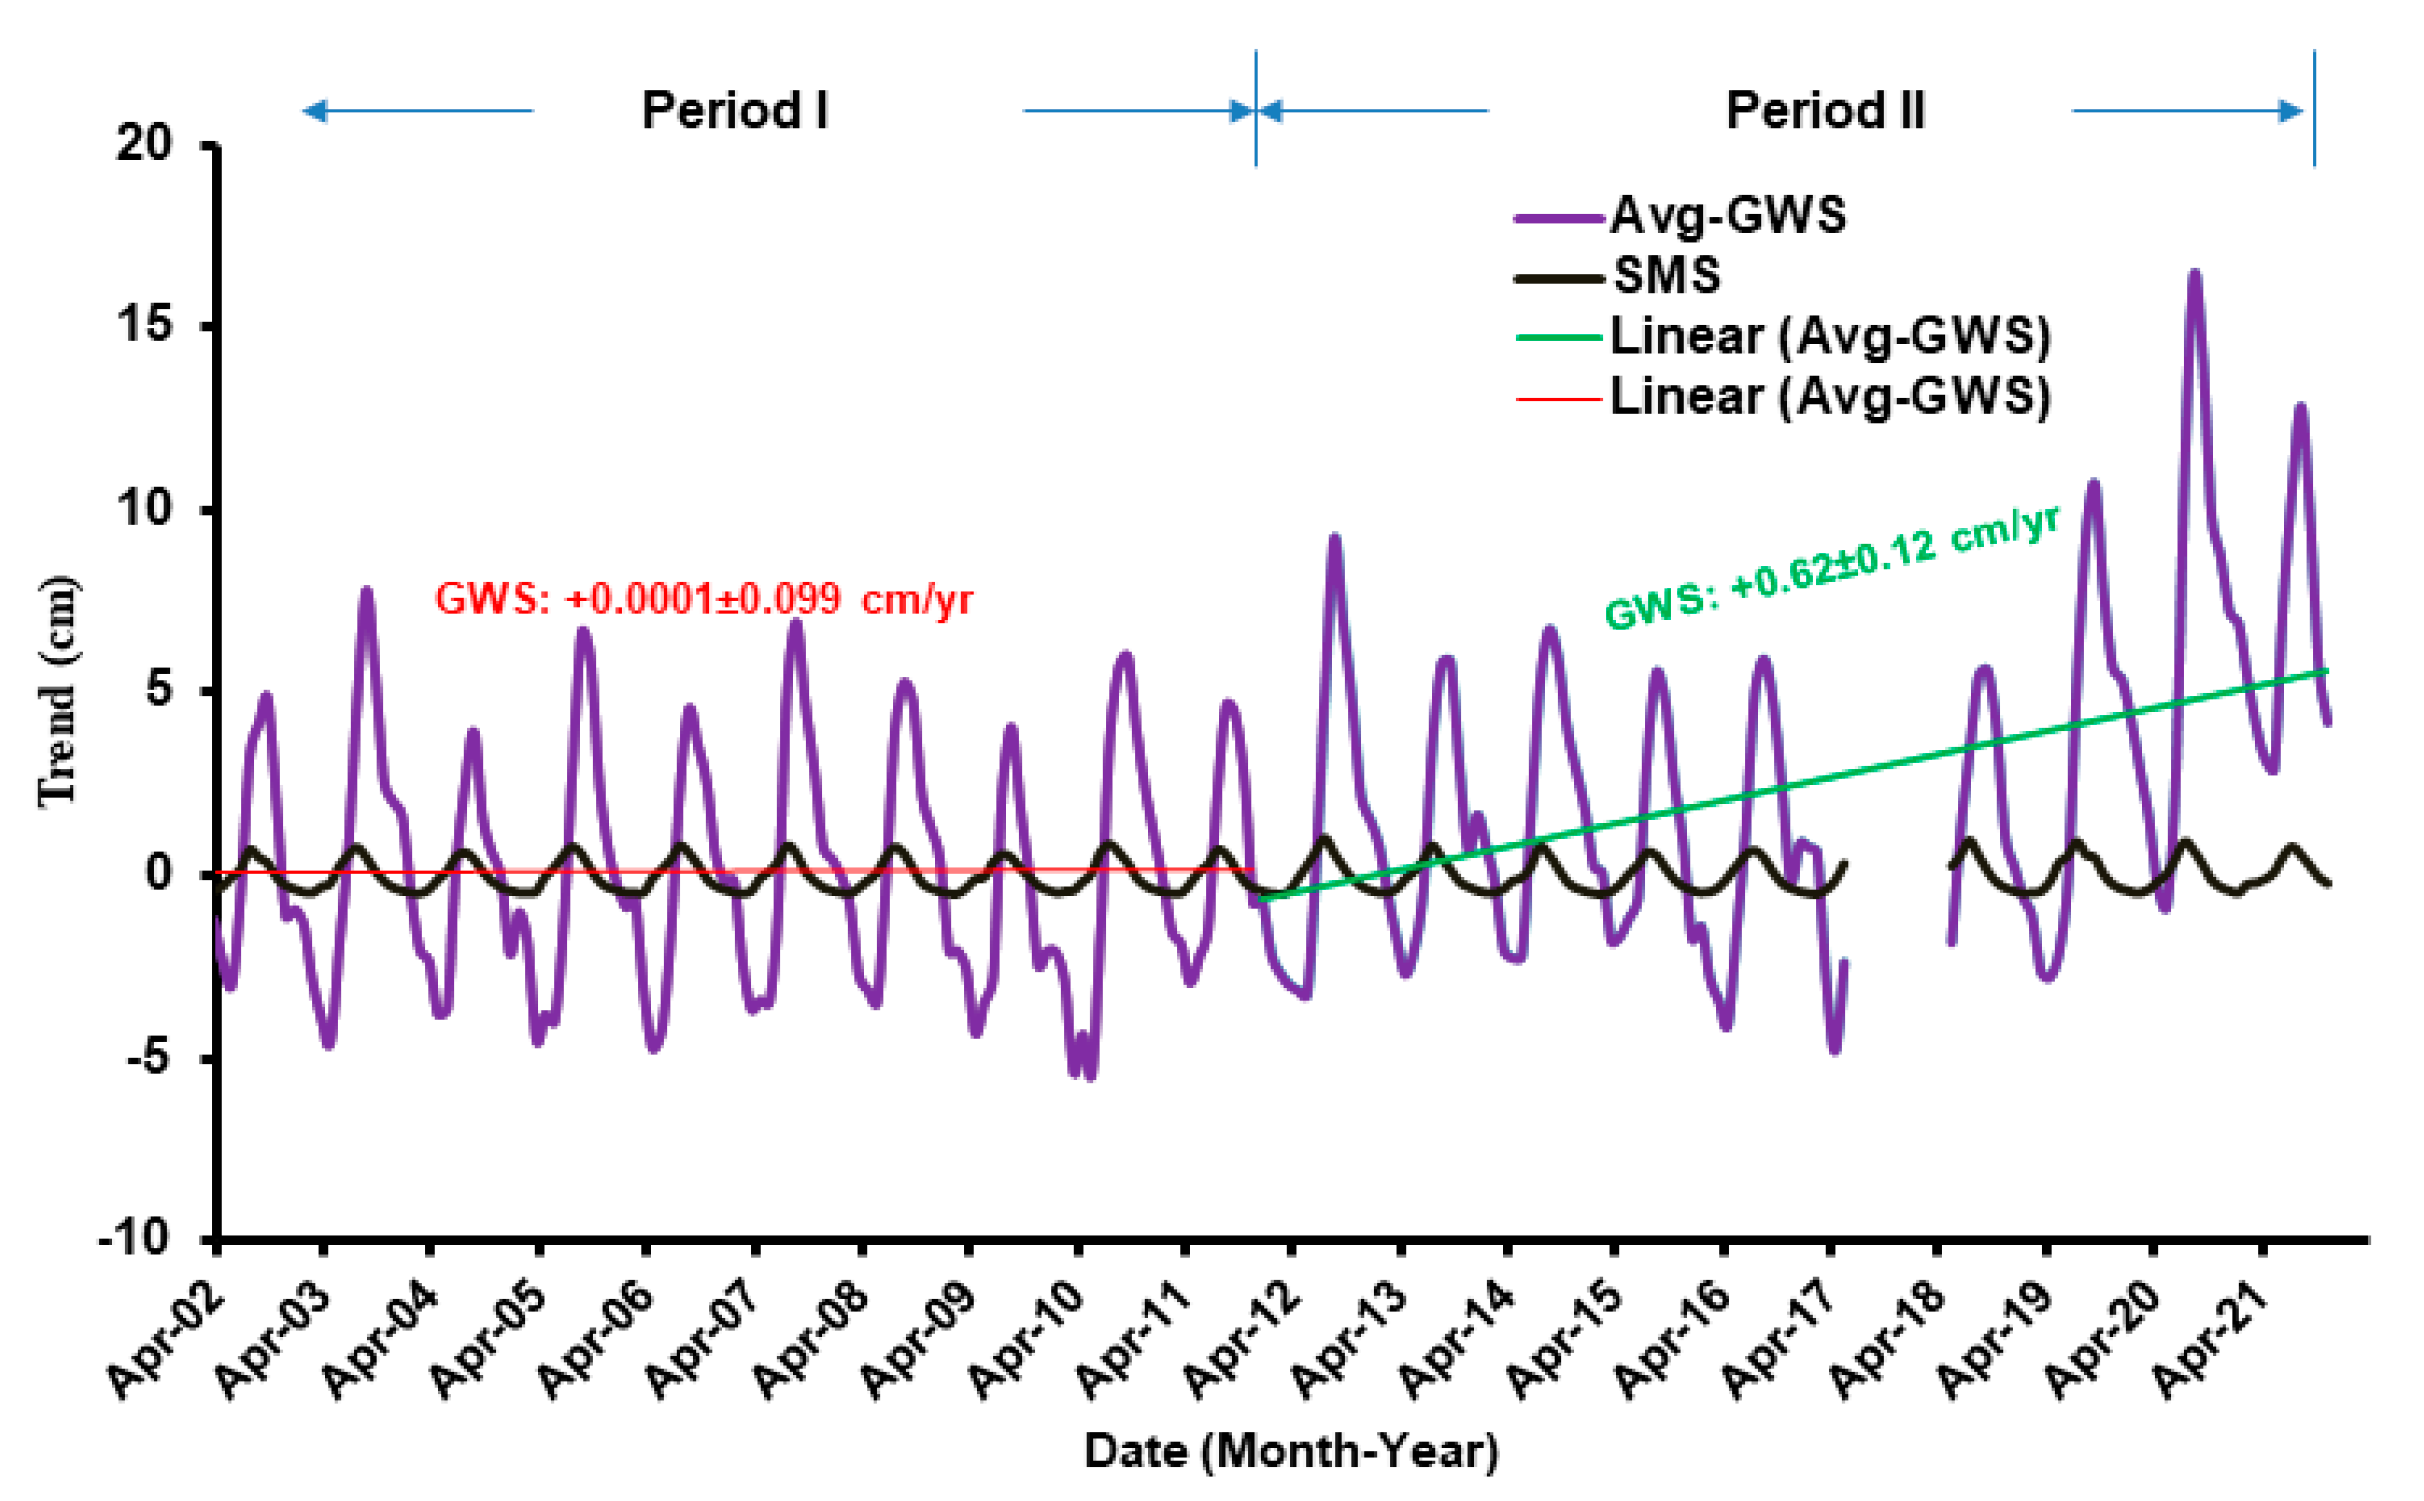
4.4. Analysis of the ΔGWS
4.5. Recharge Rate
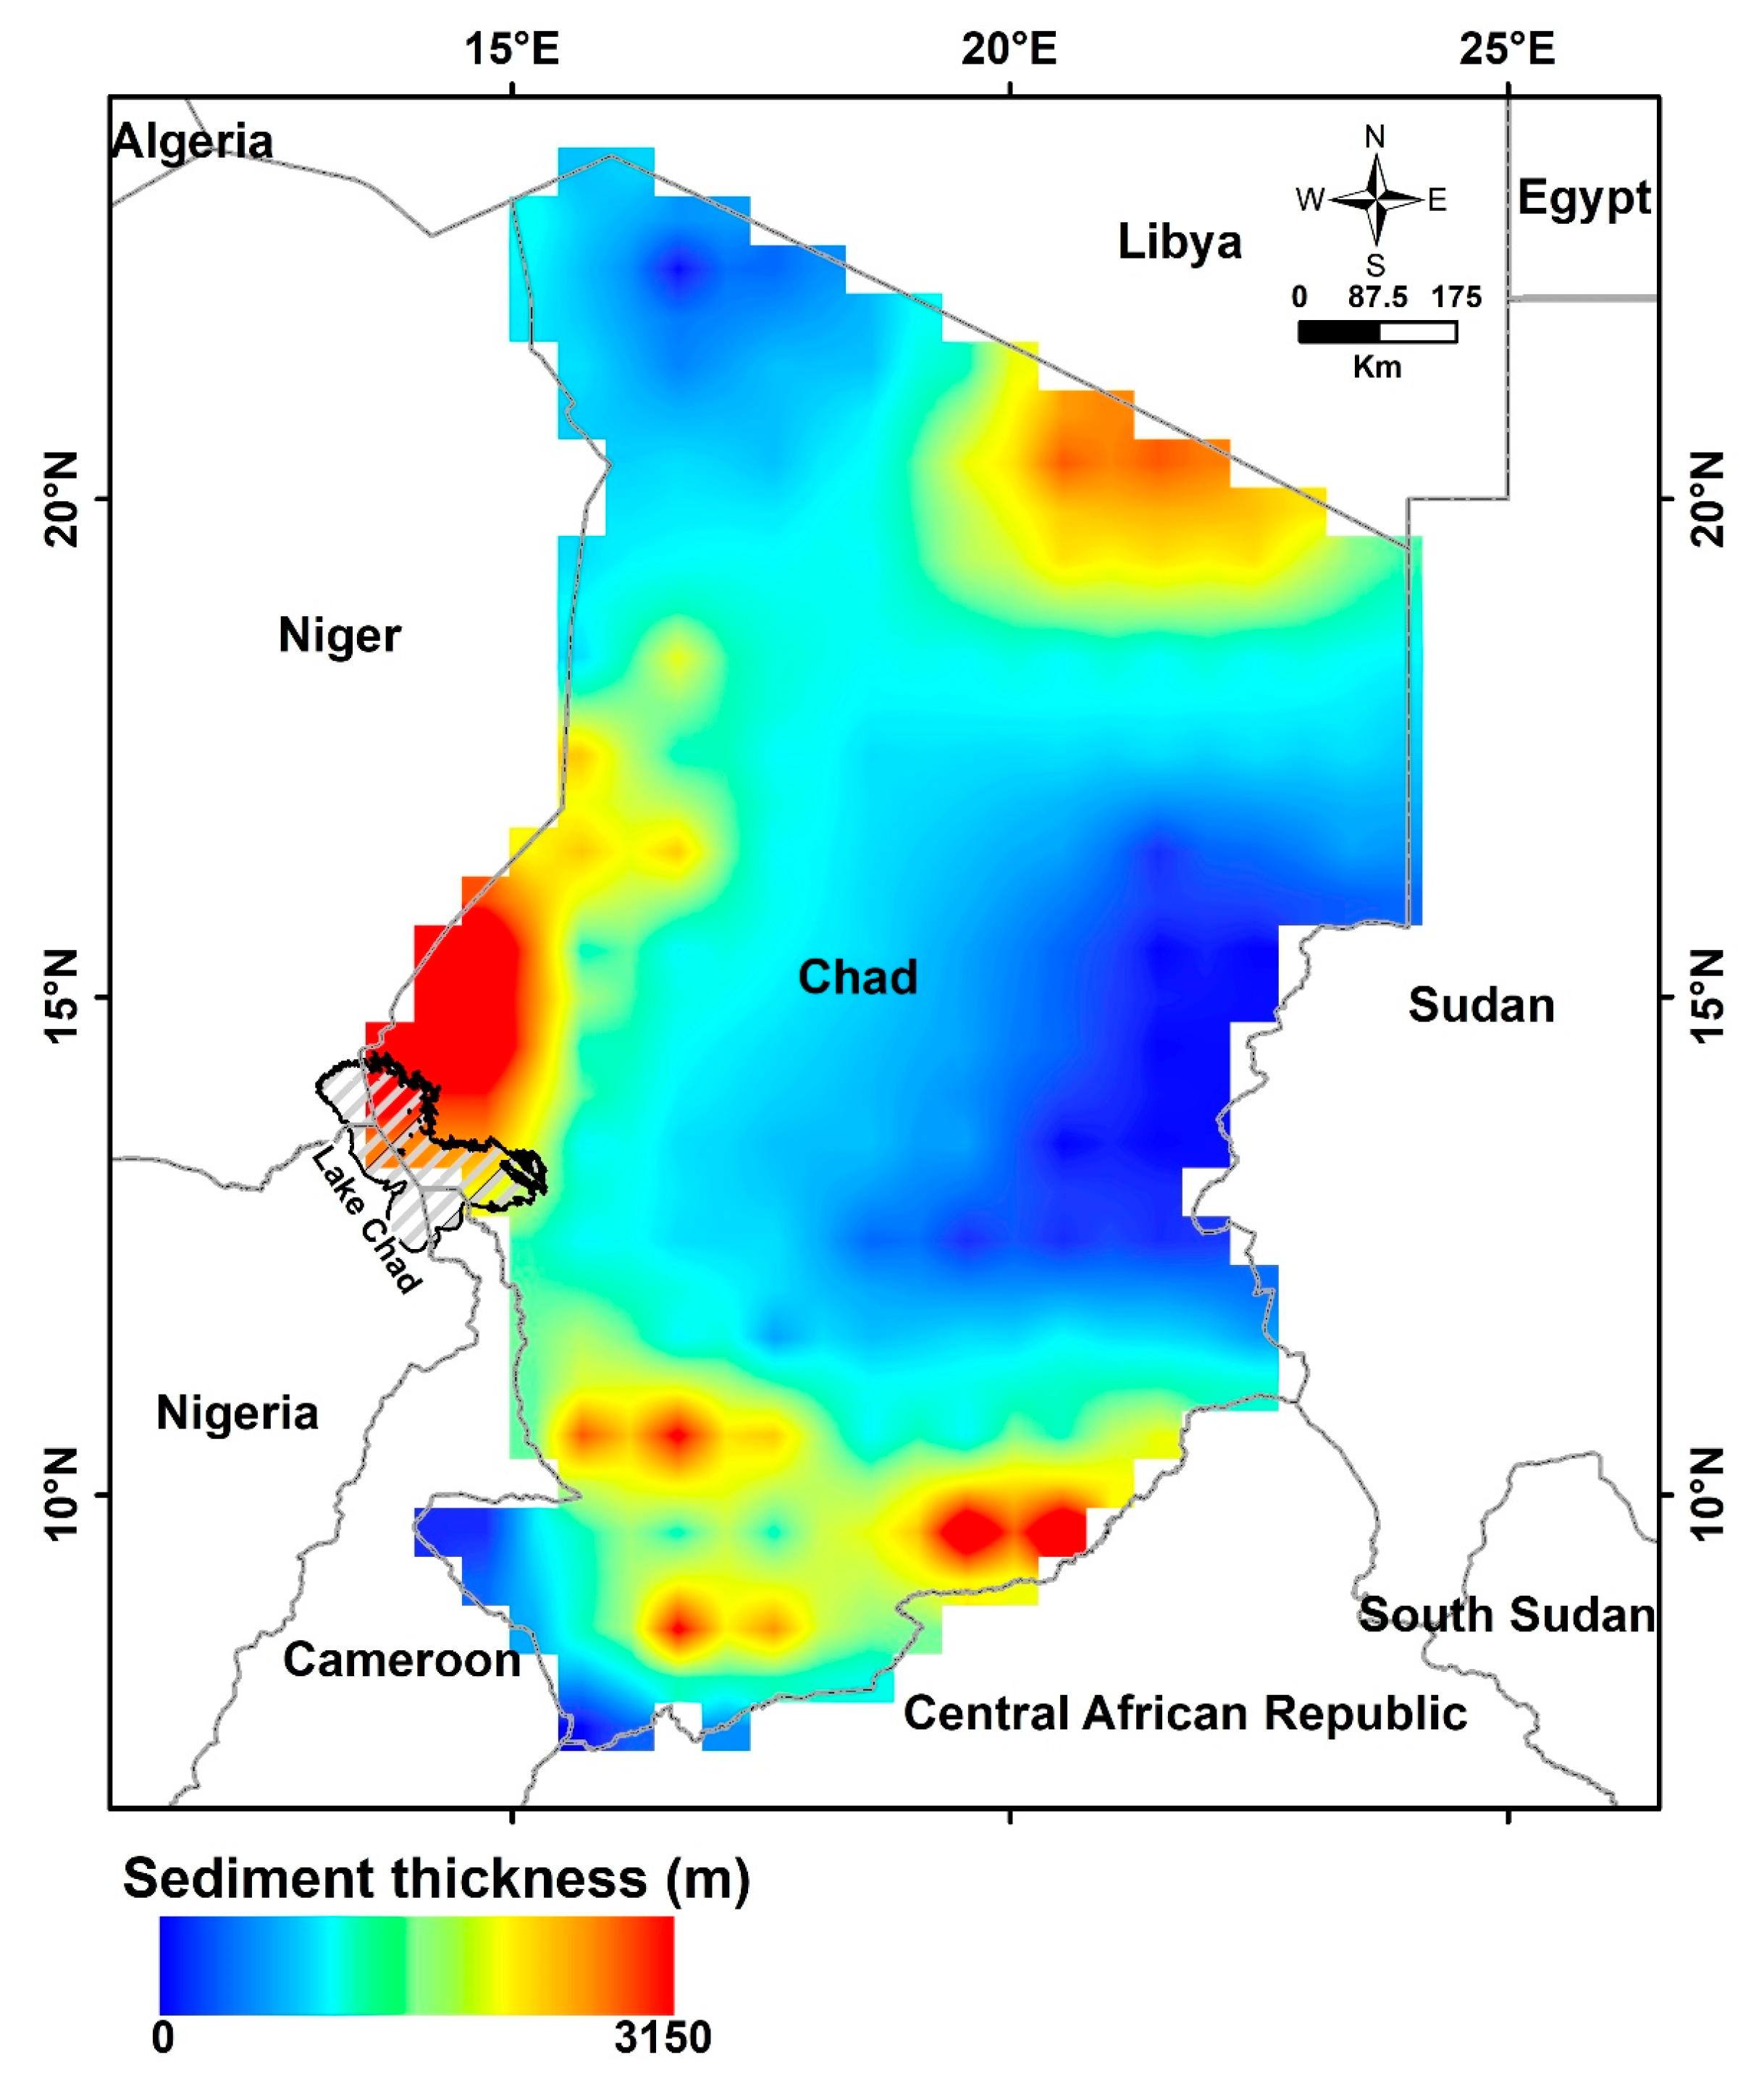
4.6. Sediment Thickness
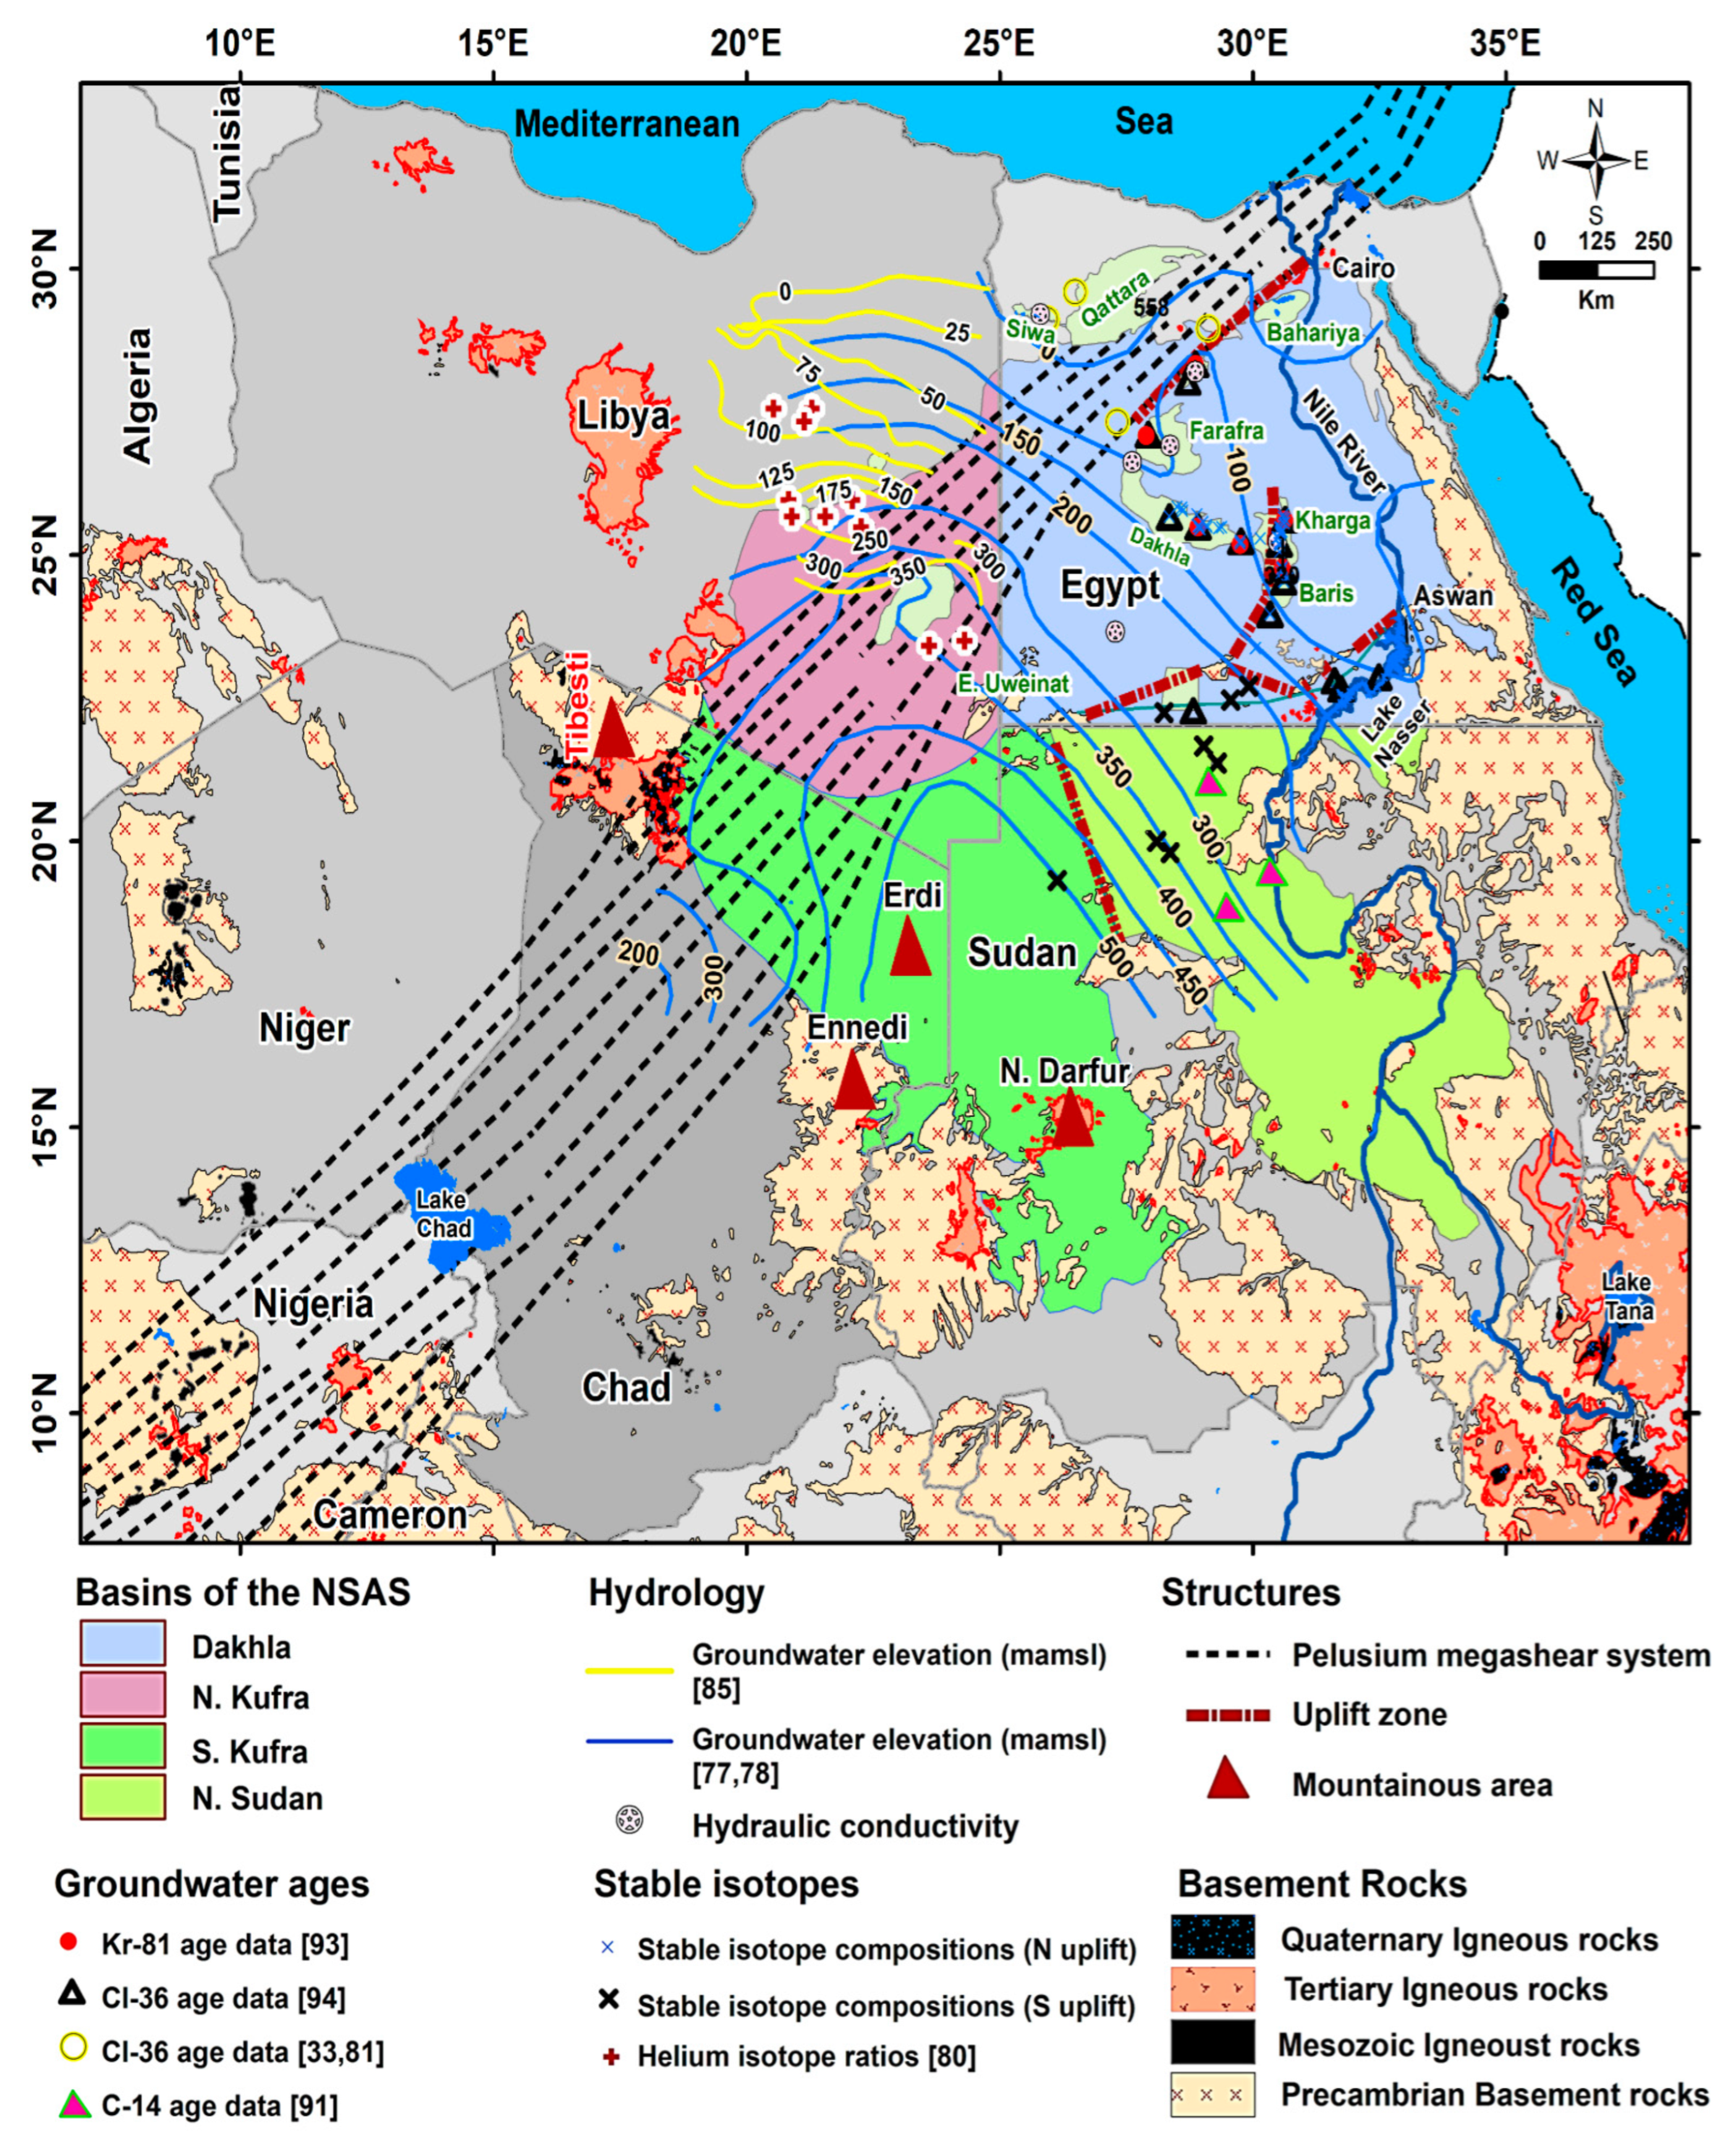
4.7. Structural Connection between the Kufra and the Dakhla Basins
4.8. Uncertainties, Implications, and Future Research
5. Conclusions
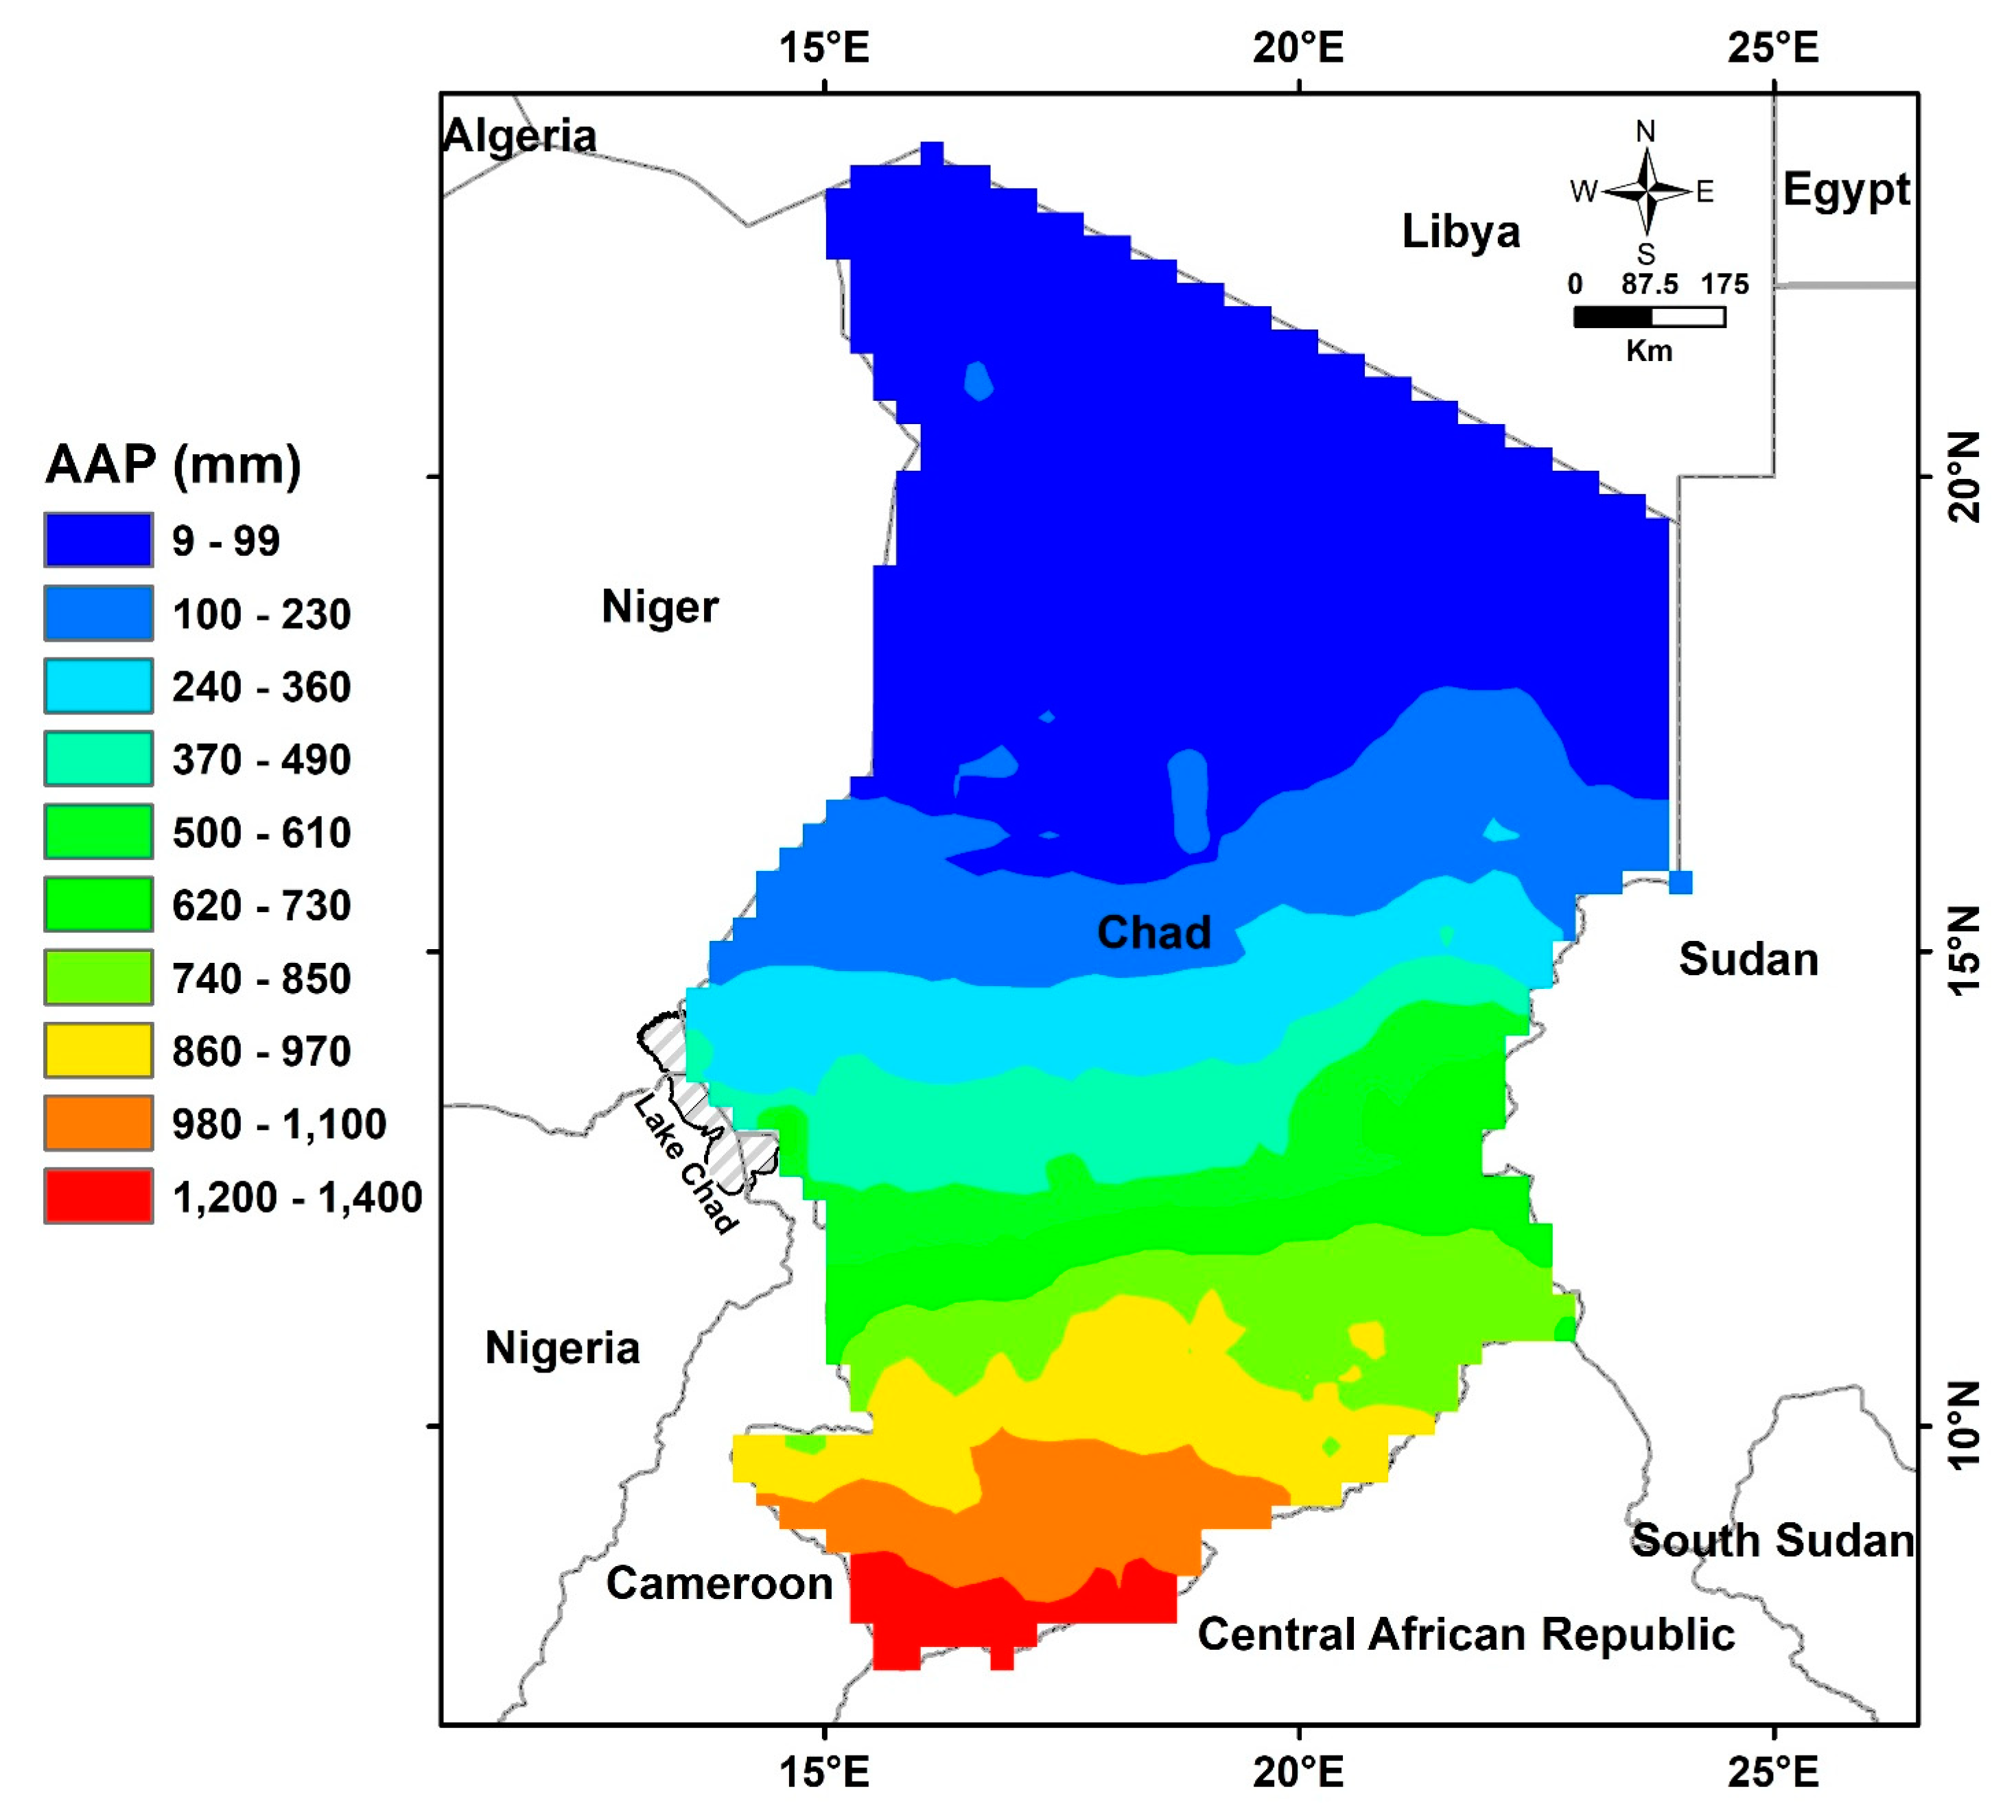
- Based on rainfall investigations in Chad, two different climatic periods spanning the research period were determined: Period I (April 2002 to December 2011) was witnessing a lower precipitation rate of 336.22 mm yr−1; and following Period II (January 2012 to December 2021), which is receiving a higher rainfall rate of 377.8 mm yr−1.
- During the entire study period, ΔTWS shows a broad improvement pattern.
- The increase rate of GWS for Period I was calculated at +0.0001 ± 0.099 cm yr−1; and a higher rate of +0.62 ± 0.12 cm yr−1 was found for Period II.
- The GWS shows a cumulative increase rate of +0.25 ± 0.04 cm yr−1 throughout the investigated region over the entire examined period, which resulted from the higher rainfall rate prevailed over the study area.
- Surface waters from the surface streams running across the highlands of northern and central Chad replenish aquifers in locations with large sedimentary thicknesses.
- The higher rainfall rate over the southern region and Lake Chad is recharging the groundwater in those areas.
- The recharge rate was estimated to be +4.11 ± 0.51 km3 yr−1 (0.32 ± 0.04 cm yr−1) across the study region over the whole period.
- The Kufra Basin in northern Chad and southeastern Libya appears to be structurally connected to the Dakhla Basin along the structures of the Pelusium megashear system.
- We also demonstrated that GRACE, when combined with other relevant datasets, can be used to answer questions regarding where and how quickly recharge and discharge occur, whether groundwater reservoirs are at steady state or being recharged, and if being recharged, whether the recharge is the result of natural or anthropogenic processes.
- Answering the issues stated herein for Chad’s groundwater resources is vital for optimum resource management and, more importantly, the development of repeatable concepts that can be easily applied to similar arid/semiarid regions around the world.
Author Contributions
Funding
Data Availability Statement
Acknowledgments
Conflicts of Interest
References
- Rodell, M.; Famiglietti, J.S.; Wiese, D.N.; Reager, J.T.; Beaudoing, H.K.; Landerer, F.W.; Lo, M.H. Emerging trends in global freshwater availability. Nature 2018, 557, 651–659. [Google Scholar] [CrossRef] [PubMed]
- Xiong, J.; Abhishek Guo, S.; Kinouchi, T. Leveraging machine learning methods to quantify 50 years of dwindling groundwater in India. Sci. Total Environ. 2022, 835, 155474. [Google Scholar] [CrossRef] [PubMed]
- Abhishek Kinouchi, T.; Sayama, T. A comprehensive assessment of water storage dynamics and hydroclimatic extremes in the Chao Phraya River Basin during 2002–2020. J. Hydrol. 2021, 603, 126868. [Google Scholar] [CrossRef]
- Van den Broeke, M.; Bamber, J.; Ettema, J.; Rignot, E.; Schrama, E.; van de Berg, W.J.; van Meijgaard, E.; Velicogna, I.; Wouters, B. Partitioning Recent Greenland Mass Loss. Science 2009, 326, 984–986. [Google Scholar] [CrossRef] [PubMed] [Green Version]
- Abhishe; Kinouchi, T. Synergetic application of GRACE gravity data, global hydrological model, and in-situ observations to quantify water storage dynamics over Peninsular India during 2002–2017. J. Hydrol. 2021, 596, 126069. [Google Scholar] [CrossRef]
- Pokhrel, Y.; Hanasaki, N.; Yeh, P.; Yeh, P.J.; Yamada, T.J.; Kanae, S.; Oki, T. Model estimates of sea-level change due to anthropogenic impacts on terrestrial water storage. Nat. Geosci. 2012, 5, 389–392. [Google Scholar] [CrossRef]
- Ahmed, M. Sustainable management scenarios for northern Africa’s fossil aquifer systems. J. Hydrol. 2020, 589, 125196. [Google Scholar] [CrossRef]
- Skaskevych, A.; Lee, J.; Jung, H.; Bolten, J.; David, J.; Policelli, F.; Goni, I.; Favreau, G.; San, S.; Ichoku, C. Application of GRACE to the estimation of groundwater storage change in a data-poor region: A case study of Ngadda catchment in the Lake Chad Basin. Hydrol. Process. 2020, 34, 941–955. [Google Scholar] [CrossRef]
- Postel, S. Water in Crisis: A Guide to the World’s Freshwater Resources; Gleick, P.H., Ed.; Oxford University Press: Oxford, UK, 1993; pp. 56–66. [Google Scholar]
- Rodell, M.; Velicogna, I.; Famiglietti, J.S. Satellite-based estimates of groundwater depletion in India. Nature 2009, 460, 999–1002. [Google Scholar] [CrossRef] [Green Version]
- Purdy, A.J.; David, C.H.; Sikder, M.; Reager, J.T.; Chandanpurkar, H.A.; Jones, N.L.; Matin, M.A. An Open-Source Tool to Facilitate the processing of GRACE Observations and GLDAS outputs: An evaluation in Bangladesh. Front. Environ. Sci. 2019, 7, 155. [Google Scholar] [CrossRef]
- Taylor, R.G.; Scanlon, B.; Döll, P.; Rodell, M.; Van Beek, R.; Wada, Y.; Longuevergne, L.; Leblanc, M.; Famiglietti, J.S.; Edmunds, M. GroundWater and Climate Change. Nat. Clim. Chang. 2013, 3, 322–329. [Google Scholar] [CrossRef] [Green Version]
- Famiglietti, J.S. The Global Groundwater Crisis. Nat. Clim. Chang. 2014, 4, 945–948. [Google Scholar] [CrossRef] [Green Version]
- McStraw, T.C.; Pulla, S.T.; Jones, N.L.; Williams, G.P.; David, C.H.; Nelson, J.E.; Ames, D.P. An Open-Source Web Application for the Processing of GRACE Observations and GLDAS Outputs: An Evaluation in Bangladesh. Front. Environ. Sci. 2021, 7, 155. [Google Scholar]
- Famiglietti, J.S.; Rodell, M. Water in the Balance. Science 2013, 340, 1300–1301. [Google Scholar] [CrossRef]
- Villholth, K.G. Groundwater Assessment and Management: Implications and Opportunities of Globalization. Hydrogeol. J. 2006, 14, 330–339. [Google Scholar] [CrossRef]
- Scanlon, B.R.; Zhang, Z.; Save, H.; Sun, A.Y.; Schmied, H.M.; Van Beek, L.P.H.; Wiese, D.N.; Wada, Y.; Long, D.; Reedy, R.C.; et al. Global models underestimate large decadal declining and rising water storage trends relative to GRACE satellite data. Proc. Natl. Acad. Sci. USA 2018, 115, E1080–E1089. [Google Scholar] [CrossRef] [Green Version]
- De Vries, J.J.; Simmers, I. Groundwater recharge: An overview of process and challenges. Hydrogeol. J. 2002, 10, 5–17. [Google Scholar] [CrossRef]
- Milewski, A.; Sultan, M.; Yan, E.; Becker, R.; Abdeldayem, A.; Soliman, F.; Gelil, K.A. A remote sensing solution for estimating runoff and recharge in arid environments. J. Hydrol. 2009, 373, 1–14. [Google Scholar] [CrossRef]
- Mohamed, A.; Ahmed, E.; Alshehri, F.; Abdelrady, A. The groundwater flow behavior and the recharge in the Nubian Sandstone Aquifer System during the wet and arid periods. Sustainability 2022, 14, 6823. [Google Scholar] [CrossRef]
- Mohamed, A.; Asmoay, A.; Alshehri, F.; Abdelrady, A.; Othman, A. Hydro-geochemical applications and multivariate analysis to assess the water–rock interaction in arid environments. Appl. Sci. 2022, 12, 6340. [Google Scholar] [CrossRef]
- Armanios, D.E.; Fisher, J.B. Measuring water availability with limited ground data: Assessing the feasibility of an entirely remotesensing-based hydrologic budget of the Rufiji Basin, Tanzania, using TRMM, GRACE, MODIS, SRB, and AIRS. Hydrol. Process. 2014, 28, 853–867. [Google Scholar] [CrossRef]
- Becker, M.; Papa, F.; Frappart, F.; Alsdorf, D.; Calmant, S.; Santos da Silva, J.; Seyler, F. Satellite-based estimates of surface water dynamics in the Congo River Basin. Int. J. Appl. Earth Obs. Geoinf. 2018, 66, 196–209. [Google Scholar] [CrossRef] [Green Version]
- Tapley, B.D.; Bettadpur, S.; Ries, J.C.; Thompson, P.F.; Watkins, M.M. GRACE measurements of mass variability in the Earth system. Science 2004, 305, 503–505. [Google Scholar] [CrossRef] [Green Version]
- Schmidt, R.; Schwintzer, P.; Flechtner, F.; Reigber, C.; Güntner, A.; Döll, P.; Ramillien, G.; Cazenave, A.; Petrovic, S.; Jochmann, H.; et al. GRACE observations of changes in continental water storage. Glob. Planet Chang. 2006, 50, 112–126. [Google Scholar] [CrossRef]
- Rodell, M.; Chen, J.; Kato, H.; Famiglietti, J.S.; Nigro, J.; Wilson, C.R. Estimating groundwater storage changes in the Mississippi River basin (USA) using GRACE. Hydrogeol. J. 2007, 15, 159–166. [Google Scholar] [CrossRef] [Green Version]
- Swenson, S.; Wahr, J. Post-processing removal of correlated errors in GRACE data. Geophys. Res. Lett. 2006, 3, L08402. [Google Scholar] [CrossRef]
- Zhang, Y.; Yao, L.; Jing, G.; Gaopeng, L.; Zhisheng, Y.; Haishan, N. Correlation analysis between drought indices and terrestrial water storage from 2002 to 2015 in China. Environ. Earth Sci. 2018, 77, 462. [Google Scholar] [CrossRef]
- Voss, K.A.; Famiglietti, J.S.; Lo, M.; De Linage, C.; Rodell, M.; Swenson, S.C. Groundwater depletion in the Middle East from GRACE with implications for transboundary water management in the Tigris–Euphrates–western Iran region. Water Resour. Res. 2013, 49, 904–914. [Google Scholar] [CrossRef] [Green Version]
- Alshehri, F.; Mohamed, A. Analysis of Groundwater Storage Fluctuations Using GRACE and Remote Sensing Data in Wadi As-Sirhan, Northern Saudi Arabia. Water 2023, 15, 282. [Google Scholar] [CrossRef]
- Mohamed, A.; Sultan, M.; Ahmed, M.; Yan, E.; Ahmed, E. Aquifer recharge, depletion, and connectivity: Inferences from GRACE, land surface models, and geochemical and geophysical data. Bull. Geol. Soc. Am. 2017, 129, 534–546. [Google Scholar] [CrossRef] [Green Version]
- Taha, A.I.; Al Deep, M.; Mohamed, A. Investigation of groundwater occurrence using gravity and electrical resistivity methods: A case study from Wadi Sar, Hijaz Mountains, Saudi Arabia. Arab. J. Geosci. 2021, 14, 334. [Google Scholar] [CrossRef]
- Mohamed, A. Hydro-geophysical study of the groundwater storage variations over the Libyan area and its connection to the Dakhla basin in Egypt. J. Afr. Earth Sci. 2019, 157, 103508. [Google Scholar] [CrossRef]
- Mohamed, A. Gravity based estimates of modern recharge of the Sudanese area. J. Afr. Earth Sci. 2020, 163, 103740. [Google Scholar] [CrossRef]
- Mohamed, A. Gravity applications in estimating the mass variations in the Middle East: A case study from Iran. Arab. J. Geosci. 2020, 13, 364. [Google Scholar] [CrossRef]
- Mohamed, A. Gravity applications to groundwater storage variations of the Nile Delta Aquifer. J. Appl. Geophys. 2020, 182, 104177. [Google Scholar] [CrossRef]
- Mohamed, A.; Gonçalvès, J. Hydro-geophysical monitoring of the North Western Sahara Aquifer System’s groundwater resources using gravity data. J. Afr. Earth Sci. 2021, 178, 104188. [Google Scholar] [CrossRef]
- Mohamed, A.; Ragaa Eldeen, E.; Abdelmalik, K. Gravity based assessment of spatio-temporal mass variations of the groundwater resources in the Eastern Desert, Egypt. Arab. J. Geosci. 2021, 14, 500. [Google Scholar] [CrossRef]
- Mohamed, A.; Faye, C.; Othman, A.; Abdelrady, A. Hydro-geophysical Evaluation of the Regional Variability of Senegal’s Terrestrial Water Storage Using Time-Variable Gravity Data. Remote Sens. 2022, 14, 4059. [Google Scholar] [CrossRef]
- Mohamed, A.; Abdelrahman, K.; Abdelrady, A. Application of Time-Variable Gravity to Groundwater Storage Fluctuations in Saudi Arabia. Front. Earth Sci. 2022, 10, 873352. [Google Scholar] [CrossRef]
- Mohamed, A.; Al Deep, M.; Othman, A.; Taha, A.L.; Alshehri, F.; Abdelrady, A. Integrated Geophysical Assessment of groundwater potential in southwestern Saudi Arabia. Front. Earth Sci. 2022, 10, 937402. [Google Scholar] [CrossRef]
- Othman, A.; Abdelrady, A.; Mohamed, A. Monitoring Mass Variations in Iraq Using Time-Variable Gravity Data. Remote Sens. 2022, 14, 3346. [Google Scholar] [CrossRef]
- Rodell, M.; Famiglietti, J.S. The potential for satellite-based monitoring of groundwater storage changes using GRACE: The high plains aquifer, central U.S. J. Hydrol. 2002, 263, 245–256. [Google Scholar] [CrossRef] [Green Version]
- Rodell, M.; Famiglietti, J.S.; Chen, J.; Seneviratne, S.I.; Viterbo, P.; Holl, S.; Wilson, C.R. Basin scale estimates of evapotranspiration using GRACE and other observations. Geophys. Res. Lett. 2004, 31, L20504. [Google Scholar] [CrossRef] [Green Version]
- Moiwo, J.; Tao, F.; Lu, W. Estimating soil moisture storage change using quasiterrestrial water balance method. Fuel Energy Abstr. 2011, 102, 25–34. [Google Scholar]
- GWP (Global Water Partnership). The Lake Chad Basin Aquifer System. Global Water Partnership Transboundary Groundwater Fact Sheet, Compiled by F Bontemps; GWP (Global Water Partnership): Stockholm, Sweden, 2013. [Google Scholar]
- United Nations. Chad: In Groundwater in North and West Africa; Natural Resources/Water Series No. 18, ST/TCD/5; United Nations Department of Technical Cooperation for Development and Economic Commission for Africa: Addis Ababa, Ethiopia, 1988.
- Mohamed, A.; Al Deep, M. Depth to the bottom of the magnetic layer, crustal thickness, and heat flow in Africa: Inferences from gravity and magnetic data. J. Afr. Earth Sci. 2021, 179, 104204. [Google Scholar] [CrossRef]
- Mohamed, A.; Abdelrady, M.; Alshehri, F.; Mohammed, M.A.; Abdelrady, A. Detection of Mineralization Zones Using Aeromagnetic Data. Appl. Sci. 2022, 12, 9078. [Google Scholar] [CrossRef]
- Al Deep, M.; Araffa, S.A.S.; Mansour, S.A.; Taha, A.I.; Mohamed, A.; Othman, A. Geophysics and remote sensing applications for groundwater exploration in fractured basement: A case study from Abha Area, Saudi Arabia. J. Afr. Earth Sci. 2021, 184, 04368. [Google Scholar] [CrossRef]
- Mohamed, A.; Al Deep, M.; Abdelrahman, K.; Abdelrady, A. Geometry of the magma chamber and curie point depth beneath Hawaii Island: Inferences from magnetic and gravity data. Front. Earth Sci. 2022, 10, 847984. [Google Scholar] [CrossRef]
- Othman, A. Measuring and Monitoring Land Subsidence and Earth Fissures in Al-Qassim Region, Saudi Arabia: Inferences from InSAR. In Advances in Remote Sensing and Geo Informatics Applications, Proceedings of the Conference of the Arabian Journal of Geosciences, CAJG 2018, Hammamet, Tunisia, 12–15 November 2018; El-Askary, H., Lee, S., Heggy, E., Pradhan, B., Eds.; Advances in Science, Technology & Innovation (IEREK Interdisciplinary Series for Sustainable Development); Springer: Cham, Switzerland, 2019. [Google Scholar]
- Goni, I.B. Estimating Groundwater Recharge in the Southwestern Sector of the Chad Basin Using Chloride Data. In Applied Groundwater Studies in Africa; Selected Papers in Hydrogeology, No 13, IAH; Mac Donald, A., Ed.; CRC Press: Boca Raton, FL, USA, 2008; pp. 323–336. [Google Scholar]
- Luthcke, S.B.; Sabaka, T.J.; Loomis, B.D.; Arendt, A.A.; McCarthy, J.J.; Camp, J. Antarctica, Greenland and Gulf of Alaska land-ice evolution from an iterated GRACE global mascon solution. J Glaciol. 2013, 59, 613–631. [Google Scholar] [CrossRef]
- Watkins, M.; Flechtner, F.; Webb, F. In Proceedings of the GRACE Science Team Meeting, Austin, TX, USA, 20–22 September 2015; Available online: https://www2.csr.utexas.edu/grace/GSTM/2015/proceedings.html (accessed on 7 December 2022).
- Wiese, D.N.; Landerer, F.W.; Watkins, M.M. Quantifying and reducing leakage errors in the JPL RL05M GRACE mascon solution. Water Resour. Res. 2016, 52, 7490–7502. [Google Scholar] [CrossRef]
- Save, H.; Bettadpur, S.; Tapley, D.D. High resolution CSR GRACE RL05 mascons. J. Geophys. Res. Solid Earth 2016, 121, 7547–7569. [Google Scholar] [CrossRef]
- Save, H. CSR GRACE and GRACE-FO RL06 Mascon Solutions v02. Mascon Solut. JCR Solid Earth 2020, 12, 24. Available online: https://sealevel.nasa.gov/data/dataset/?identifier=SLCP_CSR-RL06-Mascons-v02_RL06_v02 (accessed on 7 December 2022).
- Loomis, B.D.; Luthcke, S.B.; Sabaka, T.J. Regularization and error characterization of GRACE mascons. J. Geod. 2019, 93, 1381–1398. [Google Scholar] [CrossRef] [PubMed]
- Sakumura, C.; Bettadpur, S.; Bruinsma, S. Ensemble Prediction and Intercomparing Analysis of GRACE Time-Variable Gravity Field Models. Geophys. Res. Lett. 2014, 41, 1389–1397. [Google Scholar] [CrossRef]
- Tiwari, V.M.; Wahr, J.; Swenson, S. Dwindling groundwater resources in northern India, from satellite gravity observations. Geophys. Res. Lett. 2009, 36, L18401. [Google Scholar] [CrossRef] [Green Version]
- Chen, J.; Famigliett, J.S.; Scanlon, B.R.; Rodell, M. Groundwater Storage Changes: Present Status from GRACE Observations. Surv. Geophys. 2016, 37, 397–417. [Google Scholar] [CrossRef] [Green Version]
- G-REALM—Home. Available online: https://ipad.fas.usda.gov/cropexplorer/global_reservoir (accessed on 7 December 2022).
- Kummerow, C. Beamfilling errors in passive microwave rainfall retrievals. J. Appl. Meteorol. 1998, 37, 356–370. [Google Scholar] [CrossRef]
- Huffman, G.J.; Bolvin, D.T.; Nelkin, E.J.; Wolff, D.B.; Adler, R.F.; Gu, G.; Hong, Y.; Bowman, K.P.; Stocker, E.F. The TRMM Multisatellite Precipitation Analysis (TMPA): Quasi-global, multiyear, combined-sensor precipitation estimates at fine scales. J. Hydrometeorol. 2007, 8, 38–55. [Google Scholar] [CrossRef]
- Cheema, M.J.M.; Bastiaanssen, W.G.M. Local calibration of remotely sensed rainfall from the TRMM satellite for different periods and spatial scales in the Indus Basin. Int. J. Remote Sens. 2012, 33, 2603–2627. [Google Scholar] [CrossRef]
- Buma, W.G.; Lee, S.-I.; Seo, J.Y. Hydrological evaluation of Lake Chad Basin using space borne and hydrological model observation. Water 2016, 8, 205. [Google Scholar] [CrossRef] [Green Version]
- Goncalves, J.; Petersen, J.; Deschamps, P.; Hamelin, B.; Baba-Sy, O. Quantifying the modern recharge of the “fossil” Sahara aquifers. Geophys. Res. Lett. 2013, 40, 2673–2678. [Google Scholar] [CrossRef]
- FAO. AQUASTAT Website. Food and Agriculture Organization of the United Nations. 2022. Available online: http://www.fao.org/statistics/fr/ (accessed on 10 July 2022).
- Goni, I.B. Tracing stable isotope values from meteoric water to groundwater in the southwestern part of the Chad basin. Hydrogeol. J. 2006, 14, 742–752. [Google Scholar] [CrossRef]
- Oursingbé, M.; Zhonghua, T. Recharge of the Quaternary Aquifer of Lake Chad Basin Estimated from Oxygen-18 (18O) and Tritium (3H) Isotopes. J. Am. Sci. 2010, 6, 283–292. [Google Scholar]
- Marie-Louise, V.; Sebastian, P.; Abderamane, H.; Francois, Z.; Daniel, H.; Philip, B. 20th EGU General Assembly, EGU2018. In Proceedings of the Conference, Vienna, Austria, 4–13 April 2018; p. 19407. [Google Scholar]
- Seyoum, W.M.; Milewski, A.M. Improved methods for estimating local terrestrial water dynamics from GRACE in the Northern High Plains. Adv. Water Resour. 2017, 110, 279–290. [Google Scholar] [CrossRef]
- Papa, F.; Frappart, F.; Malbeteau, Y.; Shamsudduha, M.; Vuruputur, V.; Sekhar, M.; Ramillien, G.; Prigentm, C.; Aires, F.; Clamant, S. Satellite-derived surface and sub-surface water storage in the Ganges–Brahmaputra River Basin. J. Hydrol. 2015, 4, 15–35. [Google Scholar] [CrossRef] [Green Version]
- Wada, Y.; Wisser, D.; Bierkens, M.F.P. Global modeling of withdrawal, allocation and consumptive use of surface water and groundwater resources. Earth Syst. Dyn. 2014, 5, 15–40. [Google Scholar] [CrossRef] [Green Version]
- Divins, D. Total Sediment Thickness of the World’s Oceans and Marginal Seas; NOAA National Geophysical Data Center: Boulder, CO, USA, 2003. [Google Scholar]
- Ball, J. Problems of the Libyan desert. Geogr. J. 1927, 70, 21–38. [Google Scholar] [CrossRef]
- Sandford, K.S. Sources of Water in the North-Western Sudan. Source: Geogr. J. 1935, 85, 412–431. Available online: http://www.jstor.org/stable/1785619 (accessed on 7 December 2022). [CrossRef]
- Neev, D.; Hall, J.K.; Saul, J.M. The Pelusium megashear system Across Africa and associated lineament swarms. J. Geophys. Res. 1982, 87, 1015–1030. [Google Scholar] [CrossRef]
- Al Faitouri, M. Isotope and Noble Gas Study of Three Aquifers in Central and Eastern Libya. Ph.D. Thesis, Colorado State University, Fort Collins, CO, USA, 2013. [Google Scholar]
- Mohamed, A. Constraints on the Amount and Passages of Groundwater Flow in the Nubian Sandstone Aquifer across Political Boundaries, Egypt. Ph.D. Thesis, Faculty of Science, Assiut University, Asyut, Egypt, 2016; p. 197. [Google Scholar]
- Mohamed, A.; Sultan, M.; Yan, E.; Ahmed, E.; Sturchio, N.C. Towards a Better Understanding of the Hydrologic Setting of the Nubian Sandstone Aquifer System: Inferences from Groundwater Flow Models, CL-36 Ages, and GRACE Data. In Proceedings of the AGU Fall Meeting Abstracts, San Francisco, CA, USA, 14–18 December 2015. [Google Scholar]
- Lüning, S.; Craig, J.; Fitches, B.; Mayouf, J.; Busrewil, A.; El Dieb, M.; Gammudi, A.; Loydell, D.K. Chapter 8—Petroleum Source and Reservoir Rock Re-Evaluation in the Kufra Basin (SE Libya, NE Chad, NW Sudan); Geological Exploration in Murzuq Basin; Sola, M.A., Worsley, D., Eds.; Elsevier Science: Amsterdam, The Netherlands, 2000; pp. 151–173. ISBN 9780444506115. [Google Scholar] [CrossRef]
- Bellini, E.; Giori, I.; Ashuri, O.; Benelli, F. Geology of Al Kufrah Basin, Libya. In The Geology of Libya; Salem, M.J., Sbeta, A.M., Bakbak, M.R., Eds.; Elsevier: Amsterdam, The Netherlands, 1991; Volume 6, pp. 2155–2184. [Google Scholar]
- Wright, E.P.; Benfield, A.C.; Edmunds, W.M.; Kitching, R. Hydrogeology of the Kufra and Sirte Basins, Eastern Libya. Q. J. Eng. Geol. Hydrogeol. 1982, 15, 83–103. [Google Scholar] [CrossRef] [Green Version]
- Thorweihe, U. Hydrogeologie des Dakhla Beckens (Ägypten): Berliner Geowissenschaftliche Abhandlungen. Ser. A 1982, 38, 1–58. [Google Scholar]
- El Ramly, L. Water Resources Study of Zone V—Al Kufra and Sirte Basins, Socialist Peoples’ Libyan Arab Jamahiriya; Technical Report; Secretariat of Agricultural Reclamation and Land Development: Tripoli, Libya, 1983; 136p, appendices.
- CEDARE. Regional Strategy for the Utilization of the Nubian Sandstone Aquifer System-Hydrogeology; Centre for the Environment and Development for the Arab Region and Europe: Cairo, Egypt, 2001. [Google Scholar]
- Haynes, C.V.; Haas, H. Radiocarbon evidence for Holocene recharge of groundwater, Western Desert, Egypt. Radiocarbon 1980, 22, 705–717. [Google Scholar] [CrossRef] [Green Version]
- Hesse, K.-H.; Hissene, A.; Kheir, O.; Schnaecker, E.; Schneider, M.; Thorweihe, U. Hydrogeological investigations of the Nubian Aquifer System, Eastern Sahara. Berl. Geowiss. Abh. Ser. A 1987, 75, 397–464. [Google Scholar]
- Froehlich, K.; Aggarwal, P.K.; Garner, W.A. An Integrated Approach in Evaluating Isotope Data of the Nubian Sandstone Aquifer System (NSAS) in Egypt (IAEA-CN-151/147). In Proceedings, Advances in Isotope Hydrology and Its Role in Sustainable Water Resources Management (IHS-2007); International Atomic Energy Agency (IAEA): Vienna, Austria, 2007; Volume 1, pp. 31–45. [Google Scholar]
- Sultan, M.; Ahmed, M.; Sturchio, N.; Eugene, Y.; Milewski, A.; Becker, R.; Wahr, J.; Becker, D.; Chouinard, K. Assessment of the vulnerabilities of the Nubian Nubian Sandstone Fossil Aquifer, North Africa. In Climate Vulnerability: Understanding and Addressing Threats to Essential Resources: Amsterdam; Pielke, R.A., Ed.; Elsevier: Amsterdam, The Netherlands, 2013; Volume 5, pp. 311–333. [Google Scholar] [CrossRef]
- Sturchio, N.C.; Du, X.; Purtschert, R.; Lehmann, B.E.; Sultan, M.; Patterson, L.J.; Lu, Z.-T.; Müller, P.; Bigler, T.; Bailey, K.; et al. One million year old groundwater in the Sahara revealed by krypton-81 and chlorine-36. Geophys. Res. Lett. 2004, 31, L05503. [Google Scholar] [CrossRef]
- Patterson, L.J.; Sturchio, N.C.; Kennedy, B.M.; van Soest, M.C.; Sultan, M.; Lu, Z.-T.; Lehmann, B.; Purtschert, R.; El Alfy, Z.; El Kaliouby, B.; et al. Cosmogenic, radiogenic, and stable isotopic constraints on groundwater residence time in the Nubian Aquifer, Western Desert of Egypt: Geochemistry, Geophysics. Geosystems 2005, 6, Q01005. [Google Scholar] [CrossRef] [Green Version]
- Li, B.; Rodell, M.; Kumar, S.; Beaudoing, H.K.; Getirana, A.; Zaitchik, B.F.; de Goncalves, L.G.; Cossetin, C.; Bhanja, S.; Mukherjee, A.; et al. Global GRACE Data Assimilation for Groundwater and Drought Monitoring: Advances and Challenges. Water Resour. Res. 2019, 55, 7564–7586. [Google Scholar] [CrossRef]


| Component | Unit | Whole Period | Period I | Period II | |
|---|---|---|---|---|---|
| GRACE total (ΔTWS) | CSR | cm yr−1 | +0.25 ± 0.04 | +0.07 ± 0.10 | +0.64 ± 0.12 |
| JPL | +0.29 ± 0.04 | +0.02 ± 0.11 | +0.68 ± 0.13 | ||
| GSFC | +0.24 ± 0.05 | −0.07 ± 0.10 | +0.64 ± 0.13 | ||
| AVG | +0.26 ± 0.04 | +0.006 ± 0.10 | +0.64 ± 0.12 | ||
| ΔSMS | mm yr−1 | +0.03 ± 0.02 | +0.016 ± 0.133 | +0.14 ± 0.013 | |
| Lake Chad | mm yr−1 | +0.032 ± 0.003 | +0.043 ± 0.01 | +0.030 ± 0.00 | |
| ΔGWS | cm yr−1 | +0.25 ± 0.04 | +0.0001 ± 0.099 | +0.62 ± 0.12 | |
| Withdrawal | mm yr−1 | −0.68 ± 0.07 | −0.68 ± 0.07 | −0.69 ± 0.07 | |
| Recharge | cm yr−1 | +0.32 ± 0.04 | +0.068 ± 0.099 | +0.69 ± 0.12 | |
| AAP | mm | 351.6 | 336.22 | 377.8 | |
Disclaimer/Publisher’s Note: The statements, opinions and data contained in all publications are solely those of the individual author(s) and contributor(s) and not of MDPI and/or the editor(s). MDPI and/or the editor(s) disclaim responsibility for any injury to people or property resulting from any ideas, methods, instructions or products referred to in the content. |
© 2023 by the authors. Licensee MDPI, Basel, Switzerland. This article is an open access article distributed under the terms and conditions of the Creative Commons Attribution (CC BY) license (https://creativecommons.org/licenses/by/4.0/).
Share and Cite
Mohamed, A.; Abdelrady, A.; Alarifi, S.S.; Othman, A. Geophysical and Remote Sensing Assessment of Chad’s Groundwater Resources. Remote Sens. 2023, 15, 560. https://doi.org/10.3390/rs15030560
Mohamed A, Abdelrady A, Alarifi SS, Othman A. Geophysical and Remote Sensing Assessment of Chad’s Groundwater Resources. Remote Sensing. 2023; 15(3):560. https://doi.org/10.3390/rs15030560
Chicago/Turabian StyleMohamed, Ahmed, Ahmed Abdelrady, Saad S. Alarifi, and Abdullah Othman. 2023. "Geophysical and Remote Sensing Assessment of Chad’s Groundwater Resources" Remote Sensing 15, no. 3: 560. https://doi.org/10.3390/rs15030560