
Underwater Hyperspectral Imaging System with Liquid Lenses
by
 , ,
, ,
Bohan Liu
1,2,
Shaojie Men
1,2,* ,
,
Zhongjun Ding
3,
Dewei Li
3,
Zhigang Zhao
1,2,
Jiahao He
1,
Haochen Ju
1,2,
Mengling Shen
1,2,
Qiuyuan Yu
1 and
Zhaojun Liu
1,2 1
School of Information Science & Engineering and Shandong Provincial Key Laboratory of Laser Technology and Application, Shandong University, Qingdao 266237, China
2
Key Laboratory of Laser & Infrared System, Ministry of Education, Shandong University, Qingdao 266237, China
3
National Deep Sea Center, Qingdao 266061, China
*
Author to whom correspondence should be addressed.
Remote Sens. 2023, 15(3), 544; https://doi.org/10.3390/rs15030544
Submission received: 1 December 2022
/
Revised: 5 January 2023
/
Accepted: 13 January 2023
/
Published: 17 January 2023
(This article belongs to the Special Issue Advancement in Undersea Remote Sensing)
Abstract
:The underwater hyperspectral imager enables the detection and identification of targets on the seafloor by collecting high-resolution spectral images. The distance between the hyperspectral imager and the targets cannot be consistent in real operation by factors such as motion and fluctuating terrain, resulting in unfocused images and negative effects on the identification. In this paper, we developed a novel integrated underwater hyperspectral imaging system for deep sea surveys and proposed an autofocus strategy based on liquid lens focusing transfer. The calibration tests provided a clear focus result for hyperspectral transects and a global spectral resolution of less than 7 nm in spectral range from 400 to 800 nm. The prototype was used to obtain spectrum and image information of manganese nodules and four other rocks in a laboratory environment. The classification of the five kinds of minerals was successfully realized by using a support vector machine. We tested the UHI prototype in the deep sea and observed a Psychropotidae specimen on the sediment from the in situ hyperspectral images. The results show that the prototype developed here can accurately and stably obtain hyperspectral data and has potential applications for in situ deep-sea exploration.
1. Introduction
As a combination of imaging and spectrometry, hyperspectral imaging can record the spectrum with high resolution for each spatial pixel of the image and construct a spectral image cube. The number of spectral bands can be in the range of several hundred, with a typical spectral spacing of less than 10 nm between each band. Hyperspectral imaging has been proven to be an effective marine remote sensing tool, enabling large-scale and continuous remote observation applications, such as ocean color inverse [1,2], marine ecological investigation [3,4], and disaster monitoring [5,6]. Recently, concerns for the marine ecosystem and environment conservation have heightened interest in underwater remote sensing. However, hyperspectral imaging systems based on airborne or satellite platforms can only cover a depth of several meters to tens of meters due to the dynamic conditions of the water-air interface, light, and atmospheric [7,8]. As a consequence, it is suitable only on the surface and in relatively shallow water.
The emergence of underwater hyperspectral imaging (UHI) technology provides a new perspective for underwater remote sensing. One significant benefit of the UHI system is that it eliminates the influence of the hybrid effect of water-air interfaces so that it can observe targets closer and more intuitively. Over the last decade, researchers have conducted extensive investigations pertaining to underwater hyperspectral imaging technology and developed several interesting prototypes [9,10,11,12]. Marine detection activities could be strongly supported by these devices, some scientifically significant, such as biological survey and habitat mapping [13,14,15], some environmentally important, such as the detection of microplastics [16], some more economically important, such as mineral detection [17,18], and some humanly important, such as the monitoring of pipelines and underwater archeology [19]. Underwater hyperspectral technology is becoming one of the most promising techniques in underwater optical exploration.
Push-broom hyperspectral imaging can achieve high-spatial and high-spectral resolution detection, with the advantages of no moving parts, compact structure, and easy integration. However, there are still restrictions to be solved in underwater applications. As a line scanning imaging method, it obtains a complete image cube relying on continuous exposure of every cross-section. The slight jitter in the scanning process may result in the displacement and deformation of the hyperspectral images. Meanwhile, due to platform movements and terrain fluctuations, the distance between the hyperspectral imager and the target of interest may be changed continually, which results in image blurring and reducing the accuracy of target identification.
There are several approaches on solving the first restriction. A relevant example is the use of navigation equipment equipped on underwater instrument carriers. The attitude and geometric could be corrected through the registration algorithm using geographic data recorded synchronously. In this paper, we are mainly centered on the second issue, i.e., clear imaging for the underwater hyperspectral imager. Common solutions usually rely on auxiliary sensors to measure the distance and keep the imager running at a fixed height from the target. For instance, Chennu et al. [20] developed a hyperspectral imaging and topographic surveying system for automated mapping of benthic habitats, whose altitude was controlled by the diver based on the measurement of an acoustic altimeter. Summers et al. [21] proposed a mini-ROV-UHI system for arctic macroalgal habitats mapping, which had a constant depth controlled at 0.5 m depth in the operating, with an altitude to the seafloor varying between 0.6–1.5 m. Unfortunately, there is little relevant work on the dynamic focusing method for the push-broom UHI imager, mainly for the reason that focusing has a large delay compared to the speed of distance variation. Thus, a UHI system with rapid and real-time focusing technology is required.
In this work, we developed a novel push-broom underwater hyperspectral imaging system prototype, which was an instrument deployed on underwater vehicle for the purpose of subsea detection. A liquid lens was employed as the telescope lens of the hyperspectral imager, which has the advantages of fast focus and small volume. The calibration results showed that the working spectral range was 400 nm to 800 nm and the spectral resolution correspondingly changed from 2.5 nm to 6.75 nm. In addition, a novel autofocus strategy for the HSI imager was presented to overcome many of challenges by using a focusing transfer method combined with the liquid lens. Instead of operating on the push-broom hyperspectral imager, this method achieved autofocus by using an RGB camera equipped with a liquid lens and transmitting the focusing information to the hyperspectral imager. The transfer factor of the two cameras was calibrated carefully, and the performances of the system were verified by imaging on mineral samples in laboratory. We also tested the prototype in the deep-sea field. The experiment results showed that the system had good imaging quality and reliability as a detection tool in underwater applications.
2. UHI System Design and Development
2.1. UHI System Design
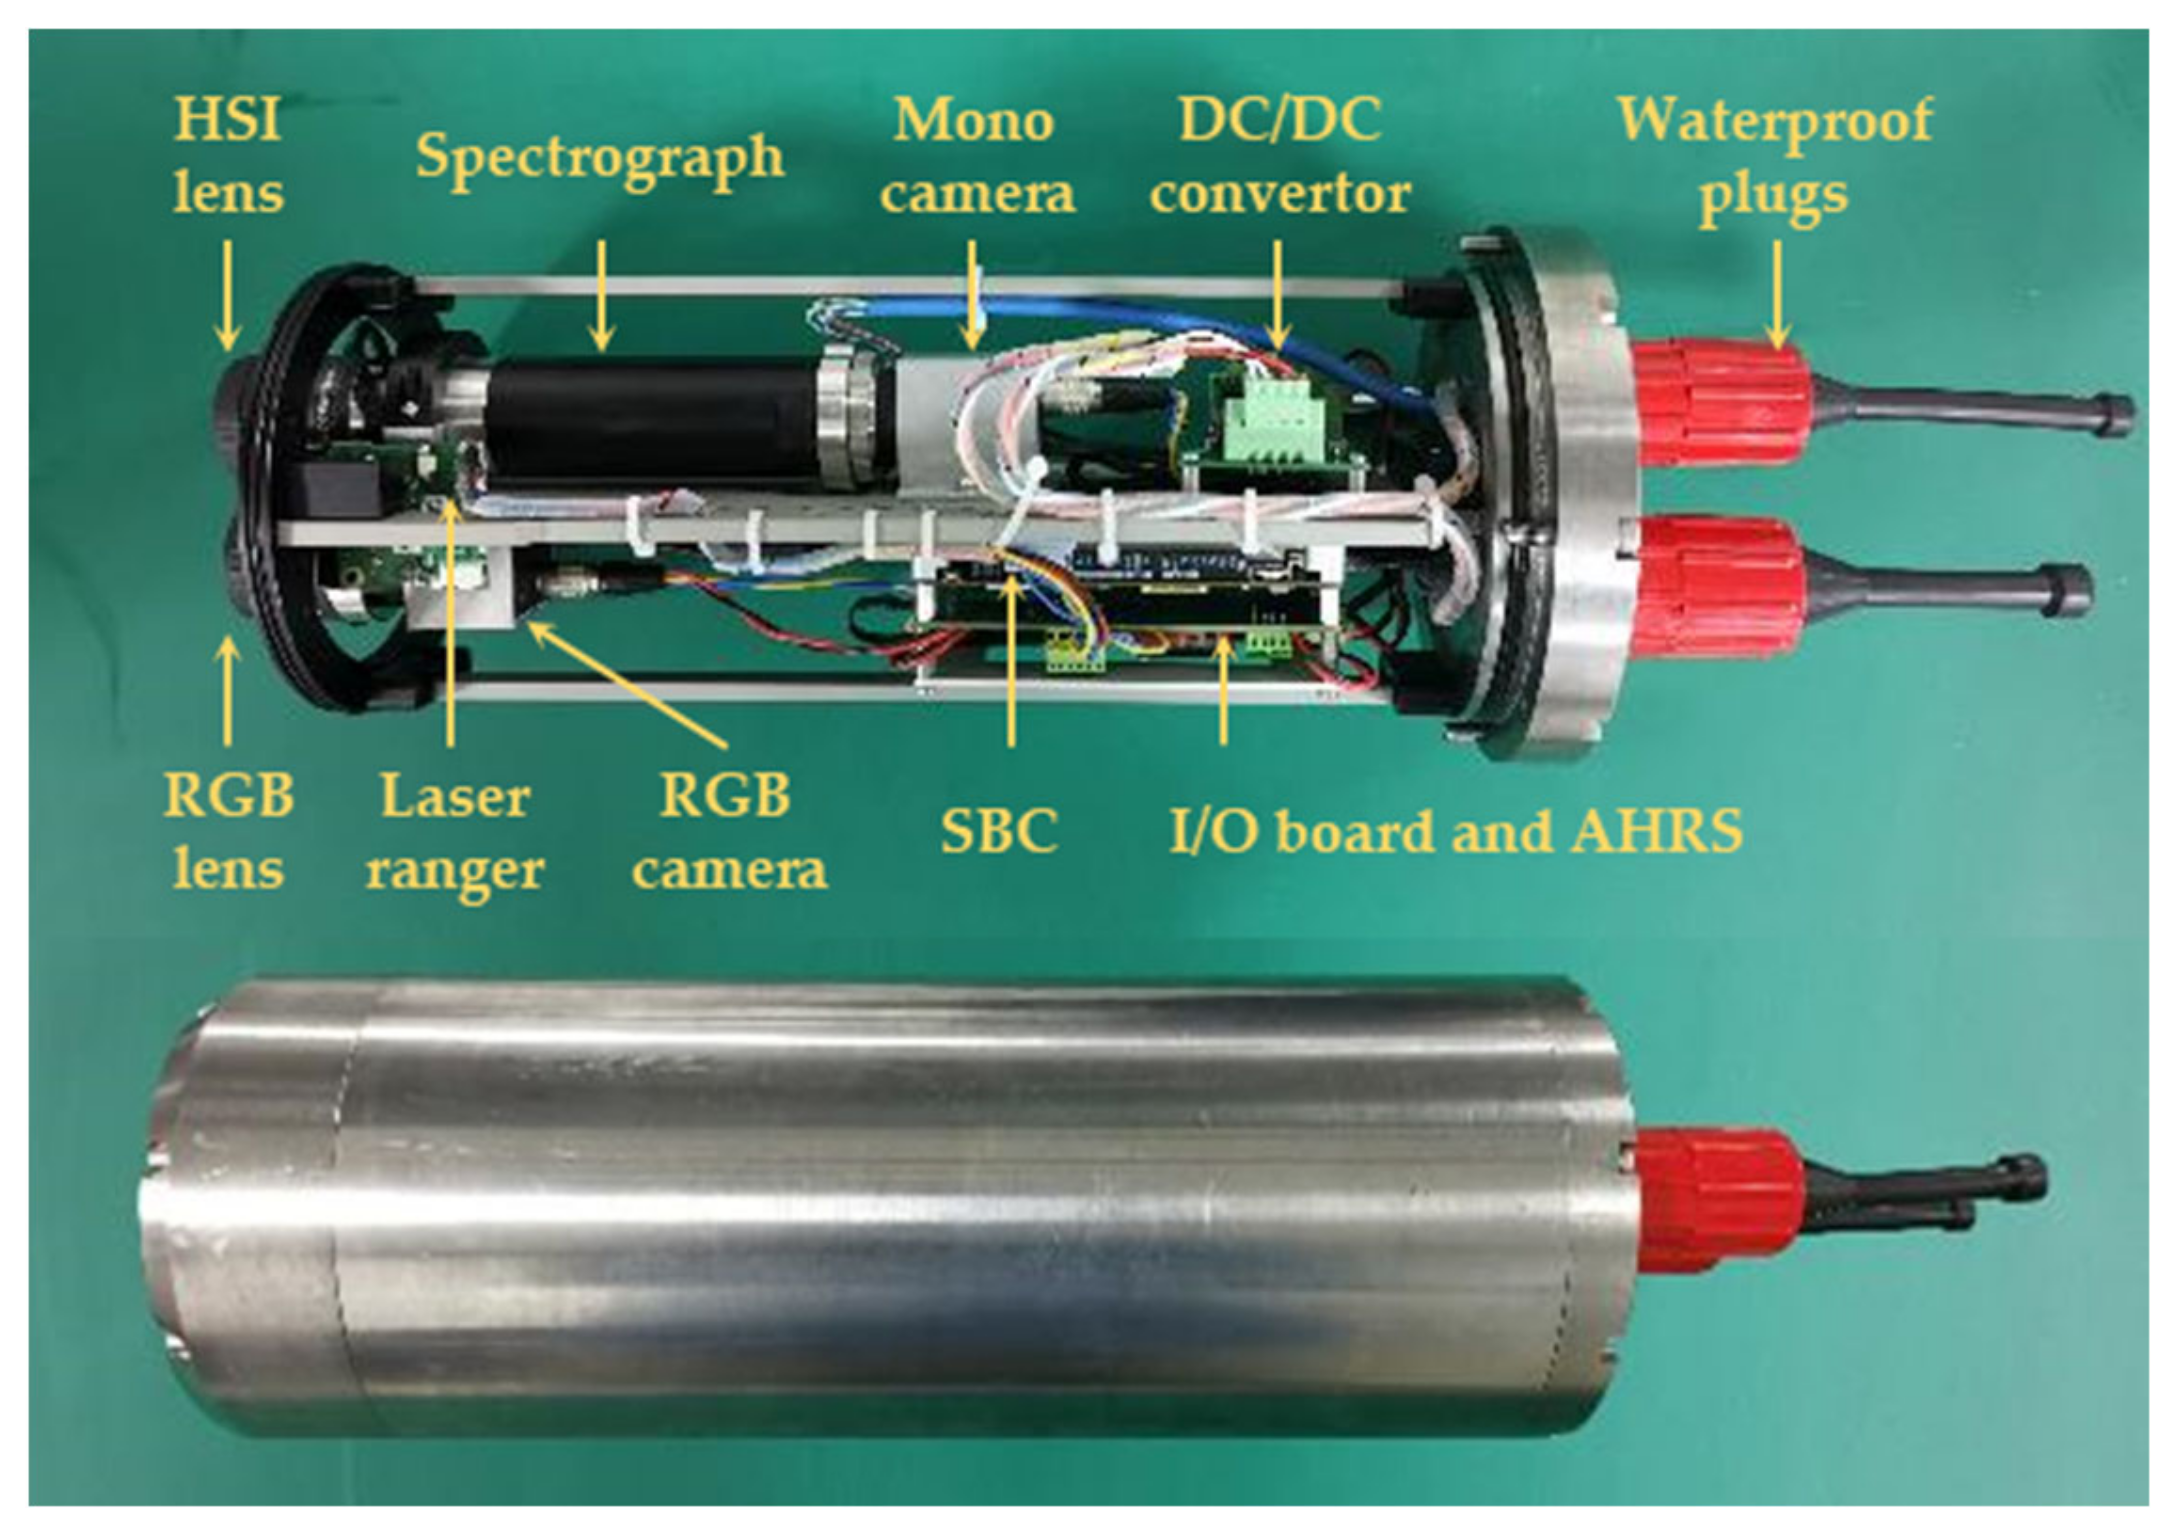
The UHI system is an integrated instrument to be deployed on ROV, AUV, and HOV for the purpose of large-scale underwater surveys. Therefore, the issue of appropriate independence is considered attentively, which can potentially provide portability to suit different vehicles with respect to configuration adjustments for intended observation scenarios. In our prototype, the UHI system adopts a modular design and consists of three parts, which are the imaging subsystem, the sensing modules, and the control unit. Figure 1 presents the prototype and the encapsulated structure of the UHI system.
The imaging subsystem is a combination of the push-broom hyperspectral imager and the RGB camera. For the hyperspectral imager, a V10 spectrograph (Specim Ltd., Oulu, Finland), which consists of the slit, collimating optics, and grating, is used as the spectral splitting unit. In this case, the width of the slit is set to 30 μm with the view of the trade-off between the luminous flux and spectral resolution. The RGB camera has also been introduced into the imaging module, which can record the RGB imagery of the seafloor and provide the operator with a real-time view for better manipulation of the vehicles to track and aim at targets. Two electronically controllable focus lenses (Corning Inc., Glendale, AZ, USA) based on the liquid lenses are respectively utilized as the telescopes for both the hyperspectral imager and the RGB camera. There is nothing different, but the lens for the RGB camera (RGB lens) has a small focal length, resulting in a larger field of view than the lens for hyperspectral imaging (HSI lens). Such configuration aims to facilitate the post-processing of hyperspectral data, like geometric correction and image registration.
Attitude and ranging data are critical for underwater hyperspectral imaging to recover images from distortion and estimate the water influence. During underwater operation, the attitude of the UHI system may inevitably change on account of many factors, such as marine conditions and vehicle motion. Hence, a miniaturized attitude and heading reference system (AHRS) MTi-630 (Xsens Inc., Enschede, The Netherlands) are attached to the plate to capture orientation, acceleration, and inertial data. Besides, there are various commercial off-the-shelf ranging sensors available now, such as sonars and optical 3D ranging sensors, but they tend to be expensive, and these externally mounted sensors present some trouble with synchronizing hyperspectral data with sensor data. For these considerations, we modified and deployed a low-cost miniaturized phase-type single-point laser ranger inside the system to measure the distance roughly between the vehicle and targets. The laser ranger uses a 520 nm diode laser and has a range of 40 m with 3 mm accuracy in the air. All sensor data will be used for the calculation to compensate and calibrate the deviation to achieve the precise splicing of hyperspectral transects.
It is necessary to record sensor data while collecting each frame of the hyperspectral image. Thus, the cooperation of sensors and imager needs to be controlled in an orderly manner. A low-power-consumption single-board computer (SBC) is drawn into the control unit for data storage and operation control. The SBC also has an Arduino Leonard coprocessor, which generates a trigger signal for synchronous acquisition. The multi-serial port extension circuit is developed, which serves as a bridge to realize the interconnection between sensors and SBC. In data streams, hyperspectral images and the data of each sensor are recorded frame by frame, while RGB images are recorded every 20 frames. The skipped RGB images are aimed at calculating the focusing voltage in real time. All data is stored in a solid-state disk with a capacity of 2 TB, and images are synchronously transmitted to the computer on vehicles for further decision-making by operators. Following these strategies, the final control algorithm and software are developed.
Finally, the UHI system gathered with three parts is encapsulated in a pressure-tight shell. The shell is made of titanium alloy, and its rated depth for operation can reach up to 6000 m. With dimensions of 152 mm in outer diameter and 426 mm in length, the UHI system can be easily deployed on underwater vehicles. Two optional waterproof ports at the system’s tail allow 9–36 V direct-current input and ethernet communication with external vehicles. The detailed parameters of the UHI system are described in Table 1.
2.2. Autofocus Strategy for UHI
Focusing distance will affect the clarity of the images. In some scenes that cannot be manually operated, the autofocusing process is usually completed with the help of sensors and algorithms. The autofocus methods are divided into three main types: searching on the look-up table (LUT) based on distance-aware [22], peak searching based on sharpness measurement [23], and combined method based on distance-aware and sharpness measurement [24].
Since one exposure of the push-broom hyperspectral imager only obtains the spatial information of one cross-section, in some scenes with insignificant spatial features, such as uniformly distributed sediments or targets with smooth surfaces, the method of peak searching sometimes oscillates and cannot converge quickly, resulting in misleading focus. Moreover, the method based on distance-aware may be ineffective because of the low surface reflectivity or complex terrain, leading to a wrong distance feedback. Thus, it is a challenging work for underwater hyperspectral imager to focus directly by using conventional methods in the underwater environment.
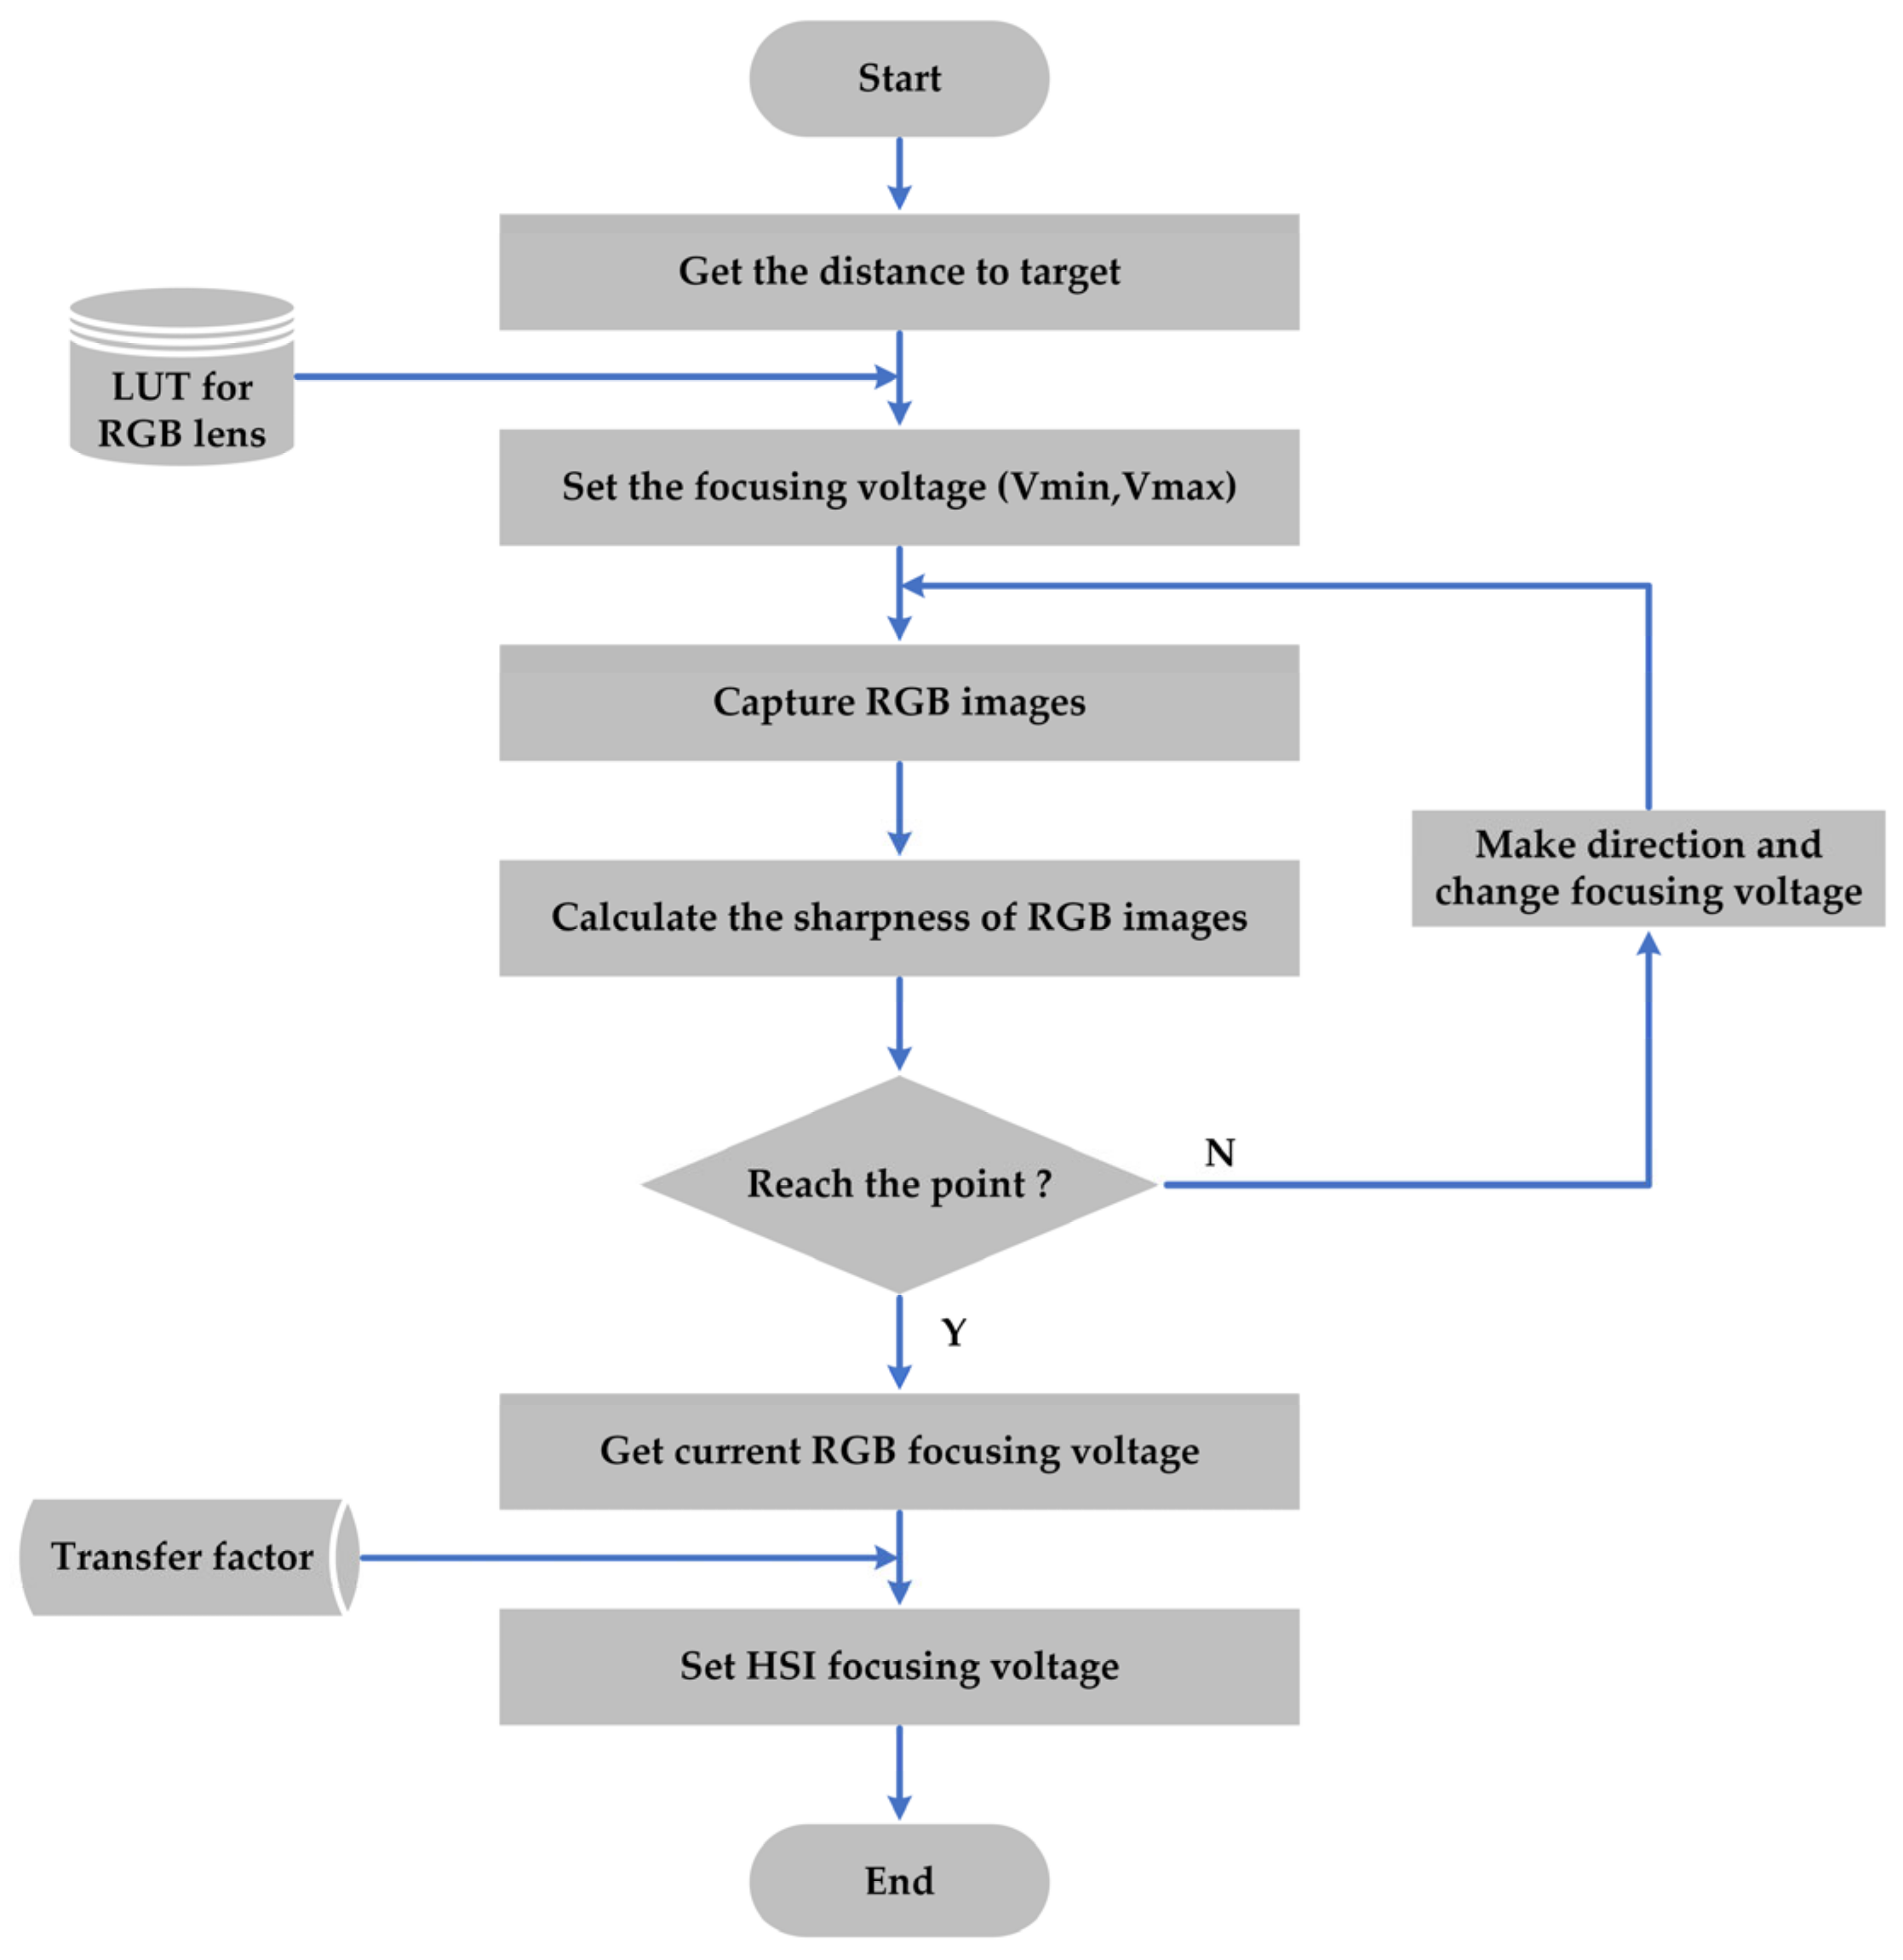
Here, we propose an autofocus strategy for the underwater hyperspectral imager by using the idea of focusing transfer based on liquid lens configuration. Regarding the hardware, the strategy requires cooperation between the RGB lens, the HSI lens, the RGB camera, and the hyperspectral imager. The liquid lenses are the core component, allowing switching the focusing distance rapidly by changing the voltage applied to the liquid lens [25]. The RGB camera serves as an assistant for the autofocus of the hyperspectral imager. Figure 2 shows the flowchart of the focusing transfer strategy for the UHI system. Firstly, measure the distance between the UHI system and the target by using the laser ranger, so the approximate interval of the focusing voltage (Vmin, Vmax) is determined. Then, the RGB camera executes the autofocusing procedure through the peak searching method based on sharpness measurement to obtain the focusing distance corresponding to the clearest image, that is, the focusing voltage of the RGB lens. The HSI lens finally focused by applying the RGB focusing voltage combined with the transfer factor to its voltage controller. This method only requires a simple calibration to determine the transfer factor between two liquid lenses. It should be noted that in some underwater areas with poor conditions, image preprocessing operations such as image enhancement, image noise reduction, and image defogging are required [26,27,28]. In addition, some other preprocessing methods, like visual saliency detection [29], can be used to assist in determining the area of interest for the autofocus procedure.
3. System Testing and Calibration
After the installation and adjustment of optical and mechanical structures, the UHI system was encapsulated in a waterproof pressure-tight shell. Then, related testing and calibration work was carried out to determine the performance of the UHI system. The key parameters, such as the central wavelength, spectral resolution, and other parameters related to relative and absolute spectral response, were determined through spectral and radiometric calibration. In addition, the transfer factor was also calibrated by the designed experiment setup.
3.1. Spectral Calibration
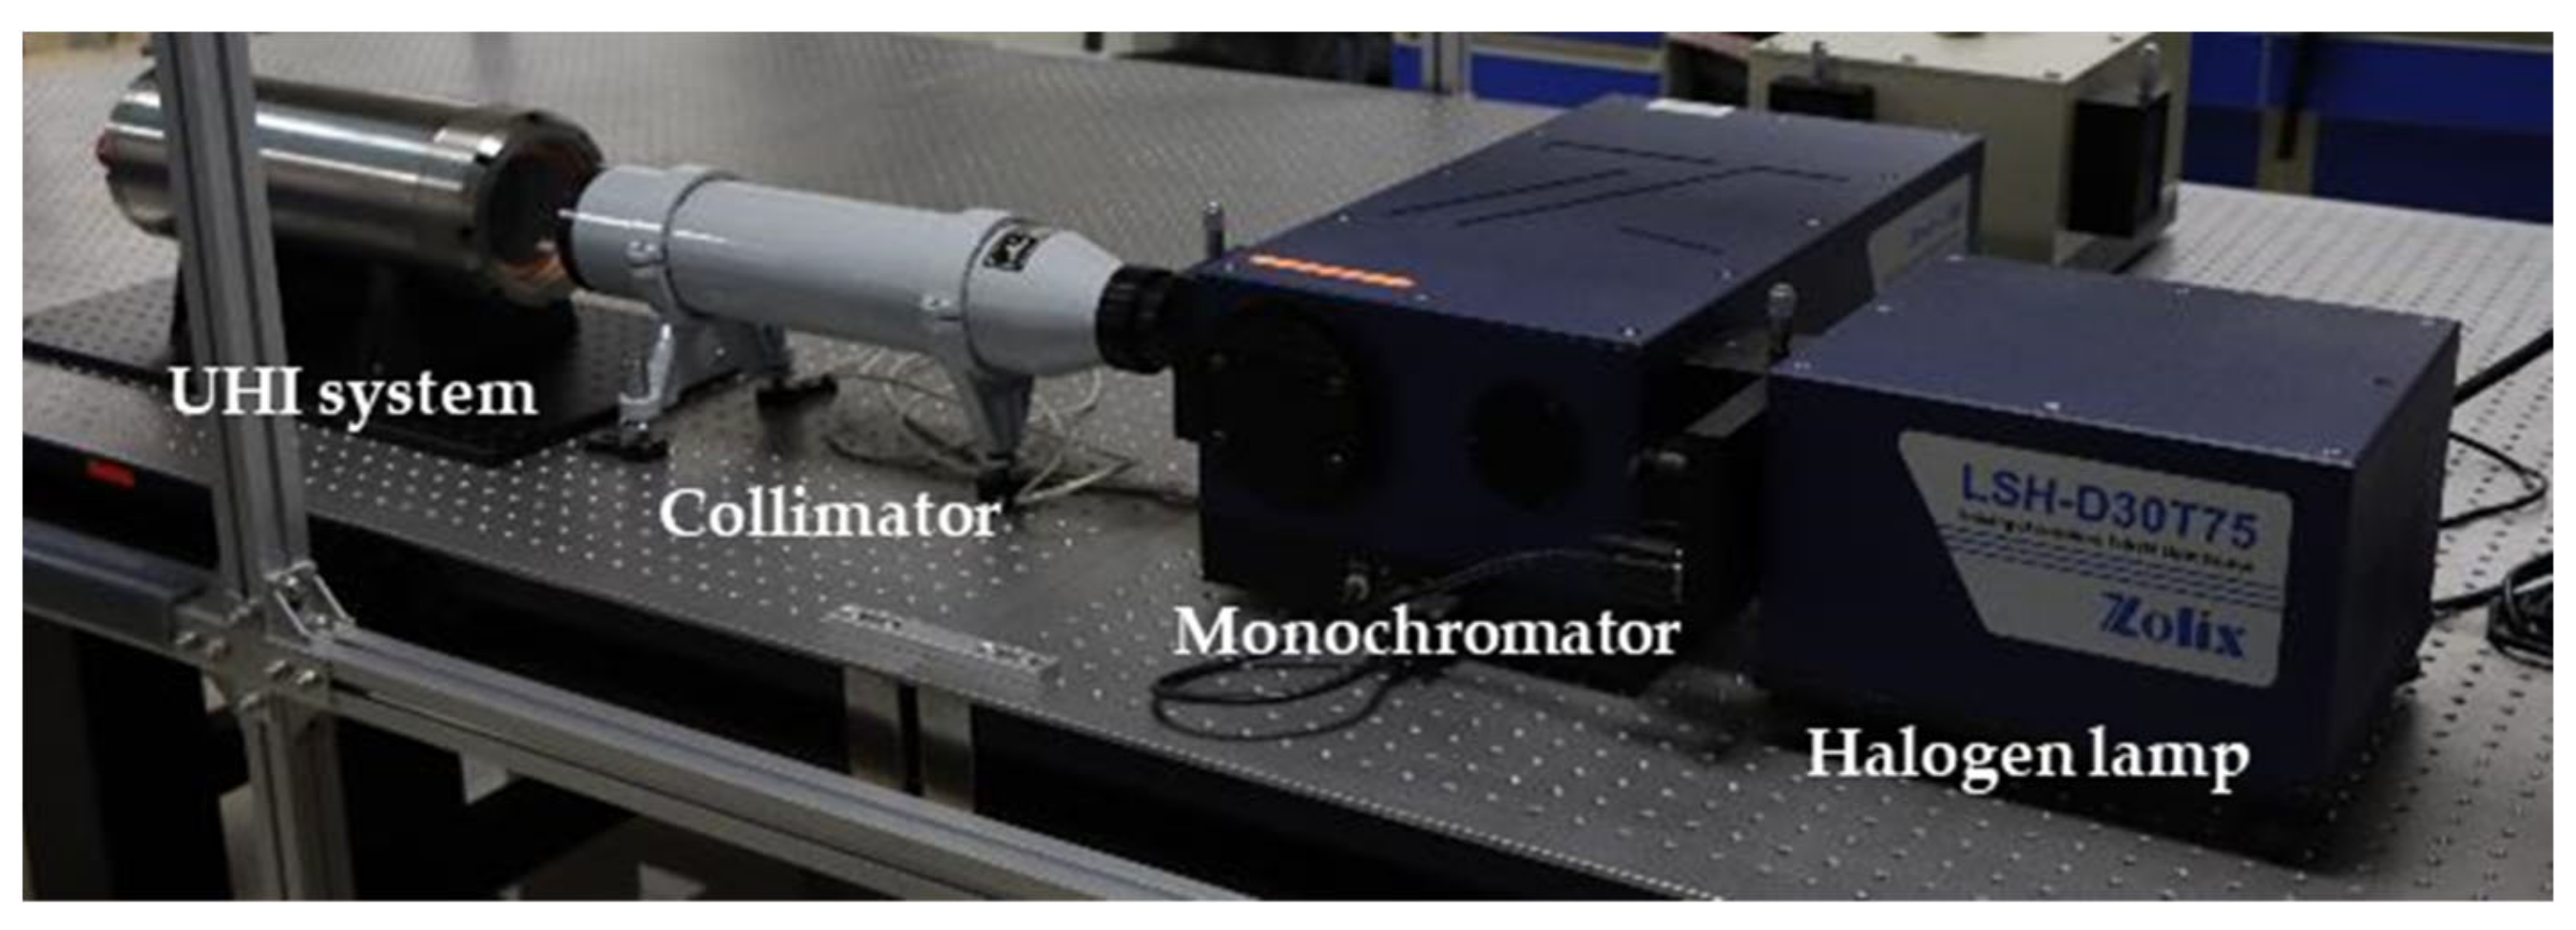
Spectral resolution refers to the minimum wavelength interval the imager can resolve, expressed by the full width at half maxima (FWHM) of the response spectrum. In the hyperspectral imager, the spectral resolution is affected by slit width, grating performance, pixel size, and other influencing factors introduced by alignment error. The experimental setup of spectral calibration is shown in Figure 3. The narrowband light generated by the halogen lamp and monochromator was expanded and collimated through the collimator, then entered into the UHI system and reached the corresponding position on the detector. The full spectrum calibration was completed by switching the wavelength of the narrowband light and recording images of the detector.
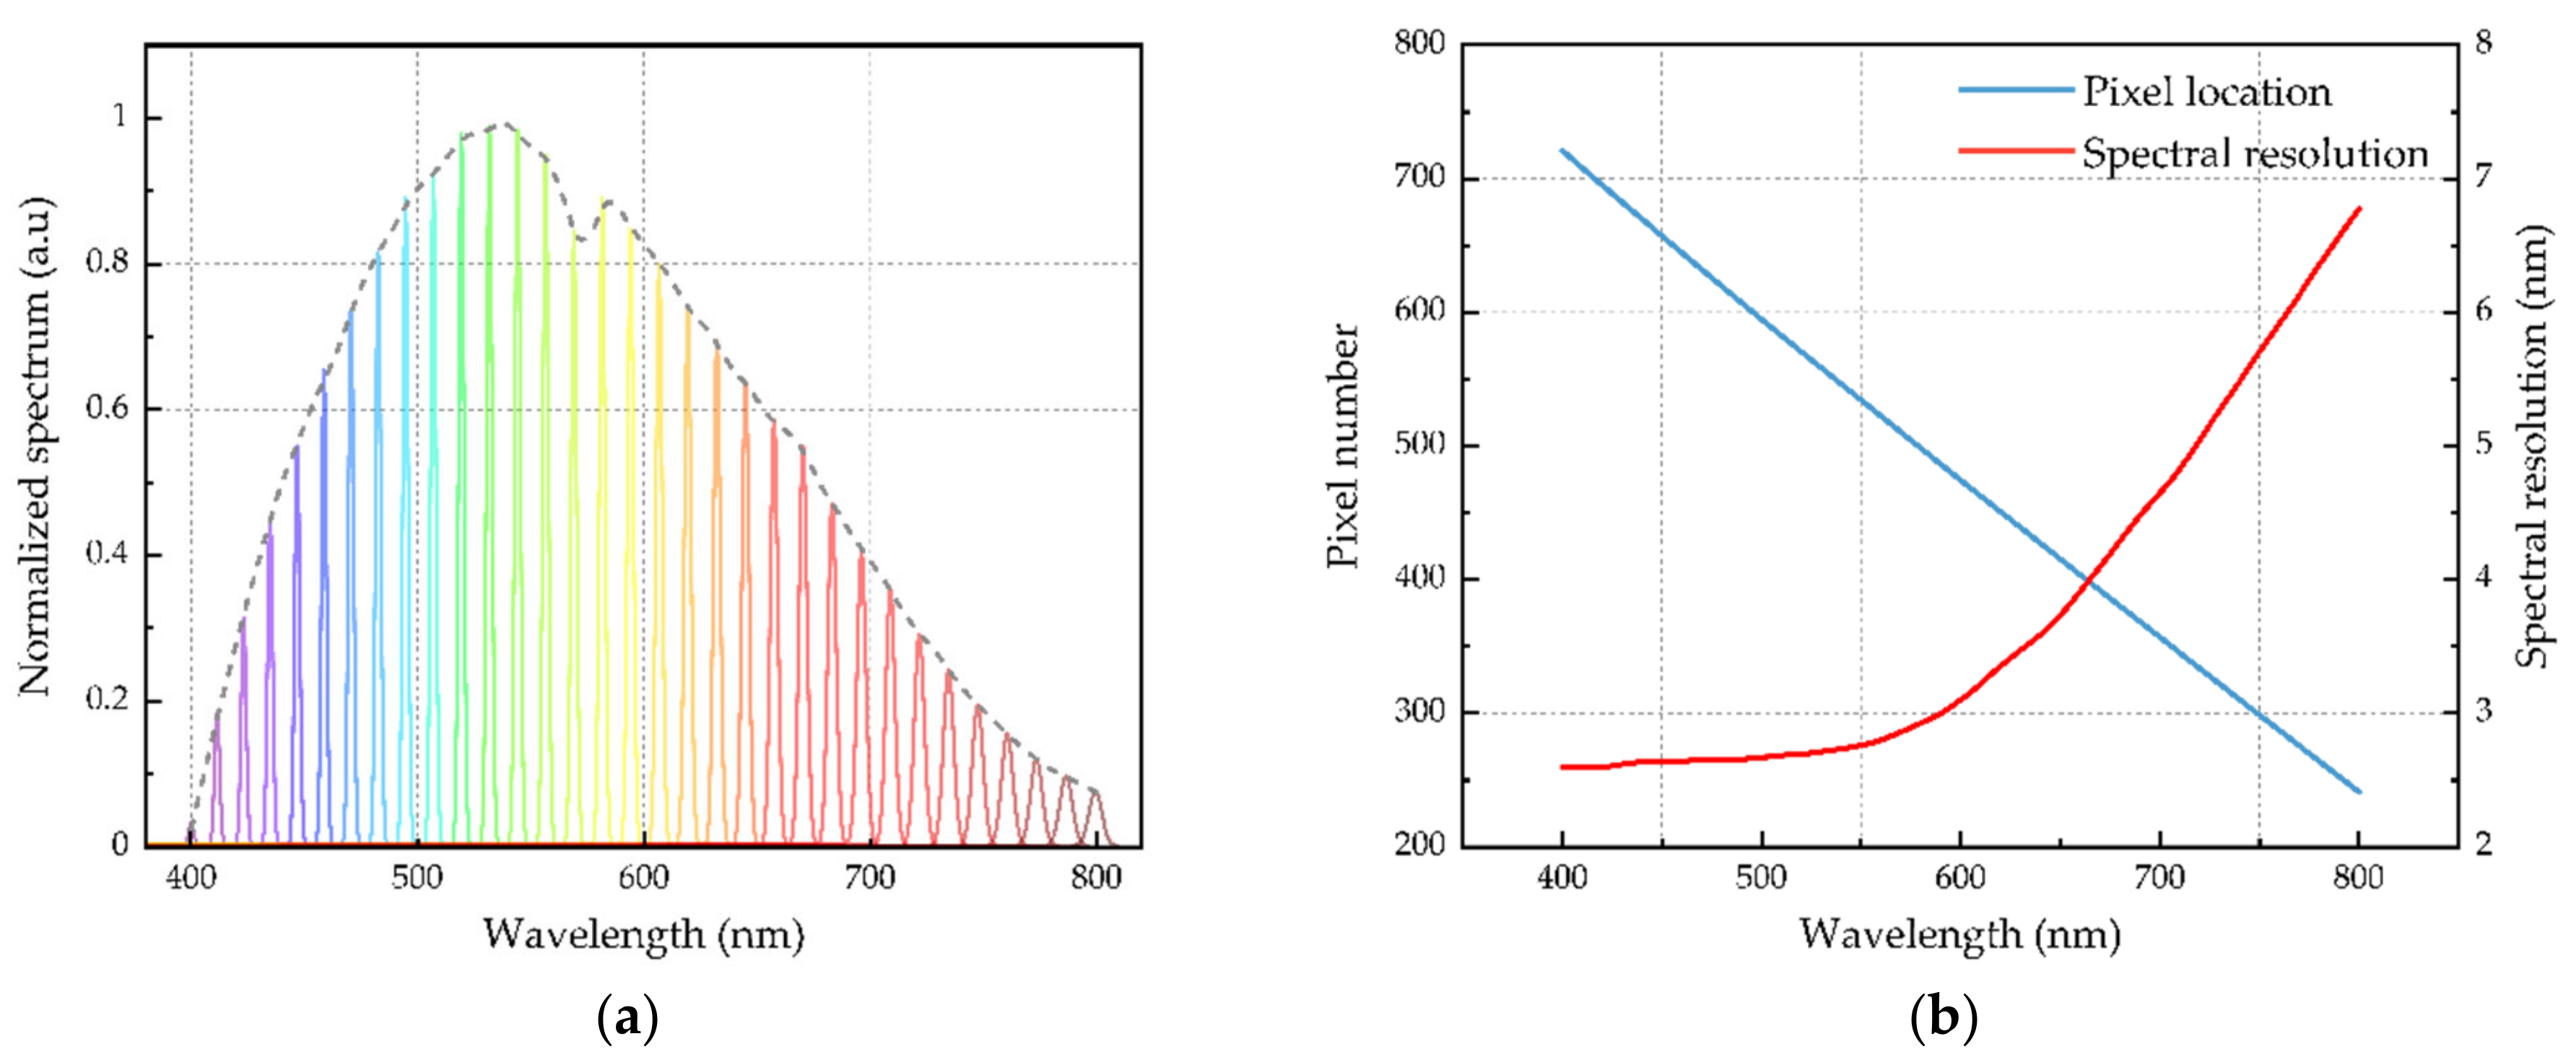
After calculation, with the 2× binning in spectral direction, the UHI system contained 480 bands covering the spectral range of 400–800 nm. Figure 4a shows the normalized response spectrum of the UHI system. There is a depression at 572 nm, which is caused by the long-pass filter in the spectrograph. Figure 4b presents the relationship among pixel location, spectral resolution, and wavelength. The pixel position and wavelength show a good linear relationship, and the spectral resolution is from 2.5 nm to 6.75 nm, with a mean value of 3.7 nm. From the perspective of the results above, the designed UHI system has a relatively high spectral resolution. In a sense, the UHI system can identify those materials with indicative spectral signatures from the mixtures.
3.2. Radiometric Calibration
The digital number (DN) is the pixel response of the input signal, which is associated with the exposure time and the spectral radiance of targets. Actually, due to some influence factors such as manufacturing defects, pixel location, and dark signal, even if the incident light is uniform, the DN of each pixel is different. Therefore, radiometric calibration is required to eliminate the influence and establish the relationship between DN and absolute spectral radiance.
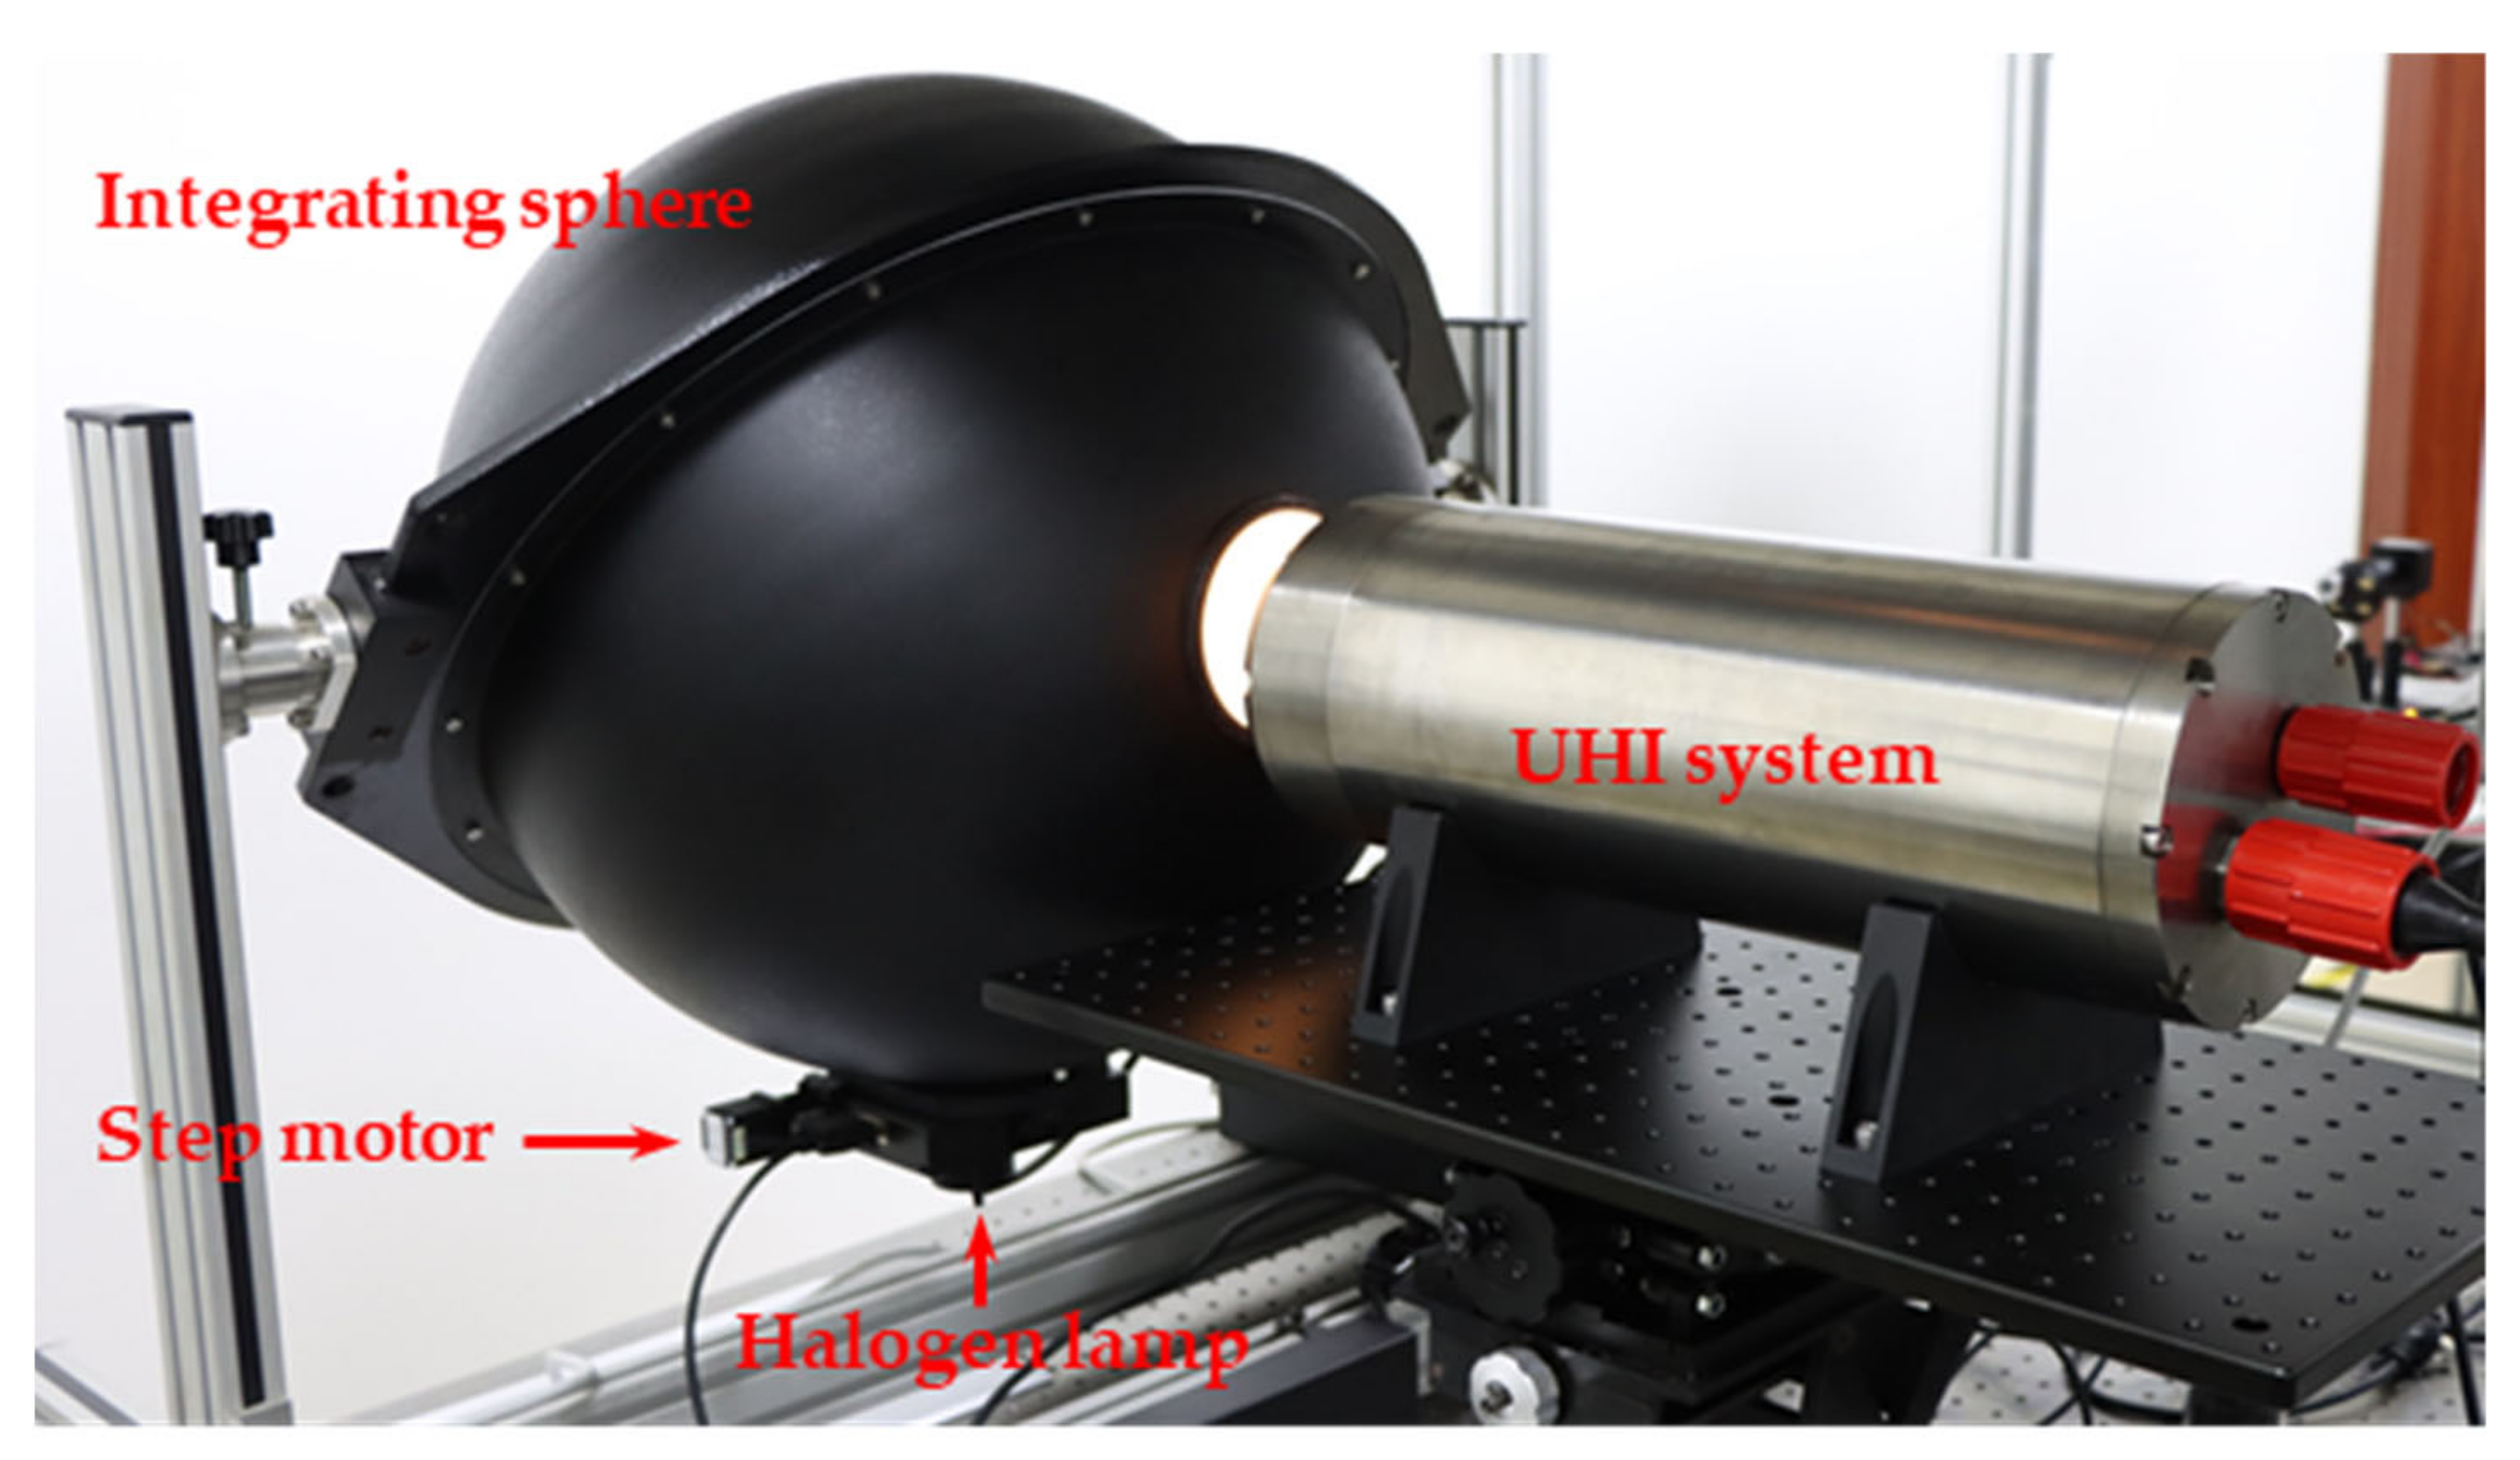
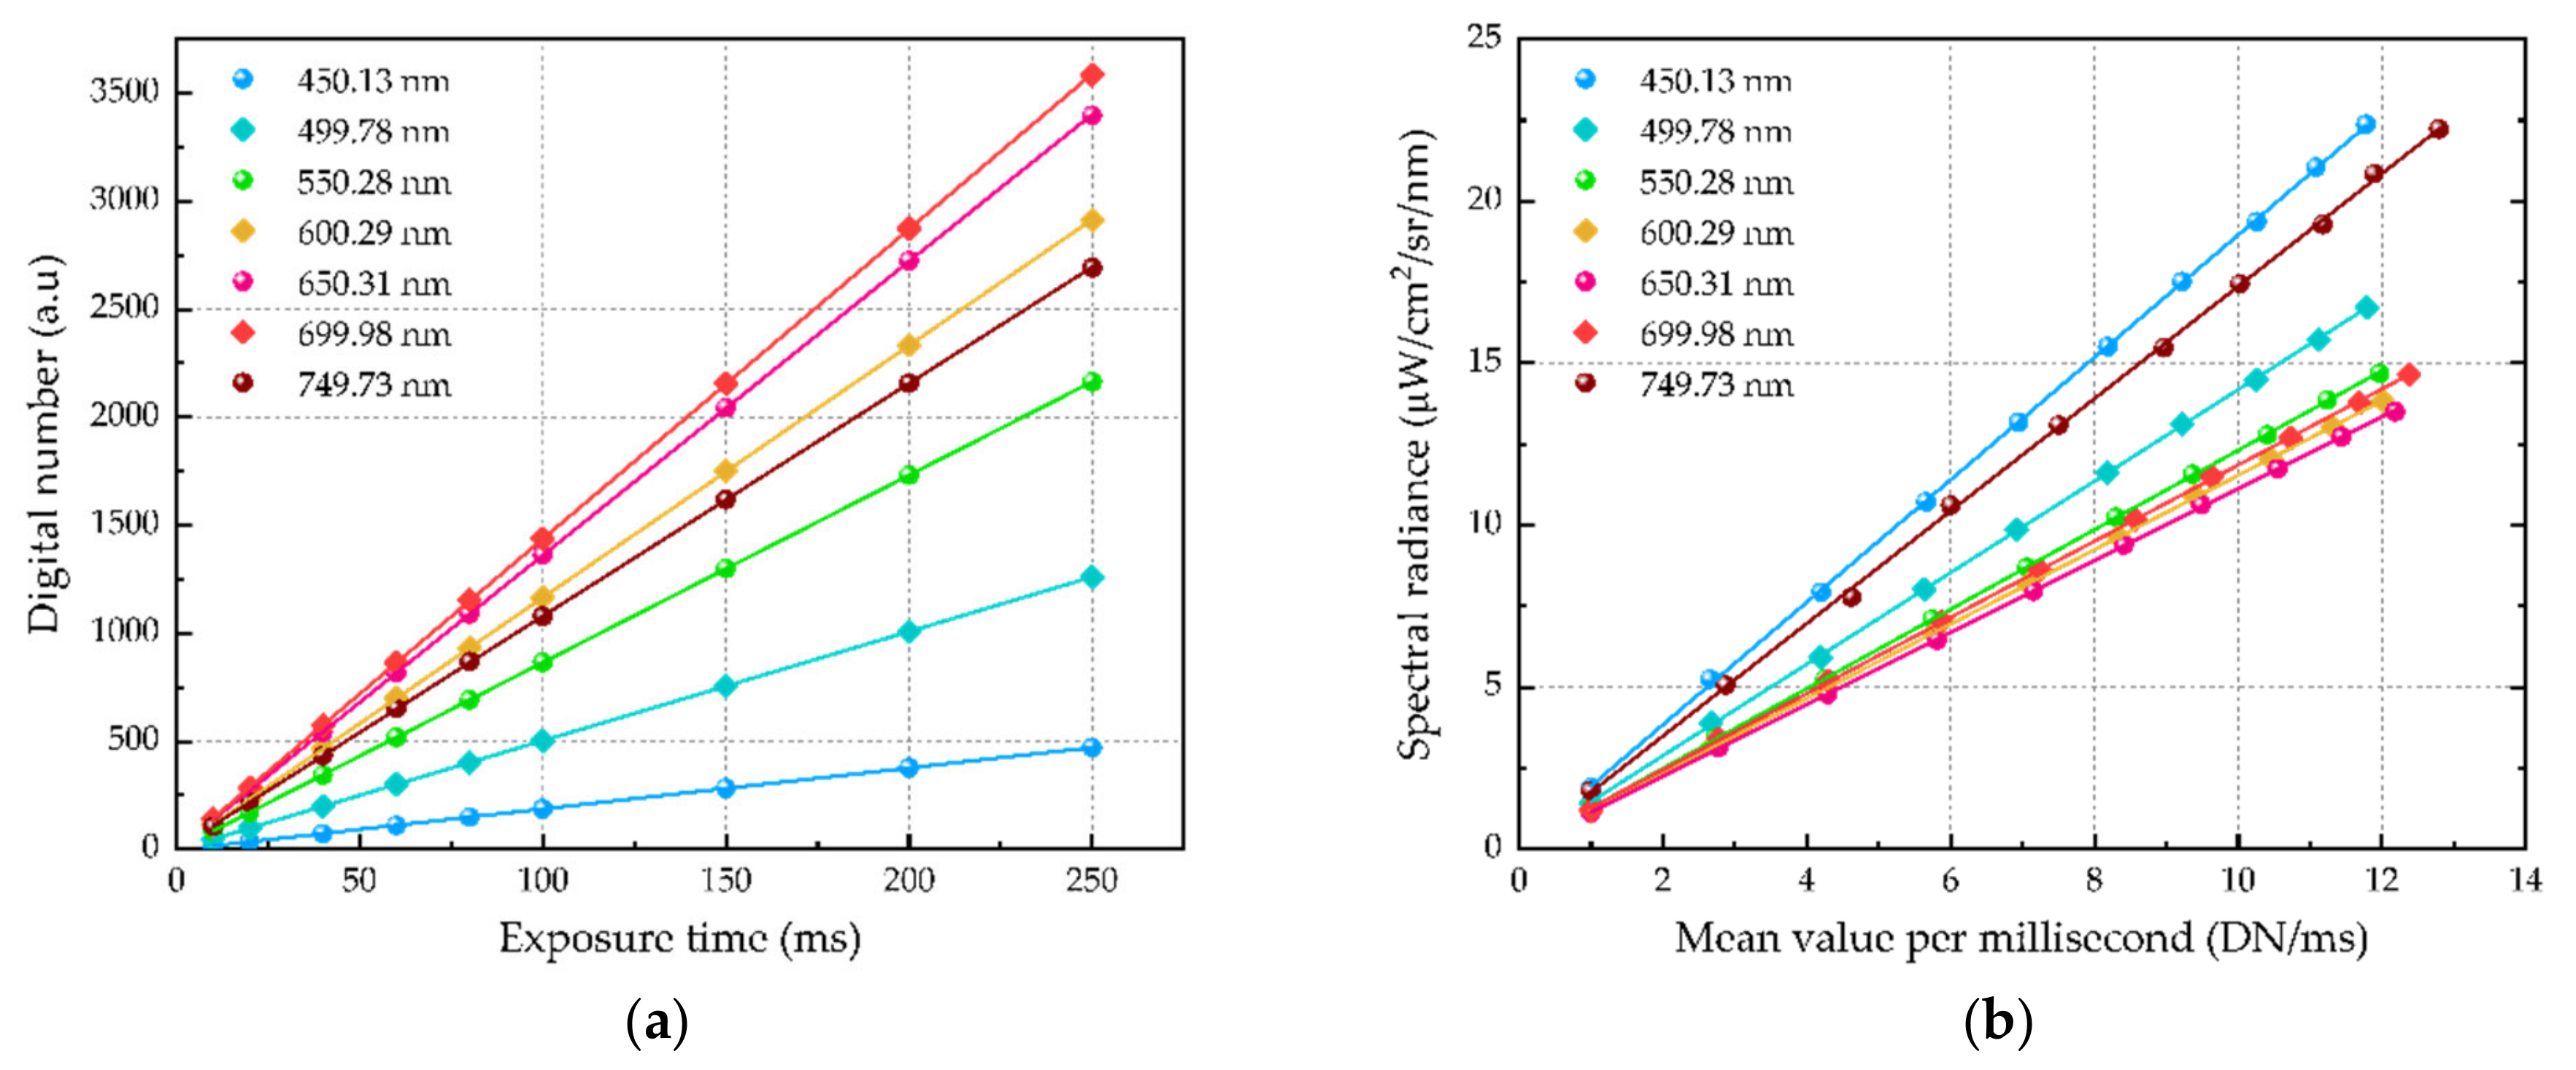
Figure 5 shows the calibration instruments in the laboratory, including the integrating sphere, halogen lamp, and slit driven by the step motor. In radiometric calibration, the bad-pixel detection and dark signal calibration of the detector were carried out first. Then, the DN of the UHI system was measured at various exposure times from 1 ms to 250 ms under the constant illumination of the integrating sphere. Figure 6a shows the relationship between the DN of seven listed spectral bands and exposure times. Each line has good linearity, and the slope of lines reflects the responsiveness to the light intensity with different wavelengths.
In addition, another darkroom test was performed to test the response of the UHI system in different light intensity. The light intensity was adjusted by the slit inside, while a radiometer placed on the exit port of the integrating sphere was used to detect the spectral radiance. The DN was measured 50 times in one intensity at a fixed exposure time of 50 ms. Thus, the mean value per millisecond was calculated, and the corresponding relationship between the DN response and spectral radiance was finally established, which is shown in Figure 6b. Based on the results in Figure 6a,b, the spectral radiation characteristics of unknown targets can be obtained according to the DN response of the UHI systems, which is effective for eliminating the water influence and reconstructing the spectral reflectance in underwater imaging.
3.3. Autofocus Calibration
In the autofocusing process of dual-mode imaging, the RGB lens is adjusted to the optimal focusing voltage according to the sharpness measurement results of RGB images. Here, the RGB focusing voltage and transfer factor are combined and then transferred to the HSI lens. The relationship between the focusing distance and the corresponding focusing voltage of each lens requires measuring to determine the transfer factor.
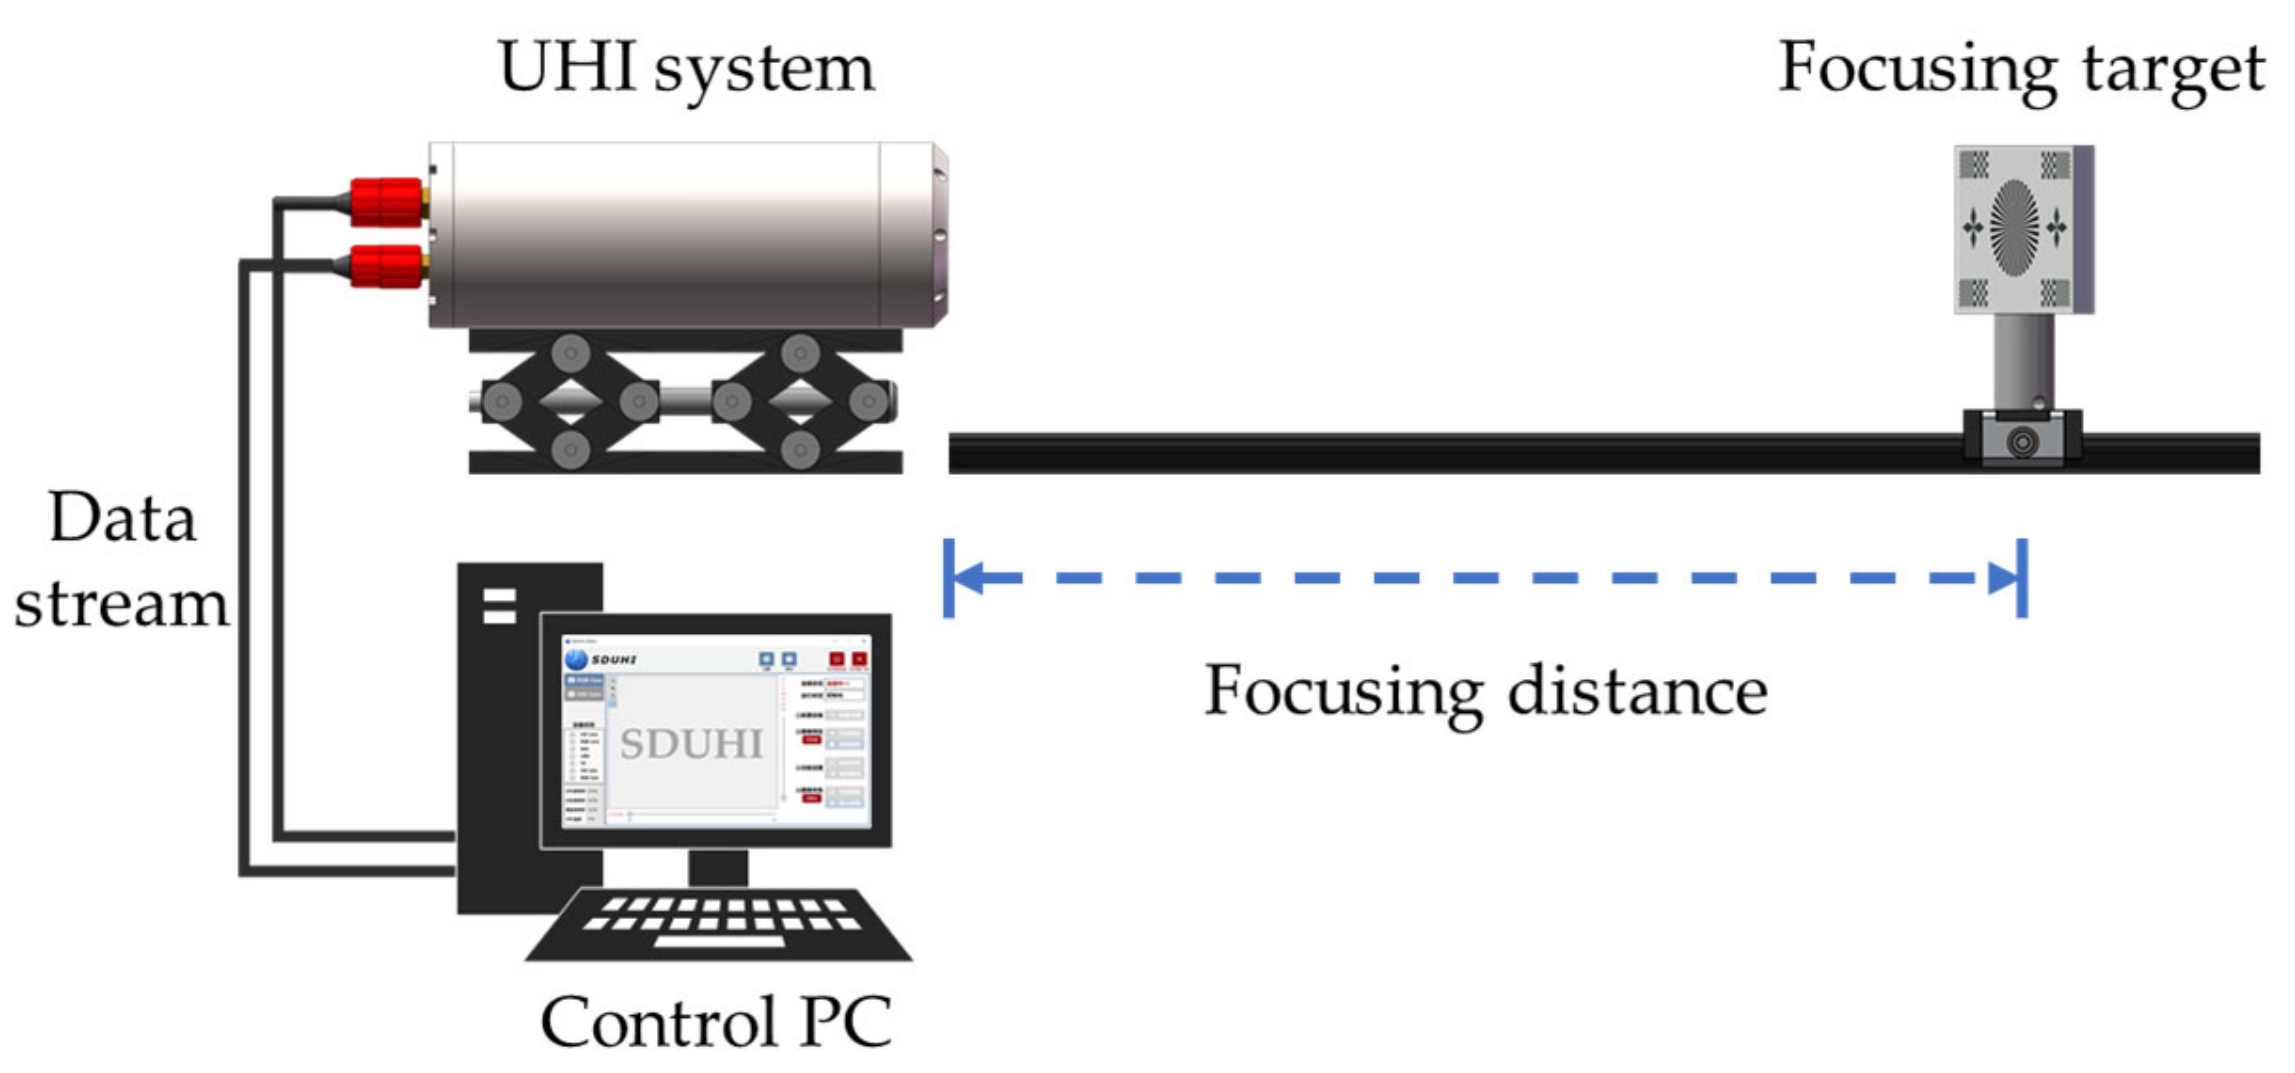
Figure 7 shows the setup of autofocus calibration instruments. The UHI system was fixed on the lifter and placed at one end of the long-distance rail. A height-adjustable target with a focusing pattern was arranged at a variable location away from the UHI system. In the next step, changing the distance of the target to the UHI system continuously at the range of 20 cm to 250 cm and simultaneously searching for the optimal focusing voltage in the whole voltage range at an interval of 0.05 V. Finally, the relationship between focusing voltage and focusing distance was obtained to establish the look-up table of RGB and HSI lens.
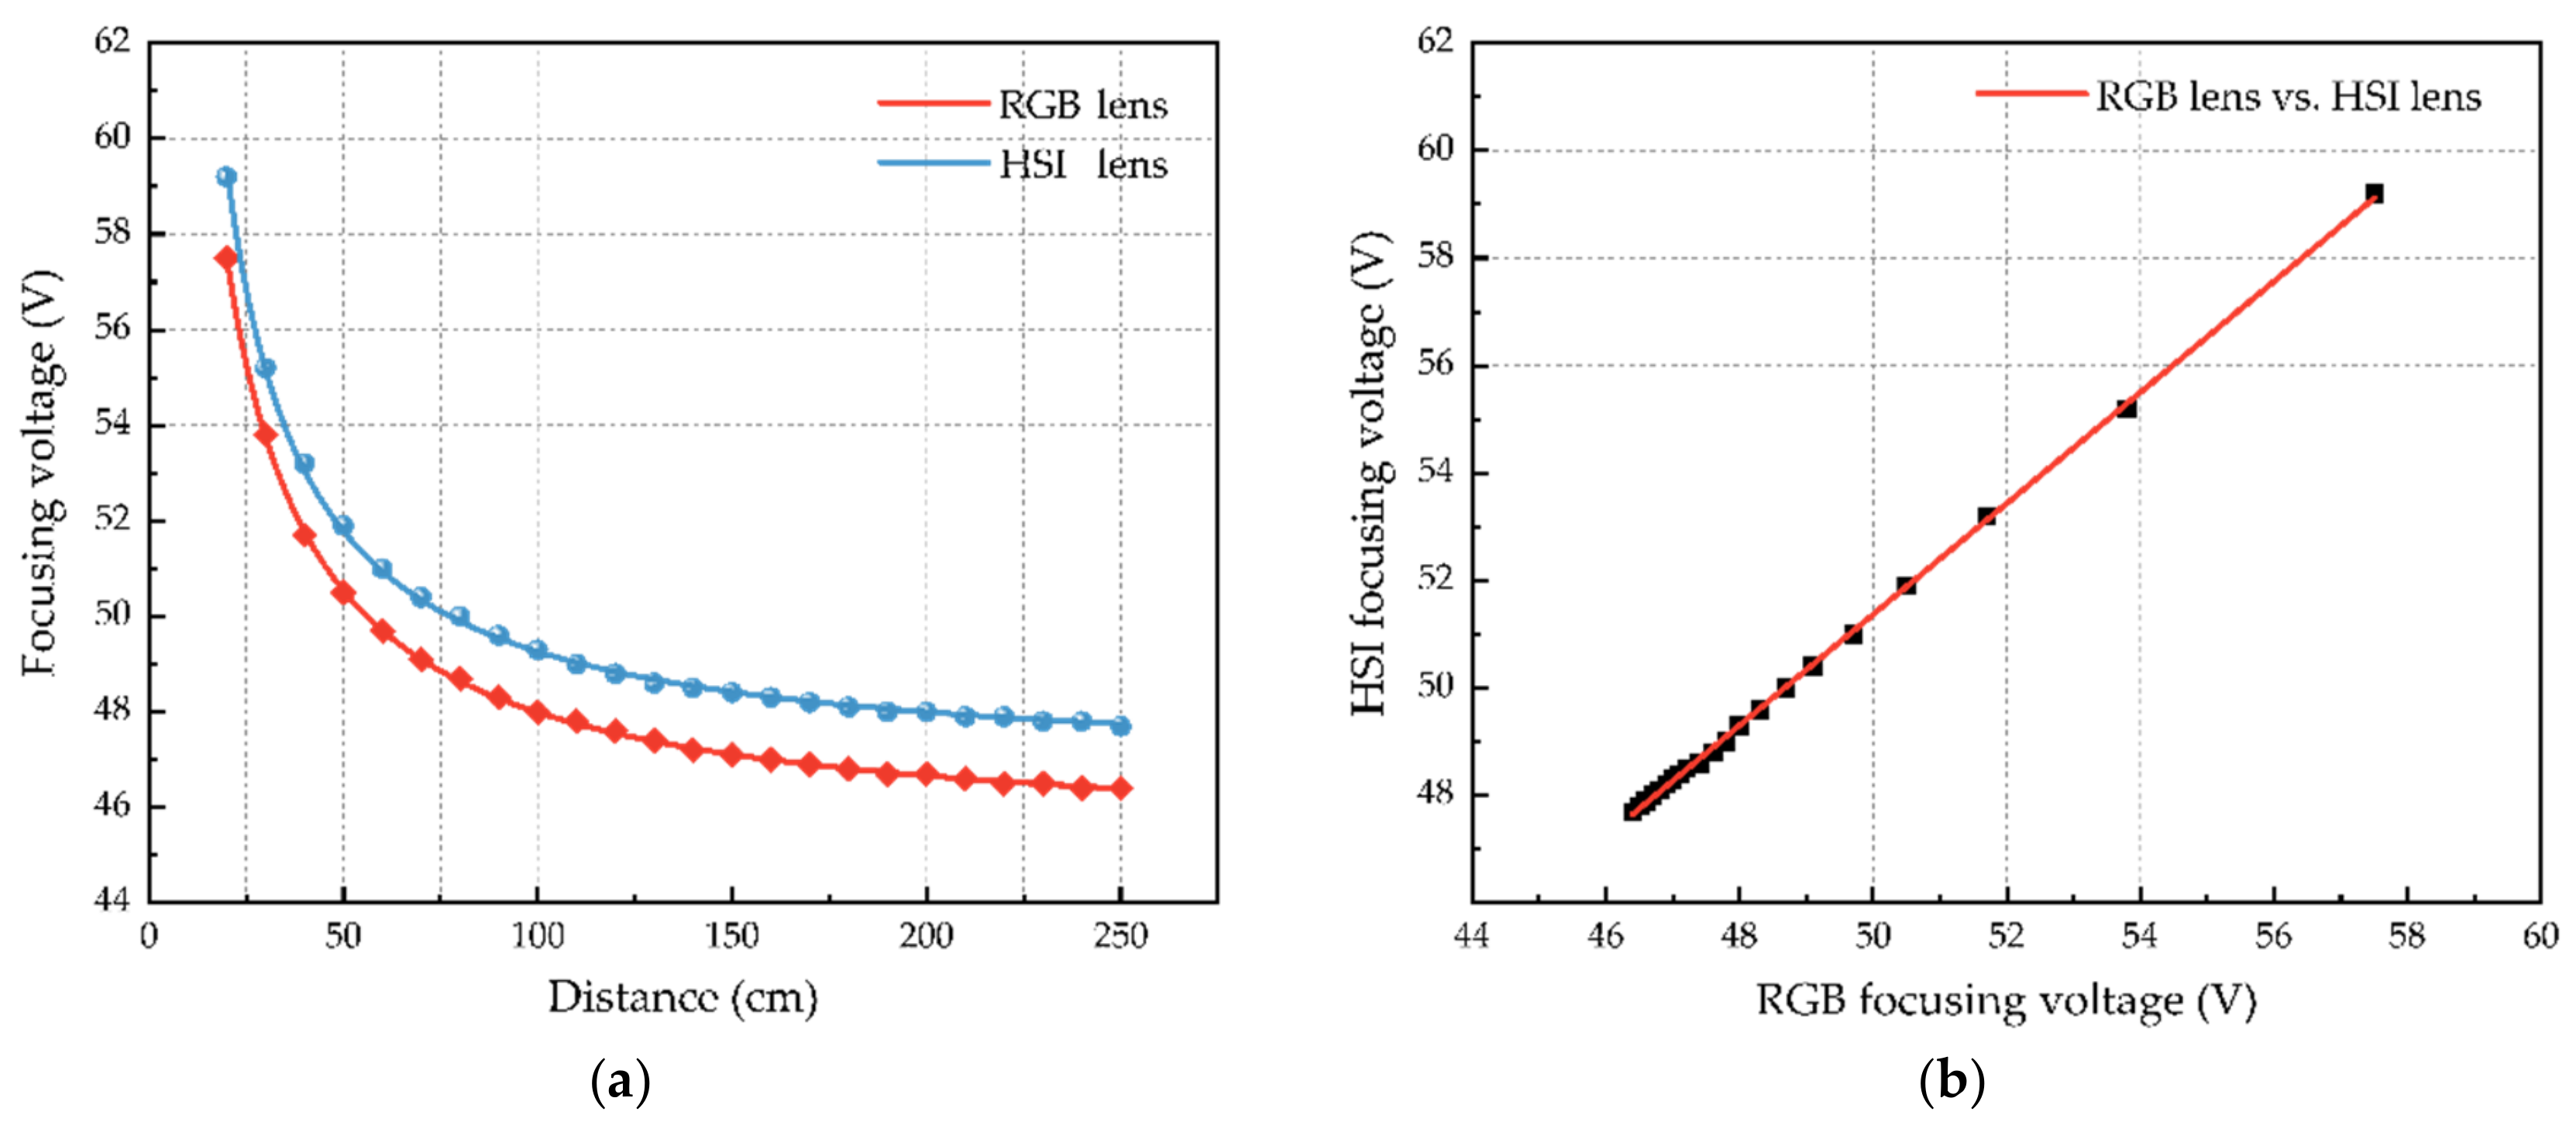
Figure 8a shows the corresponding relationship between the focusing voltage and the focusing distance, which varies at the interval of 10 cm. As the distance increases, the optimal focusing voltage decreases rapidly and then tends to gently. Figure 8b shows the relationship between the focusing voltage of the RGB lens and the HSI lens. The curve-fitting result shows a good linear relationship, which follows the form of y = 1.033x − 0.2826 at the fitting coefficient of 0.99959. Among them, the slope of the fitted line is related to the attributes of both RGB and HSI lenses, while the intercept is affected by the installation position, for example, the front-to-back distance between the two lenses.
4. Experiment Result and Analysis
4.1. Autofocus Experiment for UHI Imager
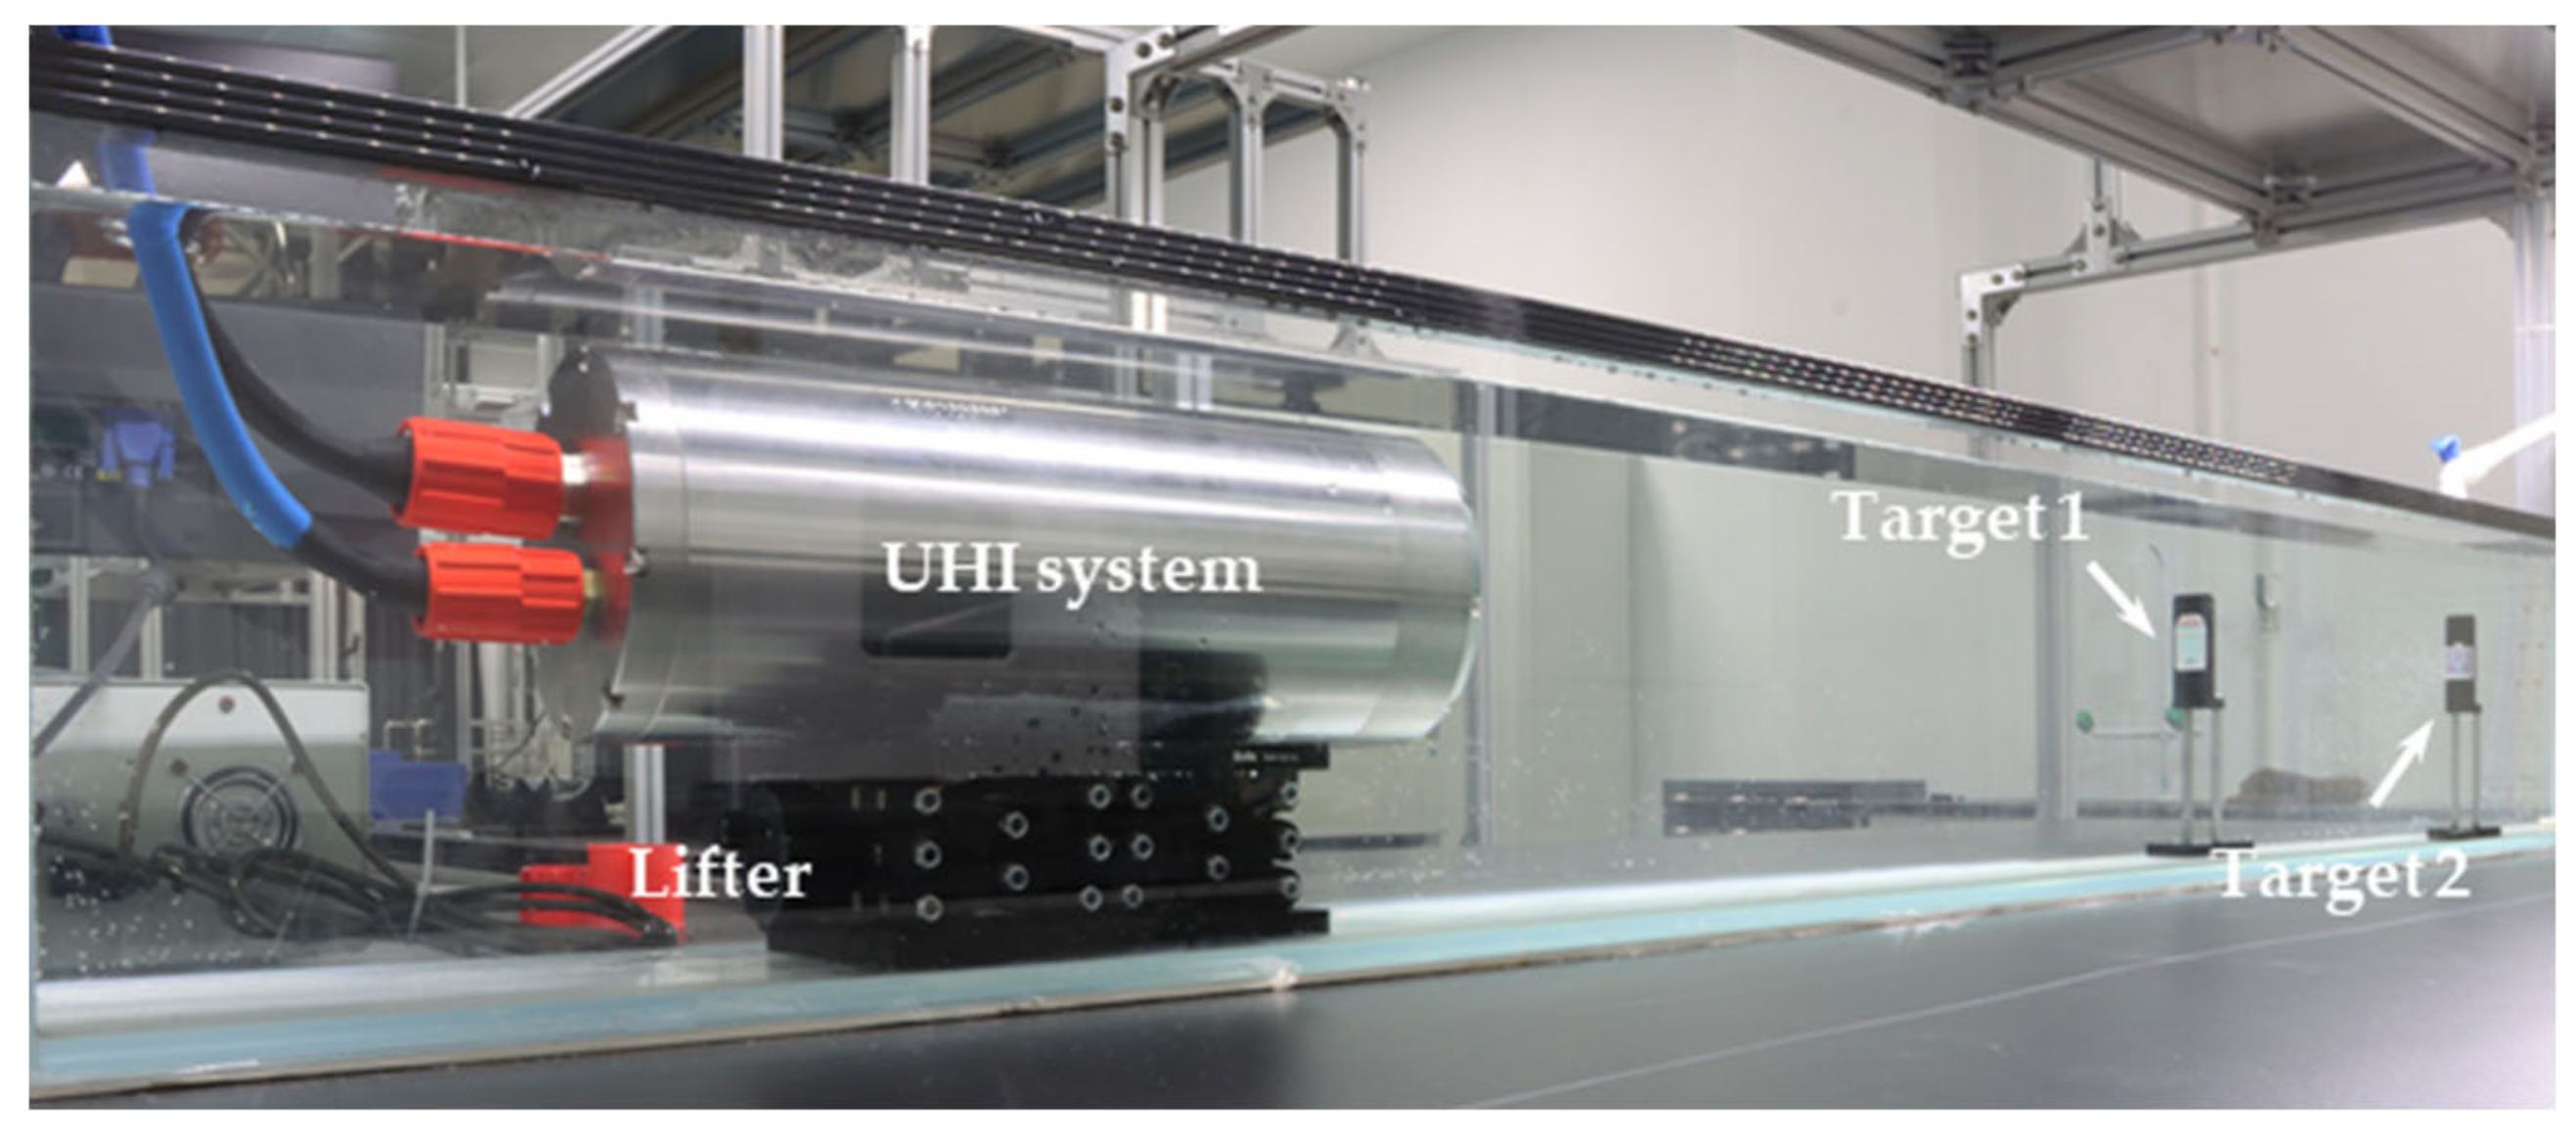
A laboratory experiment was conducted to test the performance of the focusing transfer method. The experimental setup is shown in Figure 9. Two test targets were placed in the long-distance tank in tandem. First, the focusing voltage was adjusted to make target 1 in the clearest position. Then, the focusing transfer method was used to focus on target 2. In the experiment, the formula of Tenengrad (Tenenbaum gradient) was used to calculate the sharpness of the images, and the optimal focusing voltage was found by the method of golden section search.
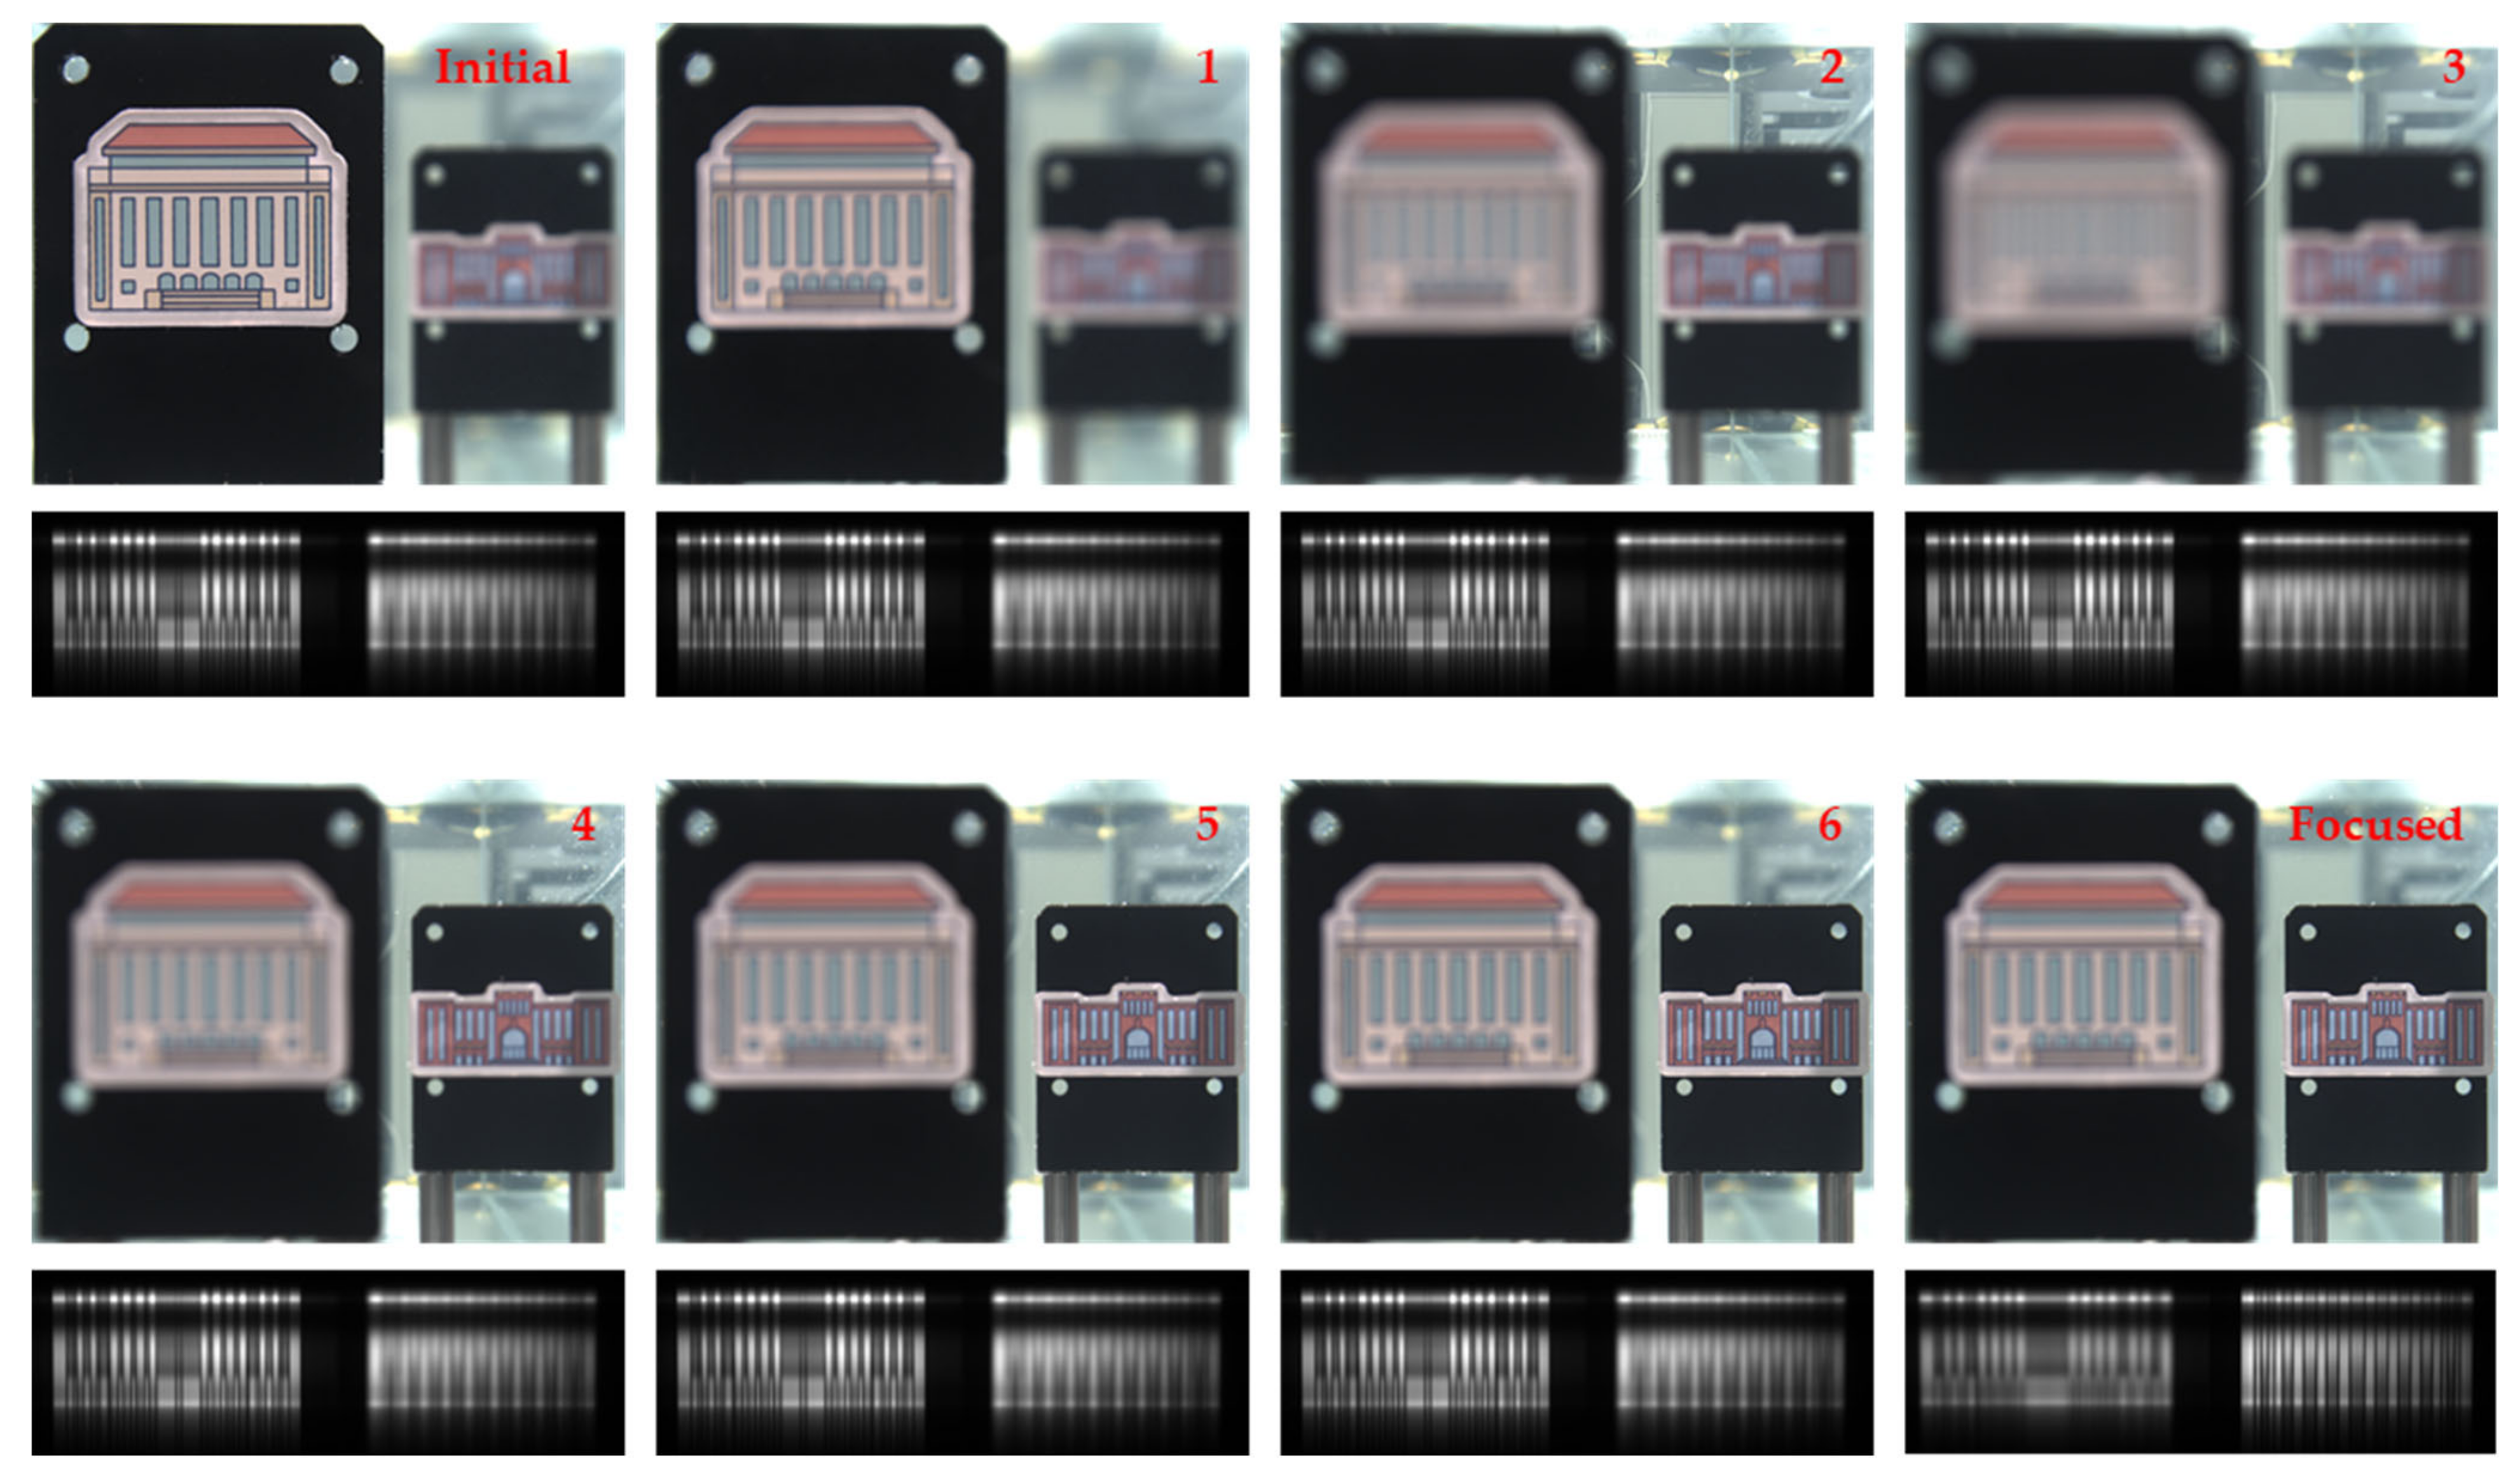
The experimental results, which demonstrate a typical process of the focusing transfer method, are shown in Figure 10. Initially, the RGB and HSI lenses both focused on target 1. In the next step, the RGB lens started to execute the autofocusing procedure to change the focusing object from target 1 to target 2. Frames 1–6 present the intuitive changes in the sharpness of two targets. The RGB images of target 2 gradually became clear, while the hyperspectral images were always focused on target 1. However, once the focusing process was completed, the hyperspectral image was quickly focused on target 2 in the next frame. The experiment illustrates that good focusing results can be obtained through the focusing transfer from the RGB lens to the HSI lens.
The two lenses are mounted as close as possible to ensure an appropriate field of view overlap in the observation area of the two lenses. The distance between the lenses is preferably negligible compared to the distance between the lenses and the observation targets to avoid the influence of the reduction of image quality on focusing at a large viewing angle. The benefit of focus transfer is that the hyperspectral imager will not capture invalid images used for sharpness measurement during continuous acquisition. Besides, the time to complete one autofocusing process has greatly shortened based on the liquid lens’s rapid response and adjustment capability. It should be pointed out that the combined method used in the focusing transfer method is replaceable. Any method that can effectively achieve autofocusing should be considered. Continuous autofocusing can be realized during the acquisition by appropriately setting the decision conditions and thresholds.
4.2. Hyperspectral Imaging Experiment
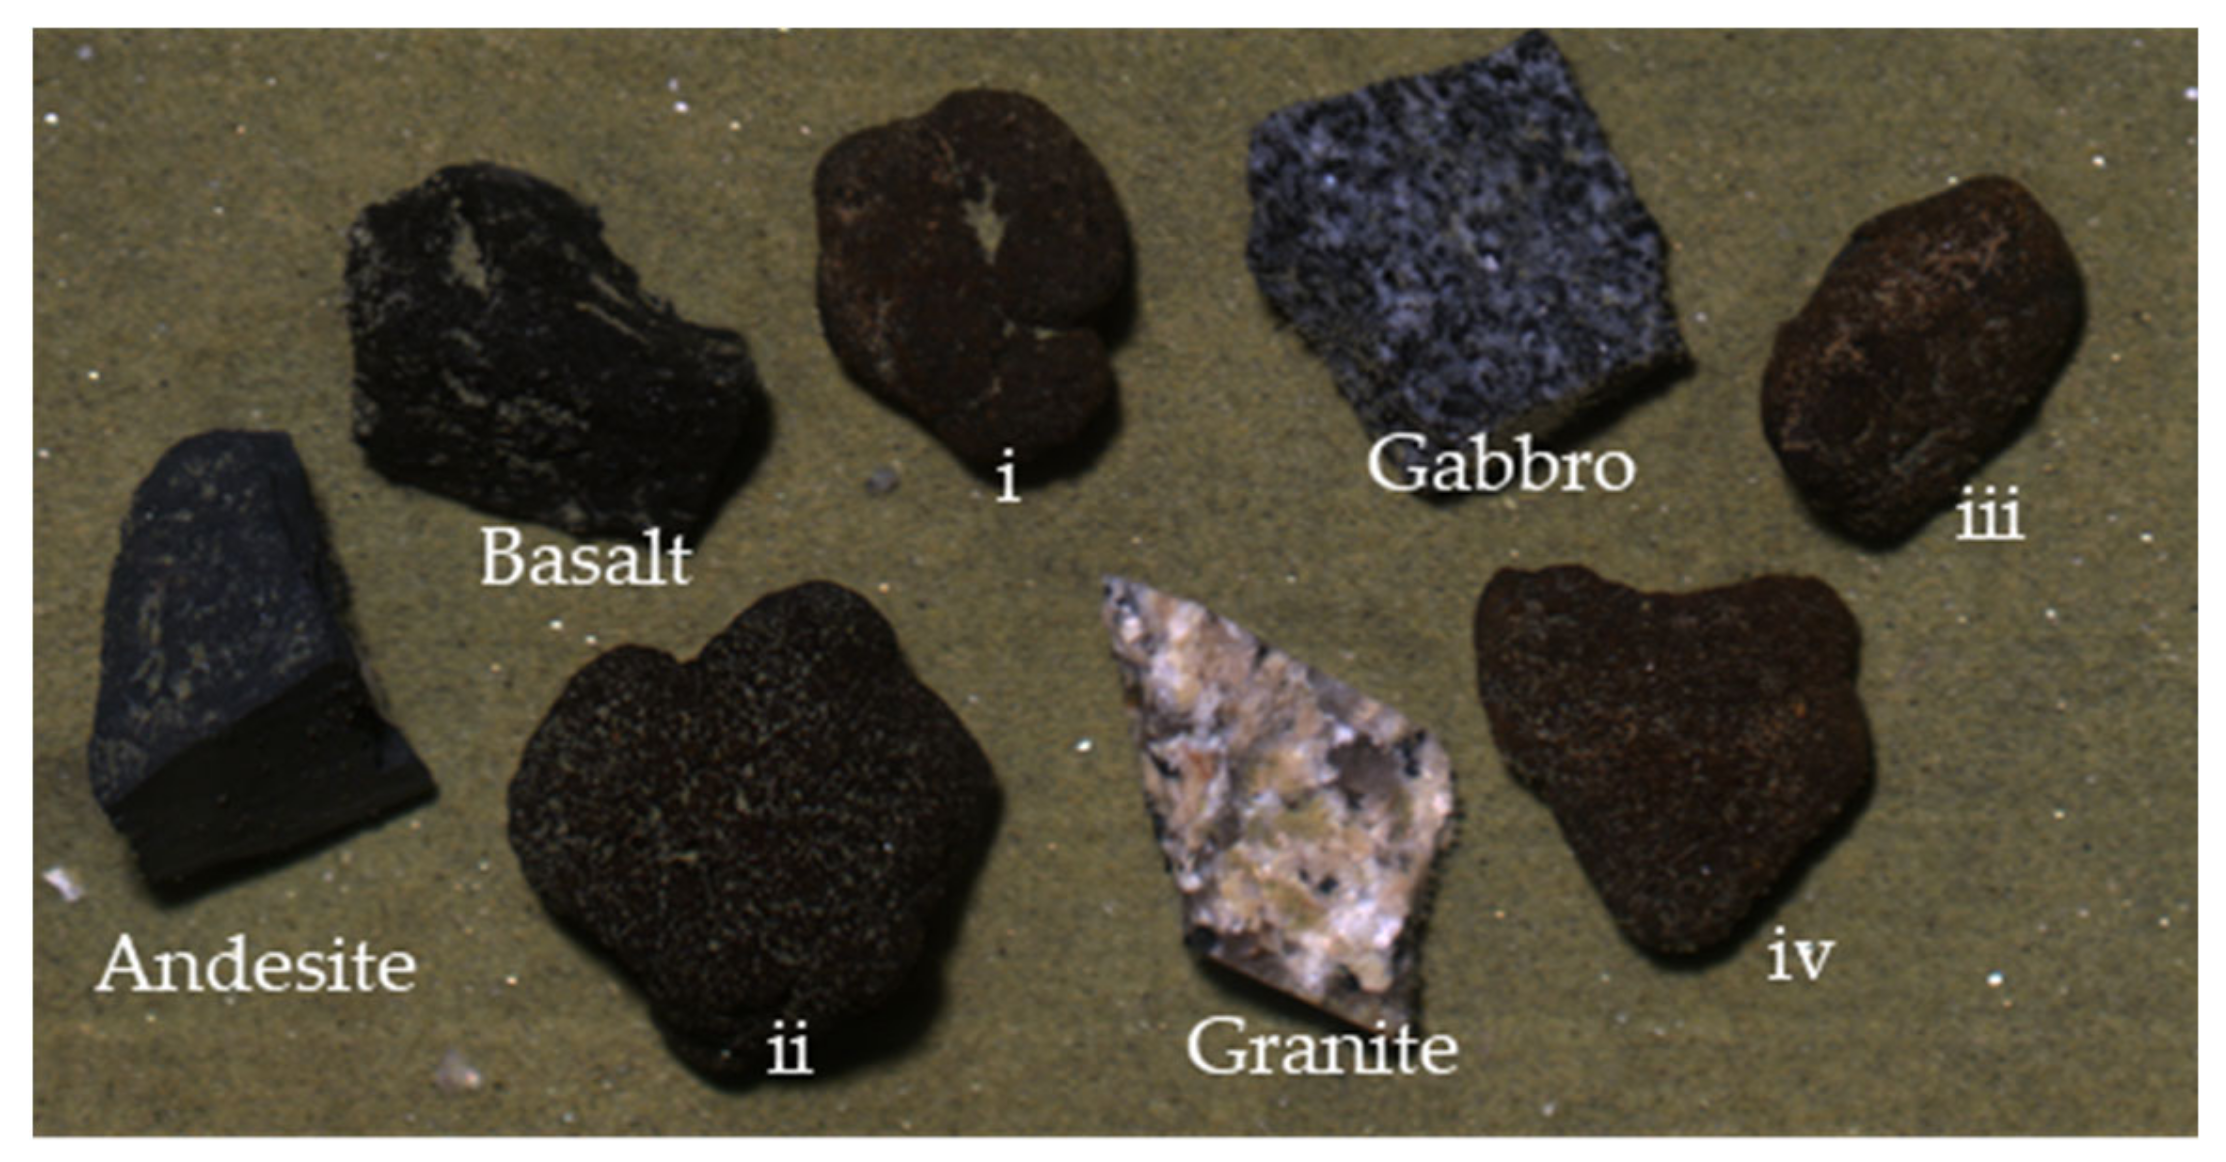
The manganese nodule samples used in this work were obtained from the seamount areas in the western Pacific Ocean at depths of 4000 to 5000 m. They are approximately 3–5 cm in shape size and between black and brown in surface color. Besides, four common rocks, such as granite, gabbro, andesite, and basalt, were chosen to enrich the abundance of sample types. The sediments were a mixture of mud and sand collected nearby the coastal areas.
The mineral samples were placed at the bottom of the black tank, and hyperspectral images were taken at a distance of 30 cm from the bottom using the designed UHI system under the illumination of two 50 W halogen lamps. Figure 11 shows the pseudo-RGB image of the mineral samples.
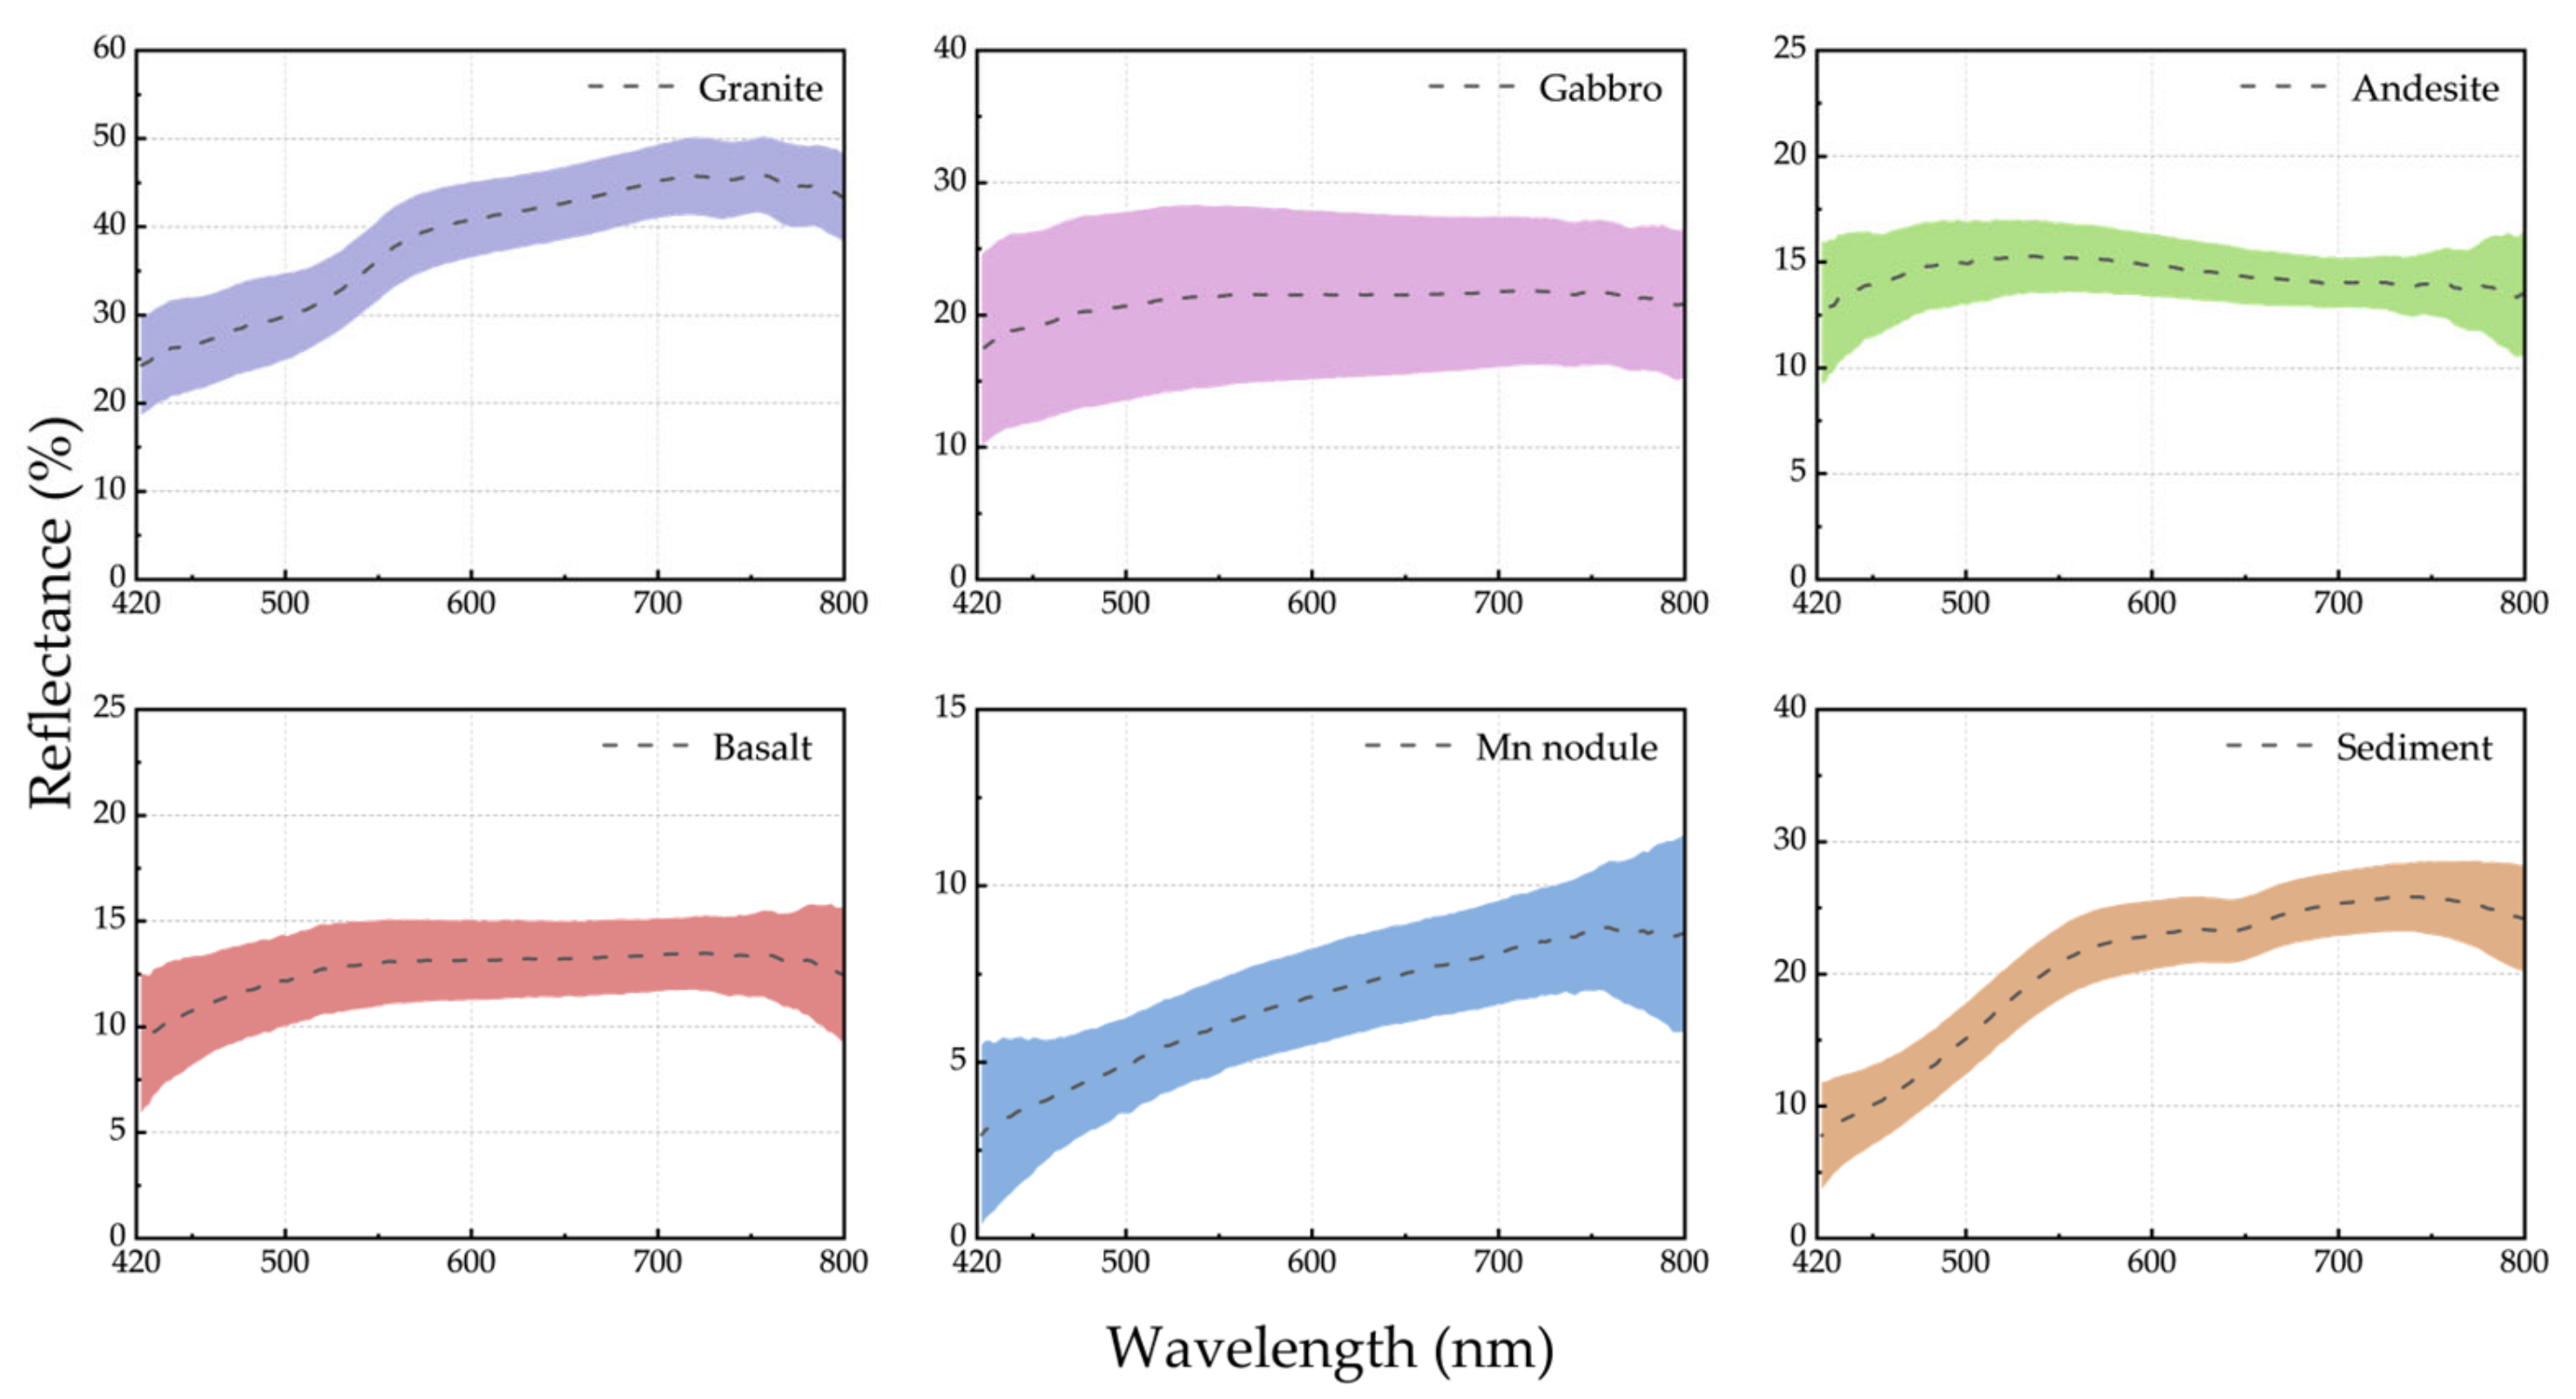
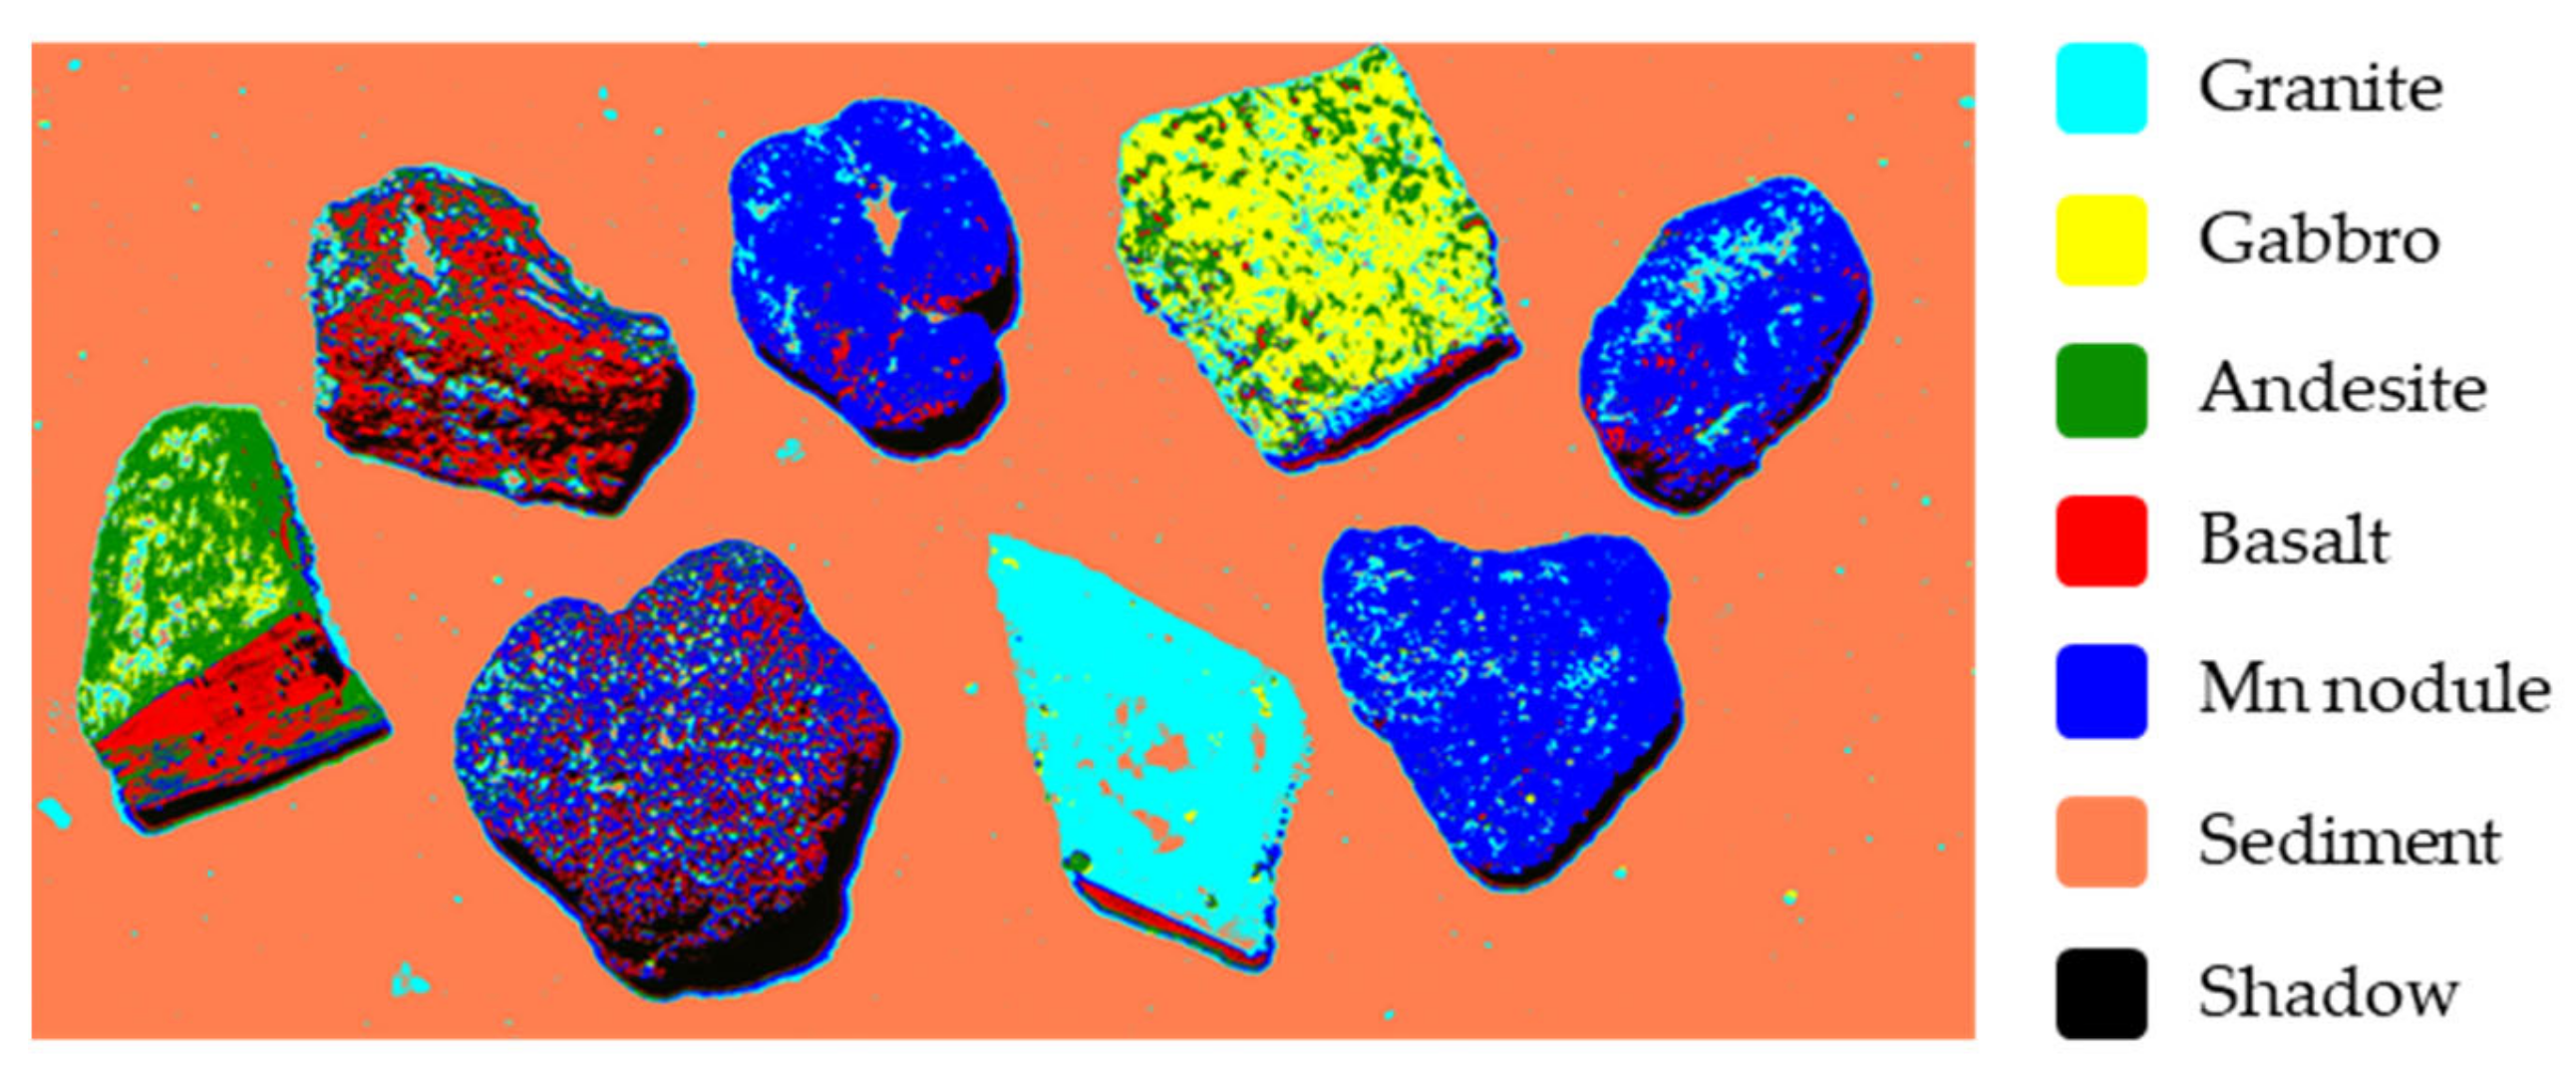
The properties of material, such as shape, transparency, and surface roughness, affect the reflection of its surface. The reflectance spectrum of materials immersed in water tends to be different from that in the air due to absorption and interface effects. Figure 12 shows the corrected reflectance spectrum of mineral samples from 420 nm to 800 nm. Spectral bands before 420 nm were eliminated due to the low signal-to-noise ratio. Although there is a lack of indicative absorption signatures, the manganese nodules still reflect trends distinct from other samples in the reflectance spectrum. Figure 13 shows the classification results of the mineral samples based on the support vector machine (SVM) method. Since the high spatial resolution characteristics brought by the close observation, there are some misclassifications on the surface of the mineral samples. Gabbro and basalt have similar chemical compositions, and their reflectance spectrum is close to andesite, which leads to the low classification accuracy among the three samples. The signature of manganese nodules differs from all other samples, allowing them to be classified almost accurately.
4.3. Deep-Sea Field Test for the UHI Prototype
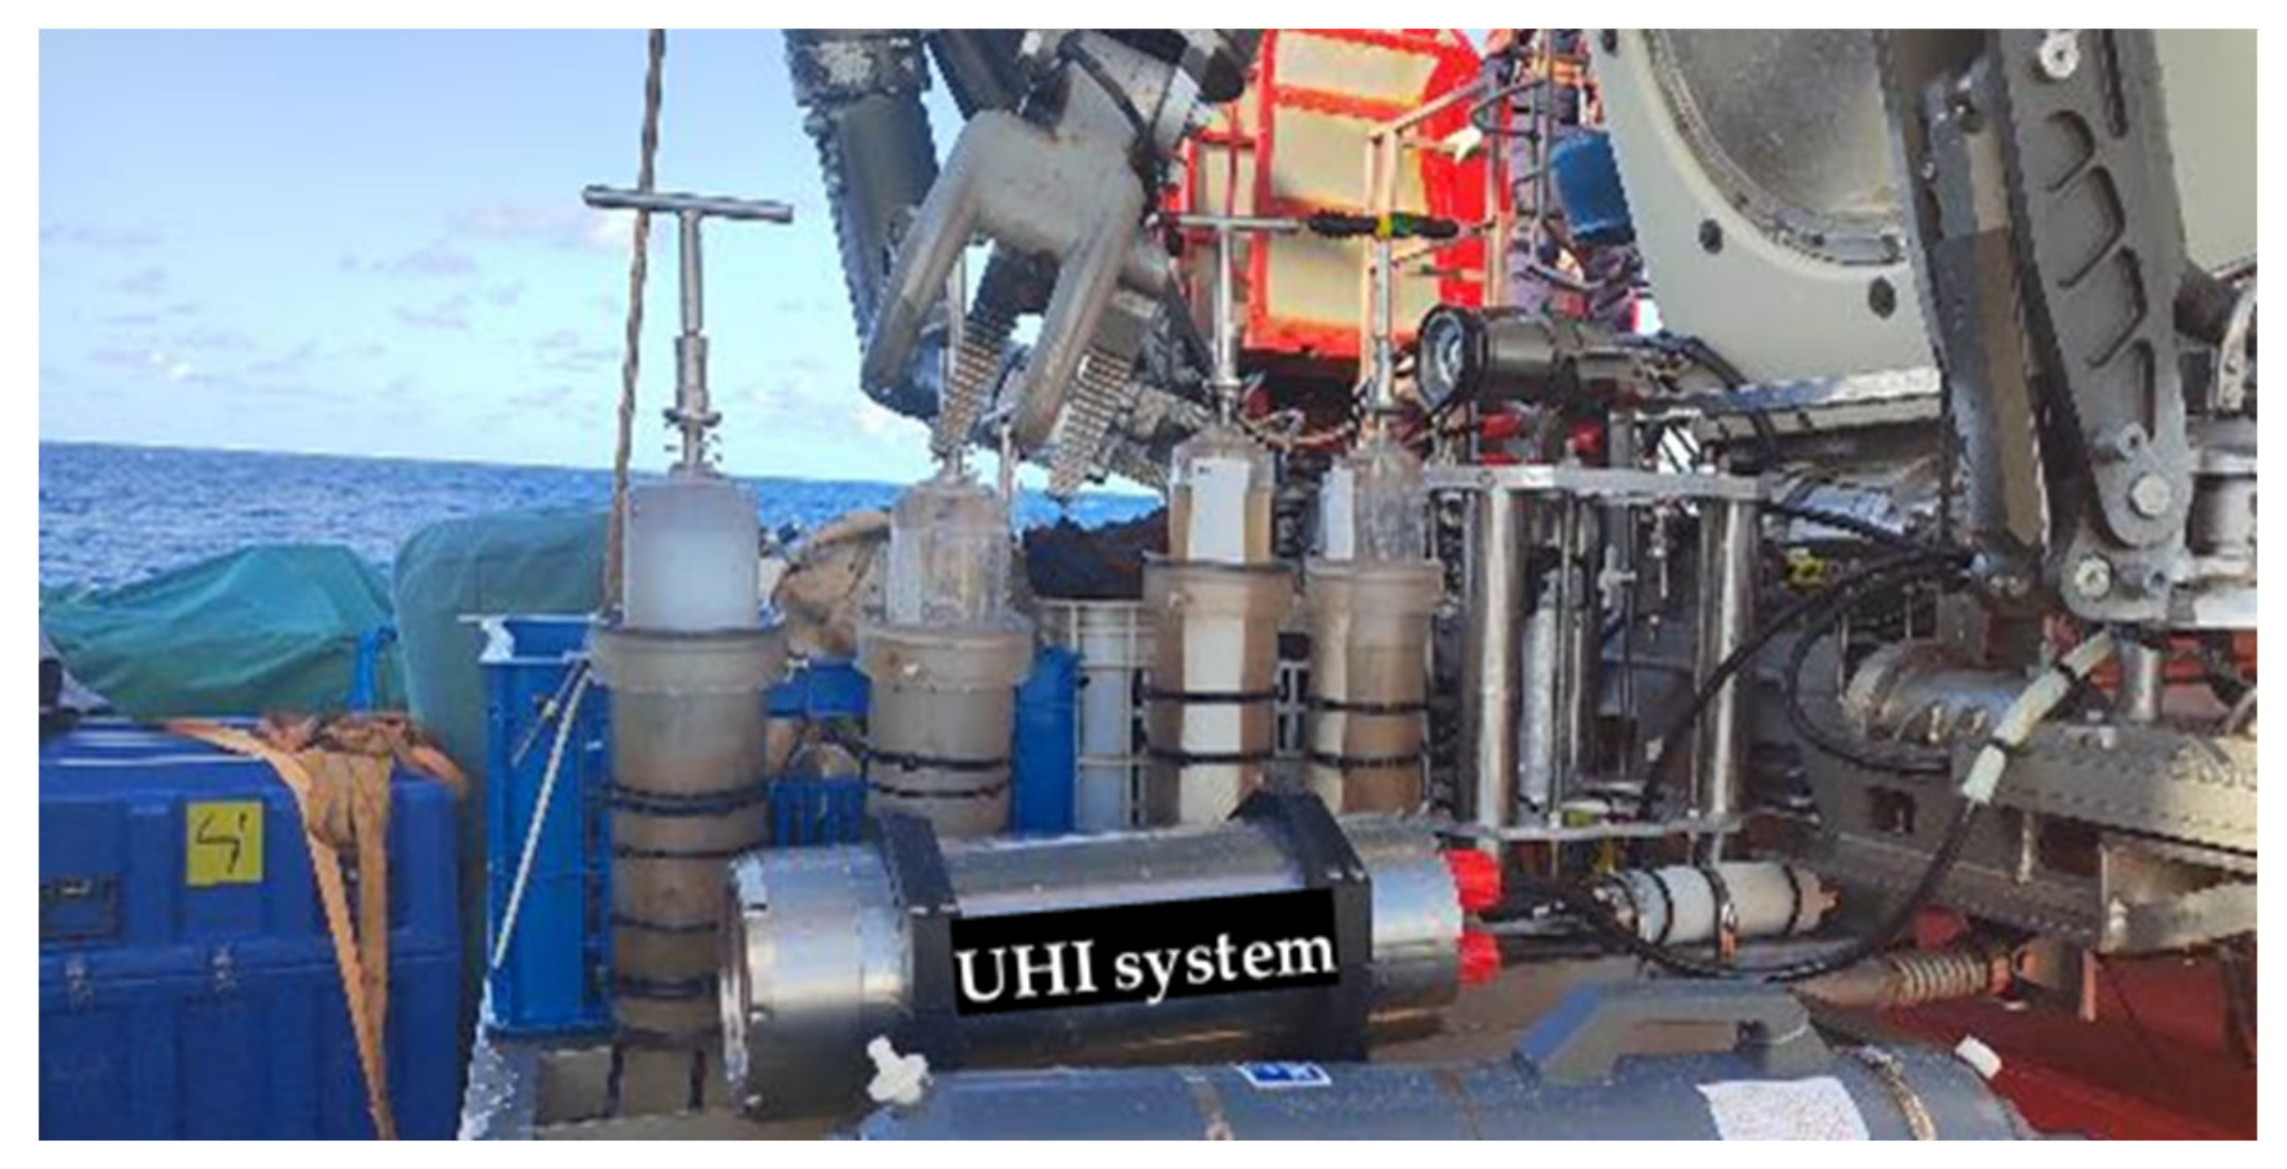
We carried out a pilot underwater experiment to further test the practical performance of the UHI system, in June 2022. The test site was located at the seamount with a depth of more than 4000 m in the northwestern Indian Ocean. The submersible used in the test was the Jiaolong human-occupied vehicle (HOV), which has a maximum operating depth of 7000 m. Figure 14 shows the setup and communication test of the UHI system with the submersible. The UHI system was installed on the front of the HOV to obtain power and exchange data from the submersible through the power and ethernet connector.
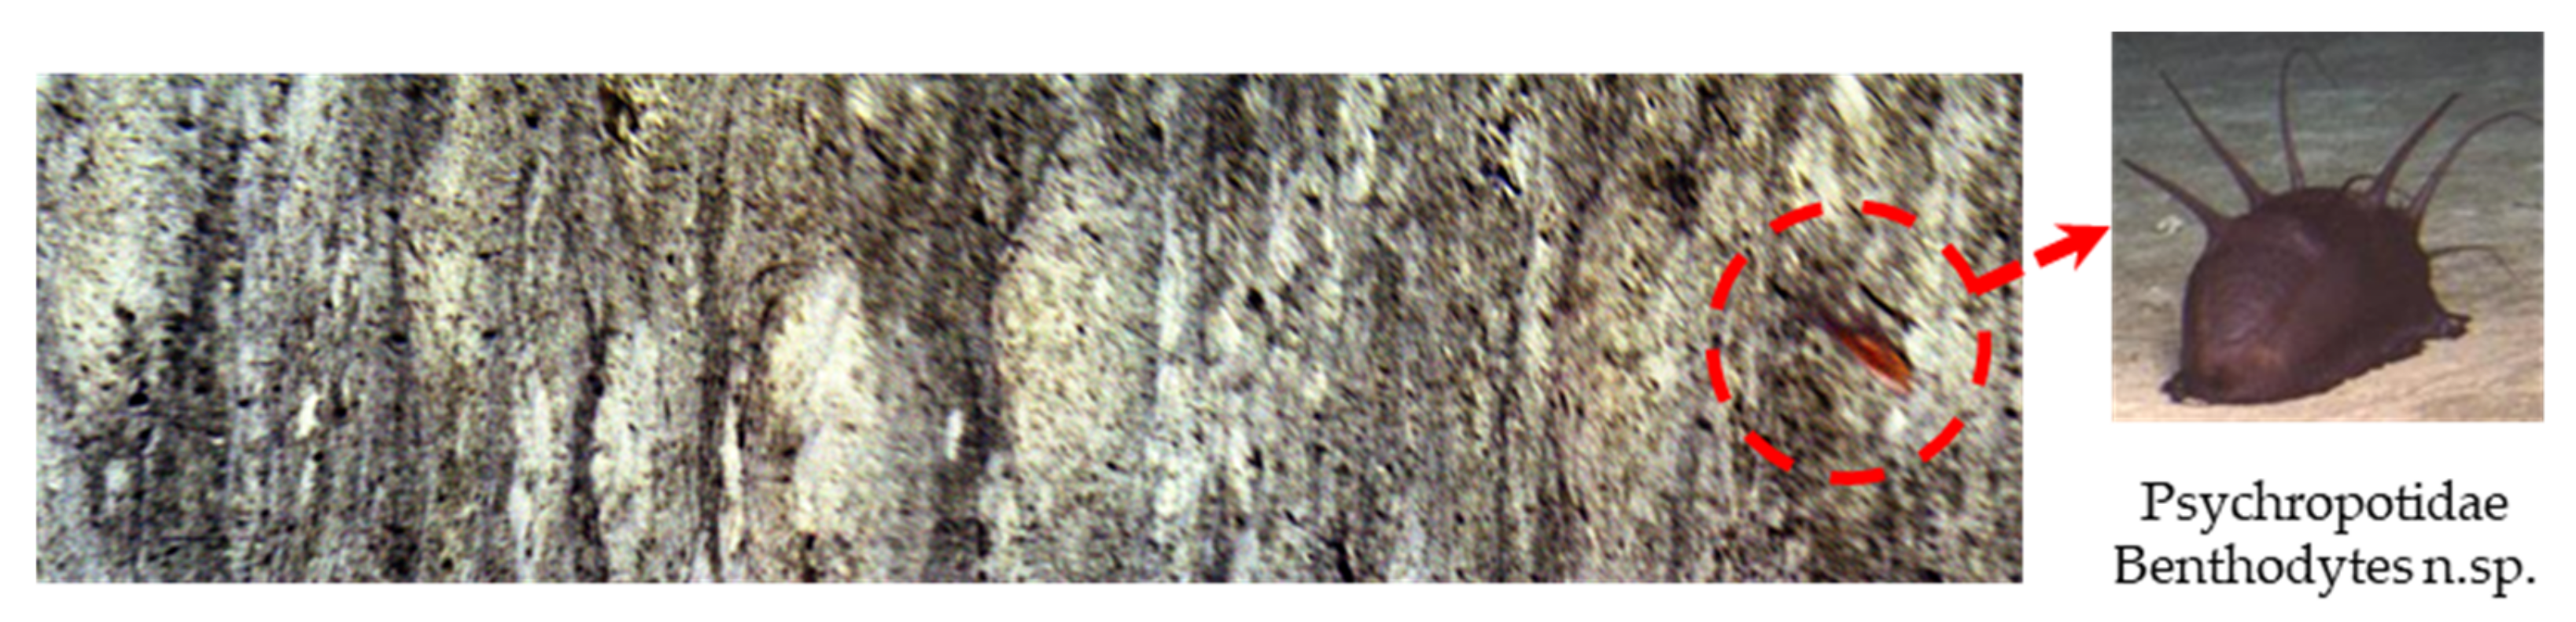
During the underwater experiment, the push-broom scanning was performed along the vertical direction of the slit under the irradiation of the high-power light source mounted on the HOV. The orientation during scanning was controlled appropriately to decrease the distortion. The submersible traveled at about 0.5 m/s, while the UHI system recorded at 50 frames per second. Figure 15 shows a pseudo-RGB image of seafloor sediment from a downward viewing perspective. There are some undulating dunes and tiny holes in the seafloor, while a Psychropotidae specimen lies on the right.
5. Conclusions
We designed an integrated push-broom underwater hyperspectral imaging system for deep-sea applications. The working spectral range was 400 nm to 800 nm with the spectral resolution changing from 2.5 nm to 6.75 nm. We proposed a novel autofocus strategy for the hyperspectral imager based on the focusing transfer method. With the assistance of RGB camera and the liquid lens, it is efficient and rapid for the hyperspectral imager to find the optimal focus distance. We detected the spectral images of deep-sea manganese and other four kinds of rocks in the laboratory environment. The result showed that the hyperspectral imager had good imaging quality and could identify targets accurately. We tested the prototype in the deep-sea field with the depth of over 4000 m and achieved images of seafloor sediment successfully. Future research on the system will focus on improving the automation level and reducing the cost of human intervention, so as to apply the system to deep-sea explorations.
Author Contributions
Conceptualization, Z.L. and S.M.; methodology, B.L., S.M. and J.H.; software, B.L.; validation, B.L., S.M., J.H. and Q.Y.; investigation, S.M. and Q.Y.; resources, Z.D. and D.L.; data curation, J.H., H.J. and M.S.; writing—original draft preparation, B.L.; writing—review and editing, B.L.; visualization, Z.Z.; funding acquisition, S.M. All authors have read and agreed to the published version of the manuscript.
Funding
This research was funded by Key Research and Development Project of Shandong Province (2020CXGC010706), Taishan Scholars Program of Shandong Province (No.tsqn201909007) and Natural Science Foundation of Shandong Province (ZR2022MF339).
Data Availability Statement
All relevant data are shown in the paper or could be recreated by following the methodology in the paper.
Acknowledgments
The authors would like to express gratitude to the operation and support team of Jiaolong HOV in National Deep Sea Center for their contribution during the test, especially in carrying out the deep-sea field test.
Conflicts of Interest
The authors declare no conflict of interest.
References
- Bracher, A.; Bouman, H.A.; Brewin, R.J.W.; Bricaud, A.; Brotas, V.; Ciotti, A.M.; Clementson, L.; Devred, E.; di Cicco, A.; Dutkiewicz, S.; et al. Obtaining Phytoplankton Diversity from Ocean Color: A Scientific Roadmap for Future Development. Front. Mar. Sci. 2017, 4, 55. [Google Scholar] [CrossRef] [Green Version]
- Emberton, S.; Chittka, L.; Cavallaro, A.; Wang, M. Sensor Capability and Atmospheric Correction in Ocean Colour Remote Sensing. Remote Sens. 2016, 8, 1. [Google Scholar] [CrossRef] [Green Version]
- Bajjouk, T.; Mouquet, P.; Ropert, M.; Quod, J.-P.; Hoarau, L.; Bigot, L.; le Dantec, N.; Delacourt, C.; Populus, J. Detection of Changes in Shallow Coral Reefs Status: Towards a Spatial Approach Using Hyperspectral and Multispectral Data. Ecol. Indic. 2019, 96, 174–191. [Google Scholar] [CrossRef]
- Marcello, J.; Eugenio, F.; Martín, J.; Marqués, F. Seabed Mapping in Coastal Shallow Waters Using High Resolution Multispectral and Hyperspectral Imagery. Remote Sens. 2018, 10, 1208. [Google Scholar] [CrossRef] [Green Version]
- Leifer, I.; Lehr, W.J.; Simecek-Beatty, D.; Bradley, E.; Clark, R.; Dennison, P.; Hu, Y.; Matheson, S.; Jones, C.E.; Holt, B.; et al. State of the Art Satellite and Airborne Marine Oil Spill Remote Sensing: Application to the BP Deepwater Horizon Oil Spill. Remote Sens. Environ. 2012, 124, 185–209. [Google Scholar] [CrossRef] [Green Version]
- Dierssen, H.; McManus, G.B.; Chlus, A.; Qiu, D.; Gao, B.-C.; Lin, S. Space Station Image Captures a Red Tide Ciliate Bloom at High Spectral and Spatial Resolution. Proc. Natl. Acad. Sci. USA 2015, 112, 14783–14787. [Google Scholar] [CrossRef] [PubMed] [Green Version]
- Montes-Herrera, J.C.; Cimoli, E.; Cummings, V.; Hill, N.; Lucieer, A.; Lucieer, V. Underwater Hyperspectral Imaging (UHI): A Review of Systems and Applications for Proximal Seafloor Ecosystem Studies. Remote Sens. 2021, 13, 3451. [Google Scholar] [CrossRef]
- Liu, B.; Liu, Z.; Men, S.; Li, Y.; Ding, Z.; He, J.; Zhao, Z. Underwater Hyperspectral Imaging Technology and Its Applications for Detecting and Mapping the Seafloor: A Review. Sensors 2020, 20, 4962. [Google Scholar] [CrossRef]
- Johnsen, G.; Ludvigsen, M.; Sørensen, A.; Sandvik Aas, L.M. The Use of Underwater Hyperspectral Imaging Deployed on Remotely Operated Vehicles—Methods and Applications. IFAC-PapersOnLine 2016, 49, 476–481. [Google Scholar] [CrossRef]
- Chennu, A.; Färber, P.; Volkenborn, N.; Al-Najjar, M.A.A.; Janssen, F.; de Beer, D.; Polerecky, L. Hyperspectral Imaging of the Microscale Distribution and Dynamics of Microphytobenthos in Intertidal Sediments. Limnol. Oceanogr. Methods 2013, 11, 511–528. [Google Scholar] [CrossRef]
- Song, H.; Mehdi, S.R.; Wu, C.; Li, Z.; Gong, H.; Ali, A.; Huang, H. Underwater Spectral Imaging System Based on Liquid Crystal Tunable Filter. J. Mar. Sci. Eng. 2021, 9, 1206. [Google Scholar] [CrossRef]
- Xue, Q.; Tian, Z.; Yang, B.; Liang, J.; Li, C.; Wang, F.; Li, Q. Underwater Hyperspectral Imaging System Using a Prism–Grating–Prism Structure. Appl. Opt. 2021, 60, 894. [Google Scholar] [CrossRef] [PubMed]
- Dumke, I.; Purser, A.; Marcon, Y.; Nornes, S.M.; Johnsen, G.; Ludvigsen, M.; Søreide, F. Underwater Hyperspectral Imaging as an in Situ Taxonomic Tool for Deep-Sea Megafauna. Sci. Rep. 2018, 8, 12860. [Google Scholar] [CrossRef] [Green Version]
- Cimoli, E.; Meiners, K.M.; Lucieer, A.; Lucieer, V. An Under-Ice Hyperspectral and RGB Imaging System to Capture Fine-Scale Biophysical Properties of Sea Ice. Remote Sens. 2019, 11, 2860. [Google Scholar] [CrossRef] [Green Version]
- Foglini, F.; Grande, V.; Marchese, F.; Bracchi, V.A.; Prampolini, M.; Angeletti, L.; Castellan, G.; Chimienti, G.; Hansen, I.M.; Gudmundsen, M.; et al. Application of Hyperspectral Imaging to Underwater Habitat Mapping, Southern Adriatic Sea. Sensors 2019, 19, 2261. [Google Scholar] [CrossRef] [Green Version]
- Huang, H.; Sun, Z.; Liu, S.; Di, Y.; Xu, J.; Liu, C.; Xu, R.; Song, H.; Zhan, S.; Wu, J. Underwater Hyperspectral Imaging for in Situ Underwater Microplastic Detection. Sci. Total Environ. 2021, 776, 145960. [Google Scholar] [CrossRef]
- Dumke, I.; Nornes, S.M.; Purser, A.; Marcon, Y.; Ludvigsen, M.; Ellefmo, S.L.; Johnsen, G.; Soreide, F. First Hyperspectral Imaging Survey of the Deep Seafloor: High-Resolution Mapping of Manganese Nodules. Remote Sens. Environ. 2018, 209, 19–30. [Google Scholar] [CrossRef]
- Dumke, I.; Ludvigsen, M.; Ellefmo, S.L.; Soreide, F.; Johnsen, G.; Murton, B.J. Underwater Hyperspectral Imaging Using a Stationary Platform in the Trans-Atlantic Geotraverse Hydrothermal Field. IEEE Trans. Geosci. Remote Sens. 2019, 57, 2947–2962. [Google Scholar] [CrossRef] [Green Version]
- Ødegård, Ø.; Mogstad, A.A.; Johnsen, G.; Sørensen, A.J.; Ludvigsen, M. Underwater Hyperspectral Imaging: A New Tool for Marine Archaeology. Appl. Opt. 2018, 57, 3214–3223. [Google Scholar] [CrossRef] [Green Version]
- Chennu, A.; Färber, P.; De’ath, G.; de Beer, D.; Fabricius, K.E. A Diver-Operated Hyperspectral Imaging and Topographic Surveying System for Automated Mapping of Benthic Habitats. Sci. Rep. 2017, 7, 7122. [Google Scholar] [CrossRef] [PubMed]
- Summers, N.; Johnsen, G.; Mogstad, A.; Løvås, H.; Fragoso, G.; Berge, J. Underwater Hyperspectral Imaging of Arctic Macroalgal Habitats during the Polar Night Using a Novel Mini-ROV-UHI Portable System. Remote Sens. 2022, 14, 1325. [Google Scholar] [CrossRef]
- Chen, L.; Yang, Z.; Sun, L. Fast Autofocus of Microscopy Images Based on Depth-from-Defocus. In Proceedings of the 2008 IEEE/RSJ International Conference on Intelligent Robots and Systems, Nice, France, 22–26 September 2008; pp. 3115–3120. [Google Scholar]
- Guo, C.; Ma, Z.; Guo, X.; Li, W.; Qi, X.; Zhao, Q. Fast Auto-Focusing Search Algorithm for a High-Speed and High-Resolution Camera Based on the Image Histogram Feature Function. Appl. Opt. 2018, 57, F44–F49. [Google Scholar] [CrossRef] [PubMed]
- Zhang, X.; Fan, F.; Gheisari, M.; Srivastava, G. A Novel Auto-Focus Method for Image Processing Using Laser Triangulation. IEEE Access 2019, 7, 64837–64843. [Google Scholar] [CrossRef]
- Mugele, F.; Baret, J.-C. Electrowetting: From Basics to Applications. J. Phys. Condens. Matter 2005, 17, R705. [Google Scholar] [CrossRef]
- Jian, M.; Liu, X.; Luo, H.; Lu, X.; Yu, H.; Dong, J. Underwater Image Processing and Analysis: A Review. Signal Process. Image Commun. 2021, 91, 116088. [Google Scholar] [CrossRef]
- Raveendran, S.; Patil, M.D.; Birajdar, G.K. Underwater Image Enhancement: A Comprehensive Review, Recent Trends, Challenges and Applications. Artif. Intell. Rev. 2021, 54, 5413–5467. [Google Scholar] [CrossRef]
- Zhou, J.; Zhang, D.; Zhang, W. Classical and State-of-the-Art Approaches for Underwater Image Defogging: A Comprehensive Survey. Front. Inform. Technol. Elect. Eng. 2020, 21, 1745–1769. [Google Scholar] [CrossRef]
- Jian, M.; Qi, Q.; Dong, J.; Yin, Y.; Lam, K.-M. Integrating QDWD with Pattern Distinctness and Local Contrast for Underwater Saliency Detection. J. Vis. Commun. Image Represent. 2018, 53, 31–41. [Google Scholar] [CrossRef]
Figure 1.
The prototype and encapsulated structure of the UHI system. The prototype includes the imaging subsystem (hyperspectral imager and RGB camera), sensing modules (laser ranger and IMU unit), and control unit (DC/DC convert, SBC, and I/O board) installed in the pressure-tight shell.
Figure 1.
The prototype and encapsulated structure of the UHI system. The prototype includes the imaging subsystem (hyperspectral imager and RGB camera), sensing modules (laser ranger and IMU unit), and control unit (DC/DC convert, SBC, and I/O board) installed in the pressure-tight shell.

Figure 2.
The flowchart of the proposed focusing transfer method.

Figure 3.
The spectral calibration instruments of the designed UHI system. From left to right are the collimator (FPG-6C, Huazhong Precision Instrument, China), the grating monochromator (Omni-λ500, Zolix, China), and a halogen lamp (LSH-D30T75, Zolix, China).
Figure 3.
The spectral calibration instruments of the designed UHI system. From left to right are the collimator (FPG-6C, Huazhong Precision Instrument, China), the grating monochromator (Omni-λ500, Zolix, China), and a halogen lamp (LSH-D30T75, Zolix, China).

Figure 4.
The results of the spectral calibration: (a) the normalized response spectrum of the designed UHI system in 400 nm to 800 nm; (b) the relationship among pixel location, spectral resolution, and wavelength, respectively.
Figure 4.
The results of the spectral calibration: (a) the normalized response spectrum of the designed UHI system in 400 nm to 800 nm; (b) the relationship among pixel location, spectral resolution, and wavelength, respectively.

Figure 5.
The radiometric calibration instruments of the designed UHI system. The halogen lamp and the integrating sphere (HGISLE500, Hgoan, China) generate uniform light output. A slit driven by the step motor is used to adjust the light intensity, and a radiometer (OHSP-350L, Hopoocolor, China) measures the spectral radiance at the exit port of the integrating sphere.

Figure 6.
The results of the radiometric calibration: (a) the pixel intensity at different exposure times; (b) the mean value per millisecond versus the absolute spectral radiance in different spectral bands.
Figure 6.
The results of the radiometric calibration: (a) the pixel intensity at different exposure times; (b) the mean value per millisecond versus the absolute spectral radiance in different spectral bands.

Figure 7.
Schematics of the experimental setup for the autofocus test. The autofocus calibration to establish the look-up table in order to obtain the transfer factor.
Figure 7.
Schematics of the experimental setup for the autofocus test. The autofocus calibration to establish the look-up table in order to obtain the transfer factor.

Figure 8.
The results of the autofocus calibration: (a) the focusing voltage of RGB lens and HSI lens according to the distance at 20 cm to 250 cm; (b) the correspondence between focusing voltages of RGB lens and HSI lens in every distance.
Figure 8.
The results of the autofocus calibration: (a) the focusing voltage of RGB lens and HSI lens according to the distance at 20 cm to 250 cm; (b) the correspondence between focusing voltages of RGB lens and HSI lens in every distance.

Figure 9.
The experimental setup for the performance test of the focusing transfer method.

Figure 10.
The results of the additional autofocus experiment. The figure shows the process of autofocus from target 1 to target 2. The top of each group is the RGB image, and the bottom is the HSI image.
Figure 10.
The results of the additional autofocus experiment. The figure shows the process of autofocus from target 1 to target 2. The top of each group is the RGB image, and the bottom is the HSI image.

Figure 11.
The pseudo-RGB (R:640 nm, G: 550 nm, B: 470 nm) image of the mineral samples. Numbers i to iv represent the manganese nodules in different shapes.
Figure 11.
The pseudo-RGB (R:640 nm, G: 550 nm, B: 470 nm) image of the mineral samples. Numbers i to iv represent the manganese nodules in different shapes.

Figure 12.
The corrected reflectance spectrum of granite, gabbro, andesite, basalt, manganese nodules, and sediment in 420 nm to 800 nm. The dashed lines are the mean spectrum, and the color-filled areas represent the range of the mean ± one standard deviation.
Figure 12.
The corrected reflectance spectrum of granite, gabbro, andesite, basalt, manganese nodules, and sediment in 420 nm to 800 nm. The dashed lines are the mean spectrum, and the color-filled areas represent the range of the mean ± one standard deviation.

Figure 13.
The SVM classification image of several mineral samples and sediment.

Figure 14.
Commissioning before the underwater experiment. The designed UHI system is fixed on the shelf at the front of Jiaolong HOV and connected to the submersible through cables.
Figure 14.
Commissioning before the underwater experiment. The designed UHI system is fixed on the shelf at the front of Jiaolong HOV and connected to the submersible through cables.

Figure 15.
The pseudo-RGB (R: 640 nm, G: 550 nm, B: 470 nm) image of the seafloor in the northwest Indian ocean. A captured Psychropotidae specimen is shown on the right.
Figure 15.
The pseudo-RGB (R: 640 nm, G: 550 nm, B: 470 nm) image of the seafloor in the northwest Indian ocean. A captured Psychropotidae specimen is shown on the right.


Table 1.
The detailed specifications and parameters of our UHI system.
| Component | Category | Parameter | |
|---|---|---|---|
| Imager | Imager | HSI | RGB |
| F# | 4 | 2.8 | |
| Focal length | 25 mm | 16 mm | |
| FOV (transverse) | 24.8° | 38° | |
| Frame rate | 100 Hz | 75 Hz | |
| Resolution | 1920 × 1 | 2448 × 2048 | |
| Sensor | Accuracy (roll/pitch/yaw) | 0.2°/0.2°/1° | |
| Attitude data rate | 1–400 Hz | ||
| Ranging distance | 0.2–5 m | ||
| Interface | Communication | 100/1000 Mbps Ethernet | |
| Input voltage | 9–36 VDC | ||
| Power consumption | Max. 28 W (18 W typical) | ||
| Mechanism | Housing material | Titanium | |
| Size (Diameter × length) | 152 × 426 mm | ||
| Weight (air/water) | 16/10 Kg | ||
| MAX working depth | 6000 m | ||
Disclaimer/Publisher’s Note: The statements, opinions and data contained in all publications are solely those of the individual author(s) and contributor(s) and not of MDPI and/or the editor(s). MDPI and/or the editor(s) disclaim responsibility for any injury to people or property resulting from any ideas, methods, instructions or products referred to in the content. |
© 2023 by the authors. Licensee MDPI, Basel, Switzerland. This article is an open access article distributed under the terms and conditions of the Creative Commons Attribution (CC BY) license (https://creativecommons.org/licenses/by/4.0/).
Share and Cite
MDPI and ACS Style
Liu, B.; Men, S.; Ding, Z.; Li, D.; Zhao, Z.; He, J.; Ju, H.; Shen, M.; Yu, Q.; Liu, Z. Underwater Hyperspectral Imaging System with Liquid Lenses. Remote Sens. 2023, 15, 544. https://doi.org/10.3390/rs15030544
AMA Style
Liu B, Men S, Ding Z, Li D, Zhao Z, He J, Ju H, Shen M, Yu Q, Liu Z. Underwater Hyperspectral Imaging System with Liquid Lenses. Remote Sensing. 2023; 15(3):544. https://doi.org/10.3390/rs15030544
Chicago/Turabian StyleLiu, Bohan, Shaojie Men, Zhongjun Ding, Dewei Li, Zhigang Zhao, Jiahao He, Haochen Ju, Mengling Shen, Qiuyuan Yu, and Zhaojun Liu. 2023. "Underwater Hyperspectral Imaging System with Liquid Lenses" Remote Sensing 15, no. 3: 544. https://doi.org/10.3390/rs15030544
Note that from the first issue of 2016, this journal uses article numbers instead of page numbers. See further details here.