Article

Quantifying the Impact of Hurricane Harvey on Beach−Dune Systems of the Central Texas Coast and Monitoring Their Changes Using UAV Photogrammetry

Department of Earth and Atmospheric Sciences, University of Houston, Houston, TX 77204, USA
*
Author to whom correspondence should be addressed.
Remote Sens. 2023, 15(24), 5779; https://doi.org/10.3390/rs15245779
Submission received: 30 October 2023 / Revised: 6 December 2023 / Accepted: 12 December 2023 / Published: 18 December 2023

Abstract

:
Historically, the Texas Gulf Coast has been affected by many tropical storms and hurricanes. The most recent severe impact was caused by Hurricane Harvey, which made landfall in August 2017 on the central Texas coast. We evaluated the impact of Hurricane Harvey on the barrier islands of the central Texas coast, including San Jose Island, Mustang Island, and North Padre Island. We used public data sets, including 1 m resolution bare-earth digital elevation models (DEMs), derived from airborne lidar acquisitions before (2016) and after (2018) Hurricane Harvey, and sub-meter scale aerial imagery pre- and post-Harvey to evaluate changes at a regional scale. Shoreline proxies were extracted to quantify shoreline retreat and/or advance, and DEM differencing was performed to quantify net sediment erosion and accretion or deposition. Unmanned aerial vehicle surveys were conducted at each island to produce high-resolution (cm scale) imagery and topographic data used for morphological and change analyses of beaches and dunes at the local scale. The results show that Hurricane Harvey caused drastic local shoreline retreat, reaching 59 m, and significant erosion levels of beach−dune elements immediately after its landfall. Erosion and recovery processes and their levels were influenced by the local geomorphology of the beach−foredune complexes. It is also observed that local depositional events contributed to their post-storm rebuilding. This study aims to enhance the understanding of major storm impacts on coastal areas and help in future protection planning of the Texas coast. It also has broader implications for coastlines on Earth affected by major storms.

Graphical Abstract

1. Introduction

The Texas Gulf Coast is a dynamic environment that is continuously modified by natural shoreline processes and anthropogenic activity. Erosion and shoreline retreat are the main contributors to land loss in this region, caused by the net contribution of global sea-level rise, land subsidence, reduced sediment influx, longshore currents, high-intensity and high-frequency storms, and human land development [1]. By using shoreline position changes from 1930 to 2019, Paine et al. [1] estimated an average net retreat rate of 1.27 m/yr and an average land loss rate of 74 ha/yr along the Texas coast.
Severe storm events can create significant morphological changes in coastal environments [2,3]. Historically, beach and dune systems on the Texas Gulf Coast have been significantly affected by tropical storms and hurricanes [4,5,6]. Many studies suggest that the intensity and frequency of tropical storms have increased, with some models projecting a large (200%) increase in this century [7,8,9]. National Oceanic and Atmospheric Administration (NOAA) reported 56 tropical storms and 64 hurricanes that struck the Texas coast from 1850 until 2010, amounting to an average of four hurricanes and four tropical storms per decade. In the last two decades (2001 to 2022), Texas received 11 tropical storms and 8 hurricanes based on NOAA records [10].
This study aims to understand the destructive impact of major storms on the barrier island systems of the Texas coast and their recovery processes. As large accumulations of sand along the shore, beaches and dunes on barrier islands act as natural buffers and serve as the first line of defense against storm-induced surges [11,12,13,14]. The level of protection by dunes and beaches can vary depending on their geomorphologic characteristics, such as height, width, and degree of land development [11,14,15]. Although there are many studies on erosion on Texas beaches, little attention is given to dunes and dune morphologies. Additionally, many studies have focused on short-term and long-term shoreline changes [16] or low-intensity storm events that are more frequent [15].
Studies of coastal geomorphology and shoreline movement often rely on aerial images and light-detection-and-ranging (lidar) data [17]. High-density elevation data from airborne lidar assist in evaluating shoreline movement [1,18], effects of storms and hurricanes on coastal geology [19,20,21,22,23], and coastal-dune modeling [24,25,26]. However, publicly available elevation data are acquired relatively sparsely and usually at a 1 m spatial resolution. Recently, unmanned aerial vehicles (UAVs) have been deployed in coastal studies for the acquisition of topographic data at high spatial and temporal resolutions, allowing for detailed mapping and multitemporal analyses [27,28,29]. A review of such studies and accuracies achieved by UAV surveying on sandy beaches is provided in [29].
A previous study completed a generalized change map comparing pre- and post-Hurricane Harvey lidar and identified erosional areas along the upper Texas coast. Additionally, the authors evaluated the morphological changes to the west end of Galveston Island and the east end of Follett’s Island after Hurricane Harvey by comparing 2016, 2017, 2018, and 2018/2019 lidar data and 2022 UAV-derived topographic data [30].
Similarly, this study focuses on the dune and beach systems of the central Texas coast, covering the southern portion of San Jose Island, Mustang Island, and the northern portion of North Padre Island (Figure 1). The most recent and intense storm that impacted this area was Hurricane Harvey, which landed as a category 4 (wind speed of 115 kt or 213 km/h) hurricane on the northern end of San Jose Island east of Rockport, Texas, on 26 August 2017, and caused up to 9 ft of storm surge inundation (Figure 1) [31]. We attempted to evaluate the impact of this hurricane on dunes and beach at the island scale by using public, pre-Harvey and post-Harvey airborne elevation data. Additionally, we performed UAV surveys in select, local sections along the shore to analyze the present-day state of the dune−beach complexes and net changes during the last four years. This work follows similar methods seen in [30], however, evaluates a different area and attempts to quantify beach−dune changes due to Harvey using the following objectives: (1) quantifying shoreline changes between 2016 and 2018 to assess shoreline retreat, (2) quantifying elevation changes between 2016 and 2018 to identify areas of significant dune erosion, (3) describing the morphologies of beach−dune systems from UAV-derived imagery and digital terrain models at three selected sites, and (4) evaluating elevation changes between 2018 and 2022 at these sites to identify areas of erosion and/or deposition and relating them to the morphology of each barrier island. Therefore, the novelty of this study includes an evaluation of the impact of a major storm on the beach−dune systems of the central Texas coast and their post-storm changes using higher resolution data sets than previously employed. The morphological aspects of beach−dune systems were of special interest, and two hypotheses were tested to address the ways these elements react to storm events:
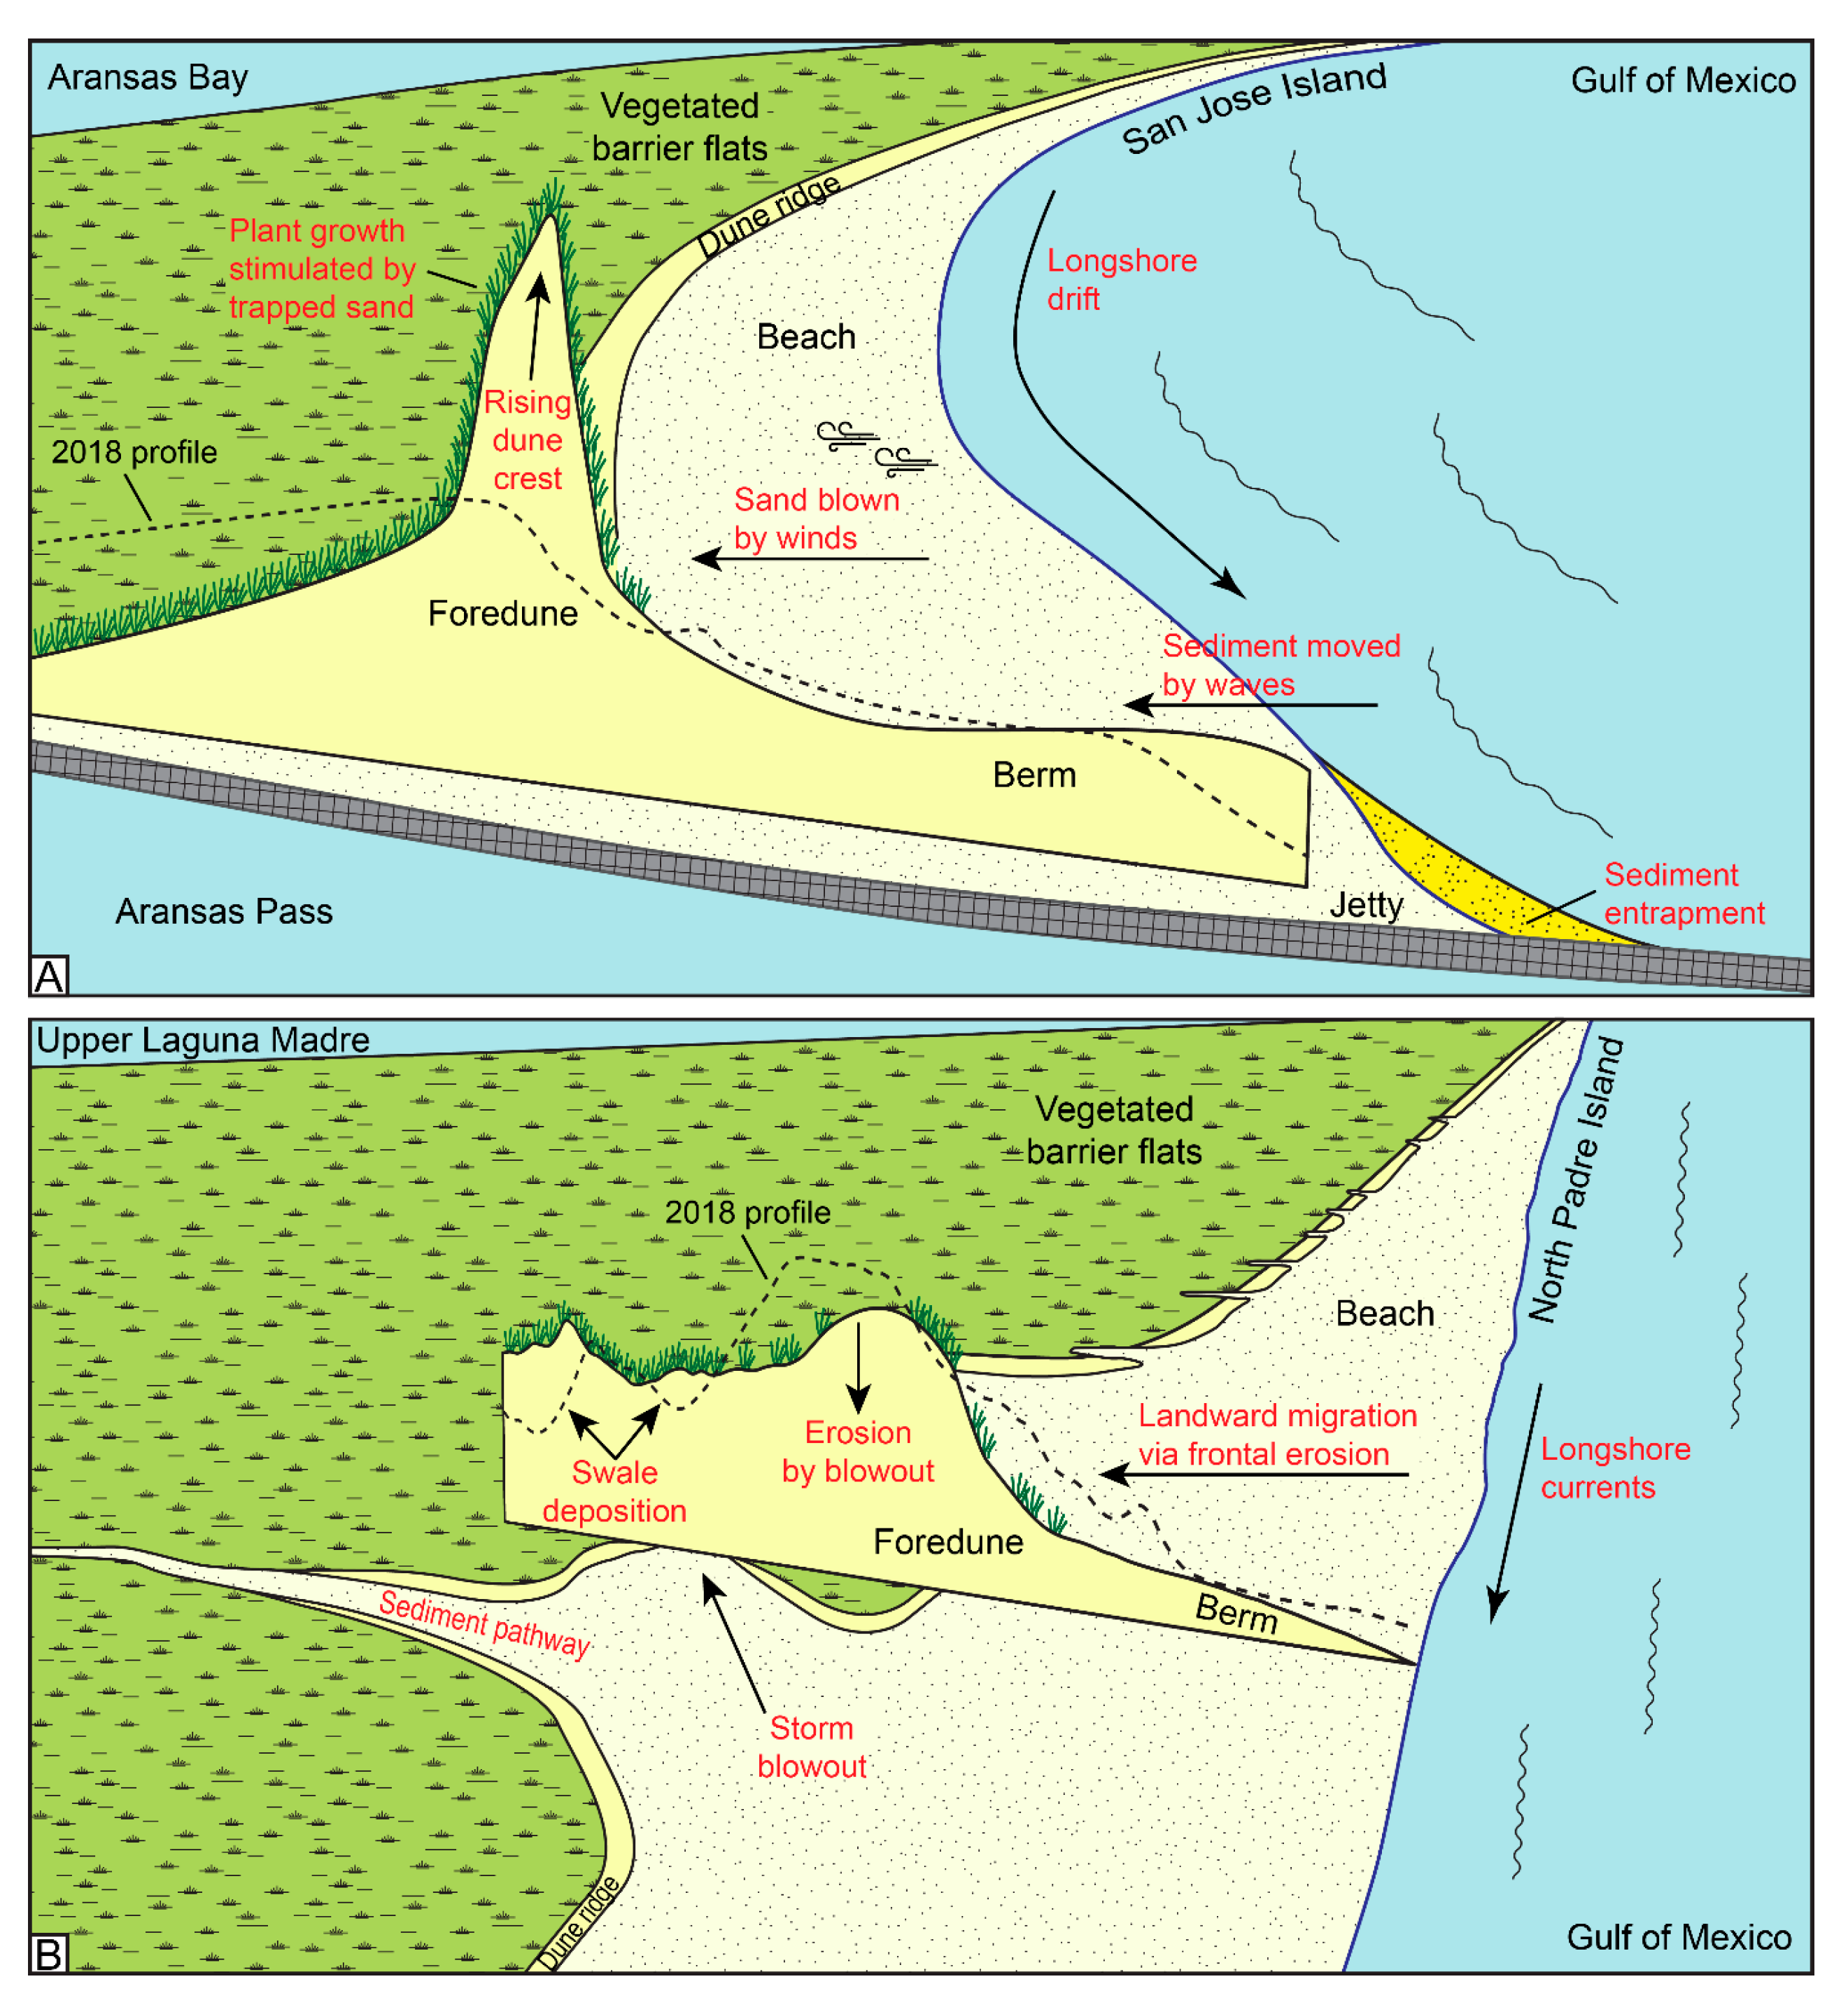
  • Impacted dunes migrate landward via rear-slope accretion and recover by vertical aggradation;
  • Erosion and recovery processes and their levels are controlled by the geomorphology (i.e., height, width, and geometry) of beach−foredune complexes.
Understanding these processes and their controls is valuable for the planning of maintenance and restoration activities and for evaluating the potential impact of future major storms.
Coastal erosion is a global issue that affects many coastal areas worldwide. Storm surges, caused by storms, can damage buildings, infrastructure, utilities, and ecosystems. In many areas, dunes provide protection against wind, waves, and storm surges. This study utilized aerial photographs, airborne LiDAR, and UAV imagery data to assess coastal erosion in three key locations. The use of UAVs offers significant advantages in collecting data from remote or inaccessible areas where traditional methods of data collection are difficult or impossible to implement.

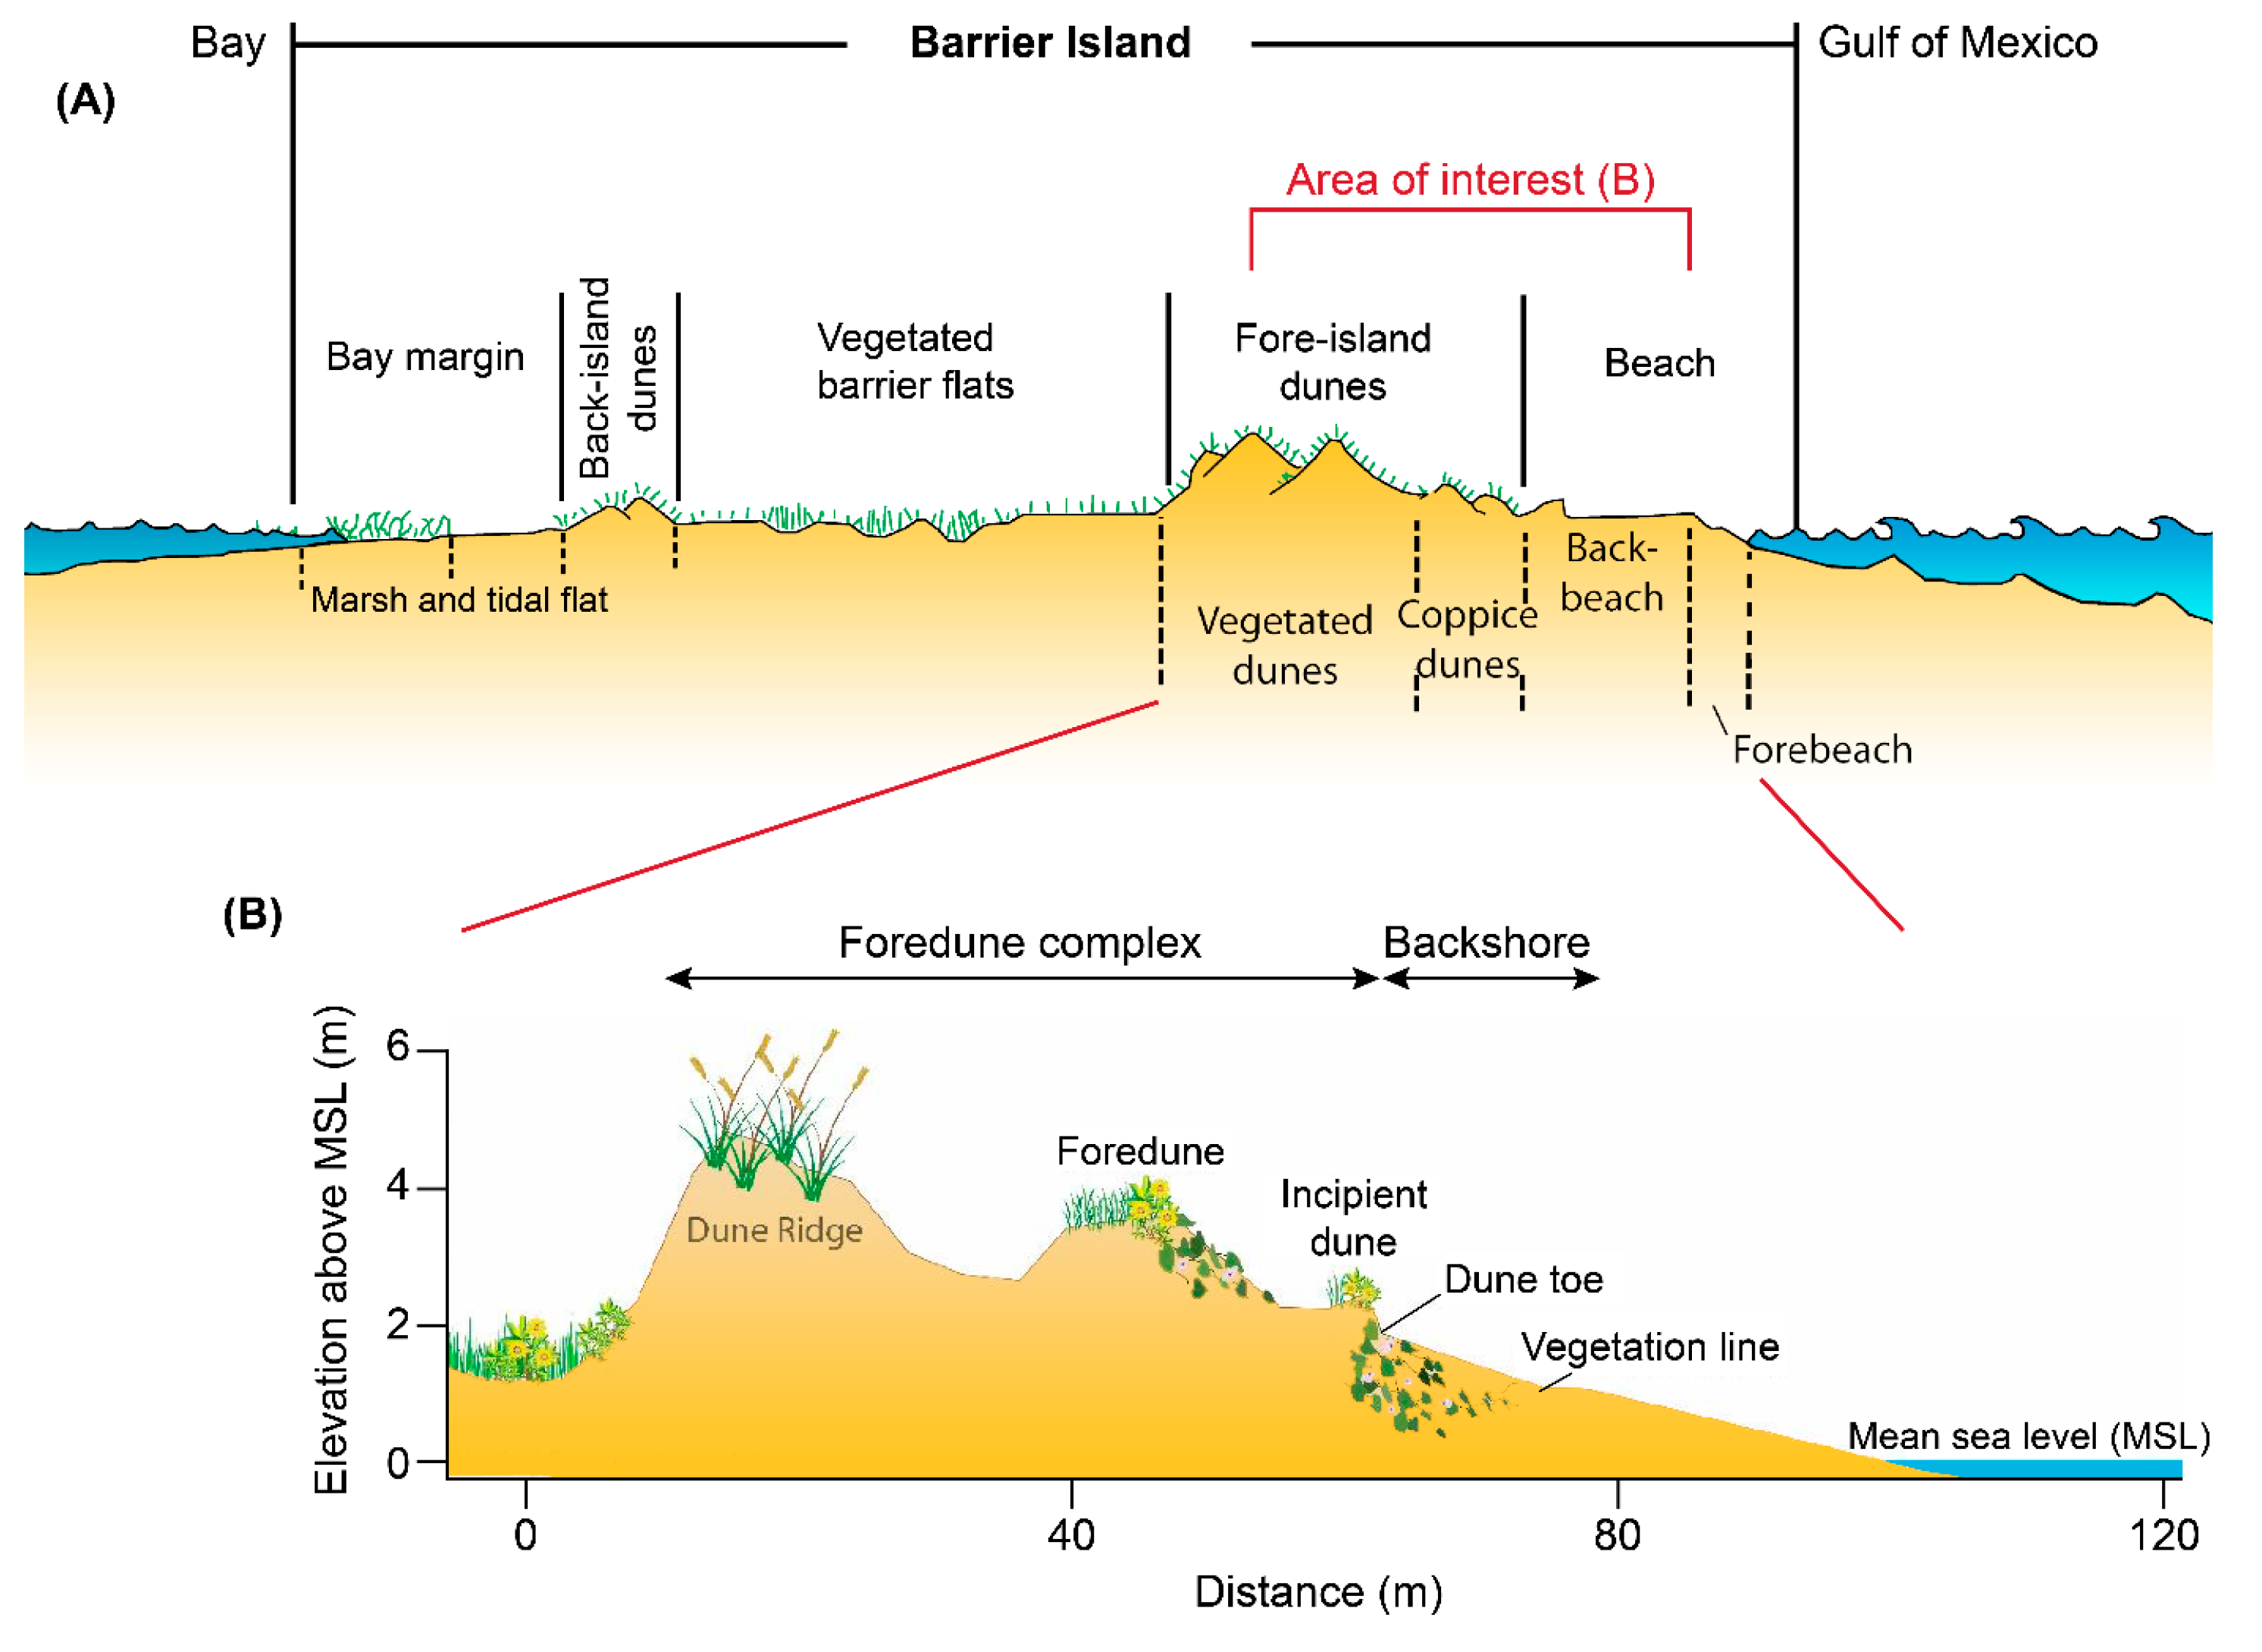
Description of Barrier-Island Dune Systems

San Jose, Mustang, and North Padre Islands are Holocene-aged, microtidal, wave-dominated, sandy barrier islands [1,15,33]. They are separated from each other by tidal passes and channels: Aransas Pass between San Jose and Mustang Islands, and Packery Channel between Mustang and North Padre Islands (Figure 1). All three studied islands are located above the longshore drift convergence zone at the center of the arcuate Texas coast and are affected by southerly longshore currents [1,34]. These islands host several valuable services, such as natural habitats and recreational sites. However, they are at risk of disturbance by storm activity; in the past two decades, several tropical storms (Erin in 2007; Don in 2011) and hurricanes (Harvey in 2017; Hanna in 2020) have made landfall on these islands, causing storm surges that impacted these sites. At Padre and Mustang Islands, attempts have been made to maintain the beaches to a certain degree [33]. On the other hand, San Jose Island is privately owned and is largely undisturbed by man; therefore, it is a unique study area for dunes guided by natural processes.
These islands consist of a series of geomorphologic features, where the back-beach and fore-island dunes form the seaward portion (Figure 2) [33,35]. Three types of dunes may be typically present on a barrier island: coppice dunes, fore-island dunes, and back-island dunes (Figure 2A) [36,37]. Coppice dunes are the initial, incipient dunes located on the back-beach that form by the entrapment of sediment by vegetation or debris. As sand accumulates, fore-island dunes develop between the back-beach and the vegetated barrier flats, growing to considerable heights and forming the highest point along the barrier island [37]. Back-island dunes are shorter, non-active dunes that occur before the bay margin and form via landward migration of the foredune ridges. Thus, dunes on barrier islands can vary in height and vegetation coverage, and these aspects influence the resiliency of dunes against erosional events [2]. Erosional events cause either a scarped dune, where a portion of the dune has been removed, or flooding (overwash) of the dune, depending on the dune’s height relative to the wave height or storm surge during storms [11].
The backshore area and the foredune complex, consisting of foredune ridges and incipient dunes, are the focus of this study (Figure 2B).

2. Materials and Methods

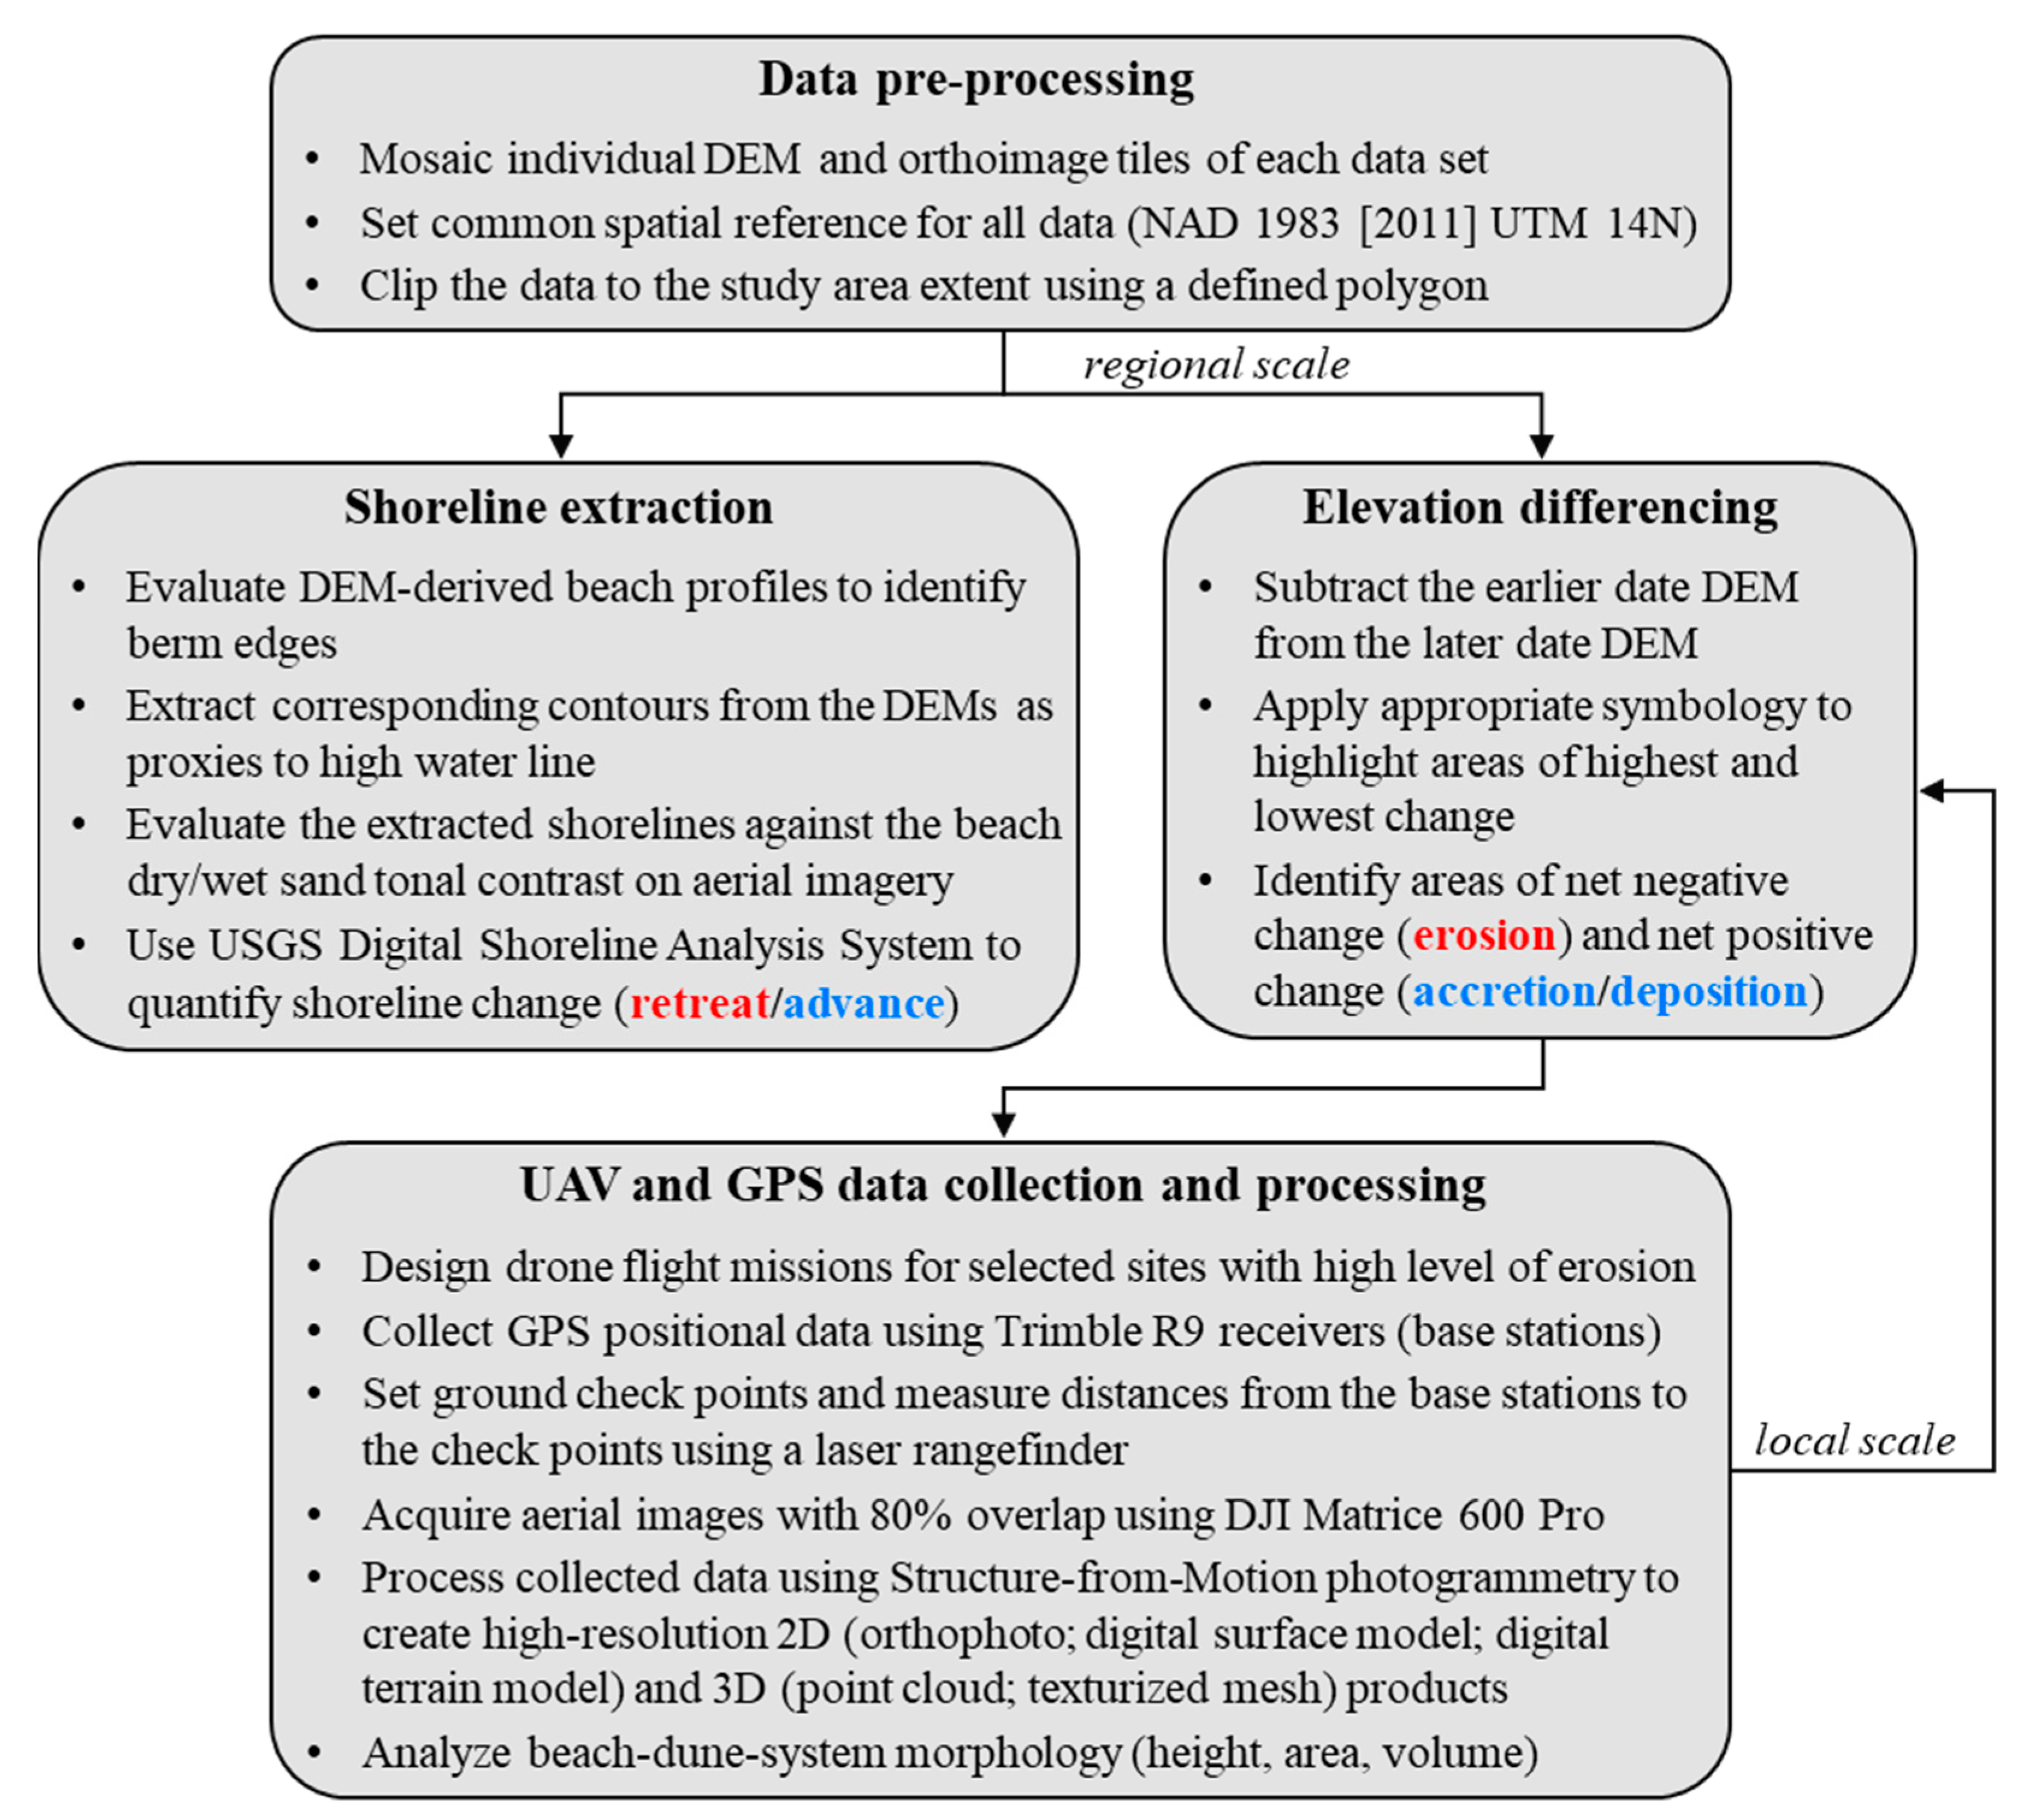
2.1. Data and Workflow

This work consisted of two parts. In the first part, publicly available elevation data (bare-earth digital elevation models derived from airborne lidar surveys) and aerial imagery data (Table 1) were downloaded, pre-processed, and used for regional-scale (~80 km along shore) post-Harvey (2016–2018) quantitative and qualitative change analyses. Based on these analyses, areas with high levels of change were identified (green and red points in Figure 1). Then, three of these sites (T1, T5, and T10 in Figure 1), covering San Jose, Mustang, and North Padre Islands, were selected for the collection of unmanned-aerial-vehicle (UAV) imagery used for analyses of the dune morphologies and local-scale (~200 m along shore) changes from 2018 to 2022.
The workflow of this project is summarized in Figure 3. First, all data sets were imported into an ArcGIS Pro [38] project. Then, individual digital-elevation-model (DEM) and orthophoto tiles were combined into single raster products and projected to a common spatial reference (North American Datum [NAD] 1983 [2011], Universal Transverse Mercator [UTM] Zone 14N). Next, a study-area polygon was defined, and all products were clipped to this polygon to ensure equal coverage among the data from different years. Following pre-processing, shoreline change analysis and elevation differencing were performed as described in the subsequent methodology sections.

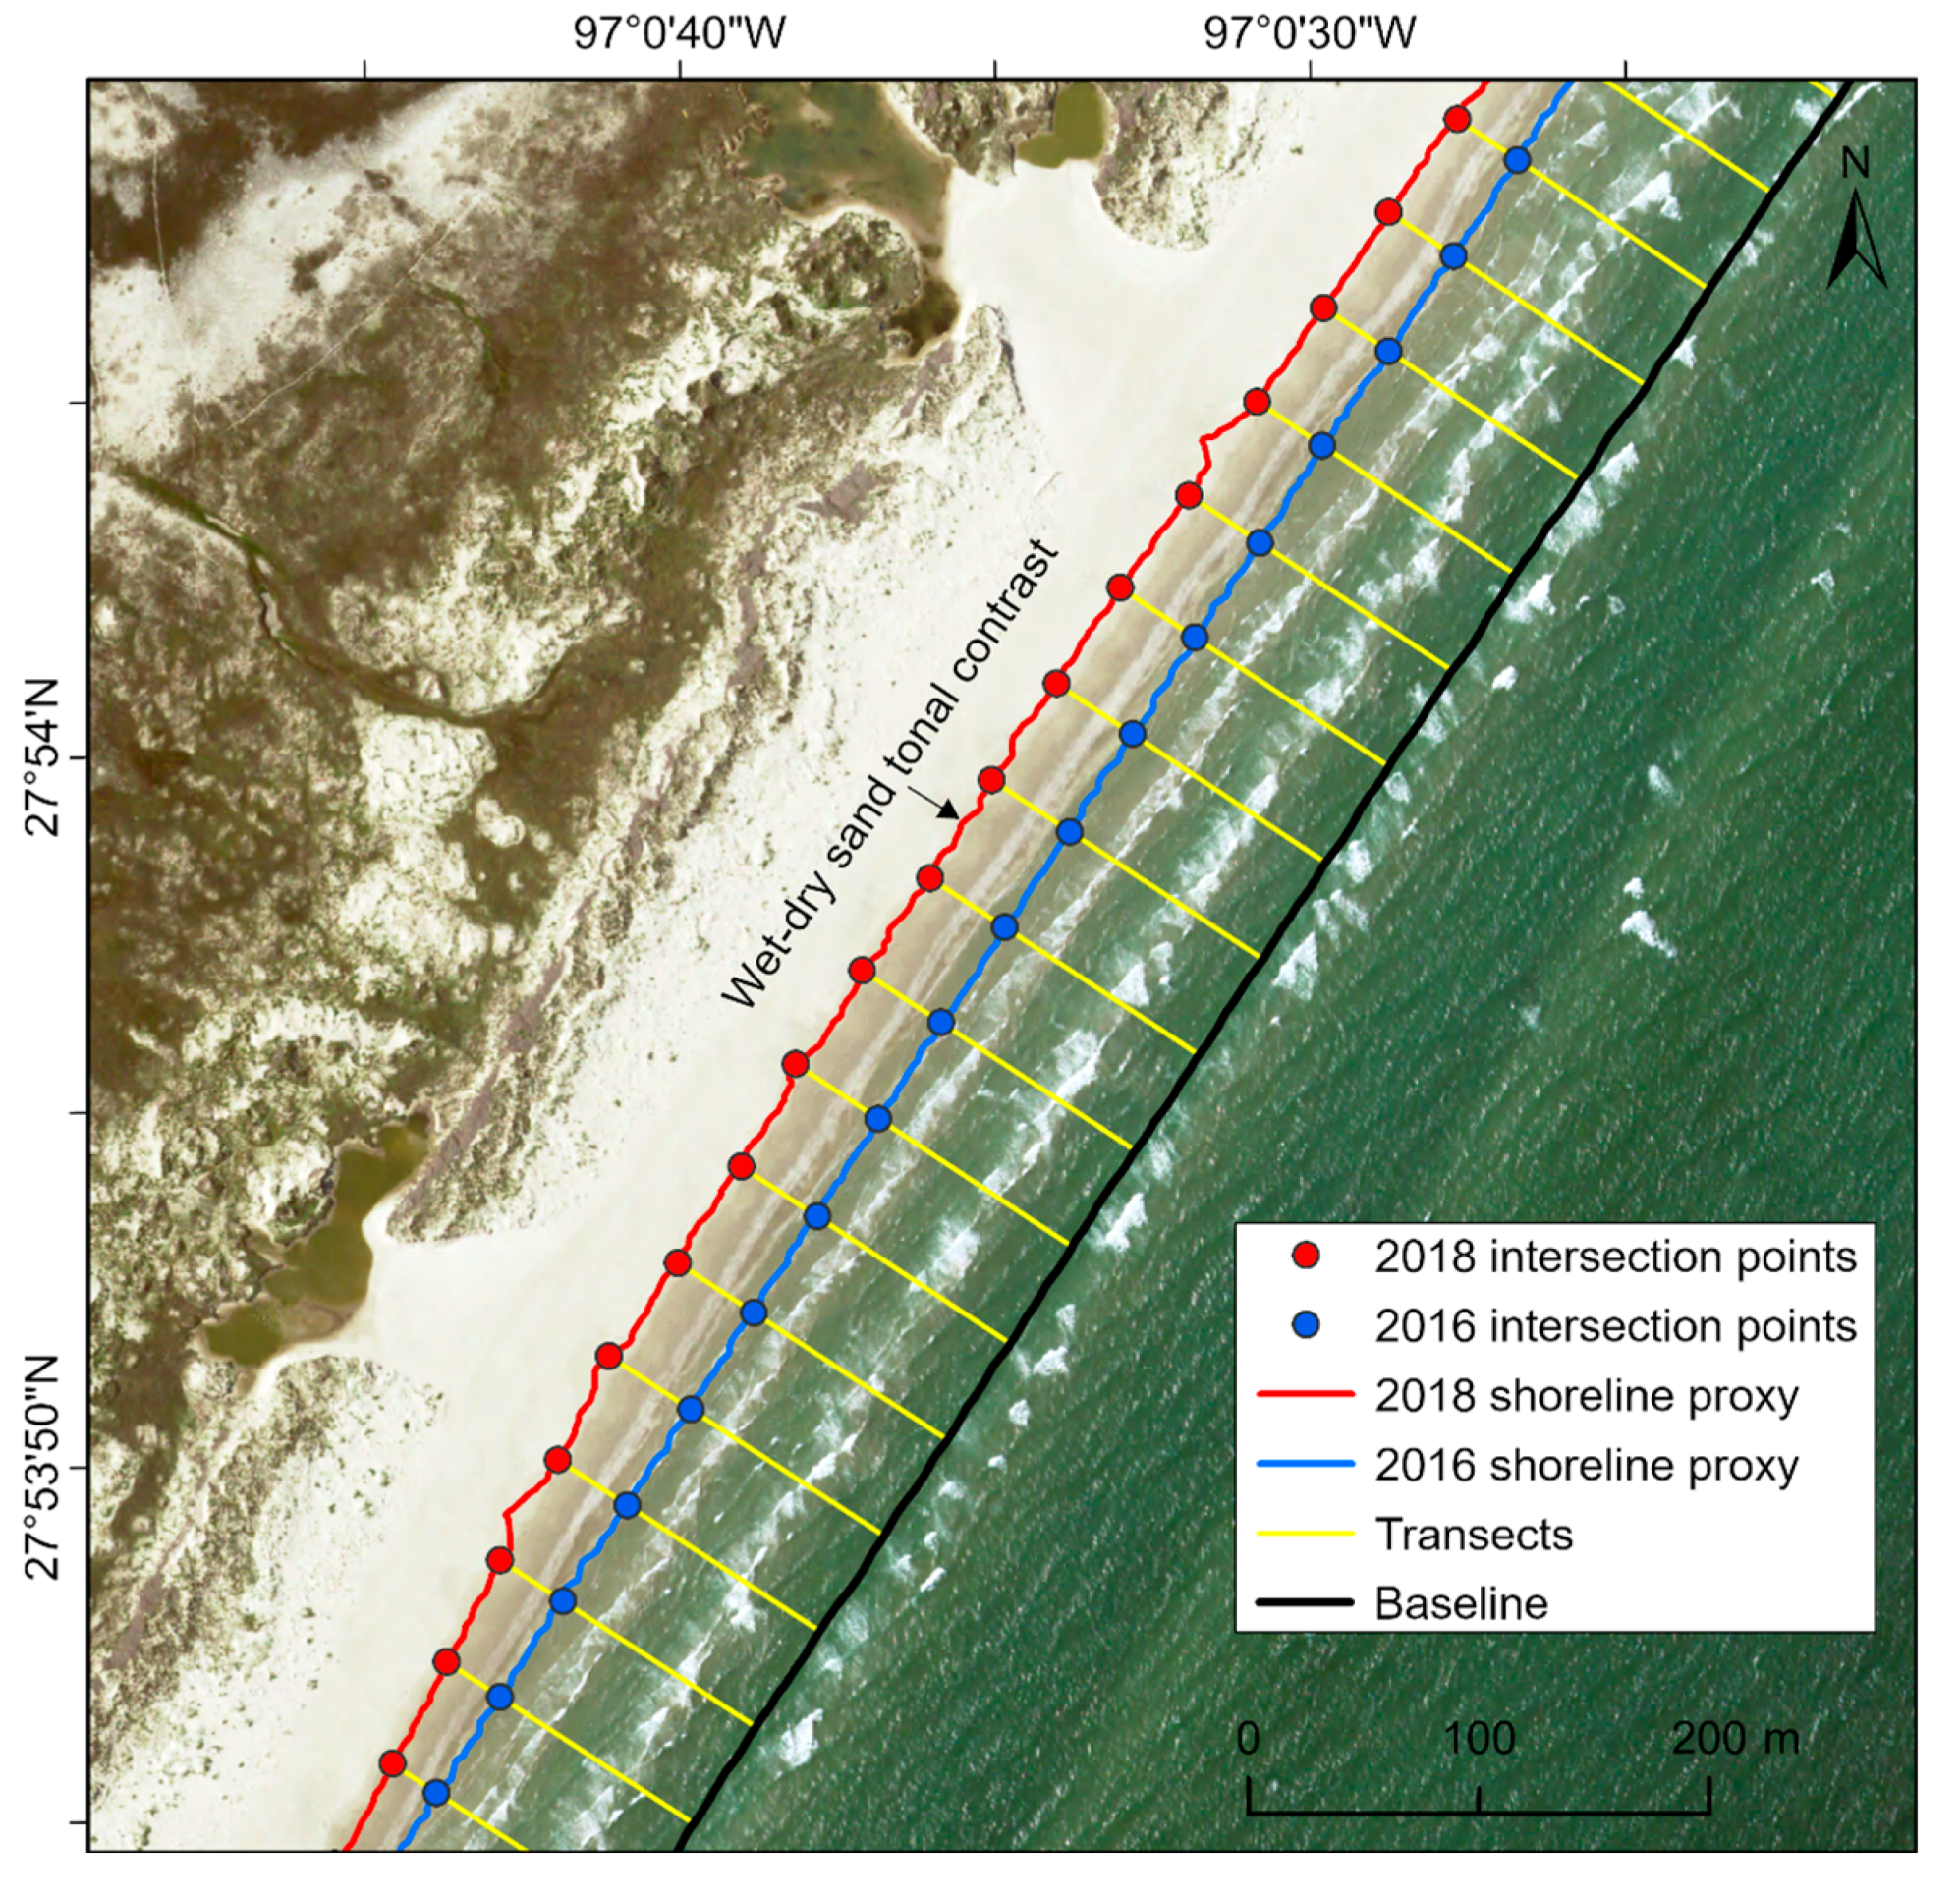
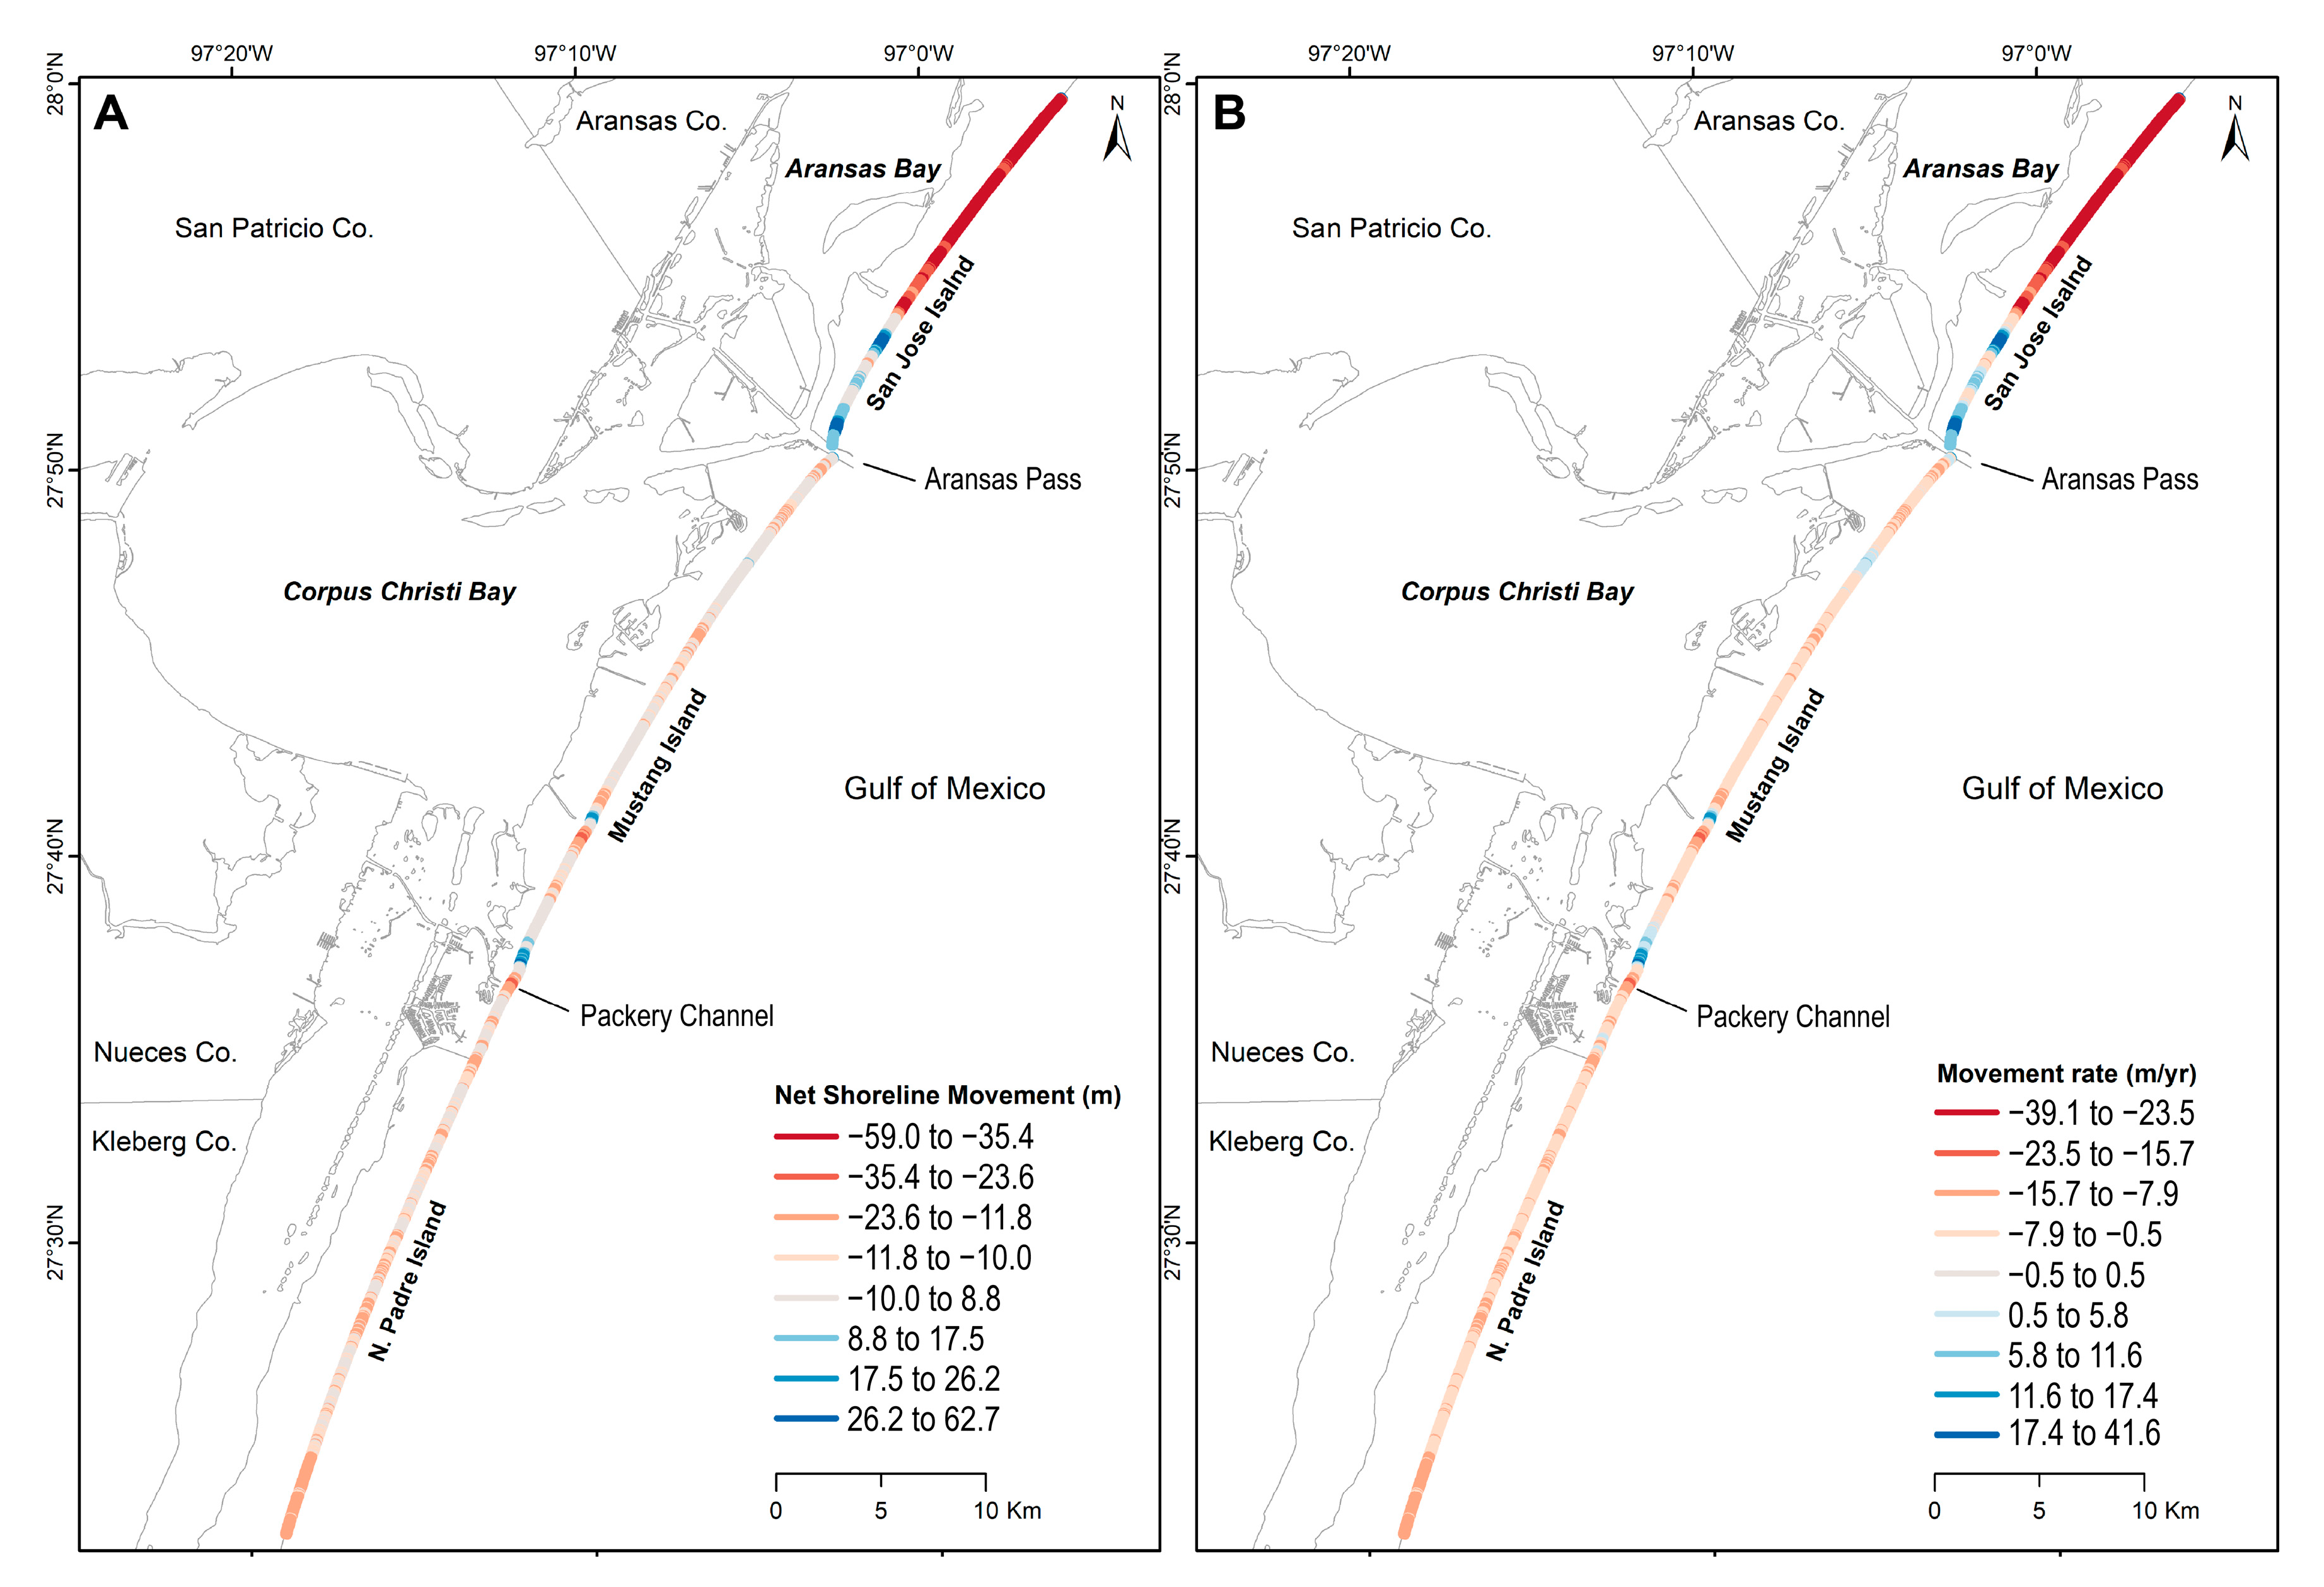
2.2. Shoreline Change Analysis

Historically, various techniques have been used to define shorelines in coastal studies, including nautical charts, ground-based global positioning system (GPS) surveys, and manual digitizing by tracing the tonal contrast between the wet and dry beach on aerial photographs [1,39,40]. With the advent of high-accuracy airborne lidar surveys, shoreline positions can be extracted directly from the elevation data using a specific contour as the shoreline proxy. This contour corresponds to the high-water line or the wet-dry sand boundary, which, in turn, usually corresponds to the seaward edge of the major beach berm and occurs approximately 0.6 m above local mean sea level on the Texas Gulf Coastline [39]. This method is more rigorous for determining a shoreline because lidar-derived DEMs are referenced to a fixed vertical datum and the extracted contour lies above the zone of high-frequency water activity occurring on the lower beachface, eliminating the inconsistency associated with the spatially and temporally variable mean sea level [1,39].
Slightly various values (e.g., 0.6 m, 1 m, 1.05 m, and 1.15 m) have been used in the literature as the shoreline proxies for the Texas Gulf Coast in different years based on an evaluation of multiple beach-profile, GPS, and lidar surveys. The difference in the contour values was due to the use of updated geoid models as years advance to convert ellipsoidal heights acquired from GPS-based lidar surveys to orthometric heights (North American Vertical Datum of 1988 [NAVD88] elevations) during lidar data processing, and due to the local difference between NAVD88 and mean sea level [1,16,40]. It is suggested that for each lidar survey, the shoreline proxy should best match the wet-dry beach boundary at the time of the survey in order to capture current conditions and to maintain consistency with historical shoreline mapping [40]; therefore, it is important to evaluate the extracted elevation contour against the aerial imagery and beach profiles relevant to each lidar survey.
In this study, we used 1 m resolution DEMs derived from airborne lidar data acquired by the United States Army Corps of Engineers (USACE) during September–October 2016 (hereafter referred to as “2016 DEM”) and the United States Geological Survey (USGS) in March 2018 (hereafter referred to as “2018 DEM”) (Table 1). Both DEMs are relative to NAVD88 based on GEOID12B transformation. By evaluating DEM-derived beach-normal profiles at numerous sections of the beach and comparing them with the aerial imagery acquired by the United States Department of Agriculture (USDA) on 30 September 2016 (hereafter referred to as “2016 NAIP imagery”) and 17 May 2018 (hereafter referred to as “2018 NAIP imagery”) (Table 1), we extracted a 1 m elevation contour from the 2016 DEM and a 0.9 m elevation contour from the 2018 DEM as the optimal shoreline proxies. The extracted contours were further processed in ArcGIS Pro by adapting the process established by the Bureau of Economic Geology Coastal Studies Program. First, they were edited to retain the most seaward, continuous contours, then smoothed using a 2 m tolerance and generalized using a 0.1 m tolerance to eliminate fine-scale kinks along the shore, while maintaining the shape of the shoreline feature [1,16]. The derived shoreline proxies matched closely with the wet-dry sand tonal contrast on the aerial imagery (Figure 4).
Finally, the USGS Digital Shoreline Analysis System (DSAS version 5.1) [41] was used to compute change statistics between the 2016 and 2018 shorelines. First, a shore-parallel baseline was defined 100 m offshore, and shore-perpendicular transects were cast from this baseline to the 2016 and 2018 shoreline proxies at a 50 m spacing along the shore (Figure 4). Each shoreline must have a positional uncertainty assigned to it to account for shoreline variation due to natural influences, such as waves, tides, and winds, as well as shoreline variation due to measurement uncertainties [41]. A 10 m positional and measurement uncertainty was assigned to the shorelines based on the lateral shift associated with the vertical accuracy of the DEMs (Table 1), the slope of the beach, and the range of shoreline proxy elevations. This value is also the default, average shoreline uncertainty value suggested by the USGS [41]. Then, the distances in meters from the baseline to the intersection-point pairs were used to calculate the net shoreline movement (NSM) at each transect. The end point rate (i.e., the shoreline movement rate expressed in m/yr) was calculated by dividing the NSM by the time interval between the two shoreline proxies. It is important to note that this time interval represents a short-term change within 18 months; therefore, the average movement rates expressed in m/yr should not be projected into the future as trends and should only be used as a unit to express the effect of the hurricane and to compare to average retreat rate of the Texas coast.
Thus, DSAS produces change-rate statistics, where transects with a net negative change are considered erosional and transects with a net positive change are considered accretional, corresponding to shoreline retreat and advance, respectively.

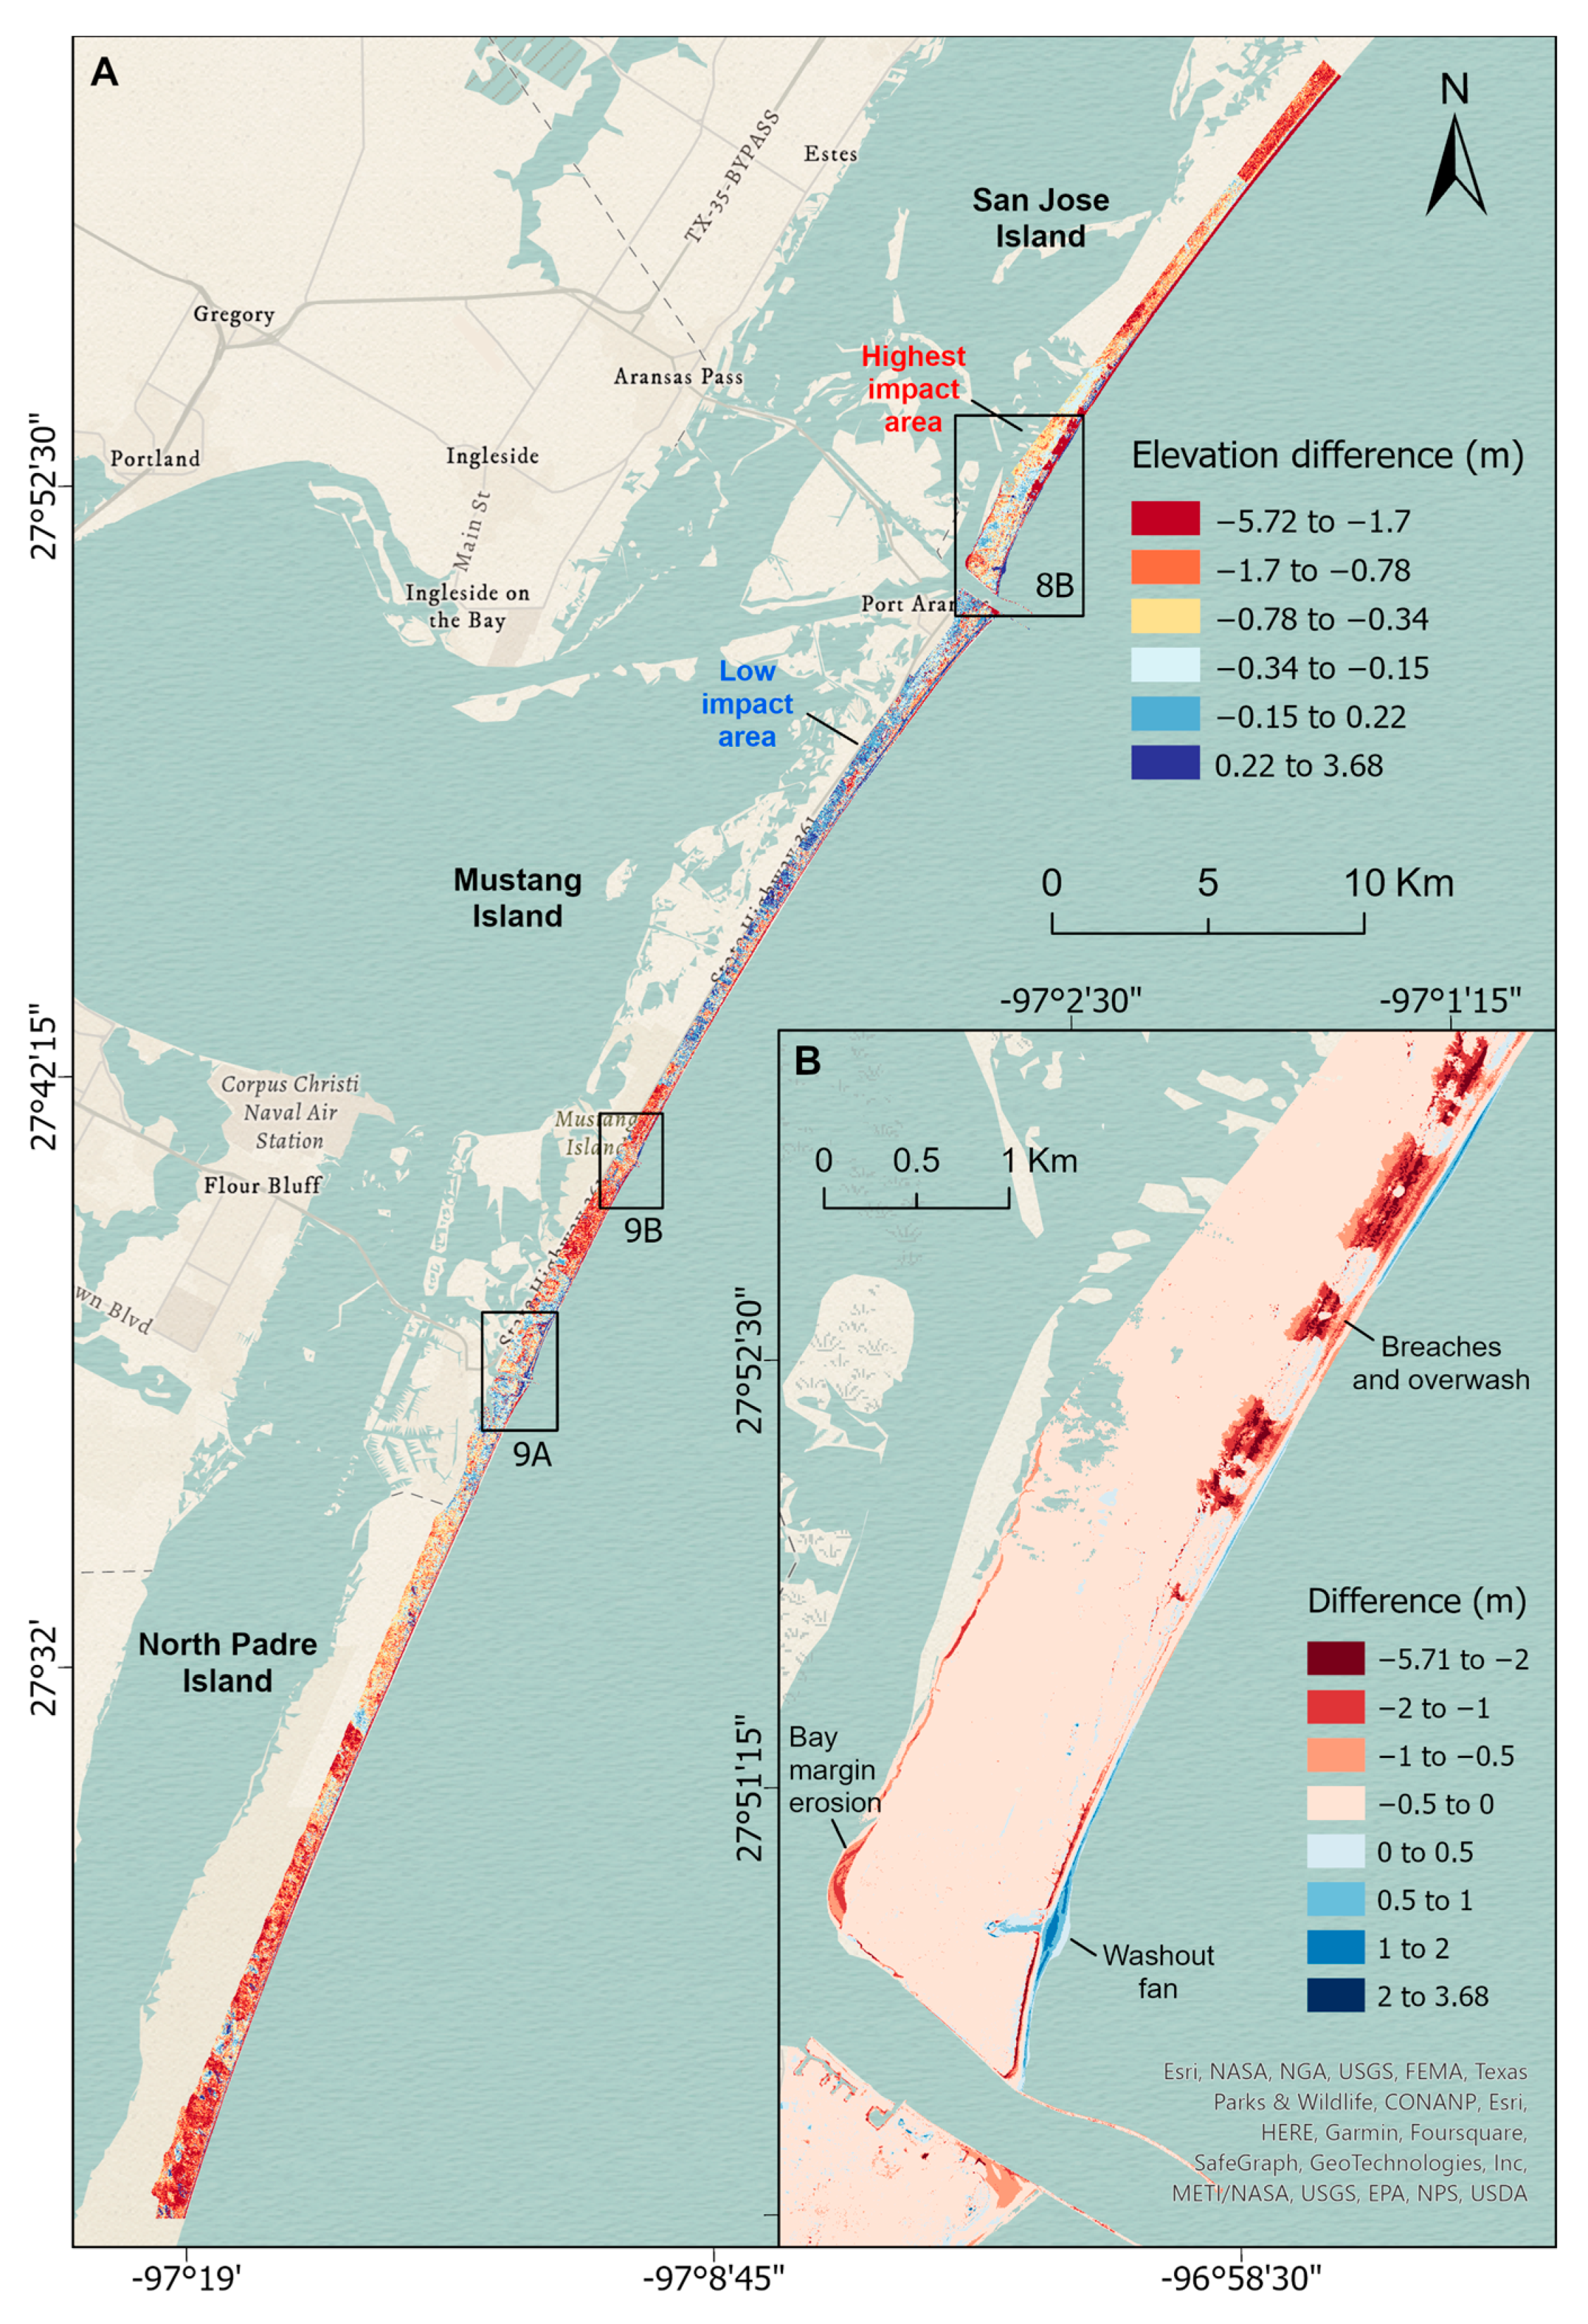
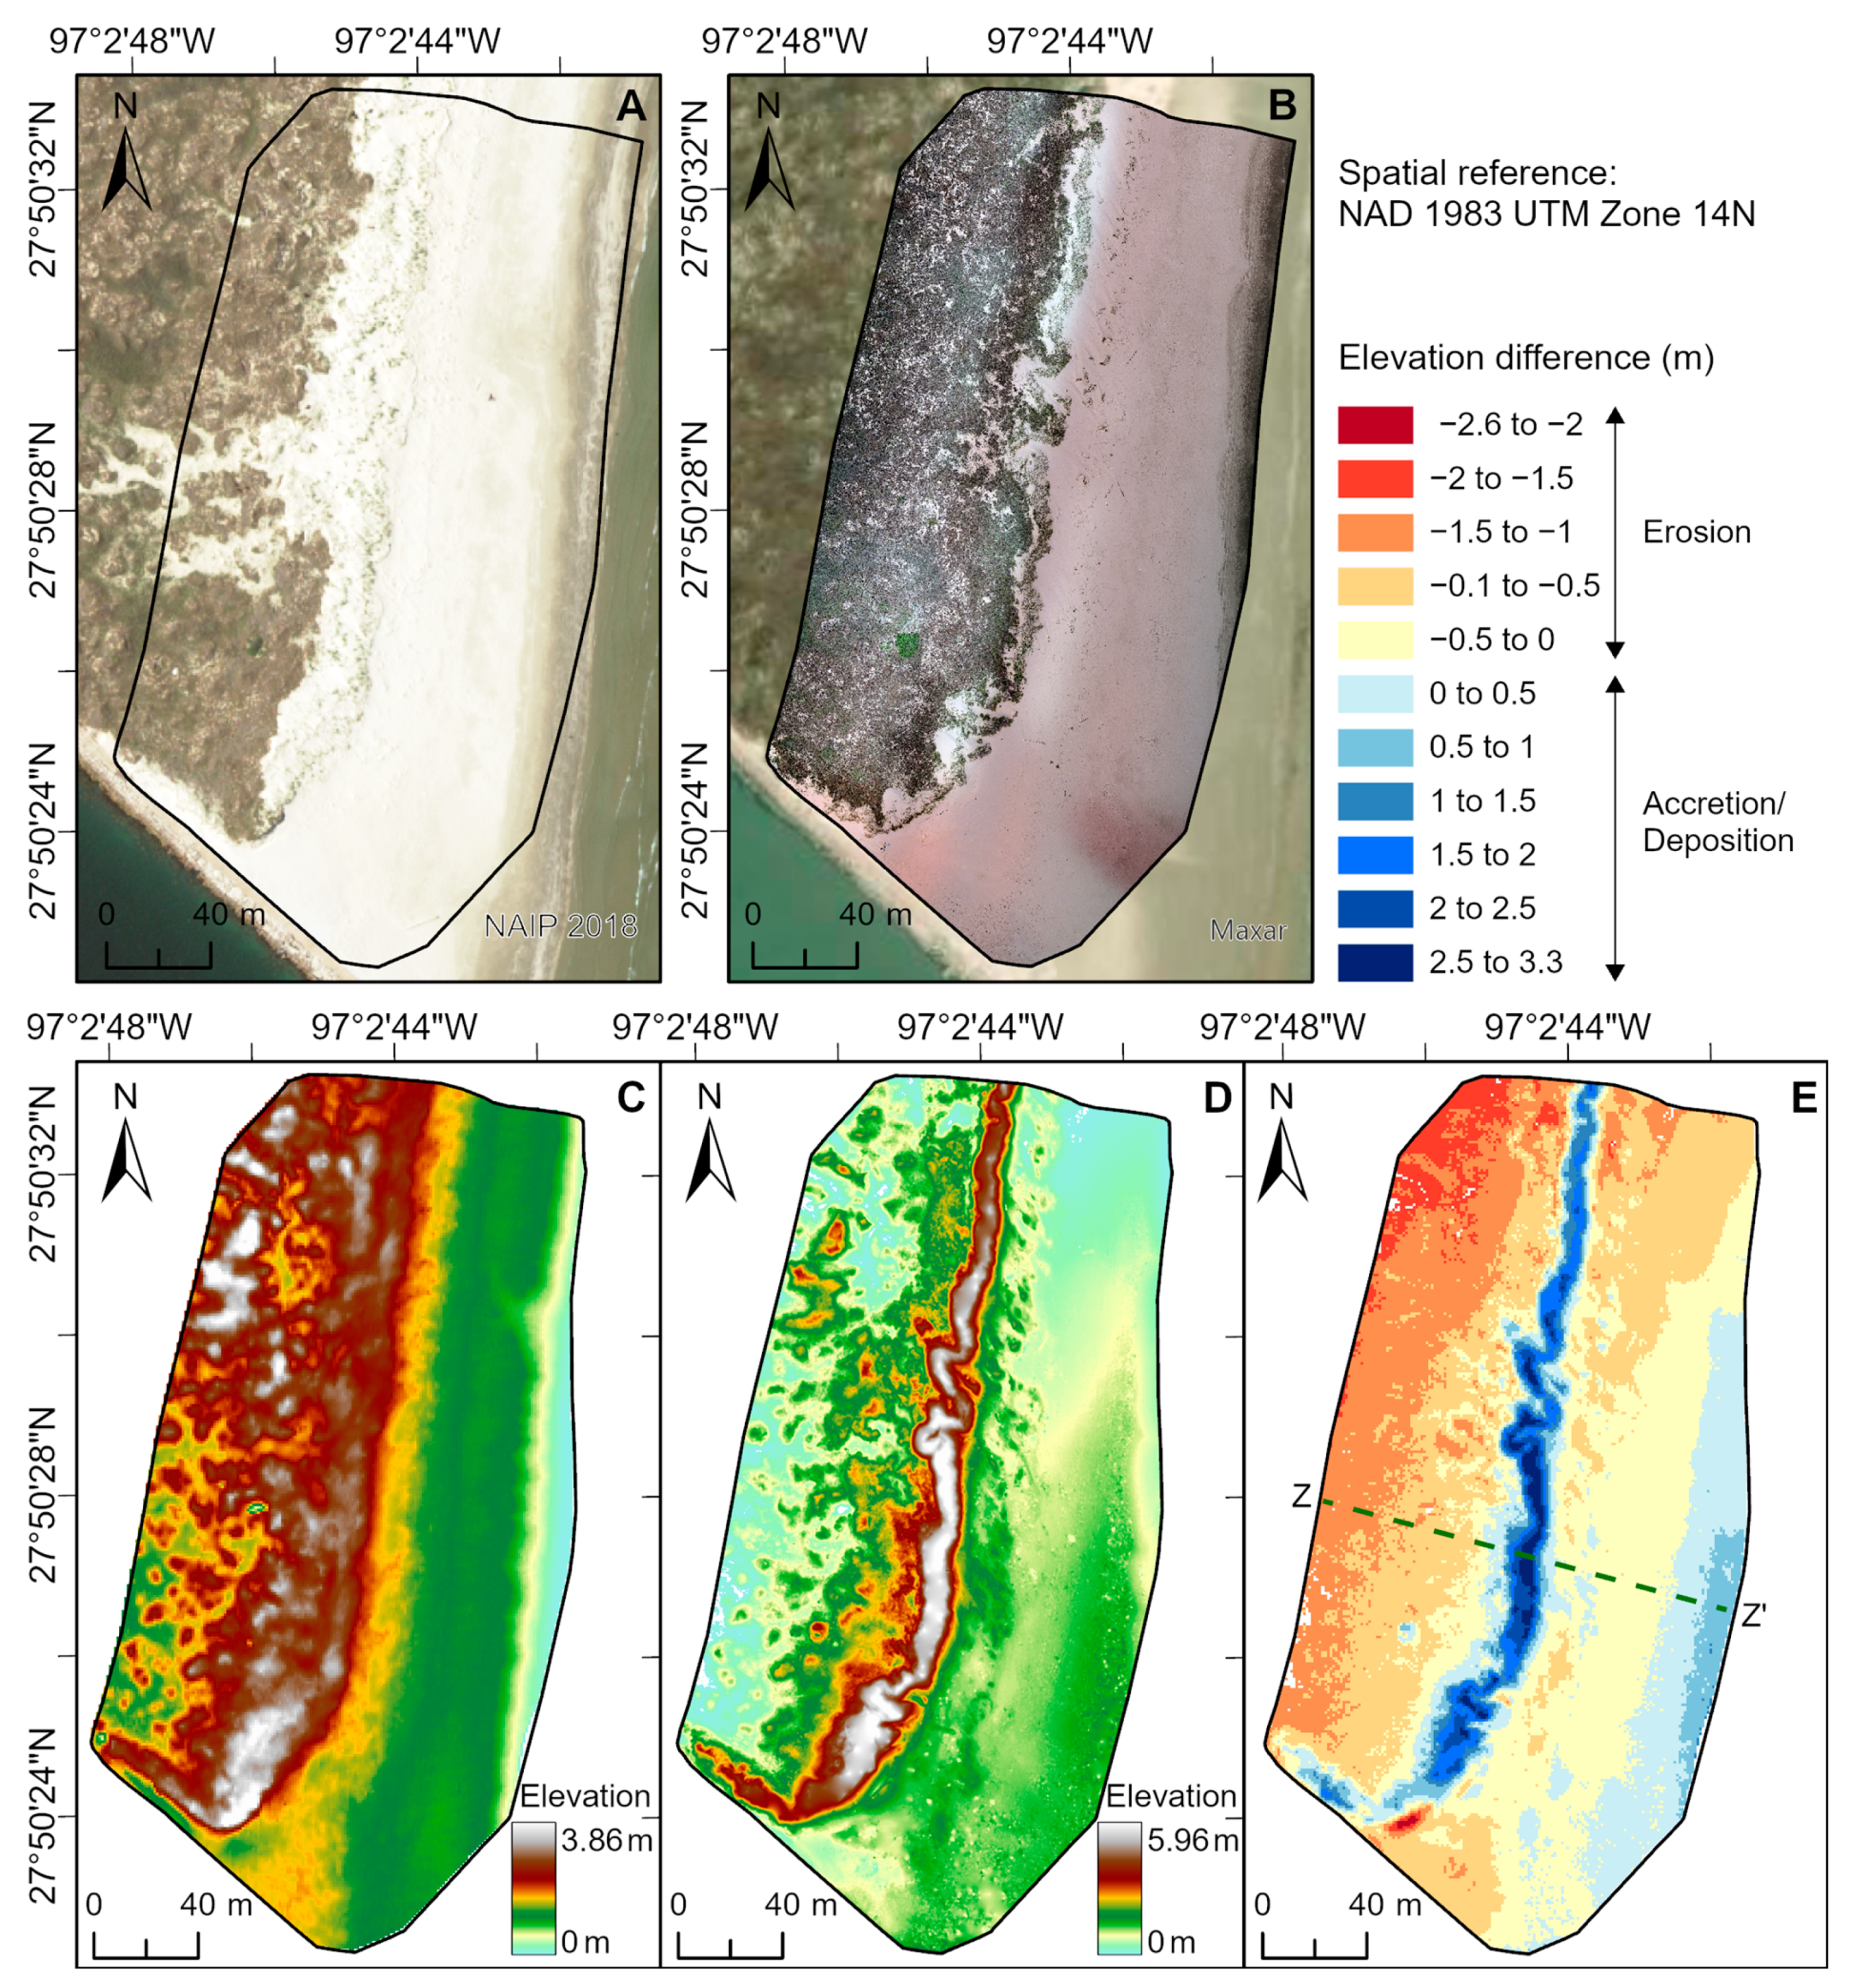
2.3. Elevation Differencing

DEM differencing was used to identify areas of net vertical erosion (negative elevation difference) and/or deposition (positive elevation difference). Because of the variability in the coastline associated with erosional and depositional events, the 2016 and 2018 DEMs had different expressions of the shore. In order to capture parts of the shoreline that had been eroded and parts of the shoreline that had been accreted, the negative pixel values in the DEMs that correspond to offshore areas and onshore water bodies were first set to zero. Then, the 2016 DEM was subtracted from the 2018 DEM using the raster calculator tool in ArcGIS Pro. Finally, a mask was defined and applied to the DEM-difference raster to eliminate (i.e., set to null) zero values that resulted from areas with water bodies in both DEMs and to retain only the real zero values, which represented no change. Thus, the created DEM-difference map showed the areas where new sediment had been deposited seaward of the 2016 shore (e.g., fans and bars), as well as parts of the 2016 shore where material had been removed by storms and/or other erosional events. However, it should be noted that the values in these areas represented change above water surface.
Based on the DEM-difference map, 17 sections along the central Texas coast with over 1 m vertical elevation change in the foredunes were identified for further investigation in the field (Figure 1).

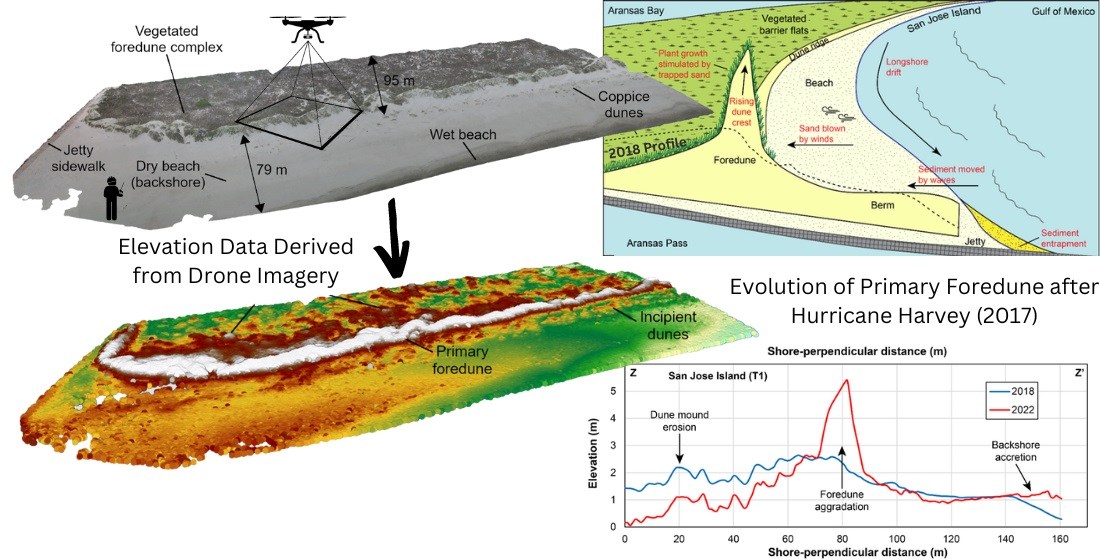
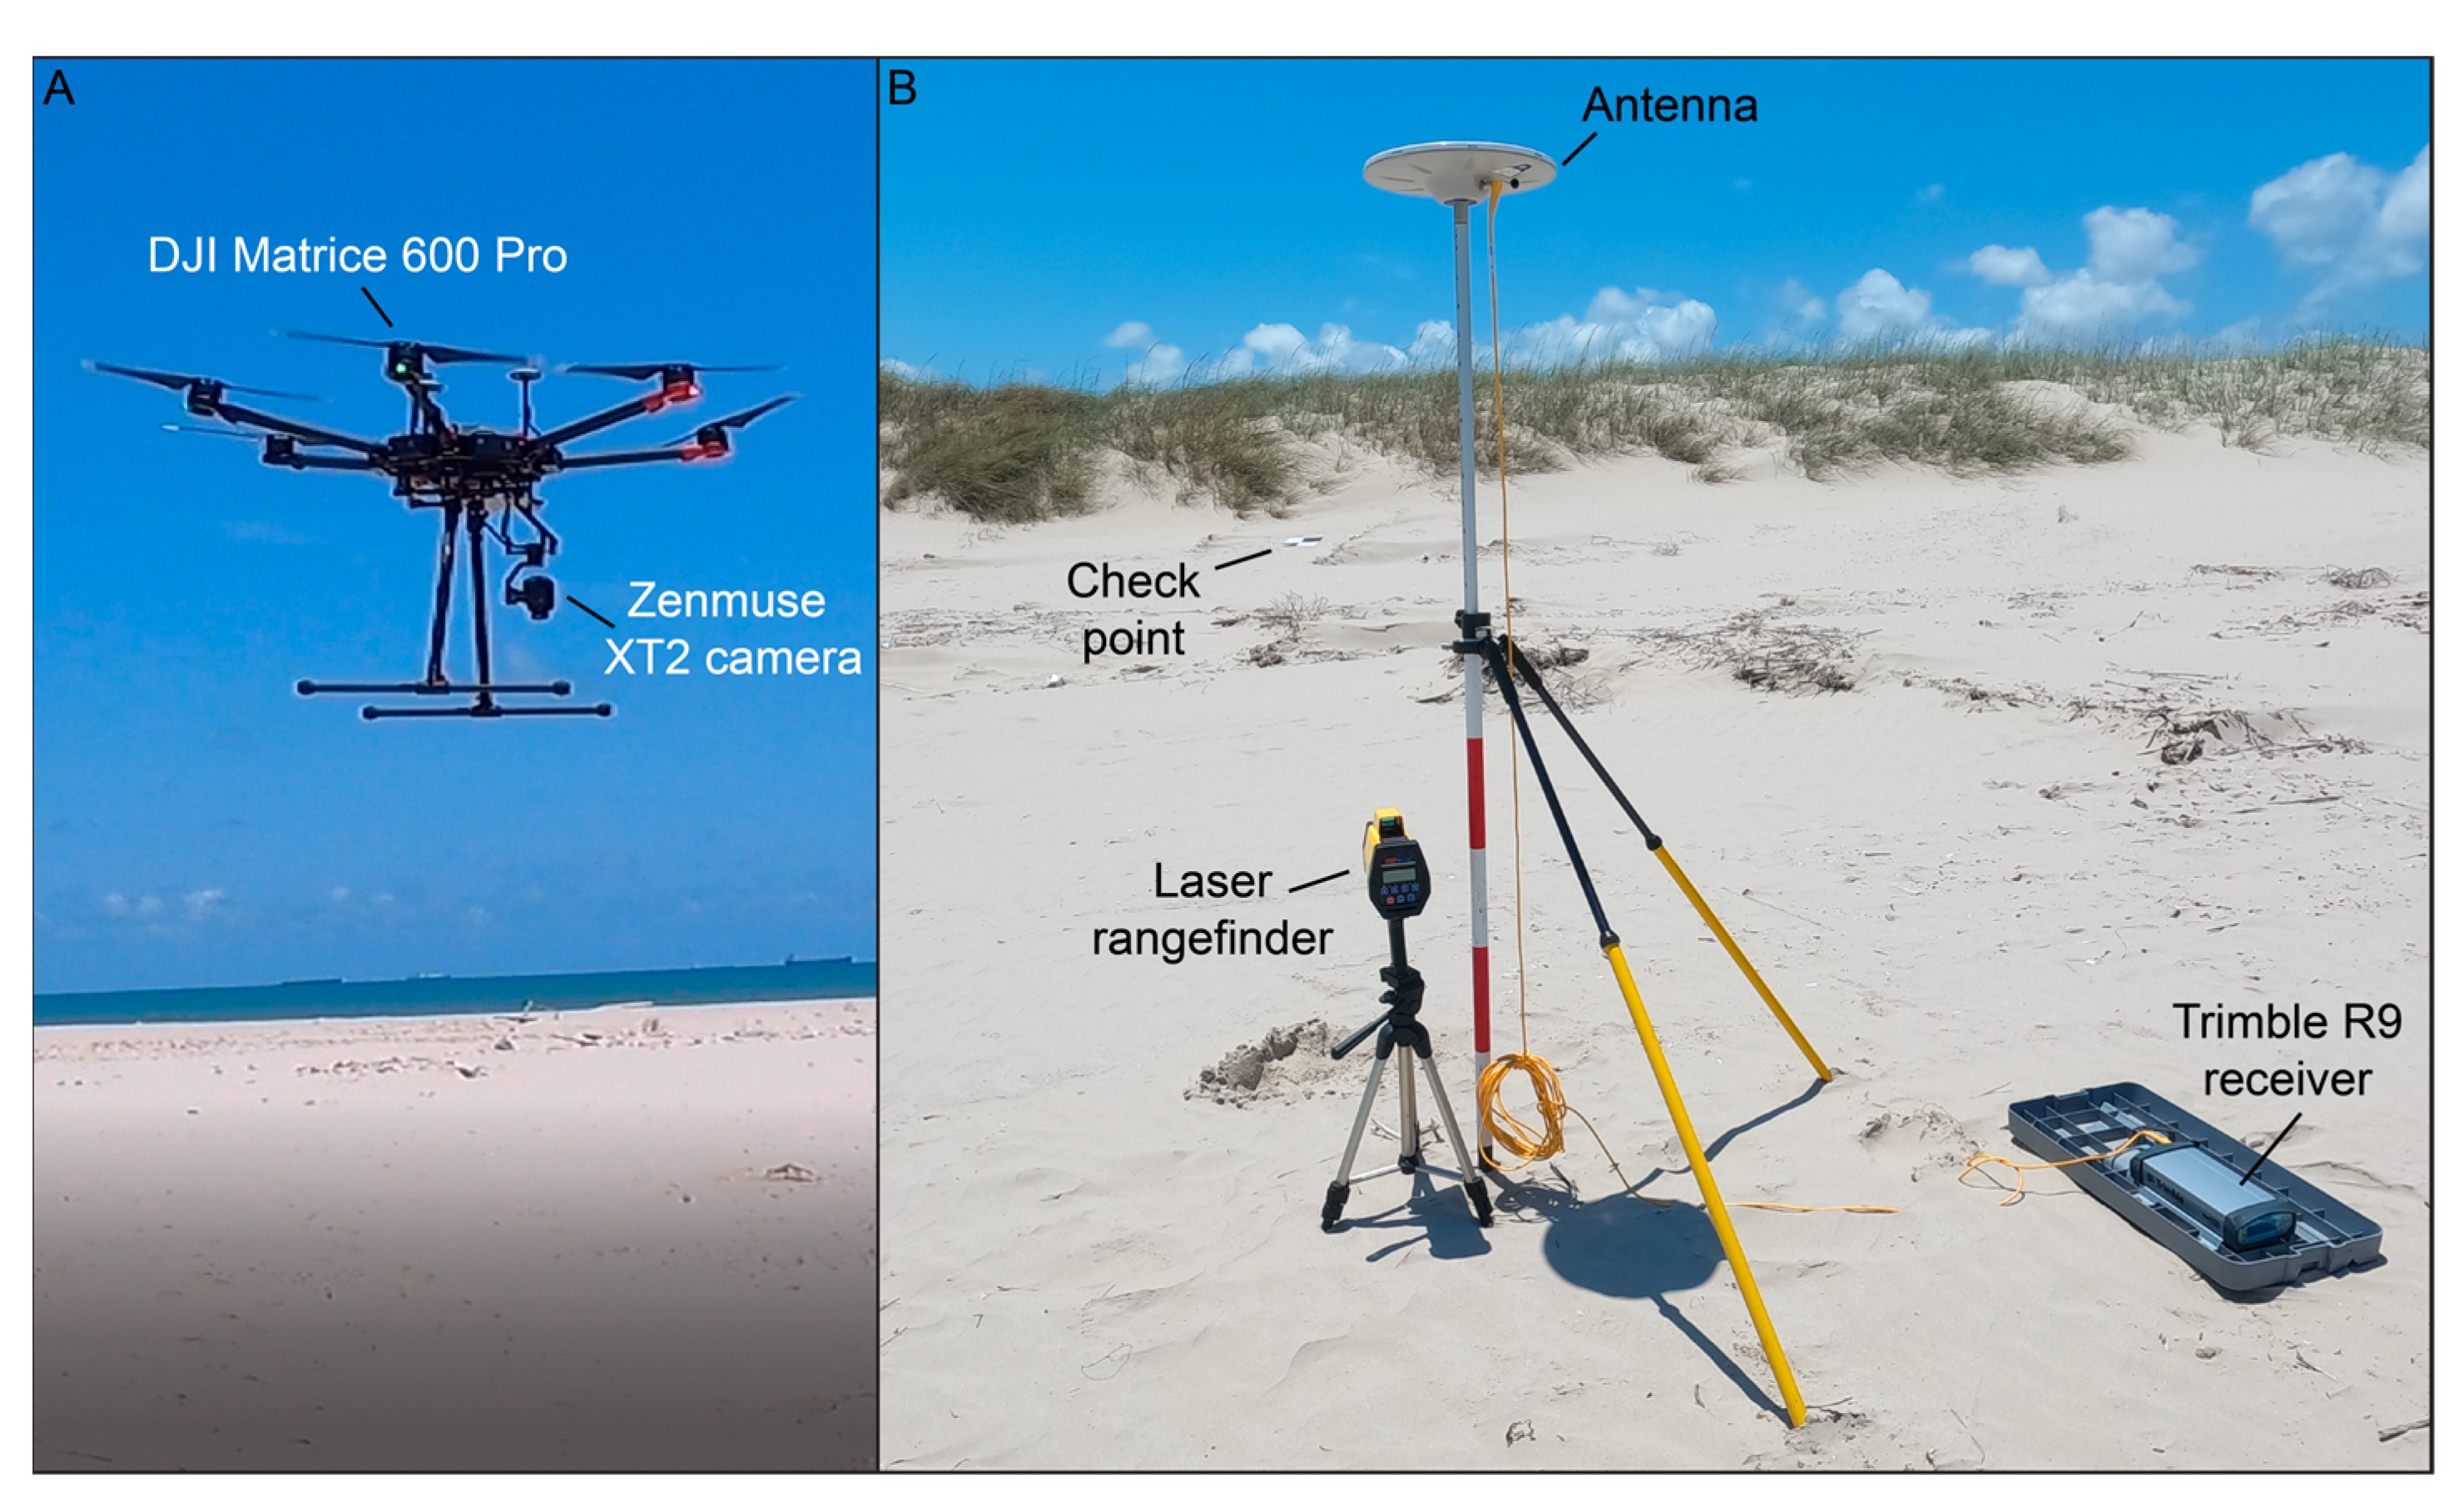
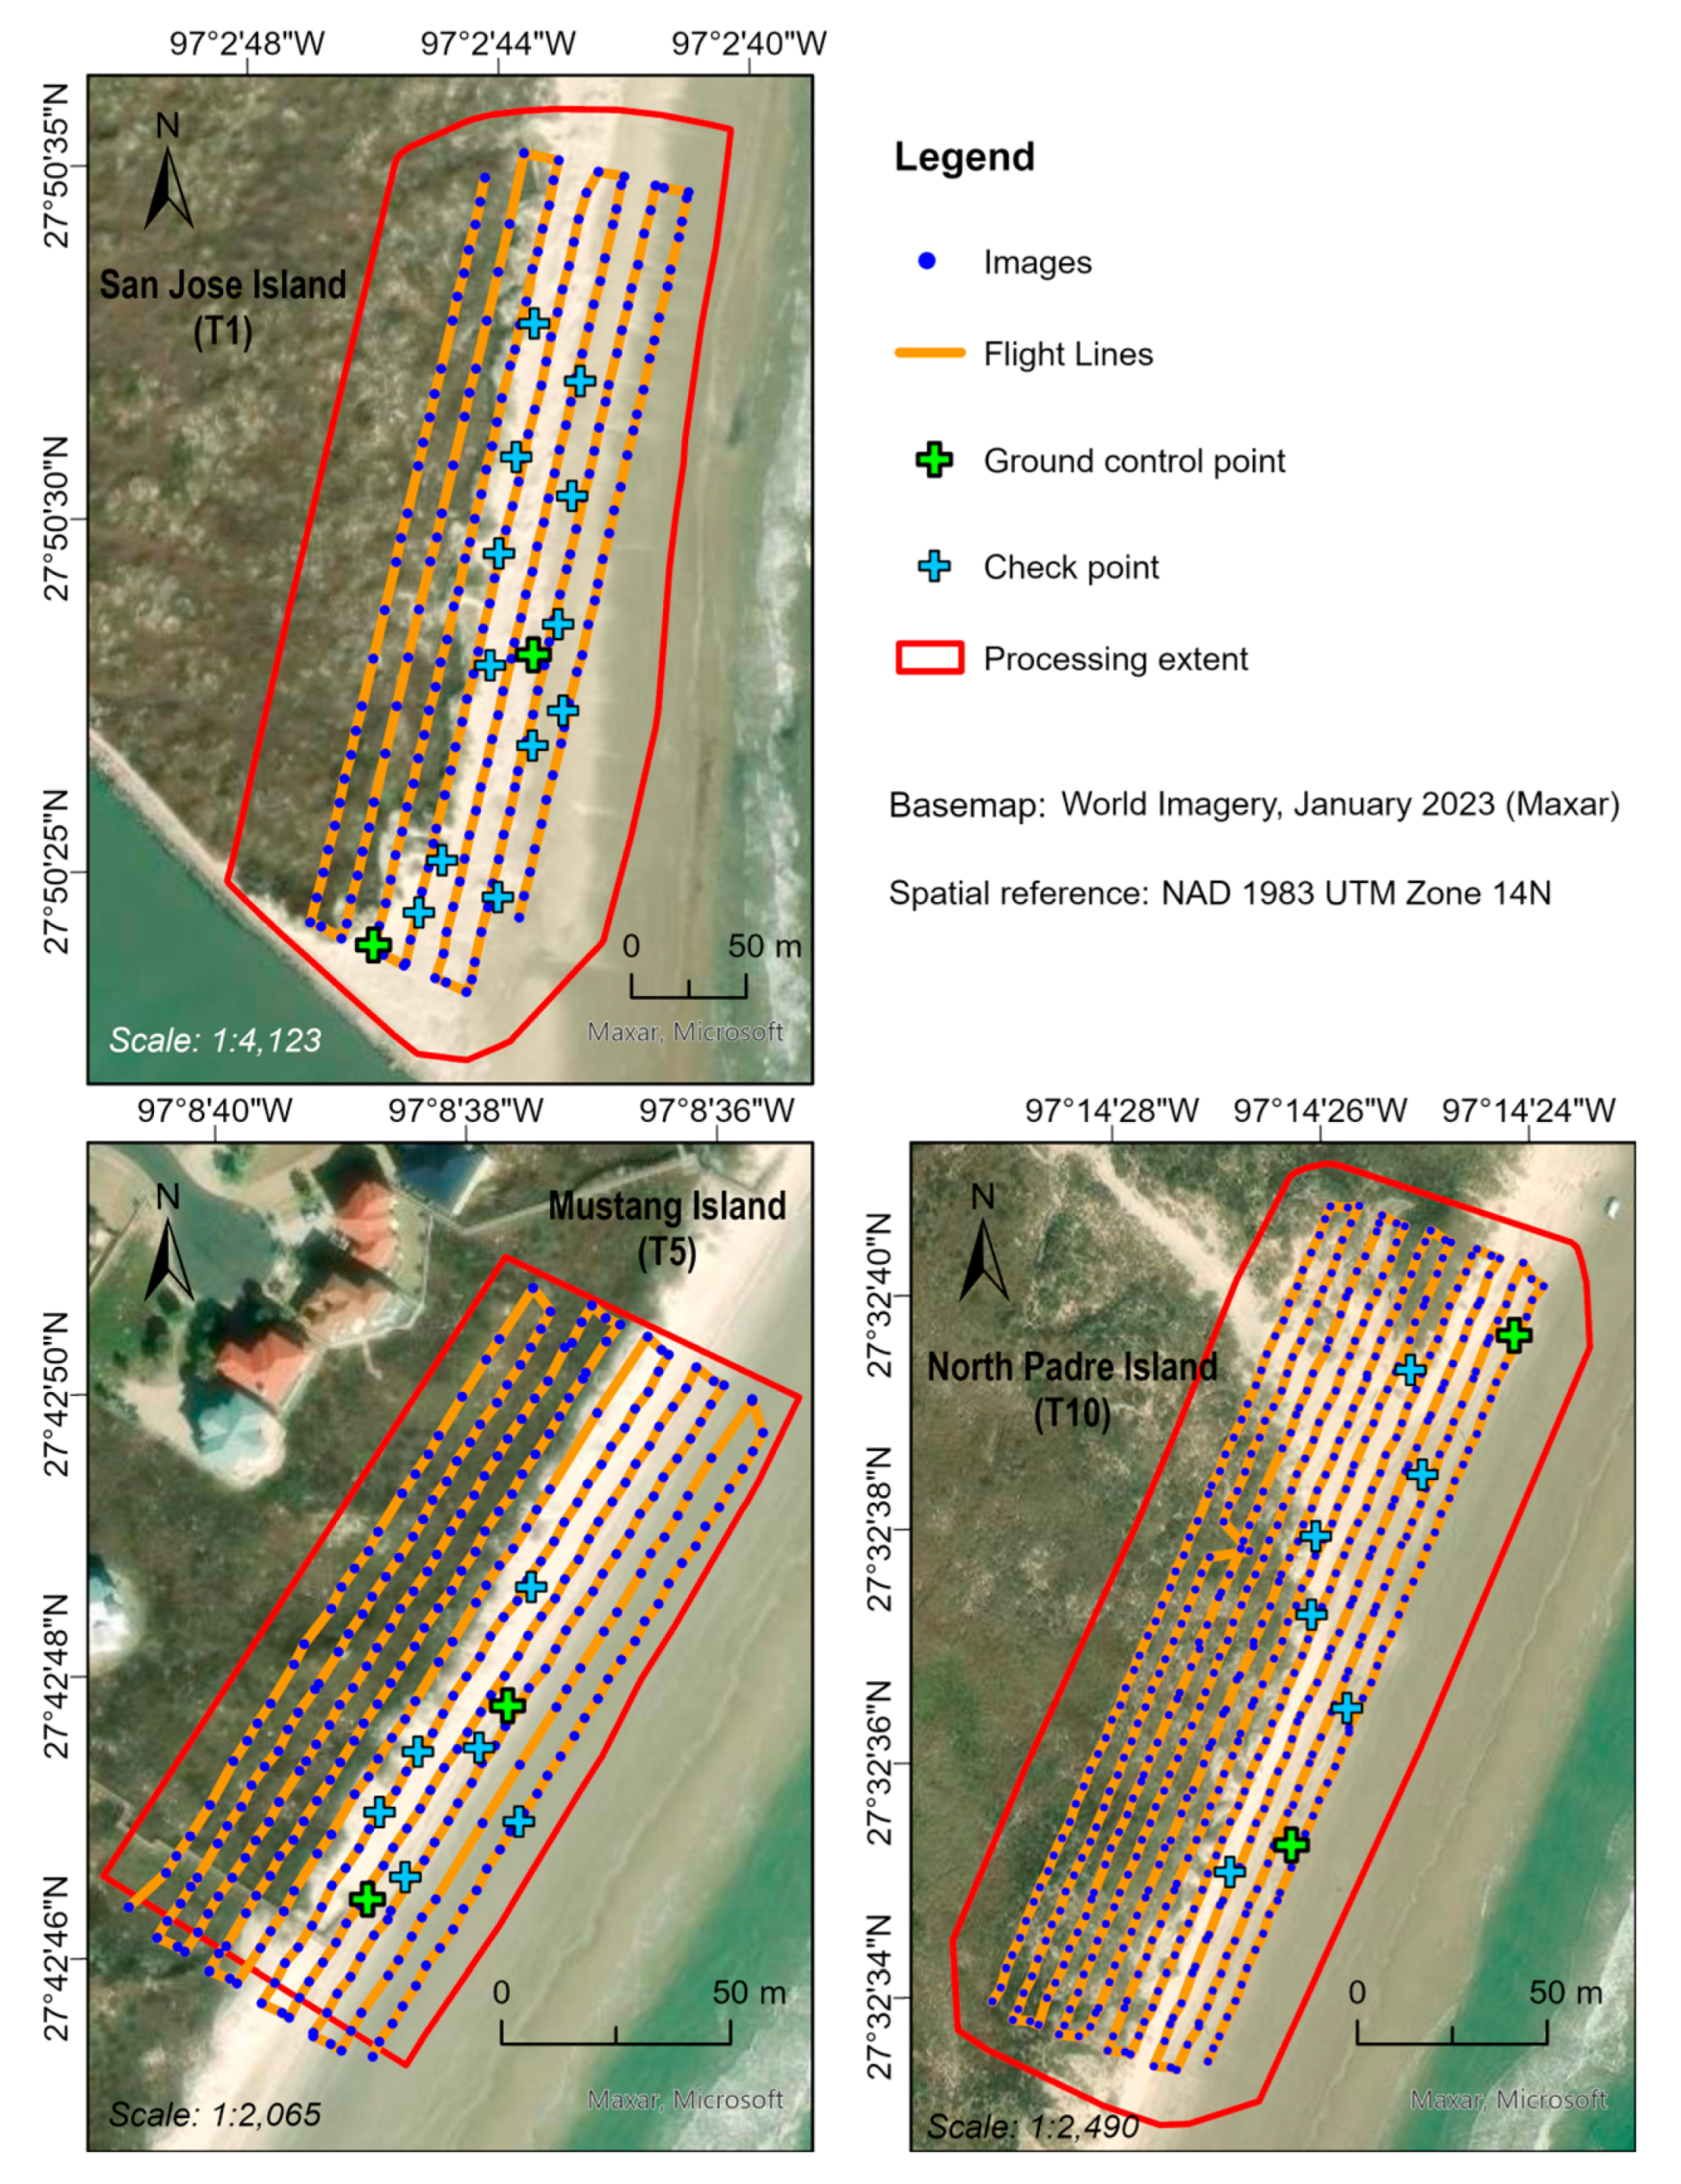
2.4. UAV and GPS data Collection and Processing

After reconnaissance of the identified sites, one location at each barrier island was selected for UAV and GPS data acquisition based on field accessibility, as well as visual inspection of storm impacts in these areas from aerial imagery. The selected sites were T1 in San Jose Island, T5 in Mustang Island, and T10 in North Padre Island (Figure 1).
The UAV used in this study was DJI Matrice 600 Pro (Figure 5A), with a mounted Zenmuse XT2 camera (12 MP, 8 mm visual lens, and 19 mm thermal lens). At each site, the UAV was flown at a low altitude along the shore using designed, automated flight missions, and hundreds of aerial images were captured with 80% overlap, covering the backshore and foredune complexes (Figure 6). The flight specifications for each site, including the UAV altitude, ground sampling distance (spatial resolution), number of images, and area covered, are shown in Table 2.
To georeference the UAV imagery, two ground control points at each site (green crosses in Figure 6) were surveyed using a Trimble R9 GNSS system (Figure 5B). Additionally, 6–12 aerial targets (Figure 5B) were placed at each site and used as check points (blue crosses in Figure 6) for accuracy assessment of the final products. Distances from the ground control points to each check point were measured (average of three measurements) with a Laser Atlanta Advantage rangefinder with up to 10 cm accuracy. The collected GNSS data were post-processed at ~1 cm horizontal and 3–5 cm vertical accuracy using the Canadian Spatial Reference System precise point positioning (CSRS-PPP) service by the Geodetic Survey of Natural Resources Canada.
Finally, the collected imagery was processed in ArcGIS Drone2Map [42] drone mapping software following the structure-from-motion workflow to generate high-resolution 2D (orthophoto, digital surface model, and digital terrain model) and 3D (point cloud and texturized mesh) products. A processing boundary (red polygons in Figure 6) was defined for each site to exclude the far edges of the surveys, where images might be distorted. The relative horizontal accuracy achieved by georeferencing ranged from 0.5 cm to 15 cm at the edges of the products. The orthophotos, digital surface models, and 3D photorealistic models were used to describe the morphology of the beach−dune systems. The digital terrain models, which were equivalent to bare-earth digital elevation models, were used to analyze elevation change from 2018 to 2022. First, their elevations were converted from ellipsoidal heights to NAVD88 orthometric heights using the GEOID12B model (GEOID12B height values for each site were obtained from NOAA’s National Geodetic Survey). Then, the 2018 DEM was subtracted from the 2022 DEMs of each site to quantify erosion and/or deposition. Thus, volumes of sediment change were calculated using the cut-and-fill method in ArcGIS Pro.

3. Results

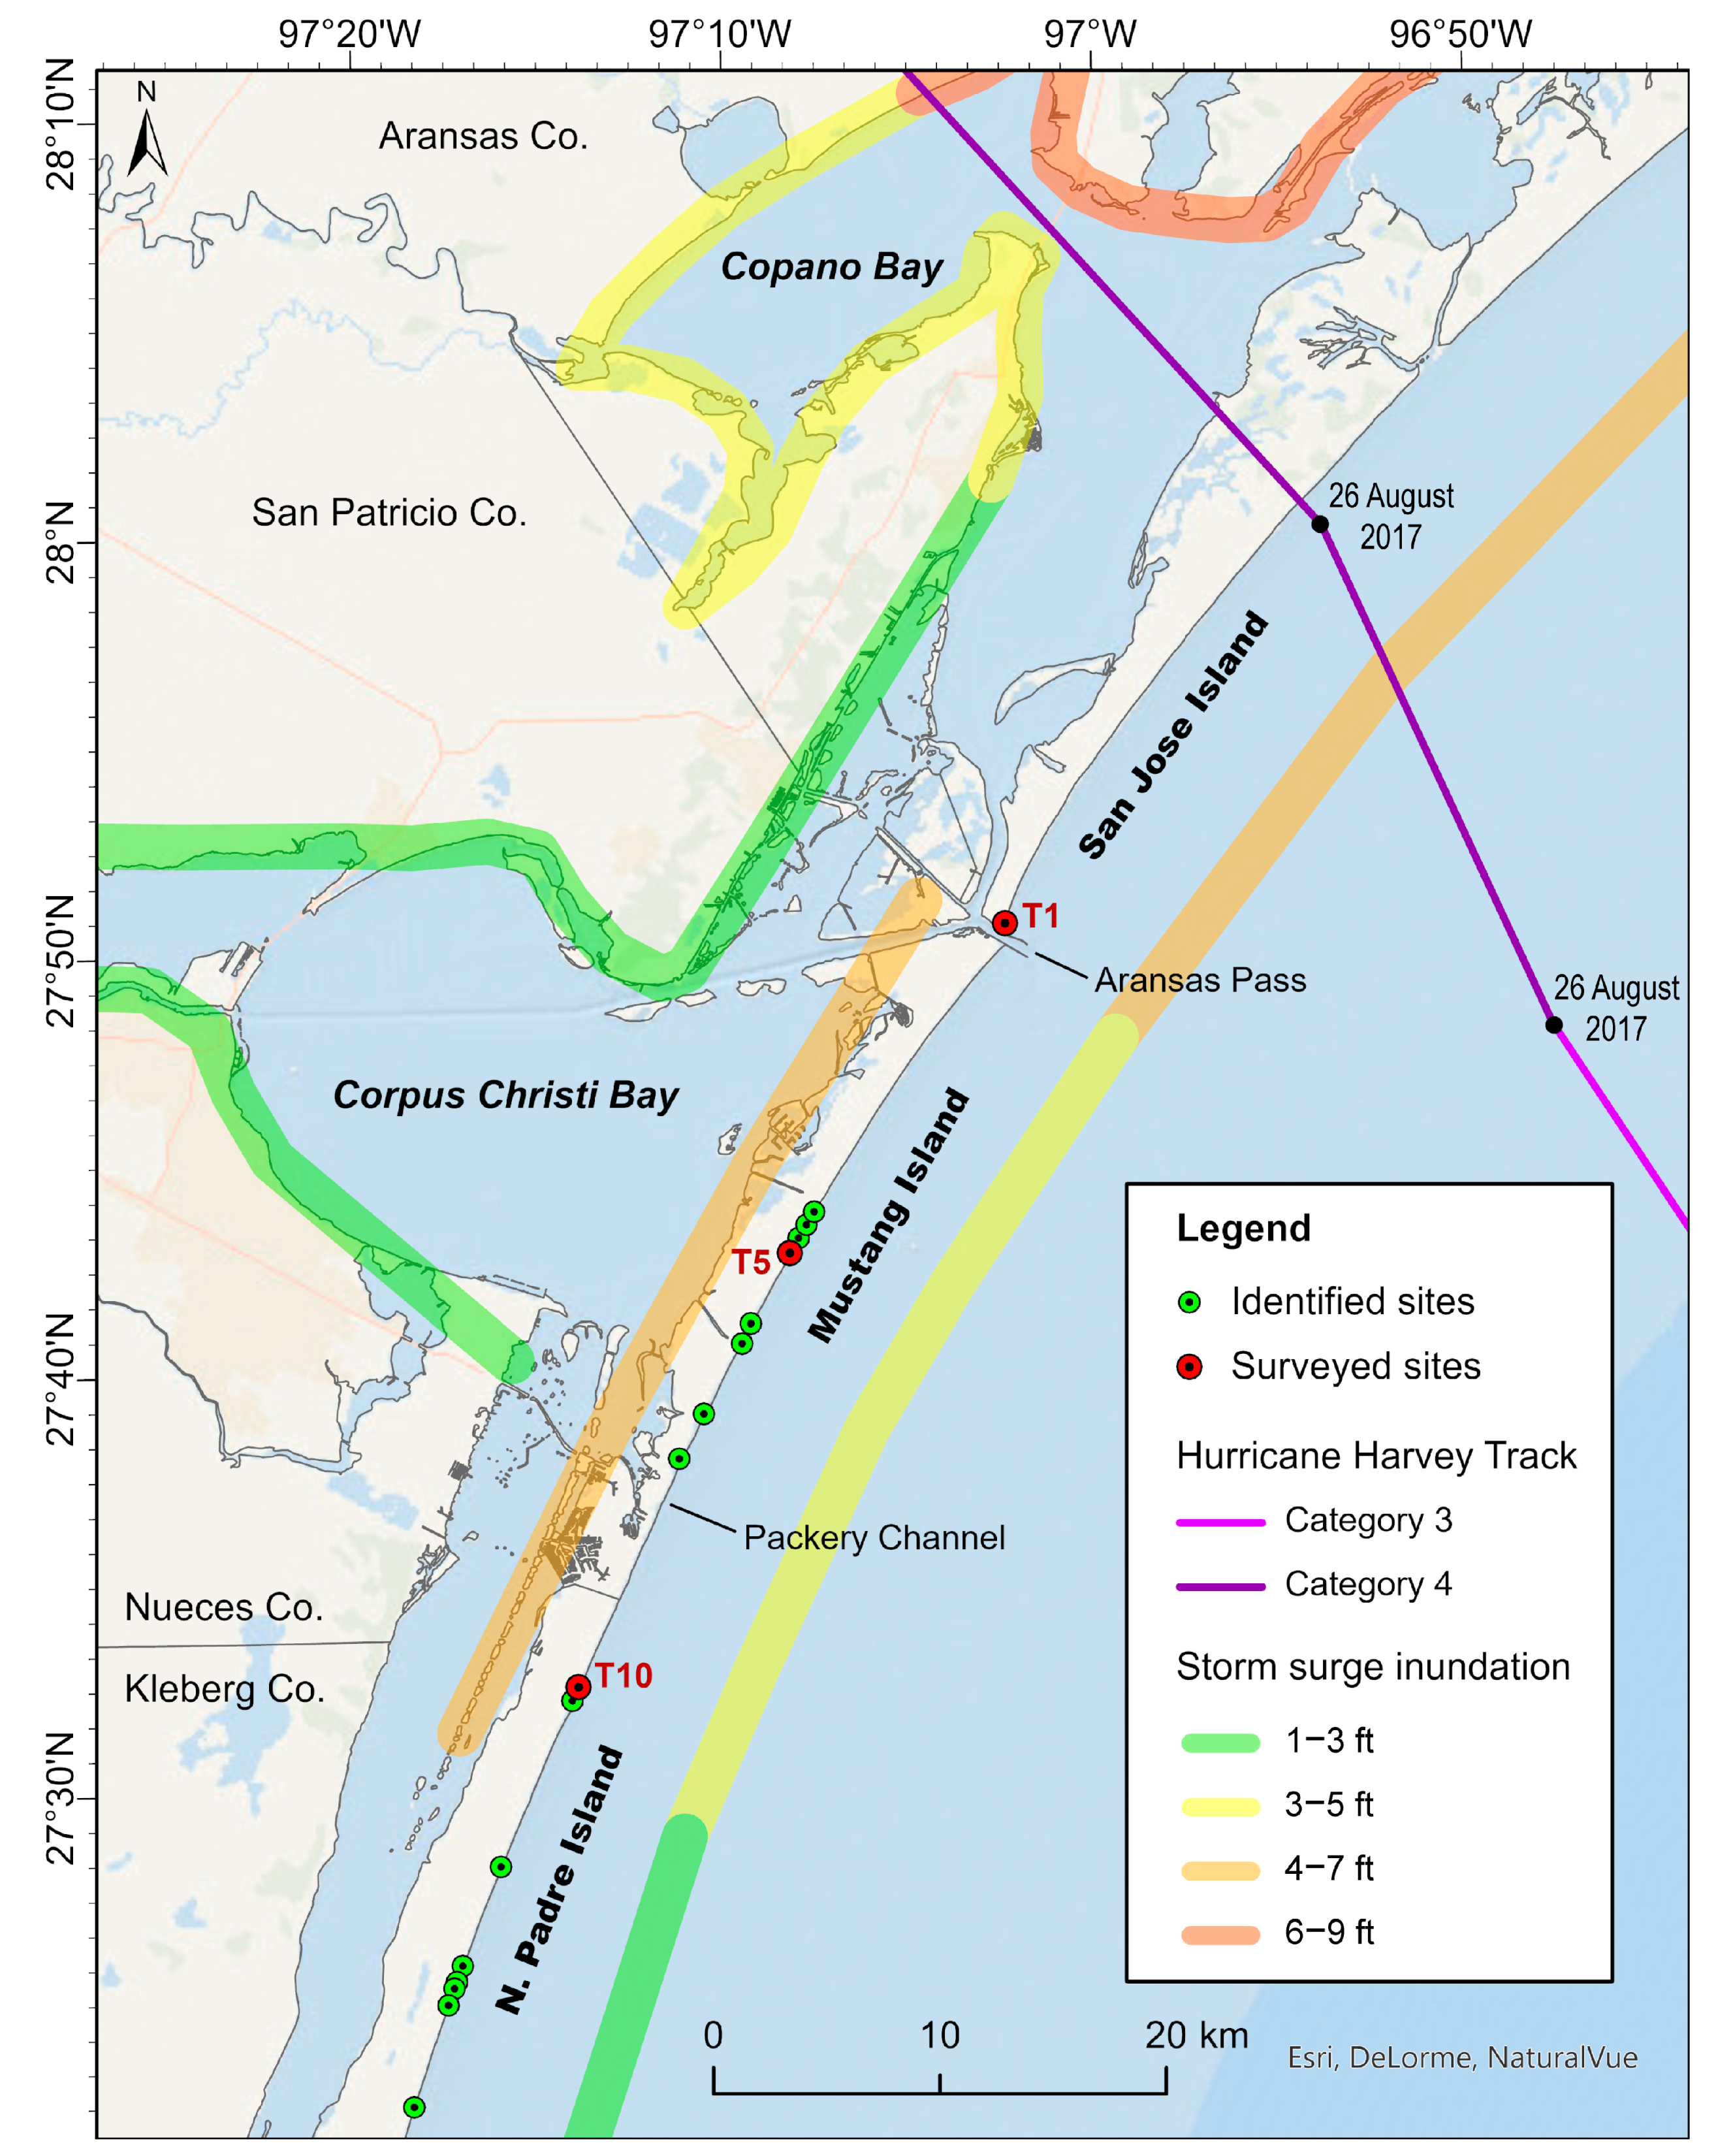
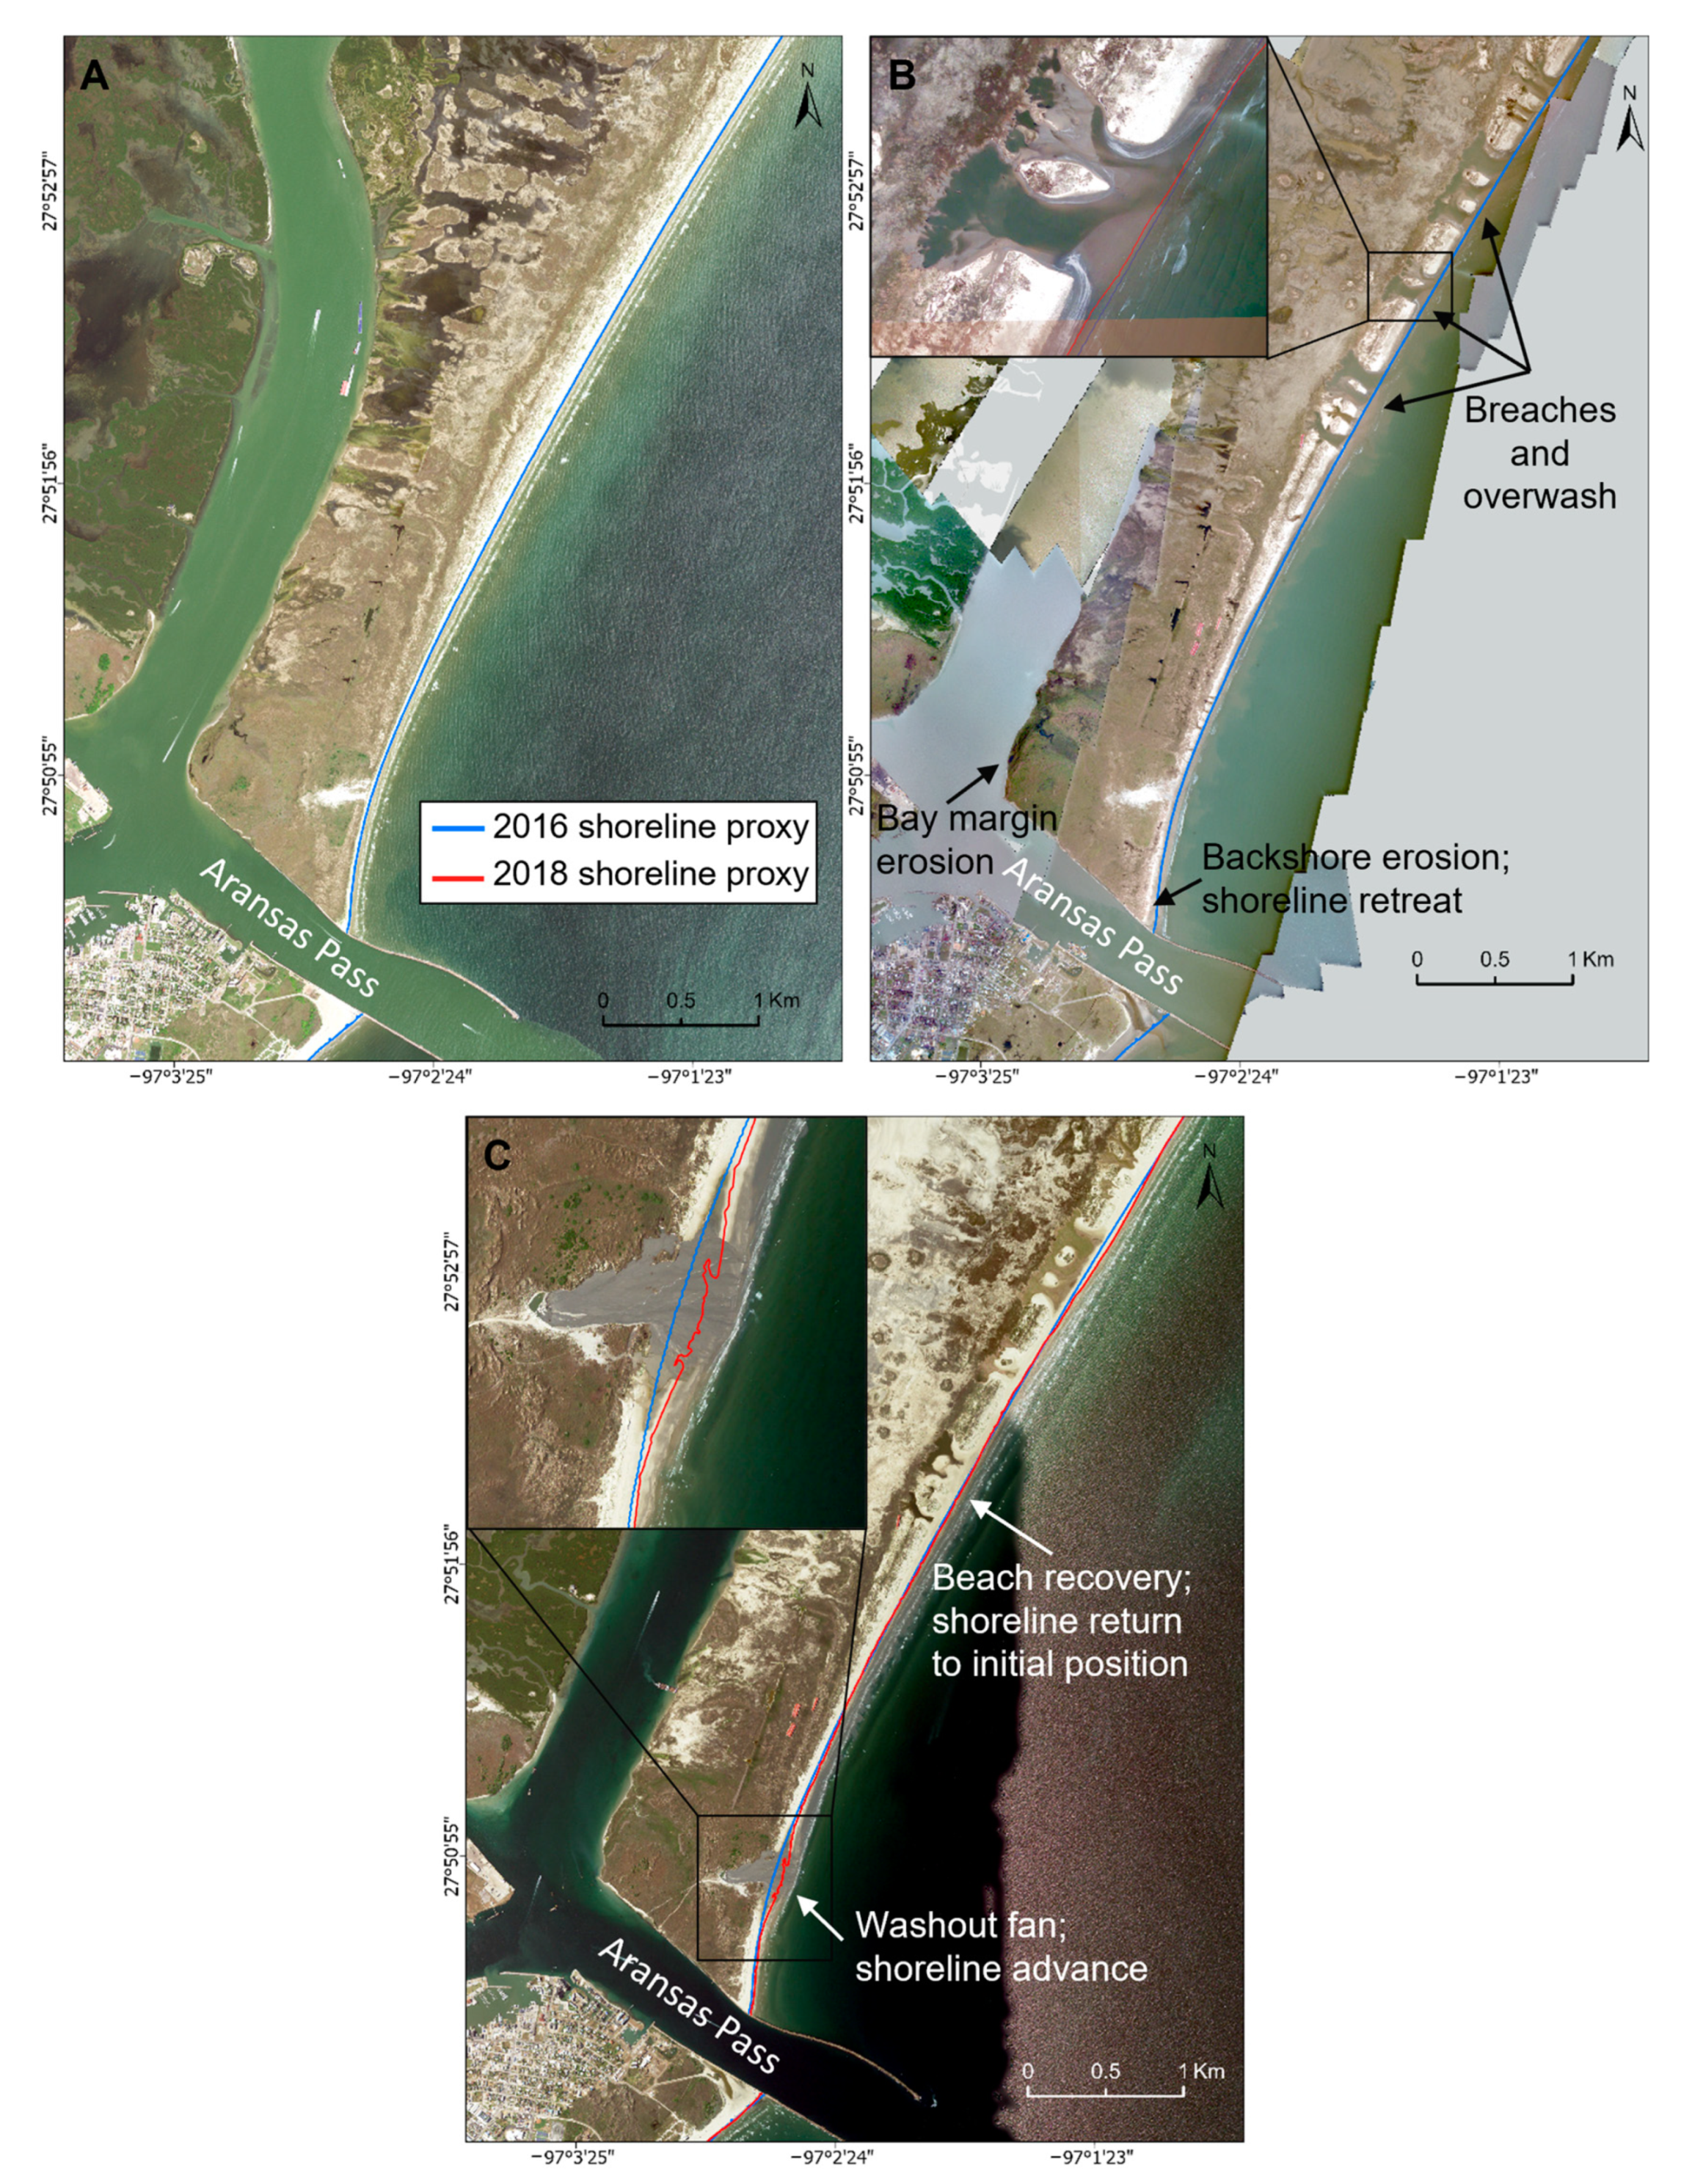
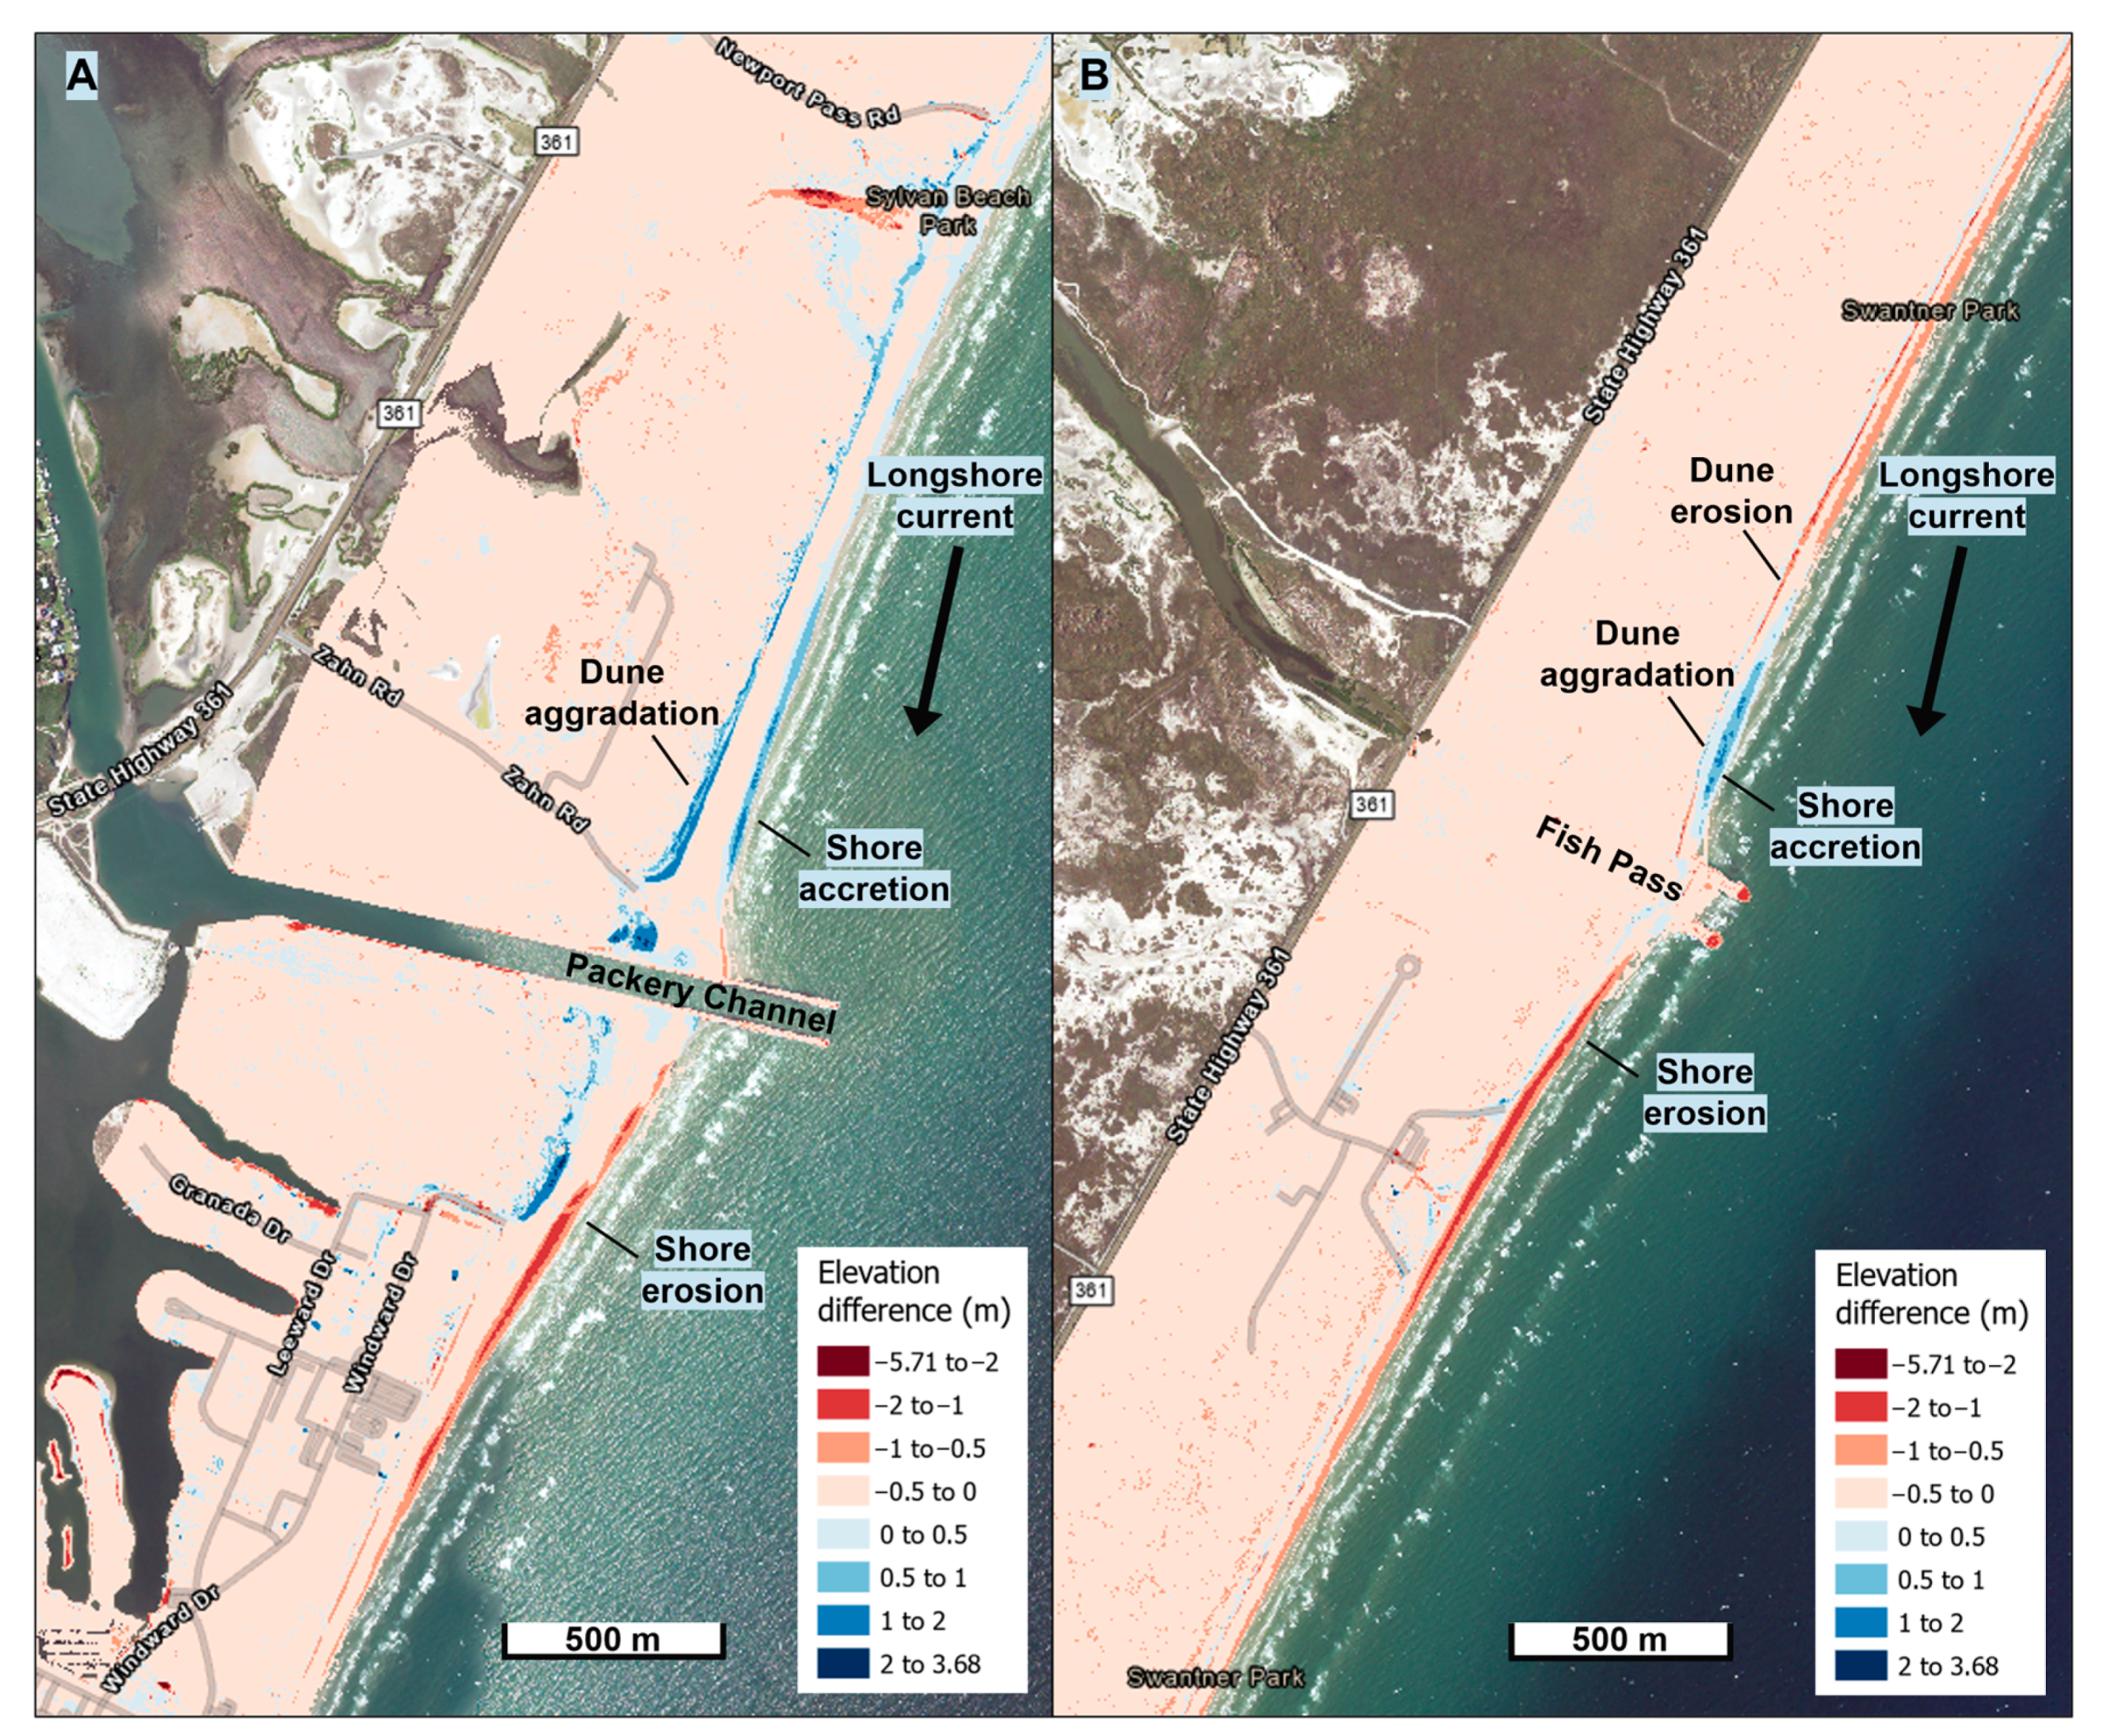
3.1. Regional Changes in Barrier Islands between 2016 and 2018

The effects of Hurricane Harvey on the coastal features of barrier islands can be seen by visual comparison of aerial images (Figure 7). Within only a couple days from landing, this hurricane caused severe (reaching tens of meters) erosional activity. At San Jose Island, many fore-island dune segments were breached (at least 10 observed on Figure 7B), causing individual and linked series of overwash extending to the barrier flats behind the foredune complexes. The backshore area was eroded, causing retreat of the shoreline. Additionally, the outflow of the storm surge through Aransas Pass caused strong alongshore currents, removing a ∼100 m wide chunk of the back-barrier area along the bay margin. Dune overwash was not observed at Mustang and North Padre Islands; instead, collision with storm waves caused scarped dunes and dune blowouts.
Post-storm states of the coastal areas can also be observed from aerial imagery. The NAIP 2018 imagery (Figure 7C) shows that the coastal features started recovering when observed approximately eight months after the landfall. Redistribution of sediment by post-storm, wave activity caused partial backfilling of the overwash areas and rebuilding of parts of the beach−foredune complex. Correspondingly, the shoreline started to move back toward its initial 2016 position and even advanced past the 2016 shoreline proxy in some areas, such as the massive washout fan near the southern tip of San Jose Island, which likely resulted from an outflow of removed sediment via the pre-existing large blowout on the barrier flat (Figure 7C).
Post-Harvey elevation changes quantified on the barrier islands of the central Texas coast show various levels or erosion and/or accretion along the shore (Figure 8A), where some sections have been impacted more than others. Particularly, the highest and most continuous amount of vertical erosion was observed on San Jose Island, reaching up to 5.7 m in dunes completely eroded by overwash. The entire foredune ridge at the southern part of this island underwent significant vertical erosion of 1.5–3.5 m (Figure 8B). Notable amounts of dune erosion were also observed at North Padre Island, but were considerably lower than San Jose Island, at around 1–1.5 m. Additionally, compared with San Jose Island, these erosional sections were not continuous and were separated by low-affected sections with 0.2–1 m erosion.
On the other hand, Mustang Island appeared to be relatively stable, with most of the island showing accretional changes (Figure 8A) and only a few 100–200 m long dune sections with considerable amounts of erosion of around 1.3 m (green and red points in Figure 1).
A few sections along the central Texas shore show accretional patterns (blue areas in Figure 8A). These areas appear to be related to protective jetties that trap sediment transported by the southward-moving longshore currents. Thus, the northern wall of these structures causes the accretion of sediment along the directly adjacent shore, while the southern side continues to erode (Figure 9). Interestingly, these processes appear to influence the development of dunes in these areas as well. For example, significant dune growth of up to 1.7 m was observed on the foredune line north of Packery Channel (Figure 9A). Local depositional events, such as the washout fan shown in Figure 7C and Figure 8B, could also significantly contribute to backshore accretion (up to 1.5 m on San Jose Island).
Similar destructive and constructive trends were observed from the shoreline change maps (Figure 10). The shoreline retreat was the highest (30–59 m) on San Jose Island, and this high impact extended for ~13 km alongshore toward the south (Figure 10A). Net shoreline movement (Figure 10A) and its rate (Figure 10B) decreased toward the south away from the landfall, with predominantly <10 m retreat in the Mustang and North Padre Islands.
A statistical summary of the shoreline change rates is shown in Table 3. Almost 90% of the central Texas coast was erosional, with an average retreat of 16.2 m (10.7 m/yr). Almost a quarter of the shore experienced statistically significant levels of erosion (i.e., the percentage of all transects that have a negative rate that has a larger magnitude than the uncertainty [41]), such as the maximum retreat of 69 m at San Jose Island due to the impact of Hurricane Harvey. Accretional transects, found adjacent to jetties, comprised a small portion (12.3%) of the coast, and only one-third of these sections experienced significant accretion (i.e., the washout fan on the southern tip of San Jose Island that caused the maximum shoreline advance of 62.7 m). Finally, the net movement of the shoreline after the passing of Hurricane Harvey (between 2016 and 2018) averaged at a retreat of 12.6 m and a rate of 8.3 m/yr.

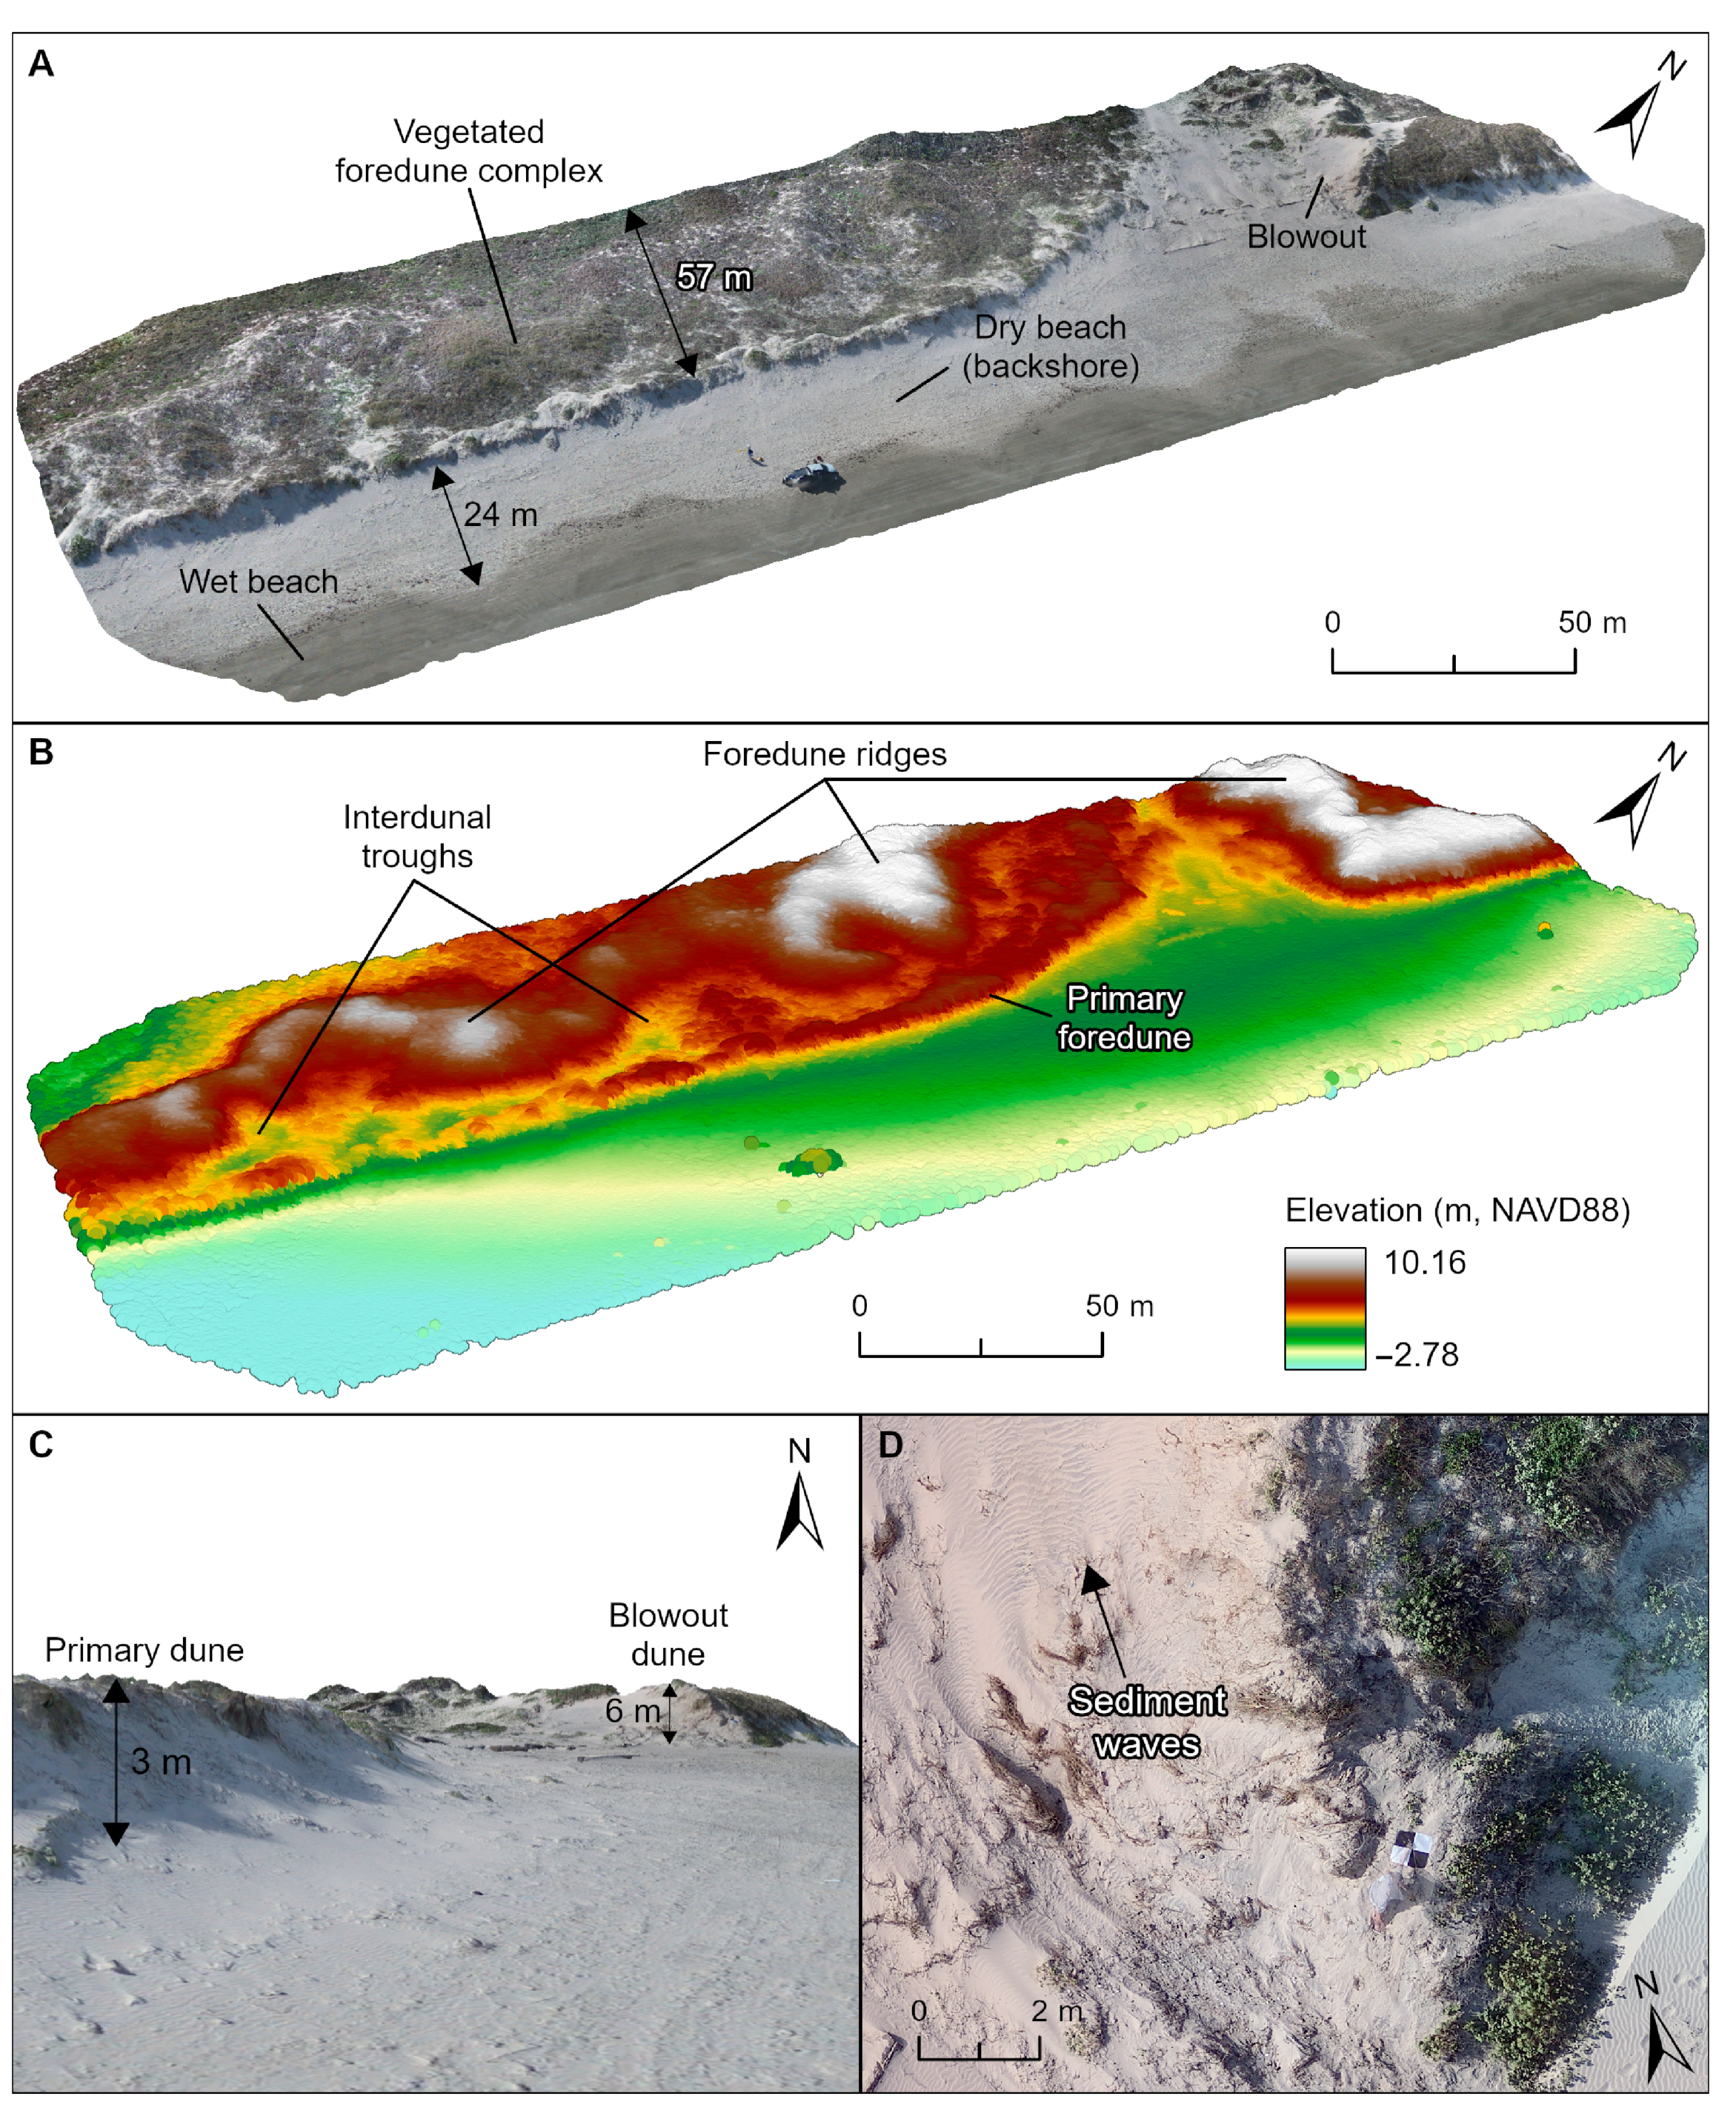
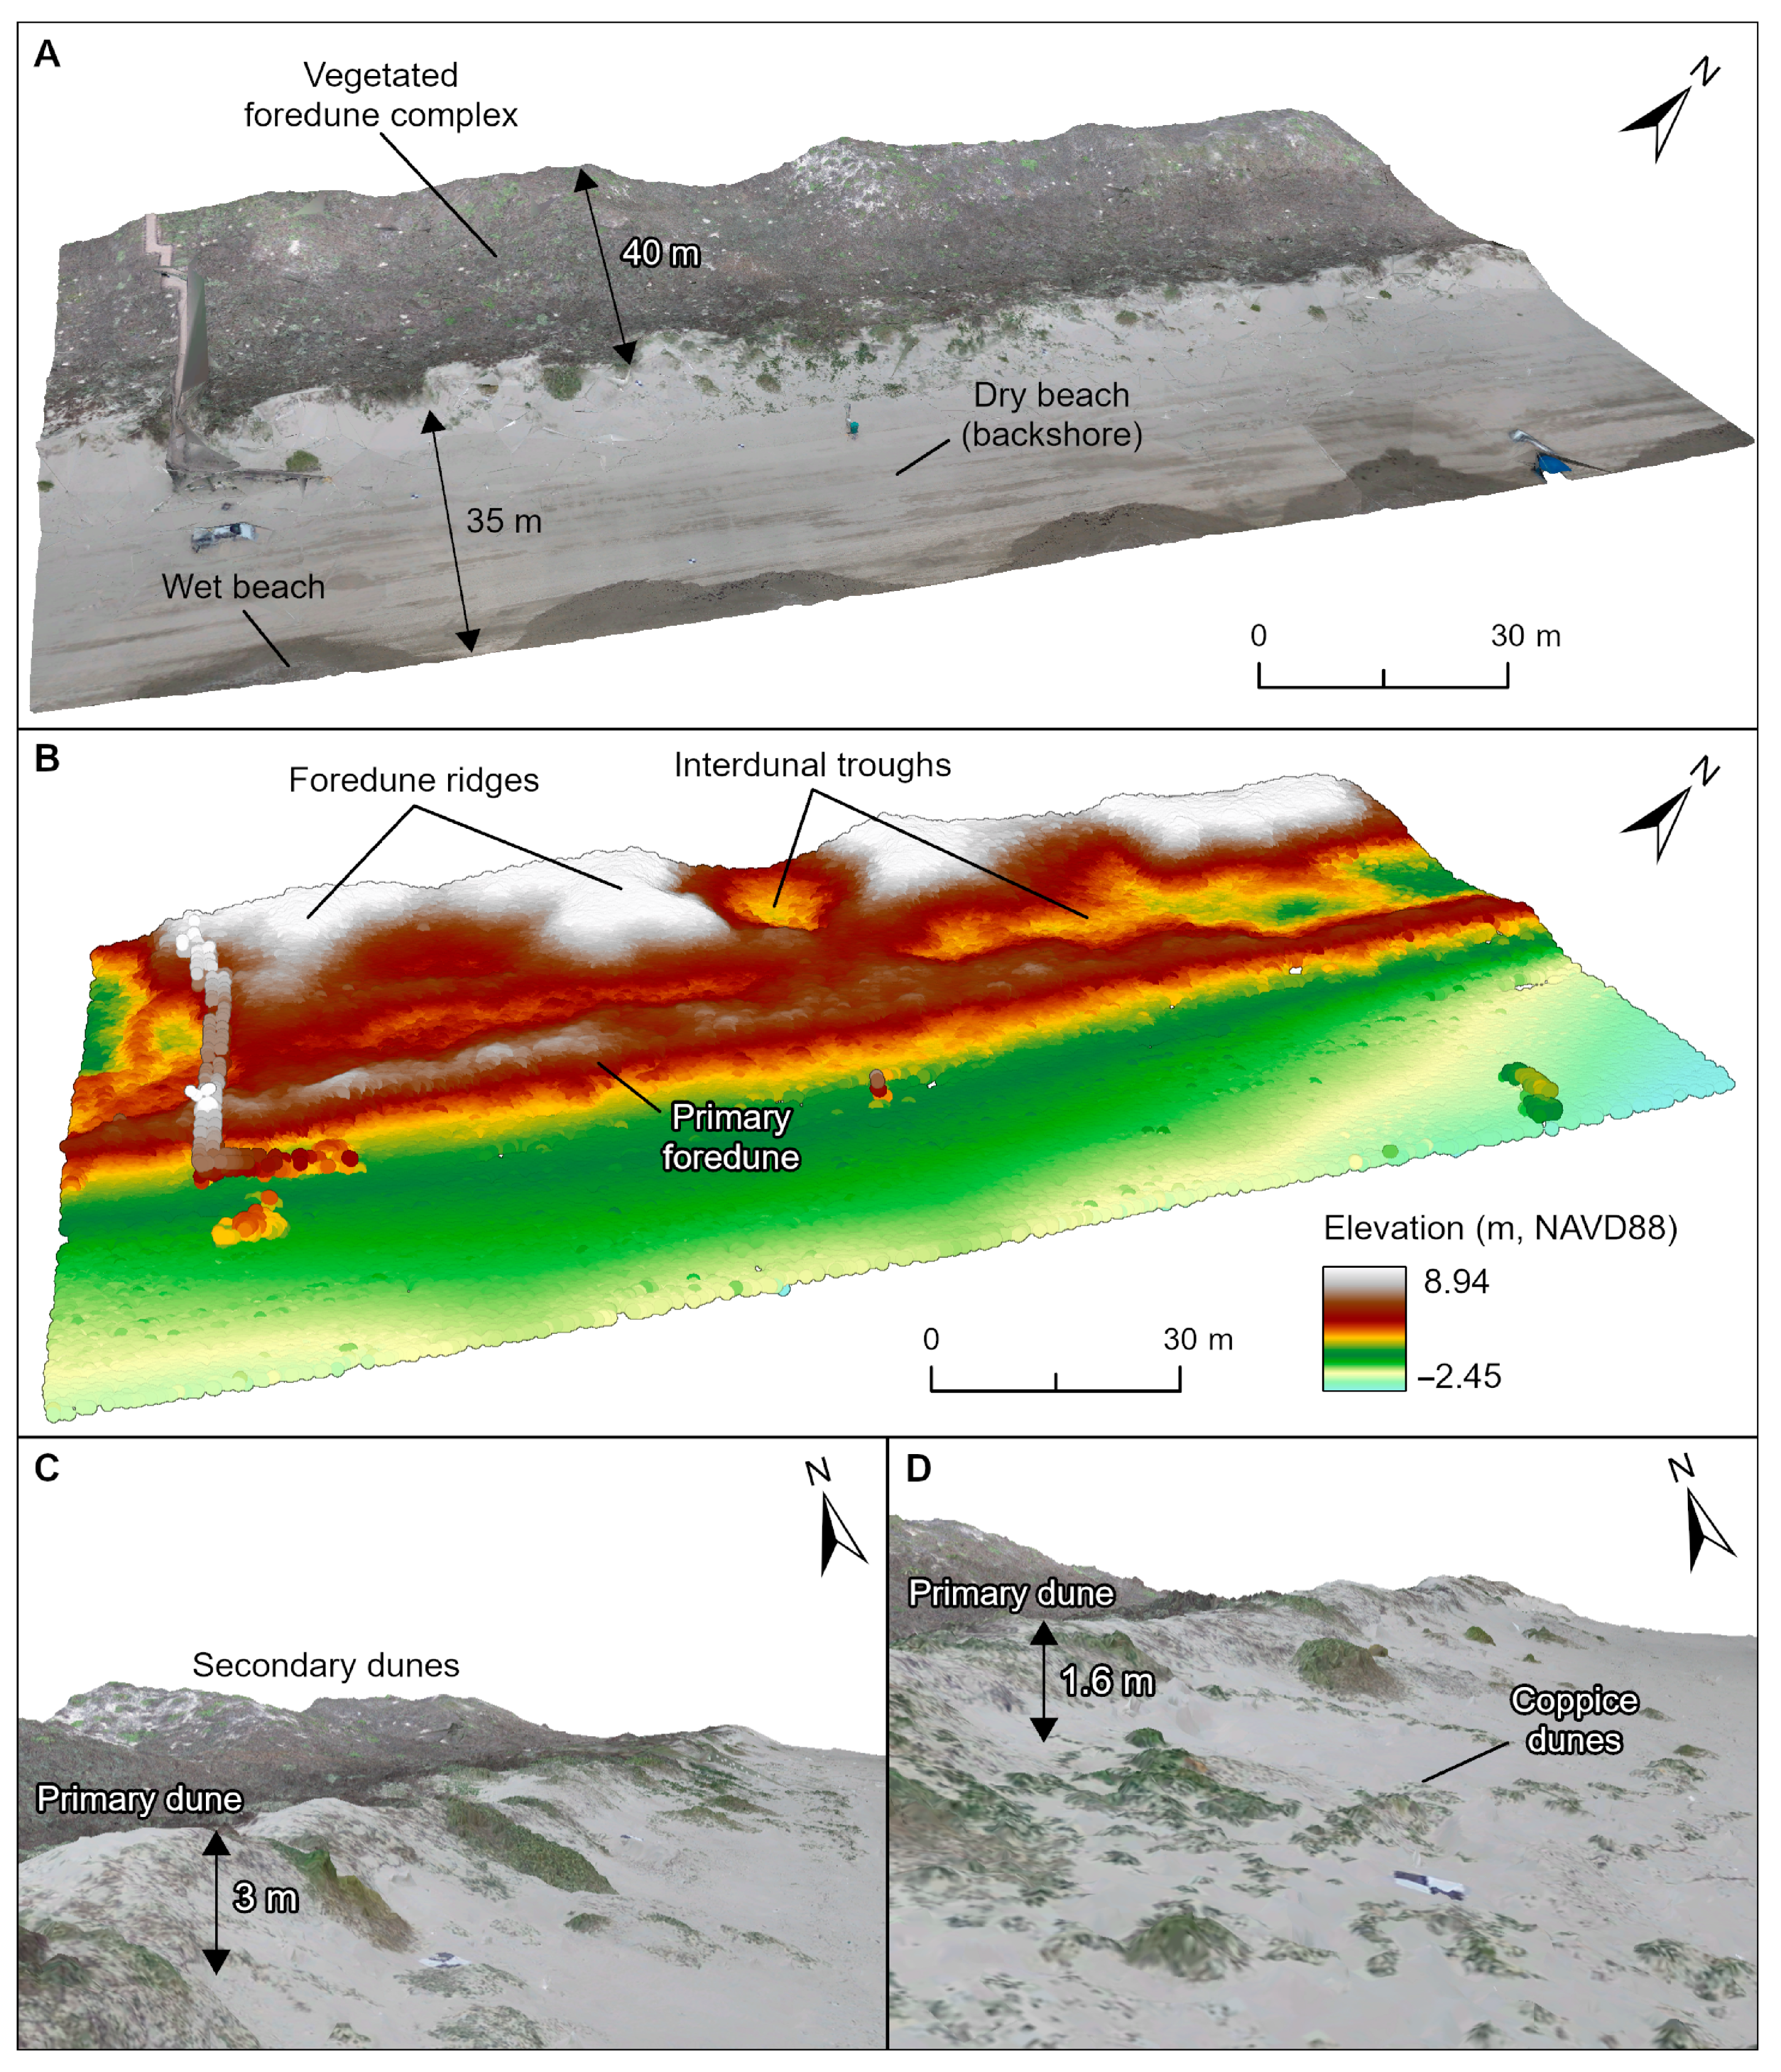
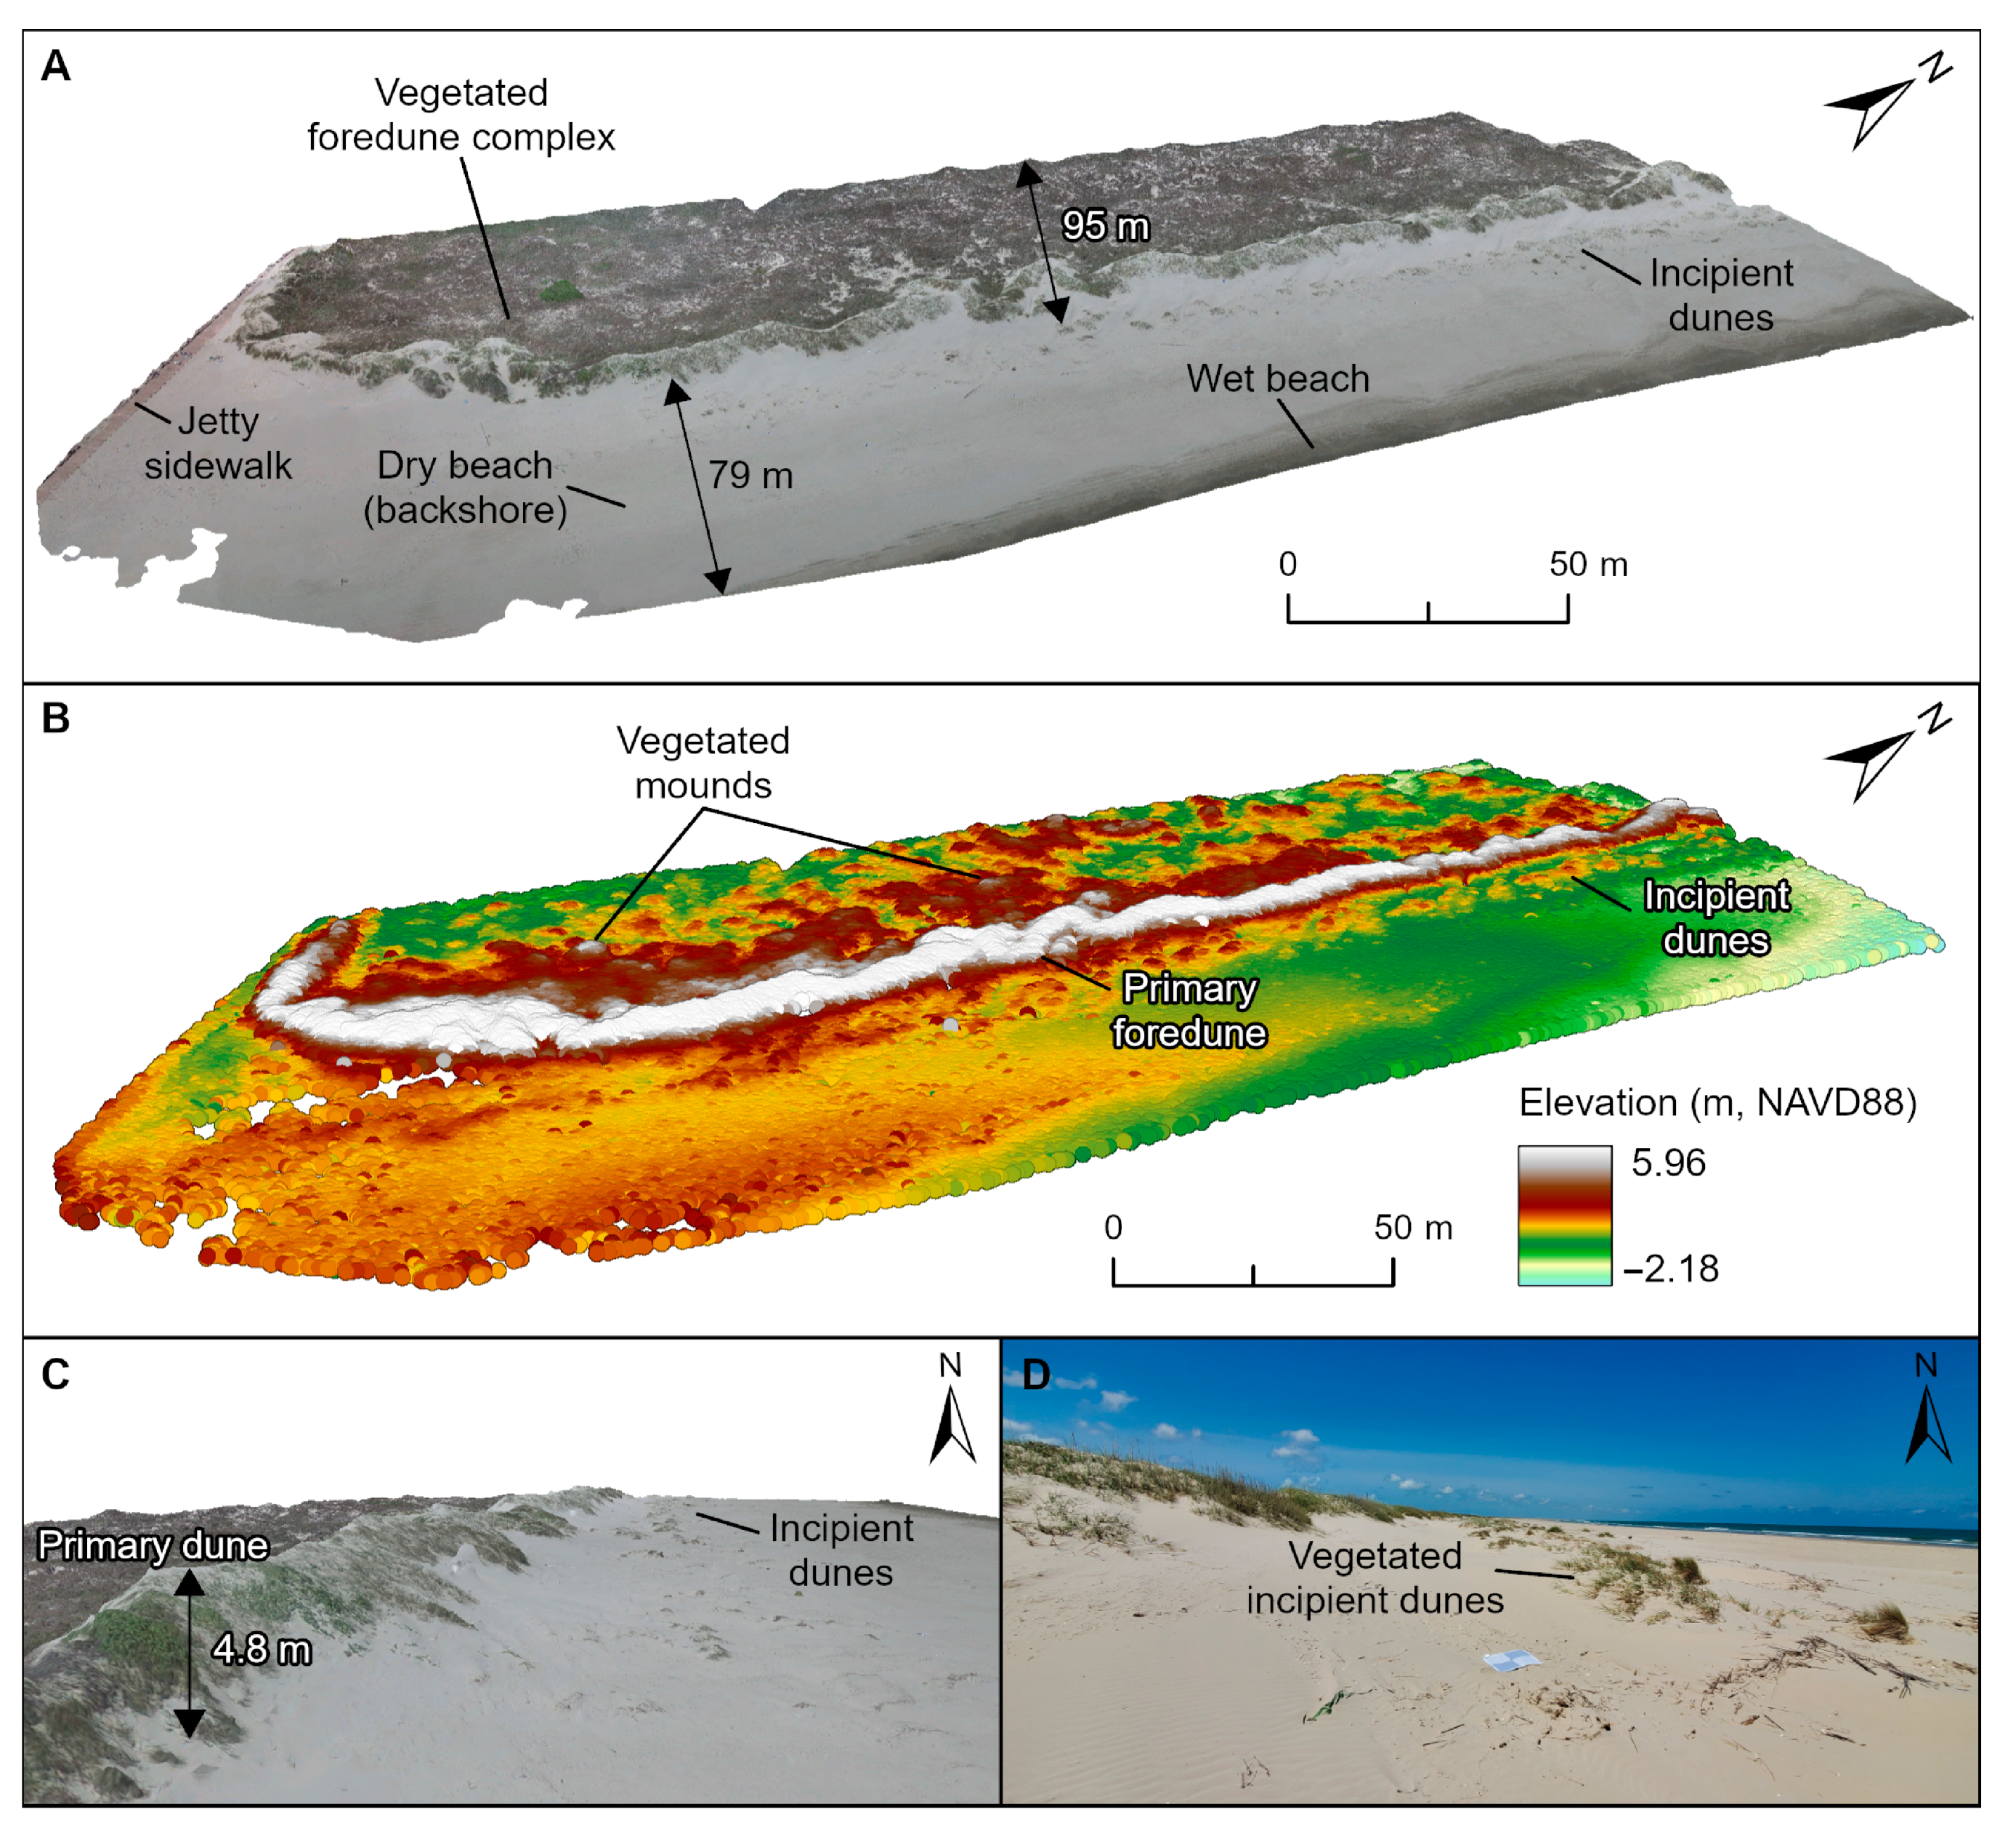
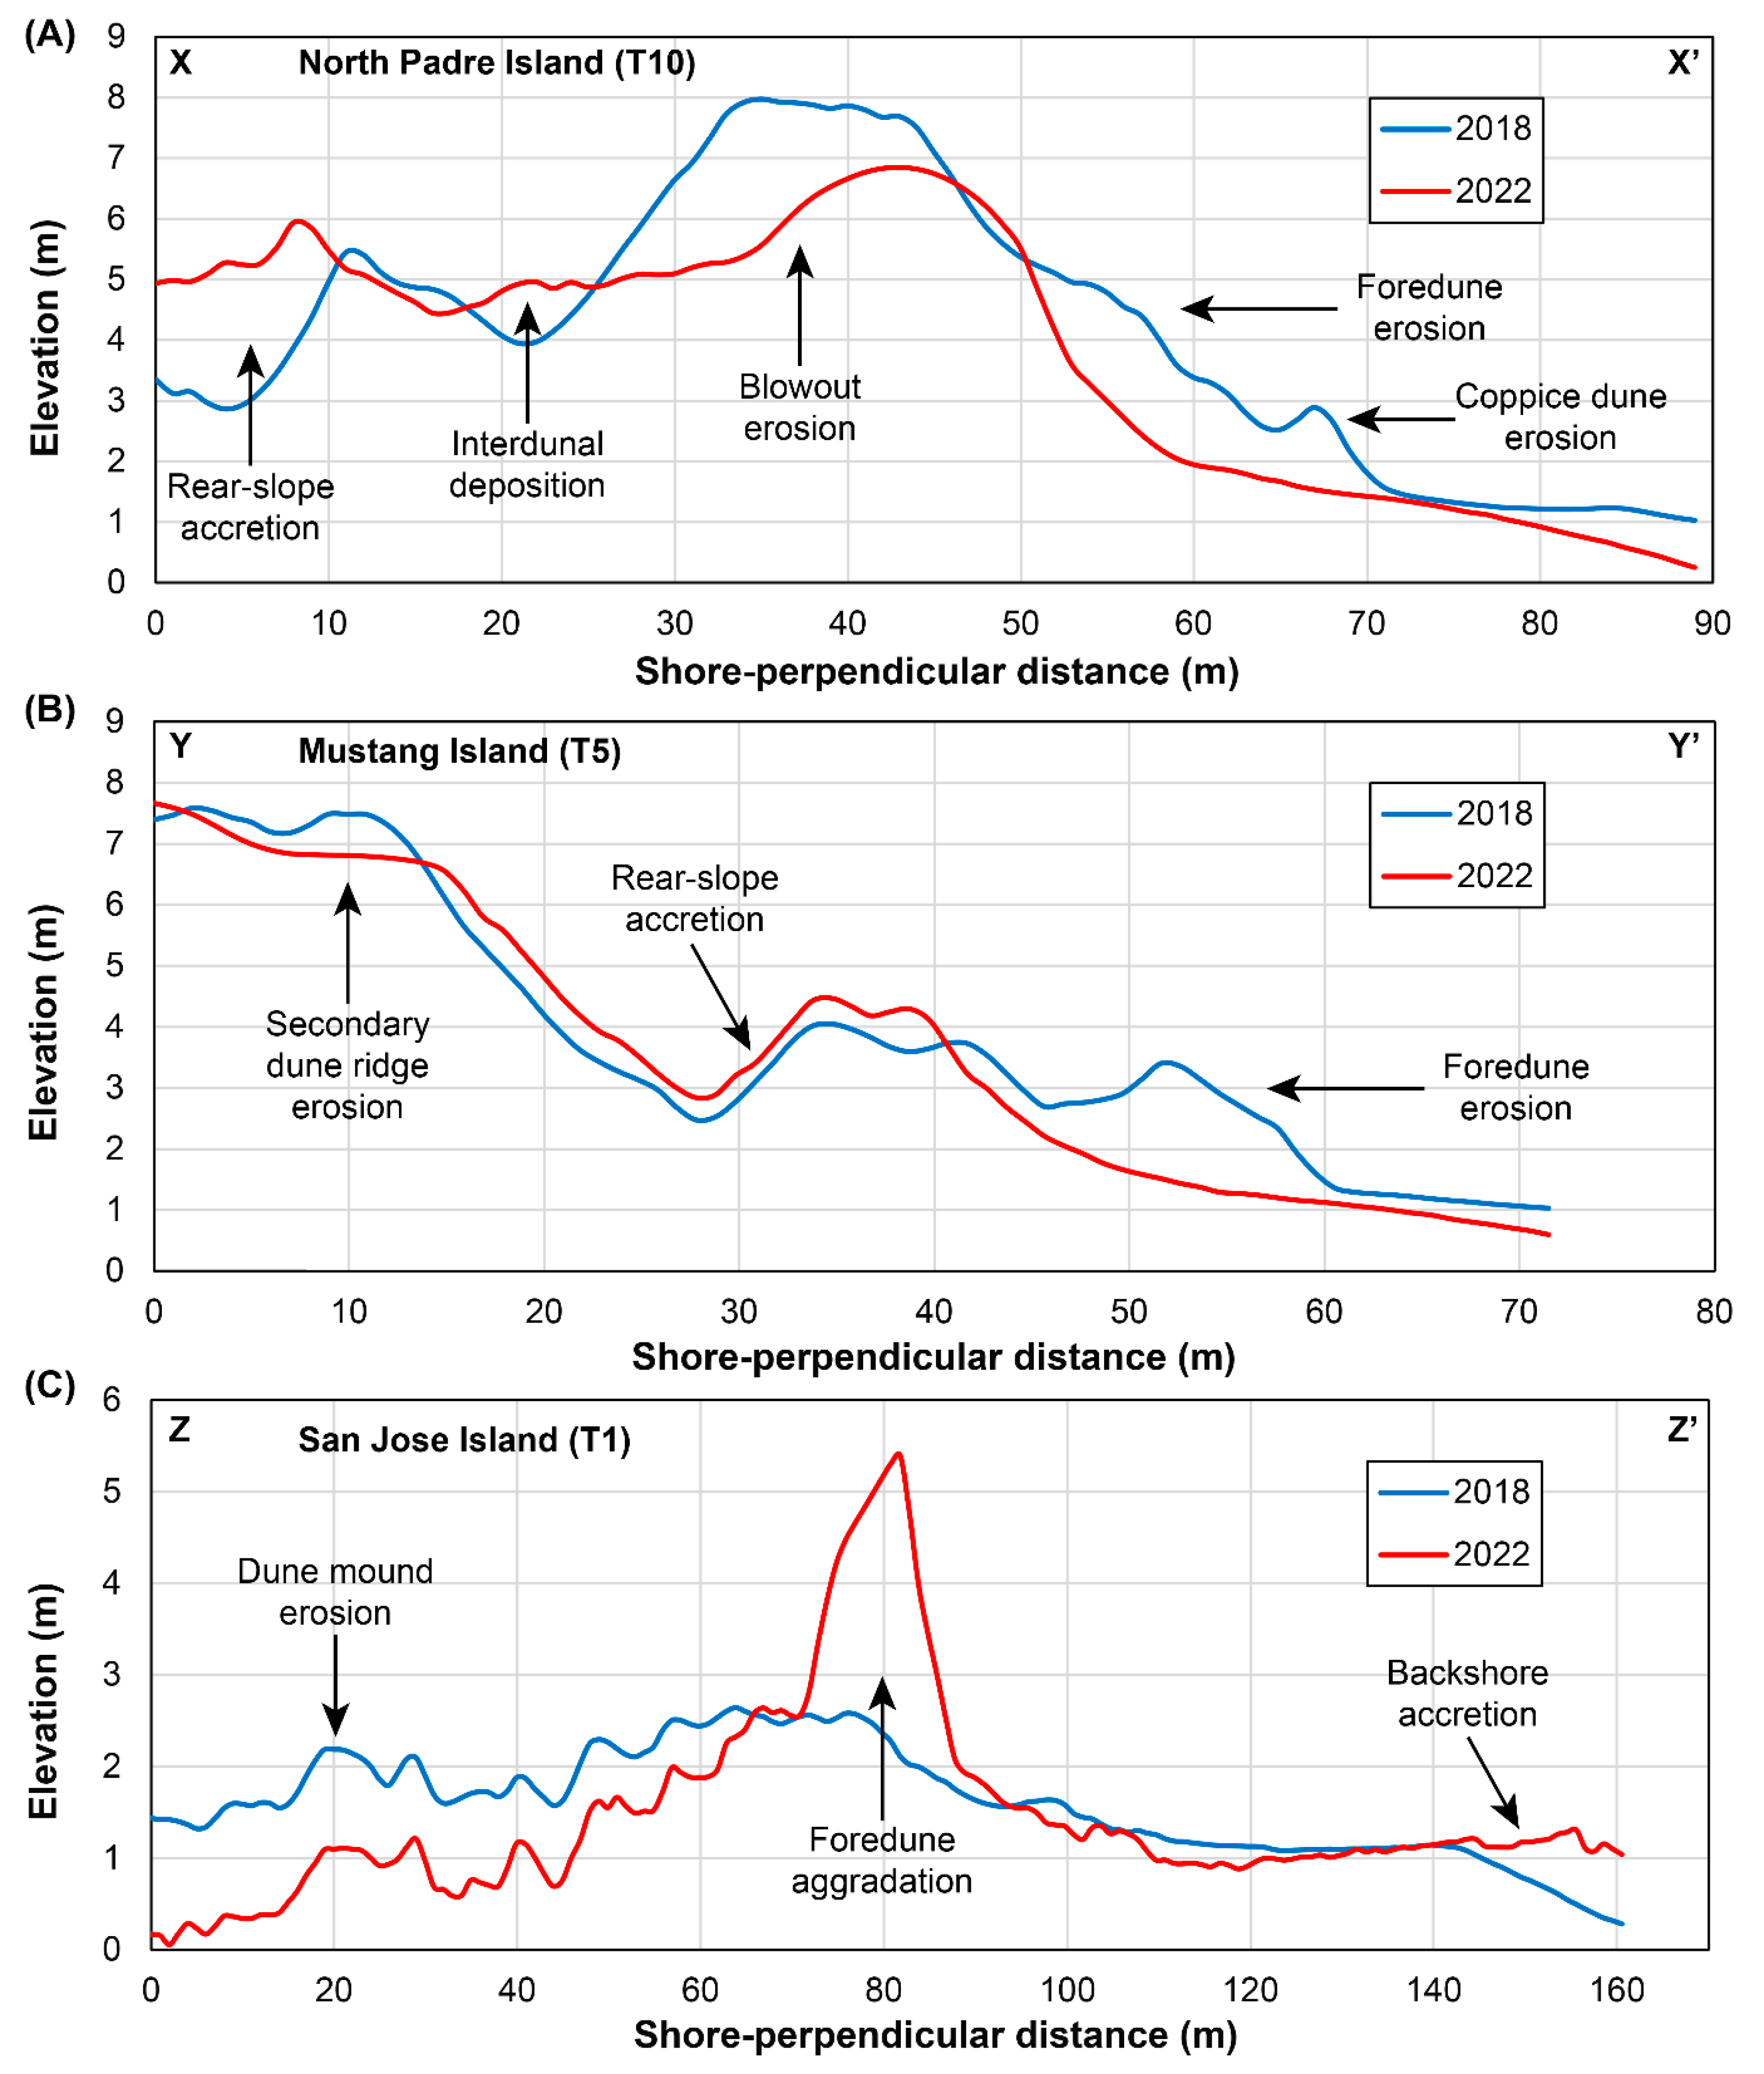
3.2. Geomorphologies of Beach-Foredune Complexes

The studied sites on the North Padre, Mustang, and San Jose Islands show varied geomorphologies based on observations of topographic products derived from UAV data collected in May 2022 (Table 2).
Site T10 on North Padre Island is characterized by a greater than 80 m wide beach−foredune complex (Figure 11). It has a relatively narrow dry beach with a width of 24 m (Figure 11A). The vegetated foredune complex is 57 m wide, and consists of a foremost, linear primary dune, and a taller, curved (wavy) secondary dune ridge behind it, forming a ridge-and-swale system with interdunal troughs (Figure 11B). The primary dune ridge ranges from 5–8 m in width and ~3 m in height alongshore to ~20 m in width and ~6 m in height on a blowout (Figure 11C), which is present on the northern end of the site (Figure 11A). The blowout is characterized by large, 1 m long erosion features that point toward the dune, indicating active, landward sand transport (Figure 11D).
Site T5 on Mustang Island is characterized by a >75 m wide beach−foredune complex (Figure 12). It has a wider dry beach with a width of 35 m (Figure 12A). The vegetated foredune complex is over 40 m wide, and consists of a linear primary dune and a series of large, mound-shaped secondary dunes behind it, which are separated by interdunal troughs that form deep (5–6 m) depocenters (Figure 12B). The primary dune ridge ranges from 7 m in width and 3 m in height at the southern end to 3 m in width and ~1.6 m in height at the northern end of the site (Figure 12C). The northern part is also characterized by small, relatively flat coppice dunes that are scattered at the base of the primary foredune (Figure 12D).
Compared with the North Padre and Mustang sites, site T1 on San Jose is characterized by a wider (174 m) beach−foredune complex, owing to its wide dry beach (79 m) (Figure 13A). The foredune complex here is ~95 m wide and consists of a single, mostly linear primary foredune, with a chain of short, incipient dunes in front of it, and small, isolated, vegetated mounds behind it (Figure 13B). The primary foredune ridge ranges between 10–23 m in width and 2.5–5 m in height (Figure 13C). The incipient dunes are up to 0.5 m in height and form a vegetated row approximately 8 m in front of the primary foredune. They are more pronounced than the coppice dunes observed at the T5 site on Mustang Island (Figure 12D).

4. Discussion

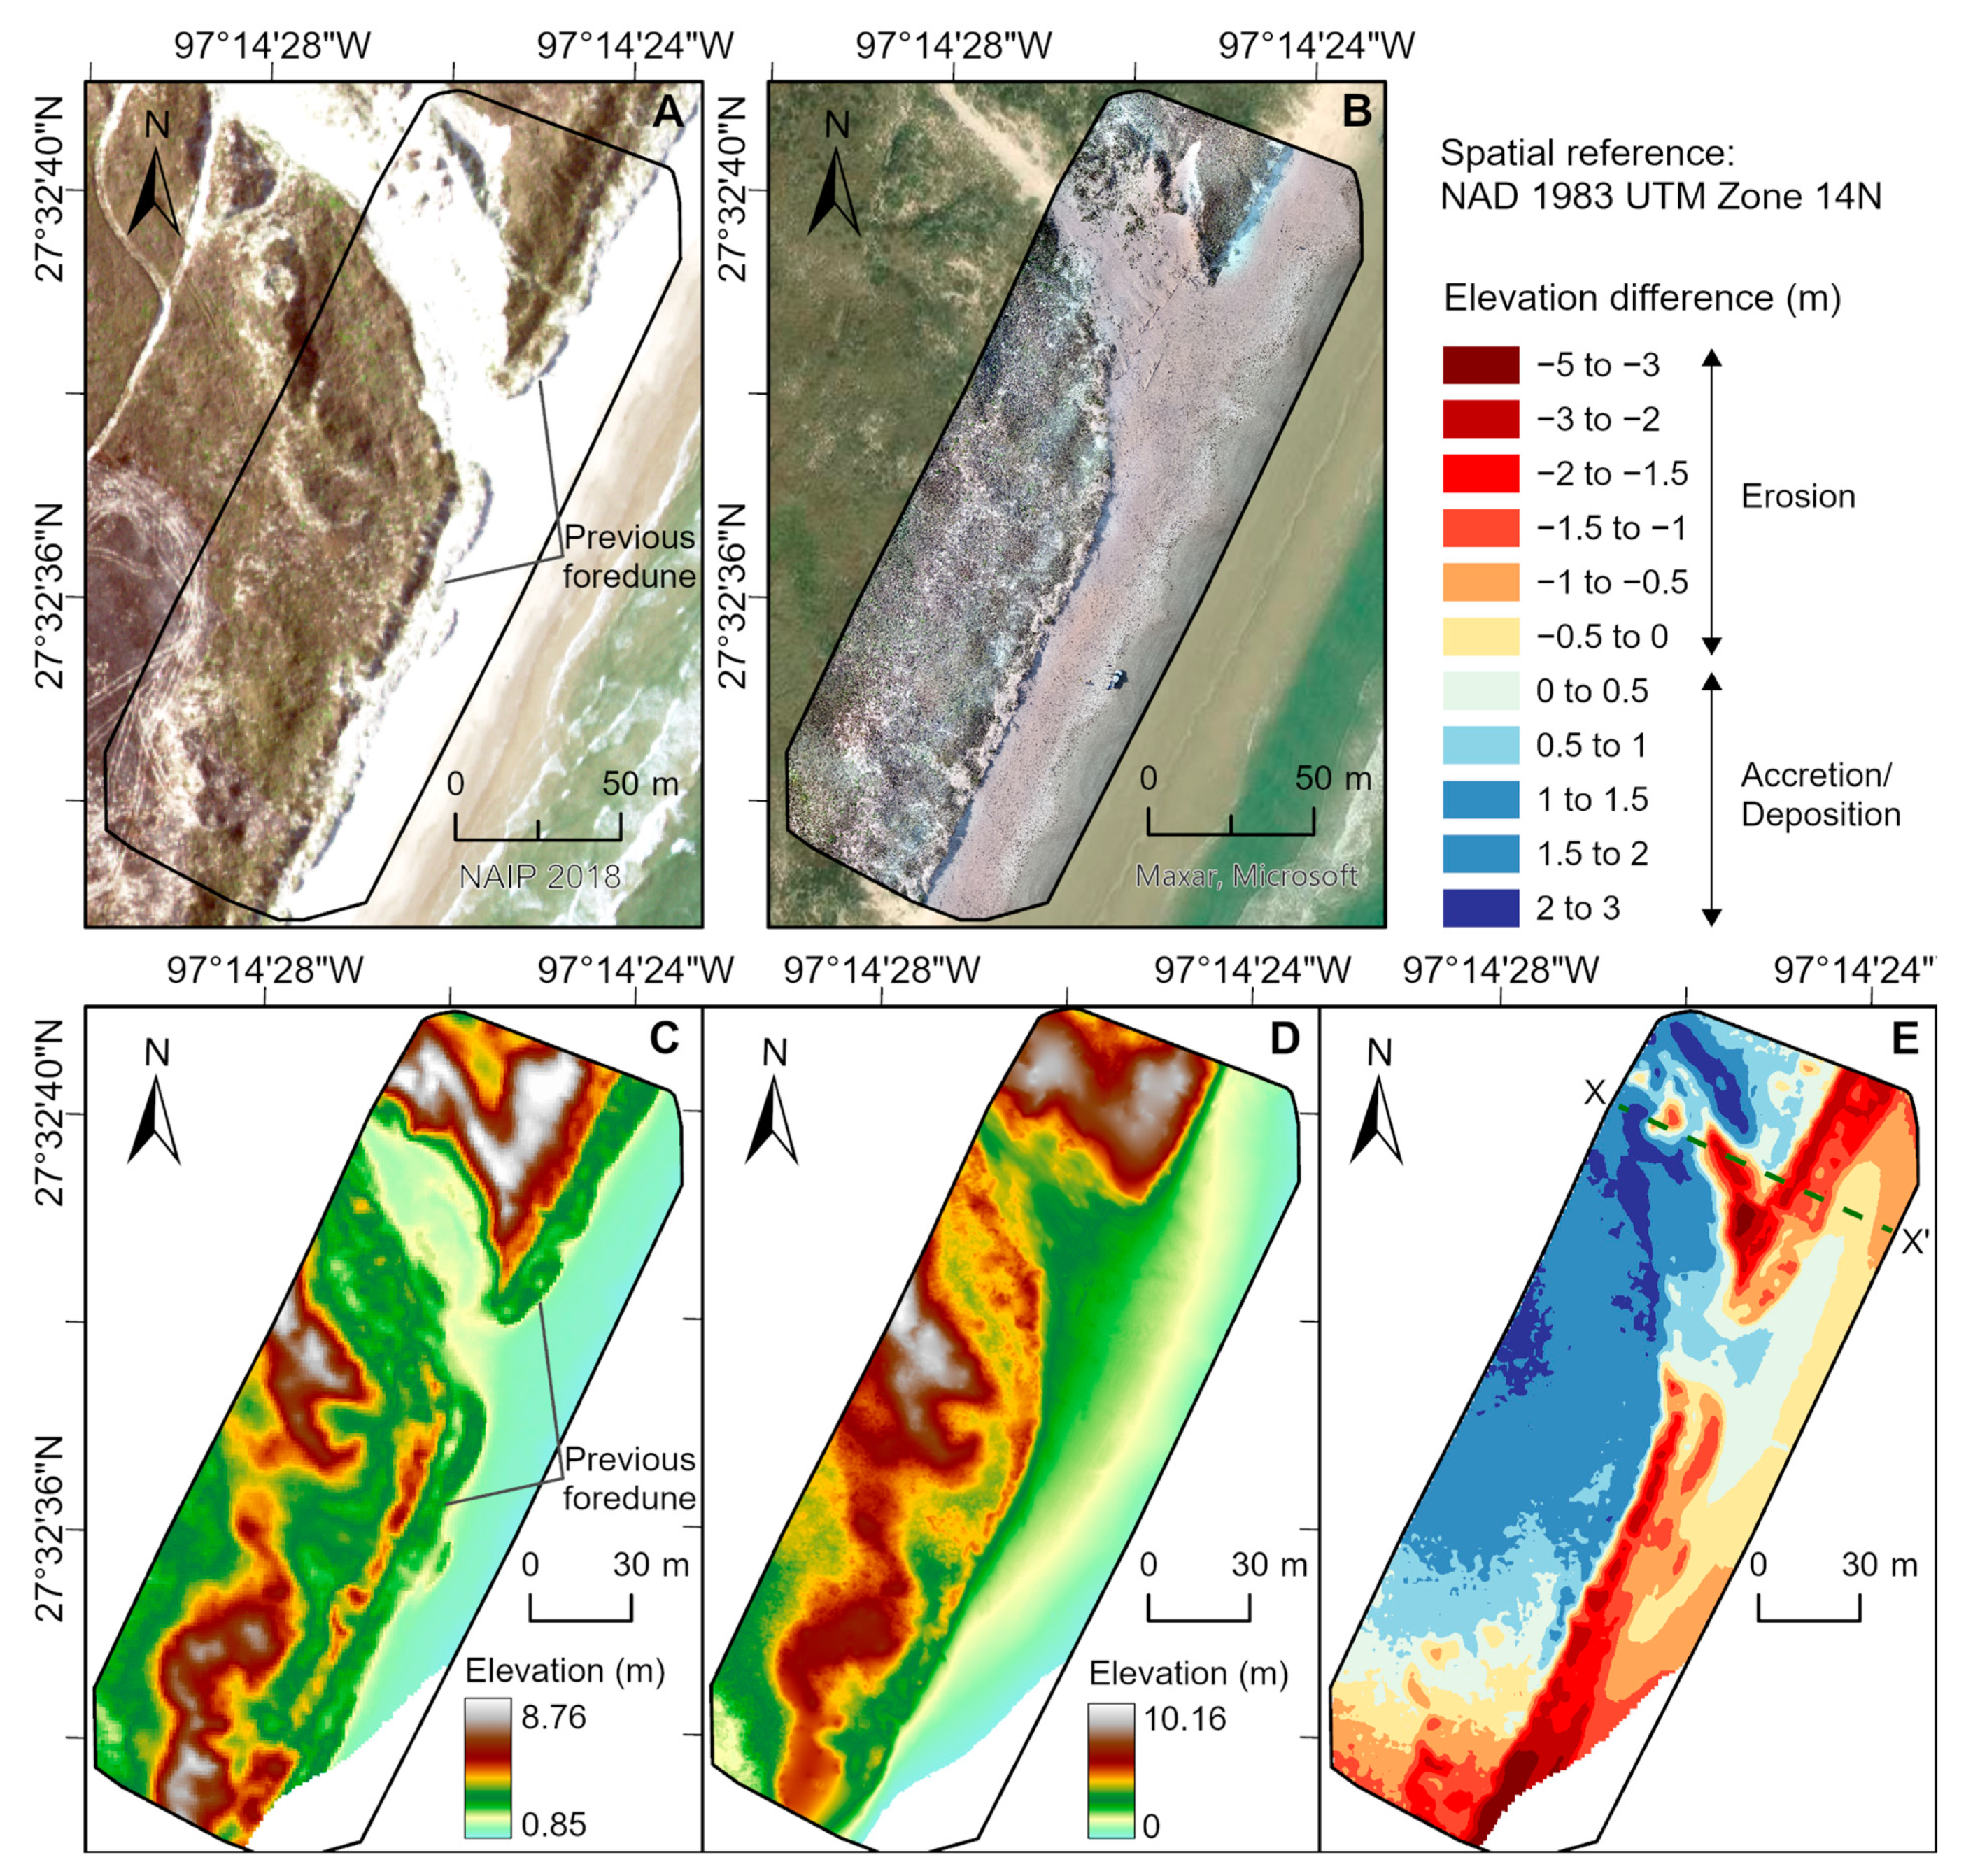
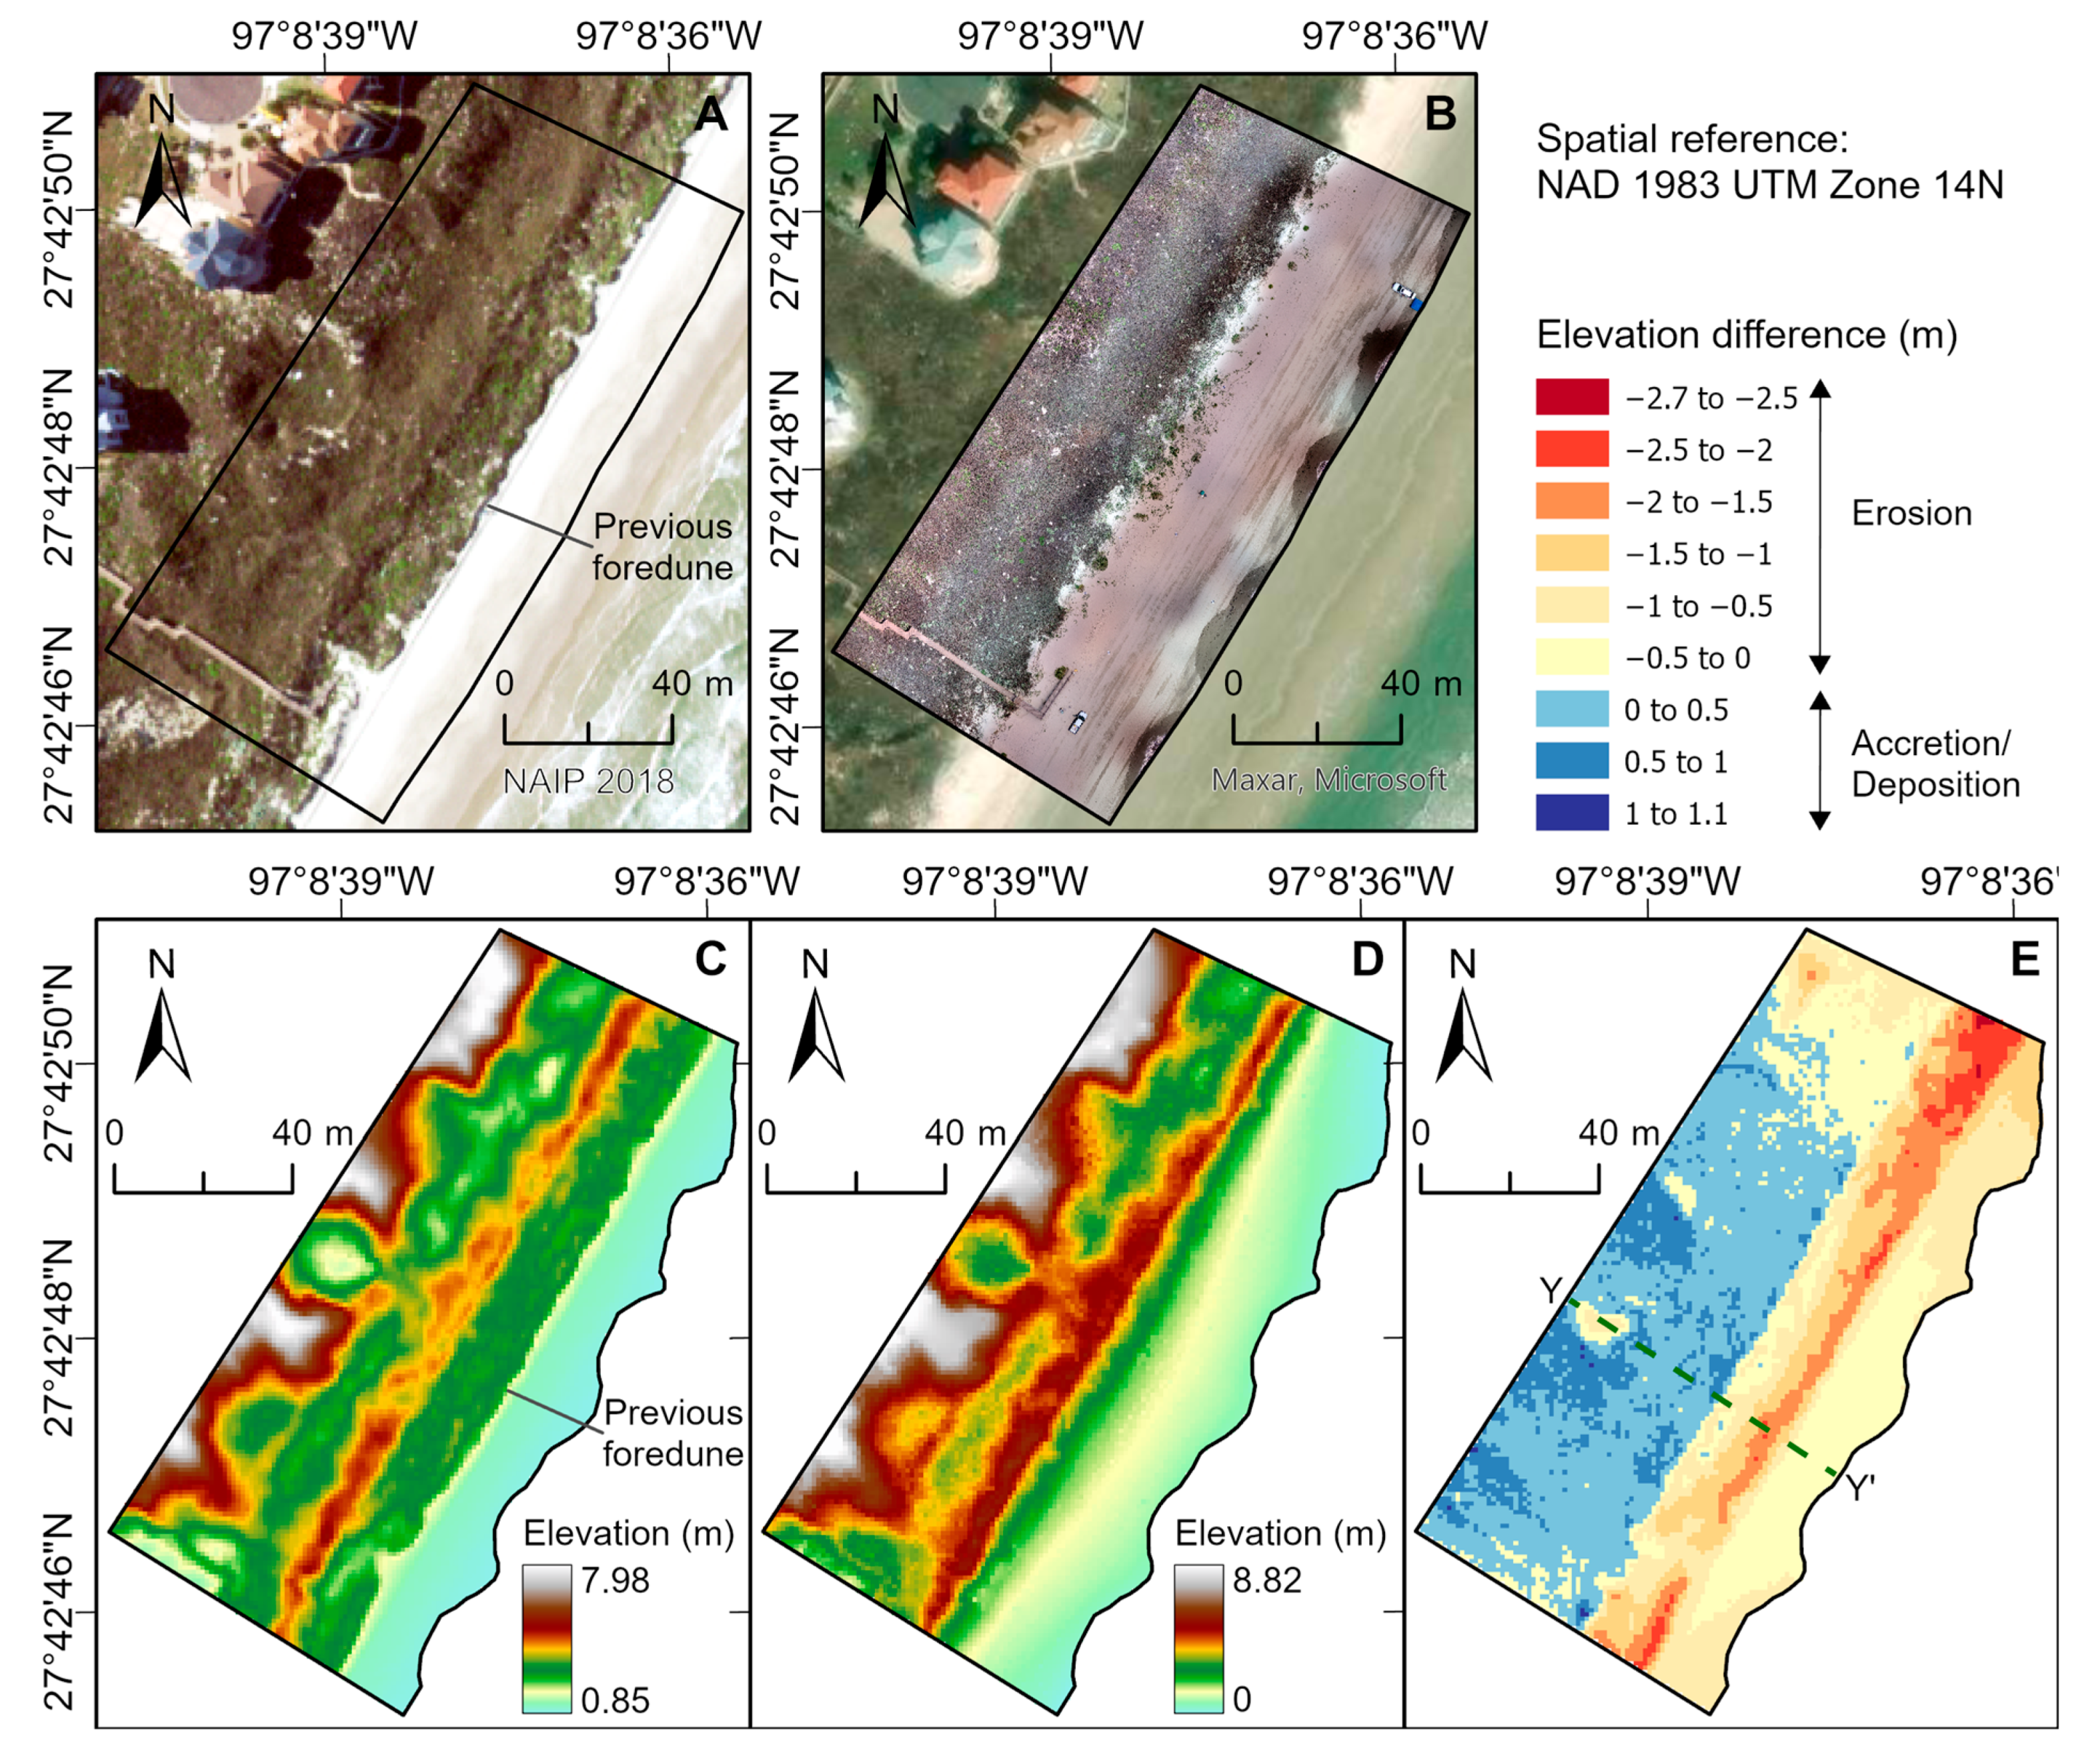
4.1. Local Changes in Dunes and Beaches between 2018 and 2022

Elevation difference maps between 2018 and 2022 (Figure 14, Figure 15 and Figure 16) show areas of net erosion and accretion or deposition at the beach−foredune complexes.
Site T10 shows that the back-beach and primary foredune were significantly eroded over time (Figure 14). The previous primary foredune ridge (Figure 14A,C) eroded and retreated landward by 12–14 m (Figure 14D), resulting in a significant vertical erosion of 1.5–3 m along the foredune (Figure 14E). The highest amount of erosion, reaching 4 m, can be observed on the blowout dune at the northern end of the site. The presence of the blowout from 2018 onward, with recent sediment waves, and the high levels of erosion indicate active erosion of this area and its susceptibility to storm events.
However, the secondary foredune system, behind the primary foredune, shows positive elevation change, indicating accretion and/or deposition (Figure 14E). Deposition is likely linked to the ridge-and-swale geometry of this system, where interdunal troughs act as sinks, capturing the sediment eroded from the surrounding, tall dunes. Such erosion is observed on top of the secondary dune ridges on the southern and northern end of site T10 (Figure 14D,E). Significant accretion (~2.5 m) also occurred on the secondary dunes, such as the northwest trending dune ridge opposite the blowout dune (Figure 14E). The growth of this dune can be explained by the accretion of sediment blown away from the opposite, eroding dune. Additionally, the blowout passage between these two ridges appeared to serve as a sediment transport pathway, bringing sediment from the dune systems toward the backshore and forming a fan-like deposit (Figure 14E).
Similar erosional and accretional or depositional patterns can be observed at site T5 on Mustang Island (Figure 15). However, their levels here were relatively less than on North Padre Island. The previous primary foredune ridge (Figure 15A,C) was scarped landward by 15 m (Figure 15D), resulting in a vertical erosion of 1.5–2 m (Figure 15E). Deposition was observed on the interdunal troughs; the most deposition was observed in the deeper depocenters between the mound-shaped large dunes of the secondary foredune system (Figure 15D,E). This sediment was likely sourced from these mounds, as they had erosional tops (yellow areas on the rear-dune mounds in Figure 15E). Compared with North Padre Island, the entire beach at this site was eroded, as there were no blowouts or other sediment passages sourcing the backshore.
Finally, site T1 on San Jose Island (Figure 16) shows a different erosional and accretional pattern. Compared with North Padre and Mustang Islands, the primary foredune ridge here recovered (Figure 16C,D) and showed significant growth of 1.5–3.3 m (Figure 16E). Such behavior could possibly be explained by the significant, natural vegetation growth (Figure 16A,B): vegetation here likely recolonized rapidly after Hurricane Harvey passed, covering the previous blowout (Figure 16A) from this hurricane and stabilizing the foredune system. Aboveground vegetation is known to protect dunes from erosion by attenuating wave swash [43]. Accretion was also observed on the seaward edge of the backshore (Figure 16E) via sediment entrapment by the Aransas Pass jetty (Figure 13A).
The response of beaches and dunes to erosional and accretional or depositional forces can be observed from comparison of 2018 and 2022 beach−foredune elevation profiles (Figure 17). At site T10 on North Padre Island, a series of interchanging erosion and accretion or deposition were observed (Figure 17A). The primary foredune shows escarpment from erosional forces that removed the frontal portion of the dune, including the coppice dune at its base. The dune ridge directly behind was also significantly eroded due to the exposure of this side of the dune by the blowout. Deposition occurred at the shallow swale behind it from the sediment eroded from the blowout. Finally, the deeper swale in the back was first filled by sediment and then built up by rear-slope accretion.
Site T5 on Mustang Island shows that the primary foredune migrated landward by rear-slope accretion (Figure 17B). This happened as the sediment scraped from the frontal (stoss) side of the foredune was pushed up over the dune crest and deposited on its lee side. Sediment was also moved here via erosion of the taller, secondary dune ridge.
On the other hand, site T1 on San Jose Island shows an opposite process, where the primary foredune ridge was accreting while the surrounding areas were being eroded (Figure 17C). Accretion happened vertically on the crest of the dune, rather than via the rear slope, indicating rapid aggradation. The small, vegetated, mound-shaped dunes were eroded vertically, while the backshore was accreted by longshore currents blocked by the Aransas Pass jetty.

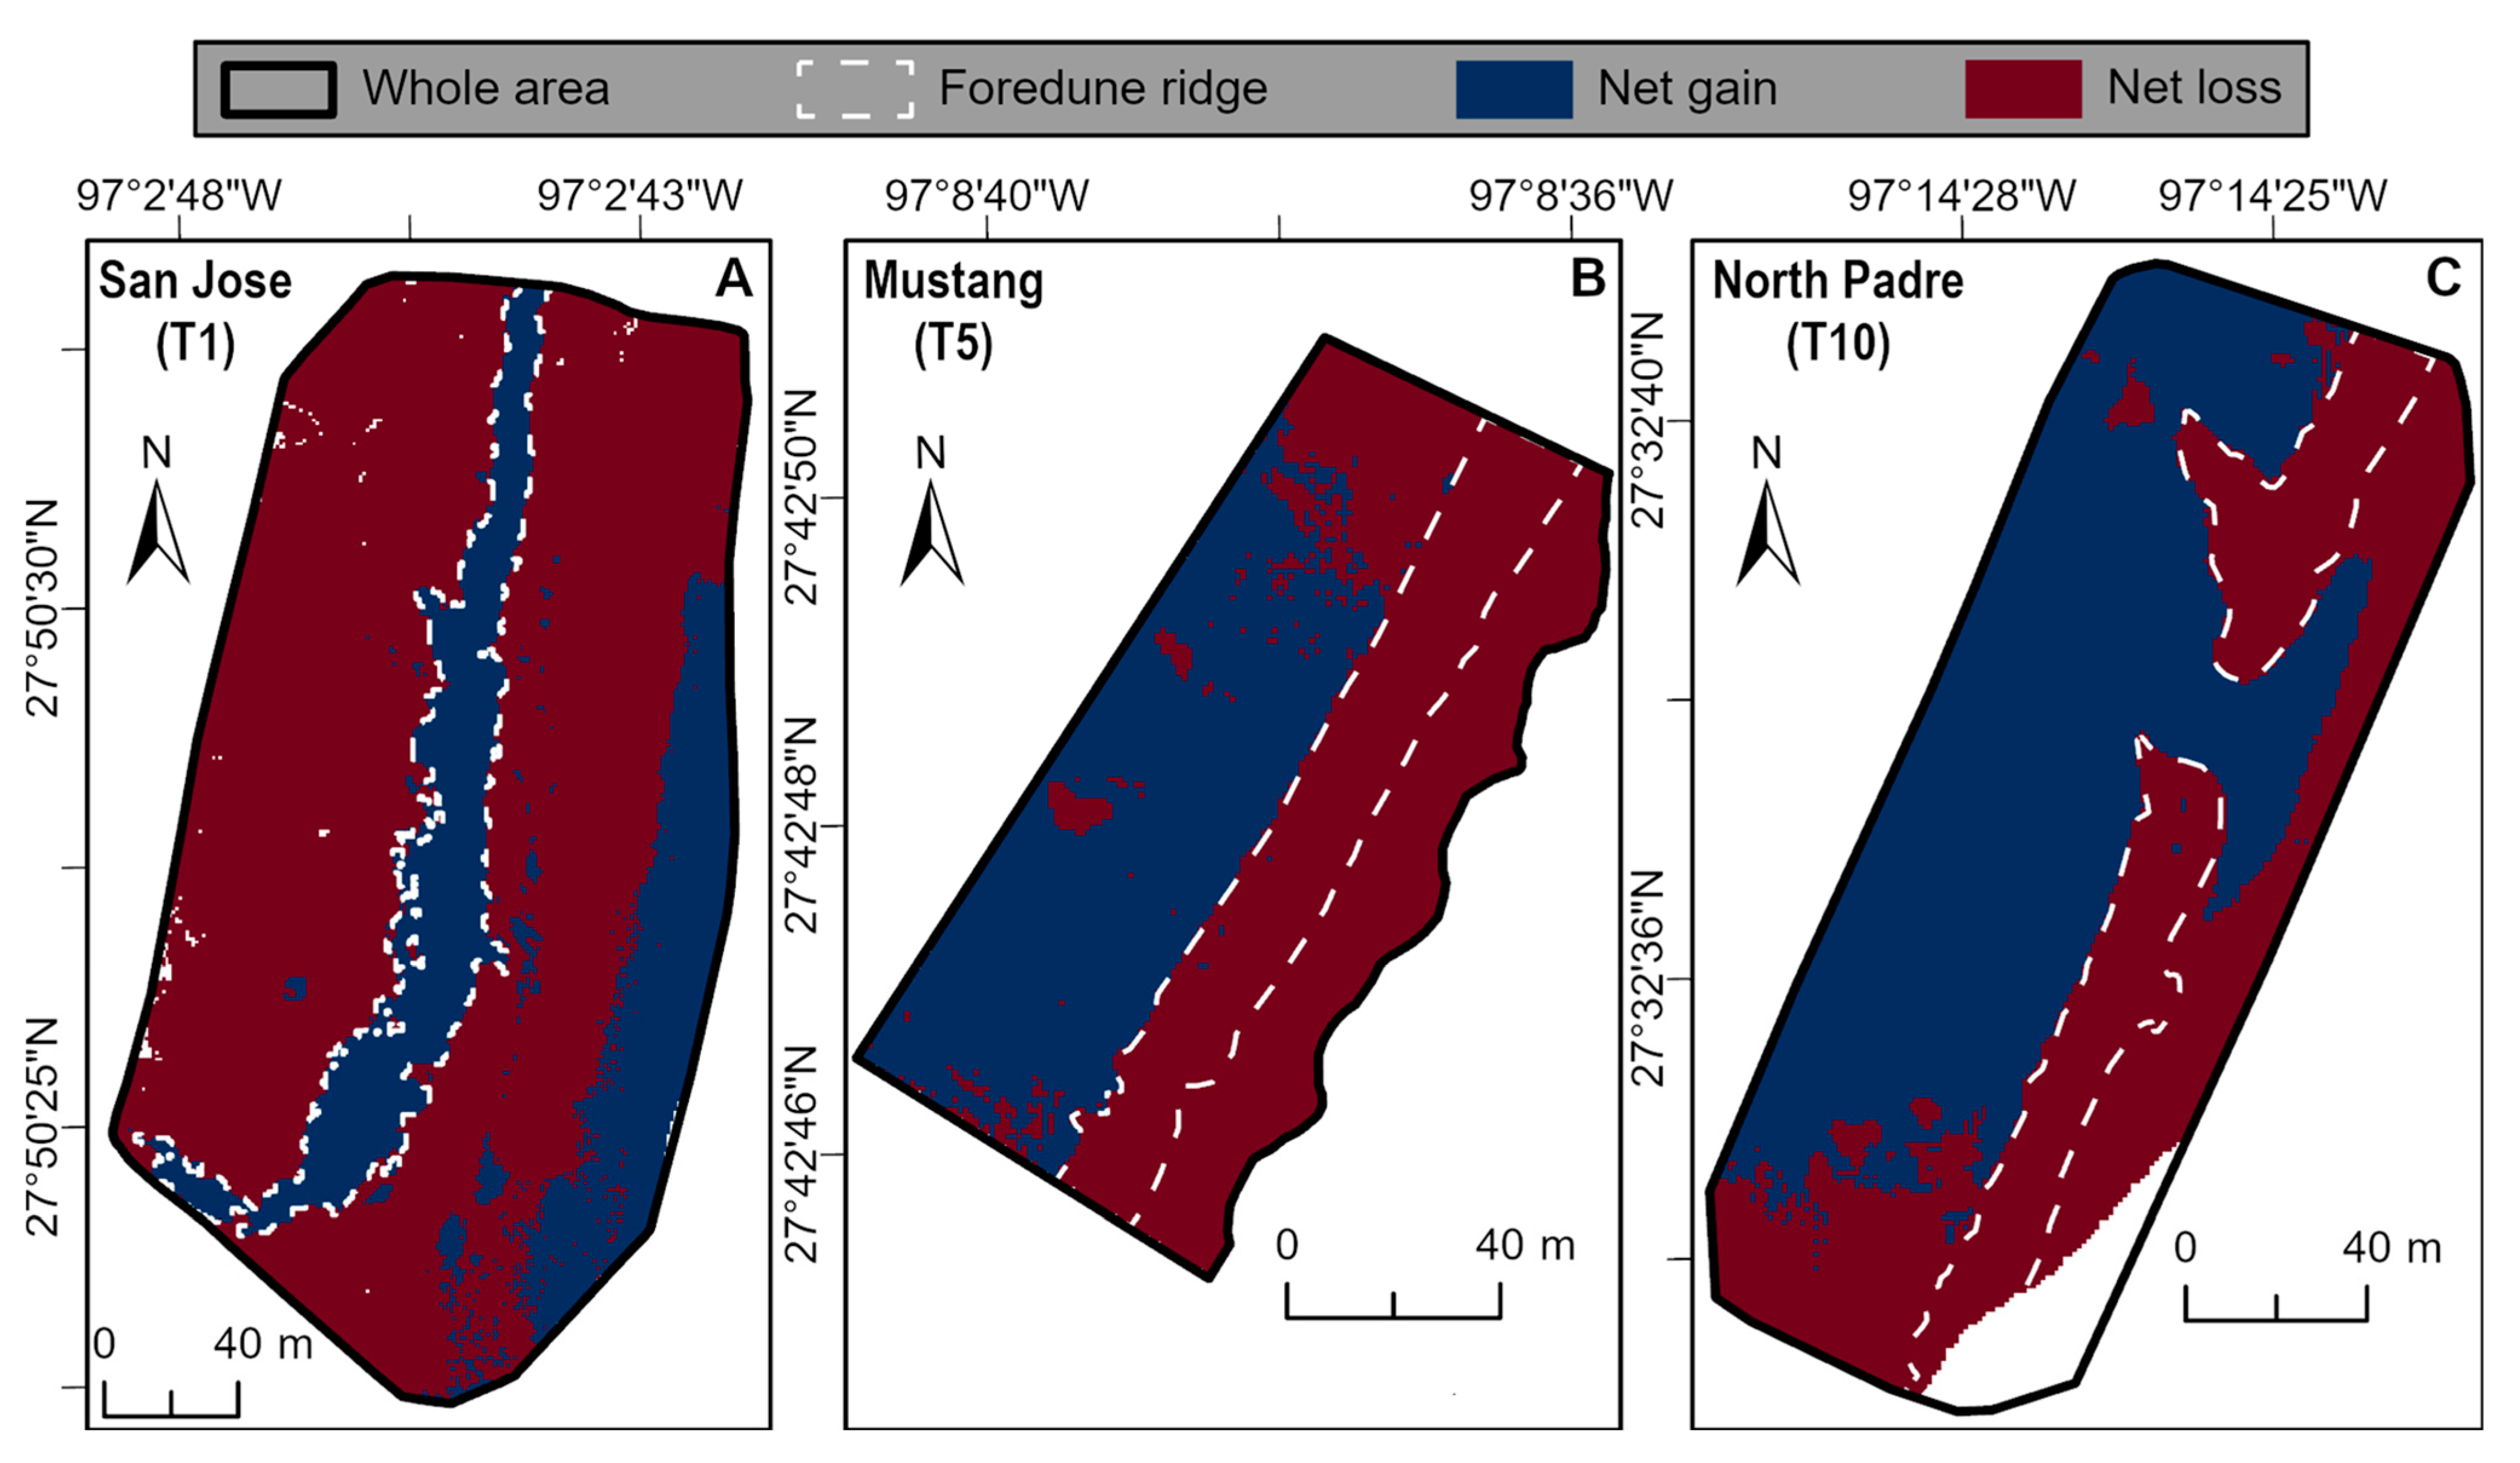
4.2. Volumetric Analysis

To show the redistribution of the sediment budget, the volume difference between the 2018 and 2022 elevation surfaces was calculated for each site (Figure 18). The results of these analyses are summarized in Table 4.
Both San Jose and Mustang Island sites (Figure 18A,B) lost more sediment than gained (Table 4), indicating that the sediment budget in these locations decreased from 2018 to 2022. On the other hand, the site at North Padre Island (Figure 18C) gained more sediment than lost (Table 4), indicating that its sediment budget increased and was possibly maintained by surge outflows after storm events, bringing in sand from surrounding areas via the blowout passage (i.e., the blue, fan-like feature in Figure 18C), as well as by longshore drift. The backshore area of the San Jose site (seaward blue segment in Figure 18A) also accumulated sediment (~1412 m3), likely sourced from the longshore drift trapped by the adjacent jetty. At all sites, part of the removed sediment was likely redeposited on the rear-dune areas (i.e., interdunal troughs on Mustang and North Padre Islands) or on the dune ridge itself (i.e., the primary dune on San Jose Island), while the other part was removed from the system and carried to offshore bars and/or surrounding areas.
The calculated volume of sediment change on the primary foredune at each site is as follows: 3310 m3 of net sediment erosion at site T5 on Mustang Island; 6151 m3 of net sediment erosion at site T10 on North Padre Island; and 6502 m3 of net sediment accretion at site T1 on San Jose Island (Table 4).

4.3. Factors Influencing the Erosion and Recovery of Beach−Dune Systems

The trends in post-Harvey elevation and shoreline changes observed on the beaches and dunes of the central Texas coast can be attributed to several factors. These factors include distance from hurricane landfall; proximity to protective coastal structures such as jetties; height of dunes relative to storm surge level; and other geomorphological characteristics such as the width, geometry, and vegetation cover of beach−foredune complexes.
For example, the highest erosional impact is observed on San Jose Island due to its proximity to Hurricane Harvey landfall, where storm surge was higher (Figure 1), and its relatively wide beach providing more surface area for erosion [44]. On the other hand, this area experienced fast recovery from 2018 to 2022 possibly due to significant, natural vegetation growth that stabilized its foredunes, accompanied by sediment entrapment and accumulation north of the Aransas Pass jetty (Figure 19A). This unique site shows that coastal areas guided by natural processes could be highly responsive, and these natural processes could play both significant destructive and constructive roles.
Conversely, Mustang Island experienced the lowest erosional impact due to its taller (4–5 m) foredunes relative to the lower storm surge level (Figure 1) and its narrower beach. As a result, Hurricane Harvey reached the base of the foredune complex, affecting mostly the base of the foredune in this area. Additionally, Mustang Island is located in a stable sedimentary area near the central Texas bend, where longshore currents converge and contribute to its aggradation [33,34,45]. Historically, shoreline changes have been minimal in this area (net retreat of 0.29 m/yr from the 1930s to 2019) compared with other parts of the Texas coast [40]. This natural protection could also explain the lower erosion levels from 2018 onward, compared with North Padre Island.
Although the beach at North Padre Island is also narrow, the higher erosion levels here could be explained by the pre-existing and active blowout processes (Figure 19B). Several blowouts, both along the shore and foredune ridges, exist further south in Padre Island based on inspection of historical aerial imagery. Hurricane Hanna, which made landfall on 25 July 2020, at Padre Island National Seashore, influenced these areas [person commun. Shelley Todd, Padre Island National Seashore].
While the 2016 and 2018 surveys show net erosion, the direct impact of Harvey is only seen in the 2017 post-Harvey aerial imagery, showing more significant erosion and retreat. Within approximately 9 months, from September 2017 to May 2018, the barrier-island system started recovering. It should be noted that our analyses are limited to available data sets, which are snapshots in time; therefore, the exact contribution of post-storm processes to the changes from 2018 to 2022 is unclear (i.e., a mixture of continued recovery from the effects of Hurricane Harvey and normal coastal processes for these areas). Thus, it could be highly beneficial to collect quarterly topographic data using UAVs and conduct time-series analyses for future events to determine post-storm dune and beach equilibrium rates.

5. Conclusions

We analyzed the impact of Hurricane Harvey on the beaches and dunes of the barrier islands on the central Texas coast. Hurricane Harvey caused a significant retreat of the shoreline, averaging at a net of 16.2 m and locally reaching 59 m near landfall, which are drastic values compared with the average short- and long-term (1.27 m/yr) retreat rates reported for the Texas coast [1]. This impact could be continuous alongshore (~13 km in the case of Harvey), but decreased further away from the site of landfall.
Based on regional pre-Harvey and post-Harvey elevation differencing, we identified 17 sites along the central Texas coast where dunes were significantly eroded. UAV surveys were conducted at three of these sites, and high-resolution (cm-scale) topographic data were acquired and processed with high accuracy. We used these data to evaluate changes to dunes and beaches from 2018 to 2022. The high-resolution products derived from these surveys may serve as baselines for future surveys and change analyses.
The response of the beach−foredune complexes to erosional events can vary based on the complexity of the foredune systems and depends on their geomorphological aspects, including the width of the back-beach, the height of the primary foredune ridge, the geometry of primary and secondary fore-island dunes (single, linear ridge versus multi-ridge-swale complex with interdunal troughs), and the presence of blowouts that expose the surfaces of dunes. Local depositional processes, such as storm washouts and entrapment of longshore drift by protective jetties, can contribute to the accretion of not only back-beach areas, but also the foredune ridges. Additionally, natural, post-storm vegetation growth can accelerate the recovery of dunes. Dune growth can happen in multiple ways, including rear-slope accretion, vertical aggradation, and dune-trough filling, depending on the geometry of the dune systems. Generally, impacted dunes migrate landward by rear-slope accretion and recover by vertical aggradation and seaward accretion.
Finally, we recommend that UAV surveys be conducted quarterly (or at a possibly higher frequency) to document the response of beach−dune complexes to erosional events in more detail and, if permitted, directly after storm events to analyze their instantaneous effects. Time-series analyses from these UAV surveys could help to identify the equilibrium time of dune and beach systems, as well as differentiate storm impacts from other erosional events that occur in these dynamic environments. This type of study could help in future storm mitigation and coast protection missions.

Author Contributions

A.S., conceptualization, methodology, formal analysis, writing—original draft, visualization, writing—review and editing; S.D.K., supervision, conceptualization, methodology, writing—review and editing; S.S.R., conceptualization, methodology, and writing-editing. All authors have read and agreed to the published version of the manuscript.

Funding

This research received no external funding.

Data Availability Statement

Data can be requested by emailing the corresponding author.

Acknowledgments

We thank Muhammad Qasim for his assistance with the fieldwork. We are thankful to Wade Ruddock for permission to collect data at San Jose Island. We would also like to acknowledge Geodetic Survey of Natural Resources Canada for their CSRS-PPP service.

Conflicts of Interest

The authors declare no conflict of interest.

References

  1. Paine, J.G.; Caudle, T.L.; Andrews, J.R. Shoreline and Sand Storage Dynamics from Annual Airborne LIDAR Surveys, Texas Gulf Coast. J. Coast. Res. 2017, 33, 487–506. [Google Scholar] [CrossRef]
  2. Morton, R.A.; Sallenger, A.H. Morphological Impacts of Extreme Storms on Sandy Beaches and Barriers. J. Coast. Res. 2003, 19, 560–573. [Google Scholar]
  3. Wang, P.; Kirby, J.H.; Haber, J.D.; Horwitz, M.H.; Knorr, P.O.; Krock, J.R. Morphological and Sedimentological Impacts of Hurricane Ivan and Immediate Poststorm Beach Recovery along the Northwestern Florida Barrier-Island Coasts. J. Coast. Res. 2006, 22, 1382–1402. [Google Scholar] [CrossRef]
  4. Hayes, M.O. Hurricanes as Geological Agents: Case Studies of Hurricanes Carla, 1961, and Cindy, 1963; The University of Texas at Austin. Bureau of Economic Geology: Austin, TX, USA, 1967. [Google Scholar]
  5. Morton, R.A.; Paine, J.G. Beach and Vegetation-Line Changes at Galveston Island, Texas: Erosion, Deposition, and Recovery from Hurricane Alicia; Austin, Texas; The University of Texas at Austin. Bureau of Economic Geology: Austin, TX, USA, 1985. [Google Scholar]
  6. Sherman, D.J.; Hales, B.U.; Potts, M.K.; Ellis, J.T.; Liu, H.; Houser, C. Impacts of Hurricane Ike on the Beaches of the Bolivar Peninsula, TX, USA. Geomorphology 2013, 199, 62–81. [Google Scholar] [CrossRef]
  7. Emanuel, K. Increasing Destructiveness of Tropical Cyclones over the Past 30 Years. Nature 2005, 436, 686–688. [Google Scholar] [CrossRef] [PubMed]
  8. Mann, M.E.; Emanuel, K.A. Atlantic Hurricane Trends Linked to Climate Change. Eos 2006, 87, 233–241. [Google Scholar] [CrossRef]
  9. Holland, G.J.; Webster, P.J. Heightened Tropical Cyclone Activity in the North Atlantic: Natural Variability or Climate Trend? Philos. Trans. R. Soc. A Math. Phys. Eng. Sci. 2007, 365, 2695–2716. [Google Scholar] [CrossRef] [PubMed]
  10. NOAA. Historical Hurricane Tracks. Available online: https://coast.noaa.gov/hurricanes/#map=4/32/-80/ (accessed on 30 June 2022).
  11. Stockdon, H.F.; Doran, K.J.; Thompson, D.M.; Sopkin, K.L.; Plant, N.G.; Sallenger, A.H. National Assessment of Hurricane-Induced Coastal Erosion Hazards: Gulf of Mexico. 2012. Available online: https://pubs.usgs.gov/of/2012/1084/ (accessed on 20 June 2022).
  12. Bird, E. Coastal Geomorphology: An Introduction, 2nd ed.; Wiley: West Sussex, UK, 2008. [Google Scholar]
  13. Anthony, E.J. Encyclopedia of Coastal Science; Schwartz, M.L., Ed.; Springer: Dordrecht, The Netherlands, 2005; ISBN 9781402019036. [Google Scholar]
  14. Houser, C.; Hapke, C.; Hamilton, S. Controls on Coastal Dune Morphology, Shoreline Erosion and Barrier Island Response to Extreme Storms. Geomorphology 2008, 100, 223–240. [Google Scholar] [CrossRef]
  15. Taylor, E.B.; Gibeaut, J.C.; Yoskowitz, D.W.; Starek, M.J. Assessment and Monetary Valuation of the Storm Protection Function of Beaches and Foredunes on the Texas Coast. J. Coast. Res. 2015, 31, 1205–1216. [Google Scholar] [CrossRef]
  16. Caudle, T.L.; Paine, J.G.; Andrews, J.R.; Saylam, K. Beach, Dune, and Nearshore Analysis of Southern Texas Gulf Coast Using Chiroptera LIDAR and Imaging System. J. Coast. Res. 2019, 35, 251–268. [Google Scholar] [CrossRef]
  17. Zhou, G.; Xie, M. Coastal 3-D Morphological Change Analysis Using LiDAR Series Data: A Case Study of Assateague Island National Seashore. J. Coast. Res. 2009, 25, 435–447. [Google Scholar] [CrossRef]
  18. Stockdon, H.F.; Sallenger, A.H.; List, J.H.; Holman, R.A. Estimation of Shoreline Position and Change Using Airborne Topographic Lidar Data. J. Coast. Res. 2002, 18, 502–513. [Google Scholar]
  19. Sallenger, A.H.; Krabill, W.B.; Swift, R.N.; Brock, J.; List, J.; Hansen, M.; Holman, R.A.; Manizade, S.; Sontag, J.; Meredith, A.; et al. Evaluation of Airborne Topographic Lidar for Quantifying Beach Changes. J. Coast. Res. 2003, 19, 125–133. [Google Scholar]
  20. Zhang, K.; Whitman, D.; Leatherman, S.; Robertson, W. Quantification of Beach Changes Caused by Hurricane Floyd along Florida’s Atlantic Coast Using Airborne Laser Surveys. J. Coast. Res. 2005, 21, 123–134. [Google Scholar] [CrossRef]
  21. Robertson, V.W.; Zhang, K.; Whitman, D. Hurricane-Induced Beach Change Derived from Airborne Laser Measurements near Panama City, Florida. Mar. Geol. 2007, 237, 191–205. [Google Scholar] [CrossRef]
  22. Stockdon, H.F.; Doran, K.S.; Sallenger, A.H. Extraction of Lidar-Based Dune-Crest Elevations for Use in Examining the Vulnerability of Beaches to Inundation during Hurricanes. J. Coast. Res. 2009, 59–65. [Google Scholar] [CrossRef]
  23. Pye, K.; Blott, S.J. Assessment of Beach and Dune Erosion and Accretion Using LiDAR: Impact of the Stormy 2013-14 Winter and Longer Term Trends on the Sefton Coast, UK. Geomorphology 2016, 266, 146–167. [Google Scholar] [CrossRef]
  24. Woolard, J.W.; Colby, J.D. Spatial Characterization, Resolution, and Volumetric Change of Coastal Dunes Using Airborne LIDAR: Cape Hatteras, North Carolina. Geomorphology 2002, 48, 269–287. [Google Scholar] [CrossRef]
  25. Mitasova, H.; Drake, T.G.; Bernstein, D.; Harmon, R.S. Quantifying Rapid Changes in Coastal Topography Using Modern Mapping Techniques and Geographic Information System. Environ. Eng. Geosci. 2004, 10, 1–11. [Google Scholar] [CrossRef]
  26. Saye, S.E.; van der Wal, D.; Pye, K.; Blott, S.J. Beach-Dune Morphological Relationships and Erosion/Accretion: An Investigation at Five Sites in England and Wales Using LIDAR Data. Geomorphology 2005, 72, 128–155. [Google Scholar] [CrossRef]
  27. Scarelli, F.M.; Sistilli, F.; Fabbri, S.; Cantelli, L.; Barboza, E.G.; Gabbianelli, G. Seasonal Dune and Beach Monitoring Using Photogrammetry from UAV Surveys to Apply in the ICZM on the Ravenna Coast (Emilia-Romagna, Italy). Remote Sens. Appl. 2017, 7, 27–39. [Google Scholar] [CrossRef]
  28. Laporte-Fauret, Q.; Marieu, V.; Castelle, B.; Michalet, R.; Bujan, S.; Rosebery, D. Low-Cost UAV for High-Resolution and Large-Scale Coastal Dune Change Monitoring Using Photogrammetry. J. Mar. Sci. Eng. 2019, 7, 63. [Google Scholar] [CrossRef]
  29. Pagán, J.I.; Bañón, L.; López, I.; Bañón, C.; Aragonés, L. Monitoring the Dune-Beach System of Guardamar Del Segura (Spain) Using UAV, SfM and GIS Techniques. Sci. Total Environ. 2019, 687, 1034–1045. [Google Scholar] [CrossRef] [PubMed]
  30. Rojas, S.S.; Khan, S.D.; Shahtakhtinskiy, A. Impact of Hurricane Harvey on the Upper Texas Coast: Using Airborne Lidar Data Sets with UAV-Derived Topographic Data to Monitor Change and Track Recovery. Remote Sens. 2022, 14, 5357. [Google Scholar] [CrossRef]
  31. Blake, E.S.; Zelinsky, D.A. Hurricane Harvey (AL092017); National Hurricane Center: Miami, FL, USA, 2018.
  32. National Hurricane Center. Available online: https://www.nhc.noaa.gov/ (accessed on 23 June 2022).
  33. Gibeaut, J.; del Angel, D.; Lord, A.; Lupher, B.; Lumb, L.; Anderson, M. Mustang and North Padre Island Beach Maintenance Impacts and Recommendations for Best Management Practices: A Report to the General Land Office under GLO Contract No. 14-246-000-8341; Texas A&M University—Corpus Christi, Harte Research Institute for Gulf of Mexico Studies: Corpus Christi, TX, USA, 2015. [Google Scholar]
  34. Gingras, M.A. Small-Scale Morphodynamics of Maintained and Unmaintained Beaches on Mustang Island, Texas. Master’s Thesis, Texas A&M University—Corpus Christi, Corpus Christi, TX, USA, 2017. [Google Scholar]
  35. Paine, J.G.; White, W.A.; Smyth, R.C.; Andrews, J.R.; Gibeaut, J.C. Mapping Coastal Environments with Lidar and EM on Mustang Island, Texas, U.S. Lead. Edge 2004, 23, 894–898. [Google Scholar] [CrossRef]
  36. Hesp, P. Foredunes and Blowouts: Initiation, Geomorphology and Dynamics. Geomorphology 2002, 48, 245–268. [Google Scholar] [CrossRef]
  37. Hesp, P.A.; Shroder, J. Coastal Dunes. In Treatise on Geomorphology; Shroder, J., Ed.; Elsevier: London, UK, 2013; Volume 11, pp. 328–355. [Google Scholar]
  38. ArcGIS Pro, version 2.9.2; Esri Inc.: Redlands, CA, USA, 2021.
  39. Gibeaut, J.C.; Caudle, T.L. Defining and Mapping Foredunes, the Line of Vegetation, and Shorelines along the Texas Gulf Coast; Final Report Prepared for the Texas General Land Office, Contract No. 07-005-22; The University of Texas at Austin. Bureau of Economic Geology: Austin, TX, USA, 2009. [Google Scholar]
  40. Paine, J.G.; Caudle, T.; Andrews, J.R. Shoreline Movement and Beach and Dune Volumetrics along the Texas Gulf Coast, 1930s to 2019; Report Prepared for General Land Office under Contract No. 16-201-000; The University of Texas at Austin. Bureau of Economic Geology: Austin, TX, USA, 2021. [Google Scholar]
  41. Himmelstoss, E.A.; Henderson, R.E.; Kratzmann, M.G.; Farris, A.S. Digital Shoreline Analysis System (DSAS) Version 5.1 User Guide; Open-File Report 2021–1091; U.S. Geological Survey: Reston, VA, USA, 2021.
  42. ArcGIS Drone2Map, version 2.3; Esri Inc.: Redlands, CA, USA, 2020.
  43. Feagin, R.A.; Furman, M.; Salgado, K.; Martinez, M.L.; Innocenti, R.A.; Eubanks, K.; Figlus, J.; Huff, T.P.; Sigren, J.; Silva, R. The role of beach and sand dune vegetation in mediating wave run up erosion. Estuar. Coast. Shelf Sci. 2019, 219, 97–106. [Google Scholar] [CrossRef]
  44. Rusinek, D. Analyzing the Effects of Hurricane Harvey on Dune Morphology and Coastline Loss Using Terrestrial Laser Scanning: A Case Study at Bryan Beach, Texas. Master’s Thesis, University of Houston, Houston, TX, USA, 2020. [Google Scholar]
  45. Simms, A.R.; Anderson, J.B.; Blum, M. Barrier-Island Aggradation via Inlet Migration: Mustang Island, Texas. Sediment. Geol. 2006, 187, 105–125. [Google Scholar] [CrossRef]
Figure 1. Study area of the central Texas coast, covering San Jose, Mustang, and North Padre Islands. Green points indicate >100 m long sections along the shore with over 1 m vertical erosion in the foredunes. Red points are the sites selected for UAV surveying. The Hurricane Harvey track was downloaded from the NOAA National Hurricane Center [32]. Storm surge inundation levels (in feet above ground) are from Blake and Zelinsky [31].
Remotesensing 15 05779 g001
Figure 2. Description of barrier islands on the Texas Gulf Coast. (A) Generalized environments and geomorphological features observed on a barrier island (modified after [35]). (B) Detail of a foredune−backshore complex on an unmaintained beach (modified after [33]).
Remotesensing 15 05779 g002
Figure 3. Change analysis workflow, summarizing the main steps of the project. Negative change processes are highlighted in red, and positive change processes are highlighted blue.
Remotesensing 15 05779 g003
Figure 4. Example of the shoreline change analysis workflow using the USGS Digital Shoreline Analysis System (DSAS) at San Jose Island. Shore-perpendicular transects are cast from an offshore baseline to the shoreline proxies at 50 m intervals, and their intersection points are used to calculate the distance between the shorelines. The 2016 shoreline proxy is extracted as the 1 m DEM contour derived from airborne lidar elevation data acquired during September–October 2016 by USACE; the 2018 shoreline proxy is extracted as the 0.9 m DEM contour derived from airborne lidar elevation data acquired in March 2018 by USGS. The basemap is NAIP aerial imagery acquired by the USDA on 17 May 2018 (Table 1).
Remotesensing 15 05779 g004
Figure 5. Tools used in the field for acquisition of aerial imagery and positional data. (A) Unmanned aerial vehicle with a mounted camera. (B) Setup of the global navigation satellite system (GNSS) and ground check points.
Remotesensing 15 05779 g005
Figure 6. Design of UAV flight missions for the selected T1, T5, and T10 locations (Figure 1) at the San Jose, Mustang, and North Padre Islands, respectively.
Remotesensing 15 05779 g006
Figure 7. Comparison of pre- and post-Harvey aerial imagery. (A) 30 September 2016, NAIP imagery, showing the 2016 shoreline proxy in blue. (B) 28–30 August 2017, Harvey Response imagery, showing detail of breached dunes and overwash areas. (C) 17 May 2018, NAIP imagery showing the 2018 shoreline proxy in red and the 2016 shoreline proxy in blue, as well as a detail of a washout fan at the southern tip of San Jose Island.
Remotesensing 15 05779 g007
Figure 8. Regional elevation changes between September 2016 and March 2018 at the central Texas coast, south of Hurricane Harvey landfall site (Figure 1). (A) DEM difference map, where negative values represent net vertical erosion (red) and positive values represent net vertical accretion or deposition (blue). (B) Zoom-in of box 8B, showing detail of southern San Jose Island (Figure 7C), where the erosional impact by Hurricane Harvey was the highest. Boxes 9A and 9B show locations for Figure 9.
Remotesensing 15 05779 g008
Figure 9. Accretion (blue) and erosion (red) patterns observed around protective jetties (between September 2016 and March 2018). (A) Packery Channel. (B) Fish Pass. The basemap is the 2018 NAIP imagery. Figure locations shown in Figure 8.
Remotesensing 15 05779 g009
Figure 10. Shoreline change calculated between September 2016 and March 2018 from shoreline proxies extracted from the DEMs at 1 m and 0.9 m contours, respectively. (A) Net shoreline movement map, showing the distance between the shorelines measured along 1559 shore-normal transects spaced at 50 m intervals along the coast. (B) Movements rates calculated by diving the shoreline movement by the time elapsed.
Remotesensing 15 05779 g010
Figure 11. Geomorphological description of site T10 on North Padre Island based on topographical data acquired on 11 May 2022. (A) A 3D photorealistic model, showing the beach−foredune complex. (B) A 3D point cloud, showing elevation and dune features. (C) Ground view of the primary foredunes on each side of the blowout in (A). (D) Orthophoto showing a detail of the blowout in (A).
Remotesensing 15 05779 g011
Figure 12. Geomorphological description of site T5 on Mustang Island based on topographical data acquired on 11 May 2022. (A) A 3D photorealistic model, showing the beach−foredune complex. (B) A 3D point cloud, showing elevation and dune features. (C) Ground view of the primary and secondary foredunes at the southern part of the site. (D) Ground view of the primary and coppice dunes at the northern end of the site.
Remotesensing 15 05779 g012
Figure 13. Geomorphological description of site T1 on San Jose Island based on topographical data acquired on 16 May 2022. (A) A 3D photorealistic model, showing the beach−foredune complex. (B) A 3D point cloud, showing elevation and dune features. (C) Ground view of the primary and incipient dunes. (D) Field photo showing a detail of the incipient dunes.
Remotesensing 15 05779 g013
Figure 14. Changes in the beach−foredune complex of site T10 on North Padre Island. (A) 17 May 2018, NAIP imagery. (B) 11 May 2022, orthophoto, overlain on World Imagery basemap (22 January 2023). (C) March 2018 digital elevation model. (D) May 2022 digital terrain model. (E) Elevation difference map showing areas of erosion and accretion or deposition.
Remotesensing 15 05779 g014
Figure 15. Changes in the beach−foredune complex of site T5 on Mustang Island. (A) 17 May 2018, NAIP imagery. (B) 11 May 2022, orthophoto, overlain on World Imagery basemap (22 January 2023). (C) March 2018 digital elevation model. (D) May 2022 digital terrain model. (E) Elevation difference map showing areas of erosion and accretion or deposition.
Remotesensing 15 05779 g015
Figure 16. Changes in the beach−foredune complex of site T1 on San Jose Island. (A) 17 May 2018, NAIP imagery. (B) 16 May 2022, orthophoto, overlain on World Imagery basemap (22 January 2023). (C) March 2018 digital elevation model. (D) May 2022 digital terrain model. (E) Elevation difference map showing areas of erosion and accretion or deposition.
Remotesensing 15 05779 g016
Figure 17. Comparison of shore-perpendicular elevation profiles between 2018 and 2022 at the studied sites. (A) Elevation profile X-X′ from site T10 on North Padre Island (Figure 14E). (B) Elevation profile Y-Y′ from site T5 on Mustang Island (Figure 15E). (C) Elevation profile Z-Z′ from site T1 on San Jose Island (Figure 16E).
Remotesensing 15 05779 g017
Figure 18. Volume difference maps between 2018 and 2022, showing areas of lost and gained sediment at each site. (A) Site T1 on San Jose Island. (B) Site T5 on Mustang Island. (C) Site T10 on North Padre Island.
Remotesensing 15 05779 g018
Figure 19. (A) Illustration of processes contributing to the growth of the foredune on San Jose Island. (B) Illustration of erosion processes affecting the dune system on North Padre Island. Dashed line represents the beach−foredune profile extracted from the March 2018 digital elevation model. Solid-fill line represents the beach−foredune profile extracted from the May 2022 digital terrain model, built in this study.
Remotesensing 15 05779 g019
Table 1. Description of public elevation (bare earth) and aerial imagery data at the studied section of the central Texas coast, used for regional-scale post-Harvey change analyses.
SourceAgencyA. DateS. Res. (m)V. Acc. (cm)V. Datum
Digital Elevation Models
Gulf Coast NCMP LidarNOAA DC: DAVUSACESeptember 2016110NAVD88
(Geoid12B)
South Texas Lidar TNRISUSGSMarch 2018110NAVD88
(Geoid12B)
Orthophotos
Coastal Texas NAIP ImageryTNRISUSDASeptember 20161
Hurricane Harvey ImageryNOAANOAAAugust 20170.35
Coastal Texas NAIP ImageryTNRISUSDAMay 20180.6
A. Date—acquisition date; S. Res.—spatial resolution; V. Acc.—vertical accuracy; V. datum—vertical datum; USACE—United States Army Corps of Engineers; USGS—United States Geological Survey; USDA—United States Department of Agriculture; NOAA—National Oceanic and Atmospheric Administration; NOAA DC: DAV—NOAA Digital Coast: Data Access Viewer; NCMP—National Coastal Mapping Program; NAIP—National Agriculture Imagery Program; TNRIS—Texas Natural Resources Information System DataHub.
Table 2. UAV flight mission specifications at the three selected sites on the central Texas coast.
SiteT1 (San Jose)T5 (Mustang)T10 (North Padre)
Acquisition Date16 May 202211 May 202211 May 2022
Altitude (m)793635
Ground Sampling Distance (cm/pixel)1.830.830.81
Number of Images224322502
Length Along Shore (m)335155220
Area ( m 2 )23,252805410,436
Table 3. Shoreline change-rate statistics, where negatives values represent transects with net shoreline retreat (erosional transects) and positive values represent transects with net shoreline advance (accretional transects).
Net Shoreline Movement (m)Movement Rate (m/yr)
RetreatErosional Transects (%)87.7Significant Erosion (%)23.7
Max Retreat−59Max Retreat39.1
Average Retreat−16.2Average Retreat10.7
AdvanceAccretional Transects (%)12.3Significant Accretion (%)4.4
Max Advance62.7Max Advance41.5
Average Advance13.4Average Advance8.9
Average Movement−12.6Average Rate8.3
Table 4. Volume difference values calculated for the whole area and foredune ridges at each site, as shown in Figure 18.
Whole AreaForedune Ridge
SiteNet Loss (m3)Net Gain (m3)Net Change (m3)
T10 (North Padre)992313,614−6151
T5 (Mustang)55461767−3310
T1 (San Jose)23,8937982+6502
Disclaimer/Publisher’s Note: The statements, opinions and data contained in all publications are solely those of the individual author(s) and contributor(s) and not of MDPI and/or the editor(s). MDPI and/or the editor(s) disclaim responsibility for any injury to people or property resulting from any ideas, methods, instructions or products referred to in the content.

