Article

Land-Use Optimization Based on Ecological Security Pattern—A Case Study of Baicheng, Northeast China

1
Northeast Institute of Geography and Agroecology, Chinese Academy of Sciences, Changchun 130102, China
2
College of Resources and Environment, Shandong Agricultural University, Taian 271018, China
*
Author to whom correspondence should be addressed.
Remote Sens. 2023, 15(24), 5671; https://doi.org/10.3390/rs15245671
Submission received: 24 October 2023 / Revised: 28 November 2023 / Accepted: 6 December 2023 / Published: 8 December 2023

Abstract

:
In the current context of global urbanization and climate change, balancing ecological protection and economic development is a particular challenge in the optimal allocation of regional land use. Here, we propose a research framework for the optimal allocation of land use that considers the regional ecological security pattern (ESP) and allocates space for land-use activities to areas with low ecological risk. Taking Baicheng, China as our study area, ecological sources were first identified by integrating their ecological importance and landscape connectivity, and ecological corridors and functional zones were extracted using the minimum cumulative resistance difference and circuit theory. The ecological source areas were then taken as limiting factors, and four future scenarios were established for 2030 using the parcel-level land-use simulator (PLUS) model. The ecological corridors and functional zones served as areas having restricted ecological conditions, and the four future scenarios were coupled into the corresponding functional zones to optimize the land-use structure in 2030. The results indicate that under the coupled ESP–PLUS scenario, the spatial distribution and structure of land use in Baicheng balance the needs of ecological source area protection and economic development, resulting in greater sustainability. By 2030, the cultivated land area will steadily increase, but attention will also be given to the protection of ecological land (e.g., woodland and marshland), aligning with current policy planning demands. An analysis of the landscape indices for each future scenario found all scenarios to be effective in reducing negative changes in landscape patterns. These findings provide a novel perspective for the rational allocation of future land resources and the optimization of land-use structures.

Graphical Abstract

1. Introduction

As the material foundation and spatial carrier for human survival and development, the rational utilization of land resources is crucial for achieving sustainable development [1,2]. In the 21st century, with rapid population growth and socioeconomic development accompanied by high-intensity utilization of natural resources, the disturbance of ecosystems by human activities has led to drastic changes in land use in China [3,4], and the conflict between the supply and demand of land resources has intensified [5]. This has caused many ecological security problems, such as soil pollution, land desertification and salinization, soil erosion, and the overexploitation of resources [6,7,8], exposing ecosystems to the possibility of imbalance and functional degradation, and threatening regional sustainable development [9,10]. The state has responded positively to this by proposing that initiatives such as ecological civilization construction, ecological civilization system reform, and the construction of a “beautiful China” be carried out through work related to ecological protection [11,12]. Consequently, against the backdrop of the upcoming implementation of the new “14th Five-Year Plan for National Economic and Social Development” and “Master Plan for Land Use,” an urgent issue now revolves around ways in which to scientifically formulate land-use optimization plans, to maintain the balance of the land ecosystem, and to promote the efficient use of land resources and sustainable development.
The optimal allocation of land use is an important path to achieve rational land use and regional sustainability [13]. A common optimization measure is to achieve the maximum benefit of land resource utilization by setting optimization objectives and constraints [14]. In early research on optimal land-use allocation, the maximization of economic and social benefits was taken as the starting point [15], and attempts to solve the optimal land-use allocation scheme were made using gray linear programming, multi-objective programming, and statistical models [16,17,18], but this did not solve the problem of environmental damage. In recent years, environmental degradation and pollution have led researchers to pay more attention to the ecological security of urban development [19,20,21], and land-use optimization based on ecological benefits has become a research hotspot [22,23,24]. With the continuous improvement in research methodology, heuristic intelligent optimization algorithms and uncertain mathematical optimization models are now widely used in the field of land-use structure optimization [25,26]; these are constrained in terms of both the land-use quantitative structure and spatial layout. These models emphasize spatial pattern optimization; however, they do not consider the heterogeneity of development patterns and ecological conditions in different regions, so they cannot accurately reflect the sustainability of cities [10,24]. In such cases, it is necessary to separate different functional zones and implement different optimization indicators and measures according to the current situation and potential of different regions, regional development strategies, resource and environmental carrying capacity, and land-use suitability. A number of studies have been conducted on spatial structure delineation methods, including urban growth boundaries (UGB) [27], counter-planning theory [15], pressure-state-response (PSR) modeling [28], ecological networks (EN) [29], and land ecological suitability (LES) [30]. The ecological security pattern (ESP) is often regarded as a spatial constraint, yet few studies have focused on the optimal allocation of land use from the perspective of ESPs.
The ESP serves as a crucial spatial pathway to ensure regional ecological security and achieve sustainable development [21]. It has gained widespread application and recognition as a bottom-line constraint for protecting ecological security and controlling urban expansion [30,31,32,33]. At present, the research framework of “source identification → resistance surface construction → corridor extraction” is the basic paradigm for constructing an ESP [34]. For source identification [35], the importance of ecological patches in a region are assessed from various perspectives, such as ecosystem service functions, ecological sensitivity, and landscape connectivity, by establishing different indicator systems [10,36,37]. Integrating multiple evaluation index systems is currently a common screening method for identifying ecological sources [10]. The construction of resistance surfaces is mostly based on indicators such as land-use and land-cover change (LUCC), habitat quality, topography, impervious surface area, population density, and nighttime light data; this is followed by the assignment of values via expert experience or an analytical hierarchy process [38]. For corridor extraction [39,40], the circuit theory model hypothesizes ecological flow as a random walk of electric currents, simulating the random walk characteristics of species [41,42], which is capable of identifying all possible paths of ecological flows moving between ecological sources, and is not limited to identifying a single optimal path [37,43]. This model has been widely used to simulate ecological corridor processes. Additionally, the minimum cumulative resistance (MCR) model considers the spatial distribution of ecological sources and morphological characteristics of corridors [44], effectively identifying ecological functional zones; in recent years, this theory has been applied to the simulation of ecological land protection and regional land expansion [45,46]. Different simulation scenarios are coupled by separating different ecological functional zones.
In LUCC research, the simulation prediction of land-use change has become a hot topic [47], and various modeling methods have been employed to optimize land-use allocation, including the Markov [48], system dynamics (SD) [49], cellular automaton (CA) [50], and artificial neural network (ANN) models [51], among others. However, owing to the comprehensiveness and complexity of land systems, these bottom-up approaches rely on their own transition rules to allocate each land-use type to appropriate locations [52], ignoring the influence of land-use intensity and intrinsic drivers on the simulation process [53]; they fail to adequately describe the causation and processes of land use, resulting in the disregard of competition and complex interactions between land conversion processes [21,27]. To address these issues, models have been developed based on pattern analysis strategies (PAS), including the CA-Markov [54], conversion of land use and its effects at a small region extent (CLUE-S) [55], and future land-use simulation (FLUS) models [53]. While widely used, these models lack the ability to uncover the underlying causes of land-use changes and struggle with dynamic spatiotemporal simulations of various land-use types, especially patch-level changes in natural landscape types such as woodland, grassland, and marshland. Liang et al. proposed the parcel-level land-use simulator (PLUS) model that can improve the inadequacy of transition rule digging and landscape dynamic simulation [56]. This model is based on and greatly improves upon the traditional CA model, combining the advantages of transition analysis strategy and PAS, which can not only reveal the potential drivers of land-use change, but also successfully simulate the evolution of patches of multiple land-use types. In comparison with other models, the PLUS model achieves higher simulation accuracy and provides landscape pattern indices that are closer to reality [2].
Baicheng is situated in a typical arid/semi-arid ecologically fragile region of China. In recent years, owing to socioeconomic development and population growth, a substantial amount of ecological land, including wetland, woodland, and grassland, has been converted to non-ecological uses. The area of ecologically fragile sandy and saline–alkaline land has expanded continuously in recent years, leading to severe ecological consequences, disrupting the balance of ecosystems, and directly impacting regional sustainable development. Therefore, it is particularly important to scientifically and rationally plan land use in such areas, focusing on the protection of ecological land. In light of this, we focus here on Baicheng and propose a land-use optimization allocation method based on the ESP–PLUS model. We attempt to incorporate the ESP as a constraining factor into land-use simulations, aiming to optimize the land-use pattern. The specific objectives of this study are as follows: (1) explore strategies for balancing ecological conservation and economic development through the construction of ESPs for ecologically vulnerable areas; (2) simulate future land use under four different scenarios in 2030 and propose comprehensive optimization strategies under multiple coupled forecasting scenarios. The ultimate aim is to provide a basis for the optimal management of land use, ecological space construction, and territorial space planning.

2. Study Area and Data Resources

2.1. Study Area

Baicheng is situated in northwestern Jilin Province, China (44°13′57″–46°18′N, 121°38″–124°22′E) (Figure 1). It covers an area of approximately 26,000 km2, accounting for 14% of the total area of Jilin Province. The average annual precipitation is 399.9 mm, indicating a typical arid/semi-arid temperate continental monsoon climate. The terrain comprises low mountains, hills, and plains moving from northwest to southeast. The area enjoys abundant sunlight resources and there is considerable potential for wind and solar energy development. There are two national- and several provincial-level nature reserves, and the area boasts diverse landscapes and abundant flora and fauna. However, human activities have gradually encroached upon ecological patches in the region, leading to reduced biodiversity, and seriously threatening the ESP of Baicheng. The depletion of resources and deterioration of the ecological environment have begun to severely hamper the prospects of future sustainable development in the region. With the implementation of a new round of overall territorial spatial planning for Baicheng, the issues of land salinization, grassland degradation, land desertification, and wetland shrinkage are gradually being addressed. In achieving the goal of creating a “beautiful China,” how to balance the relationship between economic development and environmental protection in the context of ecological security to achieve optimal resource allocation and land-use optimization in territorial spatial planning will be a crucial question to address.

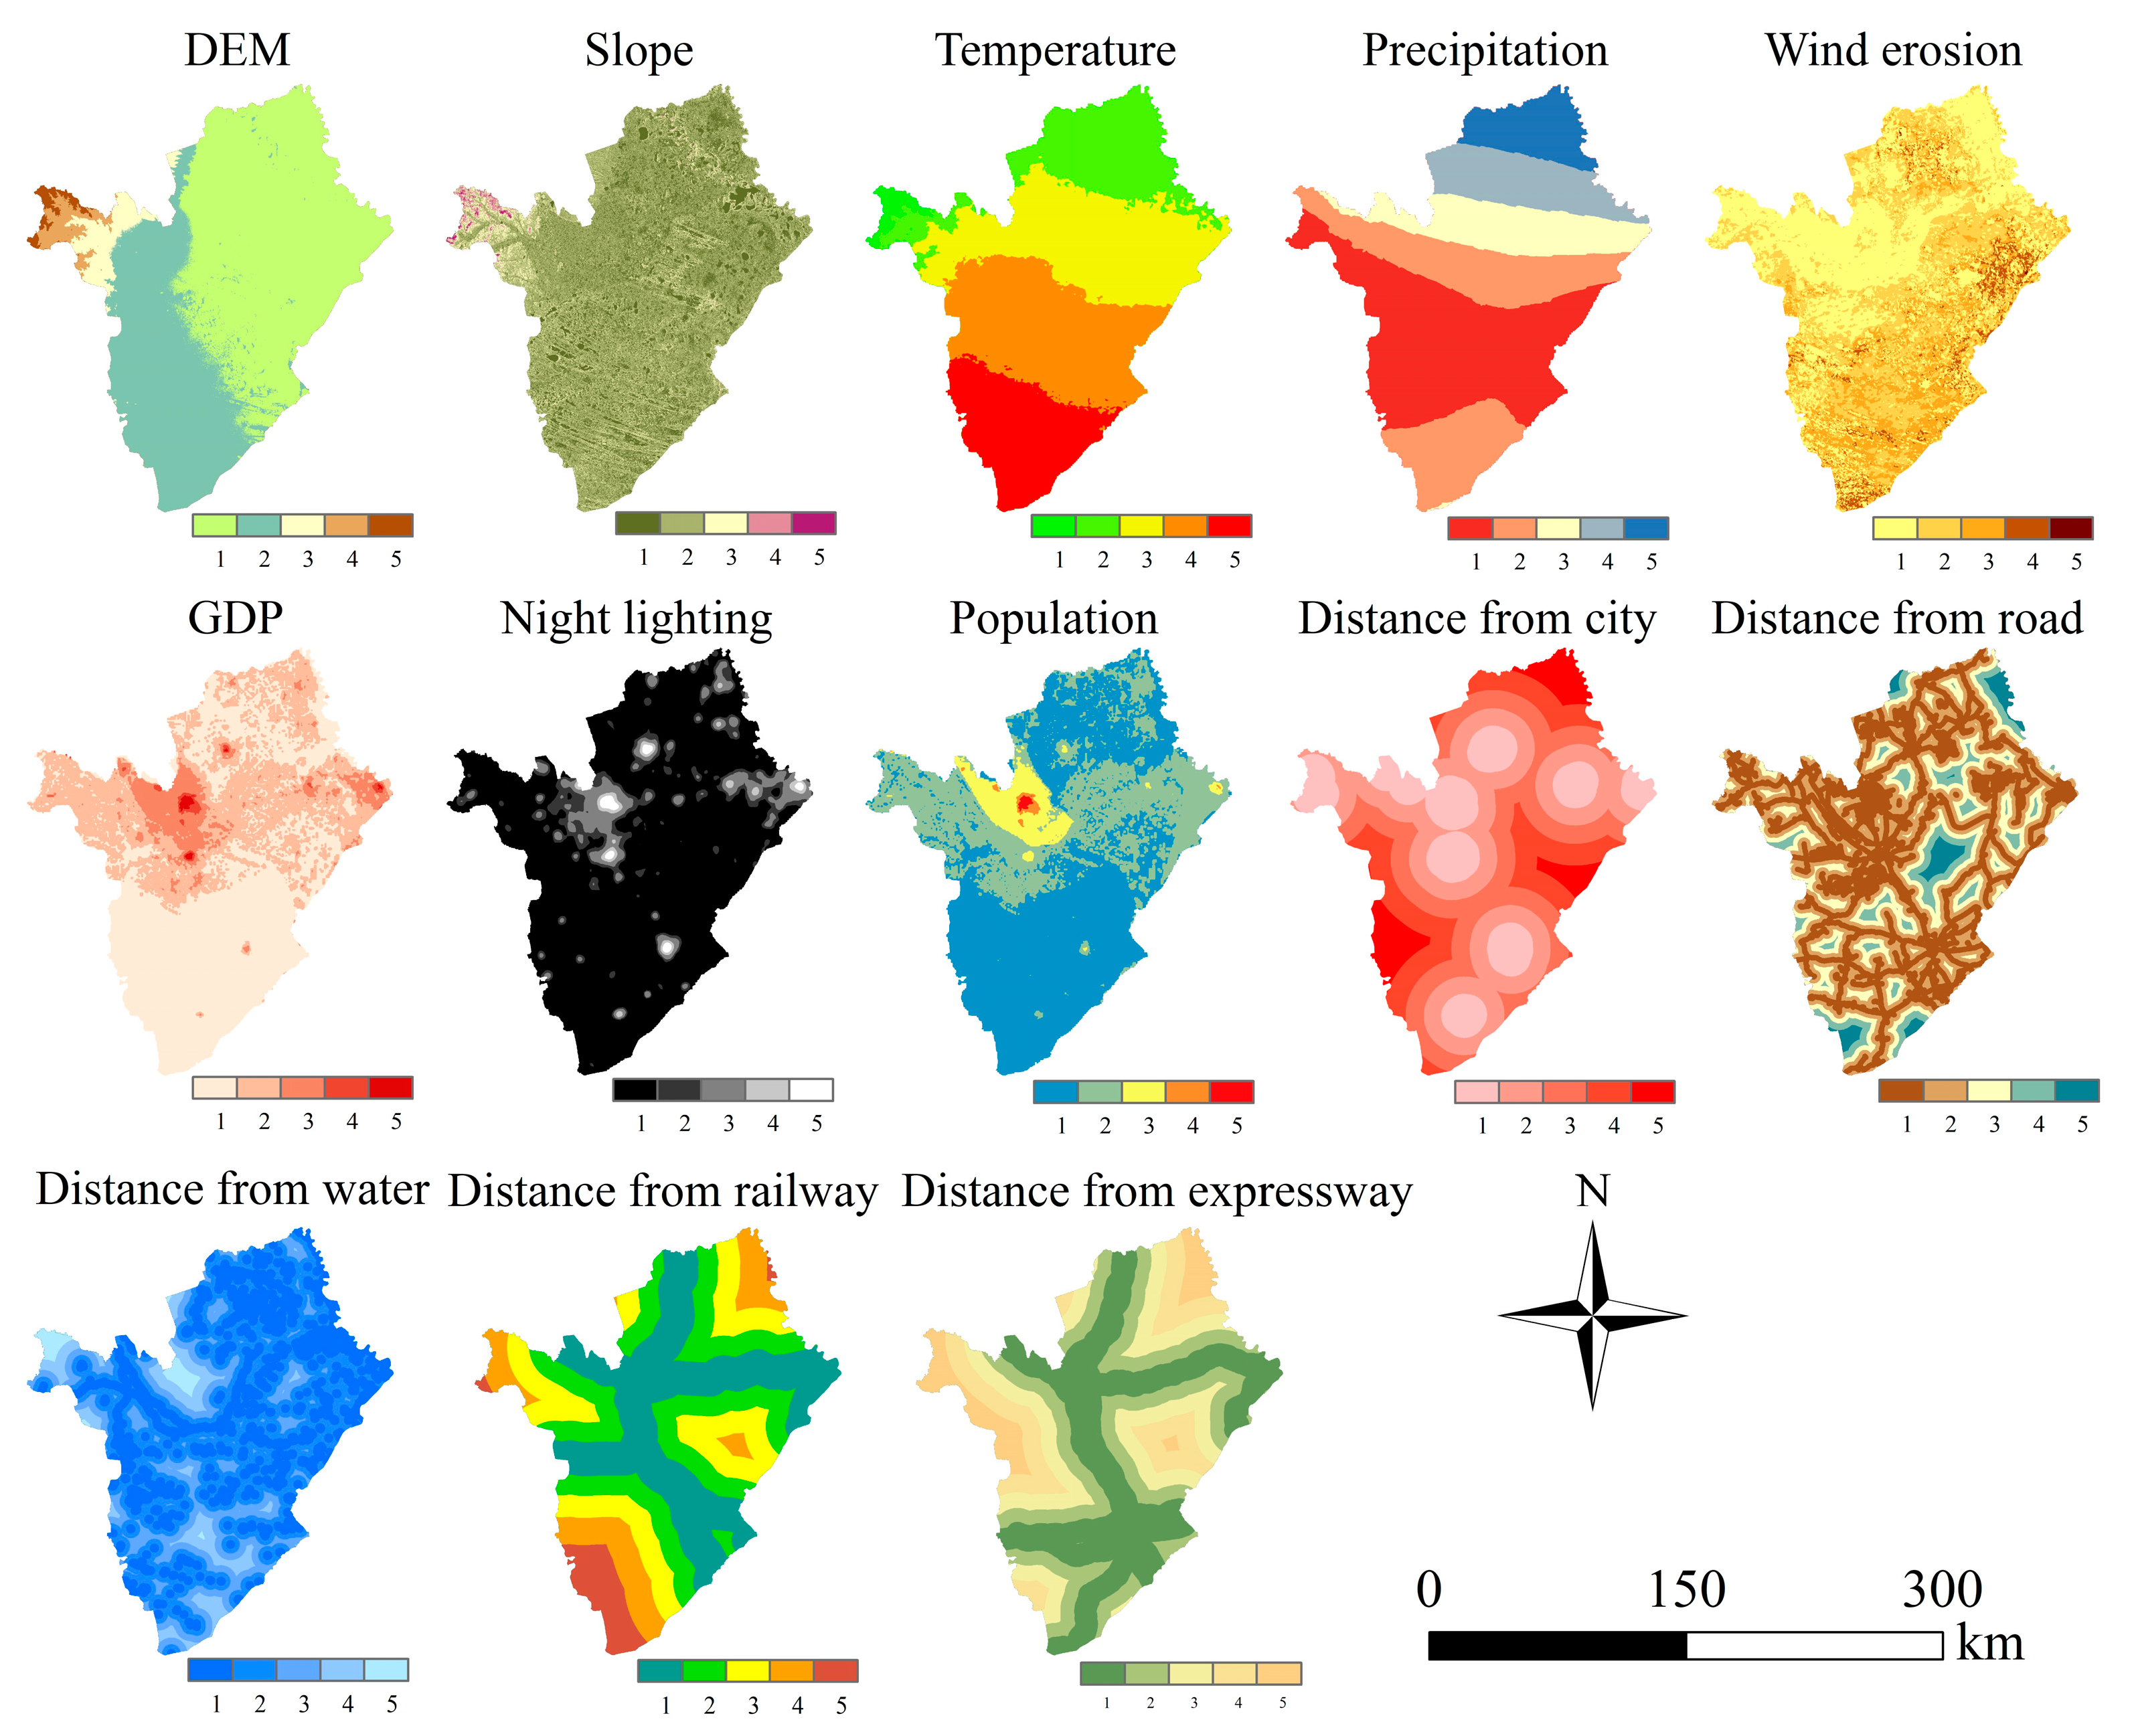
2.2. Data Sources and Processing

This study mainly used land-use data, digital elevation model (DEM) data, meteorological data, soil data, remote sensing imagery, and socioeconomic data. The relevant data sources and origins are outlined in Table 1. All data were resampled to a spatial resolution of 30 m, utilizing cubic convolution interpolation for raster data and Kriging for vector data. The projection coordinate system employed was WGS84_Albers.

3. Methodology

A comprehensive framework integrating the ESP and PLUS model for optimizing land-use allocation is proposed herein (Figure 2), consisting of three main technical steps. (1) Construction of the ESP: initially, a background diagnosis of natural elements in the Baicheng region was conducted, and ecological importance and landscape connectivity were selected. By performing an overlay analysis, regions of the utmost significance were designated as ecological sources. Resistance surfaces were constructed from three perspectives: natural factors, anthropogenic disturbance factors, and land-use types. On the basis of the MCR surfaces and ecological sources, corridors were extracted using the electric circuit theory, and ecological functional zones were delineated based on differences in expansion resistance. (2) Using the ecological sources as areas of ecological restriction, the PLUS model was used to simulate land use under the four chosen scenarios in 2030, and the ecological functional areas were coupled with the corresponding simulation scenarios. (3) An analysis of landscape patterns was performed and optimized land-use configuration results were obtained.

3.1. Constructing the ESP

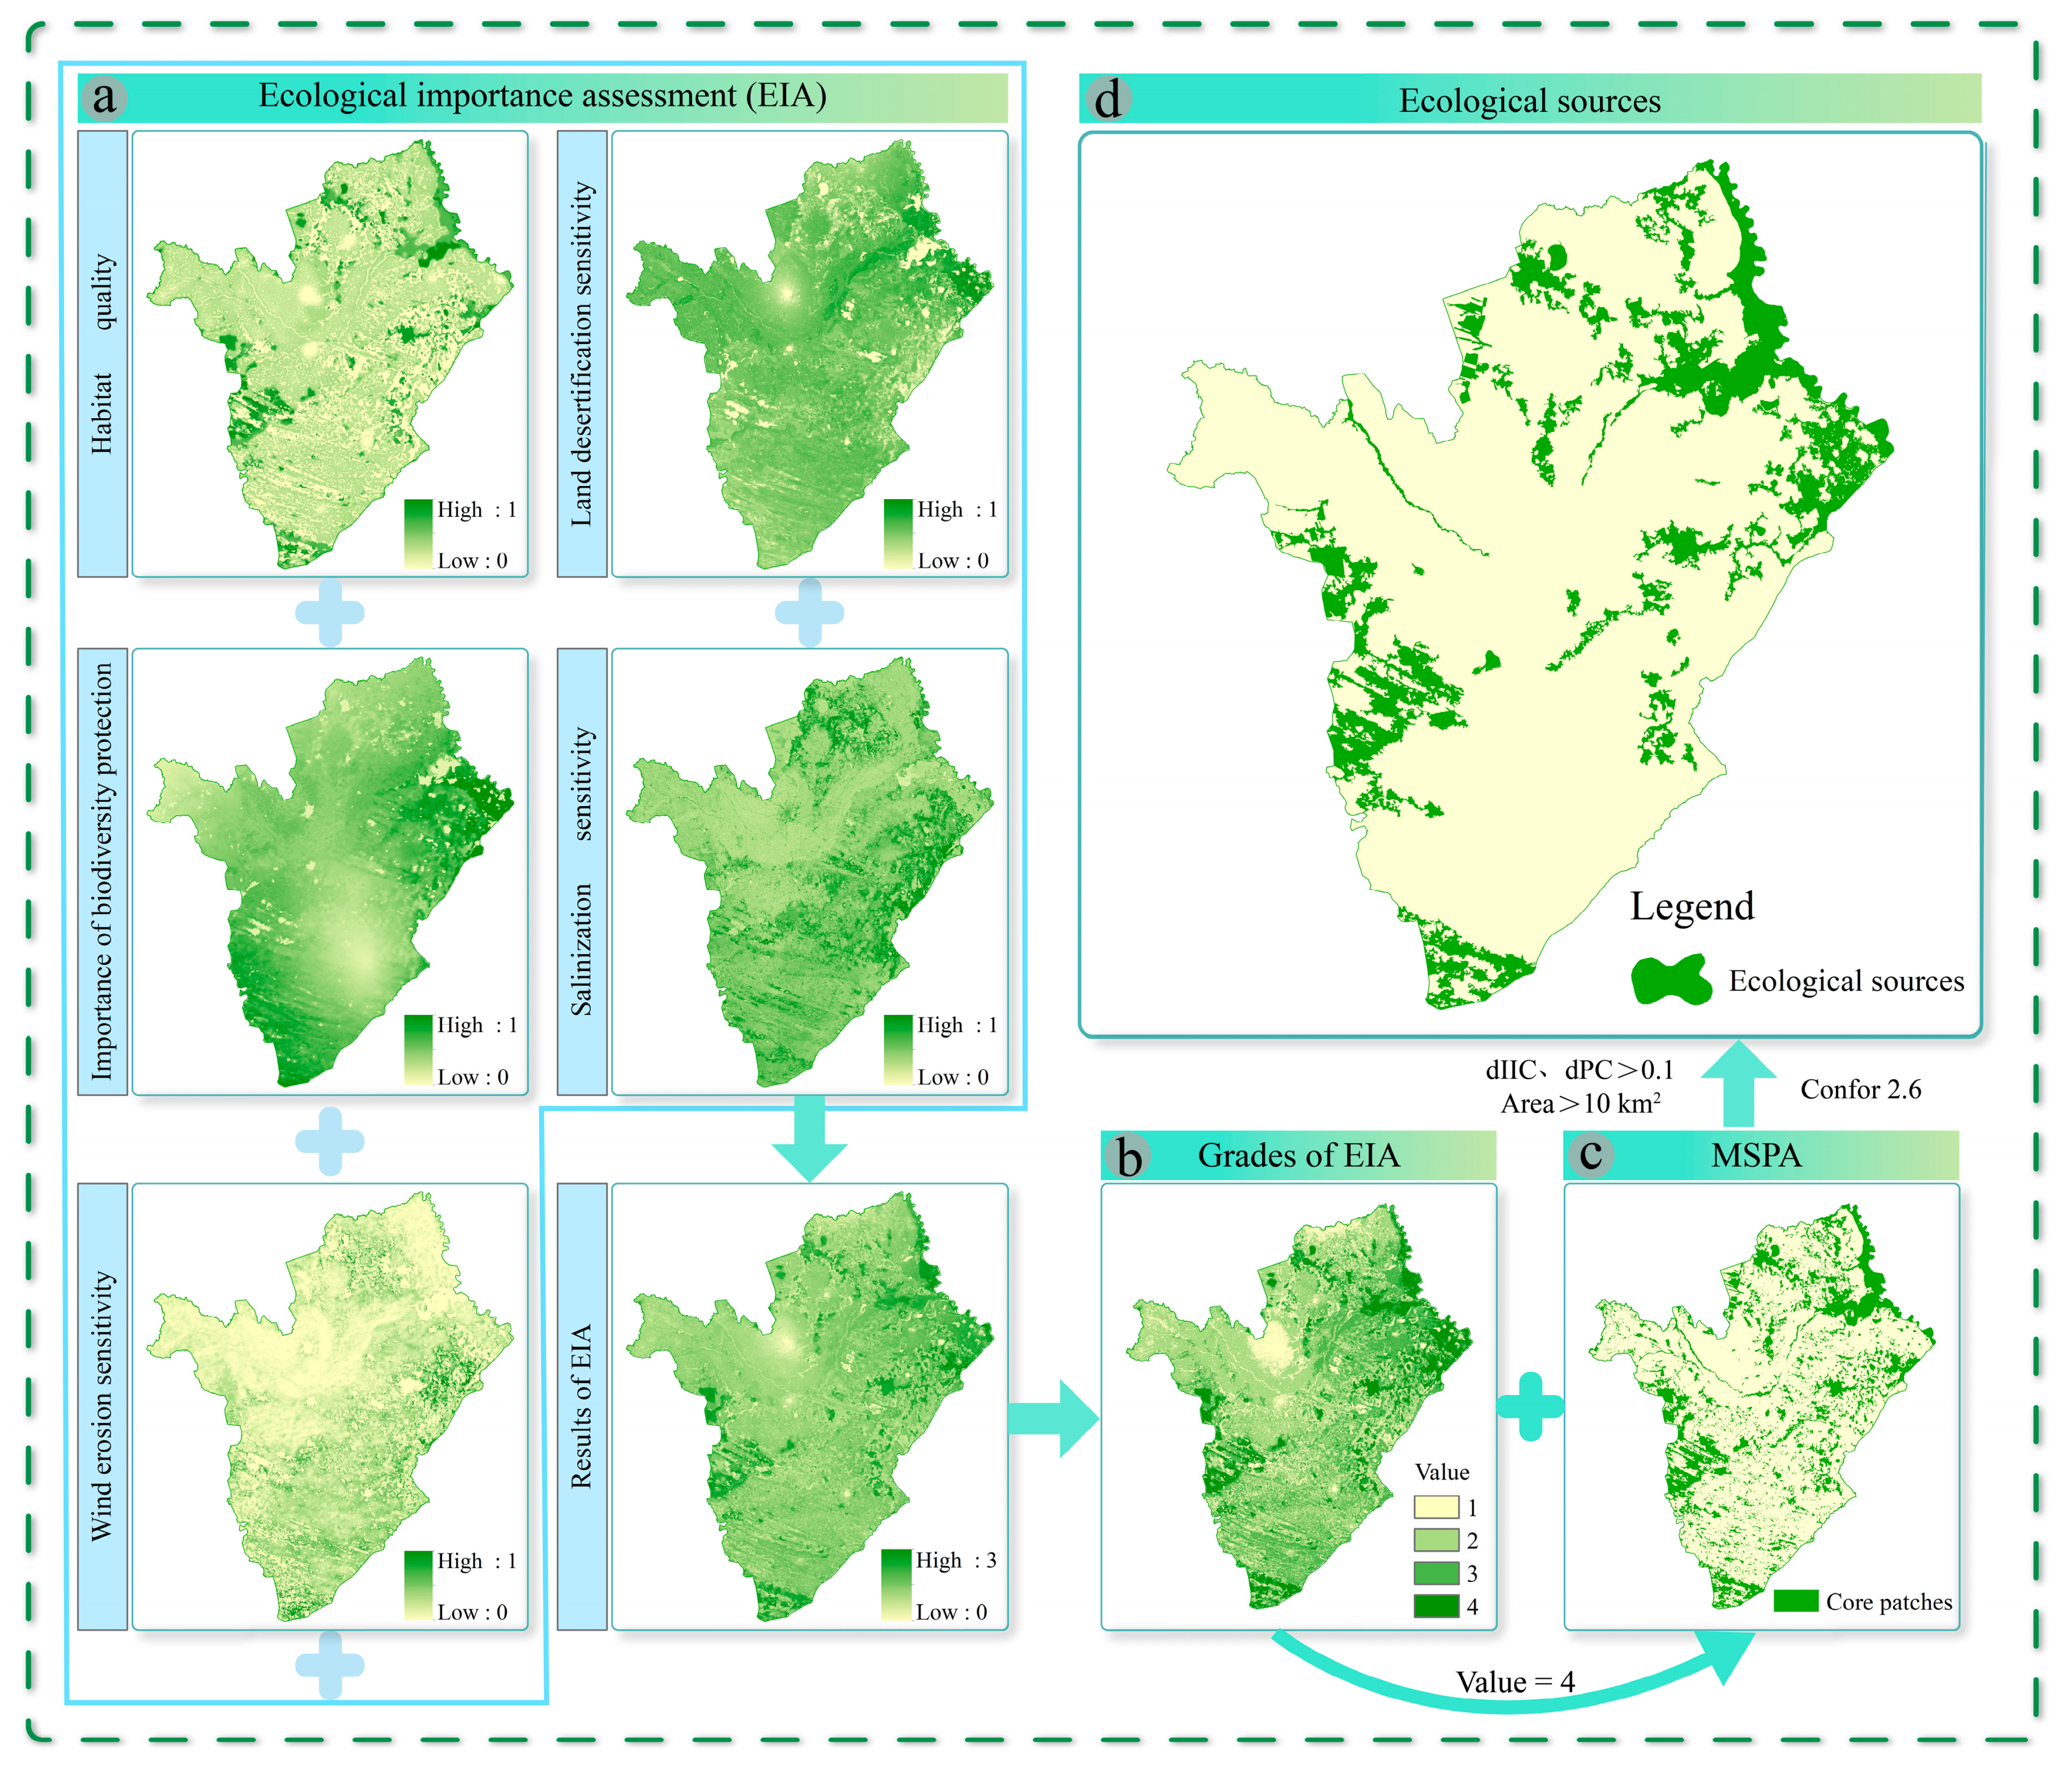
3.1.1. Identification of Ecological Sources

Ecological sources are habitat patches that take on the main radiating functions of the region [35], forming the foundation of the ecological security pattern. In this study, ecological sources were determined by integrating ecological importance and landscape connectivity. This approach not only considered the process of responding to external environmental changes but also maintained the integrity of ecological processes. The process of identifying ecological sources is illustrated in Figure 3.
(1) Ecological importance assessment. On the basis of the ecological background of the study area, the habitat quality, biodiversity, wind erosion sensitivity, land desertification sensitivity, and salinization sensitivity were selected for the ecological importance assessment. The ecological importance assessment method is detailed in Table 2. Five types of importance factors were overlain with equal weight and divided into four levels using the natural break method. High-value area patches (level 4) were extracted and after excluding patches with an area of <5 km2, these were used as the evaluation results.
(2) Landscape connectivity. The morphological spatial pattern analysis (MSPA) method was employed to identify suitable core landscape patches [57]. The patch connectivity (PC) and integrated index of connectivity (IIC) were used to quantify the importance of patches and maintain landscape continuity [58,59]. The key steps were as follows: Natural ecological land types, such as forest, grassland, water bodies, and wetland, were designated as the foreground. GuidosToolbox 3.0 software was utilized for the MSPA analysis to identify patches with core areas > 10 km2. The optimal distance threshold for the patches was determined to be 2000 m, and Confor 2.6 software was employed to calculate dIIC and dPC. Ecological patches with dIIC and dPC indices > 0.1 were selected as ecological sources.

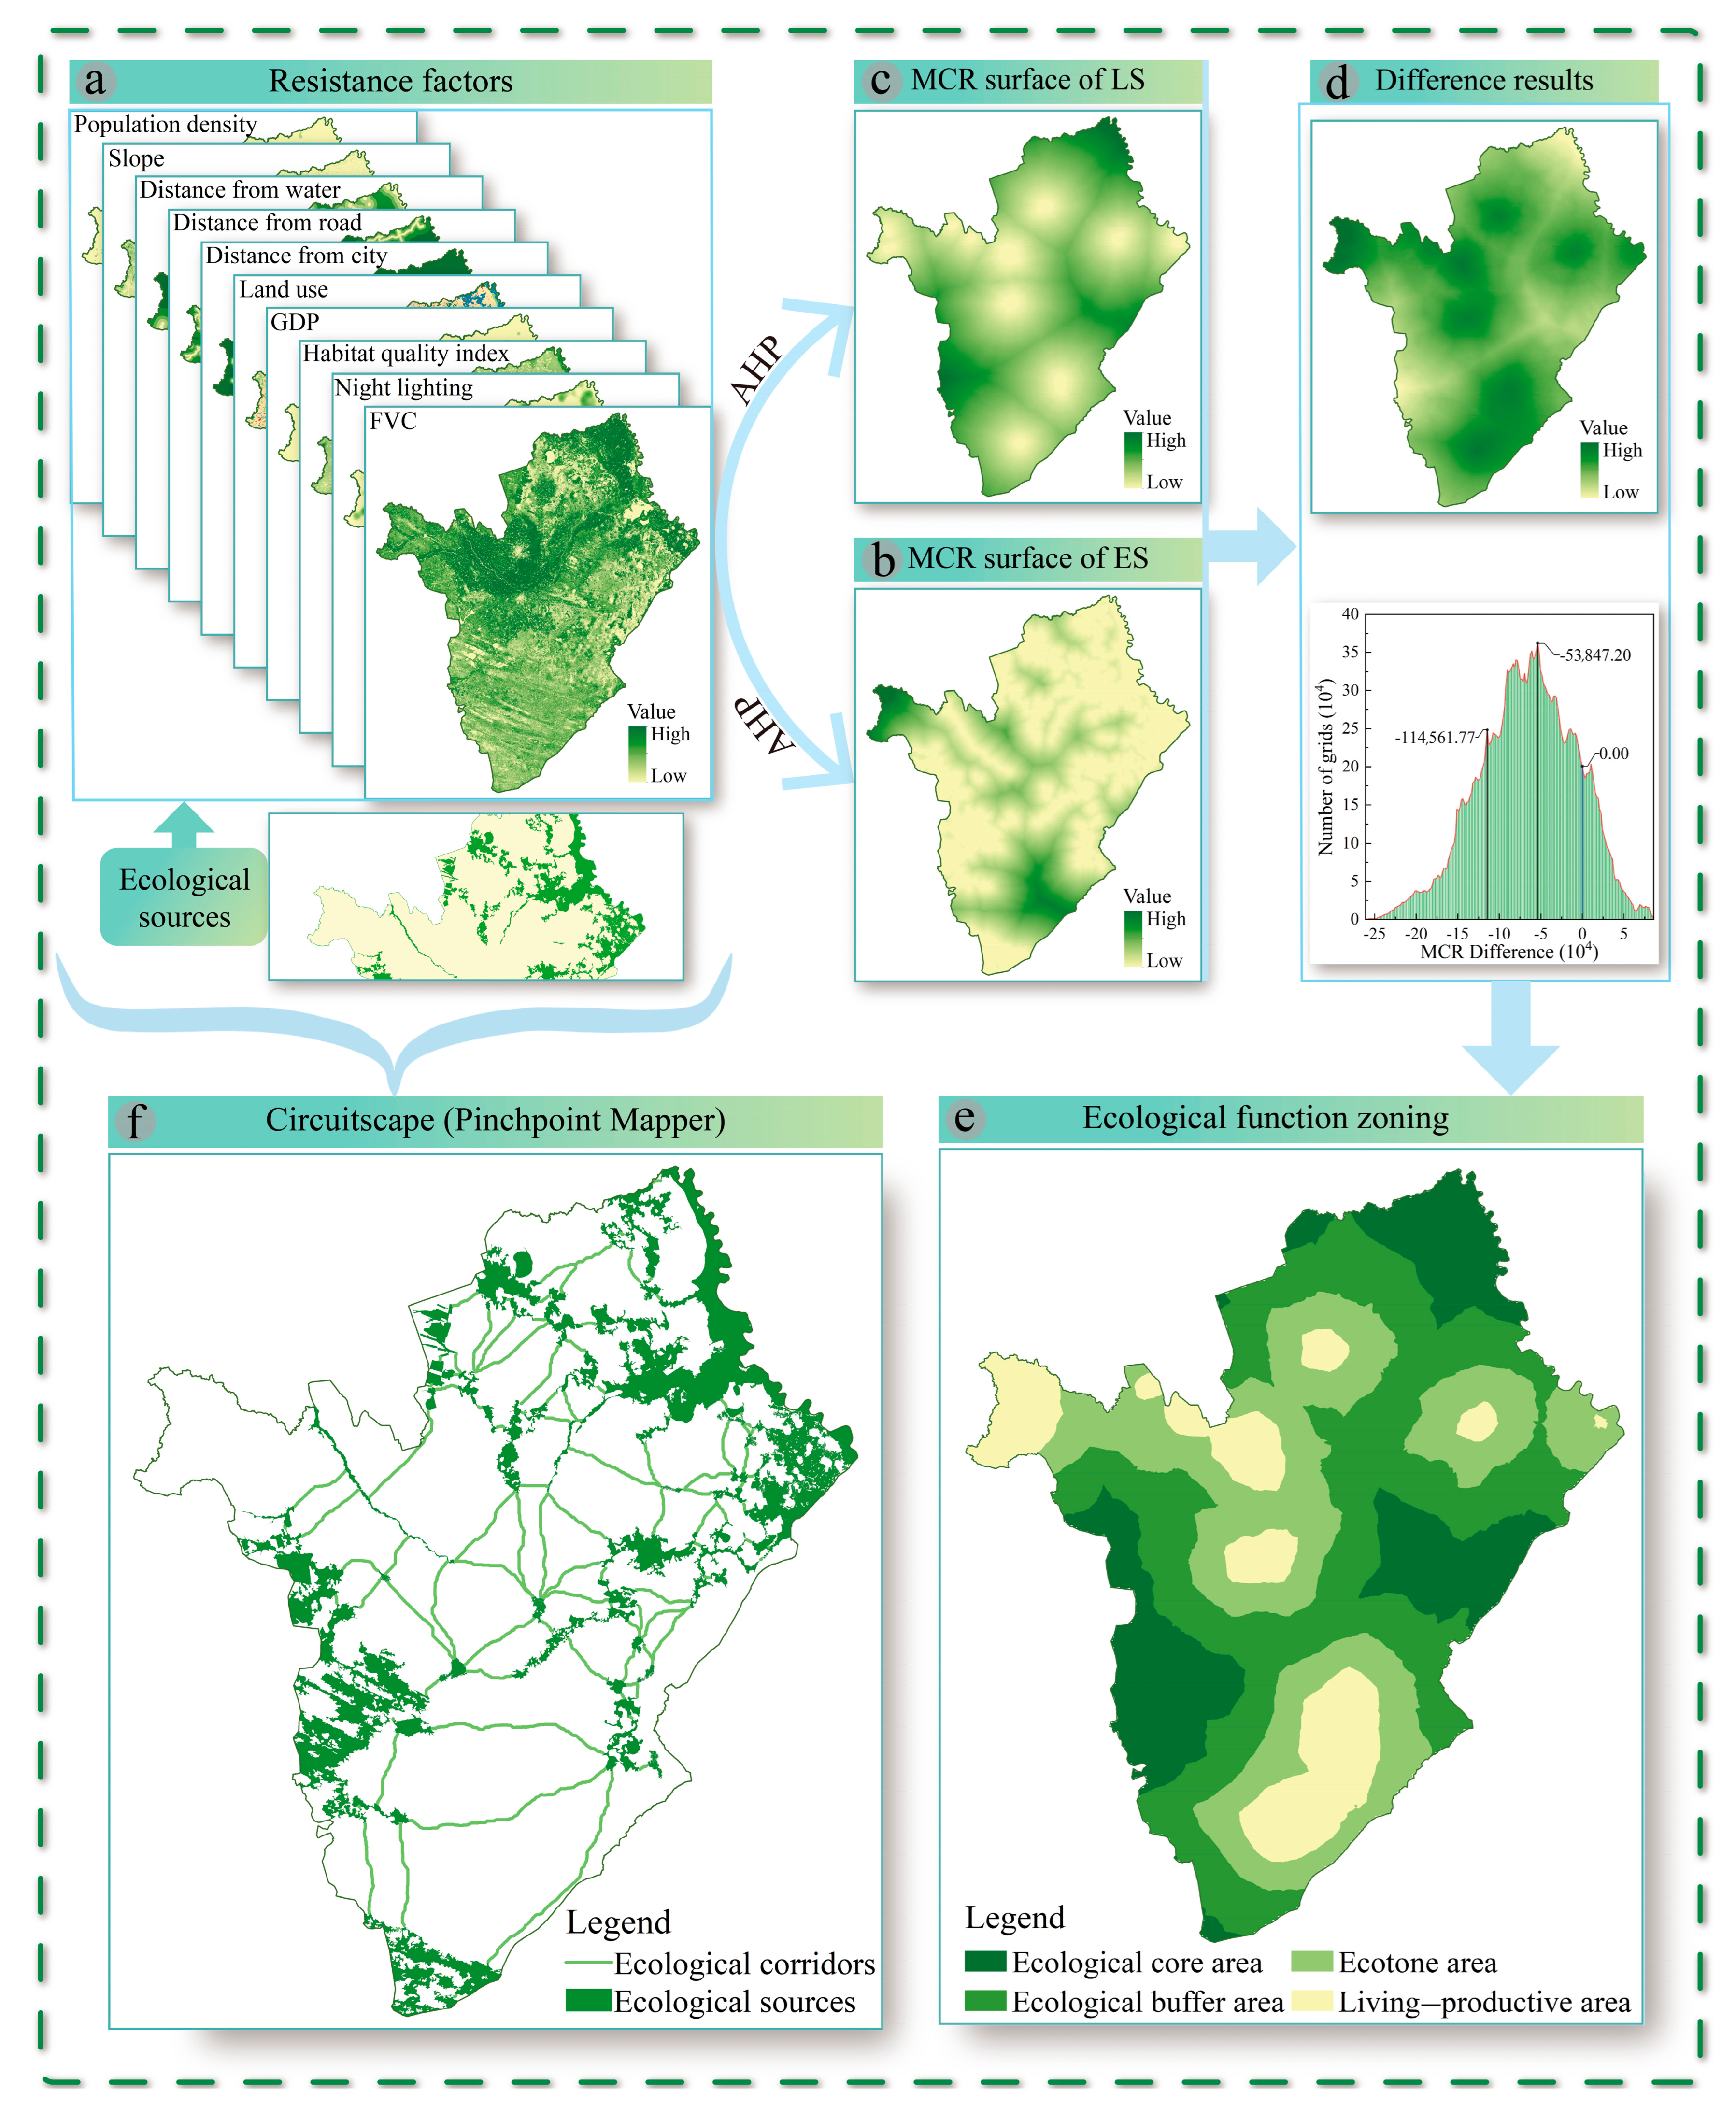
3.1.2. Construction of Ecological Resistance Surfaces and Division of Ecological Functional Zones

The construction of resistance surfaces is a crucial element in identifying ESPs [60]; this involves the selection of resistance sources, establishment of resistance assessment systems for ecological sources (ES) and living sources (LS), and calculation of minimum resistance costs. This drew on relevant research findings [38,61,62], and fully considered the characteristics of the ecological environment and current land-use situation in Baicheng, while following the principles of systematicity, data accessibility, and operability. Ten indicators were selected from three aspects—socioeconomic, natural environment, and location factors—to serve as resistance sources for ES and LS. The resistance factors were categorized into five levels, with higher values indicating stronger resistance. For factors with unknown classification thresholds, a combination of natural breaks and expert knowledge was used for the definition [63]. The weight of each resistance factor was determined using the analytic hierarchy process, as illustrated in Table 3. Finally, the weighted summation method was used to obtain the comprehensive resistance surfaces for both ES and LS.
The MCR model is widely employed in studies simulating urban land evolution processes and landscape security patterns. This model assumes that during expansion from an ES, higher resistance values favor construction, while higher resistance values during expansion from an LS favor ecological protection. These two aspects mutually constrain each other, and the role of the MCR model lies in harmonizing this expansion process [64]. Utilizing the cost distance tool, the MCR surfaces for ES and LS were calculated separately. The difference between these surfaces was calculated using a raster calculator, which represents the ecological or living suitability zoning of the area and is also the basis for ecological function zoning [3]. The formula is as follows:
M C R d i f f e r e n c e = M C R E S M C R L S .
when M C R d i f f e r e n c e < 0 , the region has little resistance to ES expansion and is suitable for ES expansion. Conversely, if M C R d i f f e r e n c e > 0 , it is more suitable for LS expansion. When M C R d i f f e r e n c e = 0 , this represents the boundary between ES and LS expansion.
When the MCR difference was −114,561.77 and −53,847, there were abrupt changes in the number of grids. The threshold of functional zoning was determined according to the mutation and demarcation points. The MCR difference surface was then reclassified, and in conjunction with the “14th Five-Year Plan” of Baicheng City, four types of ecological functional zones were established: the ecological core area, ecological buffer area, ecotone area, and living-productive area (Tables S1 and S2). The identification process is illustrated in Figure 4.

3.1.3. Extraction of Ecological Corridors

Ecological corridors are low-resistance pathways for the flow of material and energy in ecosystems, which help improve the connectivity potential between ecological sources and can be planned as urban green infrastructure [44]. In this study, we used circuit theory to assess the connectivity of ecological corridors. Circuit theory views ecological landscapes as conductive surfaces [43], assigning low-resistance values to landscape components that facilitate species movement, and high-resistance values to landscape components that impede the flow of material and energy for ecological processes; thus, ecological flows in heterogeneous landscapes are modeled based on the random walk properties of charges [37]. Circuit theory calculations were performed using Circuitscape 4.0.3 software, and the Linkage Mapper tool was used to identify regional ecological corridors. A total of 102 potential ecological corridors were identified. Given that the width of ecological corridors is typically determined through empirical methods, we referred to the relevant literature and set the ecological corridor width at 120 m [3,41,61]. The identification process is illustrated in Figure 4.

3.2. Land-Use Change Simulation

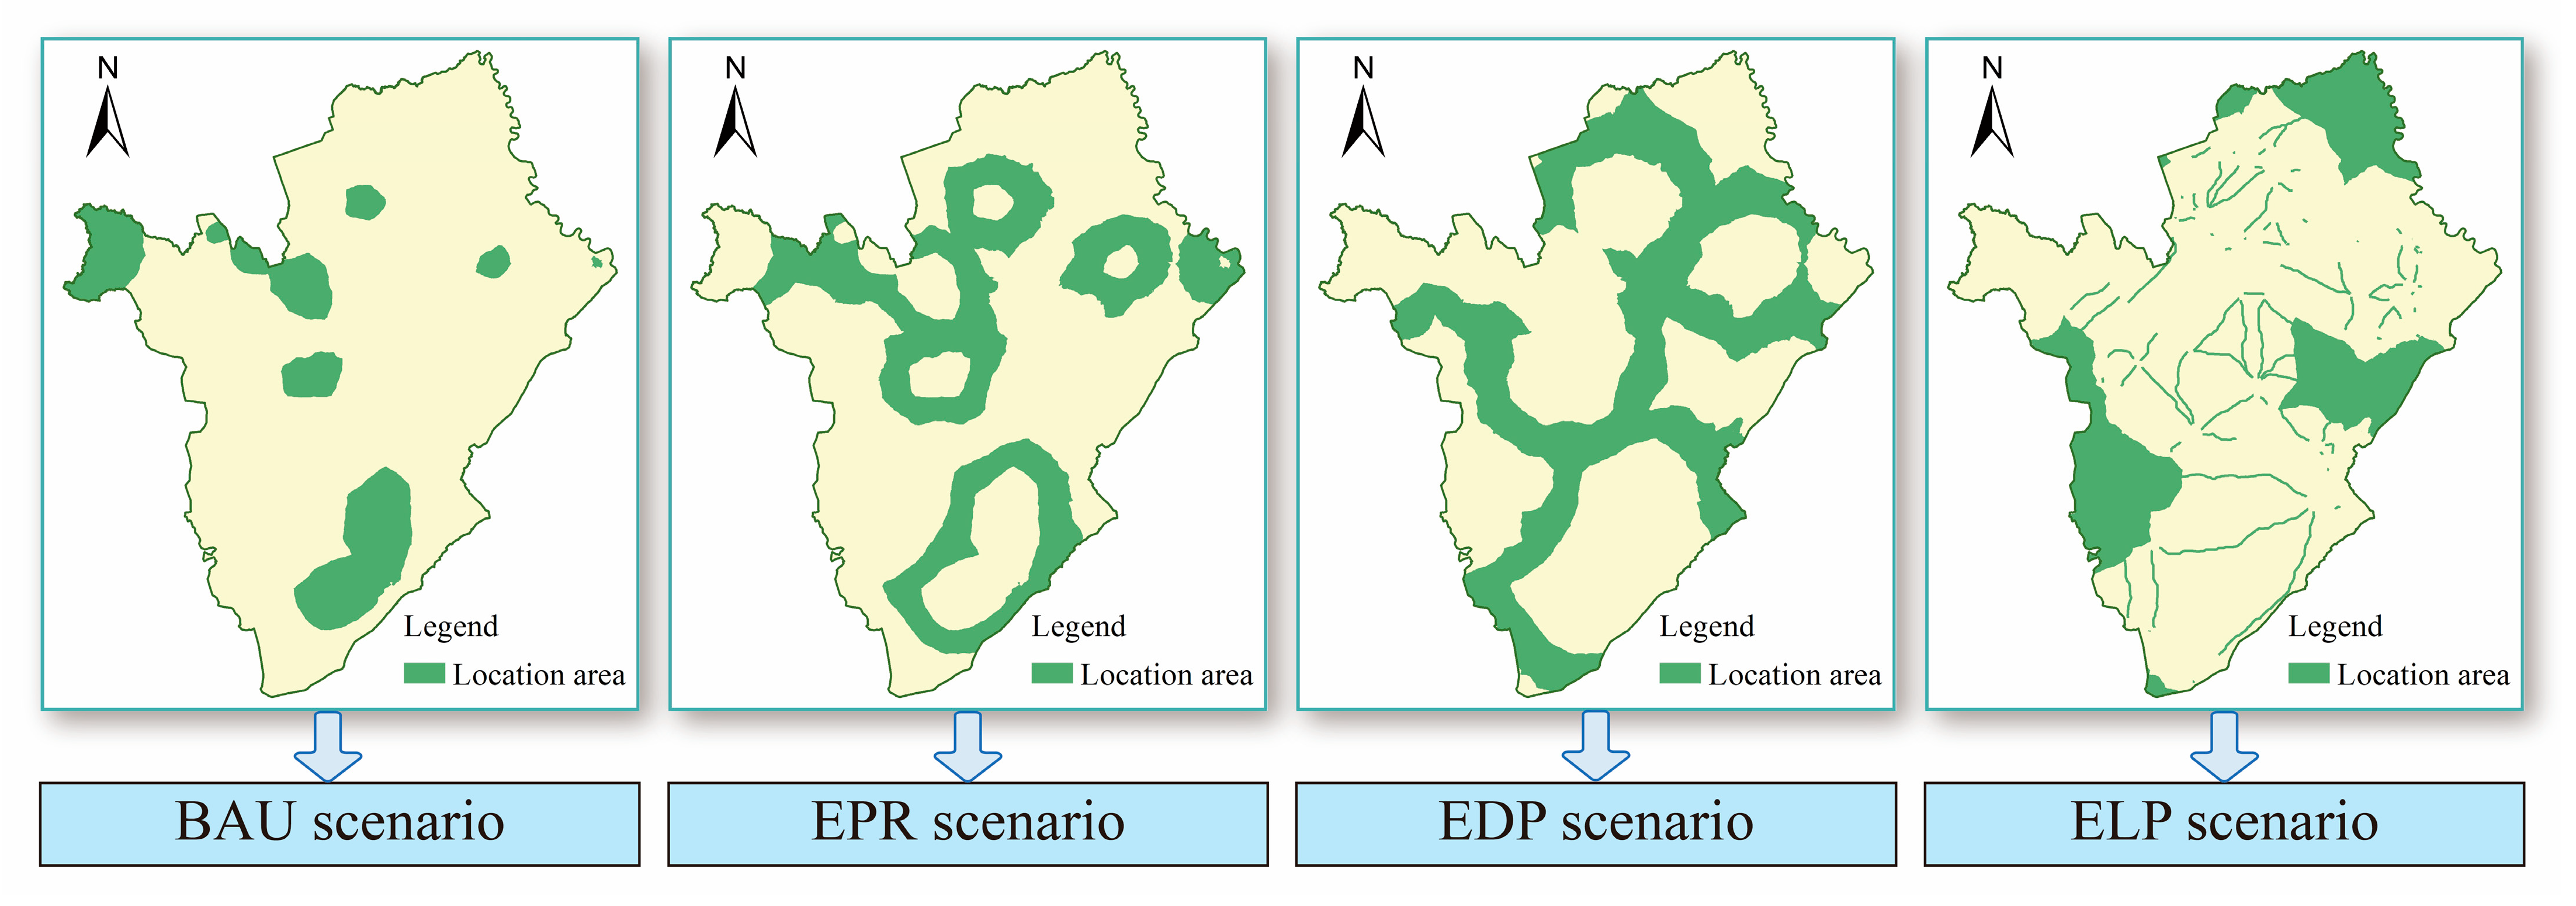
3.2.1. Design of Four Development Scenarios

Considering the functional stability and security of the ecosystem, the functional zoning of the ESP served as the basis. Four simulation scenarios were established corresponding to the ecological functional zones: business as usual (BAU), ecological priority restoration (EPR), ecological development priority (EDP), and ecological land protection (ELP). Here, ecological sources were defined as non-developable or restricted regions. The correspondence between ecological functional zones and land-use simulation scenarios is illustrated in Figure 5. To ensure that future LUCC changes in various scenarios aligned with the characteristics of each ecological functional zone, we adjusted the raster demand for each type of land use under the planning constraint scenario; this was completed with reference to existing studies and relevant policy documents [24,65], such as the Baicheng City Urban Overall Plan (2014–2030) and Baicheng City Territorial Spatial Overall Plan (2021–2035). The specific adjustments for each scenario were as follows.
BAU scenario: Taking socioeconomic development and food security as the starting point, stable industrial spatial patterns and a certain level of cultivated land utilization demand were maintained. This scenario was set according to current trends. The 2030 land-use requirements were simulated using the Markov chain model, and then the PLUS model was employed to simulate the 2030 land use. This scenario was applied to the living-productive area.
EPR scenario: This scenario served as a transition zone between the concentrated area of production–living expansion and ecological space development. Cultivated land and unused land were the primary land-use types. The focus was on ecological restoration, with a particular emphasis on the protection of grassland and forested areas within the research area. In this scenario, the probability of cultivated land being converted to construction land was reduced by 10%, and the probabilities of forested and grassland areas being converted to construction land were reduced by 20%. Additionally, the probability of unused land being converted to other land types was increased by 20%. This scenario was applied to the ecotone area.
EDP scenario: This scenario emphasized rational development and utilization while safeguarding environmental quality. The primary focus was on maintaining the health of the ecosystem. In this scenario, the probability of forested, grassland, water, and wetland areas being converted to construction land was reduced by 20%. Additionally, the probability of construction and unused land being converted to other land types (excluding cultivated land) was increased by 20%. This scenario was applied to the ecological buffer area.
ELP scenario: This scenario took ecological benefits as an optimization goal, strengthened ecological land protection, prohibited any construction activities, and appropriately reduced rural residential land. In this scenario, the probability of forested, grassland, and water areas being converted to construction land was reduced by 30%. Additionally, the probability of cultivated and unused land being converted to forested, grassland, water, and wetland areas was increased by 30%. This scenario was applied to both the ecological core area and ecological corridors.
A transition matrix was used to represent the likelihood of land conversion between different land-use types, where 1 indicates that a certain land type can transition to another, and 0 indicates that a certain land type cannot transition. According to the land-use planning documents of the study area, actual land-change situation, and development requirements under the different scenarios mentioned above, different land-use transition matrices were established (Table S3).

3.2.2. Parameter Settings of the PLUS Model

(1) Selection of driving factors: Land-use changes are influenced not only by natural and socioeconomic factors but also by the comprehensive impact of geographical spatial location factors [23]. In this study, we referred to existing research [21,27], and selected the following driving factors: DEM, slope, annual average temperature, annual average precipitation, wind erosion, and other natural elements. Additionally, we included transportation- and location-related factors, such as distances to water bodies, railways, highways, provincial roads, national roads, county roads, township roads, and urban areas. Moreover, socioeconomic factors were also considered, including nighttime light data, gross domestic product (GDP), and population (Figure 6). To ensure consistency in the row and column numbers of raster data, a resolution of 30 m was set.
(2) Restricted area: The restricted area was comprised of 48 identified ecological sources from the ESP recognition. It was transformed into a binary image containing only 0 and 1 values.
(3) Neighborhood weight parameters: The neighborhood weight represents the expansion capability of land-use types driven by external factors, and ranges from 0 to 1. A higher value indicates a stronger expansion capability of that land type and less susceptibility to occupation by other land uses [27]. In this study, we calculated the expansion intensity based on the changes in land-use areas from 2010 to 2020. The formula is as follows, and the resultant neighborhood weight values are shown in Table S4.
W i = T A i T A m i n T A m a x T A m i n ,
where W i represents the neighborhood weight of the i -th land-use type; T A i is the expansion area of the i -th land-use type; and T A m a x   a n d   T A m i n represent the maximum and minimum expansion areas, respectively.
(4) Model accuracy validation: To validate the simulation accuracy of the PLUS model, land-use conditions for the year 2020 were simulated based on land-use data for the years 2000 and 2010. The simulated 2020 land-use results were then compared with the actual 2020 land-use data for accuracy validation. A sample of 10% of the units was selected, and the overall accuracy and Kappa coefficient were calculated. According to previous research, a Kappa coefficient > 0.8 is generally considered to be at a good level. In this study, the simulated Kappa coefficient was 0.89, and the overall accuracy was 0.92. Therefore, the parameters set for the PLUS model can be used to simulate and optimize the spatial layout of future land use in Baicheng. Using the 2020 land-use data as a base, the model simulated future land use under different development scenarios.

3.3. Landscape Pattern Index

Landscape indices can reflect information on landscape patterns of land-use types within a region. By utilizing targeted landscape indices, it is possible to quantitatively and rapidly depict the structural and spatial configuration characteristics of land-use landscape patterns [66]. Landscape pattern indices were computed using FRAGSTATS 4.2 software (raster version). We selected nine indices that offer insight into landscape structure and spatial configuration: number of patches (NP), patch density (PD), edge density (ED), land shape index (LSI), largest patch index (LPI), splitting index (SPLIT), patch cohesion index (COHESION), Shannon’s diversity index (SHDI), and aggregation index (AI). The definitions and formulae for each of these indices have been thoroughly discussed in Wu et al. [67].

4. Results

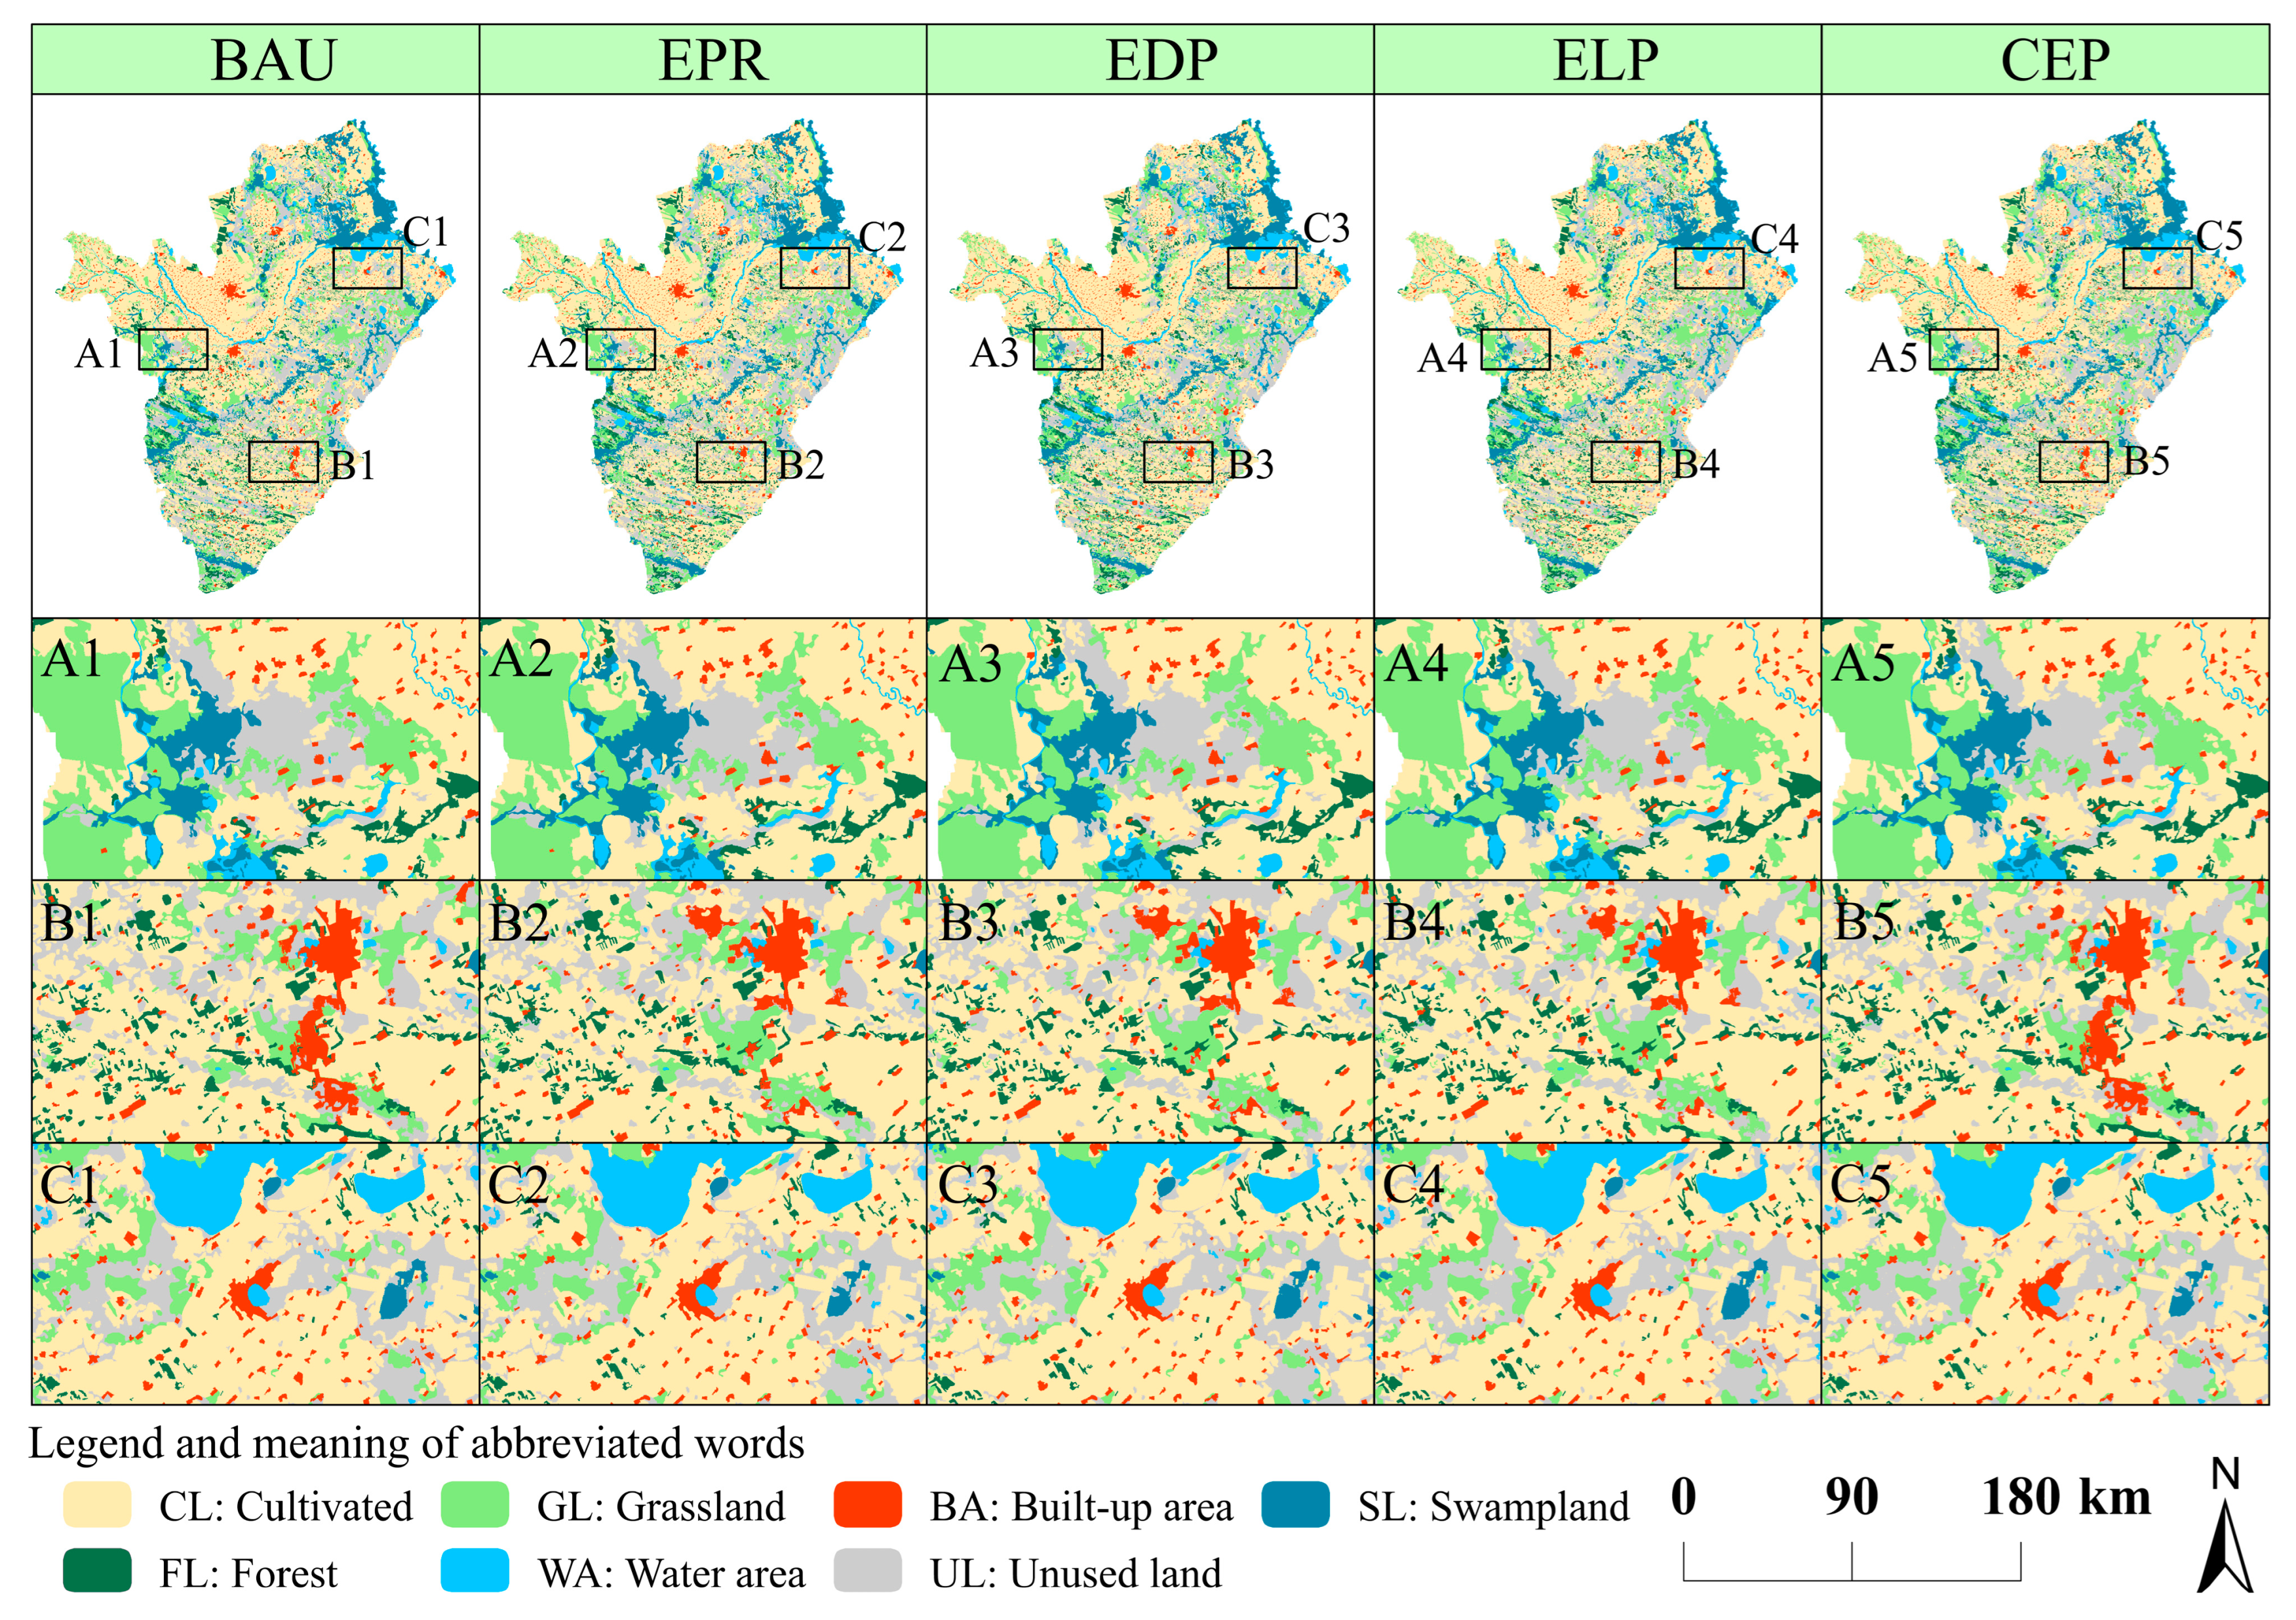
4.1. Land-Use Change Simulation Results

Using the PLUS model and our four predefined development scenarios, the simulated land-use situations for the year 2030 were obtained (Figure 7). Then, using the ArcGIS spatial overlay analysis, the transition matrices of land-use area changes for the four scenarios were derived.
In the BAU scenario, the land-use pattern in Baicheng for the year 2030 continued the trend from 2010 to 2020. The comprehensive dynamic degree of land use decreased from 0.37% (2010–2020) to 0.14%. The expansion of cultivated land was rapid and primarily sourced from unused land and forest, contributing 1.81% and 0.38%, respectively. The increase in built-up land area remained consistent with the previous period and was mainly derived from grassland and unused land. Forest, swampland, water bodies, and unused land all experienced some decline, with the most substantial reduction seen in unused land, decreasing by 6.43% compared with 2020.
In the EPR scenario, the built-up land area increased by 39.38 km2, a 4.84% increase compared with 2020: the major source was unused land, contributing 8.88%. The cultivated land area increased by 2.28% and the grassland area increased by 4.05 km2. The forested area expanded, primarily sourced from unused land, accounting for 0.65%. The unused land, water body, and swampland areas decreased by 333.44, 9.74, and 3.64 km2, respectively.
In the EDP scenario, the built-up land area increased by 30 km2, primarily sourced from unused land, constituting 3.73%. Compared with 2020, the cultivated land area increased by 1.86%, grassland area by 3.33%, forested area by 2.74%, and swampland area by 1.49%. The unused land area decreased by 8.03% and the water body area decreased by 0.5%.
In the ELP scenario, the expansion of built-up land was significantly restricted, resulting in a notable slowdown in growth. The cultivated land area increased by only 163.28 km2, mainly sourced from unused land. Compared with 2020, the areas of grassland, forest, and swampland increased by 4.85%, 3.23%, and 1.90%, respectively. Correspondingly, the areas of unused land and water bodies decreased by 7.80% and 0.76%, respectively.

4.2. Coupled ESP–PLUS (CEP) Scenario

Based on the ESP model, simulations primarily identify and divide ecological source areas in specific regions by considering ecological significance, landscape connectivity, and circuit theory. In this study, ESP simulations were based on the ecological environment characteristics of ecologically fragile areas and identifying and defining regions with significant ecological functions. These regions were set as limiting factors, coupled with the PLUS model, forming specific scenarios for optimized land use referred to as the CEP scenario. Contrasting the CEP scenario with four other development scenarios, the findings indicate the following: under the BAU scenario, there was a noticeable increase in cropland and construction land areas, following past trends in land-use change. Both cropland and construction land occupied a significant portion of ecological land, greatly impacting regional ecological functions negatively (Figure 7(B1)). In the EPR scenario, the priority of ecological land protection was raised, reducing cropland and construction land occupation on ecological land (Figure 7(B2)). However, the protective effort was relatively weak, leading to the transformation of some woodland into grassland or construction land. This shift towards land-use types with higher economic benefits might be due to the pursuit of elevated economic development values, observed in both the BAU and EPR scenarios. EDP and ELP scenarios showed a similar distribution. The aforementioned conditions were somewhat restrained, with increased protective measures for ecological land. Cropland and construction land increased less; the primary difference lay in EDP having a higher growth in cropland than ELP, while grassland areas were notably lower in EDP compared to ELP (Figure 7(A3)). However, the protection of ecological land has not reached an optimal state. In the ELP scenario, the expansion of construction land and cropland was restricted. Woodland, grassland, and marshland underwent apparent mutual transformations, resulting in drastic changes in the land-use structure. Ecological land received optimal protection, with significantly lower cropland and construction land areas compared to the other scenarios in the same period, leading to a substantial decline in the economic development potential.
In the CEP scenario, the expansion of construction land mainly concentrated on areas within key development zones and optimized development zones, trending towards major urban centers. Marshland, woodland, and grassland experienced some expansion within protected areas. The regional economic development and ecological protection achieved a relatively balanced state, ensuring a minimized impact on ecological land while promoting socioeconomic development, thus achieving the optimization for economic–ecological development. In the CEP scenario, cultivated land remained the dominant land type, occupying 48.23% of the total area (Figure 7). Compared with the year 2020, the CEP scenario exhibited substantial changes in spatial distribution and quantity structure. There were reductions in the areas of unused land and water bodies. Notably, the area of unused land sharply decreased by 414.48 km2, mainly converting to cultivated land and grassland, with conversion rates of 3.6% and 1.9%, respectively. This transformation was particularly evident in Da’an City, aligning with the policies of Baicheng aimed at enclosing pastures, improving grassland, and reclaiming saline–alkaline land, thereby increasing the areas of cultivated land and grassland. The water body area decreased by 8.22 km2, primarily converting to forest and grassland. In addition, there were increases in the areas of cultivated land, grassland, construction land, wetland, and forest. The cultivated land area saw the highest increase, growing by 216.86 km2 compared with 2020. This expansion can mainly be attributed to the conversion of unused land. By renovating low-yield farmland and saline–alkaline land, the supplementation of high-quality cultivated land can be ensured. The areas of grassland and forest increased by 102.99 km2 and 22.02 km2, respectively. Construction land expanded by 43.74 km2, with considerable expansion in areas such as Tongyu County and Taobei District. This trend aligns with the development plan of Baicheng, which indicated that more industrial zones will be established in these areas in the future. Swampland areas increased by 37.19 km2, with concentrated expansion in regions such as Momoge in Zhenlai County and Xianghai in Tongyu County. This growth likely resulted from Baicheng’s ongoing implementation of wetland protection and restorative ecological measures.

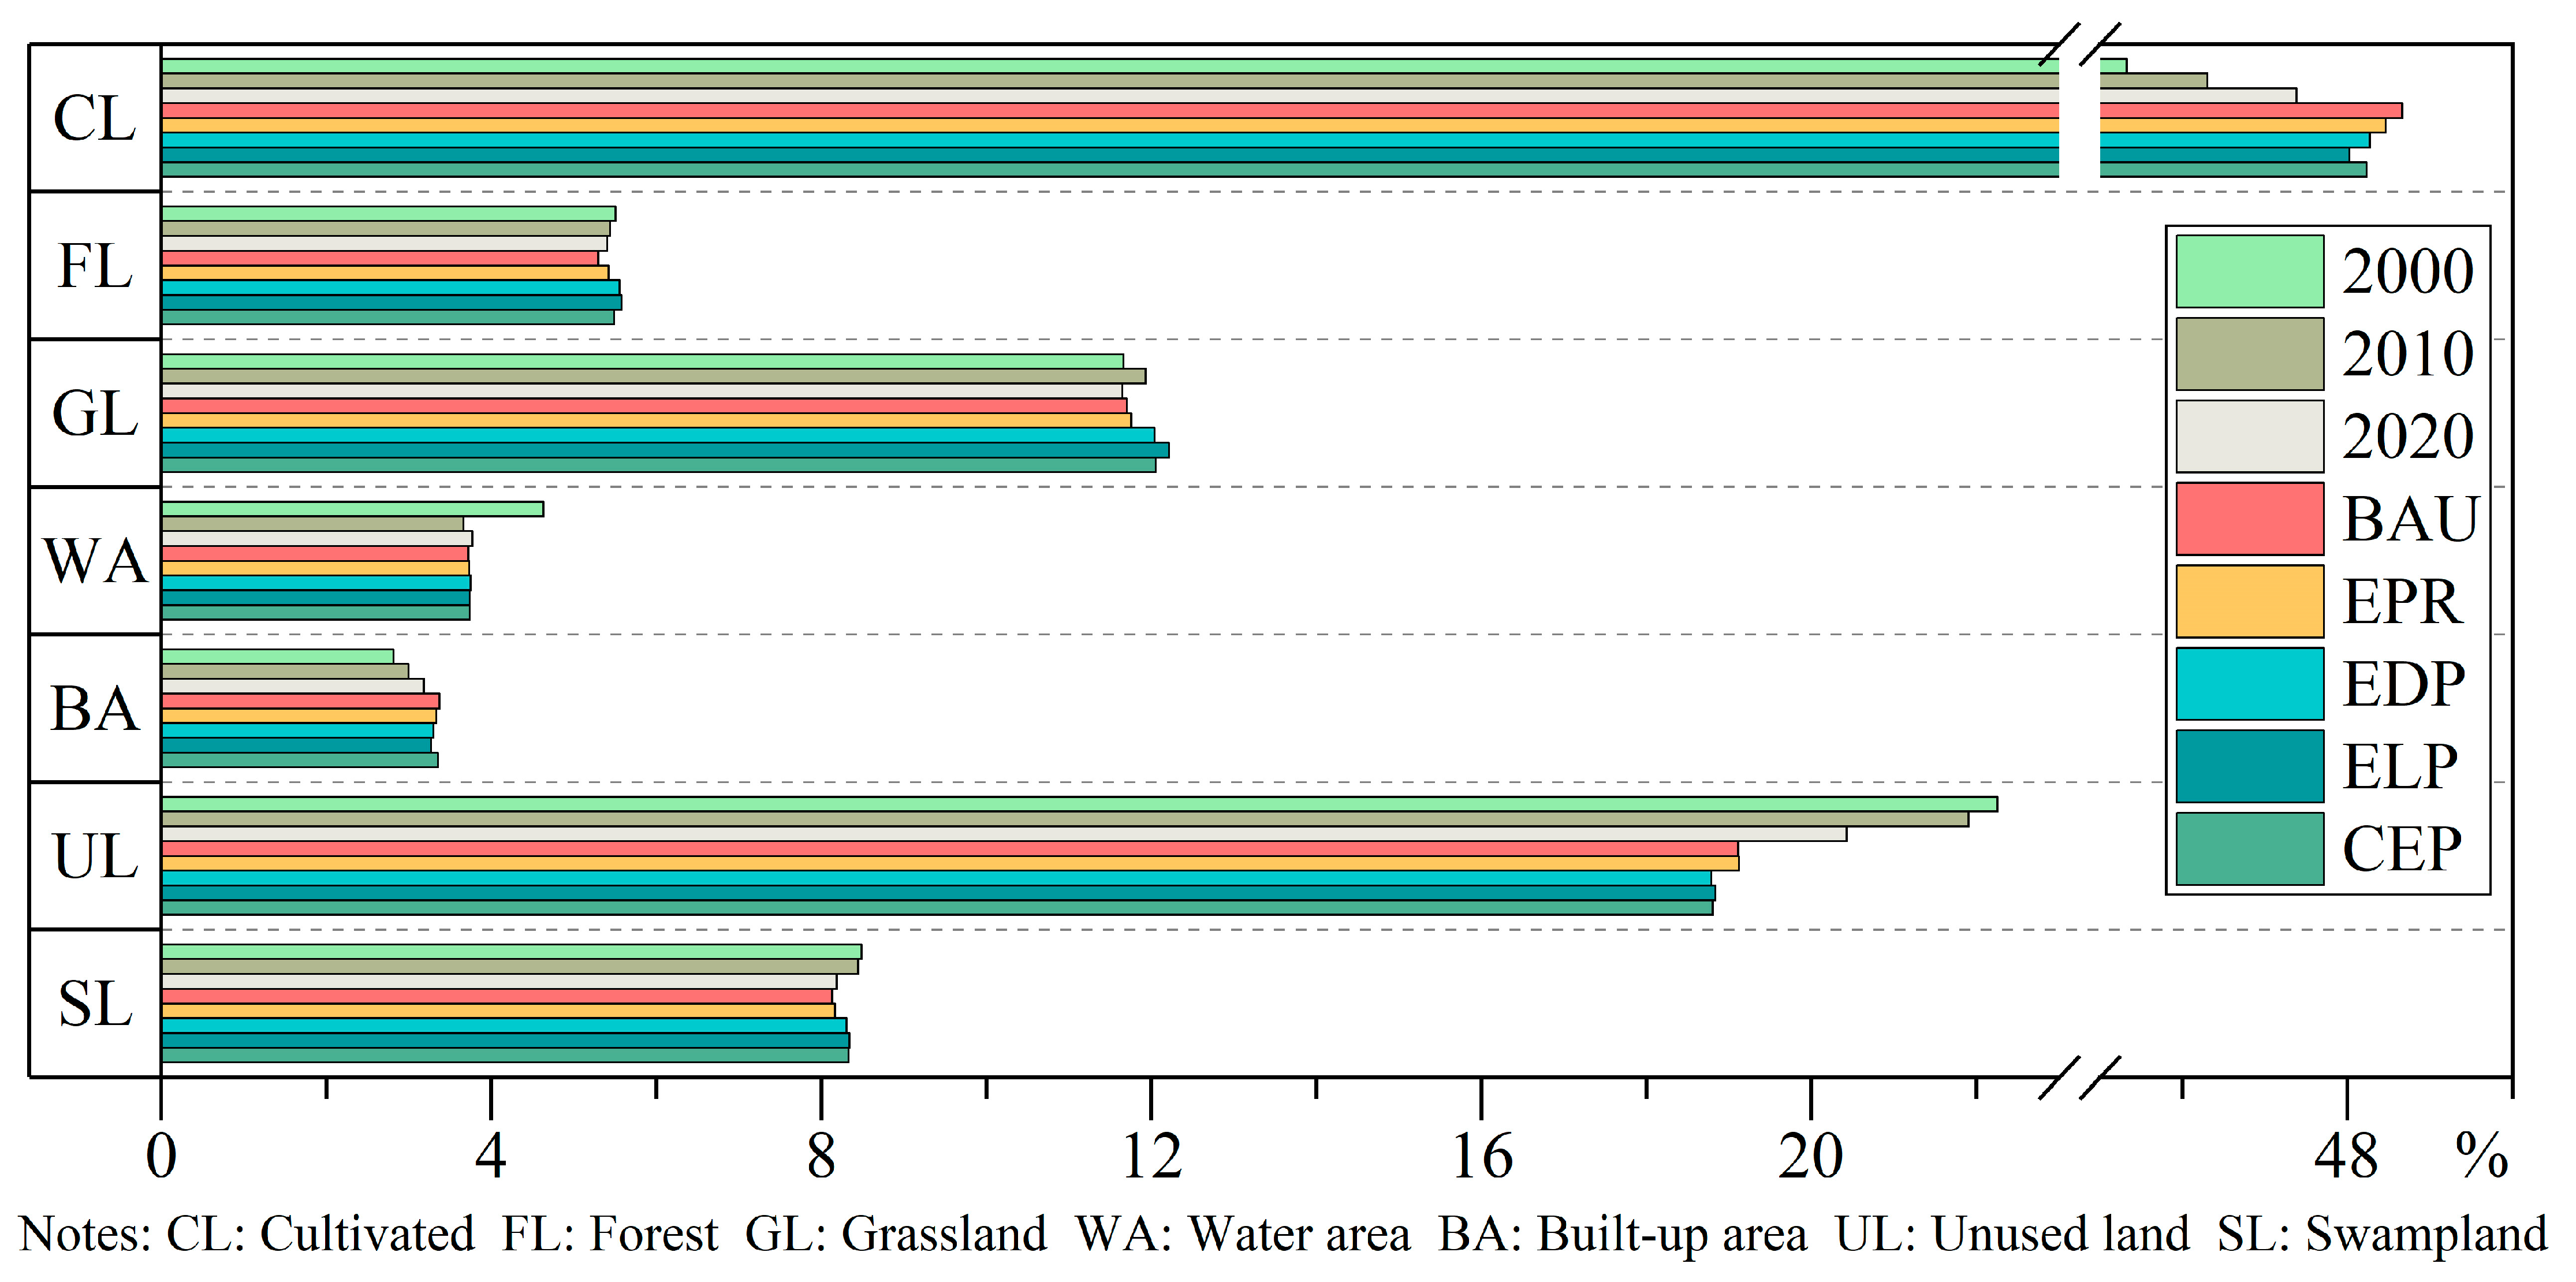
4.3. Comparison of Land-Use Area Changes under Different Scenarios

As shown in Figure 8, in the land-use changes from 2000 to 2030, cropland and unused land have consistently remained the two main land-use types in Baicheng. Compared to the actual land-use area in 2000, cropland expansion was most evident across all scenarios, with an increase of approximately 3%, while the decline in unused land was most pronounced, ranging between 2 and 3% across the scenarios. The woodland area was on an increasing trend in the EDP, ELP, and CEP scenarios, while it showed a declining trend in the BAU and EPR contexts. Grassland showed an increasing trend across all scenarios, with the most significant increases observed in the ELP and CEP scenarios. The water area displayed a decreasing trend in all scenarios, with the most substantial decrease observed in the BAU scenario. The most significant increase in construction land occurred in the BAU and CEP scenarios. Swampland decreased the most in the BAU and EPR scenarios. Compared to the actual land-use area in 2010, the trend in land-use area changes remained consistent with 2000, with the most significant expansion observed in cropland, increasing by about 2% across all scenarios, with the BAU scenario showing the highest increase, followed by the EPR scenario. Woodland and grassland areas showed a declining trend in the BAU and EPR scenarios. Water areas demonstrated an increasing trend in all scenarios, with the highest increase observed in the EDP scenario, followed by the CEP scenario. Construction land changes were consistent with 2000, showing the most significant increase in the BAU and CEP scenarios. Unused land exhibited a decreasing trend in all scenarios, with the most substantial decreases observed in the EDP and CEP scenarios. The two scenarios with the least reduction in the swampland area were the ELP and CEP scenarios.
Using 2020 as the baseline, land-use types experienced varying degrees of areal change across the different scenarios (Figure 8). Swampland showed a decreasing trend in simulations of the BAU and EPR scenarios, and the forested area in the BAU and EPR scenarios was markedly different from that in the other scenarios. Decreases in swampland and forested areas will adversely impact the sustainable development of Baicheng. In the ELP scenario, the expansion of ecological land resulted in a reduction of the cropland area, posing a threat to food security. Moreover, there was a pronounced conflict between ecological land and built-up land, leading to a notable imbalance in the LUCC structure. Changes in the quantity structure were relatively similar and stable in the EDP and CEP scenarios, but the spatial distribution directions differed substantially. For example, in the EDP scenario, owing to greater ecological constraints, the allocation of built-up land became more compact, constraining development strategies and directions, and thus preventing urban expansion. In the CEP scenario, there was considerable expansion of the built-up land area and scope; the development of the Taobei District was constrained by cropland areas to the north and south, resulting in expansion towards the east and west, while the area of built-up land in Tongyu County experienced a substantial increase. Grassland and swampland areas were higher in the CEP scenario compared with the EDP scenario, but lower compared with the ELP scenario. The area of reduction in unused land was much higher in the CEP scenario compared with the ELP scenario. Progressing towards the goal of “development through protection and protection within development,” a win–win situation of conservation and development is emerging. These findings suggest that under the CEP scenario, land-use spatial structure optimization in Baicheng will become more prominent in the future.

4.4. Comparing Differences in Landscape Indices under Different Scenarios

On the basis of the characteristics of the study area, several representative landscape indices were chosen to compare the differences in landscape patterns among the five scenarios. From a landscape perspective (Table 4), the LPI was highest, and the SPLIT was lowest in the CEP scenario. The NP value in the CEP scenario was only lower than that in the EPR scenario. This indicates that landscape fragmentation was low, and aggregation was high in the CEP scenario, suggesting that this optimized scenario does not lead to significant degradation in the integrity of patches. The ELP scenario exhibited the lowest ED value, followed by the CEP scenario, implying that the continuity of landscape types was not weakened, and land-use distribution became more simplified. Furthermore, in the CEP scenario, the decrease in the LSI and increase in the AI were second only to those in the ELP scenario, indicating a favorable spatial distribution of the landscape. Higher SHDI values indicate a greater abundance of patch types and distributions in the landscape. In this study, the ELP scenario had the highest SHDI value. However, it should be noted that the ELP scenario exhibited the highest SPLIT and lowest LPI, suggesting relatively high levels of landscape fragmentation. The BAU scenario exhibited the most notable disadvantages, with the highest NP and largest ED and LSI values, indicating poor land aggregation and substantial landscape fragmentation; this was followed by the ERP scenario. The CEP scenario had lower NP, ED, LSI, and SPLIT values compared with the EDP scenario. These landscape indices collectively indicate that the CEP scenario had a lower overall level of landscape pattern fragmentation, stronger aggregation, more balanced distribution, and better overall performance.

5. Discussion

5.1. Methodological Advantages

Guided by the “beautiful China” policy and sustainable development objectives, and based on the understanding of ecological security and optimization of urban spatial structure and function, we applied a new research framework to the optimal allocation of land resources in this study. This approach aims to better coordinate the relationship between ecological preservation and economic development. Existing research on land-use structure optimization has often focused on selecting different optimization objectives or quantities or improving optimization methods and models. However, few studies have combined hierarchical ecological constraints with different simulation scenarios. Different spatial units exhibit varying ecosystem services and socioeconomic characteristics, which play important roles in land-use optimization. Therefore, urban planning simulations should not be limited to a single scenario; instead, they should consider the characteristics of different spatial units to establish the most reasonable optimization goals and constraints. In urban development areas, optimization simulations should prioritize the sustainability and benefits of urban space. Conversely, in ecological environment zones, optimization simulations should prioritize ecological balance and environmental protection. Therefore, we designed four ecological functional zones based on ESP, coupled with four future scenarios from the PLUS model, to optimize the land-use structure, achieving spatial and quantitative constraints on future LUCC changes.
We applied a land-use optimization model to Baicheng in Jilin Province. To verify the feasibility of optimized ecological corridor protection, we overlaid LUCC with 120 m wide ecological corridors to analyze the proportions of LUCC before and after optimization. The results show that in the CEP scenario, 60.75% is cultivated land, 14.68% is grassland, and 9.19% is forest land. Compared with 2020, there is an increase in the areas of cultivated land, forest land, grassland, and swampland, while the areas of unused land and construction land have decreased, accounting for 8.48% and 0.21%, respectively (Table S5). This indicates the feasibility of ecological corridor protection in the CEP scenario. The comparison of landscape indices for each scenario demonstrated favorable optimization results. This shows that the ESP–PLUS model is both feasible and logical for regional planning and reduces the negative impact of regional development on the ecological environment. The predictions of this model can provide technical support for planners and decision-makers to formulate targeted land-use plans and achieve sustainable regional development.

5.2. Uniqueness of the Study Area

Baicheng is an ecological barrier area in Jilin Province and a dry/semi-arid ecologically fragile area. Its unique geographical location makes it more susceptible to the impacts of climate change and human activities, as shown in Figure 1. Whether it is the construction of the China-Mongolia-Russia Economic Corridor or the development of the Western Ecological Economic Zone in Jilin Province, Baicheng is a crucial key city leading the green rise in the western part of Jilin. It has become an important central city and an ecological civilization demonstration area in the ecological economic belt of northeast China, representing both enormous opportunities and challenges. Baicheng is also the main grain-producing area in northeast China. However, the region suffers from severe wind and sand, aridity, and salinization, with saline–alkali land covering about 23.3% of the total land area. The underdeveloped ecological connectivity pattern of forests, grasslands, and wetlands severely threatens the region’s space for agricultural land development and the pace of ecological construction. The area is experiencing various changes such as urbanization and agricultural development, posing challenges to sustainable development. Therefore, to achieve a balance between socioeconomic development and environmental protection, it is essential to focus on the ecological spatial pattern of Baicheng, emphasizing regional economic (grain) growth and ecological optimization. Simulating the changes in land use in Baicheng under multiple scenarios based on the ecological security pattern can provide a balanced approach for scientific urban planning and sustainable development strategies.

5.3. Recommendations for Land-Use Policies

On the basis of our optimized results, the following recommendations are proposed for future land use in the study area.
(1) Enhance policies and regulations. To ensure regional ecological security, the government should establish and refine land policies and regulations from the following perspectives. Firstly, the government should strengthen the protection and management of ecological land, clarify the types and functions of ecological functional zones, and implement rigorous control measures. Secondly, it must establish corresponding ecological compensation mechanisms to encourage farmers or entities to convert land in ecological core areas, ecological buffer areas, and ecotone areas into ecological land such as forests, grasslands, or wetlands; this will compensate for any economic losses incurred. Simultaneously, the government should formulate relevant land taxation policies, implementing differential tax policies for ecological core areas, ecological buffer areas, and ecotone areas to incentivize ecological land use. Lastly, the government should enhance the monitoring and assessment of ecological functional zones, promptly identify problems and risks, and take punitive actions and rectification measures against any violations, ensuring regional ecological security.
(2) Implement ecological connectivity projects. Baicheng has unevenly distributed ecological sources, and high edge fragmentation, leading to disruptions in the connectivity and integrity of the ecological system. By implementing ecological connectivity projects, a biodiversity protection network can be established to ensure the migration of species and habitat connectivity. This can be achieved through afforestation, the creation of ecological corridors, wetland conservation, and other methods to connect ecological land of different types and functions. Enhancing the spatial connectivity of the ecosystem will prevent the occurrence of ecological islands.
(3) Address saline–alkaline and sandy soils to improve farmland quality. Baicheng has a substantial quantity of saline–alkaline and sandy soils, which are often of poor fertility and result in low agricultural productivity. This severely restricts local agricultural production and economic development. Measures such as rational allocation of water resources, soil improvement, and adoption of technological approaches can be employed to gradually transform such land into fertile fields suitable for cultivation. This transformation can enhance food production capacity and the income of farmers, without encroaching on ecological land to expand the cultivated areas.
(4) In the comprehensive land-use management plan, differentiated governance measures should be formulated. Traditional administrative territorial management measures should be abandoned to establish a new governance model based on an ecological security pattern. This can alleviate the adverse impacts of unreasonable urban construction and agricultural activities on the ecological system diversity in the region. For natural ecological areas, the implementation of policies such as returning farmland to forests and grasslands, along with ecological governance, can enhance the overall quality of the ecological environment. This approach consolidates the status of ecological functional zones, ensuring the sustainable development of ecological land. Moreover, restoring forests and grasslands can increase ecological connectivity, providing more diversified ecological system elements for the regional ecological network. Upholding the red line for arable land and improving its quality are essential. With the acceleration of urbanization, the continuous occupation of arable land leads to a reduction in its area, intensifying the conflict between construction land and arable land. Protecting arable land involves guiding the rational development of construction land, controlling urban growth boundaries, and implementing strict policies for protecting basic farmland. Improving the arable land quality requires adjusting agricultural planting structures according to local suitability to enhance land-use efficiency. In the implementation of returning farmland to forests and grasslands in natural ecological areas, emphasis should be placed on the development and utilization of unused land in production and living areas. The loss of arable land will inevitably hinder socioeconomic development; hence, there should be strict control to prevent further reduction of arable land, while actively promoting smart agriculture and increasing the level of agricultural mechanization.

5.4. Limitations and Future Research Directions

Using the ESP–PLUS model, we can constrain future LUCC in terms of quantity and spatial distribution, thus effectively balancing the relationship between ecological conservation and urban development. This approach avoids the limitations of using multi-scenario simulations of LUCC. However, there are some shortcomings that need to be addressed to promote practical application. (1) The identification of ecological sources and ecological functional zones is a crucial step in optimizing LUCC. Determining the optimal area of ecological sources within the entire study area remains a challenge. (2) Policy interventions have a considerable impact on the simulation accuracy of the PLUS model. It is difficult to quantify and spatially represent relevant policies; hence, the simulation accuracy is somewhat compromised. (3) The PLUS model, used to simulate the optimization of the land-use quantity structure in various scenarios in Baicheng, predicts land demand in the BAU scenario using the Markov model. This model considers only two historical periods of land-use data, and adjustments for other scenarios are made based on related research experiences. The influence of subjective human factors in this process can lead to considerable errors in the results. Future improvements should focus on refining constraint settings to make the area optimization results more aligned with regional development requirements. Additionally, different factors affecting land-use changes will have varying degrees of impact on land changes. The selection of these factors is subjective, and some data collection and quantification processes are challenging, inevitably affecting the accuracy of the simulation results. Currently, there is no scientifically established calculation method for the land-use parameter matrix. Parameter settings are heavily influenced by subjective human factors, and future research should explore more scientifically reasonable approaches for setting model parameters. While the accuracy of the future land use simulated in this study meets the basic requirements, there still exists a certain discrepancy compared to the actual land-use situation. (4) The ecological functional zones and corridors defined in this study have not been surveyed on-site. Additionally, factors such as land ownership, community quantity and distribution, industrial structure, and layout have not been fully considered. Therefore, while the results provide new insights into land-use optimization, there is still a disparity between these results and their practical application.
In the context of urbanization and climate change, the material needs of human society will continue to evolve. There is considerable uncertainty about the future benefits of LUCC optimization. Therefore, it is necessary to further explore and study the rules for assessing the ecological and economic benefits of LUCC under different scenarios. While ESPs can provide quantitative support for landscape planning, the threshold quantification remains unclear [30], necessitating further exploration of the balance between supply and demand in ESPs. There are currently conflicts of land-use types in given areas between different scenarios; finding ways to weigh the land-use patches and comprehensively integrate multiple scenarios will promote the rational allocation of land resources and further the optimization and adjustment of the land-use structure.

6. Conclusions

This study proposes a method that combines ESPs and the PLUS model. By considering ecological importance, landscape connectivity, and circuit theory, an ESP was constructed, establishing four distinct levels of ecological functional zones. The four simulation scenarios generated by the PLUS model were then coupled with their corresponding functional zones to optimize the land-use structure of Baicheng in 2030.
Our research findings indicate the following: (1) ESP–PLUS coupled (CEP) scenarios have considerable application potential in regional land-use optimization. By implementing ecological zoning simulations according to local conditions, ecological land degradation can be effectively mitigated, and the area of arable land can be increased. (2) From the perspective of landscape indices, the CEP scenario efficiently mitigates negative changes in landscape patterns. The outcomes of this study effectively balance the relationship between ecological conservation and economic development, and reasonably establish development orientations for various ecological functional zones, providing comprehensive and targeted support for urban planning and sustainable development.

Supplementary Materials

The following supporting information can be downloaded at: https://www.mdpi.com/article/10.3390/rs15245671/s1. Table S1. Area of ecological functional zones. Table S2. Land use structure in 2020 for ecological function zones (%). Table S3. Transition matrices. Table S4. Neighborhood weight parameters for the years 2020–2030. Table S5. Land use structure of ecological corridors in 2020 and CEP scenario (km2).

Author Contributions

Conceptualization, J.Y. and Y.L.; methodology, B.P.; software, B.P.; validation, S.Z.; investigation, J.Y. and S.Z.; resources, J.Y. and S.Z.; writing—original draft, B.P.; writing—review and editing, J.Y., Y.L. and S.Z.; supervision, Y.L. All authors have read and agreed to the published version of the manuscript.

Funding

This research was jointly supported by the National Key Research and Development Program of China (grant no. 2021YFD1500102), the Strategic Priority Research Program of the Chinese Academy of Sciences (grant no. XDA28070500), the Jilin Provincial Natural Science Foundation (grant no. 20200201040JC), and the Key Consultation Project of the Chinese Academy of Engineering (grant no. JL2020-001).

Data Availability Statement

All data used for the study appear in the data source section of the submitted article.

Acknowledgments

The authors extend great gratitude to the anonymous reviewers and editors for their helpful reviews and critical comments.

Conflicts of Interest

The authors declare no conflict of interest.

References

  1. Haberl, H.; Wackernagel, M.; Wrbka, T. Land use and sustainability indicators. An introduction. Land Use Policy 2004, 21, 193–198. [Google Scholar] [CrossRef]
  2. Gao, L.; Tao, F.; Liu, R.; Wang, Z.; Leng, H.; Zhou, T. Multi-scenario simulation and ecological risk analysis of land use based on the PLUS model: A case study of Nanjing. Sustain. Cities Soc. 2022, 85, 104055. [Google Scholar] [CrossRef]
  3. Gao, J.; Du, F.; Zuo, L.; Jiang, Y. Integrating ecosystem services and rocky desertification into identification of karst ecological security pattern. Landsc. Ecol. 2021, 36, 2113–2133. [Google Scholar] [CrossRef]
  4. Liu, H.; Niu, T.; Yu, Q.; Yang, L.; Ma, J.; Qiu, S.; Wang, R.; Liu, W.; Li, J. Spatial and temporal variations in the relationship between the topological structure of eco-spatial network and biodiversity maintenance function in China. Ecol. Indic. 2022, 139, 108919. [Google Scholar] [CrossRef]
  5. Li, L.; Huang, X.; Wu, D.; Wang, Z.; Yang, H. Optimization of ecological security patterns considering both natural and social disturbances in China’s largest urban agglomeration. Ecol. Eng. 2022, 180, 106647. [Google Scholar] [CrossRef]
  6. Larson, K.L.; Nelson, K.C.; Samples, S.R.; Hall, S.J.; Bettez, N.; Cavender-Bares, J.; Groffman, P.M.; Grove, M.; Heffernan, J.B.; Hobbie, S.E.; et al. Ecosystem services in managing residential landscapes: Priorities, value dimensions, and cross-regional patterns. Urban Ecosyst. 2016, 19, 95–113. [Google Scholar] [CrossRef]
  7. Powers, R.P.; Jetz, W. Global habitat loss and extinction risk of terrestrial vertebrates under future land-use-change scenarios. Nat. Clim. Chang. 2019, 9, 323–329. [Google Scholar] [CrossRef]
  8. Wang, Q.; Guan, Q.; Lin, J.; Luo, H.; Tan, Z.; Ma, Y. Simulating land use/land cover change in an arid region with the coupling models. Ecol. Indic. 2021, 122, 107231. [Google Scholar] [CrossRef]
  9. Fu, Y.; Shi, X.; He, J.; Yuan, Y.; Qu, L. Identification and optimization strategy of county ecological security pattern: A case study in the Loess Plateau, China. Ecol. Indic. 2020, 112, 106030. [Google Scholar] [CrossRef]
  10. Xie, H.; Zhu, Z.; He, Y. Regulation simulation of land-use ecological security, based on a CA model and GIS: A case-study in Xingguo County, China. Land Degrad. Dev. 2022, 33, 1564–1578. [Google Scholar] [CrossRef]
  11. Xinhua News Agency. Hu Jintao’s Report at the 18th National Congress of the Communist Party of China [WWW Document]. 2012. Available online: http://www.gov.cn/ldhd/2012-11/17/content_2268826.htm (accessed on 4 April 2023).
  12. Xinhua News Agency. Xi Jinping: We Will Resolutely Build a Moderately Prosperous Society in All Respects and Win the Great Victory of Socialism with Chinese Characteristics in the New Era—Report at the 19th National Congress of the Communist Party of China [WWW Document]. 2017. Available online: http://www.gov.cn/zhuanti/2017-10/27/content_5234876.htm (accessed on 4 April 2023).
  13. Liu, Y.; Zhang, Z.; Zhou, Y. Efficiency of construction land allocation in China: An econometric analysis of panel data. Land Use Policy 2018, 74, 261–272. [Google Scholar] [CrossRef]
  14. Li, Q.; Wang, L.; Gul, H.N.; Li, D. Simulation and optimization of land use pattern to embed ecological suitability in an oasis region: A case study of Ganzhou district, Gansu province, China. J. Environ. Manag. 2021, 287, 112321. [Google Scholar] [CrossRef] [PubMed]
  15. Liu, P.; Hu, Y.; Jia, W. Land use optimization research based on FLUS model and ecosystem services–setting Jinan City as an example. Urban Clim. 2021, 40, 100984. [Google Scholar] [CrossRef]
  16. Charnes, A.; Haynes, K.E.; Hazleton, J.E.; Ryan, M.J. A Hierarchical Goal-Programming Approach To Environmental Land Use Management. Geogr. Anal. 1975, 7, 121–130. [Google Scholar] [CrossRef]
  17. Barber, G.M. Land-Use Plan Design via Interactive Multiple-Objective Programming. Environ. Plan A 1976, 8, 625–636. [Google Scholar] [CrossRef]
  18. Chuvieco, E. Integration of linear programming and GIS for land-use modelling. Int. J. Geogr. Inf. Syst. 1993, 7, 71–83. [Google Scholar] [CrossRef]
  19. Wu, J. Urban ecology and sustainability: The state-of-the-science and future directions. Landsc. Urban Plan. 2014, 125, 209–221. [Google Scholar] [CrossRef]
  20. Steffen, W.; Richardson, K.; Rockström, J.; Cornell, S.E.; Fetzer, I.; Bennett, E.M.; Biggs, R.; Carpenter, S.R.; De Vries, W.; De Wit, C.A.; et al. Planetary boundaries: Guiding human development on a changing planet. Science 2015, 347, 1259855. [Google Scholar] [CrossRef]
  21. Kang, J.; Zhang, X.; Zhu, X.; Zhang, B. Ecological security pattern: A new idea for balancing regional development and ecological protection. A case study of the Jiaodong Peninsula, China. Glob. Ecol. Conserv. 2021, 26, e01472. [Google Scholar] [CrossRef]
  22. Li, Z.-T.; Li, M.; Xia, B.-C. Spatio-temporal dynamics of ecological security pattern of the Pearl River Delta urban agglomeration based on LUCC simulation. Ecol. Indic. 2020, 114, 106319. [Google Scholar] [CrossRef]
  23. Xu, H.; Song, Y.; Tian, Y. Simulation of land-use pattern evolution in hilly mountainous areas of North China: A case study in Jincheng. Land Use Policy 2022, 112, 105826. [Google Scholar] [CrossRef]
  24. Nie, W.; Xu, B.; Yang, F.; Shi, Y.; Liu, B.; Wu, R.; Lin, W.; Pei, H.; Bao, Z. Simulating future land use by coupling ecological security patterns and multiple scenarios. Sci. Total. Environ. 2023, 859, 160262. [Google Scholar] [CrossRef] [PubMed]
  25. Tang, F.; Fu, M.; Wang, L.; Zhang, P. Land-use change in Changli County, China: Predicting its spatio-temporal evolution in habitat quality. Ecol. Indic. 2020, 117, 106719. [Google Scholar] [CrossRef]
  26. Guo, P. Research on Land Use/Cover Structure and Space Optimization by Coupling MOP and PLUS Models—A Case Study of Hefei City. Master’s Thesis, Hefei University of Technology, Hefei, China, 2021. [Google Scholar] [CrossRef]
  27. Yao, Z.; Jiang, C.; Shan-Shan, F. Effects of urban growth boundaries on urban spatial structural and ecological functional optimization in the Jining Metropolitan Area, China. Land Use Policy 2022, 117, 106113. [Google Scholar] [CrossRef]
  28. Cheng, H.; Zhu, L.; Meng, J. Fuzzy evaluation of the ecological security of land resources in mainland China based on the Pressure-State-Response framework. Sci. Total Environ. 2022, 804, 150053. [Google Scholar] [CrossRef] [PubMed]
  29. Hilty, J.; Worboys, G.L.; Keeley, A.; Woodley, S.; Lausche, B.; Locke, H.; Carr, M.; Pulsford, I.; Pittock, J.; White, J.W. Guidelines for Conserving Connectivity through Ecological Networks and Corridors. Best Practice Protected Area Guidelines Series 30. 2020, p. 122. Available online: https://portals.iucn.org/library/node/49061 (accessed on 6 April 2023).
  30. Xu, L.; Huang, Q.; Ding, D.; Mei, M.; Qin, H. Modelling urban expansion guided by land ecological suitability: A case study of Changzhou City, China. Habitat Int. 2018, 75, 12–24. [Google Scholar] [CrossRef]
  31. An, Y.; Liu, S.; Sun, Y.; Shi, F.; Beazley, R. Construction and optimization of an ecological network based on morphological spatial pattern analysis and circuit theory. Landsc. Ecol. 2021, 36, 2059–2076. [Google Scholar] [CrossRef]
  32. Bai, H.; Weng, L. Ecological security pattern construction and zoning along the China-Laos Railway based on the potential-connectedness-resilience framework. Ecol. Indic. 2023, 146, 109773. [Google Scholar] [CrossRef]
  33. Li, Y.; Liu, W.; Feng, Q.; Zhu, M.; Yang, L.; Zhang, J.; Yin, X. The role of land use change in affecting ecosystem services and the ecological security pattern of the Hexi Regions, Northwest China. Sci. Total. Environ. 2023, 855, 158940. [Google Scholar] [CrossRef]
  34. Peng, J.; Pan, Y.; Liu, Y.; Zhao, H.; Wang, Y. Linking ecological degradation risk to identify ecological security patterns in a rapidly urbanizing landscape. Habitat Int. 2018, 71, 110–124. [Google Scholar] [CrossRef]
  35. Wang, Z.; Luo, K.; Zhao, Y.; Lechner, A.M.; Wu, J.; Zhu, Q.; Sha, W.; Wang, Y. Modelling regional ecological security pattern and restoration priorities after long-term intensive open-pit coal mining. Sci. Total. Environ. 2022, 835, 155491. [Google Scholar] [CrossRef] [PubMed]
  36. Li, S.; Xiao, W.; Zhao, Y.; Lv, X. Incorporating ecological risk index in the multi-process MCRE model to optimize the ecological security pattern in a semi-arid area with intensive coal mining: A case study in northern China. J. Clean. Prod. 2020, 247, 119143. [Google Scholar] [CrossRef]
  37. Gao, M.; Hu, Y.; Bai, Y. Construction of ecological security pattern in national land space from the perspective of the community of life in mountain, water, forest, field, lake and grass: A case study in Guangxi Hechi, China. Ecol. Indic. 2022, 139, 108867. [Google Scholar] [CrossRef]
  38. Peng, B. Land Use Evolution and Identification of Ecological Security Pattern in Northwestern Jilin. Master’s Thesis, Shandong Agricultural University, Shandong, China, 2022. [Google Scholar] [CrossRef]
  39. Peng, J.; Zhao, H.; Liu, Y. Urban ecological corridors construction: A review. Acta Ecol. Sin. 2017, 37, 23–30. [Google Scholar] [CrossRef]
  40. Dai, L.; Liu, Y.; Luo, X. Integrating the MCR and DOI models to construct an ecological security network for the urban agglomeration around Poyang Lake, China. Sci. Total Environ. 2021, 754, 141868. [Google Scholar] [CrossRef]
  41. Peng, J.; Yang, Y.; Liu, Y.X.; Hu, Y.N.; Du, Y.Y.; Meersmans, J.; Qiu, S.J. Linking ecosystem services and circuit theory to identify ecological security patterns. Sci. Total. Environ. 2018, 644, 781–790. [Google Scholar] [CrossRef] [PubMed]
  42. Guo, M.; Cong, X.; Zheng, H.; Zhang, M.-J.; Wang, L.-J.; Gong, J.-W.; Ma, S. Integrating the ordered weighted averaging method to establish an ecological security pattern for the Jianghuai ecological economic zone in China: Synergistic intraregional development. Ecol. Indic. 2022, 135, 108543. [Google Scholar] [CrossRef]
  43. McRae, B.H.; Beier, P. Circuit theory predicts gene flow in plant and animal populations. Proc. Natl. Acad. Sci. USA 2007, 104, 19885–19890. [Google Scholar] [CrossRef]
  44. Fan, F.; Wen, X.; Feng, Z.; Gao, Y.; Li, W. Optimizing urban ecological space based on the scenario of ecological security patterns: The case of central Wuhan, China. Appl. Geogr. 2022, 138, 102619. [Google Scholar] [CrossRef]
  45. Xiang, Y.; Meng, J. Research into ecological suitability zoning and expansion patterns in agricultural oases based on the landscape process: A case study in the middle reaches of the Heihe River. Environ. Earth Sci. 2016, 75, 1–13. [Google Scholar] [CrossRef]
  46. Li, X.; Wang, M.; Liu, X.; Chen, Z.; Wei, X.; Che, W. MCR-Modified CA–Markov Model for the Simulation of Urban Expansion. Sustainability 2018, 10, 3116. [Google Scholar] [CrossRef]
  47. Liao, G.; He, P.; Gao, X.; Lin, Z.; Huang, C.; Zhou, W.; Deng, O.; Xu, C.; Deng, L. Land use optimization of rural production–living–ecological space at different scales based on the BP–ANN and CLUE–S models. Ecol. Indic. 2021, 137, 108710. [Google Scholar] [CrossRef]
  48. Muller, M.R.; Middleton, J.A. A Markov model of land-use change dynamics in the Niagara region, Ontario, Canada. Landsc. Ecol. 1994, 9, 151–157. [Google Scholar] [CrossRef]
  49. Ford, A.; Ford, F.A. Modeling the Environment: An Introduction to System Dynamics Models of Environmental Systems; Island Press: Washington, DC, USA, 1999. [Google Scholar]
  50. Clarke, K.C.; Hoppen, S.; Gaydos, L. A Self-Modifying Cellular Automaton Model of Historical Urbanization in the San Francisco Bay Area. Environ. Plann. B Plann. Des. 1997, 24, 247–261. [Google Scholar] [CrossRef]
  51. Pal, M.; Mather, P.M. An assessment of the effectiveness of decision tree methods for land cover classification. Remote Sens. Environ. 2003, 86, 554–565. [Google Scholar] [CrossRef]
  52. Li, C.; Wu, Y.; Gao, B.; Zheng, K.; Wu, Y.; Li, C. Multi-scenario simulation of ecosystem service value for optimization of land use in the Sichuan-Yunnan ecological barrier, China. Ecol. Indic. 2021, 132, 108328. [Google Scholar] [CrossRef]
  53. Liu, X.; Liang, X.; Li, X.; Xu, X.; Ou, J.; Chen, Y.; Li, S.; Wang, S.; Pei, F. A future land use simulation model (FLUS) for simulating multiple land use scenarios by coupling human and natural effects. Landsc. Urban Plan. 2017, 168, 94–116. [Google Scholar] [CrossRef]
  54. Al-sharif, A.A.A.; Pradhan, B. Monitoring and predicting land use change in Tripoli Metropolitan City using an integrated Markov chain and cellular automata models in GIS. Arab. J. Geosci. 2014, 7, 4291–4301. [Google Scholar] [CrossRef]
  55. Verburg, P.H.; Soepboer, W.; Veldkamp, A.; Limpiada, R.; Espaldon, V.; Mastura, S.S.A. Modeling the Spatial Dynamics of Regional Land Use: The CLUE-S Model. Environ. Manag. 2002, 30, 391–405. [Google Scholar] [CrossRef] [PubMed]
  56. Liang, X.; Guan, Q.; Clarke, K.C.; Liu, S.; Wang, B.; Yao, Y. Understanding the drivers of sustainable land expansion using a patch-generating land use simulation (PLUS) model: A case study in Wuhan, China. Comput. Environ. Urban Syst. 2020, 85, 101569. [Google Scholar] [CrossRef]
  57. Soille, P.; Vogt, P. Morphological segmentation of binary patterns. Pattern Recognit. Lett. 2009, 30, 456–459. [Google Scholar] [CrossRef]
  58. Saura, S.; Pascual-Hortal, L. A new habitat availability index to integrate connectivity in landscape conservation planning: Comparison with existing indices and application to a case study. Landsc. Urban Plan. 2007, 83, 91–103. [Google Scholar] [CrossRef]
  59. Baranyi, G.; Saura, S.; Podani, J.; Jordán, F. Contribution of habitat patches to network connectivity: Redundancy and uniqueness of topological indices. Ecol. Indic. 2011, 11, 1301–1310. [Google Scholar] [CrossRef]
  60. Zhang, K.; Huang, C.; Wang, Z.; Wu, J.; Zeng, Z. Optimization of “production-living-ecological” spaces based on DTTD-MCR-PLUS Model: Taking Changsha City as an example. Acta Ecol. Sin. 2022, 42, 9957–9970. [Google Scholar]
  61. Wang, F.; Yuan, X.; Zhou, L.; Zhang, M. Integrating ecosystem services and landscape connectivity to construct and optimize ecological security patterns: A case study in the central urban area Chongqing municipality, China. Environ. Sci. Pollut. Res. 2022, 29, 43138–43154. [Google Scholar] [CrossRef]
  62. Yu, C.; Liu, D.; Feng, R.; Tang, Q. Construction of ecological security pattern in Northeast China based on MCR model. Acta Ecol. Sin. 2021, 41, 290–301. [Google Scholar] [CrossRef]
  63. Wu, Y.; Han, Z.; Meng, J.; Zhu, L. Circuit theory-based ecological security pattern could promote ecological protection in the Heihe River Basin of China. Environ. Sci. Pollut. Res. 2023, 30, 27340–27356. [Google Scholar] [CrossRef] [PubMed]
  64. Liu, X.; Shu, J.; Zhang, L. Research on applying minimal cumulative resistance model in urban land ecological suitability assessment: As an example of Xiamen City. Acta Ecol. Sin. 2020, 30, 421–428. [Google Scholar]
  65. Wang, Z.; Gao, Y.; Wang, X.; Lin, Q.; Li, L. A new approach to land use optimization and simulation considering urban development sustainability: A case study of Bortala, China. Sustain. Cities Soc. 2022, 87, 104135. [Google Scholar] [CrossRef]
  66. Yu, Q.; Yue, D.; Wang, J.; Zhang, Q.; Li, Y.; Yu, Y.; Chen, J.; Li, N. The optimization of urban ecological infrastructure network based on the changes of county landscape patterns: A typical case study of ecological fragile zone located at Deng Kou (Inner Mongolia). J. Clean. Prod. 2017, 163, S54–S67. [Google Scholar] [CrossRef]
  67. Wu, J. Effects of changing scale on landscape pattern analysis: Scaling relations. Landsc. Ecol. 2004, 19, 125–138. [Google Scholar] [CrossRef]
Figure 1. Geographic location of the study area.
Remotesensing 15 05671 g001
Figure 2. Overall framework of the ecological security pattern–parcel-level land-use simulator (ESP–PLUS) model.
Remotesensing 15 05671 g002
Figure 3. Ecological source identification process.
Remotesensing 15 05671 g003
Figure 4. Identification process of ecological corridors and ecological functional zoning.
Remotesensing 15 05671 g004
Figure 5. Location area for each scenario.
Remotesensing 15 05671 g005
Figure 6. Map of driving factors.
Remotesensing 15 05671 g006
Figure 7. Land-use patterns in 2030 under five scenarios: (1) BAU; (2) EPR; (3) EDP; (4) ELP; (5) CEP; with (A1–C1; A2–C2; A3–C3; A4–C4; A5–C5) detailed simulation results.
Remotesensing 15 05671 g007
Figure 8. Areal proportions of each land type under the different scenarios.
Remotesensing 15 05671 g008
Table 1. Data and sources.
Data TypesData SourcesResolution
Land useThe Resource and Environment Science and Data Center of the Chinese Academy of Sciences (https://www.resdc.cn (accessed on 6 July 2021)).30 m
Meteorological dataChinese National Meteorological Information Center (http://www.nmic.cn/ (accessed on 25 December 2021))-
Road vectorThe OpenStreetMap website (https://www.openstreetmap.org/ (accessed on 25 December 2021))-
Remote sensing imagesGeospatial Data Cloud (http://www.gscloud.cn (accessed on 20 December 2021))30 m
DEMGeospatial Data Cloud via ASTER GDEM products, China (http://www.gscloud.cn/ (accessed on 25 December 2021))30 m
Night lightNational Centre for Environmental Information (NCEI) (https://www.ngdc.noaa.gov/ (accessed on 25 December 2021))1000 m
SoilFAO’s HWSD 1.2 Global Soil Assimilation database1000 m
Net primary production (NPP)The US Geological Survey (USGS) website via MODIS images (https://www.usgs.gov/ (accessed on 27 December 2021))500 m
Population densityThe WorldPop website (https://hub.worldpop.org/ (accessed on 25 December 2021))1000 m
Gross domestic product (GDP)The FigShare website (https://figshare.com/ (accessed on 25 December 2021))1000 m
Normalized difference vegetation index (NDVI)The US Geological Survey (USGS) website of Sentinel-2 satellite (https://www.usgs.gov/ (accessed on 27 December 2021))10 m
Fractional vegetation cover (FVC), Salinity Index (SI)The US Geological Survey (USGS) website of Landsat 8 satellite (https://www.usgs.gov/ (accessed on 27 December 2021))30 m
Table 2. Ecological importance assessment method.
Type of AssessmentFormula/Parameter Meanings
Habitat quality Q x j = H j 1 D x j z k z + D x j z
where Q x j is the habitat quality of grid x in land-use type j ; D x j is the habitat degradation degree, which represents the habitat degradation degree in grid x for land-use type j ; k is the semi-saturation constant, that is, half of the maximum degree of degradation; H j is the habitat adaptability of grid x for land-use type j ; z is a normalized constant, and generally the value is: 2.5.
Importance of biodiversity protection S b i o = N P P m e a n × F p r e × F t e m × ( 1 F a l t )
where S b i o is the service ability index of biodiversity; N P P m e a n is the annual average net primary productivity; F p r e is the annual average precipitation; F t e m is the annual average temperature; F a l t is the elevation factor.
Wind erosion sensitivity Q f a = 0.018 ( 1 W ) j = 1 24 T j e x p { 9.208 + 0.0198 Z 0 + 1.955 ( 0.893 U j ) 0.5 }
Q f g = 0.018 ( 1 W ) j = 1 24 T j e x p { 2.4869 0.0014 V 2 61.3935 U j }
Q f s = 0.018 ( 1 W ) j = 1 24 T j e x p { 6.168 0.0743 V 27.9613 ln 0.893 U j 0.893 U j }
where Q f a , Q f g , and Q f s represent the wind erosion modulus for cropland grassland, and sandy land, respectively (t·hm2·a−1); W is the surface soil moisture factor, with a range of values between 0 and 1; T j represents the cumulative time of wind erosion occurrence for different wind speed levels during the year (min); Z 0 is the surface roughness (cm), dimensionless; U j signifies the average wind speed for the j -th level (m/s); j is the index of wind speed levels; V is the vegetation coverage percentage (%).
Land desertification sensitivity D = I × W × K × C 4
where D is the desertification sensitivity; I is the dryness index; W is the factor representing the number of days with sandy winds; K is the soil texture factor; C is the vegetation cover factor.
Salinization sensitivity S D I = ( N D V I 1 ) 2 + S I 2
S I = ρ 1 × ρ 3
where S D I is the salinity degree of the vegetation index; S I is the soil salinity index; ρ 1 , ρ 3 are the blue and red bands of the Landsat TM and OLI imagery, respectively.
Table 3. Resistance coefficients and weights of resistance factors.
Resistance CoefficientTypesClassification of Resistance FactorsWeight
ES1103050100
LS1005030101
Slope (°)>2515–258–152–8<20.0506
FVC (%)>6550–6535–5020–35<200.1136
LUCCWoodland, waterGrassland, marshlandCropland, saline landSandy land, bare soil, and otherConstruction land0.1863
Distance to water (km)<11–33–55–10>100.0678
Habitat quality index0.9–1.00.8–0.90.4–0.80.1–0.40–0.10.1337
GDPUsing the natural break method for classification0.0942
Population densityUsing the natural break method for classification0.1279
Distance from road (km)>52–51–20.5–1<0.50.0973
Distance to city (km)>2.51.5–2.51–1.50.5–1<0.50.0812
Night lights<300300–700700–15001500–3000>30000.0474
Table 4. Comparison of landscape indices under five different scenarios.
NPLPIEDLSISPLITSHDIAI
BAU17,47721.5325.06102.3916.951.51496.24
EPR14,93221.3724.4299.8317.251.51796.34
EDP16,24021.3223.9197.7817.341.52396.42
ELP15,03521.0122.9994.1417.861.52696.55
CEP16,02322.9823.7497.1315.351.52496.45
Disclaimer/Publisher’s Note: The statements, opinions and data contained in all publications are solely those of the individual author(s) and contributor(s) and not of MDPI and/or the editor(s). MDPI and/or the editor(s) disclaim responsibility for any injury to people or property resulting from any ideas, methods, instructions or products referred to in the content.

