Technical Note

Fast Detection of Moving Targets by Refocusing in GBSAR Imagery Based on Enlightend Search

1
Radar Monitoring Technology Laboratory, College of Information, North China University of Technology, Beijing 100144, China
2
Radar Monitoring Technology Laboratory, College of Electrical and Control Engineering, North China University of Technology, Beijing 100144, China
3
North Information Control Research Academy Group Co., Ltd., Nanjing 211153, China
*
Author to whom correspondence should be addressed.
Remote Sens. 2023, 15(23), 5588; https://doi.org/10.3390/rs15235588
Submission received: 6 November 2023 / Revised: 28 November 2023 / Accepted: 29 November 2023 / Published: 30 November 2023

Abstract

:
Ground-based synthetic aperture radar (GBSAR) is widely used in mountains, mines, and other areas because it can get the sub-millimeter deformation information of monitoring scenes. This technology plays a vital role in safeguarding production operations, providing accurate disaster projections, and facilitating timely early warning dissemination. However, the moving target’s defocus/displaced signal will mask the image of GBSAR, which affects the accuracy of deformation inversion. Hence, the detection of moving targets in GBSAR imagery is essential. An algorithm for moving target detection based on refocusing is proposed in this paper to address this problem. The algorithm establishes a two-dimensional parameter search space for squint angle and relative speed. Based on the parameter searching, the improved Range Doppler (RD) algorithm is used for refocusing. The optimal 2D parameters are searched via an algorithm combining the entropy minimization principle and the enlightend search. The presence of a moving target in the observation area is determined based on whether there is an optimal parameter to minimize the entropy value of the refocused image. This approach enables the detection of moving targets in GBSAR imagery. The proposed method is verified by the synthetic data.

1. Introduction

Ground-based synthetic aperture radar (GBSAR) is a contemporary remote sensing technology that has been developed in recent years [1]. Because of the long revisit interval, narrow imaging width, and short duration for a single observation period, the region or target of interest cannot be persistently observed by traditional remote sensing satellites [2]. GBSAR can continuously monitor the deformation of an area for a long period of time. Furthermore, it enables real-time data analysis with exceptional monitoring accuracy at the sub-millimeter level [3,4,5,6]. The whole GBSAR deformation monitoring process can be highly automated. It can be used as an operational monitoring tool, even during emergencies. It is worth noting that the instrumentation can be installed outside the target area; this is an advantage, especially when dangerous deformation phenomena have to be monitored [7].
The GBSAR interferometry technique is mainly used in mining landslides, bridge span displacements, or embankments [7,8]. The GBSAR is based on a coherent radar system, which measures not only the amplitude but also the phase of the received radar signal [7]. The interferometric phase information of the image can be exploited, by using the interferometric techniques, to obtain deformation information and topography of the measured scene. The accuracy of deformation retrieval relies on the high coherence of the GBSAR image. However, the moving target’s defocus/displaced signal will mask the image of GBSAR, which can cause decoherence. Therefore, the detection of moving targets in GBSAR imagery is crucial to enhancing the accuracy of deformation inversion.
Since the existing FMCW GBSAR systems are mainly single-channel systems [9], this paper provides a brief introduction of the moving target detection method suitable for single-channel systems. The research of Freeman [10] has achieved the detection of moving targets in single-antenna SAR. Nevertheless, the detection capability is limited to targets located in the high-band range of the pulse-repetition frequency (PRF). The Wigner-Ville distribution (WVD) is applied to detect moving targets in [11]. However, the problem of the proposed algorithm demonstrates that WVD is not a linear transformation; the undesired cross terms will appear when multiple signals exist in the scene. To address this issue, scholars have proposed various improved algorithms with the objective of suppressing cross terms in the WVD [12,13,14,15]. There is the extended WVD and the WVD-HT method, which combines the Hough transform and the Wigner-Ville distribution. In reference [16], SAR echo was used to generate sub-aperture image sequences. And combined with the eigen-decomposition of the covariance matrix, the study achieved effective separation between clutter and moving targets. This method has a good processing result in the simulation, but the algorithm has a large amount of calculation.
The above detection methods usually require the system to have a high PRF, and additional cross terms are introduced due to the target motion during the detection process. Considering the low PRF of GBSAR and the slow speed of radar motion, further study is required to advance the moving target detection method employed in GBSAR systems. To solve the above problems, the moving target can be detected by focusing with motion phase compensation [17,18,19,20,21]. Barbarossa [17] has presented an approach to estimating phase errors caused by the target’s motion. And the phase errors are used to judge the existence of the moving target in the scene. In the previous studies [22], we successfully achieved refocusing imaging of moving targets in the GBSAR based on relative speed. And there is currently no research in the GBSAR system on using relative speed refocusing for moving target detection. In [18,19,20,21], the moving targets on the airborne platform can be detected by refocusing techniques. However, these methods use traversal to search for the optimal parameters, which makes target detection time-consuming. So how to improve the detection efficiency of moving targets in GBSAR is also worthy of attention.
Therefore, in this paper, we propose a moving target detection algorithm based on refocusing. The two-dimensional parameter search space is established for squint angle and relative speed. Based on the parameter searching, the improved Range Doppler (RD) algorithm is used for refocusing. And the minimum entropy value is used as the criterion for moving target detection. For each group of parameters, the corresponding phase compensation and refocusing are performed. The entropy of the refocused image under each set of parameters is computed, and the presence of a moving target in the observation area is determined based on whether there is an optimal parameter to minimize the entropy value of the refocused image. And the introduction of enlightend search is used to enhance detection efficiency.
The main contributions are:
  • A moving target detection algorithm based on refocusing is proposed to address the problem of moving target detection in GBSAR imagery;
  • A two-dimensional enlightend search is introduced to improve detection efficiency and reduce time consumption;
  • The efficiency of the proposed method is evaluated through extensive experiments.
The rest of the paper is organized as follows. In Section 2, the relative speed is used to simplify the FMCW-GBSAR moving target signal model. The details of the proposed method for moving target detection by refocusing are described in Section 3. Based on the establishment of two-dimensional parameter search space, this method uses the improved Range Doppler (RD) algorithm to refocus the moving target. The presence of moving targets in the observation area is determined through the application of the minimum entropy principle as the detection principle. Section 4 is the experiment. Section 5 is the conclusion.

2. Moving Target Signal Model Simplified by Relative Speed

The geometry of GBSAR with a moving target when azimuth time t = 0 is shown in Figure 1. Assume that the radar moves straight along the y-axis at a speed of v s . The Y-axis is the azimuth direction, and that perpendicular to the y-axis is the range direction. The radar is at the origin of the coordinates, which is expressed as ( 0 ,   v s t ) . In this paper, all movements are under the assumption of constant speeds and linear motion, with no acceleration considered [23]. v a and v r denote the azimuth and range velocities of the moving target, respectively. Before introducing the relative speed, the initial position of the moving target is at P ( x 0 ,   y 0 ) , its velocity is ( v r ,   v a ) . So the coordinates of the moving target can be expressed as ( x 0 + v r t ,   y 0 + v a t ) . Then, the instantaneous slant range is [24]:
R ( t ) = ( x 0 + v r t ) 2 + ( y 0 + ( v a v s ) t ) 2
Through the introduction of the relative speed transformation relationship, the moving target can be treated as a stationary target if the platform is assumed to move with the difference velocity v s of the initial platform velocity v s and the target velocity ( v r , v a ) [25]. At this time, the coordinates of the platform are changed from ( 0 , v s t ) to ( 0 , v s t ) . The moving target P rotates θ to P , and its coordinates are changed from ( x 0 + v r t , y 0 + v a t ) to ( x 0 , y 0 ) .
Equations (2) and (3) represent the transformation of relative speed. The v s is defined as relative speed. The θ is defined as the rotation angle; it represents the direction of v s . The v s and θ can be calculated as:
v s = ( v s v a ) 2 + ( v r ) 2
θ = arctan ( | v r | | v s v a | )
Apply (2) and (3) to (1); the range equation can be rewritten as:
{ x 0 = x 0 cos θ y 0 sin θ y 0 = x 0 sin θ + y 0 cos θ
R ( t ) = ( x 0 ) 2 + ( y 0 v s t ) 2
Next, the signal model is simplified by the relative speed. Figure 2 shows the imaging geometry of the moving target based on relative speed. P denotes the position of a moving target following the relative speed transformation. O P denotes the range between the radar and the target at an arbitrary time. R 0 represents the range between the radar and the target at t = 0 , which determines the radar’s effective detection scope for the moving target in the scene. The selection of R 0 can be set according to the monitoring requirements of the observation area. And θ is the squint angle at t = 0 .
From Figure 2, we can obtain R 0 = ( x 0 ) 2 + ( y 0 ) 2 and θ = arctan y 0 x 0 . According to the law of cosines, we can obtain the expression of the range equation [26]:
R ( t ) = ( v s t ) 2 + R 0 2 2 R 0 v s t sin θ
Equation (6) represents the focusing equation. The moving target can be refocused by searching the radar velocity v s and the squint angle θ and applying corresponding phase compensation to the moving target signal based on these parameters [27]. For different point targets in the scene, the matched values of v s and θ are different. Hence, the algorithm searches target by target in the 2D parameter space to get the matched parameters for refocusing.
The “stop-go-stop” approximation is not applicable in the GBSAR system because it uses the FMCW signal, which requires continuous signal transmitting and receiving [28,29,30]. So replace t r   +   t a into Equation (6) to get (7). The t a and t r are the azimuth and range time, respectively.
R ( t r , t a ) = ( v s t a + v s t r ) 2 + R 0 2 2 R 0 ( v s t a + v s t r ) sin θ
By substituting the rewritten range Equation (7) into the received signal after Dechirp [24], we obtain the GBSAR moving target signal simplified by relative speed:
S ( t r , t a ) = exp { j 4 π λ ( R 0 + ( v s ) 2 cos 2 θ 2 R 0 t a 2 ) } exp { j 4 π λ ( v s ) 2 t a R 0 ( v s ) sin θ R a ( t a ) t r } exp { j 4 π c K r [ R a ( t a ) + ( v s ) 2 t a R 0 v s sin θ R a ( t a ) t r R r e f ] ( t r 2 R r e f c ) }
where λ is the wavelength, c is the speed of light, K r represents the range FM rate, and R r e f is the reference range.

3. Detection Algorithm Based on Refocusing

3.1. Moving Target Detection Algorithm Flow

According to Equation (8) deduced in Section 2, the equivalent signal model is only related to the parameters v s and θ . Since the actual motion parameters of the target within the scene are unknown, the value of ( v s , θ ) can be determined by a two-dimensional parameter search. Different from the conventional traversal search, the enlightend search is introduced in this paper to reduce time consumption.
The flowchart of our proposed detection method is presented in Figure 3, which consists of three steps. (1) The 2D parameter search space ( v s , θ ) is first established. The optimal 2D parameters are searched using the enlightend search. (2) In each parameter search loop, the modified Range Doppler (RD) algorithm is used to refocus the input data by the motion phase compensation. (3) Following the phase compensation under different groups of ( v s , θ ) , the entropy value of each refocused image is calculated. By determining if the minimum entropy of the refocused image converges towards a set of ( v s , θ ) , the presence of the moving target within the scene can be judged.
It is worth mentioning that atmospheric turbulence is one of the causes of quality degradation in long-range imaging. In order to eliminate the adverse effect of atmospheric turbulence, scholars have conducted a lot of experiments and demonstrations on this issue [31,32,33,34,35]. According to reference [31], when the radar illuminating range is above 10 km, atmospheric turbulence will seriously degrade the image quality. The radar beam phase distortion induced by turbulence will affect the long-range imaging performance and degrade the resolution.
In this paper, moving target detection is achieved by refocusing in the GBSAR imagery. The GBSAR usually uses close-range imaging for the observation scene, with the radar’s illumination range not exceeding 3 km. Different from the long-range imaging in reference [31], atmospheric turbulence will not degrade the quality of GBSAR images. Therefore, the impact of turbulence on the performance of the detection algorithm proposed in this paper can be neglected.

3.2. Enlightend Search Based on 2D Parameter Space

As analyzed in Section 2, the simplified signal model is only related to v s and θ . Hence, when using the RD algorithm for refocusing, it is essential to determine the values of v s and θ . In this paper, the optimal 2D parameters are searched using the enlightend search. Compared with the method of searching parameters by traversal, the advantage of enlightend search is that the constructed enlightend function can be used to select the search scope. By reducing the number of invalid searches in the search space, the efficiency of the parameter search is improved.
We used a strategy similar to the enlightend search presented in [36]. Its searching process diagram is shown in Figure 4. A two-dimensional parameter search space is established first ( v s , θ ) by designing “cross”. The “cross” can be designed by determining the initial node and the search step. The efficiency of the search process is impacted by the position of the initial node. The initial node is usually set according to the speed and position of the platform at t = 0 .
During the search process, each ‘‘cross’’ has nine interval nodes, and ( x j , y j ) ( j = 1 , , 9 ) is the coordinate of the k th node. ( x j , y j ) represent v ^ s and θ ^ , respectively. The 2D entropy of each node is calculated. If the node with minimum entropy is found at the boundary of the “cross” (1, 5, 6, and 9), the search step preserves, and a new “cross” is reconstructed based on the node for further breadth searching. If the node with minimum entropy is situated in the interior of the “cross” (2, 3, 4, 7, and 8), the search step halves, and a new “cross” is also reconstructed centered on the node for further depth searching. Until the step size is reduced to a threshold such as 0.001, the central node within the final “cross” is identified as the node corresponding to the optimal parameters. By judging if the minimum entropy of the refocused image converges towards the optimal parameters, it can be determined whether a moving target is present in the scene.
Next, I will analyze the process of “cross” reconstruction in two cases. The first case can be observed in Figure 4. In the first “cross,” the node with the minimum entropy is found at the boundary node 6. It means that the target node corresponding to the optimal parameter should be below node 6 or between node 6 and node 7. In this case, in order to acquire the target node, it should remain the same size and establish a new cross centered on the node below node 6 for breadth search. The other case can be seen in Figure 5. It shows the reconstruction process from “cross” 5 to “cross” 6. When the node with minimum entropy is located at the internal node 7, it indicates that the target node with the optimal parameter has been included in the interior of “cross” 5. Therefore, the new “cross” can be reconstructed in half of the original step size around the current node 7. And the pseudocode of the enlightend search algorithm is listed in Appendix A.
It is worth mentioning that the selection of the initial step size greatly impacts the efficiency of the search. If the step size is too large, due to the requirement for a precision level of up to 0.001 in the step size, it would require constant updates of the current node, resulting in an increase in the number of search iterations and the overall search volume. Conversely, if the step size is too small, it may lead to incomplete search results. Only suboptimal values can be found through the search, thereby reducing the accuracy of the search. Therefore, both selecting a step size that is too large or too small will result in a decrease in the accuracy and efficiency of the search. Based on the above analysis, it is necessary to select the appropriate step size when using enlightend search to get the optimal ( v s , θ ) .

3.3. Moving Target Refocusing

According to the characteristics of the GBSAR system and the moving target motion, the RD algorithm is modified to achieve moving target refocusing, and the detailed formulas are deduced in this part.
Based on the stationary phase principle, the Equation (8) in the Doppler domain is:
S ( t r , f a ) = exp { j 4 π λ R 0 β ( f a ) } exp { j 4 π K r c [ R 0 β ( f a ) R r e f ] ( t r 2 R r e f c ) } exp { j 2 π λ K r 2 R 0 c 2 β 2 ( f a ) 1 β 3 ( f a ) ( t r 2 R r e f c ) 2 } exp { j 2 π f d c t r } exp { j 2 π sin θ R 0 f a 3 λ cos θ ( f a M 2 f a 2 ) 3 / 2 }
where λ is the wavelength, c is the speed of light, K r represents the range FM rate, and R r e f is the reference range. The t a and t r are the azimuth and range time, respectively. R 0 represents the range between the radar and the target. And θ is the squint angle.
It should be noted here that the higher order phase is omitted in this paper when using the stationary phase principle. In Equation (9) f a M = 2 v s λ , and the Doppler centroid is f d c = 2 v s sin θ λ . The correction function is constructed to correct the Doppler shift:
H d f s = exp [ j 2 π f d c t r ]
The Range Cell Migration Correction (RCMC) factor β ( f a ) in Equation (9) is expressed as:
β ( f a ) = 1 ( λ f a 2 v s cos θ ) 2
Using the approximation similar to [37], R 0 β ( f a ) can be represented as:
R 0 β ( f a ) R 0 + 1 2 R 0 λ 2 f a 2 4 ( v s ) 2 cos 2 θ
The corresponding RCMC function based on relative speed is as follows:
H r c m c = exp { j 4 π K r c 1 2 R 0 λ 2 f a 2 ( 2 v s cos θ ) 2 ( t r 2 R r e f c ) } exp { j 2 π λ K r 2 R 0 c 2 β 2 ( f a ) 1 β 3 ( f a ) ( t r 2 R r e f c ) 2 } exp { j 2 π sin θ R 0 f a 3 λ cos θ ( f a M 2 f a 2 ) 3 / 2 }
According to Equation (13), the range migration correction of Equation (9) can be completed. After using azimuth inverse FFT and range FFT, we obtain:
S ( f r , t a ) = sin c { π T p [ f r + 2 K r c ( R 0 R r e f ) ] } exp { j 4 π R r e f c f r } exp { j 4 π λ ( R 0 + ( v s ) 2 cos 2 θ 2 R 0 t a 2 ) }
The quadratic phase term of t a in (14) is the phase history, which controls azimuth focusing. The reason is this phase will cause the main lobe of the target signal to broaden to both sides, leading to defocusing of the image in the azimuth direction. Hence, in order to get the well refocused image, the quadratic phase must be compensated. The compensation term is given as (15):
H r e f = exp ( j 4 π λ ( ( v s ) 2 cos 2 θ 2 R 0 t a 2 ) )
After applying Fourier transform along the azimuth direction, we can get the refocused image of the moving target. In this paper, the minimum entropy principle is used as the criterion for moving target detection. By determining if the minimum entropy of the refocused image converges towards a set of optimal ( v s , θ ) , the presence of the moving target in the observation scene can be judged.

3.4. Moving Target Detection Criterion

The entropy value can be used as a quantitative measure to evaluate the accuracy of target refocusing. When analyzing the refocused image quality of the moving target, it is observed that images with good focusing exhibit lower entropy values. In the process of establishing the two-dimensional parameter space to search for ( v s , θ ) , we can only get the trend of coarse refocusing of the image. If there is a defocused moving target in the scene, the entropy of the refocused image can be minimized and converge to a set of optimal ( v s , θ ) . Therefore, in the process of using enlightend search to iterate the optimal parameters, we calculate the entropy for each set of parameters on the respective images and use the minimum entropy principle as the criterion for target detection.
Here we assume that a set of two-dimensional parameters in the search are denoted by ( v ^ s , θ ^ ) . The image after refocusing using the algorithm in this paper can be deduced as Equation (14), in this section (14) can be recorded as S ( v ^ s , θ ^ ) . The proximity of ( v ^ s , θ ^ ) to the actual value of the moving target directly correlates with the detection efficiency. Hence, the relationship curve between the entropy value and the corresponding S ( v ^ s , θ ^ ) must be established after their acquisition. The closer the ( v ^ s , θ ^ ) is to the actual value, the smaller the calculated entropy is.
The definition of image entropy is:
E ( v ^ s , θ ^ ) = m , n p m , n ln p m , n , m = 1 , N a ; n = 1 , N r
where p m , n is the density of the image intensity, i.e.,
p m , n = | S ( m , n ; v ^ s , θ ^ ) | 2 m = 1 N a n = 1 N r | S ( m , n ; v ^ s , θ ^ ) | 2
E t = m = 1 N a n = 1 N r | S ( m , n ; v ^ s , θ ^ ) | 2
E t can be defined as the total energy of the image. According to the Parseval theorem, it is clear that E t is constant, where N a × N r is the size of the azimuth and range direction of S ( m , n ; v ^ s , θ ^ ) .
The optimal parameters of ( v s , θ ) determined by enlightend search can achieve accurate refocusing of the moving target. At this time, the entropy value of the image reaches its minimum and tends to converge. The search result for ( v s , θ ) can be expressed as:
( v s , θ ) = arg min E ( v ^ s , θ ^ )

4. Data Processing and Discussion

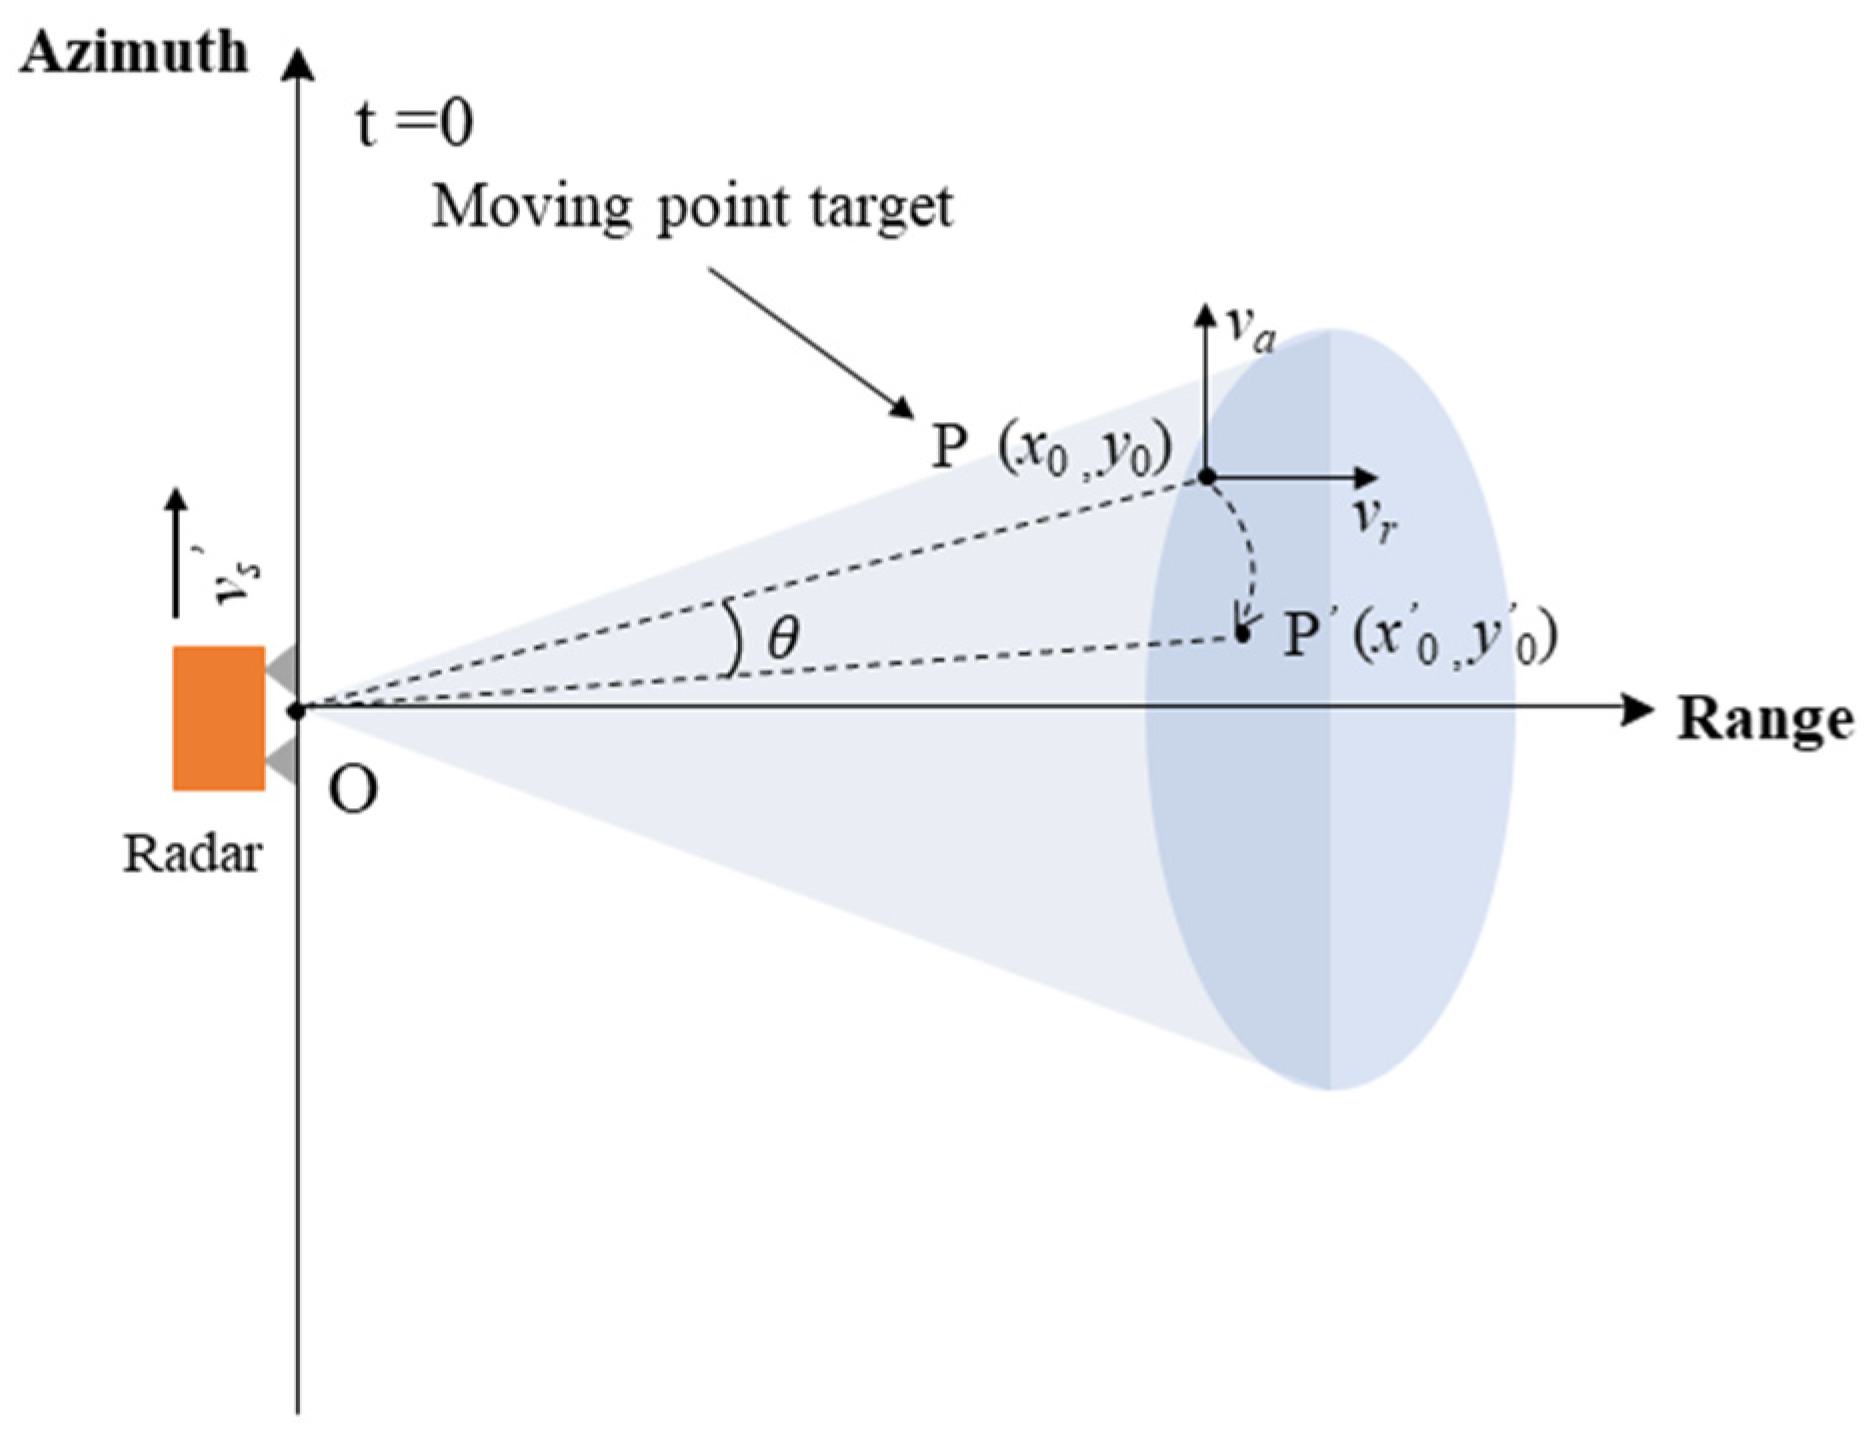
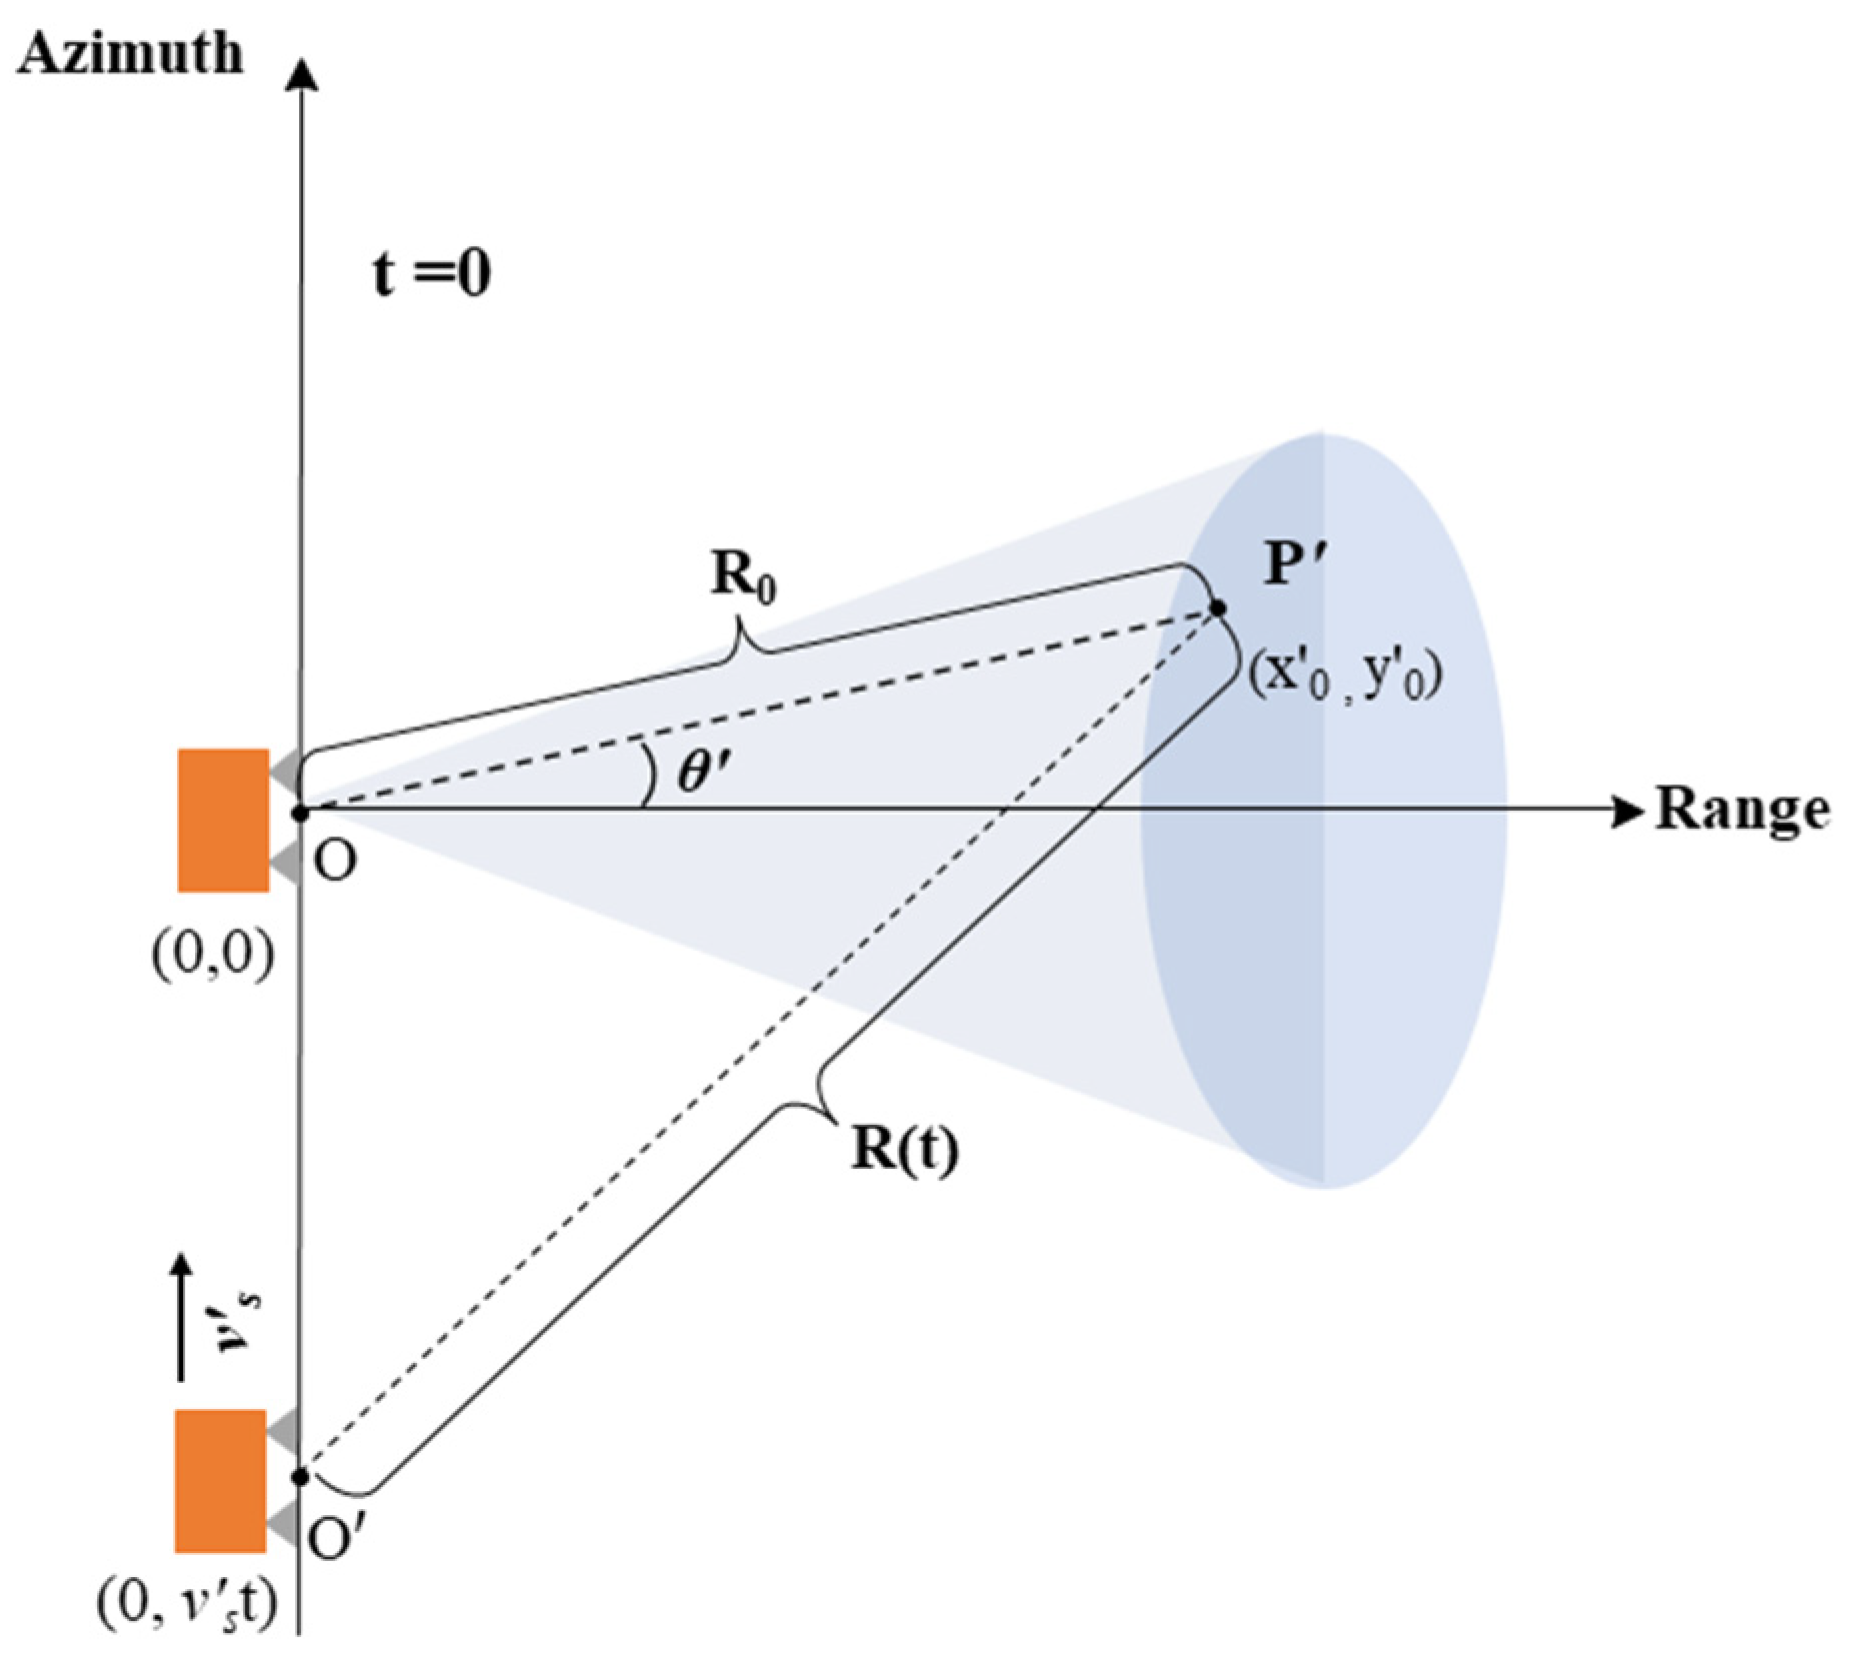
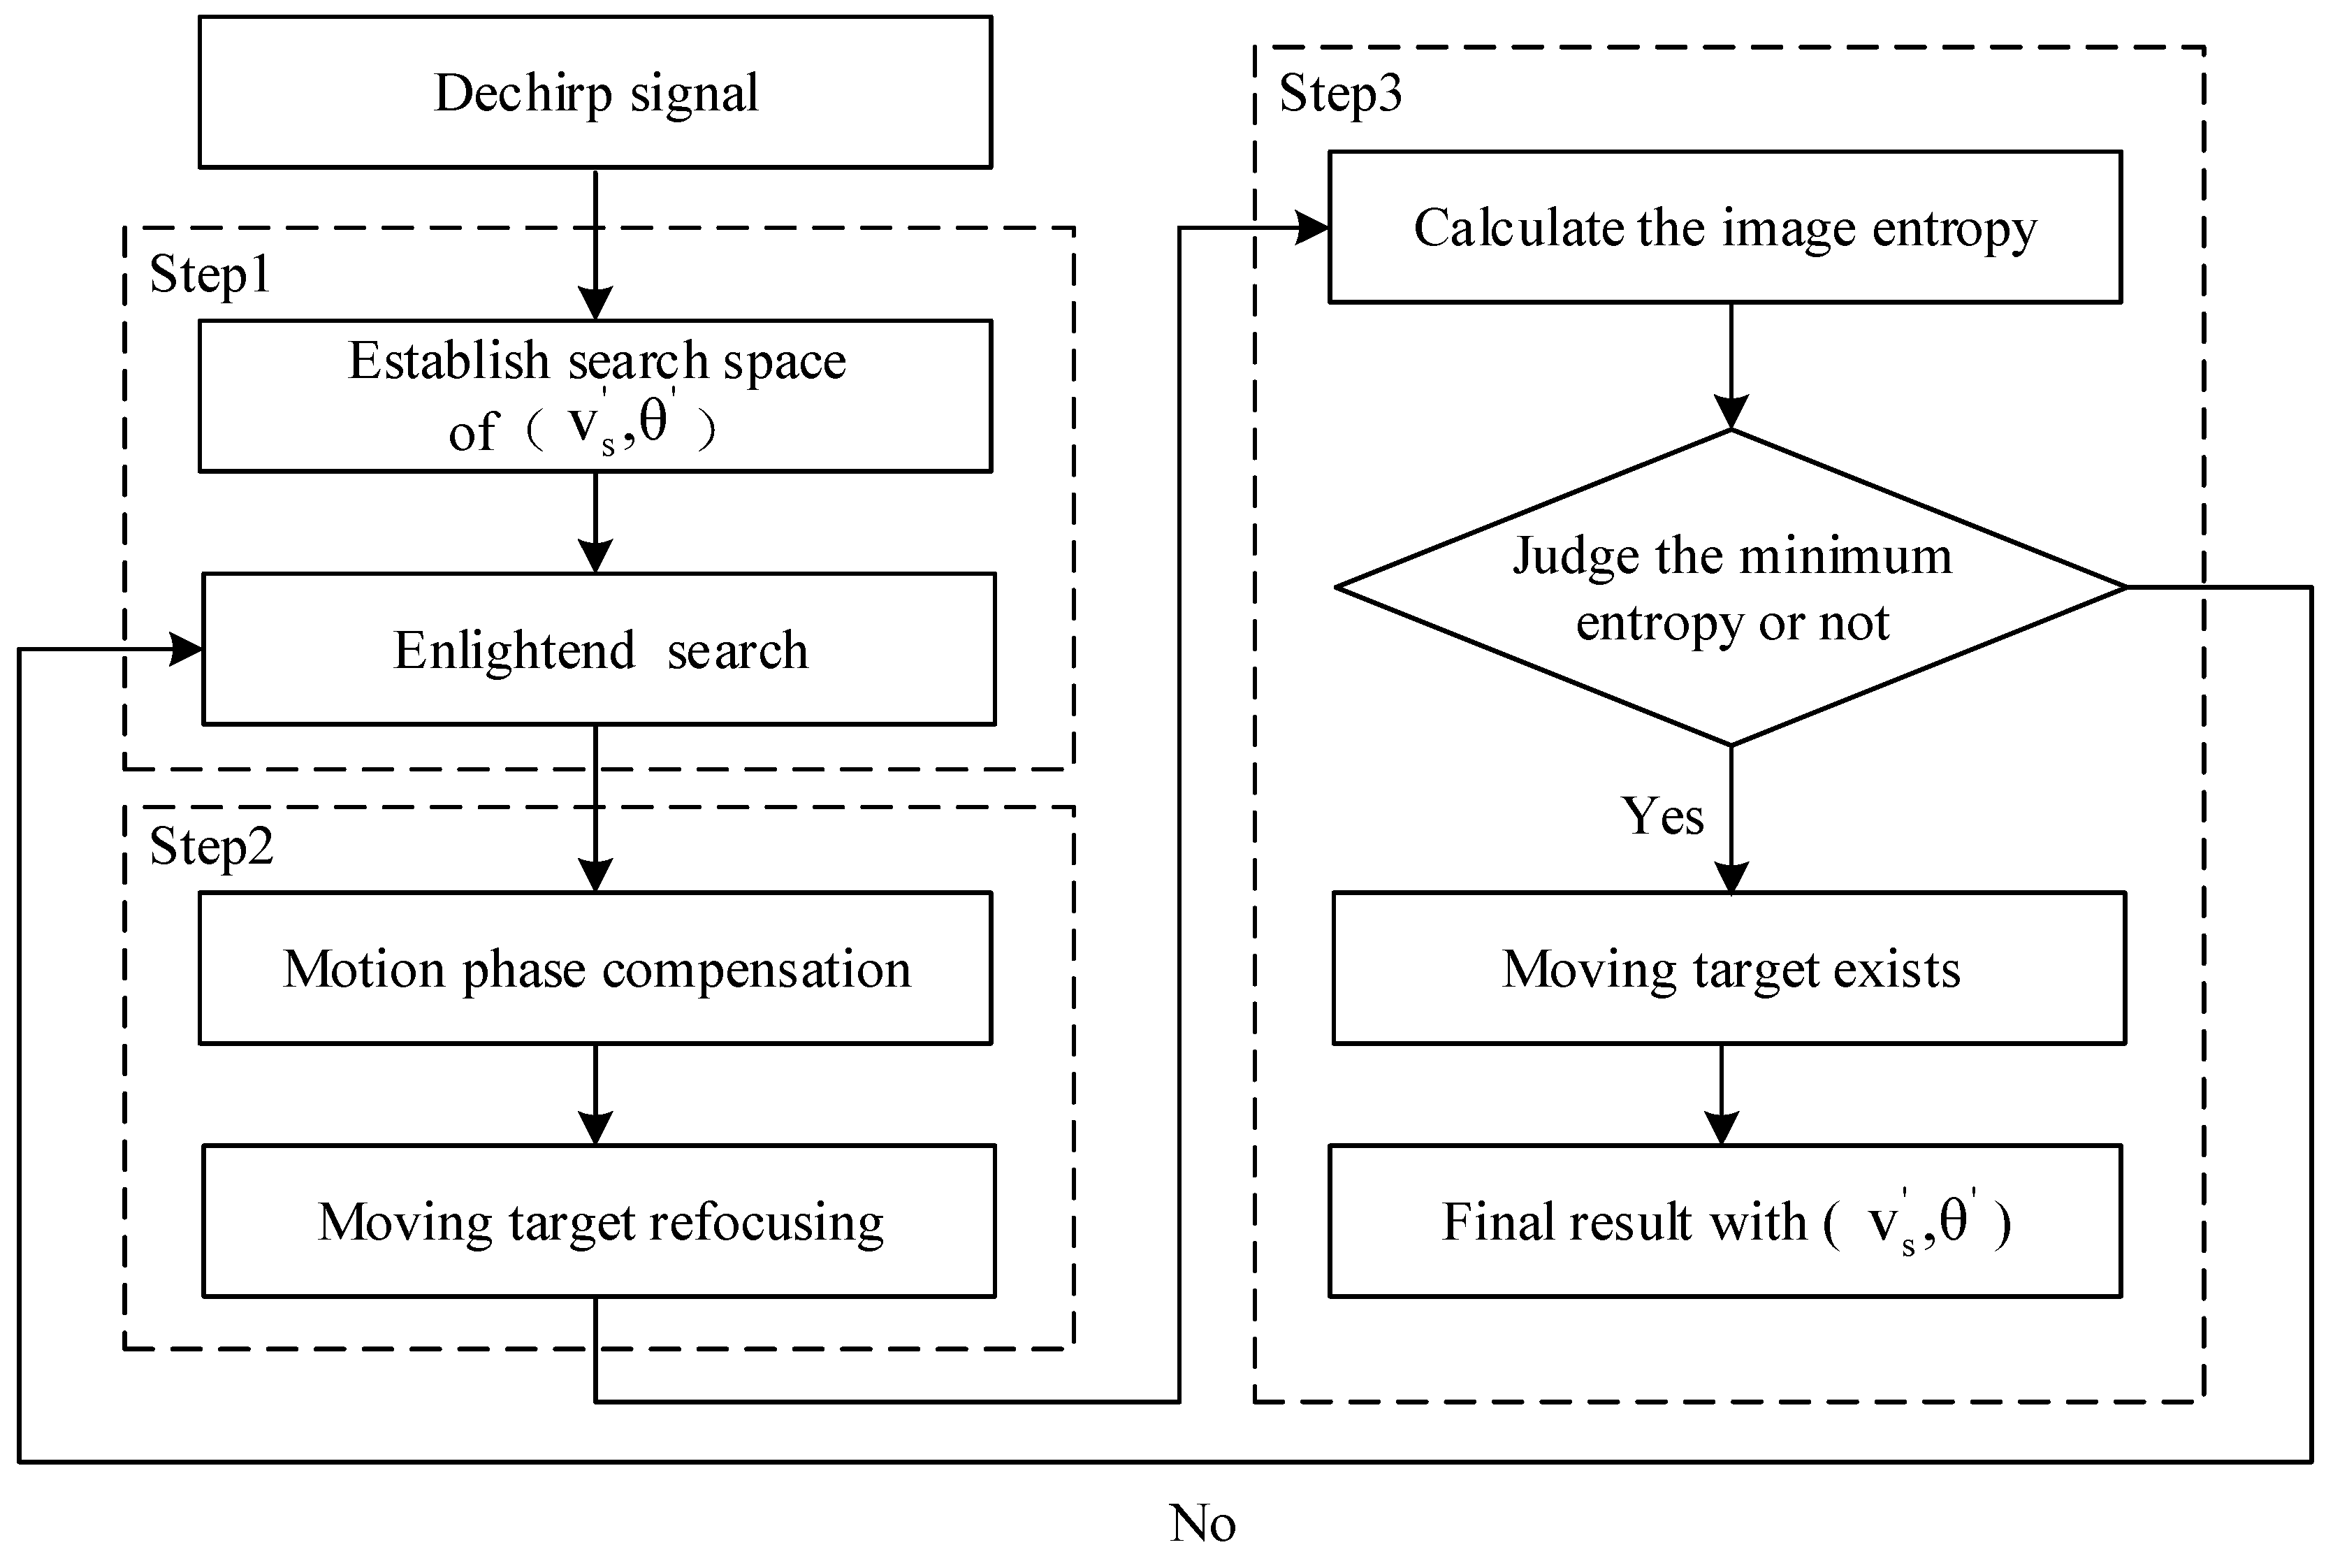
In the following section, the experiments on simulated and synthetic data for the GBSAR system are introduced.

4.1. Simulated Data

Here, we conducted multiple simulation experiments on moving targets to verify the efficacy of the algorithm proposed in the third section. The specific parameters of the GBSAR system are reported in Table 1.
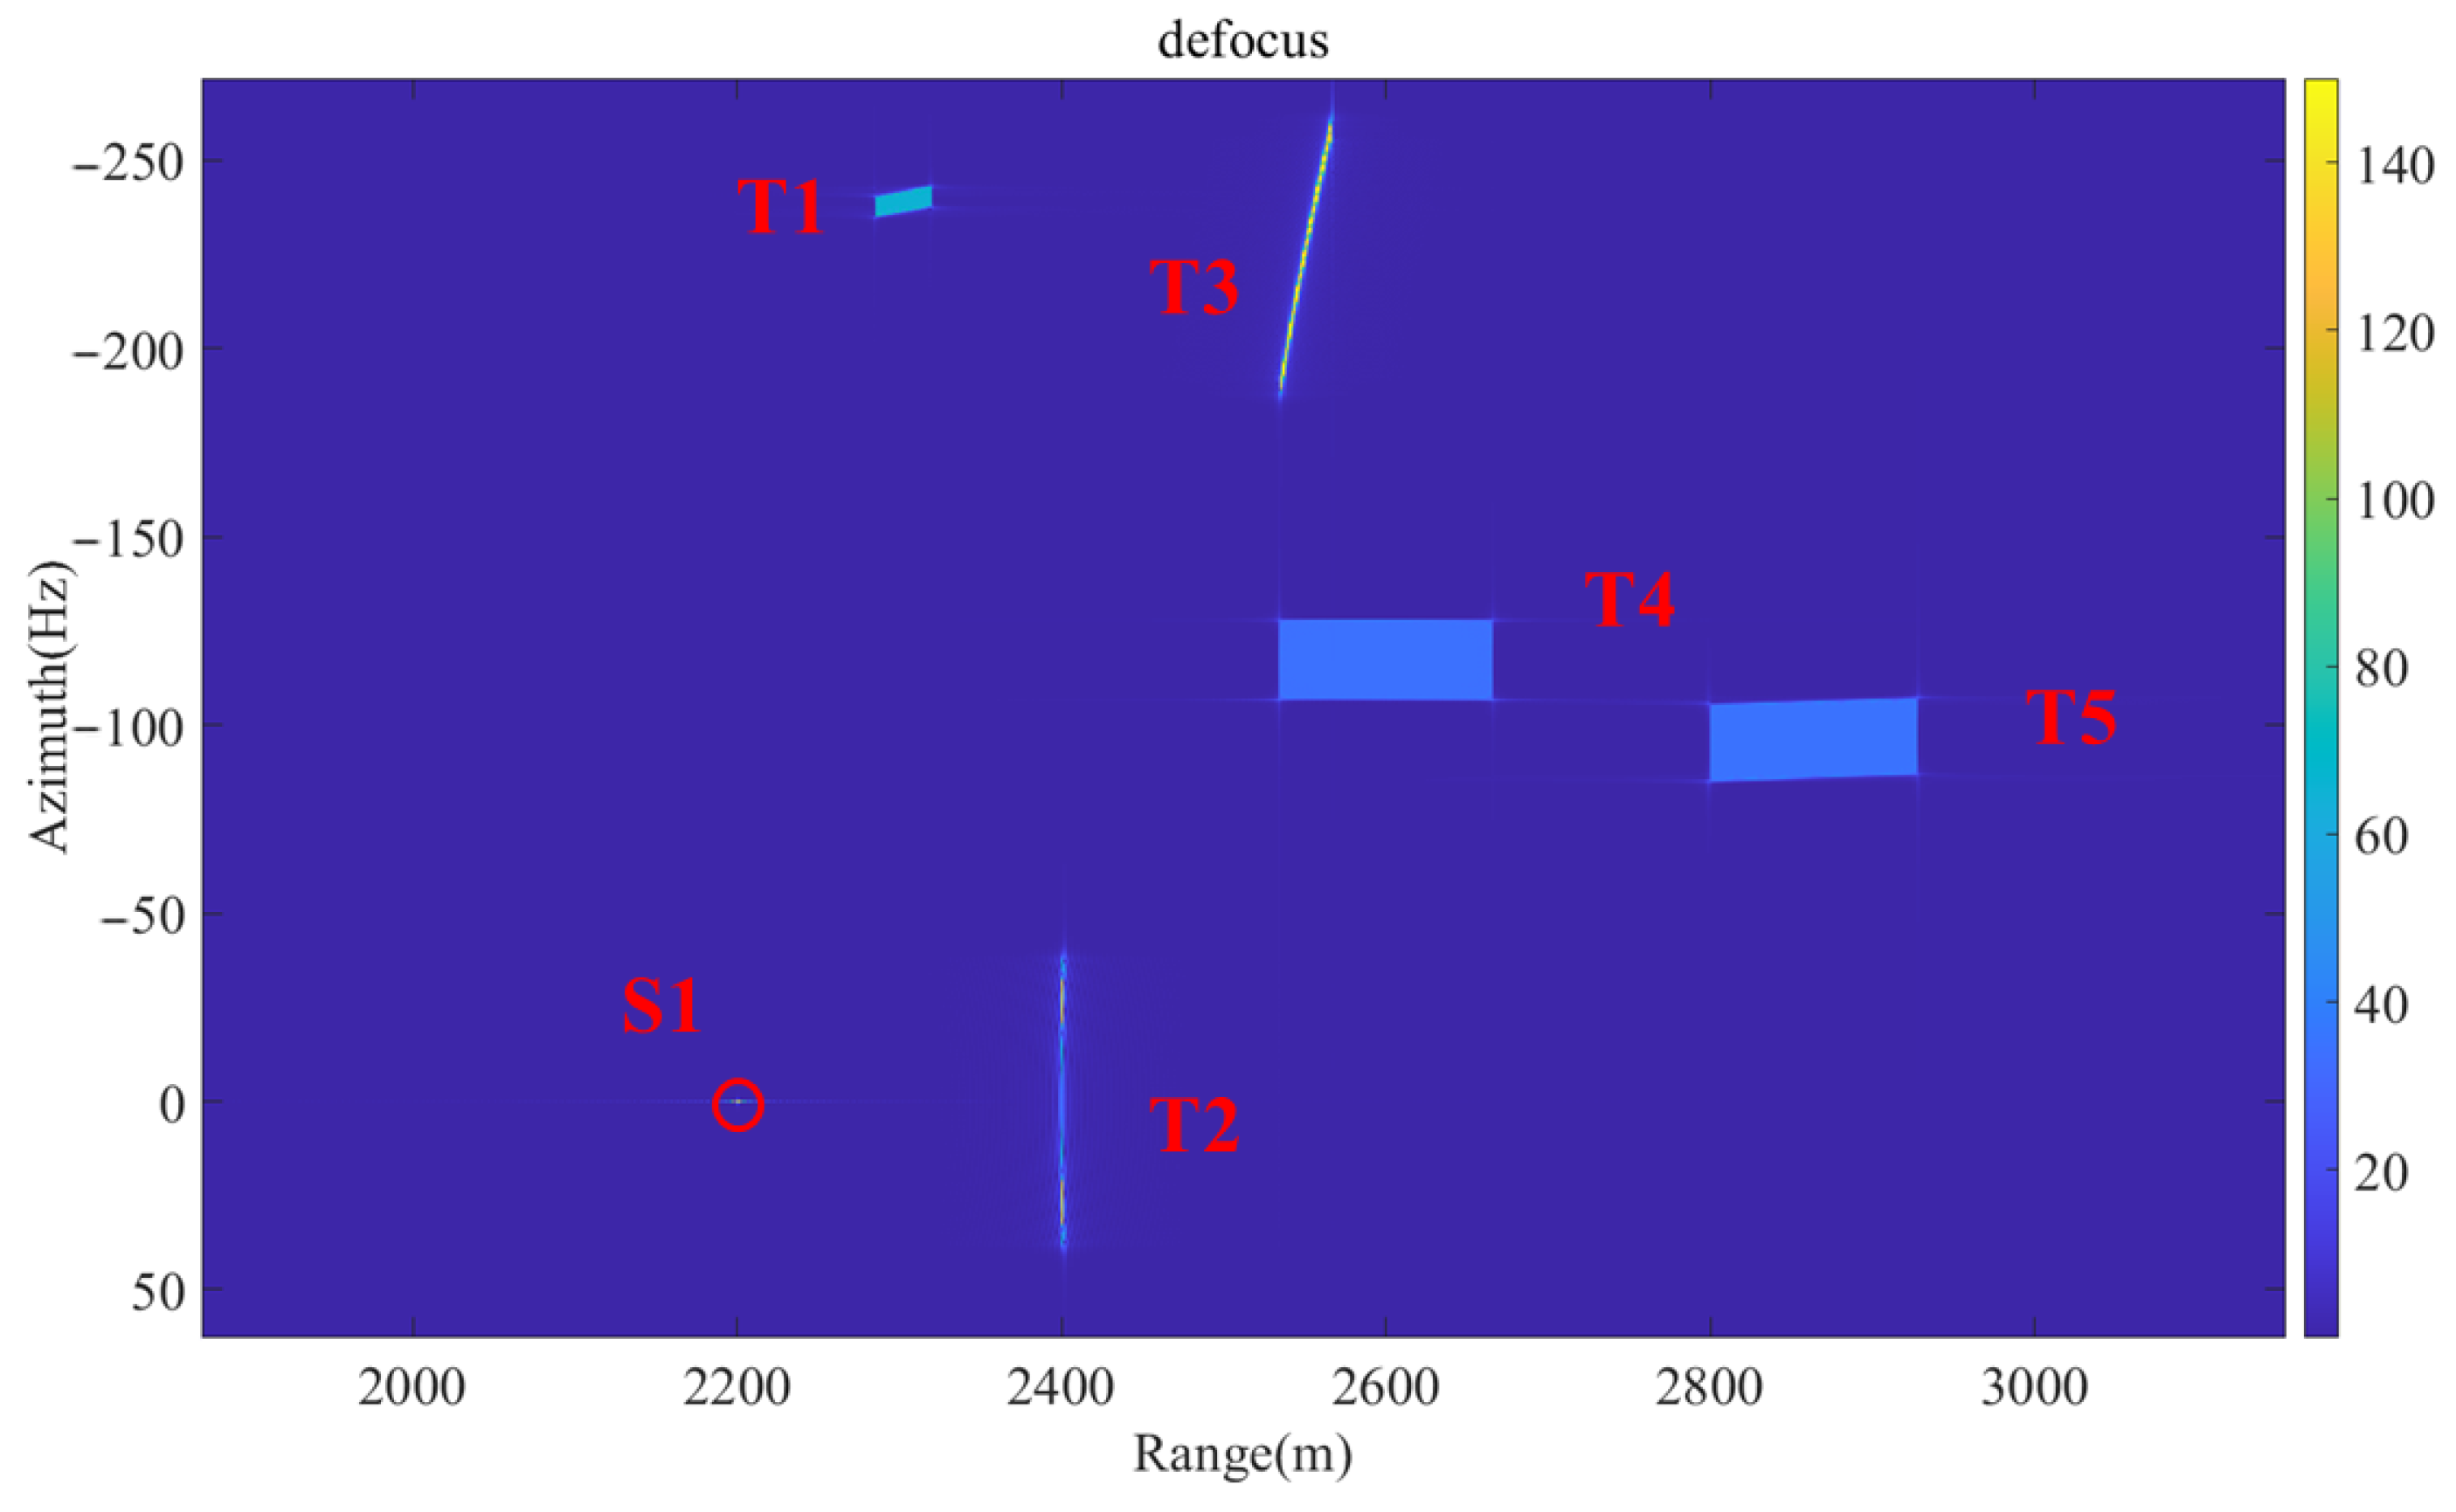
The center frequency of the GBSAR system is 17 GHz. The speed of the platform is 0.03 m/s. Here, we use 3000 m as the maximum illuminating range. The motion parameters and the positions of the targets are shown in Table 2. Five moving targets are simulated and the stationary point target S1 is used for reference.
When t a z i = 0 , moving target T1 has the 2D velocity with v r = 2 m/s and v a = 5 m/s. And it is located at (2300, 100). The positions of T2 and T3 are (2400 m, 0 m) and (2500 m, 500 m), respectively. The velocities of them are v r = 0 m/s and v a = 10 m/s. The moving targets T4 and T5 are located at (2600, 0) and (2800, 600), respectively, and the velocities of them are v r = 10 m/s and v a = 0 m/s. The coordinates of S1 in the scene are (2200 m, 0). As can be seen from Figure 6, after GBSAR imaging, S1 is well focused. Due to the influence of velocity, the moving targets are defocused and displaced.
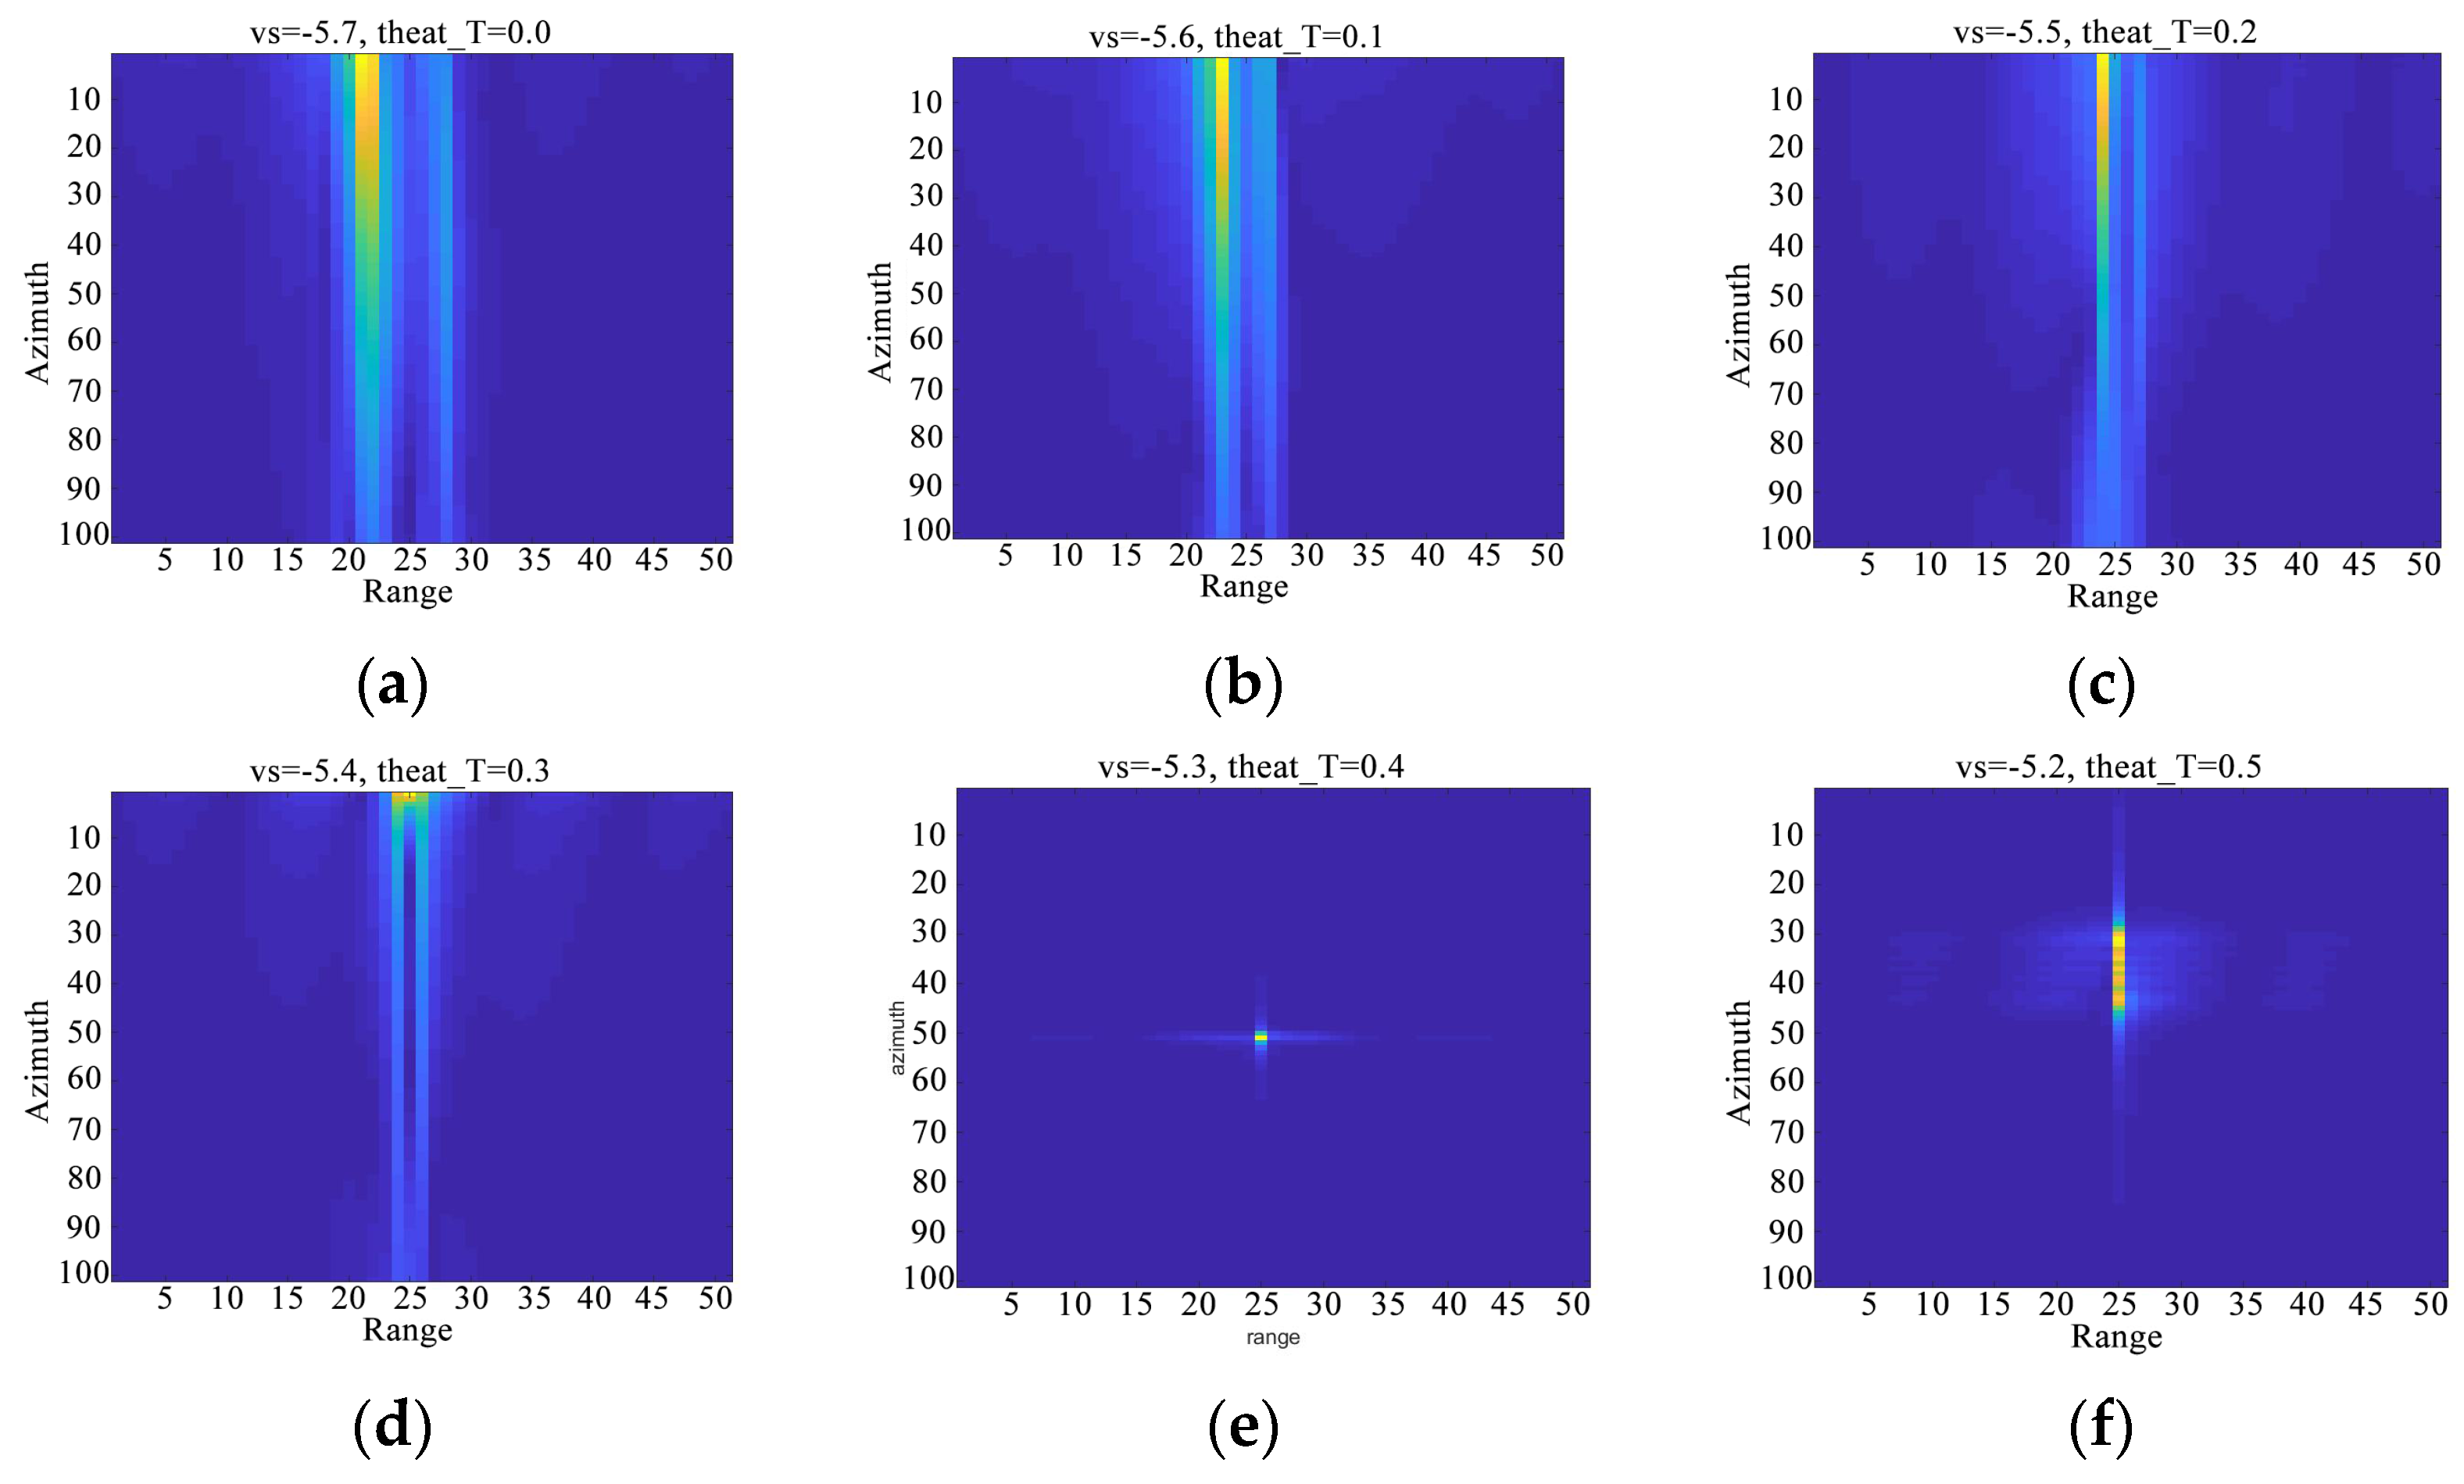
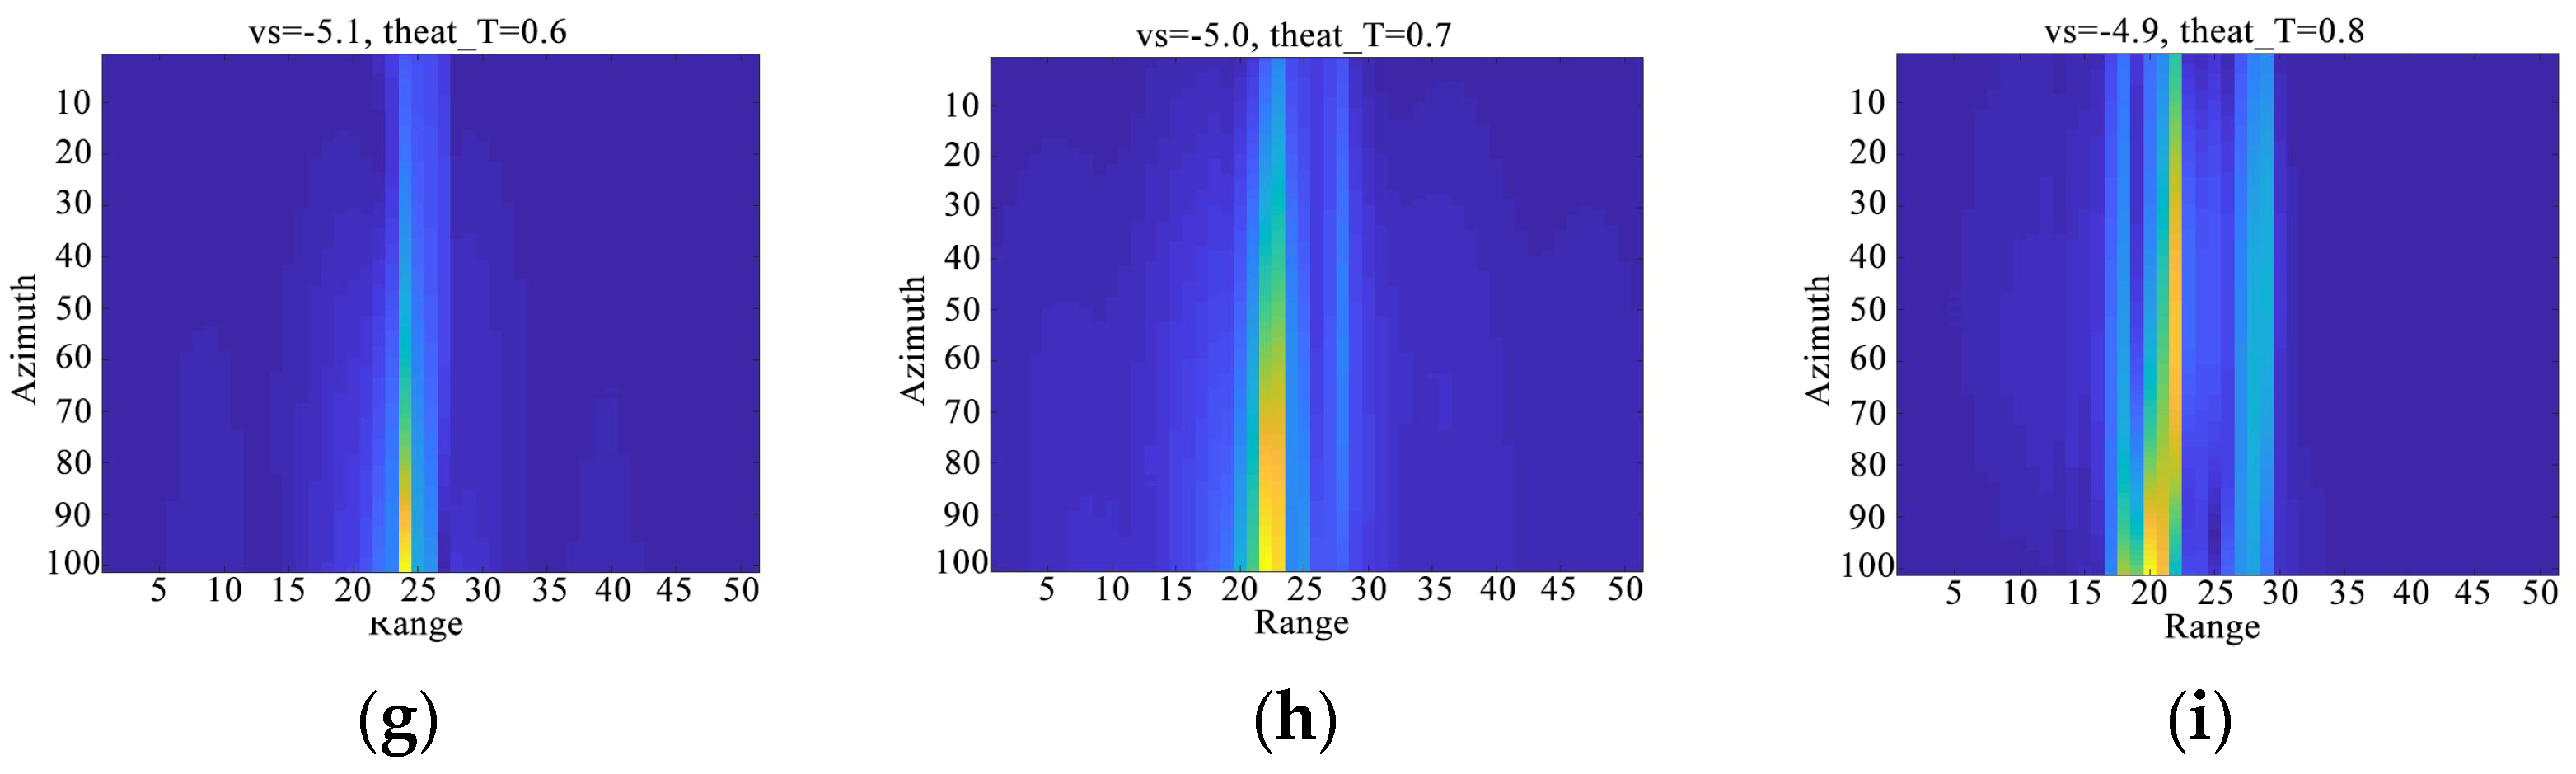
Next, T1 is selected as the example for detection, while its detection process is analyzed and evaluated. In this experiment, ( v s , θ ) was searched by traversal and 2D enlightend search, respectively.
First, we use the traversal method to search the parameters of T1. To search the optimal parameter of v s , we conduct a cyclic search ranging from −6 m/s to 6 m/s with a step size of 0.1 m/s. Similarly, for parameter θ , we perform a cyclic search from −6° to 6° with a step size of 0.1°. The refocusing results for different parameters during the search process are shown in Figure 7. Subfigures (a–i) are the images under different sets of ( v s , θ ) . The entropy of the image under different parameters is calculated, and the optimal parameters ( v s , θ ) that achieve refocusing of the moving target are confirmed by the minimum entropy principle.
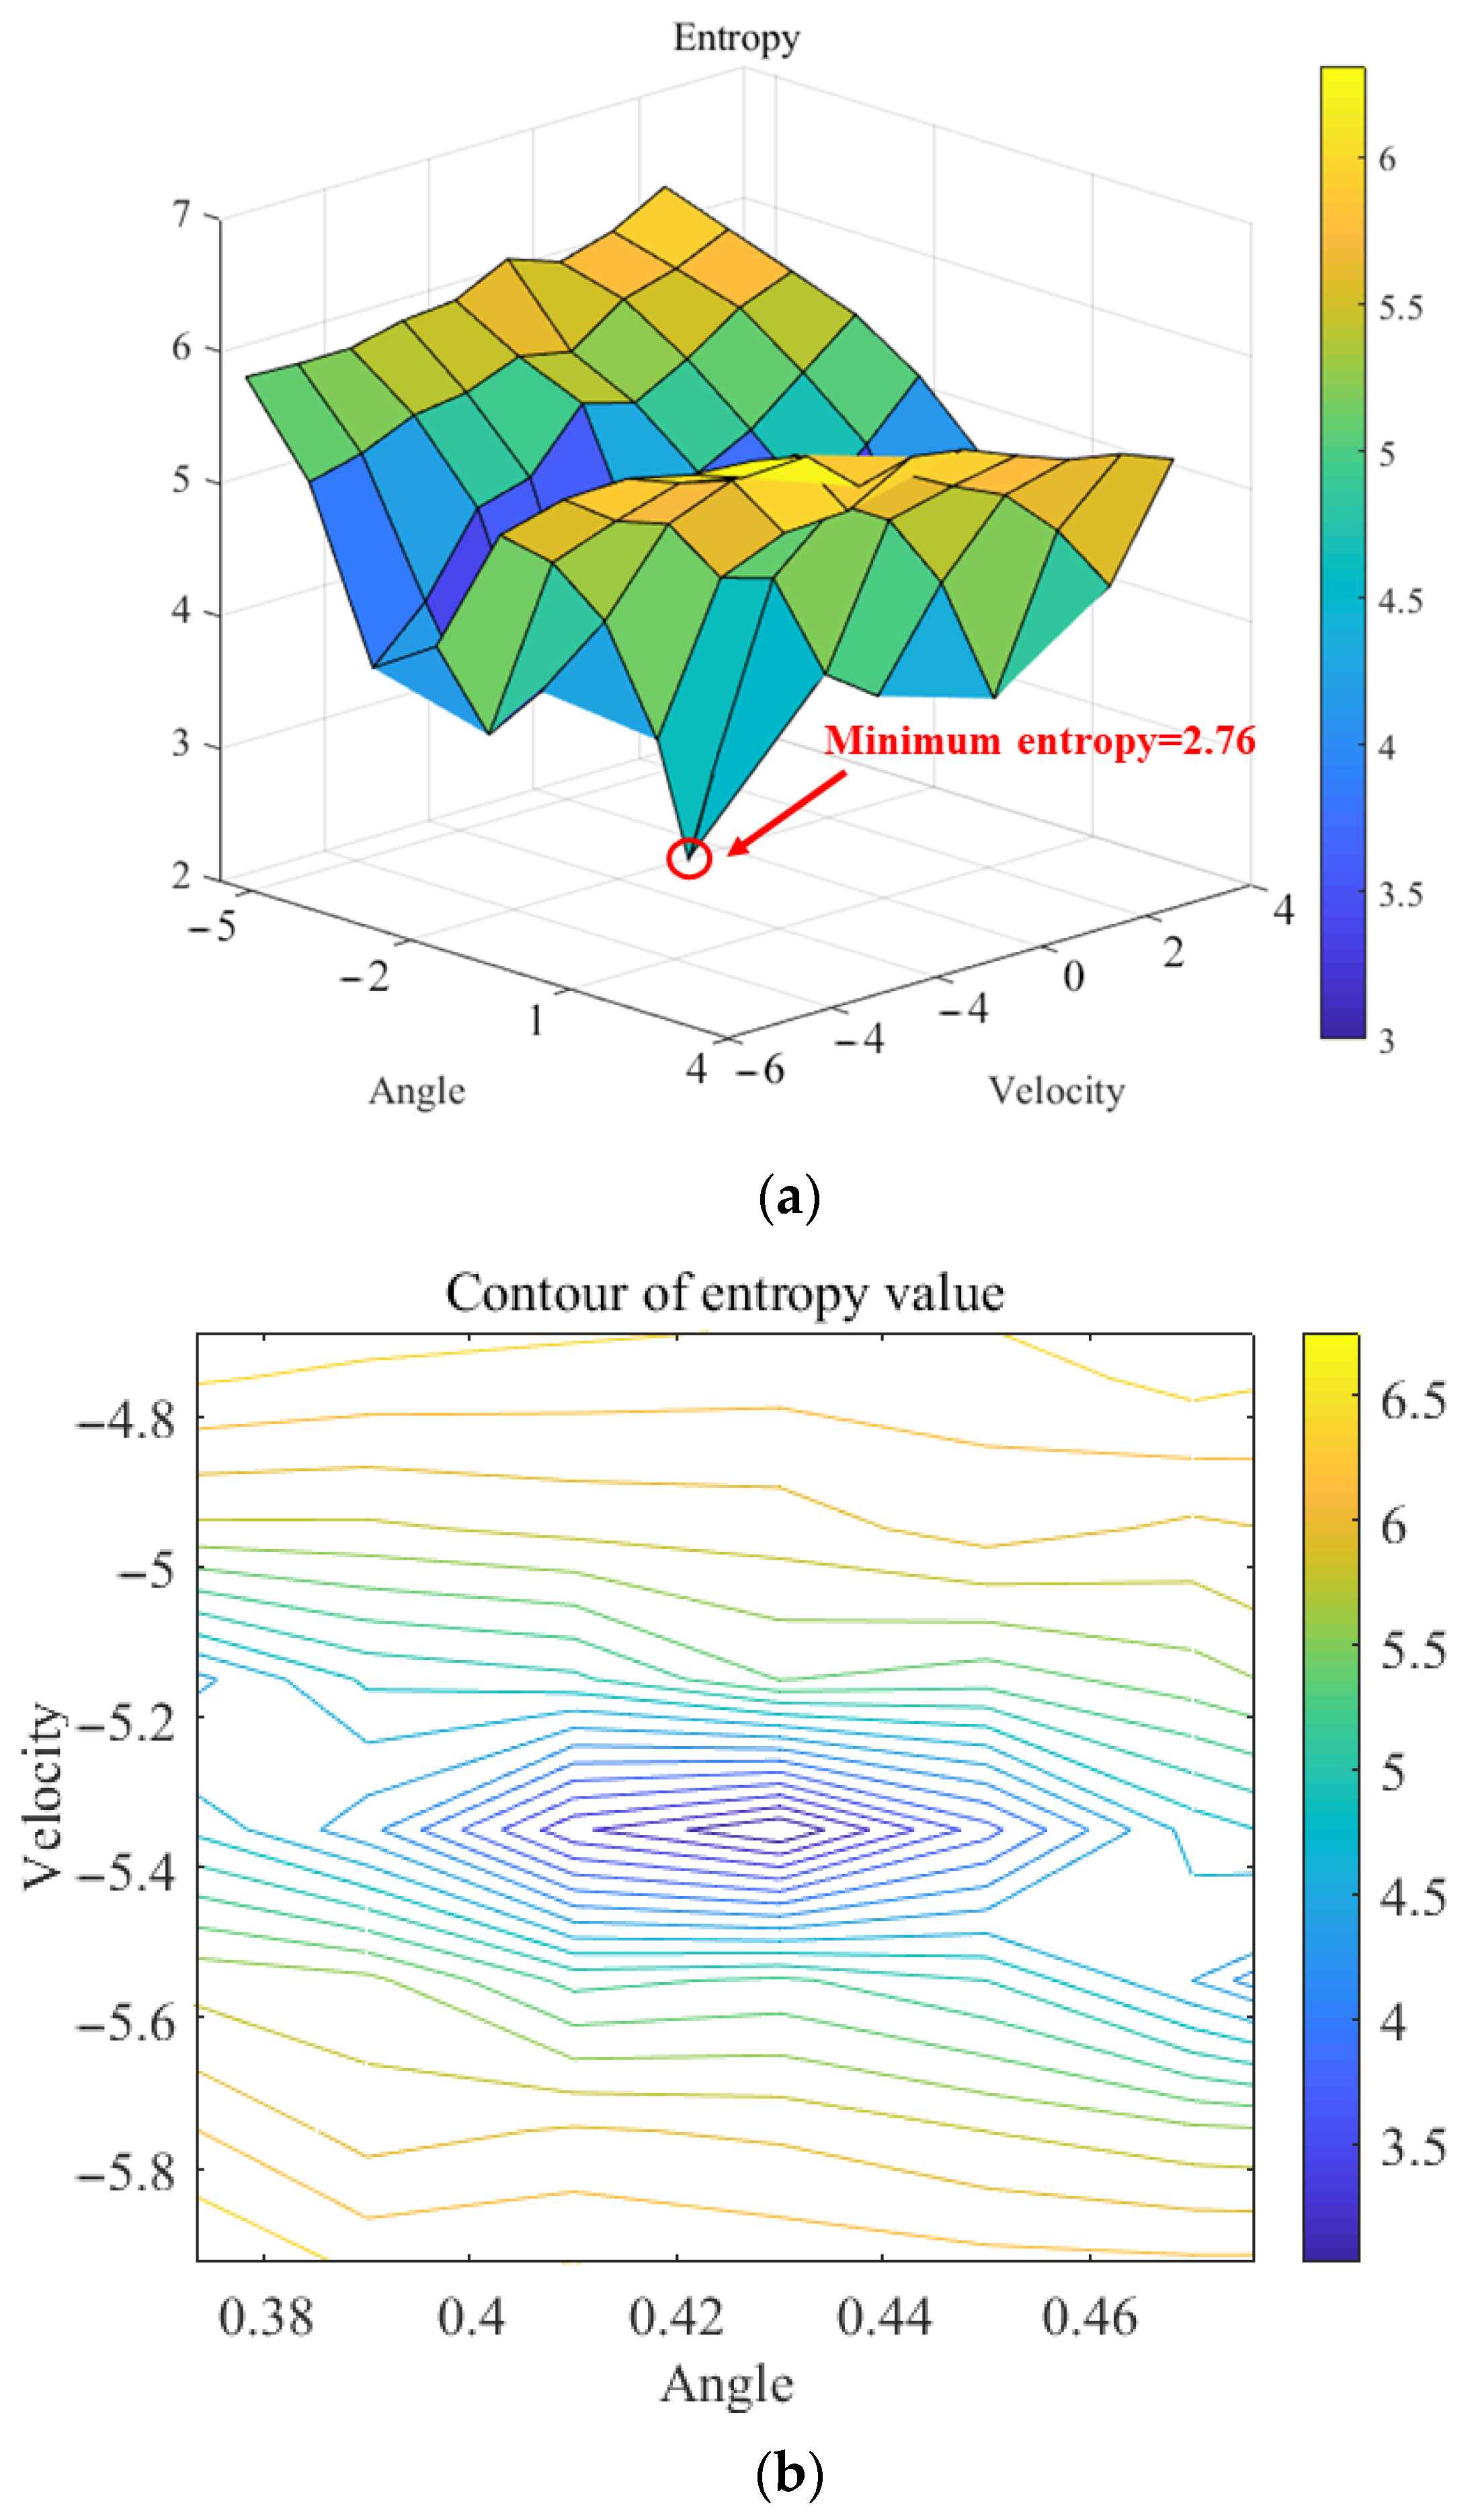
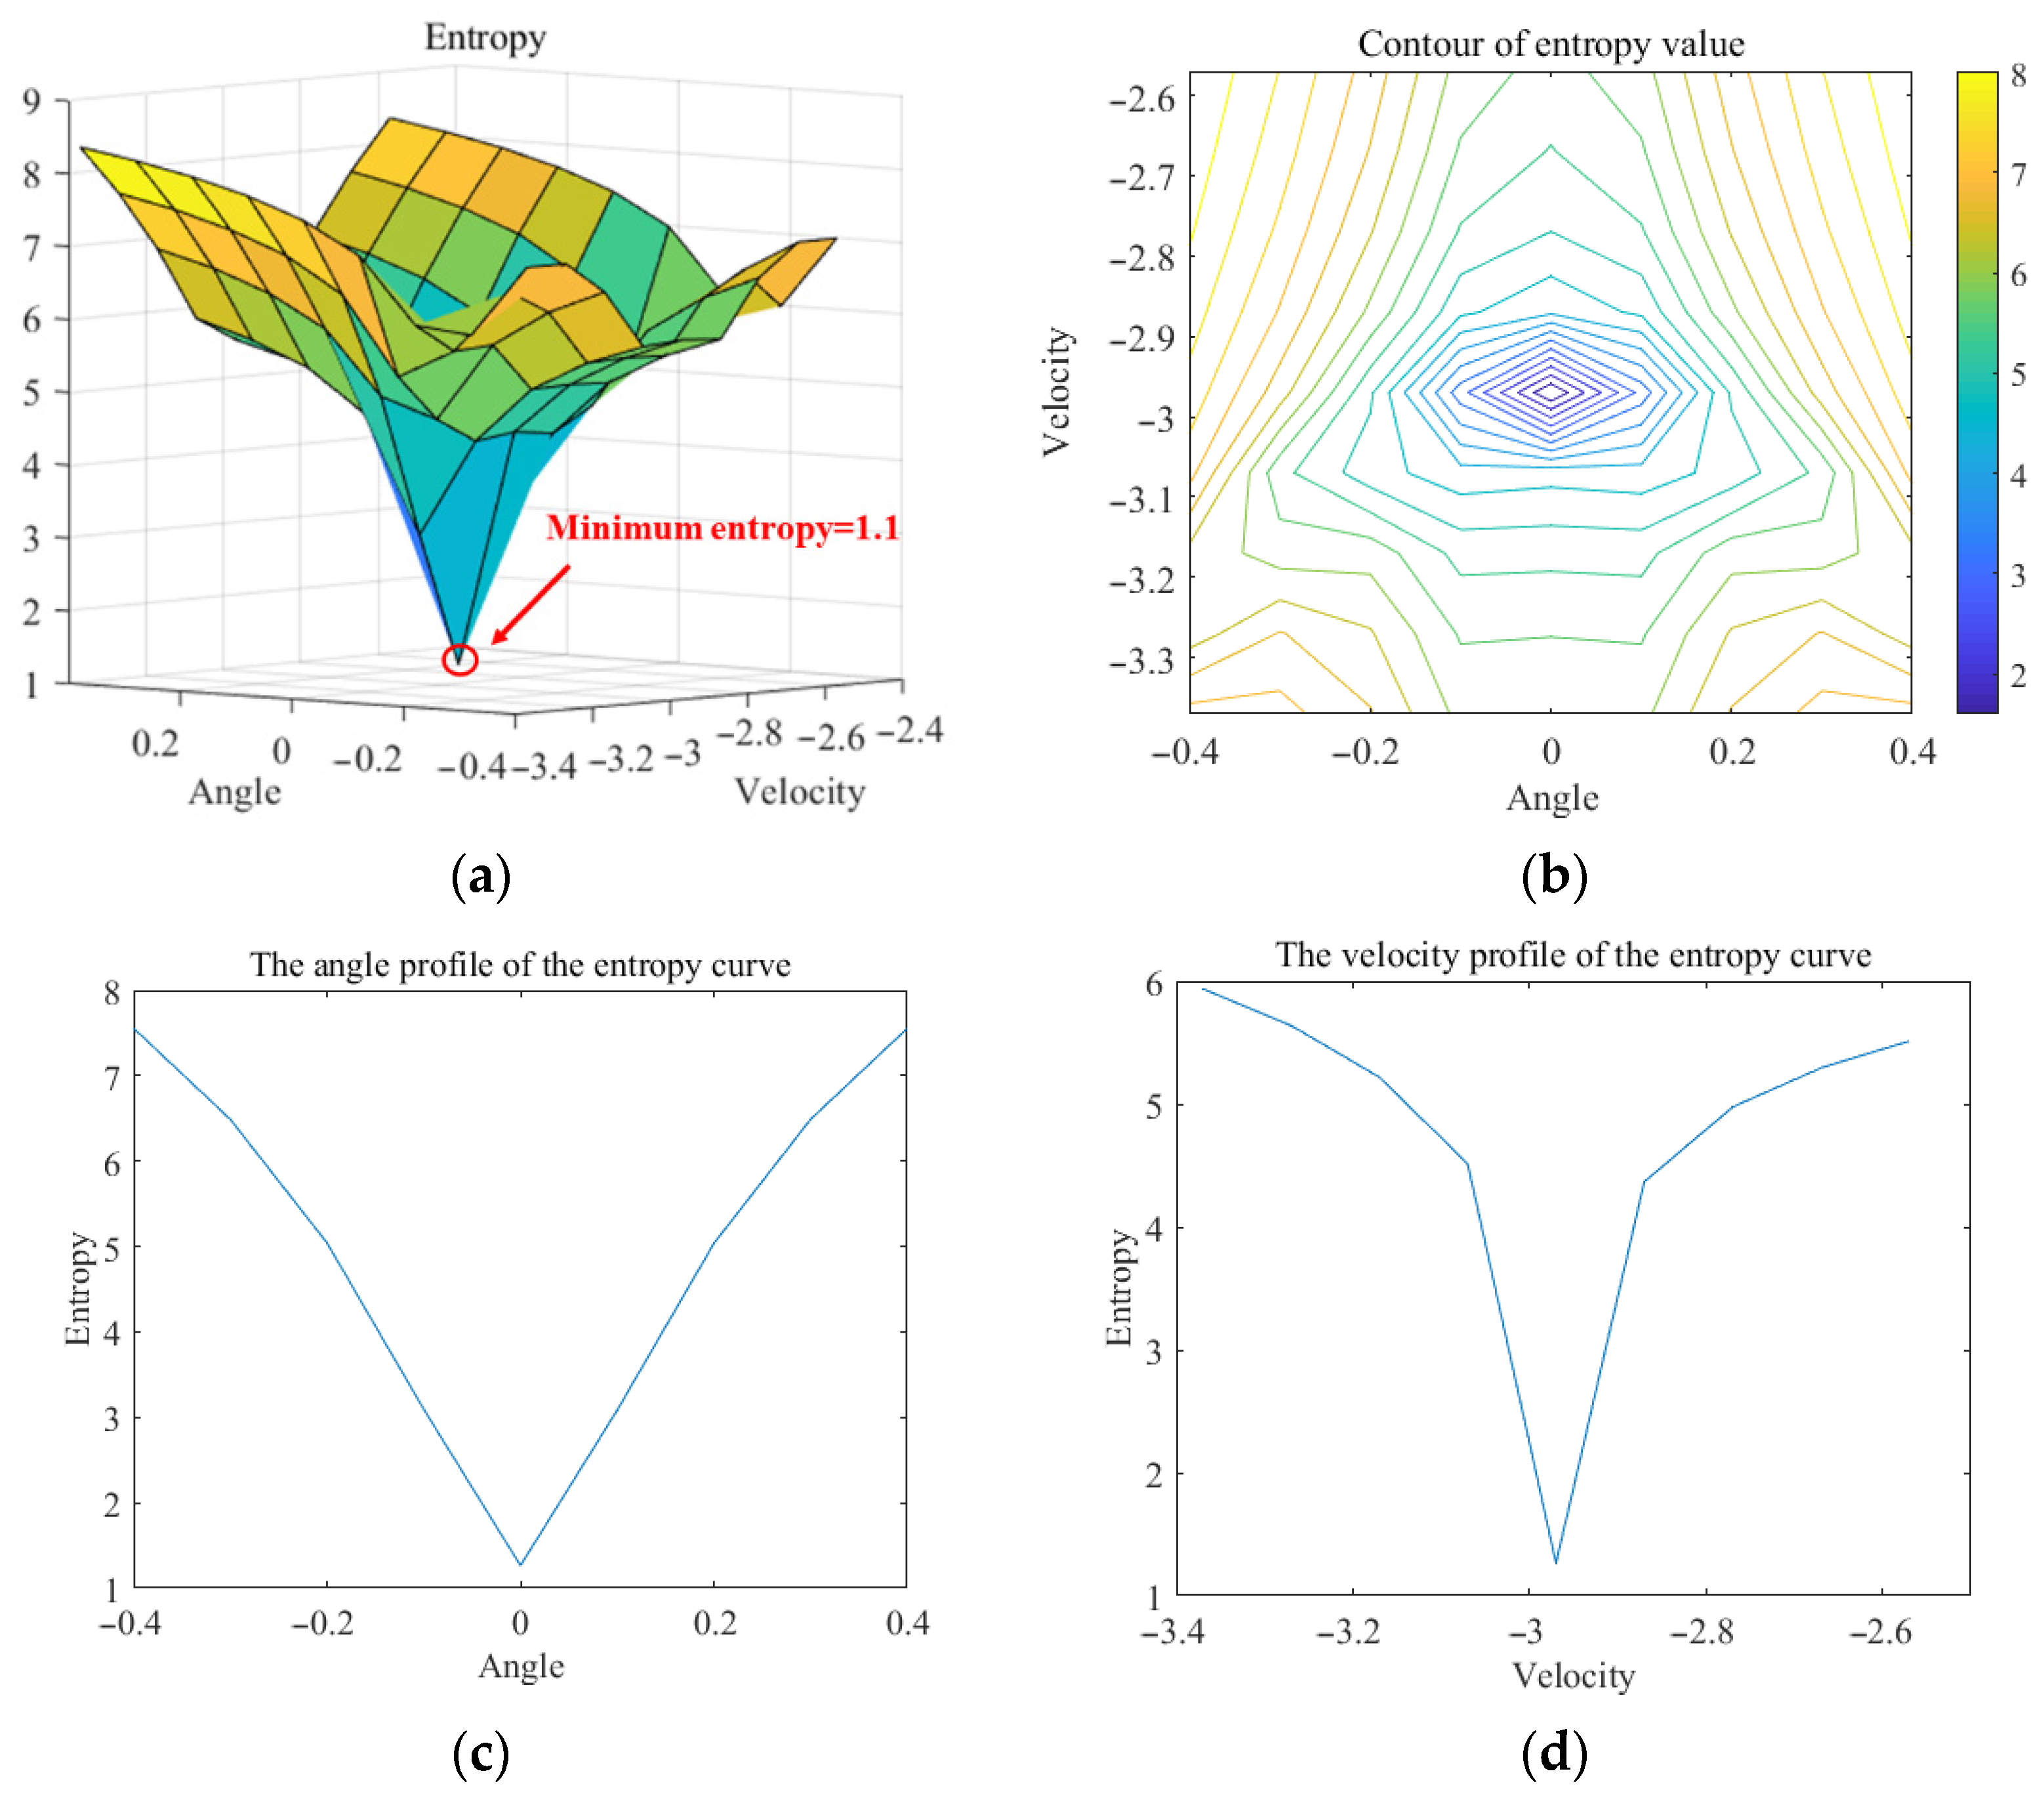
Figure 8 shows the entropy curves of T1 refocused images under different 2D parameters. The parameters corresponding to the minimum entropy value in the figure closely approximate the actual motion parameters of target T1. Figure 9 and Figure 10 show the angle and velocity profiles of the entropy curve, respectively.
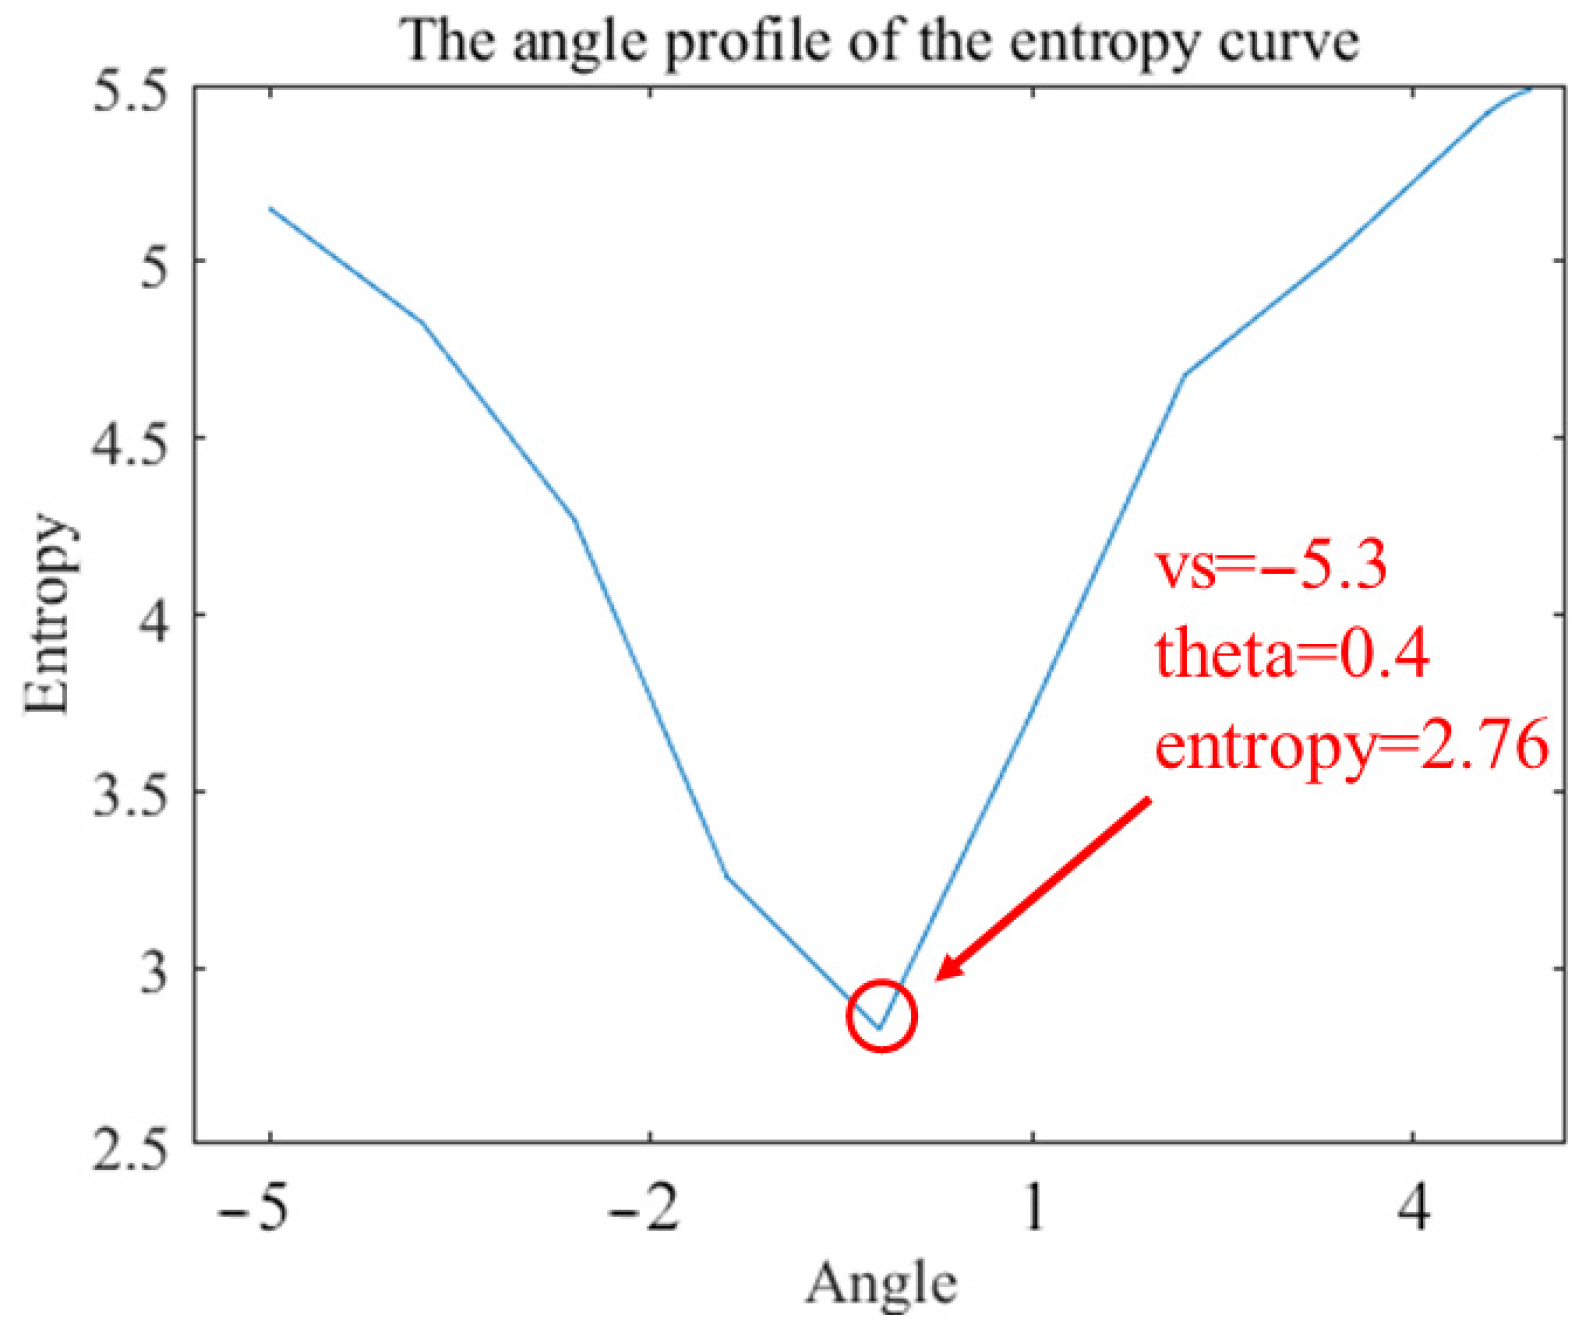
Figure 9 is the result of the angle profile. This profile can reflect the relationship between the image’s entropy and its angle during the parameter search process. It can be seen that when the angle is 0.4°, the entropy of the refocused image reaches its minimum value. 
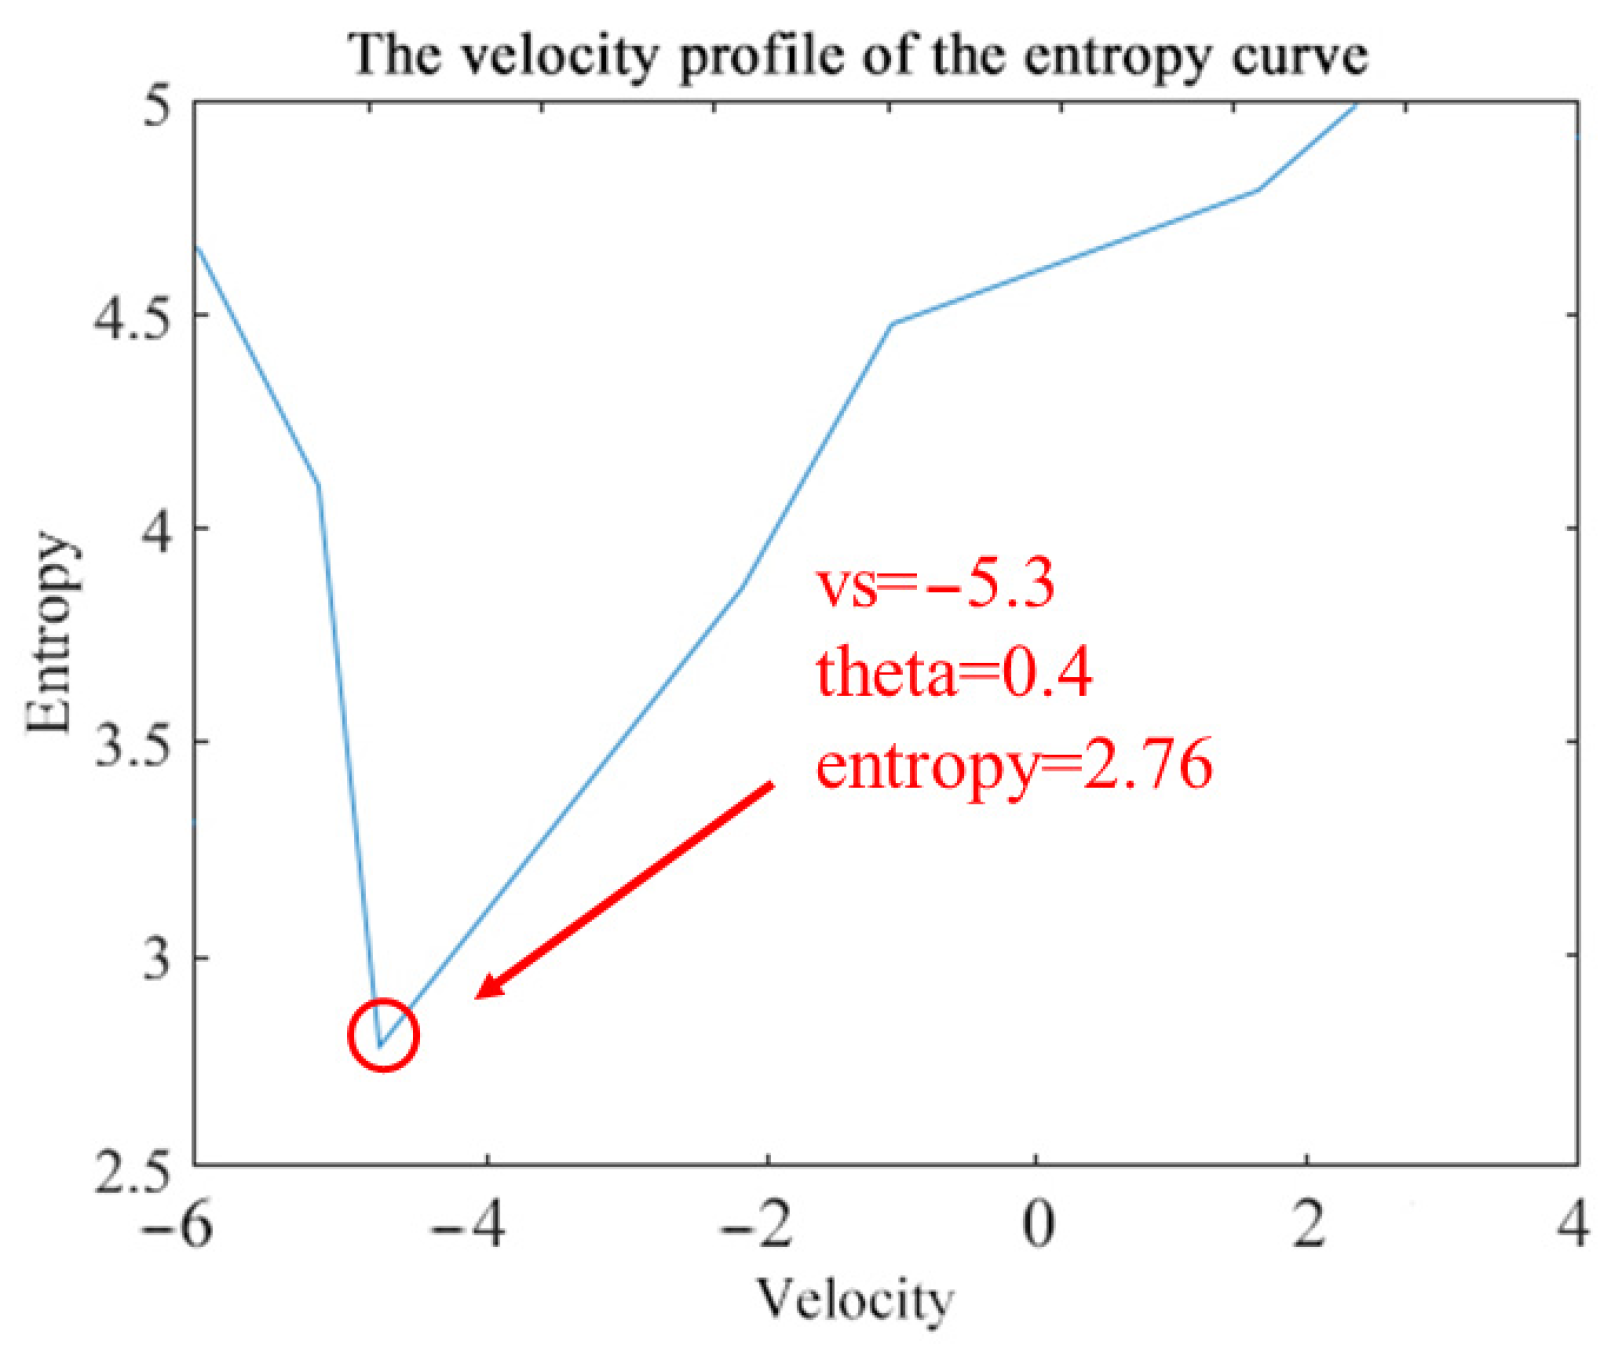
Figure 10 is the result of the velocity profile. This profile demonstrates the relationship between the image entropy and the velocity during the parameter search process. This figure clearly illustrates that the minimum value of the entropy for the refocused image is achieved at a velocity of −5.3 m/s. It can be observed from Figure 9 and Figure 10 that when the parameters v s = −5.3 m/s and θ = 0.4° are used to refocus T1, the refocusing image reaches the minimum entropy value of 2.76.
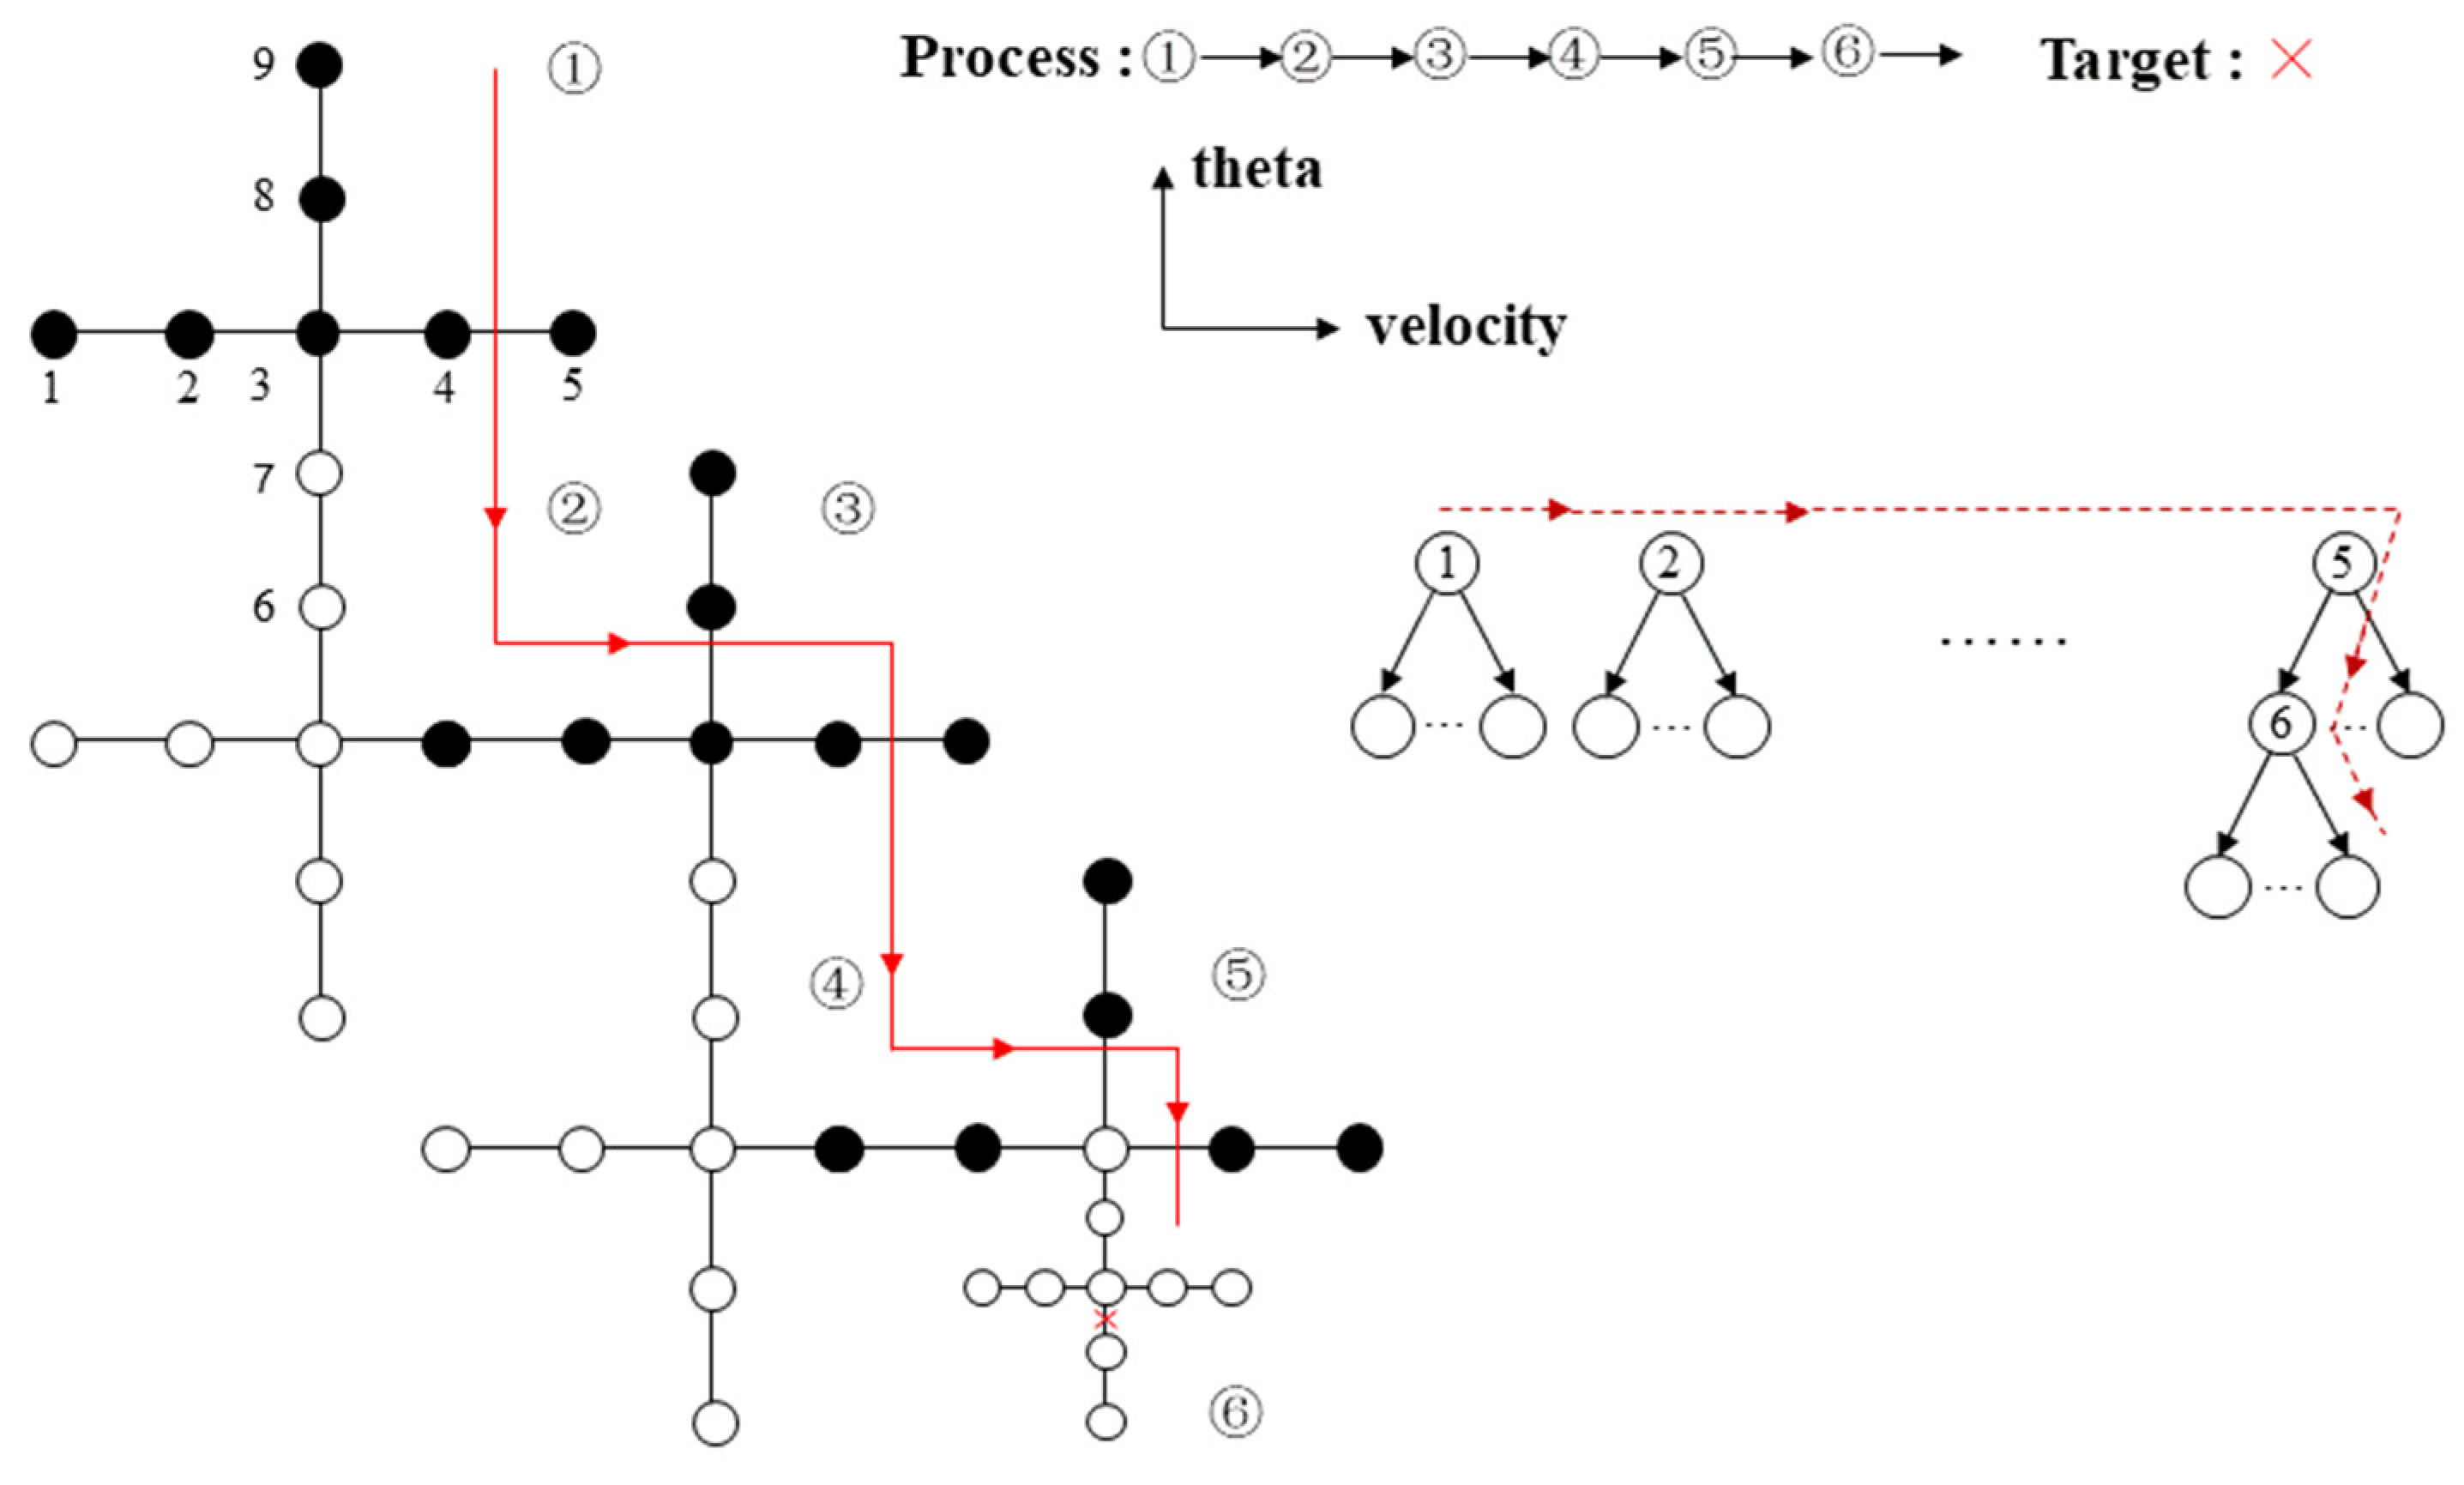
Next, the enlightend search is used to search the parameters of T1. According to the platform velocity of this simulation, we set the initial node at (0, 0.03). The 2D parameter space is established for searching with 2 m/s and 0.1 ° as the step sizes of the velocity dimension and angle dimension, respectively. It is worth mentioning that the search strategies of the traversal method and the 2D enlightend search are different. The traversal method always maintains a fixed step size to indiscriminately search for v s and θ . For the enlightend search, the node with a minimum entropy is always located at the interior of the “cross.” In order to search in depth, the search step size will be halved as the number of iterations increases. Therefore, the search step size is not the reference for comparing the convergence time between the two methods. In this study, the computational efficiency of the two methods is judged through the comparison of the time spent searching for similar optimal values in the range of allowable error.
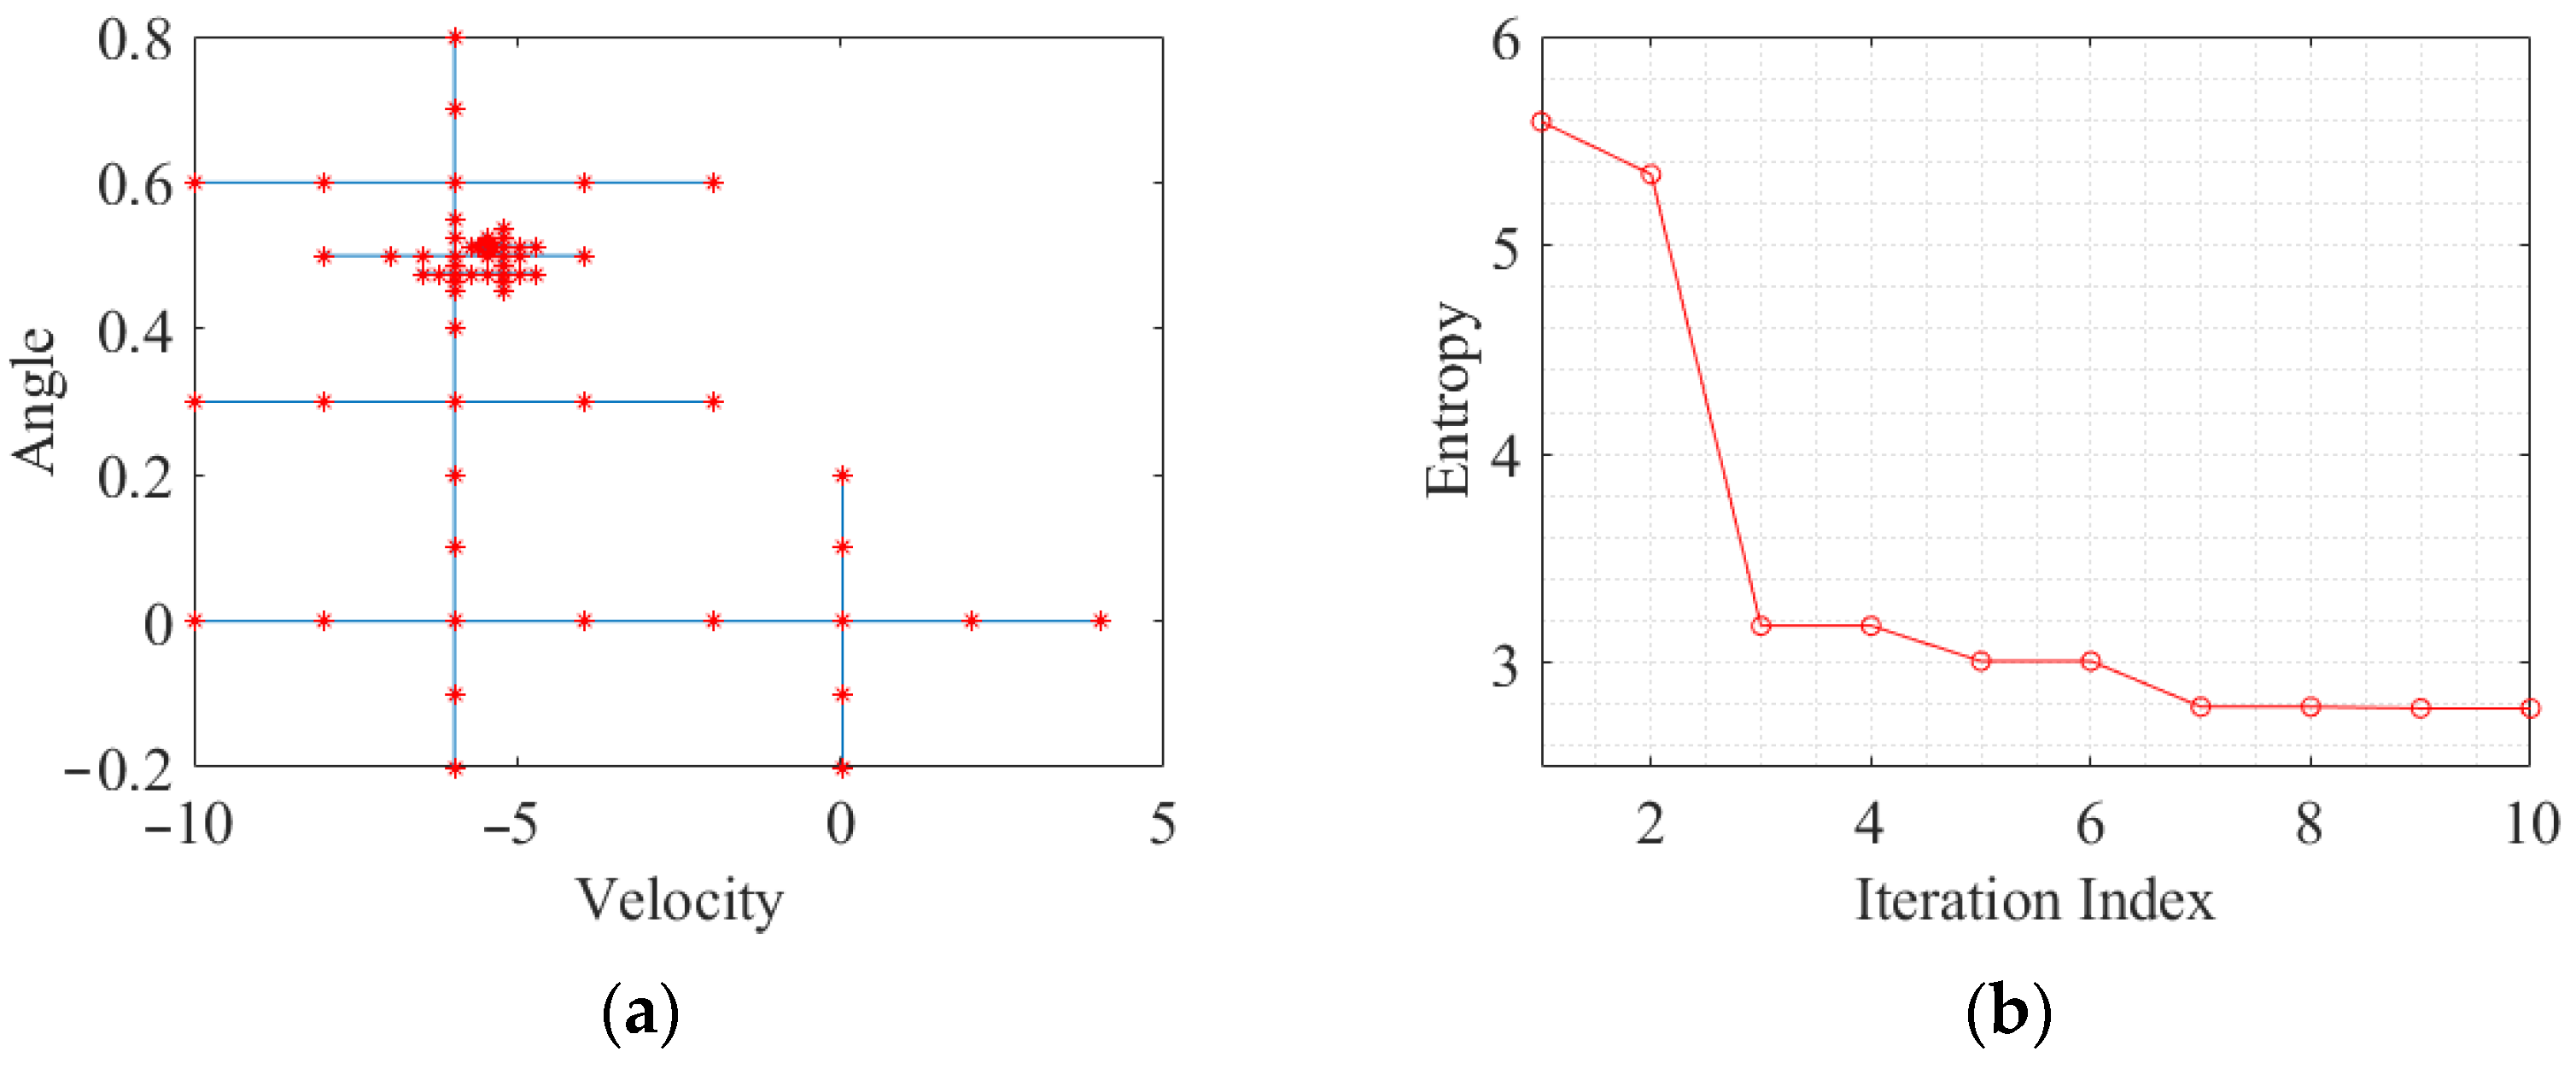
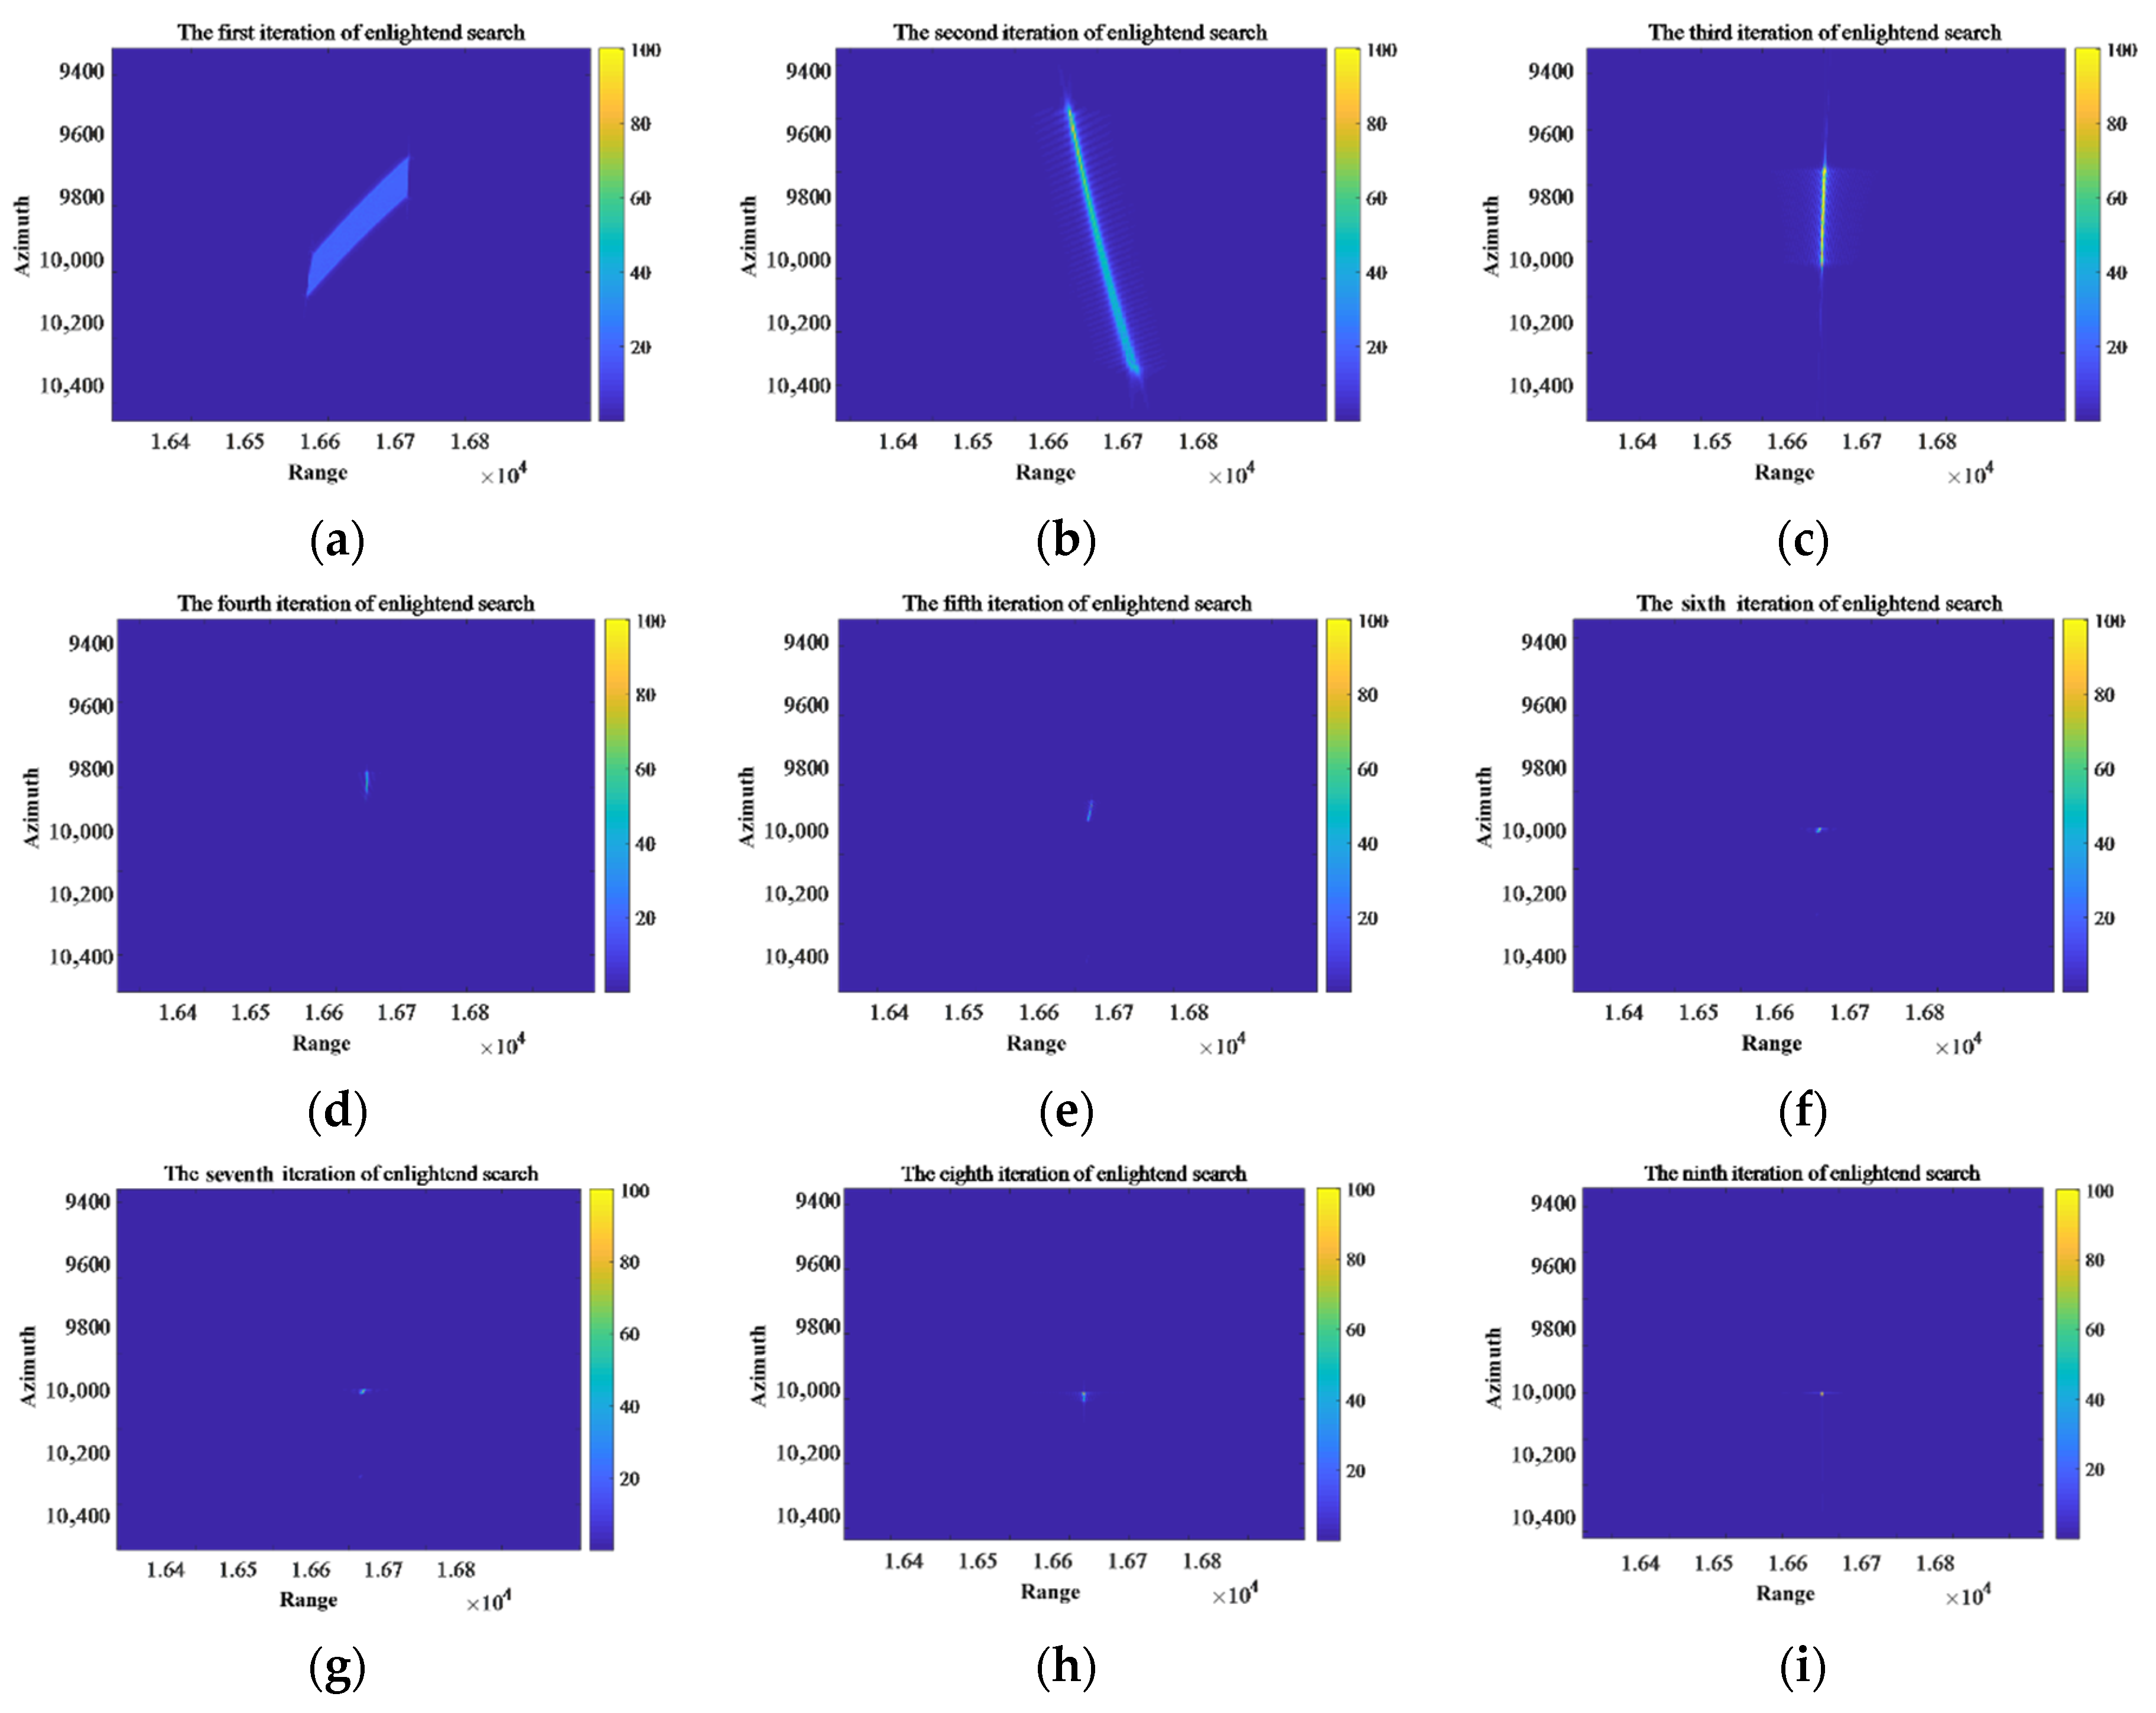
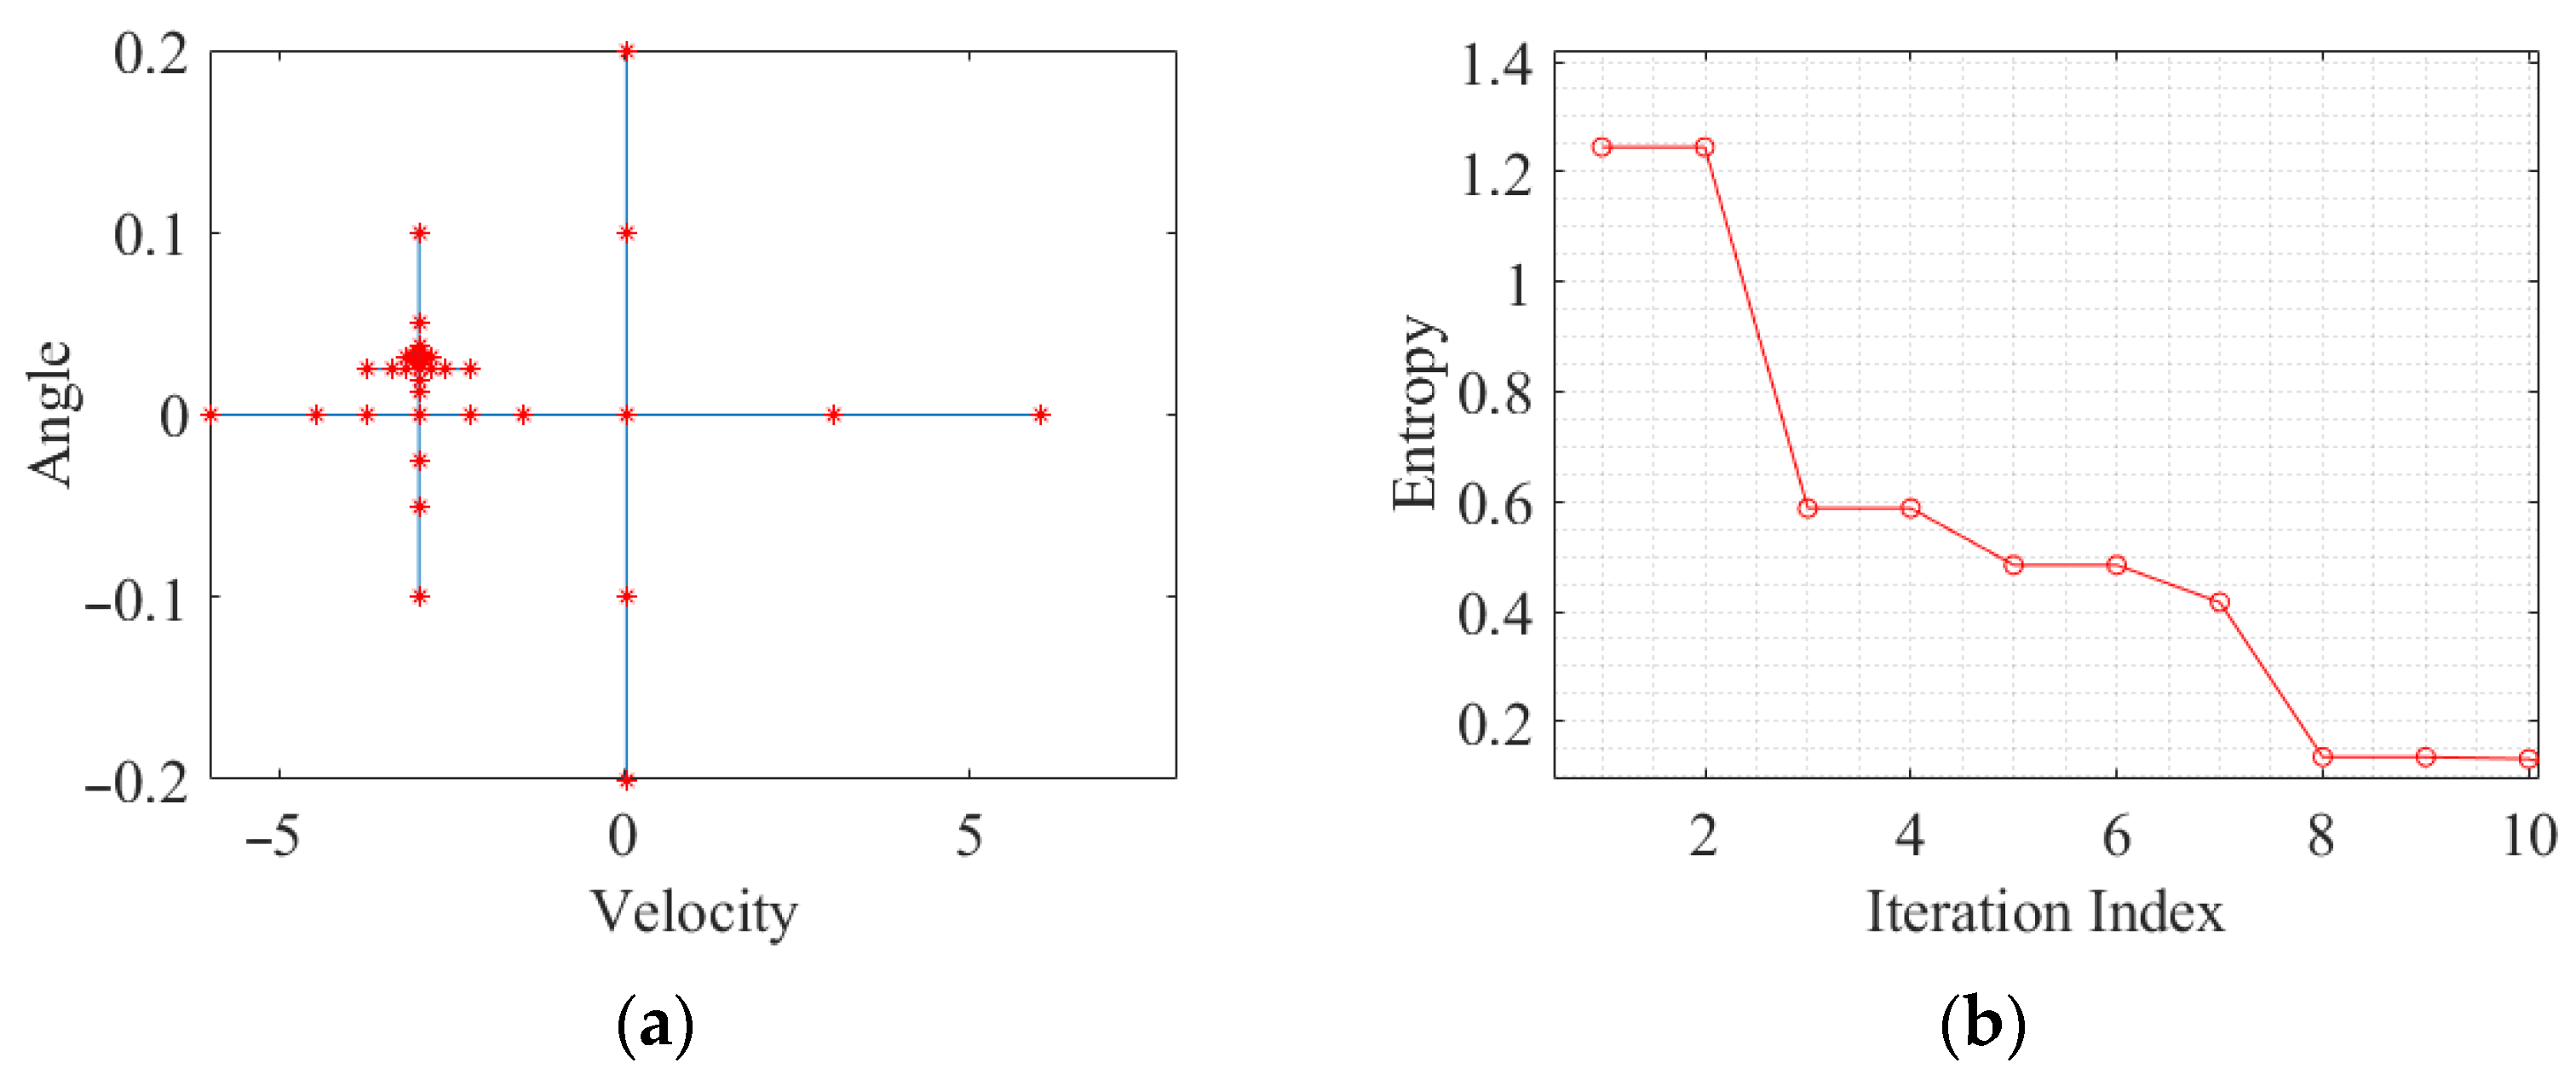
The process of parameter searching for T1 is shown in Figure 11a. The different nodes in the search “cross” are represented by red “*”. The relationship between the number of searches and the refocused image entropy is shown in Figure 11b. The circles represent the minimum entropy value after each iteration. It is evident that the greater the number of searches, the smaller the entropy. Furthermore, only the parameters of the first three searches in the parameter space have the greatest impact on the image entropy, while the other parameters have little effect on entropy, which leads to the convergence of the entropy. Because in the first three iterations, the optimal parameters are searched in breadth by using the larger search step size. The breadth search is to determine the approximate range of the optimal parameters in the 2D parameter space. Then, according to the range, the parameter values are searched accurately by halving the step size.
When the two-dimensional parameter is v s = −5.47 m/s and θ = 0.513°, the entropy value of the refocusing image reaches its minimum. The minimum entropy value is 2.65.
The theoretical value and the search results under each iteration of T1 are shown in Table 3. The refocusing results of moving target T1 under nine iterations are shown in Figure 12. Due to the utilization of a larger search step size in the first three iterations, there is a deviation between the results of the first three iterations and the theoretical optimal parameter values. When the first three sets of parameters are used to refocus the moving target, the point target still remains in the defocused state. Therefore, it can be observed from the entropy curve that the entropy of the moving target image has a significant variation during the first three iterations. With the increase in the number of iterations, the search step is gradually halved, and then the optimal parameters are searched in depth. This process makes the searched results match closely with the theoretical values, thereby leading to small variations observed on the entropy curve.
Table 4 reports the final searching results and computing time of two different methods. As shown in the table, it takes 8150 s for the traditional traversal search to get the optimal value, and the computational efficiency of this method is much lower than that of enlightend search. The accuracy of the optimal value obtained by traversal is slightly higher than enlightend search.
The enlightend search only takes 21.6 s to converge to the optimal value. In order to enhance the search efficiency, the maximum driving speed within the scene can be used as a priori information during the search process. The parameter is searched in depth directly by establishing the original “cross,” including the node corresponding to the optimal value. Similar to references [36,38], this study selected 0.001 as the threshold of the enlightend search. With a reduction in the search step from the initial step 1 to 0.001, the enlightend search only needs log 2 ( 1 / 0.001 ) 10 iterations via the priori information. Therefore, the introduction of the enlightend search greatly reduces the computational workload and can achieve fast detection of moving targets in GBSAR imagery.
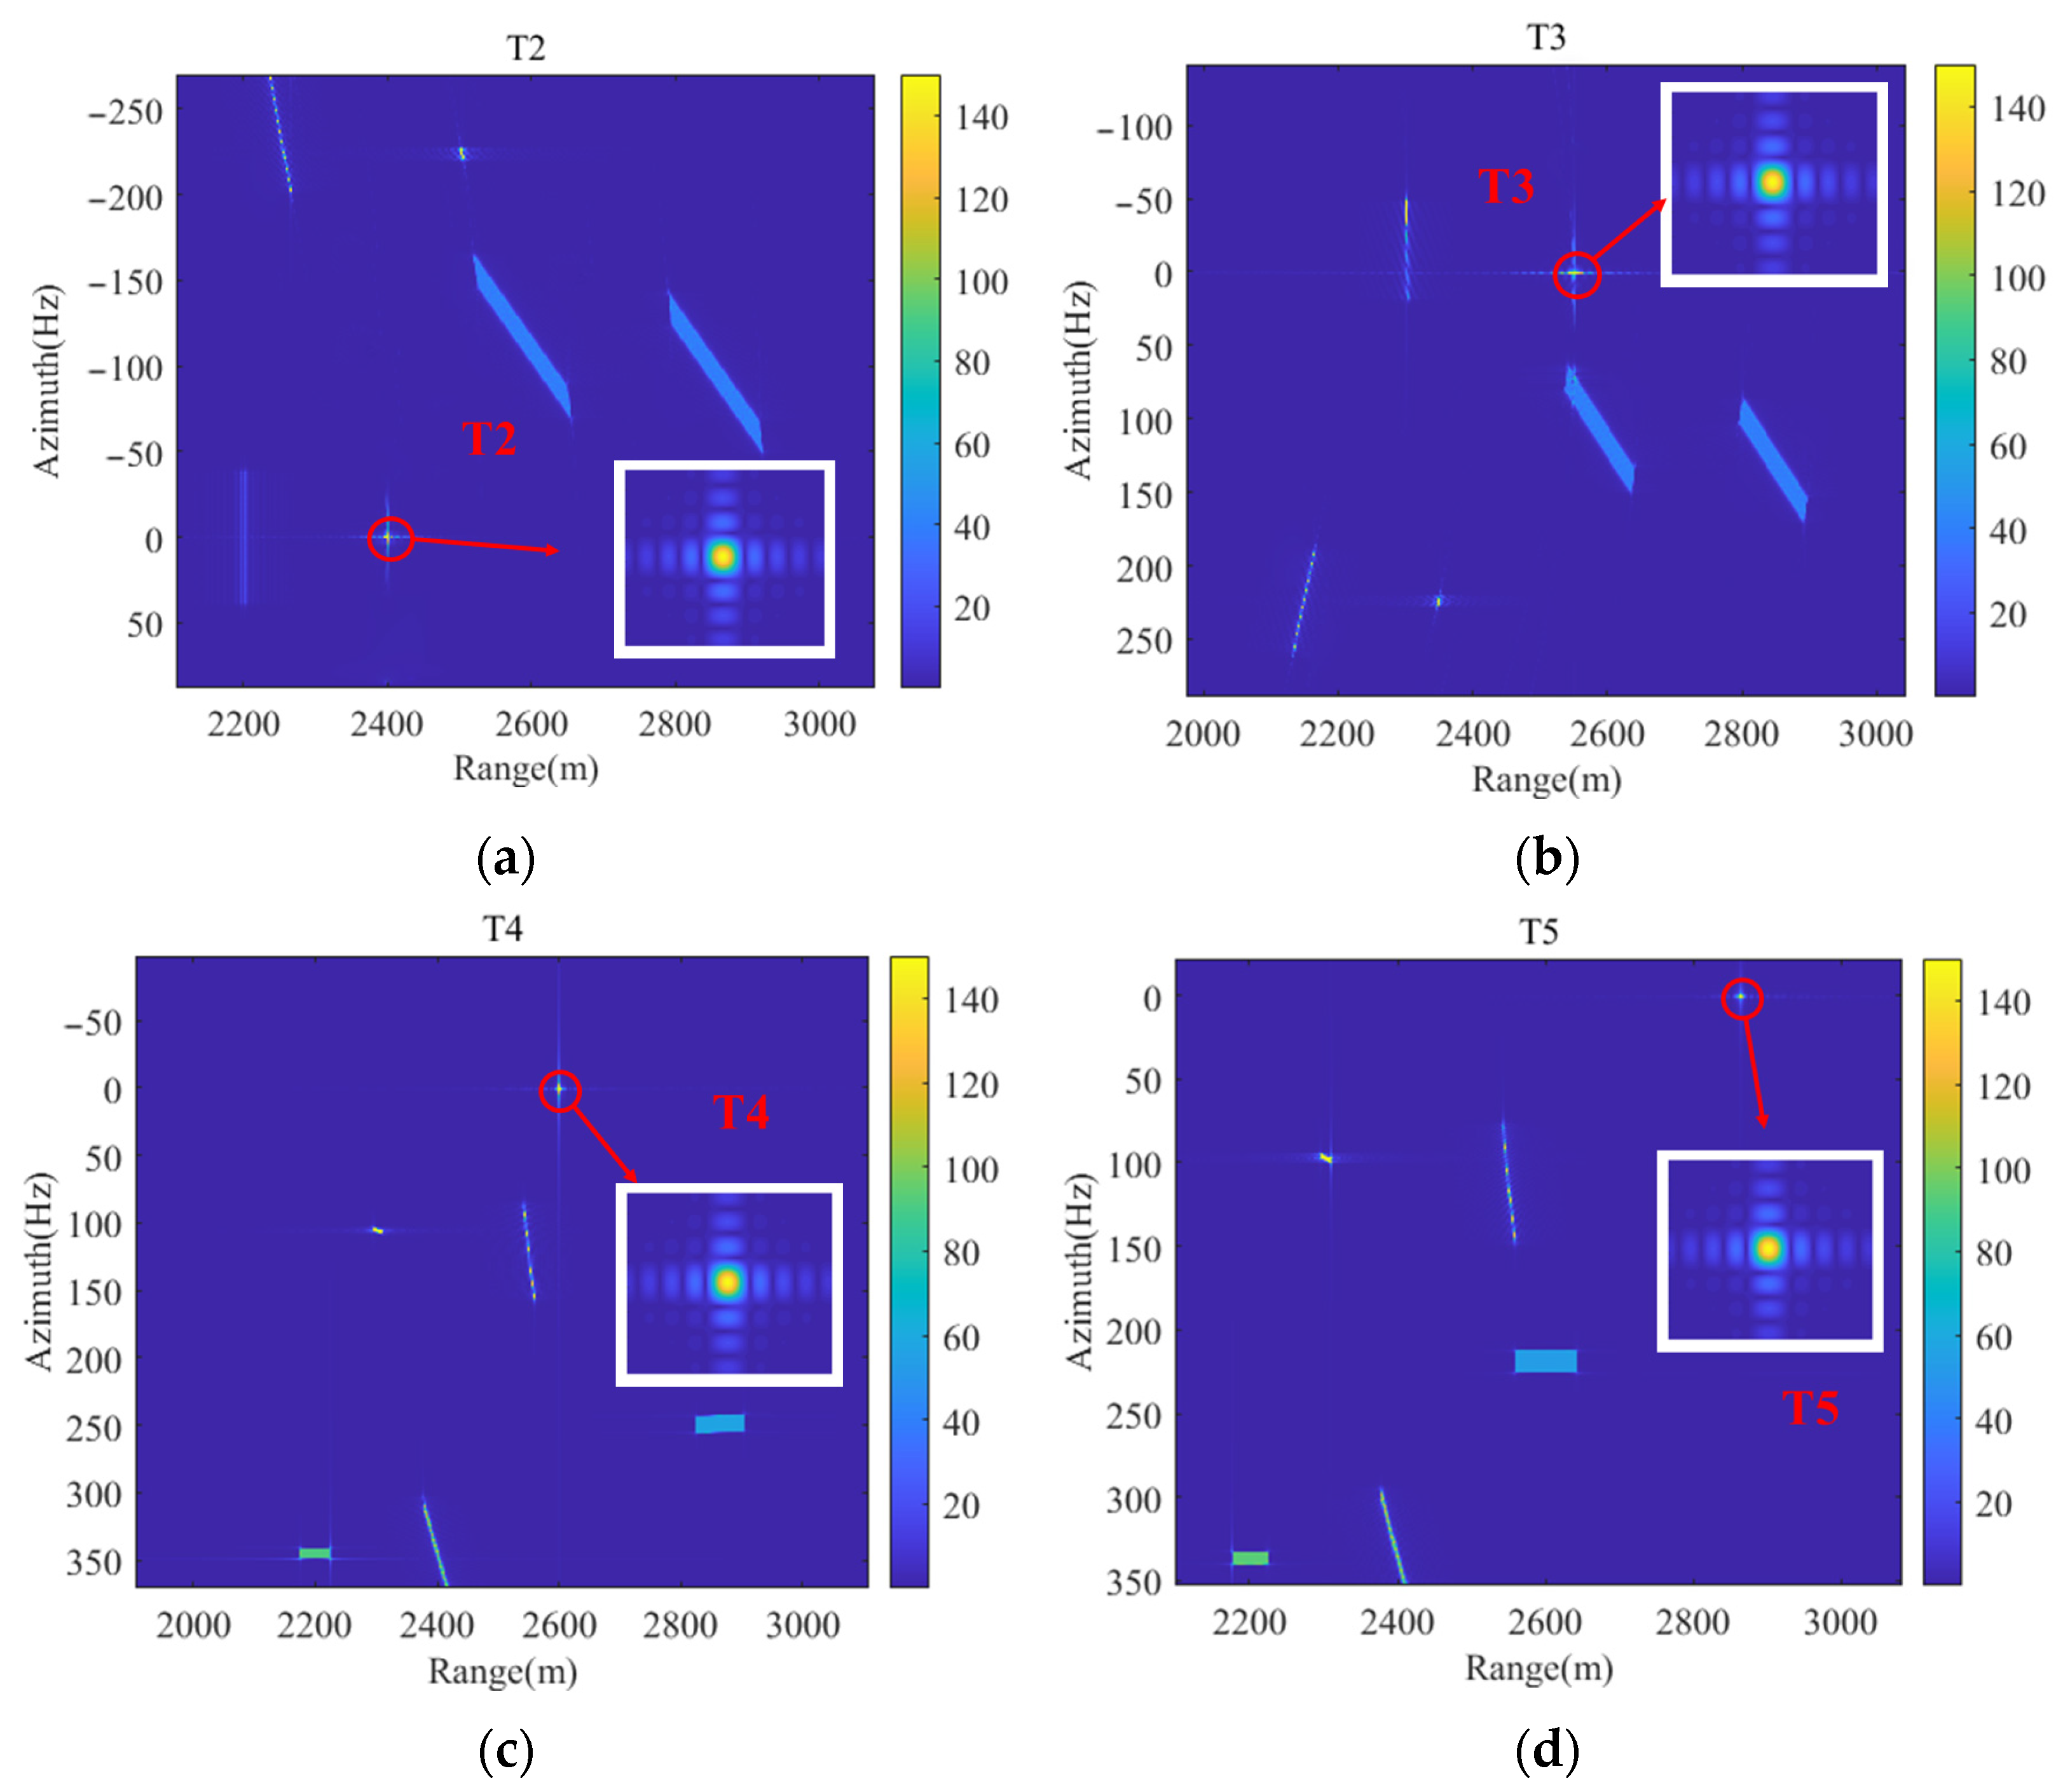
By using the identical method to detect the other moving targets, we can get the refocusing results in Figure 13.

4.2. Synthetic Data

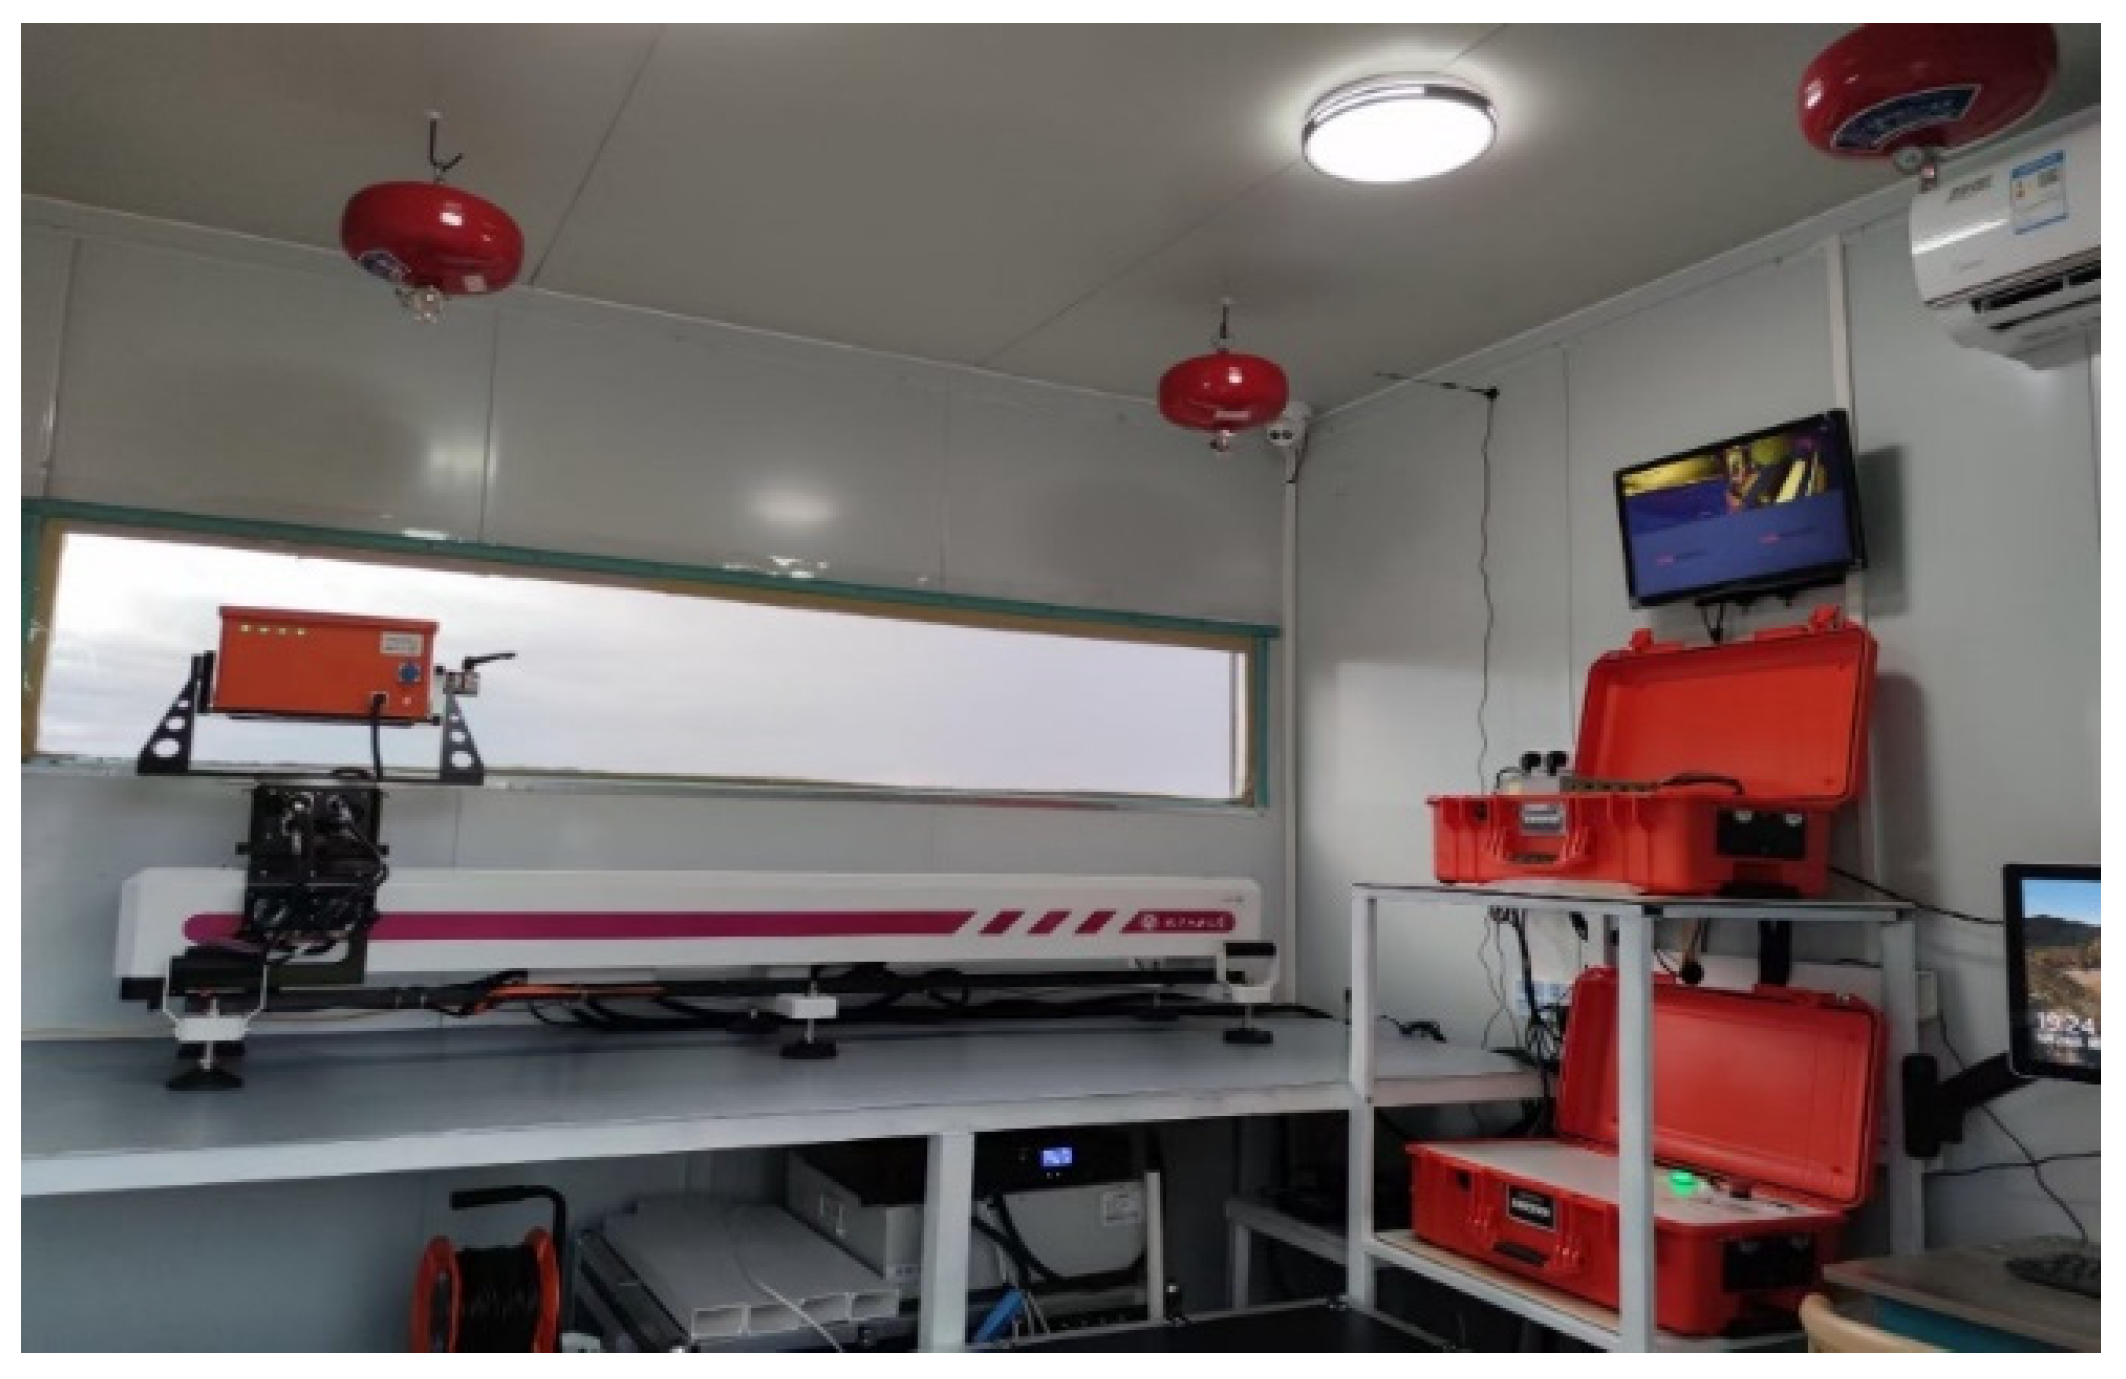
Here, a synthetic data experiment is conducted by combining real data acquired in mine with simulated moving target echo. The NCUT-RiskRadar GBSAR system is used to collect the real data. Figure 14 is the GBSAR system researched by NCUT. The system parameters employed in the experiment are consistent with the values presented in Table 1. We simulate four moving targets A1, A2, A3 and A4, and their parameters are shown in Table 5.
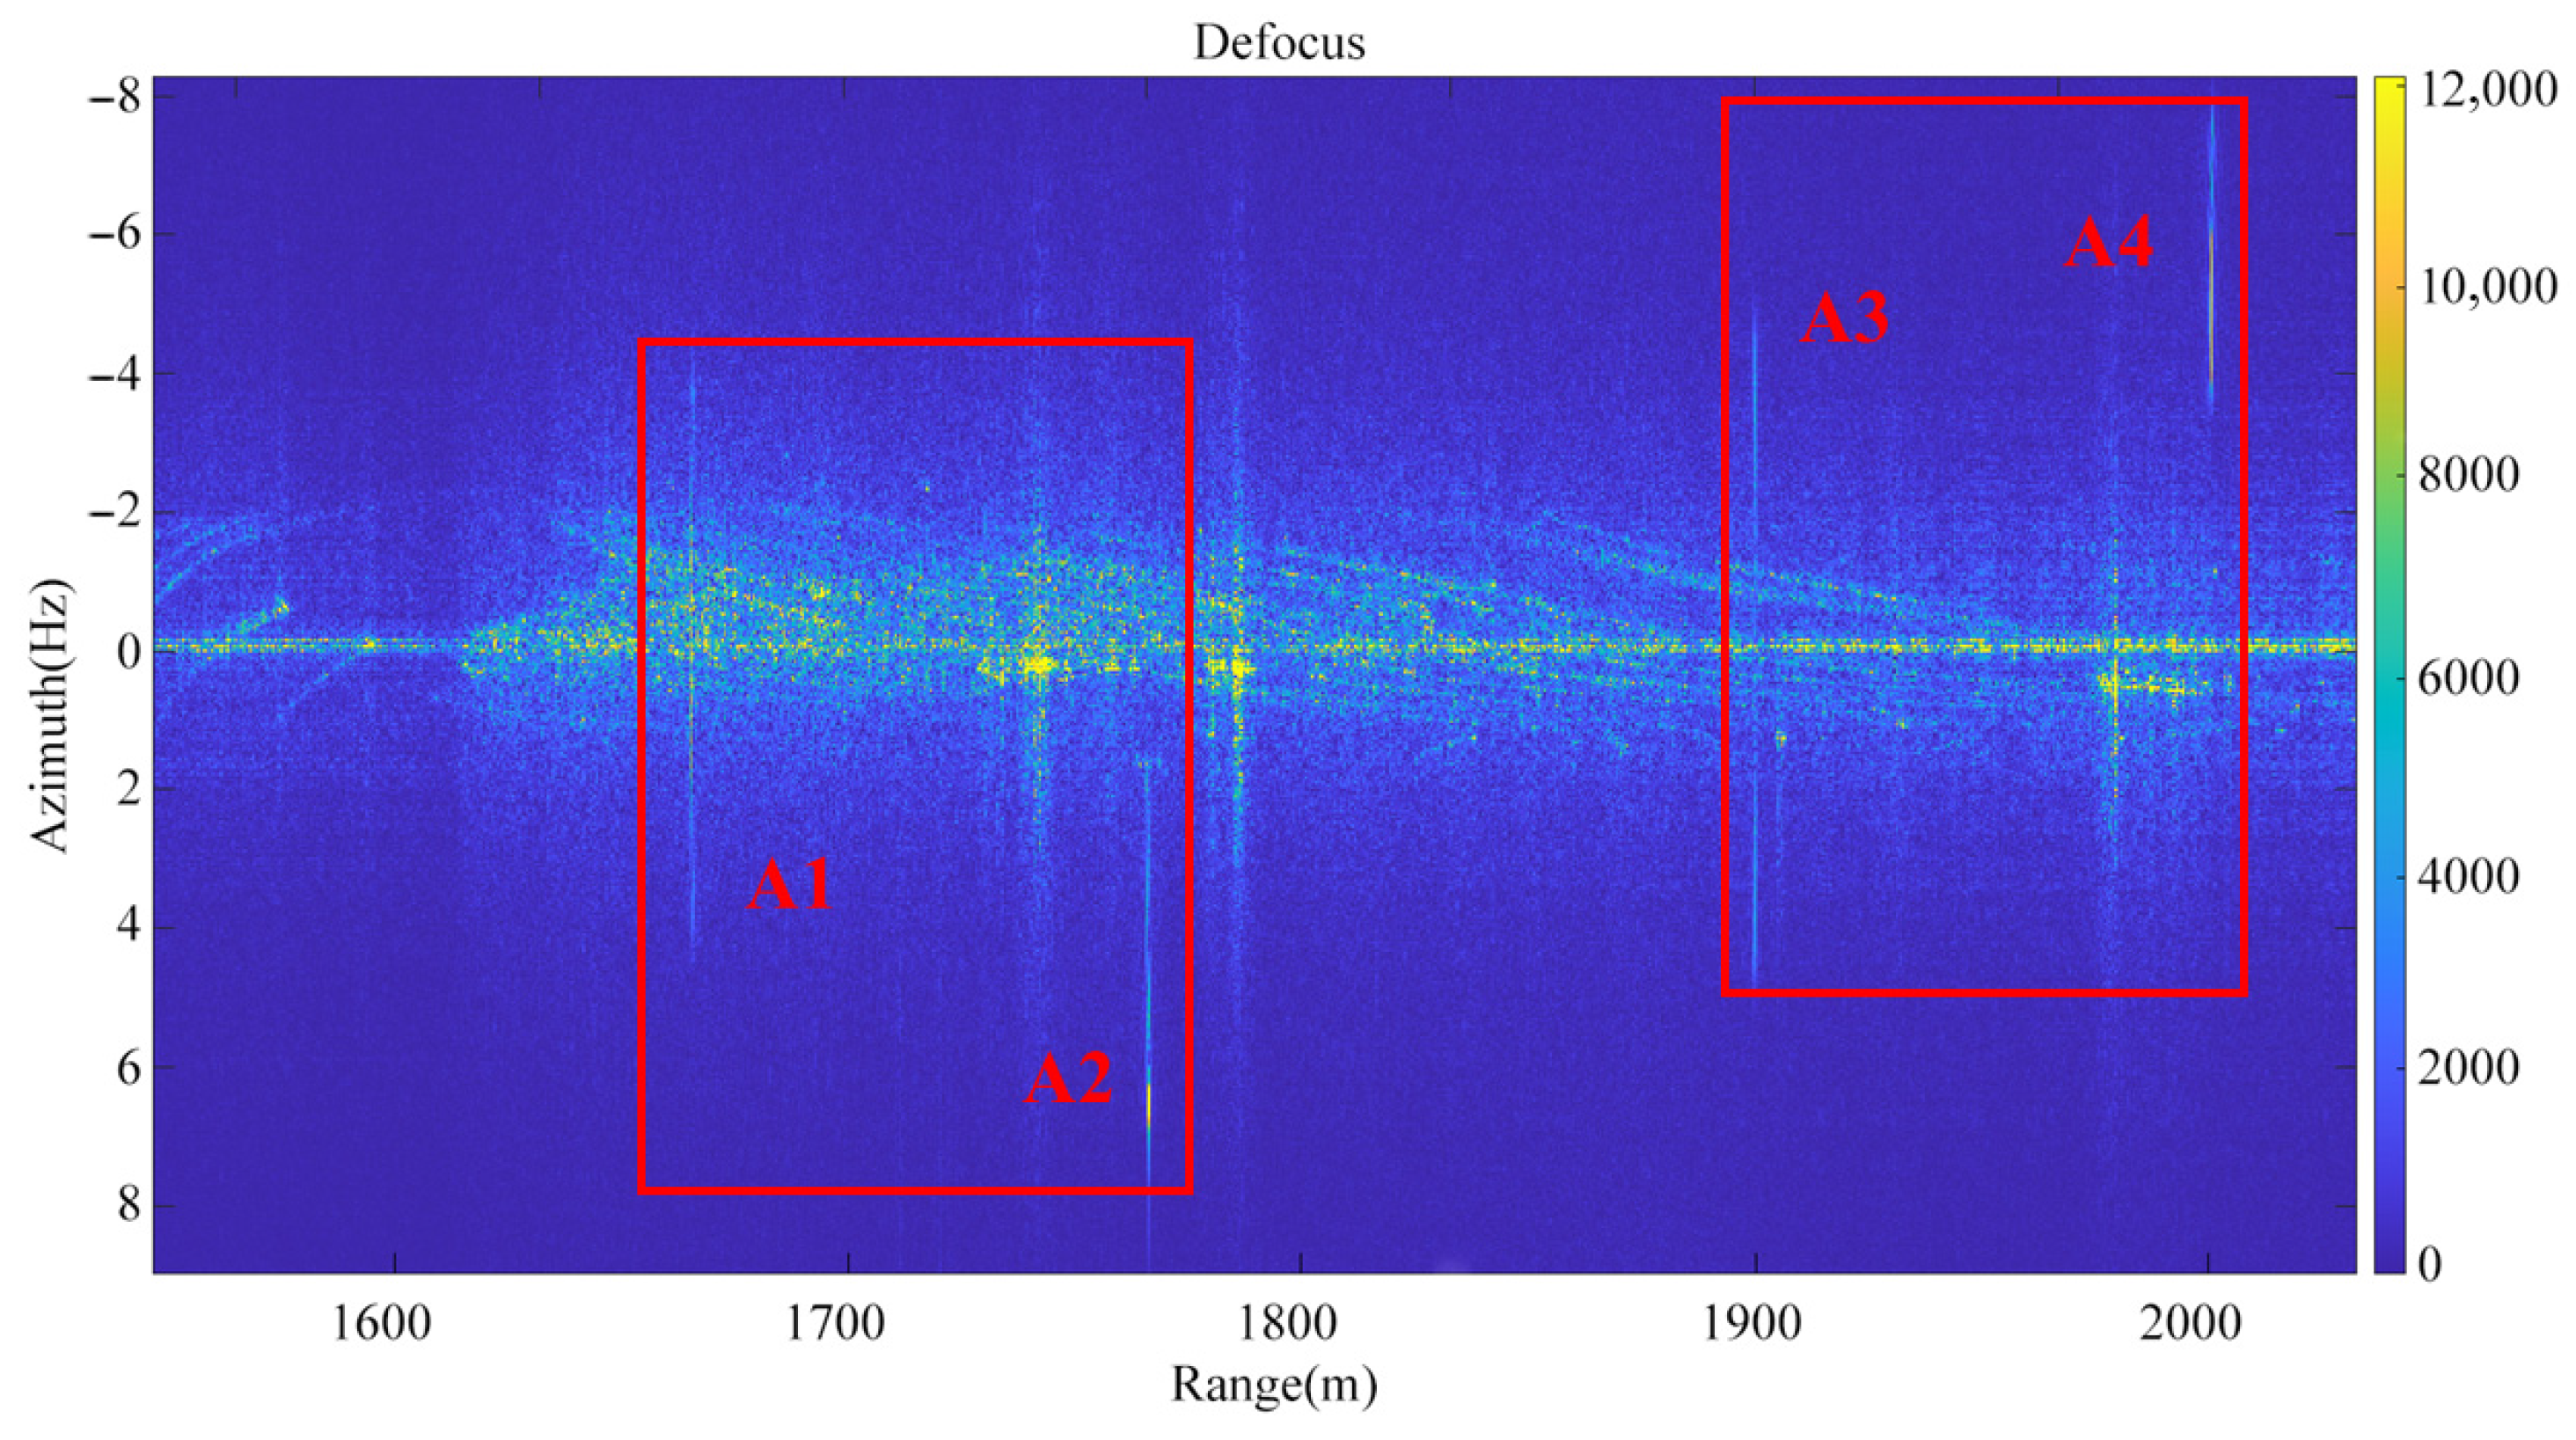
Figure 15 shows the conventional image of the synthetic data. It can be seen that the stationary mining area is well focused and is located in the middle. The moving targets are defocused and marked on both sides of the scene through the red box.
Table 6 shows the searching results and computing time of four moving targets with two different methods. As can be seen from the table, the introduction of enlightend search improves the efficiency of moving target detection in the GBSAR system.
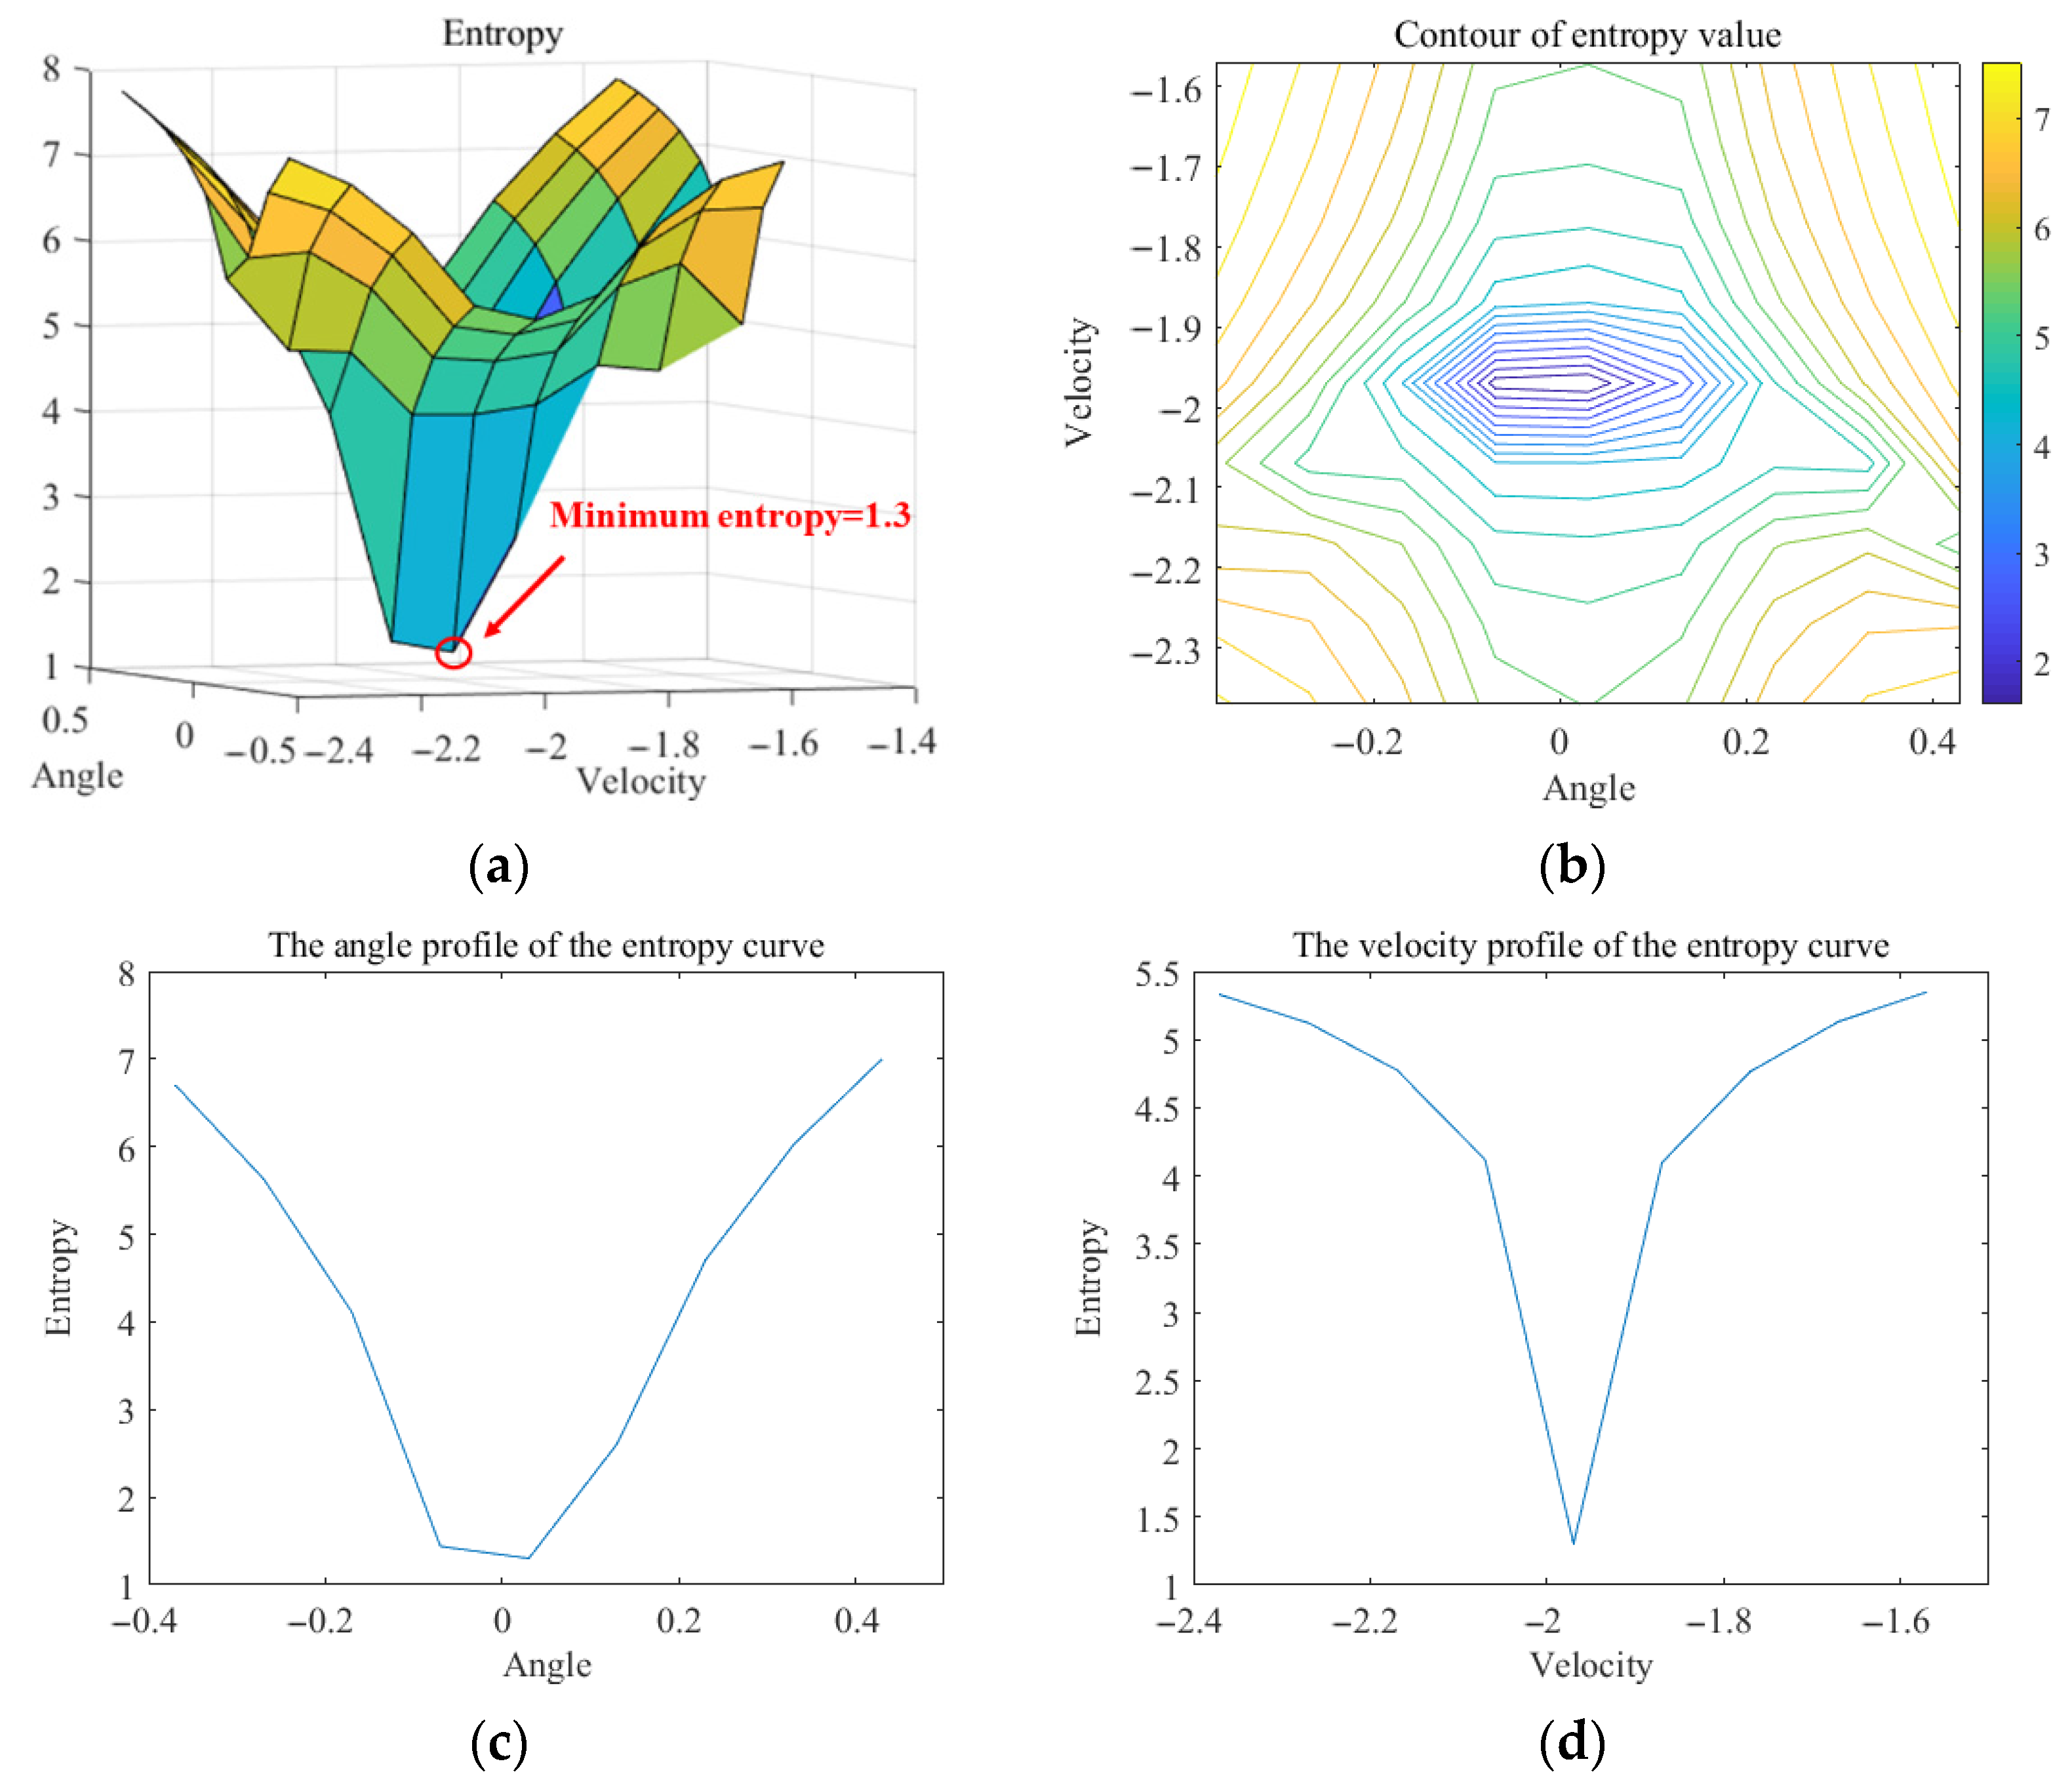
Next, let us take the targets on the right side as an example for analysis. The entropy value curve of A3 by traversal search is shown in Figure 16. When v s = −2.97 m/s and θ = 0° are selected as the refocusing parameters, the refocused image entropy of A3 reaches its minimum.
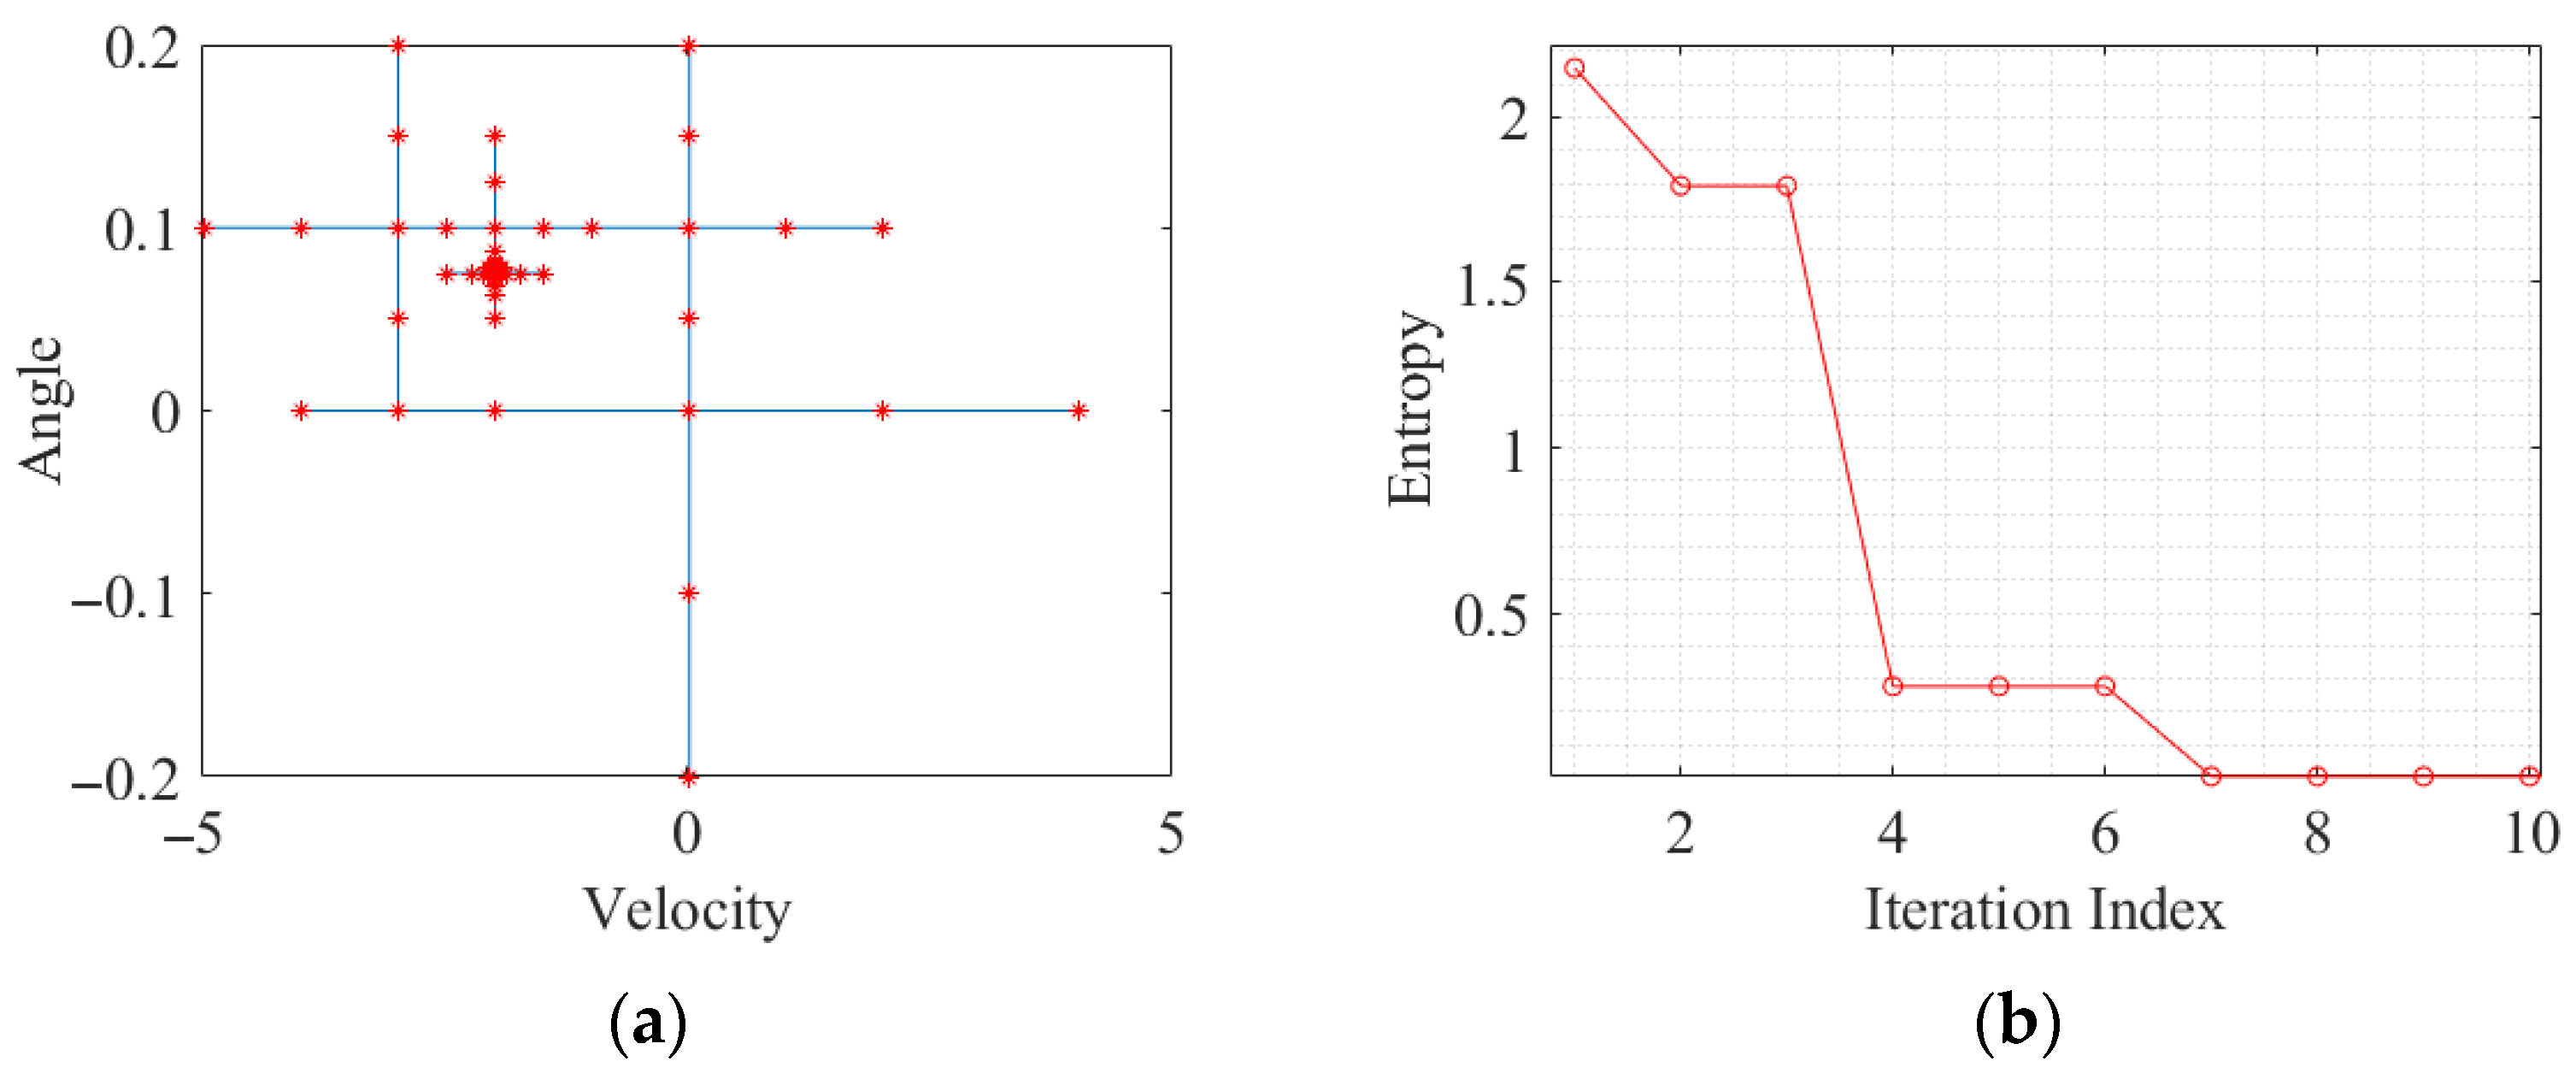
The process of using enlightend search to find the optimal parameter for A3 is shown in Figure 17a. The different nodes in the search “cross” are represented by red “*”. The relationship between the number of iterations and the 2D entropy is shown in Figure 17b. The circles represent the minimum entropy value after each iteration. A clear trend can be observed, where the entropy value decreases as the number of iterations increases. And the minimum entropy finally converges to v s = −3.01 m/s, θ = 0.03°.
The relationship between the image entropy value of A4 and the 2D parameters based on traversal search is depicted in Figure 18. The figure clearly demonstrates that when v s = −1.97 m/s and θ = 0.05° are used for refocusing, the refocused image entropy of A4 reaches the minimum.
The entropy value curve of A4 by 2D enlightend search is shown in Figure 19. And the minimum entropy finally converges to v s = −1.97 m/s, θ = 0.078°.
After using the proposed algorithm to process the synthetic data, it can be seen that the entropy values of the A3 and A4 refocused images can be minimized and converged when the two-dimensional parameters are equal to (−3.01 m/s, 0.03°) and (−1.97 m/s, 0.078°), respectively. These two sets of optimal parameters indicate the presence of the two moving targets in the scene. Therefore, the effectiveness of the proposed method in data containing real scenes is confirmed.

5. Conclusions

In this paper, a moving target detection algorithm based on refocusing is proposed. The algorithm establishes a two-dimensional parameter search space for squint angle and relative speed. Based on the parameter searching, the improved Range Doppler (RD) algorithm is used for refocusing.
The optimal 2D parameters are searched via an algorithm combining the entropy minimization principle and the enlightend search. For each group of parameters, the corresponding phase compensation and refocusing are performed. The entropy of the refocused image under each set of parameters is computed. The presence of a moving target in the observation area is determined based on whether there is an optimal parameter to minimize the entropy value of the refocused image. The introduction of enlightend search is used to enhance detection efficiency. And the proposed method is verified by the synthetic data.

Author Contributions

Conceptualization, Y.W.; methodology, Y.W. and S.W.; software MATLAB (version R2018a), Y.W. and S.W.; validation, Y.W. and S.W.; formal analysis, Y.W. and S.W.; resources, W.S., X.X., and Y.Z.; writing—original draft preparation, Y.W. and S.W.; writing—review and editing, Y.W., S.W., W.S., X.X., Y.Z., Y.L. (Yun Lin), and Y.L. (Yang Li); supervision, Y.W.; project administration, Y.W.; funding acquisition, Y.W. All authors have read and agreed to the published version of the manuscript.

Funding

This work was supported by the National Natural Science Foundation of China under Grant 62131001, 62201011 and the R&D Program of the Beijing Municipal Education Commission grant KM2022100090004 and North China University of Technology Research funds 110051360023XN224-8, 110051360023XN211.

Acknowledgments

We are thankful for the good advice and comments from anonymous reviews to help improve the quality of the paper.

Conflicts of Interest

We, the authors of this paper, declare that there is no conflict of interest regarding the content and findings presented in this manuscript. In particular, Xueyong Xu and Ye Zhou from North Information Control Research Academy Group Co., Ltd. have no financial or personal interests that could potentially bias the work or its interpretation. In all, this paper does not conflict with any vested interests.

Appendix A

The proposed of 2D enlightend search method.
Algorithm A1: Solving (19) by enlightend search based on 2D parameter space search.
Input: The SAR Echo of S ( v ^ s , θ ^ )
  • Initialization: The initial “cross” center ( x 1 O , y 1 O ) , the initial step of velocity Δ x 1 , the initial step of angle Δ y 1 , the iteration threshold γ , and the iteration index i = 1
  • Repeat:
  • Calculate the coordinate of “1,2 4,5”, “3”, and “6,7,8,9” by { x i j = [ x i O 2 Δ x i , x i O Δ x i , x i O + Δ x i , x i O + 2 Δ x i ] y i j = [ y i O , y i O , y i O , y i O ] , j = 1 , 2 , 4 , 5
    x i j = x i O ; y i j = y i O ; j = 3
    { x i j = [ x i O , x i O , x i O , x i O ] y i j = [ y i O 2 Δ y i , y i O Δ y i , y i O + Δ y i , y i O + 2 Δ y i ] , j = 6 , 7 , 8 , 9
where x i j = [ x i 1 , x i 2 , x i 4 , x i 5 ] or x i j = [ x i 6 , x i 7 , x i 8 , x i 9 ] , and y i j = [ y i 1 , y i 2 , y i 4 , y i 5 ] or y i j = [ y i 6 , y i 7 , y i 8 , y i 9 ] . x i j represent the coordinate at the j-th node of the i-th iteration.
4.
According to (16), calculate the image Entropy E j :
                       E j = E ( x i j , y i j )
where E j = [ E 1 , E 2 , , E 9 ] , represents the image entropy at nine nodes.
5.
Update the coordinate of “cross” center, the step of Δ x i and Δ y i by
If  min ( E j ) = E j , j = 1 , 5
               { Δ x i + 1 = Δ x i Δ y i + 1 = Δ y i ; { x ( i + 1 ) O = x i j Δ x i y ( i + 1 ) O = y i j , j = 1 ; { x ( i + 1 ) O = x i j + Δ x i y ( i + 1 ) O = y i j , j = 5
Else if min ( E j ) = E j , j = 6 , 9
               { Δ x i + 1 = Δ x i Δ y i + 1 = Δ y i ; { x ( i + 1 ) O = x i j y ( i + 1 ) O = y i j Δ y i , j = 6 ; { x ( i + 1 ) O = x i j y ( i + 1 ) O = y i j + Δ y i , j = 9
Else
{ Δ x i + 1 = Δ x i / 2 Δ y i + 1 = Δ y i / 2 ; { x ( i + 1 ) O = x i j y ( i + 1 ) O = y i j
6.
Update the iteration index, i = i + 1 .
7.
If  max ( Δ x i + 1 , Δ y i + 1 ) γ , Iteration stop; Else repeat step 3–6;
Output: The estimated velocity and angle, v s = x ( i + 1 ) O ; θ = y ( i + 1 ) O .

References

  1. Jiang, L.L.; Zhang, S.J.; Wang, H.Y.; Xie, Q. Analysis of oblique aerial photography data aerial triangulation accuracy. Geomat. Spat. Inf. Technol. 2015, 38, 59–60+63. [Google Scholar]
  2. Gao, G.; Yao, L.; Li, W.; Zhang, L.; Zhang, M. Onboard information fusion for multisatellite collaborative observation: Summary, challenges, and perspectives. IEEE Geosci. Remote Sens. Mag. 2023, 11, 40–59. [Google Scholar] [CrossRef]
  3. Farina, P.; Leoni, L.; Babboni, F.; Coppi, F.; Mayer, L.; Coli, N.; Thompson, C. Monitoring engineered and natural slopes by ground-based radar: Methodology, data processing and case studies review. In Proceedings of the Second Southern Hemisphere International Rock Mechanics Symposium (SHIRMS 2012), Sun City, South Africa, 14–17 May 2012; pp. 15–17. [Google Scholar]
  4. Farina, P.; Leoni, L.; Babboni, F.; Coppi, F.; Mayer, L.; Ricci, P. IBIS-M, an innovative radar for monitoring slopes in open-pit mines. In Proceedings of the International Symposium on Rock Slope Stability in Open Pit Mining and Civil Engineering, Vancouver, BC, Canada, 18–21 September 2011; pp. 18–21. [Google Scholar]
  5. Pieraccini, M.; Luzi, G.; Mecatti, D.; Noferini, L.; Atzeni, C. Ground-based SAR for short and long term monitoring of unstable slopes. In Proceedings of the 2006 European Radar Conference, Manchester, UK, 13–15 September 2006; pp. 92–95. [Google Scholar]
  6. Takahashi, K.; Matsumoto, M.; Sato, M. Monitoring of displacement on a landslide slope by GB-SAR interferometry. In Proceedings of the 2013 Asia-Pacific Conference on Synthetic Aperture Radar (APSAR), Tsukuba, Japan, 23–27 September 2013; pp. 552–555. [Google Scholar]
  7. Monserrat, O.; Crosetto, M.; Luzi, G. A review of ground-based SAR interferometry for deformation measurement. ISPRS J. Photogramm. Remote Sens. 2014, 93, 40–48. [Google Scholar] [CrossRef]
  8. Kuras, P.; Ortyl, Ł.; Owerko, T.; Salamak, M.; Łaziński, P. GB-SAR in the diagnosis of critical city infrastructure—A case study of a load test on the long tram extradosed bridge. Remote Sens. 2020, 12, 3361. [Google Scholar] [CrossRef]
  9. Liu, C. Research and Implementation of Real-Time Signal Processing Technology for Airborne SAR/GMTI. Ph.D. Thesis, Graduate School of Electronics, Chinese Academy of Sciences, Shanghai, China, 2006. [Google Scholar]
  10. Freeman, A.; Currie, A. Synthetic aperture radar (SAR) images of moving targets. GEC J. Res. 1987, 5, 106–115. [Google Scholar]
  11. Barbarossa, S. Analysis of multicomponent LFM signals by a combined Wigner-Hough transform. IEEE Trans. Signal Process. 1995, 43, 1511–1515. [Google Scholar] [CrossRef]
  12. Xie, C.; Zhang, K.; Feng, K.; Guo, C.; Xu, J. Target Detecting Based on Improved WVD-HT for Radio Frequency Interference to UWB-SAR. In Proceedings of the 2008 First International Conference on Intelligent Networks and Intelligent Systems, Wuhan, China, 1–3 November 2008; pp. 604–607. [Google Scholar]
  13. Mao, Y. Multitargets Detecting with UWB-SAR/IUWB-SAR Base on the WVD-HT. J. Electr. Inf. Technol. 1997, 19, 464–470. [Google Scholar]
  14. Barbarossa, S.; Zanalda, A. A combined Wigner-Ville and Hough transform for cross-terms suppression and optimal detection and parameter estimation. In Proceedings of the ICASSP-92: 1992 IEEE International Conference on Acoustics, Speech, and Signal Processing, San Francisco, CA, USA, 23–26 March 1992; Volume 175, pp. 173–176. [Google Scholar]
  15. Barbarossa, S.; Farina, A. A novel procedure for detecting and focusing moving objects with SAR based on the Wigner-Ville distribution. In Proceedings of the IEEE International Conference on Radar, Arlington, VA, USA, 7–10 May 1990; pp. 44–50. [Google Scholar]
  16. Liu, S.J.; Yuan, Y.N.; Mao, S.Y. The Method of Moving Target Detection Based on the Eigen-Decomposition of the Single-Channel SAR Image Sequence. J. Electr. Inf. Technol. 2009, 31, 1876–1880. [Google Scholar]
  17. Barbarossa, S.; Scaglione, A. Autofocusing of SAR images based on the product high-order ambiguity function. IEEE Proc. Radar Sonar Navig. 1998, 145, 269–273. [Google Scholar] [CrossRef]
  18. Fienup, J.R. Detecting moving targets in SAR imagery by focusing. IEEE Trans. Aerosp. Electron. Syst. 2001, 37, 794–809. [Google Scholar] [CrossRef]
  19. Kirscht, M. Detection and imaging of arbitrarily moving targets with single-channel SAR. IEE Proc. Radar Sonar Navig. 2003, 150, 7–11. [Google Scholar] [CrossRef]
  20. Sun, Z.; Wu, J.; Huang, Y.; Li, Z.; Yang, H.; Yang, J. Ground moving target detection in squint SAR imagery based on Extended Azimuth NLCS and Deramp processing. In Proceedings of the 2014 IEEE Geoscience and Remote Sensing Symposium, Quebec, QC, Canada, 13–18 July 2014; pp. 600–603. [Google Scholar]
  21. Yang, J.; Liu, C.; Wang, Y. Detection and imaging of ground moving targets with real SAR data. IEEE Trans. Geosci. Remote Sens. 2014, 53, 920–932. [Google Scholar] [CrossRef]
  22. Shen, W.; Wang, S.; Lin, Y.; Li, Y.; Ding, F.; Wang, Y. Ground-Based SAR Moving Target Refocusing Based on Relative Speed for Monitoring Mine Slopes. Remote Sens. 2022, 14, 4243. [Google Scholar] [CrossRef]
  23. Vu, V.T.; Sjögren, T.K.; Pettersson, M.I. Moving target focusing with normalized relative speed in azimuth-invarian bistatic SAR. In Proceedings of the 2013 IEEE International Geoscience and Remote Sensing Symposium—IGARSS, Melbourne, VIC, Australia, 21–26 July 2013; pp. 4198–4201. [Google Scholar]
  24. Zheng, M.J. Research on Moving Target Detection and Imaging with Synthetic Aperture Radar. Ph.D. Thesis, Graduate School of Electronics, Chinese Academy of Sciences, Shanghai, China, 2003. [Google Scholar]
  25. Pettersson, M.I. Detection of moving targets in wideband SAR. IEEE Trans. Aerosp. Electron. Syst. 2004, 40, 780–796. [Google Scholar] [CrossRef]
  26. Sjogren, T.K.; Vu, V.T.; Pettersson, M.I.; Gustavsson, A.; Ulander, L.M.H. Moving target relative speed estimation and refocusing in synthetic aperture radar images. IEEE Trans. Aerosp. Electron. Syst. 2012, 48, 2426–2436. [Google Scholar] [CrossRef]
  27. Vu, V.T.; Sjogren, T.K.; Pettersson, M.I.; Gustavsson, A.; Ulander, L.M.H. Detection of moving targets by focusing in UWB SAR—Theory and experimental results. IEEE Trans. Geosci. Remote Sens. 2010, 48, 3799–3815. [Google Scholar] [CrossRef]
  28. Meta, A.; Hoogeboom, P.; Ligthart, L.P. Correction of the effects induced by the continuous motion in airborne FMCW SAR. In Proceedings of the 2006 IEEE Conference on Radar, Verona, NY, USA, 24–27 April 2006; p. 8. [Google Scholar]
  29. Liang, Y.; Wang, H.; Xing, M.; Bao, Z. Imaging Study of High Squint SAR Based on FMCW. In Proceedings of the 2007 1st Asian and Pacific Conference on Synthetic Aperture Radar, Huangshan, China, 5–9 November 2007; pp. 6–9. [Google Scholar]
  30. Liang, X.; Wei, Q. Wavenumber domain algorithm for squint FMCW SAR. In Proceedings of the 2011 6th International Forum on Strategic Technology, Harbin, China, 22–24 August 2011; pp. 1256–1260. [Google Scholar]
  31. Liu, M.; Li, Y.; Du, Y.; Lei, T.; Qiu, J.; Hong, X.; Guo, H.; Wu, J. Performance analysis of synthetic aperture ladar system with photonic lantern coupling under atmospheric turbulence. In Proceedings of the 2022 IEEE 10th International Conference on Information, Communication and Networks (ICICN), Zhangye, China, 23–24 August 2022; pp. 479–484. [Google Scholar]
  32. Abdukirim, A.; Ren, Y.; Tao, Z.; Liu, S.; Li, Y.; Deng, H.; Rao, R. Effects of atmospheric coherent time on inverse synthetic aperture ladar imaging through atmospheric turbulence. Remote Sens. 2023, 15, 2883. [Google Scholar] [CrossRef]
  33. Galaktionov, I.; Kudryashov, A.; Sheldakova, J.; Samarkin, V.; Nikitin, A. Laser beam focusing through the atmosphere aerosol. In Proceedings of the Unconventional and Indirect Imaging, Image Reconstruction, and Wavefront Sensing 2017, San Diego, CA, USA, 6–10 August 2017; pp. 152–165. [Google Scholar]
  34. Strasburg, J.D.; Harper, W.W. Impact of atmospheric turbulence on beam propagation. In Proceedings of the Laser Systems Technology II, Orlando, FL, USA, 13 April 2004; pp. 93–102. [Google Scholar]
  35. Mori, S.; Biscarini, M.; Marziani, A.; Marzano, F.S.; Pierdicca, N. Effects of atmospheric precipitations and turbulence on satellite Ka-band synthetic aperture radar. In Proceedings of the Active and Passive Microwave Remote Sensing for Environmental Monitoring II, Berlin, Germany, 12–13 September 2018; Volume 10788, pp. 18–26. [Google Scholar]
  36. Cao, P.; Xing, M.; Sun, G.; Li, Y.; Bao, Z. Minimum entropy via subspace for ISAR autofocus. IEEE Geosci. Remote Sens. Lett. 2009, 7, 205–209. [Google Scholar] [CrossRef]
  37. Shu, Y.; Wan, J.; Li, D.; Chen, Z.; Liu, H. Fast approach for SAR imaging of ground-based moving targets based on range azimuth joint processing. Remote Sens. 2022, 14, 2965. [Google Scholar] [CrossRef]
  38. Yuan, H.; Zhou, F.; Xing, M.; Bao, Z. A novel estimation algorithm of Doppler chirp rate based on enlightend search. Mod. Radar 2009, 31, 55–60. [Google Scholar]
Figure 1. Geometry of GBSAR with moving target.
Remotesensing 15 05588 g001
Figure 2. The imaging geometry of moving target in GBSAR system.
Remotesensing 15 05588 g002
Figure 3. Flowchart of the proposed detection algorithm.
Remotesensing 15 05588 g003
Figure 4. The diagram of 2D enlightend search.
Remotesensing 15 05588 g004
Figure 5. The reconstruction process from “cross” 5 to 6.
Remotesensing 15 05588 g005
Figure 6. The conventional imaging results. Range is horizontal, and azimuth is vertical.
Remotesensing 15 05588 g006
Figure 7. Partial refocusing results of traversal search.
Remotesensing 15 05588 g007aRemotesensing 15 05588 g007b
Figure 8. The entropy curves of T1 refocused images under different 2D parameters. (a) The entropy curves of T1 refocused images (b) The contour of entropy value of T1.
Remotesensing 15 05588 g008
Figure 9. The angle profile of the entropy curve.
Remotesensing 15 05588 g009
Figure 10. The velocity profile of the entropy curve.
Remotesensing 15 05588 g010
Figure 11. Entropy value curve of A3 by 2D enlightend search. (a) The process of parameter search for T1 (b) Entropy value curve with number of searches.
Remotesensing 15 05588 g011
Figure 12. The refocusing results of T1 under nine iterations of enlightend search (ai).
Remotesensing 15 05588 g012
Figure 13. Refocused result of the other moving targets. (a) T2 (b) T3 (c) T4 (d) T5.
Remotesensing 15 05588 g013
Figure 14. The NCUT-RiskRadar GBSAR system.
Remotesensing 15 05588 g014
Figure 15. The conventional image of the synthetic data.
Remotesensing 15 05588 g015
Figure 16. Entropy value curve of A3 by traversal search. (a) The entropy curves of A3 refocused images (b) The contour of entropy value of A3 (c) The angle profile of the entropy curve (d) The velocity profile of the entropy curve.
Remotesensing 15 05588 g016
Figure 17. Entropy value curve of A3 by 2D enlightend search. (a) The process of parameter search for A3 (b) Entropy value curve with number of searches.
Remotesensing 15 05588 g017
Figure 18. Entropy value curve of A4 by traversal search. (a) The entropy curves of A4 refocused images (b) The contour of entropy value of A4 (c) The angle profile of the entropy curve (d) The velocity profile of the entropy curve.
Remotesensing 15 05588 g018
Figure 19. Entropy value curve of A4 by 2D enlightend search. (a) The process of parameter search for A4 (b) Entropy value curve with number of searches.
Remotesensing 15 05588 g019
Table 1. The experiment parameters of simulation.
ParameterValue
Center frequency17 GHz
Signal bandwidth400 MHz
Radar speed0.03 m/s
Pulse duration0.002 s
Near range500 m
Far range3000 m
Rail length0.8 m
PRF800 Hz
Table 2. The simulation parameters of target.
TargetPosition [m]Vr [m/s]Va [m/s]
S1(2200, 0)00
T1(2300, 100)25
T2(2400, 0)010
T3(2500, 500)010
T4(2600, 0)100
T5(2800, 600)100
Table 3. The search results under each iteration.
Theoretical optimal values(−5.36 m/s, 0.426°)fifth iteration result(−5.22 m/s, 0.475°)
first iteration result(−3.97 m/s, 0°)sixth iteration result(−5.22 m/s, 0.487°)
second iteration result(−5.97 m/s, 0.2°)seven iteration result(−5.22 m/s, 0.512°)
third iteration result(−5.97 m/s, 0.5°)eighth iteration result(−5.47 m/s, 0.512°)
fourth iteration result(−5.97 m/s, 0.475°)ninth iteration result(−5.47 m/s, 0.513°)
Table 4. Performance comparison of different parameter search methods.
MethodSearching ResultTimeVelocity ErrorAngular Error
traversal method(−5.3 m/s, 0.4°)8150 s0.06 m/s0.026°
2D enlightend search(−5.47 m/s, 0.513°)21.6 s0.11 m/s0.087°
Table 5. Target parameters of synthetic data.
TargetPosition [m]Vr [m/s]Va [m/s]
A1(1650, 0)03
A2(1750, −50)02
A3(1900, 0)03
A4(2000, 50)02
Table 6. Performance comparison of different methods in synthetic data.
TargetMethodSearching ResultTime
A1traversal method(−2.94 m/s, 0.01°)6418 s
2D enlightend search(−2.93 m/s, 0.04°)18.2 s
A2traversal method(−1.97 m/s, −0.03°)5759 s
2D enlightend search(−2.09 m/s, −0.036°)16.1 s
A3traversal method(−2.97 m/s, 0°)6405 s
2D enlightend search(−3.01 m/s, 0.03°)17.5 s
A4traversal search(−1.97 m/s, 0.05°)5896 s
2D enlightend search(−1.97 m/s, 0.078°)16.8 s
Disclaimer/Publisher’s Note: The statements, opinions and data contained in all publications are solely those of the individual author(s) and contributor(s) and not of MDPI and/or the editor(s). MDPI and/or the editor(s) disclaim responsibility for any injury to people or property resulting from any ideas, methods, instructions or products referred to in the content.

